2015 - credit europe · pdf filecompletion of the e-account project at the end of 2015, c eb...
TRANSCRIPT
AnnuAl RepoRt
2015

Credit Europe Bank N.V. is headquartered in the Netherlands and operates 133 branches, 685 ATMs, about 12,000 sales points and more than 23,500 point of sale terminals. The bank has more than 4,200 employees in 10 countries. More than 6 million customers around the world entrust their financial affairs to Credit Europe Bank. We offer to our corporate customers a wide range of banking products, including international trade and commodity finance, project finance and working capital loans. Represented in key trading hubs such as the Netherlands, Switzerland and the United Arab Emirates, as well as in raw material exporting and importing countries including, Russia, Turkey and Ukraine, we are well positioned to finance our customers’ transaction flows across the globe. To our retail and SME customers we offer non-complex and transparent products in seven Western and Eastern European countries: Belgium, Germany, the Netherlands, Malta, Ukraine, Romania and Russia.
Our mission is providing financial services that create value for customers.
Our vision is being the preferred bank in our core markets.
Headoffice Amsterdam, Karspeldreef 6a, 1101 CJ Amsterdam.
About Credit Europe Bank

Strategy .............................................................................. 3Five-year key figures ..........................................................4
Report of the Managing Board
From the CEO .....................................................................5Our Network .......................................................................6Retail Banking ....................................................................8Corporate Banking ........................................................... 14Funding ............................................................................. 18Human Resources ............................................................20Corporate Social Responsibility ......................................22Risk Management and Control ........................................24Outlook 2015 ....................................................................26Profile of the Managing Board ........................................28Corporate Governance .....................................................30Profile of the Supervisory Board .....................................38Report of the Supervisory Board .....................................39
Consolidated Statement of Financial Position
Consolidated Statement of Financial Position .............. 44Consolidated Statement of Income ................................ 46Consolidated Statement of Comprehensive Income ......47Consolidated Statement of Changes in Equity .............. 48Consolidated Statement of Cash Flows ......................... 49Notes to Consolidated Financial Statements ................ 50
Parent Company Financial Statements
Statement of Financial Position .................................... 125Statement of Income ...................................................... 127Statements of Changes in Equity .................................. 128Summary of Significant Accounting Policies ................ 129Notes to Financial Statements ...................................... 130Other Information ......................................................... 142
Auditor’s Report ............................................................. 143
Contents

StrategyWe have gained thorough experience and expertise to act as a bridge for our customers in key importing and exporting countries in Western Europe, the Black Sea region, the Gulf region, China and the Americas.

Strategy
Banking in its purest form is our business: easy-to-use loan and deposit products for retail customers and financing services that support our corporate clients in growing their businesses. Our strategy is to be close to our customers: we provide our services through a network of 133 branches, 685 ATMs, around 12,000 sales points and more than 23,500 point of sale terminals in 10 countries and with a wealth of local knowledge.
For more than two decades, we have focused on international trade and commodity finance. We have gained thorough experience and expertise to act as a bridge for our customers in key importing and exporting countries in Western Europe, the Black Sea region, the Gulf region, China and the Americas. We will continue to offer short-term, self-liquidating commodity financing, as well as balance sheet lending and project finance.
In corporate banking, as a medium-sized bank with hands-on managers and short communication lines, we are fast to spot and react to our customers’ needs and to create innovative, tailor-made solutions. Our flexible approach supported our customers during turbulent times and positioned us to take advantage of improving market conditions.
In the Western European markets, we offer retail banking products via online and telephone banking. Our services are facilitated by having a centralized, cross-border contact center applying high-quality information technology. In Russia and Romania, next to the above mentioned distribution channels, we also use our branch network to serve our retail customers and consolidate our retail position.
In all areas of the bank, we invest in the professionalism, expertise and customer focus of our employees. In order to sustain our long-term growth ambitions, we combine prudent capital and liquidity management with sound risk management, high level of compliance and transparent corporate governance. We believe this strategy safeguards the interests of all our stakeholders.
3
Credit Europe Bank N
V Annual Report 20
15
3
Strateg
y

Five-year key figures
€ millions 2015 2014 2013 2012(*) 2011
Assets
Cash and balances at central banks 532 375 501 1,238 1,771
Financial assets at fair value through profit or loss 8 19 18 39 46
Financial investments 1,022 1,244 1,550 974 700
Loans and receivables – banks 451 364 693 380 597
Loans and receivables – customers 5,483 5,855 6,653 5,954 6,556
Other assets 872 857 743 652 835
Total assets 8,369 8,714 10,158 9,237 10,505
Liabilities
Due to banks 469 774 1,632 1,113 813
Due to customers 5,467 5,788 6,002 5,932 7,520
Issued debt securities 441 399 862 664 501
Other liabilities 547 453 443 374 659
Subordinated liabilities 562 514 578 505 273
Total liabilities 7,486 7,928 9,517 8,588 9,766
Total equity 882 786 641 649 739
Total equity and liabilities 8,368 8,714 10,158 9,237 10,505
(*) including effects of the spin-off of Fibabanka AS
€ millions 2015 2014 2013 2012(*) 2011
Net interest income 274 361 443 388 358
Net fee and commission income 70 75 77 69 73
Operating income 121 125 66 79 48
Credit loss charges (168) (244) (176) (140) (102)
Net operating income 297 317 410 396 377
Total operating expenses (234) (256) (301) (290) (269)
Share of profit of associate (1) 2 - - -
Operating profit before tax 62 63 109 106 108
Income tax expense (15) (5) (15) (27) (24)
Profit for the year from continued operations 47 58 94 79 84
Result for the year from discontinued operations - - - (1) 10
Profit for the year 47 58 94 78 94
(*) including effects of the spin-off of Fibabanka AS
4
Cre
dit E
urop
e Ba
nk N
V A
nnua
l Rep
ort 2
015
4
Five
-yea
r ke
y fi
gu
res

From the CEO
I am pleased to report that Credit europe Bank recorded a robust financial performance for 2015, thus confirming our expectations for the year on the whole. our consistent performance has been driven by a disciplined strategy and guided by a set of clear strategic priorities on business simplification, risk management, regulatory requirements and cost controls. As the year was not without challenges, the initiatives taken enabled us to manage the headwinds that prevailed across our operations.
over the course of the year, macroeconomic and geopolitical uncertainties continued to surface. plummeting oil prices, sustained low interest rates, increasingly divergent monetary policies across major economies, stock market crash in China and economic sanctions against Russia contributed to challenging conditions.
this environment was our path to progress. throughout the year we remained focused on operating efficiencies, streamlining procedures, and investing in technology to provide even more convenience to our customers. We continued to offer tangible solutions with a candid perspective. All the while, we kept a tight grip on costs.
Despite our low lending volume in Russia and devaluation of Russian Rubles which together contributed to a smaller loan book and lower interest income, Credit europe Bank succeeded to reach the same level of profit before tax as last year (euR 62.5 million). Due to higher tax charges, we realized a net profit of euR 46.9 million (2014: euR 58 million). During 2015, total own funds of the bank increased from euR 1,117 million to euR 1,224 million and our solvency ratio stood at 17.57%.
In Russia, 2015 was another year of consolidation against the backdrop of geopolitical and economic headwinds. CeB Russia continued its focus on maintaining asset quality and organizational efficiency, and preserving the Bank’s franchise value. the Bank has successfully concentrated on effective risk monitoring and collection and continued moderate lending activity in a selected number of products and merchants. thanks to further improvements in our operational efficiency, we preserved a healthy C/I ratio of 44.9%.
At the year-end the Bank’s retail customer base exceeded 4.8 million and the Bank operated 69 branches and 564 AtMs in Russia.
In Romania, we maintained our conservative approach in asset generation. our focus was on credit card business. In order to consolidate our market position, we continued to invest in our successful “CardAvantaj” brand and launched our new “optimo Card”. our new card brand targets alternative consumer finance segments in the market.
In Western europe, we continued our focus on service quality to preserve our granular and loyal retail deposit base. With the completion of the e-account project at the end of 2015, CeB is now able to offer a fully automated process to its retail deposit holders in the eurozone. During the year, we succeeded to further reduce cost of our retail deposits in line with the general market trend.
In 2015, we took a strategic decision to exit retail lending business in Germany because of insufficient profitability. In 2016 and beyond, our retail banking center in Frankfurt will focus solely on servicing our retail deposit customers.
In Corporate Banking, despite the fact that 2015 was not an easy period in terms of market conditions and CeB had to continue its reactive conservative risk policy, I am pleased to report that our cash exposure has increased by 10% from euR 3.3 billion to euR 3.6 billion on YoY basis. In trade Finance business, negative effects of the sharp decrease in the prices of major commodities were partly offset by the increase in number of customers and commodities we are active in. In 2015, our trade finance volume reached euR 10.8 billion (2014: euR 11.4 billion).
looking ahead, our targets are ambitious and conditions before us are challenging. nevertheless we remain confident that we can meet and exceed our objectives. We will stick to the elements that have underpinned our success and will build upon them to achieve our goals. In 2016, we will continue to closely monitor developments in the markets where we operate. on one hand we will seize the opportunities to further strengthen our franchise in selected markets and products; on the other hand we will actively reduce our exposure in markets and products where we have low risk appetite. our diversified asset and revenue generation capacity will again be a major advantage in pursuing our targets.
thanks to our committed shareholder, I am pleased to underline that the capital base of Credit europe Bank nV was further strengthened by new capital of euR 100 million in the first quarter of 2015 in addition to the conversion of euR 103 million At1 securities into core capital in December 2014.
to conclude, I would like to express our gratitude to our customers, business partners and employees all of whom worked together intensively last year to continue generating long-term value for all our stakeholders.
Amsterdam, March 11, 2016
E. Murat Başbay
Report of the Managing BoardC
redit Europe Bank NV A
nnual Report 2015
5
Rep
ort of the M
anag
ing
Board

Our Network
Western Europe • Corporate Banking and trade finance services from the
netherlands, Switzerland and Malta• private banking services from Switzerland• Strong focus on direct banking services• Retail Banking services to almost 400,000 customers in
Germany, the netherlands, Belgium and Malta, mainly through the multilingua operations andl contact center in Frankfurt
Russia• Active in Retail, Corporate, Commercial and SMe Banking• 69 branches in 48 cities covering seven time zones• An important player in credit cards market with close to 1
million active cards• 4,168 sales points and 14,858 point of sale terminals• 564 AtMs
Romania• Active in Retail and Commercial Banking• 59 branches in 26 cities• Dominant market player with close to 300,000 active credit
cards and 17% market share• Strong partner merchant network with 7,867 sales points
and 8,661 point of sale terminals• 121 AtMs
Ukraine• Active in Corporate, Commercial and SMe Banking
Turkey • Representative office in Istanbul
Outside Europe• trade finance services from the Dubai International Financial
Centre in the united Arab emirates• Representative office in Shanghai, pR China
6
Cre
dit E
urop
e Ba
nk N
V A
nnua
l Rep
ort 2
015
Ou
r N
etw
ork

Customer FocusThe success of our customers is our own success.
All of our decisions are therefore taken with the customer in focus.

Retail Banking
(1) Frank Research Group
2015 was not free of volatility and uncertainties: emerging market vulnerabilities, legacy issues from the crisis in advanced economies, slumping commodity prices, China’s bursting equity bubble, pressure on exchange rates and continuing low interest rates. overall, we faced an intensely competitive, low-growth, low-margin environment – coupled with the pace of technology evolution and changing customer preferences.
Since the very beginning, Credit europe Bank pays close attention to customer and user perspectives. Accordingly, as before, in 2015 customer preferences and expectations on accessibility, easiness and personalization have been the key drivers for our operations. the main objective in 2015 for the Retail Banking Division was to maintain customer loyalty and customer satisfaction by making the banking experience for them as seamless as possible. In 2015, Credit europe Bank served almost 6 million retail customers in Western and eastern europe by offering a broad range of competitive, transparent and non-complex products.
Retail Banking offers deposits, cash loans, car loans and credit cards as well as a number of insurance products in cooperation with external insurance providers via online banking and an extensive broker and partner network. In Russia and Romania, in addition to telephone and web-based banking, we serve our customers through a wide-spread network of branches and points of sale.
Russia
Active in:• Retail, • Corporate, • Commercial and SMe
Banking
• 69 branches in 48 cities covering seven time zones
• An important player in credit cards market with close to 1 million active cards
• 4,168 sales points and 14,858 point of sale terminals
• 564 AtMs
8
Cre
dit E
urop
e Ba
nk N
V A
nnua
l Rep
ort 2
015
Ret
ail
Ban
kin
g

Russia –Weathering the storm
Retail Banking performance in Russia reflected another year of consolidation in the reshaping and strengthening the Bank’s business against a backdrop of geopolitical and economic headwinds, many of which could not have been foreseen at the outset of the year.
In 2015 many of the challenging aspects were common to the industry as a whole. In spite of the vulnarable economic and political conditions, the Retail Banking Division in Russia continued to invest their efforts into improvement of business performance while managing the impact of the negative external factors on retail banking business and preserving the Bank’s franchise value.
In the situation of economic uncertainty the Bank continued to apply very conservative approach to new risk and significantly restrained issuance – retail loan issuance was RuB 9.0 bn in 2015 vs RuB 31.4 bn in 2014; retail loan portfolio decreased to RuB 61 bn as of end 2015 (vs RuB 86 bn in 2014).
operational efficiency, network optimization and effective credit risk management remained the Bank’s strategic targets. As nIM decreased to the level of 7.2% (vs 9.1% in FY14), the decrease in interest income was compensated by cost control and optimization measures, which allowed further preserve the consistently healthy C/I ratio at 45.0 %. the headcount has been decreased from 3,336 (Dec14) to 2,612 Ftes (Dec15), in line with the Bank’s organizational efficiency policy.
the Bank continued the planned supply chain re-shaping with the focus on multi-purpose branches, distant channels and customer self-service solutions. About 85% of retail credit payments are fueled via AtMs. the effective network re-organization helped to attract new customers and to maintain the volume of individual term deposits on a notable level – it totaled RuB 7.1 bn in FYe15. At the year-end the Bank’s retail customer base exceeded 4.8m; the Bank operated 69 branches and 564 AtMs in Russia.
Retail Banking
9
Credit Europe Bank N
V Annual Report 20
15R
etail Ban
kin
g
9

Retail Banking
Germany – The Customer is Core
our Western europe retail operations are centralized in Frankfurt, Germany, where we have our multilingual customer contact center, sales & marketing and back offices, serving our customers in the netherlands, Germany, Belgium and Malta. our top priority is to assist our customers to meet more of their financial needs.
In 2015, the Western europe deposit volume remained stable at euR 3.4 bn. to cater for the changing needs and preferences of our customers we strengthened our online offerings. We applied high standards and make every effort to ensure the availability of our online banking services. to enable us to develop even more personalized and convenient service to our customers we simplified and enhanced our online banking platform. We also cleaned up our customer data, removing inactive or wrong customer data from our systems. While there is still work to do, we have made sustained and consistent progress against our targets during the year, providing strong evidence that our strategy is working.
the performance at the loan business in Western europe was challenging and the demand was limited. Following a comprehensive review and assessment run by the bank to evaluate all of the alternatives available for the future direction of its loan business in Western europe, the bank approved an orderly wind down. the division will continue to service and collect on existing loans, however new loan applications will be halted. this step will enable the Retail Banking Division in Western europe to both focus more on priorities and rebalance resources across our customer facing and support services.
10
Cre
dit E
urop
e Ba
nk N
V A
nnua
l Rep
ort 2
015
Ret
ail
Ban
kin
g
10

Retail Banking
Western Europe
• Corporate Banking and trade finance services from the netherlands, Switzerland and Malta
• private banking services from Switzerland• Strong focus on direct banking services• Retail Banking services to almost half a million customers
in Germany, the netherlands, Belgium and Malta, mainly through the multilingua operations andl contact center in Frankfurt
11
Credit Europe Bank N
V Annual Report 20
15R
etail Ban
kin
g
11

Retail Banking
Romania -
Aligning with Strategy for Growth
In 2015 Romania registered one of the best economic performances among eu member states with a preliminary GDp growth of 3.7%. Strong recovery in private investment and accelerating consumption demand, supported by an ample fiscal easing, fuel a medium-term average economic growth. thus as compared to previous years’ export-driven recovery, Romania returned to a more balanced growth model, where increasing disposable household income spurs internal demand and investment.
the big news of 2015 was the launch of optimo Card, the newest consumer finance product that represents a new step that Credit europe Bank Romania makes on the market in order to consolidate its position as an expert in the cards sector. the new product completes our portfolio besides CardAvantaj, our flagship product, which plays an important role on the credit cards Romanian market. As a result, 2015 generated more than 30,000 activated credit cards.
the whole year brought important players in our merchants’ network. Big names like Debenhams, Cora, Real, Dedeman and Bricodepot joined our portfolio. While the increase number of paypass poS’s, to almost 5,000, maintained Credit europe Bank Romania among the banks with the largest paypass acceptance network, on the local market.
12
Cre
dit E
urop
e Ba
nk N
V A
nnua
l Rep
ort 2
015
Ret
ail
Ban
kin
g

Retail Banking
Romania
Active in • Retail and • Commercial Banking
• 59 branches in 26 cities
• Dominant market player with close to 300,000 active credit cards and 17% market share
• Strong partner merchant network with 7,867 sales points and 8,661 point of sale terminals
• 121 AtMs
13
Credit Europe Bank N
V Annual Report 20
15R
etail Ban
kin
g

the Corporate Banking Division is one of the key pillars of Credit europe Bank nV. In the spirit of the bank’s overall strategy and its core values, Corporate Banking strives for balanced and prudent growth both in Western europe andin emerging markets, whilst carefully assessing the risks of the changing environments our teams are operating in.
the Corporate Banking strategy is defined in coordination with home market teams at the group level and implemented locally. Short communication lines, swift decision making, and seamless execution enables the bank to meet complex and ever changing requirements of our corporate customers.
our banking services provide more than standard banking products as we are eager to find and timely deliver tailor made solutions to our customers. our strength springs from our know-how, accumulated over 20 years of practice in the local and global markets we are present in.
Multi-cultural team of Corporate Banking possessing skills crafted from varied backgrounds offers the bank a number of advantages including deep knowledge of different markets, culturally sensitive customer service and a variety of product and geographical specializations. our local teams operate in close co-operation with each other in providing solutions to our international clientele.
our Corporate Banking Divisions are quartered in the netherlands, Russia, Romania, united Arab emirates, Switzerland and ukraine. the physical presence in diversified hubs and geographies provide us with a timely information flow and enables us to easily assess changing circumstances in order to serve our customers at needed precision and promptness. our effective communication lines provide our implementers with clear instructions and feedback opportunities which lead to swift decision making and smooth execution. the Corporate Banking Division benefits from
Corporate BankingSince its incorporation, Credit Europe Bank has been a keen niche player in structured trade and commodity finance. The bank has accumulated a valuable expertise in meeting the needs of large and medium sized international commodity traders, importers and exporters.
14
Cre
dit E
urop
e Ba
nk N
V A
nnua
l Rep
ort 2
015
No
tes
to C
onso
lid
ated
Fin
anci
al S
tate
men
ts

assorted operations, creating synergies Fedon varied practices in a selective number of areas: structured trade and commodity finance, corporate lending and vessel finance.
Since its incorporation, Credit europe Bank has been a keen niche player in structured trade and commodity finance. the bank has accumulated a valuable expertise in meeting the needs of large and medium sized international commodity traders, importers and exporters. As world trade growth rate outpaces economic growth globally and certain commodity flows prove essential to the economy, regardless of the larger macroeconomics; structured trade and commodity finance provides the bank with a continuous flow of interest- and fee income. With profound presence in key trading hubs namely Amsterdam, Geneva and Dubai, as well as in raw material exporting and importing countries, the bank enjoys such benefit of a wide-range coverage, guarding the practice with proper risk assessment and necessary alertness. Diversifying risks taken across geographies and a
large spectrum of commodities from minerals, metals, energy, oil, petrochemicals, and fertilizers to soft commodities such as grains and cocoa; the division fortifies its operations over a well-balanced and well-assessed risk quality base.
In addition to international trade finance, the bank also offers other Corporate lending possibilities to its clients who are mainly selected out of large scale corporations and active in markets complementing the bank’s growth strategy. Working capital loans and project finance transactions are the main type of lending offered to finance investments, acquisitions and operations of its customers. Corporate Banking Division selects its customers methodically and following exceptional due diligence, deliberately identifies the key risk factors, utilizes analytical tools, continuously monitors and reassess the health of their portfolio. promptly reacting to changes of its environment, the corporate lending division has recently undertaken to further widen its portfolio towards the West european markets.
Corporate Banking
15
Credit Europe Bank N
V Annual Report 20
15N
otes to C
onsolid
ated Fin
ancial S
tatemen
ts

Notes to Consolidated Financial Statements
The year in review: 2015
After years of stagnation following the 2008 financial crisis, the banking and financial services industry finally saw a rather positive momentum in 2015, yet still fighting with its crippling challenges.
From economical point of view, 2015 was dominated by sluggish global economic growth mainly driven by the slowdown in China, diminishing global demand for commodities, causing drastic decrease in commodity prices, negatively influencing the developing economies which are generally dependent on commodities, leading to cash outflow and rate cuts in ratings and relatively limiting credit availability for emerging markets. these developments have been coupled with the interest rate increase of Fed towards the end of the year, which was partly balanced by the rate cuts and quantitative easing in many other regions including europe.
In addition to such global developments, some other regional headwinds had negative influence on some of the markets the bank is active in such as sanctions towards Russia remaining in force, unrest in Middle east due to ISIS, massive influx of refugees from war torn regions, crisis erupting between turkey and Russia over a downed Russian jet fighter, etc.
As a result of these factors, continuous risk monitoring and conservative approach remained as the main pillars of our key business strategy. Corporate Banking risk mitigation had ever increasing emphasis over business generation and profit making in order to preserve the asset quality by divisions in effected geographies.
Corporate Banking in general:
In addition to a difficult and considerably volatile environment, banks now face rising competitive threats on all sides as insurers, private funding initiatives and private funded trading houses seek competition in the market.
Still, Corporate Banking - commodity and trade finance - continued to perform well in 2015. our consistent performance has been driven by a disciplined growth strategy and guided by a set of clear strategic priorities. From the founding of the bank, we believed in building long lasting relationships with our customers. this gives us the opportunity to understand their needs, analyse how our services meeting those needs, and to continue to improve. It generates superior return at lower risk. In 2015, deepening relationships with our clients remained a high priority and we were privileged to do business to a great deal with loyal customers to whom we have a long lasting-relationship. We became more selective about which customers we choose to serve, actively seeking new counterparties.
We are pleased to register an increase by 10% on Corporate Banking’s loan book from euR 3.3 billion to euR 3.6 billion during 2015. the increase is largely attributable to a euR 250+ millions of fresh lending to hearty players of the local european markets. from prudent risk adverse strategies to innovative products.
Trade Finance Volume (€ million)
2,000
4,000
6,000
8,000
10,000
12,000
2015
10,783
2014
11,360
8,731
2013
20%
40%
60%
80%
100%
2015
43%
34%
23%
2014
49%
28%
23%
39%
21%
40%
2013
Contribution to Desks in STCF
oil and petrochemicals
Metal and Minerals
Agri Commodities
1,000
2,000
3,000
4,000
5,000
2015
401
2014
448521
2013
Loans to Corporate Customers (€ million)
Cash non-Cash
16
Cre
dit E
urop
e Ba
nk N
V A
nnua
l Rep
ort 2
015
No
tes
to C
onso
lid
ated
Fin
anci
al S
tate
men
ts
Notes to Consolidated Financial Statements
Outlook for 2016: We share the views of many market players that 2016 will probably fall short of major recovery. Several important factors such as abundant oil supply, Chinese oversupply of steel products, the stagnant economies of mainly developed markets in combination with emerging markets’ shyness to stabilize, as well as new competitors in financing sector such as trading houses stepping in the gaps of the traditional banking and rapidly game changing regulations within the banking sector, will continue to put pressure over longed growth figures.
the Corporate Banking Division has always successfully responded to such changing market conditions and we are very confident, to do so in future, too. Despite facing challenges that confront us, for 2016, we see the potential for significant business opportunities. We are nimble and flexible and willing to innovate in terms of distribution and new markets. our teams consist of multi-cultural professionals, who are eager to bring their know-how in the local markets. We take the necessary steps to assess a constant flow of information in their profound expertise and consolidate the necessary actions, from prudent risk adverse strategies to innovative products. We work hard to serve our customers even better and to guide the path of the bank in line with its core values and to the satisfaction of its shareholders.
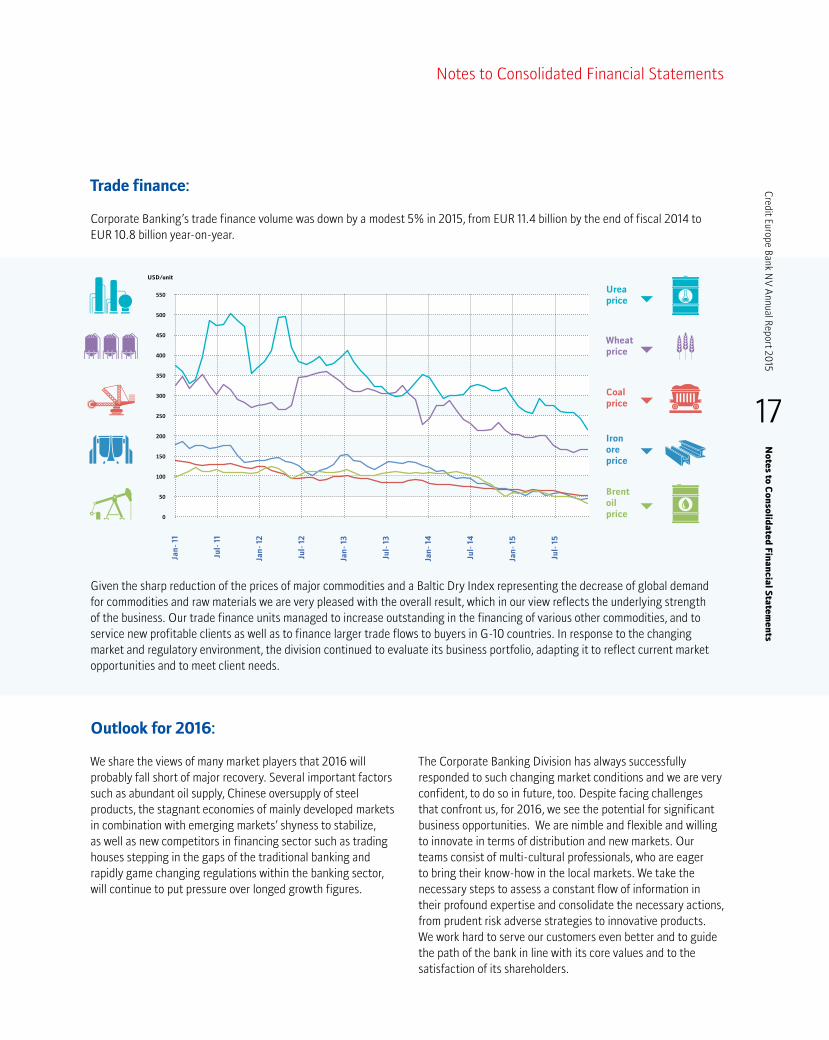
Trade finance:
Corporate Banking’s trade finance volume was down by a modest 5% in 2015, from euR 11.4 billion by the end of fiscal 2014 to euR 10.8 billion year-on-year.
Given the sharp reduction of the prices of major commodities and a Baltic Dry Index representing the decrease of global demand for commodities and raw materials we are very pleased with the overall result, which in our view reflects the underlying strength of the business. our trade finance units managed to increase outstanding in the financing of various other commodities, and to service new profitable clients as well as to finance larger trade flows to buyers in G-10 countries. In response to the changing market and regulatory environment, the division continued to evaluate its business portfolio, adapting it to reflect current market opportunities and to meet client needs.
Coal price
Iron ore price
Wheat price
Urea price
Brent oil price
Jan
- 13
Jan
- 15
Jan
- 12
Jan
- 14
Jul-
11
Jan
- 11
Jul-
13
Jul-
15
Jul-
12
Jul-
14
0
50
100
150
200
250
300
350
400
450
500
550
USD/unit
17
Credit Europe Bank N
V Annual Report 20
15N
otes to C
onsolid
ated Fin
ancial S
tatemen
ts
Credit europe Bank has a stable, granular and geographically diversified deposit base which is the core funding source of the bank. We offer easy-to-use and transparent deposit products to our clients in all our branches and subsidiaries. the retail customer deposits size of the bank remained stable around euro 4.0 billion during 2015, while the cost of deposits have further come down in line with the general market trend.
the bank has executed the following deals in international and local capital markets during the year:
Credit Europe Bank Ltd., Russia During the year 2015, Credit europe Bank ltd., Russia raised five RuB denominated loans totalling to RuB 18 billion with a total maturity of 3 years. the bank has also issued a “car loan” ABS transaction of RuB 3.5 billion maturing in 2024.
Credit Europe Bank (Suisse) SA In December 2015, Credit europe Bank (Suisse) SA successfully raised 1 year dual-currency syndicated term loan comprising of two tranches (euR 45 million and uSD 27.5 million) participated by major international banks.
Credit Ratings the bank and its Russian subsidiary have the following credit ratings at the of 2015.
Credit Europe Bank N.V, the Netherlands• Fitch long term Issuer
Default Rating: BB-/outlook Stable• Moody’s Global local
Currency Deposit Rating: Ba2/outlook negative• In June 2015, Moody’s upgraded
the long term deposit rating of Credit europe Bank n.V by two notches to Ba2.
Credit Europe Bank Ltd., Russia• Moody’s Global local
Currency Deposit Rating : B1/outlook negative• Fitch long term Issuer
Default Rating: BB-/outlook negative
In December 2015, Fitch affirmed the long term Issuer Default Rating of Credit europe Bank n.V and Credit europe Bank ltd (both BB-). the outlooks (stable for Credit europe Bank n.V and negative for Credit europe Bank ltd) were also affirmed.
Funding
18
Cre
dit E
urop
e Ba
nk N
V A
nnua
l Rep
ort 2
015
Fun
din
g

ProfessionalismOur professionalism embraces and stimulates the necessary skills, qualifications,
knowledge and diversity. Our colleagues undertake their tasks in a competent and integer manner.
Through teamwork we achieve our goals.

Human Resources Our organizational success depends on the high level of skills and professionalism of our employees. 20
Cre
dit E
urop
e Ba
nk N
V A
nnua
l Rep
ort 2
015
Hu
man
Res
ourc
es
the Human Resources department plays a critical role in supporting and upholding Credit europe Bank’s goals, by fostering a positive and engaging work environment. our organizational success depends on the high level of skills and professionalism of our employees.
to evolve the HR function from an administrative unit to a professional value-added business partner. the first steps have been taken to move towards a more strategic role, by starting to review core HR processes such as talent Management, performance Management, Career Development and learning. this move will eventually also entail a change in expectations and responsibility from other departments and function levels within the organization. extra attention will go to the training and development of line manager’s and their accountability for engagement, talent and employee issues. the process to uplift HR from a personnel and administrative function to a business partnership will continue in 2016.
We consider the development of our staff members an ongoing task and therefore continue making the effort to help employees reach their full potential. the talent program for high potentials has positively progressed throughout 2015. to enhance the development and capabilities of our entire human capital, more emphasis will be put on (e-learning) trainings. not only by allocating adequate training budgets, but also by creating more awareness about the importance and value of (self) development and by stimulating learning.
there lies a continuous emphasis on prominent subjects like engagement, retention & motivation of employees. In view of this, internal communication has been identified as one of the key factors, having significant impact. In 2015 a survey has been conducted on ‘Internal Communication’ at the organization’s headquarters. With this initiative, valuable input from our staff members has been obtained and the results derived from the survey have been analysed. Aside from showing positive aspects, several communication gaps came to the surface. Concrete actions for minimizing the gaps and enhancement are formulated and will be implemented within the organization throughout 2016.
In the interest of sharing best practices and increasing synergy within the group, in May 2015, the first Global HR Conference, initiated by the FIBA Group, took place in Istanbul. Aside from increasing the interaction between the HR functions and creating an environment to enable the sharing of best practices, the conference included various trending HR topics. themes like, the Added Value of HR functions, top HR Challenges, Corporate Social Responsibility projects, were presented by various prominent guest speakers.
While serving our customers in different geographies as an international bank, we embrace the business challenges and opportunities arising from the diversity. Alike concerning our employees, we affirm diversity and inclusion and provide equal opportunities for all. We view staff diversity broadly to include, among other things, men and women of different ethnicity, races, cultures, religions, ages, intellectual traditions, and economic and social backgrounds.

Human Resources
21
Credit Europe Bank N
V Annual Report 20
15H
um
an R
esources
21

Corporate Social Responsibility Social and environmental performance of the bank is monitored through a system of established processes, such as the customer due diligence process, the credit application process and the transaction due diligence process.
22
Cre
dit E
urop
e Ba
nk N
V A
nnua
l Rep
ort 2
015
Cor
por
ate
So
cial
Res
pon
sib
ilit
y

Credit europe Bank recognizes the social and environmental responsibility as an integral part of its business strategy, corporate decision-making and day-to-day practice and gives high importance to the impact of its activities on its stakeholders as well as on society and the environment at large. In this respect the bank has established a social and environmental management framework, which is built on the basis of the bank’s core values and underlying commitment to respect elementary ethical norms, such as values of human life, the right to work, fair working conditions, civil responsibility, equal opportunities and occupational health and safety. under these pillars, the bank operates a Social and environmental Responsibility policy, which supplements other internal policies and procedures such as the Code of Conduct and the bank’s whistle-blower system.
Credit europe Bank continuously endeavours to ensure effective social and environmental responsibility practices in all its activities, products and services. Hence, the application of the social and environmental management framework requires the involvement of: • Business lines – the departments which have direct client
contact and originate transactions (leading to potential social and environmental risk); and
• Risk Management functions – the independent risk management departments which provide control over the activities undertaken by the business lines of the bank.
Social and environmental performance of the bank is monitored through a system of established processes, such as the customer due diligence process, the credit application process and the transaction due diligence process. Any issues identified are escalated to the appropriate stakeholders and addressed through regular Management Information Systems (e.g. risk dashboards).
In the last quarter of 2015, the Dutch Bankers Association issued a climate statement in which the Dutch banks jointly recognize climate change as a serious problem which needs to be addressed collectively. the climate statement consists of 10 action points/measures and in the statement the Dutch banks, amongst others, encourage the Dutch government to provide incentives for companies and institutions and to enable them to publish their Co2 emissions so that banks can better include the climate impact in their financing and investment decisions. In this respect, Credit europe Bank intends to meet, to the extent possible, the objectives set out in the aforementioned climate statement in the coming years. In addition, the bank aspires to further enhance its internal training for better understanding of the social and environmental risks that could be associated with its products and services.
Corporate Social Responsibility
23
Credit Europe Bank N
V Annual Report 20
15C
orporate S
ocial R
espon
sibility

Risk Management and Control
Risk management and internal control is anchored strategically in the banks’ organization, with active involvement at both the Managing Board and Supervisory Board level. the Managing Board has the responsibility to ensure that the bank maintains an effective system of risk management and internal control. A risk management and internal control framework has been implemented in line with the bank’s business activities and geographical organization. the purpose of such framework is to set the minimum requirements for risk management and internal control in respect of major risks and successful achievement of Credit europe Bank’s strategic goals.
the Managing Board sets Credit europe Bank’s risk appetite and the Supervisory Board conducts oversight on the overall of risk management and internal control framework that is designed, in light of applicable local and international legal and regulatory requirements, to respond to the various financial and non-financial risks the bank is exposed to. the Managing Board, and in particular the Chief Risk officer (CRo) are responsible for implementing and maintaining the risk policies within the organization, and monitoring the risk exposure to ensure that Credit europe Bank’s activities and portfolios are not exposed to unacceptable potential losses or reputational damage. In his activities the CRo is supported by the Risk Management and Compliance Divisions. the financial and non-financial risks are assigned as follows:• Risk management: credit risks, market risks, asset
and liability management (AlM), capital and liquidity management, operational risks and information security risks.
• Compliance: staff integrity risks, customer integrity risks (including anti-money laundering, know your customer and financial sanctions), organisation integrity risks (including conflicts of interest / related parties, data protection) and services integrity risks (including product information and complaint handling).
each banking subsidiary has local risk management and compliance functions which report both to local management and Head office management. Credit europe Bank based its governance framework on a “three lines of defence” model. the business units form the first line of defence. the second line consists of the risk management, compliance and other control functions. the presence of the CRo within the Managing Board ensures that risk management, compliance and other control issues are addressed and discussed with sufficient authority. the third line of defence is the internal audit function, which assesses the functioning and effectiveness of business units, financial risk management and non-financial risk management activities.
Credit europe Bank’s risk management and internal control framework enables the Managing Board to control the financial and non-financial risks of business activities. this framework is governed by a system of policies, procedures, committees, business lines as well as support and control functions. limits and controls have been put in place to mitigate financial and non-financial risks to an acceptable level in line with Credit europe Bank’s risk appetite. the risk appetite has been approved by the Supervisory Board and is designed to i) set the maximum level of risk the bank is willing to accept in order to achieve its business objectives and ii) protect the bank’s activities, not only in terms of profitability, sound capital adequacy and liquidity ratios, but also in terms of reputation and integrity risks. to maintain the quality of financial reports and to increase the effectiveness of reporting, the bank has implemented internal financial reporting controls.
Effectiveness of risk management and internal controls
the management annually reviews the effectiveness of the risk management and internal control framework. the internal audit function reviews the self-assessment of the effectiveness of the risk management and internal control framework, taking into account their knowledge on policies and procedures and related audit findings. the Audit & Risk Committee monitors the risk management and internal control framework, reviews the results of the self-assessment and findings of the internal audit function. In addition, regular reports are presented to the Audit & Risk Committee by the management, internal audit, risk management and financial control. Regular risk reports are distributed covering credit risk, market risk, liquidity risk, operational risk, etc. Compliance reports including integrity risks (money laundering, improper conduct, conflicts of interest etc.) are reported to the Compliance oversight Committee. Management has reviewed the risk management and internal control processes and concluded that they are designed efficiently and operating effectively. Areas of improvement observed are not considered as material control deficiencies.
note 37 of the Financial Statements elaborates in more detail on the risk management and internal control framework, the risks incurred and the main risk factors attached to the strategy of the bank. our corporate website also provides information on risk management and internal control.
24
Cre
dit E
urop
e Ba
nk N
V A
nnua
l Rep
ort 2
015
Ris
k M
anag
emen
t an
d C
ontr
ol
Risk Management and Control
Key developments in 2015In 2015, the following events required specific attention of the Managing Board:• the bank’s asset & liability management activities including
the internal liquidity adequacy assessment process and related reporting standards have been automated. the information system provides real time view over the bank’s consolidated cash flow structure. With the same token, the bank implemented a similar module for credit risk reporting of which full implementation of information of all banking subsidiaries will be completed in the course of 2016. Both tools are parametrized in line with CRR requirements as well as european Banking Authority (eBA) guidelines.
• In 2015, Credit europe Bank continued a large scale program involving re-engineering of the bank’s entire credit risk management framework. this project not only includes the review and re-calibration of the bank’s existing credit rating models, but also developing new models and tools to better quantify the risk profile of its borrowers.
• the aforementioned developments also underpin, amongst others, the importance of having in place an internal capital adequacy assessment process, an internal liquidity assessment process and a recovery plan. the recovery plan of the bank provides a menu of measures to address a range of severe financial stresses. the bank’s recovery plan can be readily implemented when necessary and is integrated within the bank’s risk management and internal control framework. the recovery plan is yearly reviewed to take into account the latest developments and results of most recent stress tests.
• the Managing Board pays continuous attention to further improvement of the internal control environment in the bank both in financial risk- and non-financial risk areas. the annual internal control framework evaluation performed at, and the follow-up of the improvement areas identified thereby contribute to a better standard of the internal control and risk management practices and facilitate benchmarking between Credit europe Bank’s entities. In 2015, Credit europe Bank further embedded risk assessments and control activities conducted by the business units and It department. the results of these assessments are being used for further strengthening of the internal control framework and the bank’s risk and control measures.
• the systematic integrity risk assessment conducted by Credit europe Bank delivered insights in the integrity risks Credit europe Bank is facing, how these risks are mitigated by the controls that have been implemented and the residual risk that remains for Credit europe Bank. the assessment outcome also helped Credit europe Bank to define its
compliance efforts and to adopt appropriate measures to optimally allocate the available resources.
• In order to further strengthening Credit europe Bank’s cyber resilience, enhancements have been made in the areas of information security, data protection and business continuity.
Areas of improvement for 2016
the bank continues to make all necessary preparations to comply with ever changing regulatory requirements including eMIR, CRS and international financial reporting standards (e.g. IFRS9). Adjustments to the bank’s core It system and related procedures are being made and related reporting requirements will be implemented in 2016 onwards. Management also aims to further streamline Credit europe Bank’s data information framework to increase the bank’s efficiency and effectiveness and to meet client expectations.
Responsibility Statement
Credit europe Bank’s internal control framework is based on the framework developed by CoSo (Committee of Sponsoring organizations of the treadway Commission). our risk management and internal control framework is compliant with the basic requirements II.1.4 and II.1.5 of the Dutch Corporate Governance Code. Internal controls ensure that transactions are recorded as necessary for reporting in accordance with International Financial Reporting Standards as adapted by the european union. the Managing Board has concluded that the risk management and internal control framework is adequate and effective and provides reasonable assurance that the financial reporting is free of material misstatement.
pursuant to article 5:25c section 2 part c of the Financial Supervision Act, the members of the Managing Board state that, to the best of their knowledge: • the financial statements give a true and fair view of the
assets, liabilities, financial position and profit or loss of Credit europe Bank and the companies included in the consolidation;
• the annual report gives a true and fair view of the state of affairs on the balance sheet date and the course of affairs during the financial year 2015 of Credit europe Bank and its affiliated entities whose information is included in its financial statements;
• the annual report describes the material risks which Credit europe Bank faces.
25
Credit Europe Bank N
V Annual Report 20
15R
isk Man
agem
ent an
d C
ontrol
25

It seems like financial markets are entering into a new phase just before 2015 ends with the first rate hike in uS over a decade. emerging markets are going through a quite volatile and vulnerable period with rising geopolitical risks, sluggish energy & commodity prices and end of an easy monetary policy. there is a strong trend of persistent commodity price declines and global demand remains sluggish for quite some time. It is also quite interesting to see the developed economies are caught in different cycles where european & Japanese economies are in search for further easing tools where uS & england are entering into a tightening path.
The Netherlands
For 2016, it is expected that the economic activity is back to where it was before the crisis. However, unemployment still stands at much higher levels than pre-crisis peak at 6.9% in late 2015. Due to the significant income tax cuts of €5 billion (equivalent to 0.7% of GDp), Dutch households will see their disposable income increase next year and inflation is likely to rise from an average rate of 0.6% to 1.2% in 2016.
the housing market recovery remains on track. Recent data confirms that house prices have increased by 5.1% over the last seven quarters since end of 2013. Better economic growth, low mortgage rates and high consumer confidence will likely continue to support the housing market.
Euro Zone & Swiss Economy Outlook
eCB has failed to satisfy the market expectations on its last meeting by signalling the market that it sees its measures adequate for economy to get out of the low inflation & growth outlook in 2016. However, the market expectations were running a bit high as eCB still delivered a cut to the interest rate on deposit facility by 10 bps to -0.3% and extended the duration of its Asset purchase program by 6 months till March 2017 while also broadening the scope of eligible assets.
euro area is expected to benefit from the low energy prices, weaker currency and easing in the credit supply conditions and 1.5%-2% growth rate is estimated in 2016. Headline CpI is still close to very low levels of 0.1% but is expected to bounce gradually with positive unit labour costs and less scope for continued margin compression. However it should be noted that eurozone economies are quite vulnerable to external factors arising from Asia and uS in terms of both growth and monetary policy.
the Swiss economy fared better than feared and it is expected to close 2015 with growth rates just under 1% which is likely to pick up next year. SnB did not do anything on its last monetary policy after eCB’s last meeting. However, SnB continues with its guidance that Swiss franc is still overvalued and that bank will remain active to influence the exchange rates as it deems necessary.
Romania is likely to emerge as one of the eu’s fastest-growing economies in 2015, with GDp growth standing at 4.1%. on the political front, the parliament is expected to pass populist measures ahead of general elections in 2016 which will lead to higher public spending and accelerating wage growth. the CpI expectation in 2016 is around 1.4% and downside risks persist which would probably hold back nBR to start hiking rates in 2016.
The United States
uS economy is entering a transitionary period with Congressional and presidential elections in 2016 and with its first rate hike cycle in a decade. FoMC has announced a hike of 25 bps at its last meeting in December 2015 while communicating that the normalization of the federal funds rate is likely to follow a more gradual and shallow path compared to previous cycles. uS economy is expected to grow around 2.25-2.5% in 2016 with unemployment rate staying at 5%.
It was emphasized by Fed that low levels of inflation is temporary in uS economy and core inflation is expected to reach its 2% target in the coming 18 months. FoMC members’ estimations show 4 more hikes to follow till the end of 2016 (FoMC dots) but it is clearly communicated that this is not an expectations management tool but more of an optionality for the members. Market rates are pricing in two more hikes of 25bps each in 2016 albeit the longer term neutral rate is forecasted to be at 3.5% at the end of the hiking cycle.
26
Cre
dit E
urop
e Ba
nk N
V A
nnua
l Rep
ort 2
015
Ou
tloo
k
Outlook 2016

Emerging Markets
After a disappointing 2015 performance for most eM asset classes, the downside risks are stronger than before for the next year. Weaker Chinese growth, further falls in commodity prices, corporate defaults and start of Fed tightening cycle are the most clearly defined risks for 2016.
emerging market currencies depreciated significantly in 2015, and are still vulnerable to the stronger dollar and lower growth expectations in 2016. the IMF expectations are showing that eM growth will rebound in 2016 to 4.5% levels after reaching bottom in 2015. this recovery is mainly expected to come from countries which suffered deeper adjustments - such as Brazil and Russia - due to steep fall in commodity prices and political shocks. A hard landing in China will continue to be the main concern for all eM countries especially in latam and Africa due to their high exposure to China.
Following four elections within the last two years, there are no planned elections until 2019 in turkey. As the political uncertainty seems to decrease, this is indeed a worthy opportunity for the ruling-party AKp to focus on economic problems by implementing long-waited structural reforms and decrease institutional independence concerns. As a result, markets expects a 3% GDp growth in 2016 with support from rising domestic consumption expected to be driven mostly by fiscal easing promised during november elections. oil prices had a significant positive impact on turkey’s main macro vulnerability, namely its current account balance, pushing it to surplus for the second time since 2009. even though the political uncertainty is over and declining energy/commodity prices are supposed to help the fundamentals of the economy, turkey is still vulnerable to external shocks since the geopolitical risks are rising in the region which is expected to influence turkish economy in 2016. expectations have been accumulating on the new economic reform programme of the new government which is quite crucial for investors to see if they will be delivering what investors are looking for. on the monetary policy, tCMB Governor erdem Basci signalled potentially important changes to CBt’s policy framework: a simplification of the policy by gradually letting go the current rate corridor and eventually adopting a single rate policy. It will also be important to see who will be succeeding erdem Basci as the next central bank governor in April.
China is dealing with some obstacles posed by high levels of debt, weaker demographics and disinflationary pressures which cause overall GDp growth to remain in a downward channel. GDp growth is expected to be 6.7%YoY in 2016 and
6.6%YoY in 2017. on monetary policy, pBoC is expected to use more relending tools to manage liquidity and improve the interest rate transmission mechanisms. the central government should continue to take the lead in fiscal easing, with special financial bond issuance and/or special treasury bond issuance a potential option. there is still notable risk of further deceleration in investment growth and expected GDp growth to slip to 6.0% in 2016. pBoC is expected to be more aggressive, with another four rate cuts of total 100bp while also shifting its peg policy against uSD towards a basket of currencies.
In Russia, while 3Q GDp points to earlier stabilization, tight fiscal policy, bearish business sentiment and recent slide in oil prices is expected to keep Russian growth in negative territory at -0.8% in 2016. Weak domestic demand resulted in inflation slowing throughout 2015 and is likely to continue its trend to 7.8% in 2016. this will allow CBR to cut its key rate to 10.50% (11% as of this writing) and bring it back to the level before the emergency increase in December 2014 that helped to stabilize a depreciating Ruble.
In ukraine, after sharp declining growth rate forecast around -10.7% in 2015, GDp is set for a recovery in 2016. Since the annexation of Crimea, ukraine have been diversifying its trades away from Russia as the latter threatened to impose new trade restrictions if ukraine enters the eu DCFtA, planned in January. the near-term challenge which would determine ukraine’s prospects of cooperation with the IMF lies in the adoption of a new tax reform that will allow the consolidated government budget deficit to 3.9% of GDp and stay on track with the IMF programme. After the restructuring of its current international debt stock, risks still remain as to how they will restructure their debt to Russia.
economic developments in the Gulf Region Countries (GCC) continue to be driven largely by the sustained decline in oil prices over the last year, and governments have addressed the shortfall in oil revenues through a combination of spending cuts and subsidy moderation. the slump in oil prices is also affecting the banking sector liquidity, as government deposits are a key contributor to the total bank deposits in the region. However, real growth in the GCC appears to remain robust, underpinned by increased oil production as governments boost output to mitigate some of the impact of lower oil prices. the GDp in uAe is expected to grow at 4.0% to $374 billion and at 4.5% to $413 billion, in 2015 and 2016 respectively, while annual inflation is projected to pick up to 4.0% in 2015, and ease down to 3.5% in 2016.
27
Credit Europe Bank N
V Annual Report 20
15O
utlook
27
Outlook 2016

Profile of the Managing Board as per February 2016 E. Murat Başbay (1968) Chief executive officer
Enver Murat Başbay holds a BSc degree in business administration from Bosphorus university, Istanbul. He began his career in 1992 at Arthur Andersen Worldwide and worked in the Istanbul and Dubai offices. In 1997 he joined the founding team of Credit europe Bank in Russia. In 1999 he joined the management team of Credit europe Bank in the netherlands and he played an active role in the expansion of the bank as CFO and member of the Managing Board. Mr. Başbay returned to Russia in 2005 as Ceo. under his leadership the Russian subsidiary of Credit europe Bank n.V. grew substantially. Since June 2010, Mr. Başbay has been CEO of Credit Europe Group, currently responsible for treasury, corporate credits and corporate governance.
Şenol Aloğlu (1965)Deputy Chief executive officer
A graduate of Bosphorus university, Istanbul, in business administration, Şenol Aloğlu started his banking career at Interbank in 1987, joining the Fiba Group in 1991. He held various positions at Finansbank AS and Finans leasing AS in Istanbul. In november 2000, he was appointed executive Vice president for Financial Institutions and also Country Manager for the netherlands. In november 2005, he was appointed Managing Board member at Credit Europe Bank. Mr. Aloğlu is responsible for retail banking, bank relations, financial institutions’ credits, information technology, operations and public relations.
Umut Bayoğlu (1973)Chief Financial officer
Holds a BSc in economics from Metu in Ankara. He began his career in 1996 as a management trainee with Finansbank AS. In 2001 he was appointed Head of Financial Control in Germany. In 2006 he became CFo of Credit europe Bank and in 2008 he joined the Managing Board. He is responsible for financial control, human resources, accounting and central bank reporting.
Scott Cheung (1975) Chief Risk officer
Holds a postgraduate ‘Register-accountant’ qualification from the university of Amsterdam. He worked for six years at eY (named ernst & Young Accountants at that time) in Amsterdam and Hong Kong, before joining Credit europe Bank in 2002 as Head of the Internal Audit Department. In 2006, he was appointed Head of Group Audit, responsible for coordinating the group’s Internal Audit activities. Mr. Cheung has been a member of the Managing Board since December 1, 2010. He is responsible for financial and non-financial risk management, internal audit and compliance.
Levent Karaca (1970) Member
Holds an MBA degree in Finance and economics from Marmara university in Istanbul. He began his career in Istanbul with Finansbank AS, worked for Banque de Bosphore in paris, France and joined Credit europe Bank in 2000. He worked at the Belgian branch of the bank, and was responsible for setting up the corporate and retail divisions of this branch before moving to Russia in 2006, where he was head of the Corporate Banking division and a member of the management team. He returned to Amsterdam in 2010 to become Division Director Corporate Banking responsible for the corporate banking activities of the bank on a consolidated level. Mr. Karaca was appointed to the Managing Board of the bank in 2012. As a Board Member he is chiefly responsible for corporate banking and legal affairs.
28
Cre
dit E
urop
e Ba
nk N
V A
nnua
l Rep
ort 2
015
Pro
file
of
the
Man
agin
g B
oard
Profile of the Managing Board

IntegrityIntegrity defines our obligation to generate trust
and confidence through ethical behavior and by
complying with laws, regulations and guidelines.

Corporate Governance
A. GeneralCredit europe Bank n.V. (CeB) is a public limited company (naamloze vennootschap) established in Amsterdam on February 24, 1994. the company has registered shares and is not listed on any stock exchange.
Share capitalAs of December 31, 2015, the total issued and fully paid-up share capital of the bank amounted to € 632.464.054. During 2015 the capital of CeB was increased from € 429.5 million to the aforementioned amount of €632.464.054. the shares of CeB are fully owned by Credit europe Group n.V. (CeG), a holding company established in the netherlands. CeB makes up around 99% of CeG’s assets.
CeG’s shares are ultimately owned, through -inter alia- the investment company FIBA Holding AS in turkey, by Mr. Hüsnü M. Özyeğin.
Regulatory frameworkCeB has had a full banking license in the netherlands since 1994. the Dutch Central Bank (De nederlandsche Bank or DnB) is the consolidated prudential supervisor: its supervision extends to CeB’s banking activities in the netherlands as well as to the banking activities of its subsidiaries.
not only is the Dutch Central Bank the supervisor of CeB, it is also our regulator. the provisions of Supervisory Regulations and policy Rules issued by DnB apply to CeB to the fullest extent. Furthermore, the international standards and guidelines from european- and other relevant authorities are used by CeB as tool to substantiate its due compliance to these regulations.
In addition, the bank is registered as financial services provider with the netherlands Authority for the Financial Markets (Autoriteit Financiële Markten or AFM).
Although CeB is not listed, it voluntarily supports and applies, to a large extent, the best practices of the Dutch Corporate Governance Code, mindful of its role as a financial institution in the netherlands. this is also in line with Dutch Central Bank’s recommendations to apply the best practices of the Dutch Corporate Governance Code. For more information on the bank’s application of the principles and best practices of the Dutch Corporate Governance Code, see page 32.
Further CeB is subject to the provisions of the Banking Code (Code Banken) – insofar its priniples are not ‘overruled’ in the meantime by legislation or other DnB rules. the sector-wide
principles in the Banking Code were announced by the Dutch Bankers’ Association (nederlandse Vereniging van Banken) with effect from January 1, 2010 and have been updated as of 1 January 2015. the new Banking Code forms part of the set of documents titled ‘Future oriented Banking’. this package comprises of a Social Charter, (an updated) Banking Code and a Bankers’ oath (with associated Rules of Conduct and a disciplinary system). All CeB’s current employees working in the netherlands have taken the Bankers’ oath/Affirmation. each quarter a Bankers’ oath session will be held for new employees of CeB. As the members of the Supervisory Board and Managing Board already took their oath/Affirmation in June 2013, in 2015 they signed a declaration through which they acknowledged the disciplinary regulations attached to the Bankers’ oath. For more information on our application of the principles of the Banking Code, please see a summary report in page 33, section D and a full report on www.crediteuropebank.com.
the statutory corporate rules in the netherlands are laid down in the bank's articles of association (statuten). the Managing Board, Supervisory Board and each subcommittee have their own charters (reglementen). the charters of the Managing Board, the Supervisory Board and its subcommittees are published on our corporate website.
For employees and others working with CeB, a Code of Conduct has been established to set standards for professional conduct. Furthermore, an extensive set of internal governance-related policies and procedures apply to our employees, ranging from ‘whistleblower’ procedures to policies relating to expenses.
Credit Europe Bank N.V. as a parent bankper the end of 2015 CeB directly owns five banking subsidiaries in Russia, Switzerland, Romania, ukraine and the united Arab emirates, and two leasing companies in Romania and ukraine.
to underpin the central position of the head office in Amsterdam, the netherlands, the bank applies a functional reporting structure: local managers in the subsidiaries maintain a direct reporting line to the functional head of the respective department in Amsterdam. this structure applies to departments such as Internal Audit, Compliance, treasury (asset-liability management), Credits, Risk Management, It, Financial Control and Corporate Banking. Moreover, the general managers of all subsidiaries report directly to the Ceo of CeB. During 2015, the general managers of the bank’s subsidiaries and the members of the Managing Board met on a regular basis. the main purpose of these meetings is to share knowledge and experience, to align group policies, and to consider the bank’s strategy and budgets.
30
Cre
dit E
urop
e Ba
nk N
V A
nnua
l Rep
ort 2
015
Cor
por
ate
Gov
ern
ance
Finally, in order to ensure that CeB’s business policies are applied consistently and for CeB to exercise control over its subsidiaries, the Ceo of CeB and (in most entities) one other Managing Board member sit on the Supervisory Board or Board of Directors of subsidiaries of CeB. In addition to each of these local boards, one or two independent CeB Supervisory Board members have been appointed as board member.
B. BoardsCeB has a two-tier board structure, with a Managing Board and a Supervisory Board.
Managing Board
Compositionthe Managing Board consists of 5 board members. It is composed in such a way that it is able to perform its tasks properly. the individual resumes of each of the members of the Managing Board can be found on page 27.
Tasks the Managing Board is responsible for the management of CeB, which includes realizing the bank’s goals and strategy, setting policies and achieving results. the Managing Board is also responsible for compliance with all relevant laws and regulations, management of the risks attached to our banking activities and the bank’s funding. the members of the Managing Board take the social role of the bank and the interests of the bank’s various stakeholders into account in the performance of their management function.
Without affecting this collective and joint responsibility, the members of the Managing Board have agreed to allocate their tasks as follows:
Murat Başbay, Ceo treasury, corporate credit and corporate
governance
Şenol Aloğlu, Deputy Ceo Retail banking, bank relations, financial
institutions’ credits, operations,
information technology, public relations
Umut Bayoğlu, CFo Financial control, human resources,
accounting, central bank reporting
Scott Cheung, CRo Financial and non-financial risk
management, internal audit, compliance
Levent Karaca, Member Corporate banking and legal
Supervisory BoardFor a full description of the Supervisory Board: its composition, tasks, subcommittees and 2015 report, see page 41.
C. Dutch Corporate Governance Codethis section contains a brief overview of CeB’s compliance with the best practice rules of the Dutch Corporate Governance Code (in this section known as the Code). It should be noted that due to our private ownership structure, the Code’s provisions on shareholders (rights, meetings, obligations, protective measures – see Chapter IV of the Code) are not applicable to CeB.
Based on a gap analysis of the provisions in the Code and CeB’s current practice and structure, the CeB’s main deviations from the relevant best practices of the Code are:
Transparency on remuneration of Managing Board and Supervisory Board (best practice provisions II.2 and III.7).
At present, information is given on the remuneration of the Managing and Supervisory Board collectively per board, split into fixed and variable remuneration. no information is given at an individual level. this also applies to (individual) pension rights, peer group information and performance assessment criteria. It is the view of the Managing Board that the aggregate quantitative and qualitative information provided in the Remuneration Report in paragraph F below is sufficiently transparent for stakeholders. Information in paragraph F below is in line with the disclosure requirements set out by DnB/the relevant eu regulations/directives.
Independence of Supervisory Board members (best practice provision III.2)
under best practice provision III.2, the requirement is set for Supervisory Board members that ‘all members but one are independent’. Since January 1, 2013, the following statement applies to the Supervisory Board of CeB: that ‘half of the members are independent’. this ratio is in line with DnB’s requirements in that respect.
Diversity (best practice provision III.3)Although the composition of the Supervisory Board is diversified in terms of background, expertise and age, the gender diversity within the Supervisory Board requires improvement. this is acknowledged by all members of the Supervisory Board. For 2016 the item of gender diversity is put on the priority list of the Supervisory Board and it will be investigated how and within which time-frame the gender diversity within the Supervisory Board can be improved.
D. Banking Codethis section summarizes how CeB applies the principles of the Banking Code and where we deviate from these. A full report on implementation of the Banking Code can be found on our website, www.crediteuropebank.com
Corporate Governance
31
Credit Europe Bank N
V Annual Report 20
15C
orporate G
overnan
ce

please find below a summary of our application of the principles of the new Banking Code in 2015. the overview follows the sequence of the chapters of the Banking Code.
1. Sound and ethical operationthe Managing Board has set out the strategy of the bank for the period 2015 – 2018 in a Strategy Document. this document has been approved by the Supervisory Board. the Strategy Document outlines the defined business strategy and the set of key objectives appropriate for the current landscape for the period until 2018. the strategy includes both financial and non-financial measures, it defines the implementation process and timeline. Inter alia the following topics are included in the Strategy Document: guiding principles (including the bank’s vision, mission and its core values), strategic objectives, HR, It, Risk Management and Internal Control, Financial targets, Corporate Social Responsibility etc. the bank’s strategy is embedded in the daily business of the different departments of the bank.
CeB recognizes the social and environmental responsibility as an integral part of its business strategy, corporate decision-making and day-to-day practice and gives high importance to the impact of its activities on its stakeholders as well as on society and the environment at large. In this respect the bank has established a social and environmental management framework, which is built on the basis of the bank’s core values and underlying commitment to respect elementary ethical norms, such as values of human life, the right to work, fair working conditions, civil responsibility, equal opportunities and occupational health and safety. In addition CeB will do its utmost to meet the objectives set out in the Climate Statement issued by the Dutch Bankers Association in the coming years.
When setting its strategy CeB has carefully considered its role in society. this appears amongst others from CeB’s mission (i.e. providing financial services that create value for its customers) and its core values (‘customer focus’, ‘integrity’, ‘professionalism’ and ‘transparency’).
In order to ensure a proper governance structure CeB has instituted several committees in addition to the Supervisory Board and the Managing Board, such as the Asset & liability committee, It Steering committee, Risk committees and Credit committees. these committees meet on a regular basis. Further weekly management meetings are organized and each quarter a General Managers’ meeting is held (see paragraph 3 herein below for more information). the committees/meetings support the Managing Board in its daily management of the bank. the Supervisory Board monitors whether the bank’s
governance structure functions properly. this is inter alia done through the quarterly Supervisory Board meetings and the meetings of the sub-committees of the Supervisory Board (such as the Corporate Governance & nomination committee).
to enable the members of the Supervisory Board and the Managing Board to be a role model for the bank’s employees an introduction program for new board members has been developed. As a part of this program the members are trained on the bank’s core values, its main policies (e.g. code of conduct) and the bank’s culture. For the current Supervisory and Managing Board members regular awareness sessions are held during the board meetings and also trainings on this topic are organized. In connection with the annual evaluation of the members of the Managing Board the way in which they fulfil their exemplary role is assessed. the fulfilment of the exemplary role by the Supervisory board is reviewed in connection with their annual self-evaluation/suitability matrix and the external assessment.
the standards on integrity, morals and leadership are included in the bank’s core values, different internal policies/guidelines and in the Charters of the Supervisory Board and the Managing Board. Further these standards are communicated through intranet, internal trainings (/e-learnings), staff mailings and staff events. the monitoring of the duly application of these standards is embedded in the daily practice of the bank’s departments. In addition monitoring takes place by the HR and the Compliance department, Managing Board, Supervisory Board (and its sub-committees including the Compliance oversight committee) and the Internal Audit department.
CeB acknowledges that a solid It-infrastructure is vital for the functioning of the bank. Its system architecture is composed of industry proven technologies and payment systems supporting automated workflows. transactions are secured with the latest encryption standards, while at the same time software vulnerabilities are continuously monitored, investigated and mitigated. this all enables CeB to process transactions and orders of customers fast, safe and accurate. Due to the use of technologies that are widely adopted within the financial industry and the service oriented basis of the application structure, CeB can quickly adapt to changing demands of its customers. the It Steering Committee and the Supervisory Board supervise, discuss and decide on It related matters. Within the Supervisory Board ‘It Management’ is a recurring agenda-item. In the last years there is an increasing focus on security related activities (such as vulnerability management, data leakage prevention etc.). Additionally, modernization of infrastructure components and mobile device management
Corporate Governance
32
Cre
dit E
urop
e Ba
nk N
V A
nnua
l Rep
ort 2
015
Cor
por
ate
Gov
ern
ance
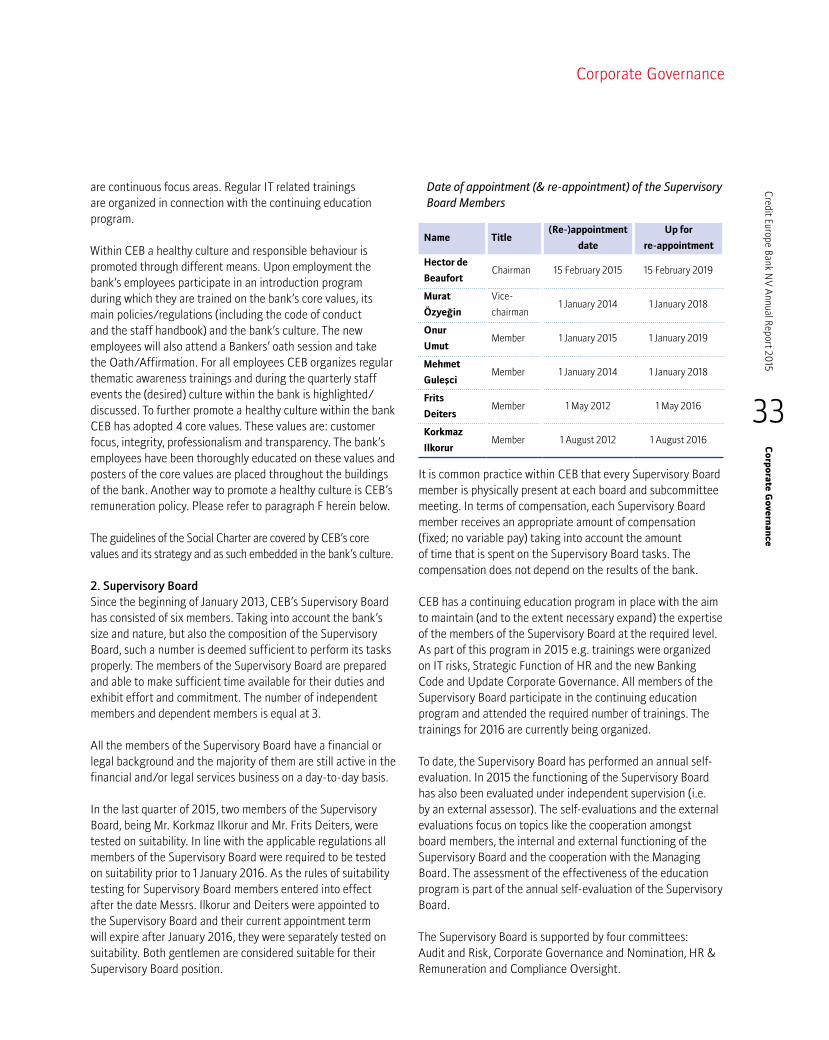
are continuous focus areas. Regular It related trainings are organized in connection with the continuing education program.
Within CeB a healthy culture and responsible behaviour is promoted through different means. upon employment the bank’s employees participate in an introduction program during which they are trained on the bank’s core values, its main policies/regulations (including the code of conduct and the staff handbook) and the bank’s culture. the new employees will also attend a Bankers’ oath session and take the oath/Affirmation. For all employees CeB organizes regular thematic awareness trainings and during the quarterly staff events the (desired) culture within the bank is highlighted/discussed. to further promote a healthy culture within the bank CeB has adopted 4 core values. these values are: customer focus, integrity, professionalism and transparency. the bank’s employees have been thoroughly educated on these values and posters of the core values are placed throughout the buildings of the bank. Another way to promote a healthy culture is CeB’s remuneration policy. please refer to paragraph F herein below.
the guidelines of the Social Charter are covered by CeB’s core values and its strategy and as such embedded in the bank’s culture.
2. Supervisory BoardSince the beginning of January 2013, CeB’s Supervisory Board has consisted of six members. taking into account the bank’s size and nature, but also the composition of the Supervisory Board, such a number is deemed sufficient to perform its tasks properly. the members of the Supervisory Board are prepared and able to make sufficient time available for their duties and exhibit effort and commitment. the number of independent members and dependent members is equal at 3.
All the members of the Supervisory Board have a financial or legal background and the majority of them are still active in the financial and/or legal services business on a day-to-day basis.
In the last quarter of 2015, two members of the Supervisory Board, being Mr. Korkmaz Ilkorur and Mr. Frits Deiters, were tested on suitability. In line with the applicable regulations all members of the Supervisory Board were required to be tested on suitability prior to 1 January 2016. As the rules of suitability testing for Supervisory Board members entered into effect after the date Messrs. Ilkorur and Deiters were appointed to the Supervisory Board and their current appointment term will expire after January 2016, they were separately tested on suitability. Both gentlemen are considered suitable for their Supervisory Board position.
Date of appointment (& re-appointment) of the Supervisory Board Members
Name Title(Re-)appointment
date
Up for
re-appointment
Hector de
BeaufortChairman 15 February 2015 15 February 2019
Murat
Özyeğin
Vice-
chairman1 January 2014 1 January 2018
Onur
UmutMember 1 January 2015 1 January 2019
Mehmet
GuleşciMember 1 January 2014 1 January 2018
Frits
DeitersMember 1 May 2012 1 May 2016
Korkmaz
IlkorurMember 1 August 2012 1 August 2016
It is common practice within CeB that every Supervisory Board member is physically present at each board and subcommittee meeting. In terms of compensation, each Supervisory Board member receives an appropriate amount of compensation (fixed; no variable pay) taking into account the amount of time that is spent on the Supervisory Board tasks. the compensation does not depend on the results of the bank.
CeB has a continuing education program in place with the aim to maintain (and to the extent necessary expand) the expertise of the members of the Supervisory Board at the required level. As part of this program in 2015 e.g. trainings were organized on It risks, Strategic Function of HR and the new Banking Code and update Corporate Governance. All members of the Supervisory Board participate in the continuing education program and attended the required number of trainings. the trainings for 2016 are currently being organized.
to date, the Supervisory Board has performed an annual self-evaluation. In 2015 the functioning of the Supervisory Board has also been evaluated under independent supervision (i.e. by an external assessor). the self-evaluations and the external evaluations focus on topics like the cooperation amongst board members, the internal and external functioning of the Supervisory Board and the cooperation with the Managing Board. the assessment of the effectiveness of the education program is part of the annual self-evaluation of the Supervisory Board.
the Supervisory Board is supported by four committees: Audit and Risk, Corporate Governance and nomination, HR & Remuneration and Compliance oversight.
Corporate Governance
33
Credit Europe Bank N
V Annual Report 20
15C
orporate G
overnan
ce

Each committee is composed as follows:
Committee Members
Audit & RiskFrits Deiters (chairman), Mehmet Guleşci
(vice-chairman), Korkmaz Ilkorur
Corporate Governance &
Nomination
Hector de Beaufort (chairman), Mehmet
Guleşci, Murat Özyeğin
HR & Remunerationonur umut (chairman), Hector de
Beaufort, Murat Özyeğin
Compliance OversightKorkmaz Ilkorur (chairman), Frits Deiters,
onur umut
the members of the Audit & Risk committee meet the specific competence and experience requirements as set out in the Banking Code.
3. Managing BoardSince January 1, 2012, the Managing Board of CeB has had five members. All members have gained thorough expertise and knowledge of banking, of our company, and of the locations in the various countries where the bank is active.
It is the Managing Board’s task to set the business policy and strategy of CeB. on an annual basis, mostly while discussing the consolidated budget, the bank’s business policy is discussed with and validated by the Supervisory Board. this policy also takes into account external developments such as movements in the markets where the bank is active, global financial developments, the general financial situation of the bank, its clients’ interests and other stakeholders’ positions.
Without detriment to the collective responsibility of the Managing Board as a whole, the CRo is responsible for financial and non-financial risk matters within the bank and for preparing the decision-making with regard to risk management. the CRo does not bear any individual commercial responsibility for and operates independently from commercial areas. CeB’s risk management also includes a focus on the impact that systematic risk might have on the bank’s risk profile.
In order to ensure/enhance due balancing of the interests of the bank’s stakeholders several subcommittees and weekly (management) meetings have been formed (such as the Asset & liability Committee, It Steering Committee, Risk Committee). these committees meet on a weekly/monthly basis). Additionally the Managing Board organizes regular General Managers’ meetings for which the General Managers of CeB’s banking subsidiaries are invited. In these General Managers meetings group updates/topics are discussed in areas of risk management, compliance, It etc. the
contributions of these meetings add to the Managing Board’s due balancing of the interests of its clients, business partners, employees, supervisors and shareholders. the Ceo ensures that a continuing education program is in place with the aim to maintain (and to the extent necessary expand) the expertise of the members of the Managing Board at the required level. All members of the Managing Board participate in the continuing education program and attended the required number of trainings. the trainings for 2016 are currently being organized.
4. Risk Management Risk management is at the heart of CeB’s organization, and supported at both the Managing Board and Supervisory Board level. the Supervisory Board (inter alia through its Audit & Risk committee) supervises the risk policy pursued by the Managing Board and the Supervisory Board/the Audit & Risk committee reviews and discusses the risk profile of the bank and the capital allocation and liquidity policy as well as country risks, credit risks, market risks and operational risks taking into account the (approved) risk appetite of the bank. the CRo and the Risk management department are the main sponsors on consolidated level for the bank’s Risk Appetite, ICAAp, IlAAp and other requirements. CeB’s risk appetite statement is discussed and reviewed/approved annually in the relevant Supervisory Board meeting (and also any material interim changes to the risk appetite are subject to the approval of the Supervisory Board). More information on CeB’s Risk Management can be found in note 37 of the Consolidated Financial Statements.
5. Auditthe Internal Audit Department (IAD) within CeB plays an important role in ensuring ever better governance. It represents an independent and objective assurance and consulting function as a third line of defence. through the application of a risk-based methodology, IAD evaluates and examines whether proper measures are taken to ensure ‘control’ in the organization and its activities.
the Group Internal Auditor has a direct reporting line to the Chairman of the Audit & Risk committee (and administratively reports to the CRo).
exchange of information between IAD, the Audit & Risk committee and the external auditor inter alia takes place in the meetings of the Audit & Risk during which e.g. the risk analysis, audit plan and findings are presented and discussed. Also outside these meetings IAD, the members of the Audit & Risk committee and the external auditor have regular contact to share information and discuss and consult on specific topics.
Corporate Governance
34
Cre
dit E
urop
e Ba
nk N
V A
nnua
l Rep
ort 2
015
Cor
por
ate
Gov
ern
ance
Corporate Governance
At least once a year a so-called tripartite meeting between representatives of DnB, CeB’s external auditor and IAD is organized in which the risk analysis, findings and each other’s audit plan are discussed. the last tripartite meeting was held in november 2015.
External AuditorCeB safeguards independency of the external auditor by monitoring and overseeing the external auditor activities. the Audit & Risk Committee half-yearly reviews the reports, audit fees and independence statements of the external auditor. the external auditor, KpMG Accountant n.V., has been appointed as from financial year 2007. As of January 2017 CeB will change its external auditor due to mandatory legislation.
6. RemunerationCeB’s Group Remuneration policy has been updated/revised to comply with national and international regulations (such as the Banking Code, DnB’s regulation on sound remuneration, the Financial Supervision Act and the relevant provisions included in CRDIV). the total income of a member of the Managing Board is -at the time it is set- below the median for comparable positions within and outside the financial industry. Any variable remuneration paid to the Managing Board members is set in accordance with the applicable national and international regulations. For a summary of the remuneration policy in CeB, please revert to paragraph F below.
E. Handling potential conflicts of interests Credit europe Bank has effected a group of procedures suitable for managing potential conflicts of interests. Such arrangements have to be complied with for professional integrity - and transparency reasons. the generic arrangements aim at setting criteria and controls that identify and govern potential conflicts of interest arising from normal personal banking transactions by employees, senior management or members of the Managing and Supervisory Board.
In 2015 no direct, indirect or formal conflicts of interest were identified.
A special category of potentially conflicting situations forms the Bank entering into a transaction with a related party. parties related to Credit europe Bank include all Fiba and Fina Group associated companies, any member of the Managing- or Supervisory Board as well as their close family members and any entities controlled by them.
Related party transactions are settled in the normal course of business and on an arm’s length basis, i.e. under the same
commercial and market terms that apply to non-related parties. the kind of transactions that fall under related party transactions are various: loans, deposits or foreign exchange transactions.
the bank has specific arrangements in place to ensure a proper management of potential conflicts of interests in related party transactions. these arrangements include procedures to identify, authorize and report related party transactions to the Managing Board and the Compliance oversight Committee. In every Compliance oversight Committee meeting, an overview with (approved) related party transactions is presented to review whether the bank acted in conformity with its established procedures and with the required approval process.
on an annual basis, the bank’s Internal Audit department carries out audit procedures to provide reasonable assurance that the bank’s policies and procedures for related party transactions are properly and effectively executed.
F. Remuneration Report
(i) Decision- making process to determine the remunerationBy virtue of CeB’s Group Remuneration policy, the key elements of the governance structure for the fixing, execution and evaluation of the remuneration management are as follows: CeB’s Supervisory Board is responsible for the establishment, execution and evaluation of the Group Remuneration policy and the Supervisory Board monitors the proper implementation of this by the Managing Board. the HR & Remuneration Committee (a subcommittee of the Supervisory Board – described in more detail below) meets at least each quarter and prepares the decision-making process for the Supervisory Board, taking into account the long-term interests of all stakeholders of CeB.
Remuneration of Identified Staff (defined in the Group Remuneration policy and determined as described in the Assessment of Identified Staff procedure) is determined by the Supervisory Board. the remuneration of the other employees is determined and implemented by the Managing Board and supervised by the HR & Remuneration Committee. For senior managers in control functions, remuneration is directly supervised by the HR & Remuneration Committee.
As a general principle, CeB’s Group Remuneration policy authorizes the Supervisory Board to adjust the variable remuneration of (a group of) employees – as defined in such policy, if continuation on the same level would have an unfair and unintended effect.
35
Credit Europe Bank N
V Annual Report 20
15
35
Corp
orate Govern
ance

Moreover, the Supervisory Board has the right to reclaim the variable component of remuneration granted to employees, if it turns out that such a variable was based on inaccurate data.
(ii) Link between performance and payone of the key elements of CeB’s Group Remuneration policy is the description of the appraisal process. In this paragraph, a summary is given of this process:
on the basis of pre-determined and assessable objectives, comprising financial and non-financial elements, and also on the basis of competences and general indicators, an employee’s overall performance assessment is determined, at least once per year. the non-financial objectives form a substantial portion (with a minimum of 50%) of the total set of objectives for an employee.
Objective-settingeach year, the Managing Board formulates its own objectives (financial and non-financial) and presents them for approval to the Supervisory Board. the approved objectives are then assigned (partially) to the relevant Identified Staff and employees. pursuant to the Group Remuneration policy, financial objective-setting for employees in control functions may not be based on the commercial objectives of CeB, i.e. the objectives of these employees are set independent from the financial targets and/or results of the business they control.
Performance assessmentFinancial performance of an employee is assessed in the context of CeB’s financial stability and own funds requirements as well as the long-term interests of the shareholders and other stakeholders.
Financial performance shall be evaluated on the basis of (a) divisional/ departmental profitability, calculated on financial criteria such as net Income and (b) the department’s attribution/claim to the risk profile of CeB.
Via a web-based performance management system, an overall ‘performance score’ is generated. the three performance categories are competences, general indicators and objectives. For the overall score, the following weighted percentages apply per category: competences 30%, general indicators 20% and objectives 50%. the end score is a figure between 1 and 5 – whereby 5 is excellent.
performance evaluation of Identified Staff takes into account performance over several years and appraisals for employees in control functions take into account the ‘countervailing function’ of these staff members.
(iii) Most important characteristics of remuneration systemApart from the governance structure and appraisal process, the CeB Group Remuneration policy also incorporates rules and guidelines for the setting and determination of fixed and variable remuneration for employees.
As a rule in CeB, fixed salary levels are conservatively aligned in comparison to similar functions in banking and the industry, nationally and internationally.
one of the basic principles for granting variable pay (if any at all) is that variable pay may never exceed 100% of the fixed salary, and that guaranteed variable remuneration to Identified Staff is not allowed.
Phantom Share planIn CeB’s phantom Share plan the terms and conditions for the granting of phantom Shares to Identified Staff are laid down. the plan entails that variable remuneration awarded to an Identified Staff will be for 60% unconditional and for 40% deferred. If an Identified Staff member is awarded a total of more than € 300.000 gross (or equivalent), 40% will be unconditional and for 60% deferred. At least 50% of the variable remuneration (deferred or unconditional) is in the form of financial instruments whose value is determined by/ derived from the value of CeB shares: phantom Shares. these financial instruments are rights – not shares.
the deferred part of the variable remuneration vests over a period of 3 years. Furthermore, vested phantom Shares (whether deferred or unconditional) are subject to a retention period of 1 year. Vesting and exercise of the phantom Shares is subject to the fulfilment of certain conditions. For example, the holder’s performance score (see paragraph (ii) above) must exceed a certain limit.
(iv) Most important parameters & motivation for variable remuneration
pursuant to the Group Remuneration policy, the granting of variable remuneration ‘at all’ depends on CeB’s performance in a year. By virtue of the rules, if CeB’s RoAe in any given year is less than 2% or negative, there will be no variable remuneration. Additionally, the requirement applies that the granting of variable remuneration may not restrict CeB’s possibilities to reinforce its regulatory capital, its solvency ratio or its own funds.
CeB has no other non-cash benefits/non-cash variable remuneration elements.
36
Cre
dit E
urop
e Ba
nk N
V A
nnua
l Rep
ort 2
015
Cor
por
ate
Gov
ern
ance
Corporate Governance

Corporate Governance
(v) Aggregate quantitative information on remuneration per business segment
In 2015, CeB paid out € 57,475,965 to employees working in the Wholesale Banking business segment and € 47,177,170 to employees in the Retail Banking segment.
(vi) Aggregate quantitative information on remuneration for Identified Staff and senior managers
CeB has identified 82 Identified Staff members and 111 senior managers.
In 2015, the total amount of remuneration paid out to the Identified Staff and senior managers amounted to € 20,903,041, split into € 13,247,235 for Identified Staff and € 7,655,806 for senior managers. Such total remuneration was split into € 19,821,350 fixed salary (for Identified Staff € 12,469,171 and senior managers € 7,352,179) and € 1,081,691 variable remuneration (for Identified Staff € 778,064 and senior managers € 303,627). please note that the variable remuneration for Identified Staff was split in a deferred and unconditional part (resp. 40% and 60%, or resp. 60% and 40% if awarded a total of more than € 300,000 gross) and awarded in cash or phantom Shares (50/50). A retention period of 1 year applies to the vested phantom Shares.
the total amount of awarded + outstanding deferred remuneration (vested and unvested) in 2015 (for the phantom Shares granted as per 2014) amounts to € 1,881,556.
As part of the CeB’s Group Remuneration policy, variable remuneration packages of all employees are granted based on the (financial and non-financial) performance over the respective reporting year and paid out in the form of cash and/or phantom Share (both unconditional and conditional) in the preceding years. this Remuneration Report refers to the performance year of 2014, with the related bonus payment executed in 2015.
By virtue of the rules in the Group Remuneration policy, in 2015 there will be no ‘less than awarded’ deferred pay-out due to unsatisfactory performance adjustment.
(vii) New severance payment In the reporting year 2015, CeB on a consolidated basis paid severance payments to a total of 21 employees – none of which was an Identified Staff member. For none of them did the severance payment exceed one year's fixed salary – a requirement explicitly included in CeB's Group Remuneration policy. In total, CeB paid € 1,048,798 in severance in 2015. the highest amount granted was € 100,685.
CeB did not pay sign-on or entry awards to any Identified Staff member in 2015.
37
Credit Europe Bank N
V Annual Report 20
15C
orporate G
overnan
ce
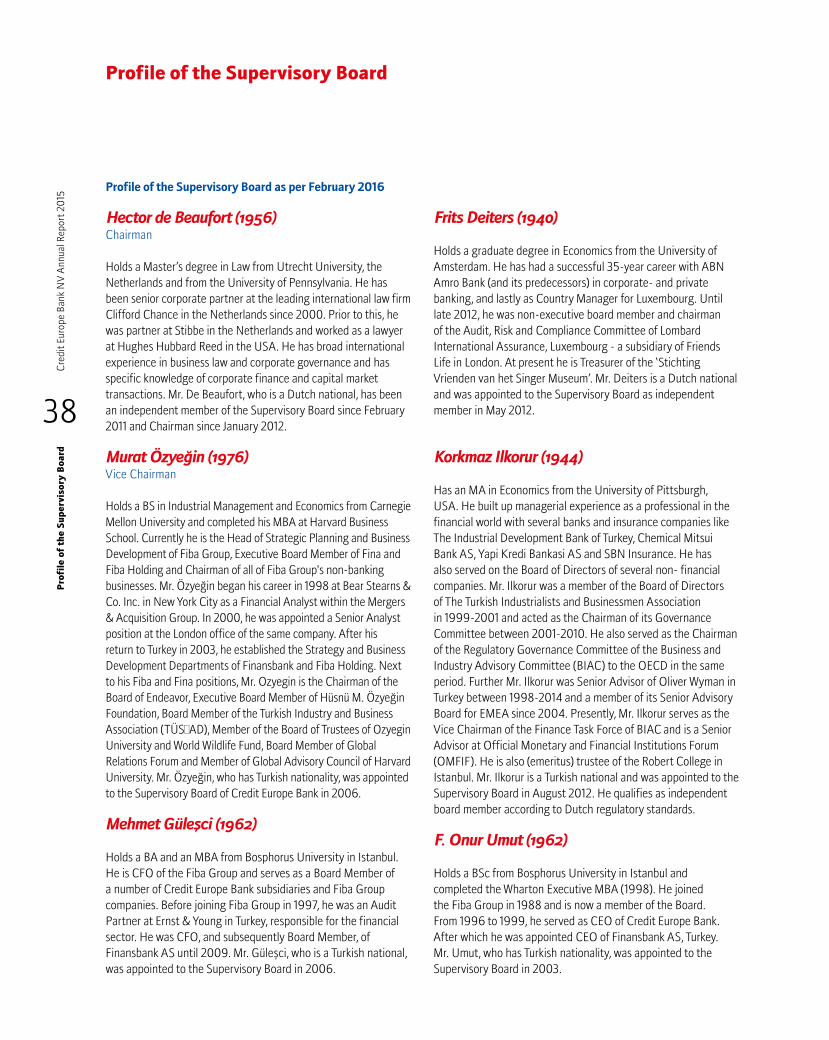
Profile of the Supervisory Board as per February 2016 Hector de Beaufort (1956)Chairman
Holds a Master’s degree in law from utrecht university, the netherlands and from the university of pennsylvania. He has been senior corporate partner at the leading international law firm Clifford Chance in the netherlands since 2000. prior to this, he was partner at Stibbe in the netherlands and worked as a lawyer at Hughes Hubbard Reed in the uSA. He has broad international experience in business law and corporate governance and has specific knowledge of corporate finance and capital market transactions. Mr. De Beaufort, who is a Dutch national, has been an independent member of the Supervisory Board since February 2011 and Chairman since January 2012.
Murat Özyeğin (1976) Vice Chairman
Holds a BS in Industrial Management and economics from Carnegie Mellon university and completed his MBA at Harvard Business School. Currently he is the Head of Strategic planning and Business Development of Fiba Group, executive Board Member of Fina and Fiba Holding and Chairman of all of Fiba Group's non-banking businesses. Mr. Özyeğin began his career in 1998 at Bear Stearns & Co. Inc. in new York City as a Financial Analyst within the Mergers & Acquisition Group. In 2000, he was appointed a Senior Analyst position at the london office of the same company. After his return to turkey in 2003, he established the Strategy and Business Development Departments of Finansbank and Fiba Holding. next to his Fiba and Fina positions, Mr. ozyegin is the Chairman of the Board of Endeavor, Executive Board Member of Hüsnü M. Özyeğin Foundation, Board Member of the turkish Industry and Business Association (TÜSİAD), Member of the Board of Trustees of Ozyegin university and World Wildlife Fund, Board Member of Global Relations Forum and Member of Global Advisory Council of Harvard University. Mr. Özyeğin, who has Turkish nationality, was appointed to the Supervisory Board of Credit europe Bank in 2006.
Mehmet Güleşci (1962)
Holds a BA and an MBA from Bosphorus university in Istanbul. He is CFo of the Fiba Group and serves as a Board Member of a number of Credit europe Bank subsidiaries and Fiba Group companies. Before joining Fiba Group in 1997, he was an Audit partner at ernst & Young in turkey, responsible for the financial sector. He was CFo, and subsequently Board Member, of Finansbank AS until 2009. Mr. Güleşci, who is a Turkish national, was appointed to the Supervisory Board in 2006.
Frits Deiters (1940)
Holds a graduate degree in economics from the university of Amsterdam. He has had a successful 35-year career with ABn Amro Bank (and its predecessors) in corporate- and private banking, and lastly as Country Manager for luxembourg. until late 2012, he was non-executive board member and chairman of the Audit, Risk and Compliance Committee of lombard International Assurance, luxembourg - a subsidiary of Friends life in london. At present he is treasurer of the ‘Stichting Vrienden van het Singer Museum’. Mr. Deiters is a Dutch national and was appointed to the Supervisory Board as independent member in May 2012.
Korkmaz Ilkorur (1944)
Has an MA in economics from the university of pittsburgh, uSA. He built up managerial experience as a professional in the financial world with several banks and insurance companies like the Industrial Development Bank of turkey, Chemical Mitsui Bank AS, Yapi Kredi Bankasi AS and SBn Insurance. He has also served on the Board of Directors of several non- financial companies. Mr. Ilkorur was a member of the Board of Directors of the turkish Industrialists and Businessmen Association in 1999-2001 and acted as the Chairman of its Governance Committee between 2001-2010. He also served as the Chairman of the Regulatory Governance Committee of the Business and Industry Advisory Committee (BIAC) to the oeCD in the same period. Further Mr. Ilkorur was Senior Advisor of oliver Wyman in turkey between 1998-2014 and a member of its Senior Advisory Board for eMeA since 2004. presently, Mr. Ilkorur serves as the Vice Chairman of the Finance task Force of BIAC and is a Senior Advisor at official Monetary and Financial Institutions Forum (oMFIF). He is also (emeritus) trustee of the Robert College in Istanbul. Mr. Ilkorur is a turkish national and was appointed to the Supervisory Board in August 2012. He qualifies as independent board member according to Dutch regulatory standards.
F. Onur Umut (1962)
Holds a BSc from Bosphorus university in Istanbul and completed the Wharton executive MBA (1998). He joined the Fiba Group in 1988 and is now a member of the Board. From 1996 to 1999, he served as Ceo of Credit europe Bank. After which he was appointed Ceo of Finansbank AS, turkey. Mr. umut, who has turkish nationality, was appointed to the Supervisory Board in 2003.
38
Cre
dit E
urop
e Ba
nk N
V A
nnua
l Rep
ort 2
015
Profile of the Supervisory BoardP
rofi
le o
f th
e S
up
ervi
sory
Boa
rd

the Supervisory Board is pleased to inform you that CeB, despite another year of volatile market conditions, has realized a net profit of euR 46.8 million in 2015. the overall operating environment in the financial sector remained challenging, but due to CeB’s solid strategy and diversified business model it managed to realize sound financial results.
Amongst the factors that largely affected the business climate of the financial sector in 2015 in general and CeB’s business in particular are: low commodity prices, sharp drop in the Chinese market and the recent military and political tension between Russia and turkey (as a result of the shooting down of a Russian military fighter aircraft by turkey). these circumstances made that also in 2015 Credit europe Bank put much focus on risk monitoring and preservation of asset quality.
the ever-changing regulatory environment with increasing requirements in the field of risk management, compliance, liquidity/capital management and corporate governance continues to require utmost attention of the Supervisory Board, the Managing Board and its staff in order for CeB to remain fully compliant with the rules and regulations in all countries that CeB operates. the Supervisory Board is pleased to see that the responsibilities are taken with due care and commitment from all persons involved within CeB.
In general 2015 can be considered a good year for Credit europe Bank especially in view of the difficult market conditions and the Supervisory Board wishes to extend its gratitude to all employees working in the CeB group of companies for their continuous loyalty and energy expended in supporting the strength of the group.
Net income allocationthe Supervisory Board has reviewed the Report of the Managing Board and the financial statements for 2015, comprising the balance sheet and profit and loss accounts. the financial statements further include explanatory notes and other information, including the report of the external auditors, KpMG Accountants nV, for the year ending December 31, 2015.
We propose and advise that the General Meeting of Shareholders adopts these financial statements. Furthermore, we propose to add the full amount of net income to the retained earnings (i.e. to pay no dividend to shareholders), thereby discharging the members of the Managing Board from their liability with respect to their management responsibilities and the members of the Supervisory Board with respect to their supervisory responsibilities.
to conclude, we believe CeB is well positioned to face forthcoming challenges and opportunities for 2016. Given the incessant efforts and support of all CeB employees – managed and guided by the Managing Board – the Supervisory Board is convinced that this forms a solid basis to face the year ahead.
Supervisory Board structure and compositionAs at February 2016, the Supervisory Board of CeB consists of six members: Hector de Beaufort (Chairman), Murat Özyeğin (Vice Chairman), Onur Umut, Mehmet Güleşci, Frits Deiters and Korkmaz Ilkorur. All members of the Supervisory Board have a background and experience in banking, legal or finance. Mehmet Güleşci qualifies as financial expert in the meaning of III.3.2 of the Dutch Corporate Governance Code. Hector de Beaufort, chairman of the Supervisory Board, is senior partner with Clifford Chance in Amsterdam, specialized in boardroom counselling and strategic advice and furthermore he focuses on (the legal side of) M&A transactions and corporate finance.
In line with corporate rules in the netherlands, and as set out in CeB’s Articles of Association and in the Charter of the Supervisory Board, the Supervisory Board’s task is to supervise the policy of the Managing Board and the general affairs of the bank, and to support the Managing Board with advice. overall the Supervisory Board is very much involved in the general affairs of the bank and its strategy.
Committeesthe Supervisory Board is supported by four committees: Audit & Risk, Corporate Governance & nomination, HR & Remuneration and Compliance oversight. All Supervisory Board members have a standing invitation to attend the sub-committee meetings of which they are not a member.
the main objective of each committee is as follows:
Audit & Risk: advises the Supervisory Board on, and supervises the status of and developments in the bank’s risk management system, internal control systems, including the internal audit function and compliance-related issues. the committee monitors the financial reporting process, oversees the accounting policies and practices and ensures that CeB maintains an adequate internal control system and processes. this includes the activities of the risk management function and internal audit function. the Committee also performs a review of CeB’s financial statements and the reports of the external auditor. Moreover, it discusses the relationship with the external auditor, including his independence, remuneration and other permitted services executed for the bank.
3939
Credit Europe Bank N
V Annual Report 20
15R
eport of th
e Su
pervisory B
oard
Report of the Supervisory Board

Report of the Supervisory Board
In 2015 the following Supervisory Board members were members of this subcommittee: Frits Deiters (Chairman), Mehmet Güleşci (Vice Chairman) and Korkmaz Ilkorur.
Corporate Governance & Nomination: advises the Supervisory Board on corporate governance developments, reviews the implementation of corporate governance principles and practices within CeB and advises on adjustments. It is also responsible for nominations, which involves establishing and advising on the selection criteria, profile and nomination process for new Supervisory and Managing Board members.
the following Supervisory Board members formed the Corporate Governance & nomination Committee in 2015: Hector de Beaufort (Chairman), Murat Özyeğin and Mehmet Güleşci.
HR & Remuneration: acts as advisor of the Supervisory Board in all areas of HR and remuneration in general and pertaining to the Managing Board/Identified Staff. Further it proposes a policy and a structure relating to performance evaluation and target-setting for a certain level of senior employees of CeB and its subsidiaries, and oversees the implementation of relevant policies for the Supervisory Board. Also the committee is engaged in succession planning.
Members of the HR & Remuneration Committee in 2015 were: Onur Umut (Chairman), Murat Özyeğin and Hector de Beaufort.
Compliance Oversight: assists the Supervisory Board in overseeing the bank’s overall compliance framework that is designed, in light of applicable local and international legal and regulatory requirements, to respond to the various compliance and regulatory risks the bank is exposed to. It keeps the Supervisory Board informed and updated on developments and/or best practices in compliance and reviews these developments and/or best practices for applicability to CeB. It further reviews the implementation and maintenance of CeB’s compliance principles and Compliance program and advises on adjustments.
In 2015, this committee consisted of the following Supervisory Board members: Korkmaz Ilkorur (Chairman), Frits Deiters and onur umut. Supervisory Board meetingsIn 2015 the Supervisory Board had four meetings in accordance with pre-determined schedules. In addition several other meetings were held on specific times when certain
situations were to be discussed. the latter meetings were mostly held in the form of a video conference meeting. the meeting in December 2015 coincided with a global budget meeting.
the majority of the meetings were attended by all Supervisory Board members. As a rule, the Managing Board is always present at Supervisory Board meetings, with the exception of the ‘executive session’, in which the Supervisory Board discusses its own functioning as a whole, its culture and its relationship with the Managing Board.
Recurring topics in all Supervisory Board meetings are risk management and risk monitoring, capital adequacy, It management, developments in the retail and corporate banking business, in treasury and in liquidity management and updates on (regulatory) corporate governance guidelines. not only in collective meetings are these topics (and other relevant topics) discussed; also in various informal contacts between and with Supervisory Board members and (individual) members of the Managing Board and/or their direct reports, the developments in these areas are discussed or further explored. these contacts contribute to the Supervisory Board’s engaging role and to the enhancing of the quality of the Board’s supervisory responsibility.
Audit & Risk Committeethis committee met seven times in 2015 (of which four were (standard) quarterly meetings and three meetings concerned discussions on specific topics). Representatives of the bank’s external auditor, the Managing Board and the Division Directors of the Internal Audit and Risk Management departments joined the quarterly meetings. In addition the meetings were also regularly attended by other Supervisory Board members who have a standing invitation to join the meeting. Key topics were financial performance, risk management developments and the risk profile of the bank, global internal audit activities and reports of the external auditor. this includes the review of the bank’s (interim) financial statements, Internal Capital Adequacy Assessment process (ICAAp), the Internal liquidity Adequacy Assessment process (IlAAp), CeB’s risk appetite policy and periodical reporting on Information Security and operational Risks. Specific topics discussed were the self-evaluation of the functioning of the ARC, performance of the internal audit function and an internal audit report performed at request of the ARC on a customer complaint. each meeting the risk management function and internal audit function reported about the functioning of the internal control system and processes. the internal audit plan has been discussed and
40
Cre
dit E
urop
e Ba
nk N
V A
nnua
l Rep
ort 2
015
Rep
ort
of t
he
Su
per
viso
ry B
oard

Report of the Supervisory Board
approved and related charters, policies and procedures are being reviewed on a cycle basis. the Committee took notice of the key audit reports, findings and recommendations of the internal audit function and related follow-up activities. the Committee made sure that there is an open communication between the internal audit function and the Board and its committees, management, external auditor and supervisor. Furthermore, a closed meeting has been held with the external auditor.
Corporate Governance & Nomination Committeethis committee met four times in 2015. In addition to the recurring agenda-items (such as a review of the key decisions of CeB’s subsidiaries and the key correspondence between CeB’s subsidiaries and their local supervisors) several (other) key topics have been dealt with. these include amongst others the implementation of the set of documents titled ‘Future oriented Banking’, the revision of the Charter of the Supervisory Board and the Managing Board, the reappointment of one supervisory board member and the suitability testing of two supervisory board members and the external assessment of the Supervisory Board. the Ceo and CRo were present at all committee meetings.
HR & Remuneration CommitteeIn 2015, this committee met four times. Focus during the meetings was on the Group’s HR reports, CeB’s talent management programme, redefining of the HR function and the implementation of the Dutch Financial undertakings (Remuneration policy) Act. the Ceo and CFo participated in all meetings.
Compliance Oversight Committeethis committee met four times in 2015 and was joined during these meetings by the Chief executive officer, the Chief Risk officer and the Division Director Compliance. During the meetings, the focus was on the work undertaken as outlined in the bank’s Compliance program, the status of compliance topics at group level – in particular, the areas of anti-money laundering and sanctions compliance – presented through the Compliance Dashboard, the reporting on related party transactions, the implementation of FAtCA rules and systematic integrity risk analysis. In addition, the committee members received trainings on specific compliance topics.
Amsterdam, March 11, 2016
Hector de Beaufort, Chairman Murat Özyeğin Frits Deiters Mehmet Güleşci Korkmaz Ilkorur F. onur umut
41
Credit Europe Bank N
V Annual Report 20
15R
eport of th
e Su
pervisory B
oard

TransparencyTransparency is a key business best practice in our products and services,
accounting standards or management decision-making.
44
Cre
dit E
urop
e Ba
nk N
V A
nnua
l Rep
ort 2
015
Con
soli
dat
ed S
tate
men
t o
f F
inan
cial
Po
siti
on
Consolidated Statement of Financial PositionAs of December 31, 2015
In thousands of EURO unless otherwise indicated
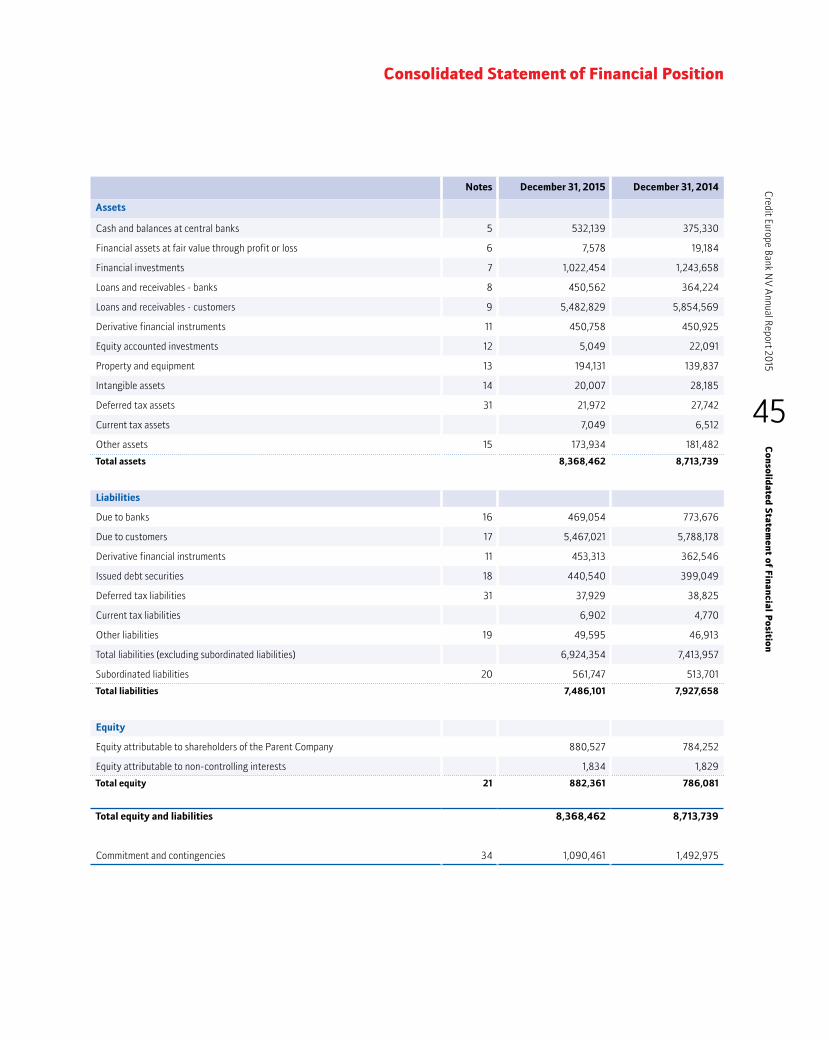
45
Credit Europe Bank N
V Annual Report 20
15C
onsolid
ated S
tatemen
t of F
inan
cial Po
sition
Consolidated Statement of Financial Position
Notes December 31, 2015 December 31, 2014
Assets
Cash and balances at central banks 5 532,139 375,330
Financial assets at fair value through profit or loss 6 7,578 19,184
Financial investments 7 1,022,454 1,243,658
Loans and receivables - banks 8 450,562 364,224
Loans and receivables - customers 9 5,482,829 5,854,569
Derivative financial instruments 11 450,758 450,925
Equity accounted investments 12 5,049 22,091
Property and equipment 13 194,131 139,837
Intangible assets 14 20,007 28,185
Deferred tax assets 31 21,972 27,742
Current tax assets 7,049 6,512
Other assets 15 173,934 181,482
Total assets 8,368,462 8,713,739
Liabilities
Due to banks 16 469,054 773,676
Due to customers 17 5,467,021 5,788,178
Derivative financial instruments 11 453,313 362,546
Issued debt securities 18 440,540 399,049
Deferred tax liabilities 31 37,929 38,825
Current tax liabilities 6,902 4,770
Other liabilities 19 49,595 46,913
Total liabilities (excluding subordinated liabilities) 6,924,354 7,413,957
Subordinated liabilities 20 561,747 513,701
Total liabilities 7,486,101 7,927,658
Equity
Equity attributable to shareholders of the Parent Company 880,527 784,252
Equity attributable to non-controlling interests 1,834 1,829
Total equity 21 882,361 786,081
Total equity and liabilities 8,368,462 8,713,739
Commitment and contingencies 34 1,090,461 1,492,975
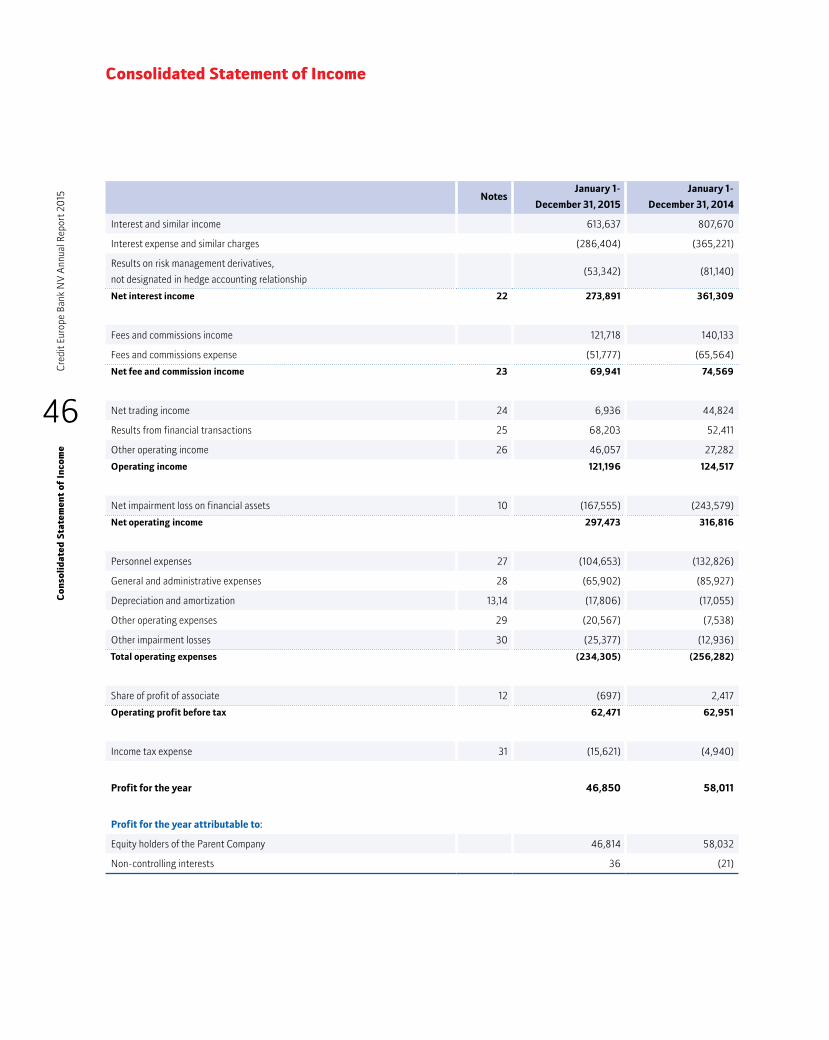
46
Cre
dit E
urop
e Ba
nk N
V A
nnua
l Rep
ort 2
015
Con
soli
dat
ed S
tate
men
t of
In
com
e
Consolidated Statement of Income
NotesJanuary 1-
December 31, 2015
January 1-
December 31, 2014
Interest and similar income 613,637 807,670
Interest expense and similar charges (286,404) (365,221)
Results on risk management derivatives,
not designated in hedge accounting relationship (53,342) (81,140)
Net interest income 22 273,891 361,309
Fees and commissions income 121,718 140,133
Fees and commissions expense (51,777) (65,564)
Net fee and commission income 23 69,941 74,569
Net trading income 24 6,936 44,824
Results from financial transactions 25 68,203 52,411
Other operating income 26 46,057 27,282
Operating income 121,196 124,517
Net impairment loss on financial assets 10 (167,555) (243,579)
Net operating income 297,473 316,816
Personnel expenses 27 (104,653) (132,826)
General and administrative expenses 28 (65,902) (85,927)
Depreciation and amortization 13,14 (17,806) (17,055)
Other operating expenses 29 (20,567) (7,538)
Other impairment losses 30 (25,377) (12,936)
Total operating expenses (234,305) (256,282)
Share of profit of associate 12 (697) 2,417
Operating profit before tax 62,471 62,951
Income tax expense 31 (15,621) (4,940)
Profit for the year 46,850 58,011
Profit for the year attributable to:
Equity holders of the Parent Company 46,814 58,032
Non-controlling interests 36 (21)

47
Credit Europe Bank N
V Annual Report 20
15C
onsolid
ated S
tatemen
t of Com
preh
ensive In
come
Consolidated Statement of Comprehensive Income
January 1-
December 31, 2015
January 1-
December 31, 2014
Profit for the year 46,850 58,011
Items that are or may be reclassified to the statement of income:
Change in translation reserve (11,701) (183,247)
Change in fair value reserve 12,905 18,933
Change in net investment hedge reserve (43,466) 150,454
Change in cash flow hedge reserve 819 (481)
Items that will never be reclassified to the statement of income:
Change in tangible assets revaluation reserve (23) 61
Other comprehensive income for the year (41,466) (14,280)
Total comprehensive income for the year 5,384 43,731
January 1-
December 31, 2015
January 1-
December 31, 2014
Total comprehensive income attributable to:
Equity holders of the Parent Company 5,379 43,758
Non-controlling interests 5 (27)
Total comprehensive income 5,384 43,731

48
Cre
dit E
urop
e Ba
nk N
V A
nnua
l Rep
ort 2
015
Con
soli
dat
ed S
tate
men
t of
Ch
ang
es in
Equ
ity
Attributable to equity holders of the Parent Company
Issued capital
Share premium
Retained earnings
Fair value reserve
Net in-vestment
hedge reserve
Cash flow hedge
reserve
Transla-tion
reserveTotal
Non-con-trolling interest
Total equity
At January 1, 2015 429,500 266,712 406,757 (12,716) 11,472 (173) (317,300) 784,252 1,829 786,081
Total comprehensive income
Change in fair value reserve - - - 12,917 - - - 12,917 (12) 12,905
Change in translation reserve - - - - - - (11,682) (11,682) (19) (11,701)
Change in net investment hedge reserve - - - - (43,466) - - (43,466) - (43,466)
Change in cash flow hedge reserve - - - - - 819 - 819 - 819
Change in tangible assets revaluation reserve - - (23) - - - - (23) - (23)
Profit for the year - - 46,814 - - - - 46,814 36 46,850
Total comprehensive income - - 46,791 12,917 (43,466) 819 (11,682) 5,379 5 5,384
Transactions with owners of the Bank
Increase in share capital 100,000 - - - - - - 100,000 - 100,000
Transfer from share premium 102,964 (102,964) - - - - - - - -
Equity decrease resulting from business combinations - - (9,104) - - - - (9,104) - (9,104)
At December 31, 2015 632,464 163,748 444,444 201 (31,994) 646 (328,982) 880,527 1,834 882,361
Attributable to equity holders of the Parent Company
Issued capital
Share premium
Retained earnings
Fair value reserve
Net in-vestment
hedge reserve
Cash flow hedge
reserve
Transla-tion
reserveTotal
Non-con-trolling interest
Total equity
At January 1, 2014 429,500 163,748 348,664 (31,649) (138,982) 343 (134,094) 637,530 3,742 641,272
Total comprehensive income
Change in fair value reserve - - - 18,933 - - - 18,933 - 18,933
Change in translation reserve - - - - - - (183,206) (183,206) (41) (183,247)
Change in net investment hedge reserve - - - - 150,454 - - 150,454 - 150,454
Change in cash flow hedge reserve - - - - - (516) - (516) 35 (481)
Change in tangible assets revaluation reserve - - 61 - - - - 61 - 61
Profit for the year - - 58,032 - - - - 58,032 (21) 58,011
Total comprehensive income - - 58,093 18,933 150,454 (516) (183,206) 43,758 (27) 43,731
Transactions with owners of the Bank
Conversion of debt to equity - 102,964 - - - - - 102,964 - 102,964
Acquisition of the non-controlling interest without change in control
- - - - - - - - (1,886) (1,886)
At December 31, 2014 429,500 266,712 406,757 (12,716) 11,472 (173) (317,300) 784,252 1,829 786,081
Consolidated Statement of Changes in Equity
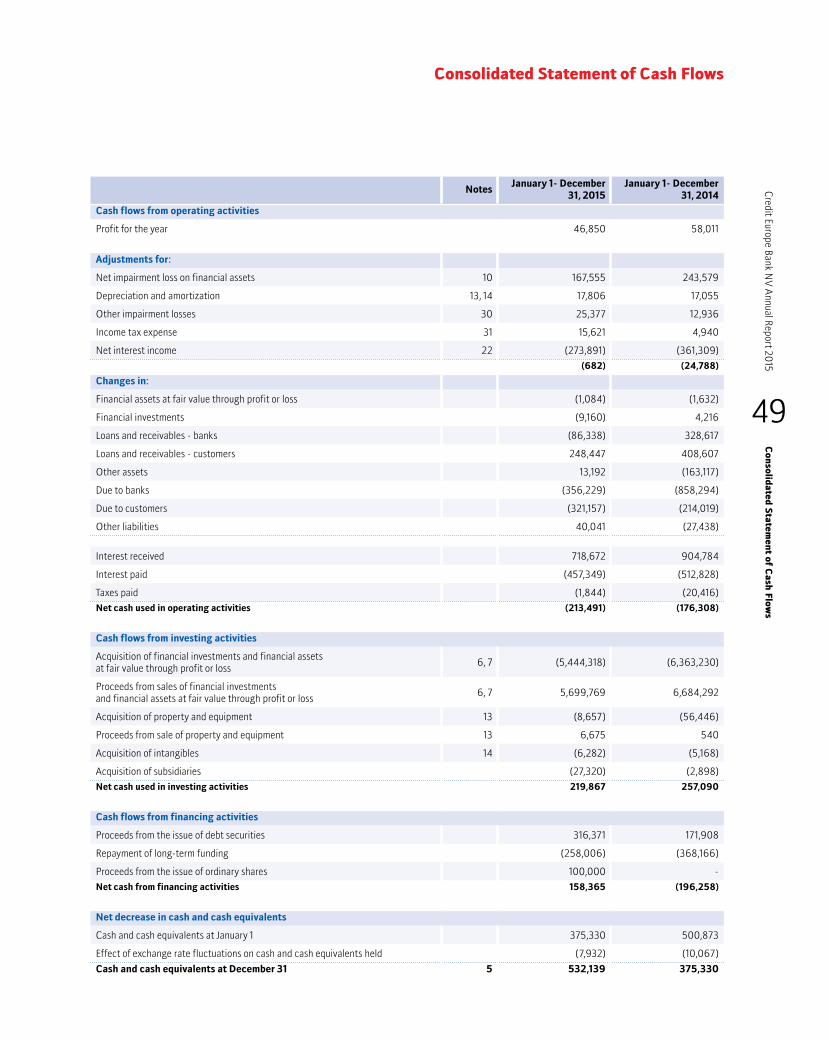
49
Credit Europe Bank N
V Annual Report 20
15C
onsolid
ated S
tatemen
t of Cash
Flows
Consolidated Statement of Cash Flows
NotesJanuary 1- December
31, 2015January 1- December
31, 2014
Cash flows from operating activities
Profit for the year 46,850 58,011
Adjustments for:
Net impairment loss on financial assets 10 167,555 243,579
Depreciation and amortization 13, 14 17,806 17,055
Other impairment losses 30 25,377 12,936
Income tax expense 31 15,621 4,940
Net interest income 22 (273,891) (361,309)
(682) (24,788)
Changes in:
Financial assets at fair value through profit or loss (1,084) (1,632)
Financial investments (9,160) 4,216
Loans and receivables - banks (86,338) 328,617
Loans and receivables - customers 248,447 408,607
Other assets 13,192 (163,117)
Due to banks (356,229) (858,294)
Due to customers (321,157) (214,019)
Other liabilities 40,041 (27,438)
Interest received 718,672 904,784
Interest paid (457,349) (512,828)
Taxes paid (1,844) (20,416)
Net cash used in operating activities (213,491) (176,308)
Cash flows from investing activities
Acquisition of financial investments and financial assets at fair value through profit or loss 6, 7 (5,444,318) (6,363,230)
Proceeds from sales of financial investments and financial assets at fair value through profit or loss 6, 7 5,699,769 6,684,292
Acquisition of property and equipment 13 (8,657) (56,446)
Proceeds from sale of property and equipment 13 6,675 540
Acquisition of intangibles 14 (6,282) (5,168)
Acquisition of subsidiaries (27,320) (2,898)
Net cash used in investing activities 219,867 257,090
Cash flows from financing activities
Proceeds from the issue of debt securities 316,371 171,908
Repayment of long-term funding (258,006) (368,166)
Proceeds from the issue of ordinary shares 100,000 -
Net cash from financing activities 158,365 (196,258)
Net decrease in cash and cash equivalents
Cash and cash equivalents at January 1 375,330 500,873
Effect of exchange rate fluctuations on cash and cash equivalents held (7,932) (10,067)
Cash and cash equivalents at December 31 5 532,139 375,330

50
Cre
dit E
urop
e Ba
nk N
V A
nnua
l Rep
ort 2
015
No
tes
to C
onso
lid
ated
Fin
anci
al S
tate
men
ts
Notes to Consolidated Financial Statements
1. Corporate information
GeneralCredit Europe Bank N.V., herein after ‘the Bank’, is domiciled in Amsterdam, the Netherlands. Credit Europe Bank N.V. comprises four branches in the Netherlands, Germany, Belgium and Malta. The Consolidated Financial Statements of the Bank as of December 31, 2015, comprise the figures of the Bank, its subsidiaries and other controlled entities. Together they are referred to as the ‘Bank’.
The Bank was founded as a specialized trade-finance bank, which aimed to actively participate in the wholesale financing of international trade. In later years, the Bank started retail-banking activities, including savings accounts, mortgage loans, consumer loans and credit cards.
The Bank’s registered office is Karspeldreef 6A, 1101 CJ Amsterdam, Netherlands.
Changes to the GroupIn March 2015, Credit Europe Bank Ltd (Russia), the Bank’s direct subsidiary, entered into the stake purchase agreement with the company which is under common control of the ultimate controlling party of the Bank for acquisition of 100% of the share capital of LLC Autopartners for EUR 13,357 thousand.
In December 2015, Yenikoy Enterprises B.V., the Bank’s direct subsidiary, entered into the share purchase agreement with the third party for acquisition of remaining 50% of the share capital of Armada Gemi Insaa Teknolojisi Sanayi ve Ticaret A.S., a joint venture entity in which it previously held %50 ownership.
More information can be found in note 38.
51
Credit Europe Bank N
V Annual Report 20
15N
otes to con
solidated
finan
cial statemen
ts
Notes to consolidated financial statements
2. Basis of preparation
a) Statement of complianceThe Consolidated Financial Statements of Credit Europe Bank N.V. and all its subsidiaries are prepared in accordance with International Financial Reporting Standards (IFRS), as adopted by the European Union (EU), and have been approved by the Managing Board and the Supervisory Board on March 11, 2016.
b) Basis of measurementThe Consolidated Financial Statements have been prepared on the historical-cost basis, except for ‘financial investments’, ‘derivative financial instruments’, ‘assets held for sale’, ‘investment properties’ and ‘financial assets (and liabilities) designated at fair value through profit or loss’, which are measured at fair value. The amortized costs of financial assets and liabilities designated as hedged items in qualifying fair value hedge relationships are adjusted for changes in fair value attributable to the risk being hedged.
c) Functional and presentation currencyThese Consolidated Financial Statements are presented in Euros, which is the Bank’s functional currency. Financial information presented in Euros has been rounded to the nearest thousands, except where indicated.
d) Use of estimates and judgmentsThe preparation of Consolidated Financial Statements in conformity with IFRS requires the Bank’s management to make judgments, estimates and assumptions that affect the application of policies, and the reported amounts of assets and liabilities, income and expenses. The estimates and associated assumptions are based on historical experience and various other factors that are believed to be reasonable under the circumstances, the results of which form the basis of judgments about the carrying values of assets and liabilities that are not readily apparent from other sources. Actual results may differ from these estimates.
The estimates and underlying assumptions are reviewed on an ongoing basis. Revisions to accounting estimates are recognized in the period in which the estimate is revised if the revision affects only that period or in the period of the revision and future periods if the revision affects both current and future periods.
The most significant use of judgments and estimates are as follows:
(a) Judgmentsi. Determination of control over investee
Management applies its judgment to determine whether the control indicators set out in ‘Significant Accounting Policies’ indicate that the Bank controls an entity.
ii. Fair value of financial instrumentsFair value is the amount for which an asset could be exchanged, or a liability settled, between knowledgeable, willing parties in an arm’s length transaction on the measurement date. Where the fair values of financial assets and financial liabilities recorded on the statement of financial position cannot be derived from active markets, they are determined using a variety of valuation techniques that include the use of mathematical models. The input to these models is taken from observable markets where possible, but where this is not feasible, a degree of judgment is required in establishing fair values. The chosen valuation technique makes maximum use of market input and relies as little as possible on estimates specific to the Bank. iii. Impairment losses on loans and receivables The Bank evaluates the assets, which are accounted for at amortized cost, for impairment. The individual component of the total allowance for impairment applies to financial assets evaluated individually for impairment and is based on management’s best estimate of the present value of the cash flows that are expected to be received. In estimating these cash flows, management makes judgments about a debtor’s financial institution and the net realizable value of any underlying collateral. Each impaired asset is assessed on its merits, and the workout strategy and estimate of cash flows considered recoverable are independently approved by the Corporate Credit Committee.
In assessing the need for collective loss allowance, management considers factors such as credit quality, portfolio size, concentrations and economic factors. To estimate the required allowance, assumptions are made to define how inherent losses are modelled and to determine the required input parameters, based on historical experience and current economic conditions. The accuracy of the allowance depends on the model assumptions and parameters used in determining the collective allowance.
iv. Deferred tax assetsDeferred tax assets are recognised for unused tax losses, unused tax credits and deductible temporary differences to the extent that is probable that taxable profit will be available against which the losses can be utilized. Significant management judgment is required to determine the amount of deferred tax assets that can be recognized, based on the likely
52
Cre
dit E
urop
e Ba
nk N
V A
nnua
l Rep
ort 2
015
No
tes
to C
onso
lid
ated
Fin
anci
al S
tate
men
ts
Notes to Consolidated Financial Statements
timing and level of future taxable profits together with future tax-planning strategies.
(b) Assumptions and estimation uncertainties
Impairment of loans and receivablesThe collective allowance for groups of homogenous loans is established using statistical methods such as roll rate methodology or, for small portfolios with insufficient information, a formula approach based on historical loss rate experience. The roll rate methodology uses statistical analysis of historical data on delinquency to estimate the amount of loss. Management applies judgment to ensure that the estimate of loss arrived on the basis of historical information is appropriately adjusted to reflect the economic conditions and product mix at the reporting date. Roll rates and loss rates are regularly benchmarked against actual loss experience.
3. Significant accounting policies
The accounting policies set out below have been applied consistently to all periods presented in these Consolidated Financial Statements, and have been applied consistently throughout the Bank.
a) Basis of consolidationBusiness combinationsBusiness combinations are accounted for using the acquisition method when control is transferred to the Bank. The consideration transferred in the acquisition is generally measured at fair value, as are the identifiable net assets acquired. Any goodwill that arises is tested annually for impairment. Any gain on a bargain purchase is recognised in profit or loss immediately. Transaction costs are expensed as incurred, except if they are related to the issue of debt or equity securities.
The consideration transferred does not include amounts related to the settlement of pre-existing relationships. Such amounts are generally recognised in profit or loss.
Any contingent consideration is measured at fair value at the date of acquisition. If an obligation to pay contingent consideration that meets the definition of a financial instrument is classified as equity, then it is not remeasured and settlement is accounted for within equity. Otherwise, subsequent changes in the fair value of the contingent consideration are recognised in profit or loss.
If share-based payment awards (replacement awards) are required to be exchanged for awards held by the acquiree's
employees (acquiree's awards) and relate to past services, then all or a portion of the amount of the acquirer's replacement awards is included in measuring the consideration transferred in the business combination. This determination is based on the market-based value of the replacement awards compared with the market-based value of the acquiree's awards and the extent to which the replacement awards relate to pre-combination service.
Non-controlling interestsNCI are measured at their proportionate share of the acquiree's identifiable net assets at the date of acquisition.
Changes in the Bank's interest in a subsidiary that do not result in a loss of control are accounted for as equity transactions.
SubsidiariesSubsidiaries are investees controlled by the Bank. The Bank controls an investee if it is exposed to, or has rights to, variable returns from its involvement with the investee and has the ability to affect those returns through its power over the investee. The Bank reassesses whether it has control if there are changes to one or more of the elements of control. This includes circumstances in which protective rights held (e.g. those resulting from a lending relationship) become substantive and lead to the Bank having power over an investee.
The financial statements of subsidiaries are included into the consolidated financial statements from the date on which control commences until the date when control ceases.
Loss of controlWhen the Bank loses control over a subsidiary, it derecognises the assets and liabilities of the subsidiary and any related NCI and other components of equity. Any resulting gain or loss is recognised in profit or loss. Any interest retained in the former subsidiary is measured at fair value when control is lost.
Investments in associates and jointly controlled entities (equity-accounted investments)Associates are those entities in which the Bank has significant influence, but not control, over the financial and operating policies. Significant influence is presumed to exist when the Bank holds between 20 and 50 percent of the voting power of another entity. Joint ventures are those entities over whose activities the Bank has joint control, established by contractual agreement and requiring unanimous consent for strategic financial and operational decisions. Investments in associates and jointly controlled entities are accounted for using the equity method (equity-accounted investments) and are

53
Credit Europe Bank N
V Annual Report 20
15N
otes to con
solidated
finan
cial statemen
ts
Notes to consolidated financial statements
recognized initially at cost. The cost of the investment includes transaction costs.
The consolidated financial statements include the Bank’s share of the profit or loss and other comprehensive income, after adjustments to align the accounting policies with those of the Bank, from the date that significant influence or joint control commences until the date that significant influence or joint control ceases. When the Bank’s share of losses exceeds its interest in an equity-accounted investment, the carrying amount of that interest, including any long-term investments, is reduced to zero, and the recognition of further losses is discontinued except to the extent that the Bank has an obligation or has made payments on behalf of the investee.
Transactions eliminated on consolidationIntra-group balances and transactions, and any unrealised income and expenses (except for foreign currency transaction gains or losses) arising from intra-group transactions are eliminated in preparing the consolidated financial statements. Unrealised losses are eliminated in the same way as unrealised gains, but only to the extent that there is no evidence of impairment. b) Foreign currency translationTransaction and balancesTransactions in foreign currencies are translated to the respective functional currencies of the Bank entities at the spot exchange rates at the dates of the transactions. Monetary assets and liabilities denominated in foreign currencies at the reporting date are translated to the functional currency at the exchange rate at that date. The foreign currency gain or loss on monetary items is the difference between amortised cost in the functional currency at the beginning of the year, adjusted for effective interest and payments during the year, and the amortised cost in foreign currency translated at the exchange rate at the end of the year.
Non-monetary assets and liabilities that are measured at fair value in a foreign currency are translated to the functional currency at the spot exchange rate at the date on which the fair value was determined. Non-monetary items that are measured based on historical cost in a foreign currency are translated using the spot exchange rate at the date of the transaction.
Foreign currency differences arising on translation are generally recognized in profit or loss. However, foreign currency differences arising from the translation of the following items are recognized in other comprehensive income:
• available-for-sale equity investments (except on impairment in which case foreign currency differences that have been recognized in other comprehensive income are reclassified to profit or loss);
• a financial liability designated as a hedge of the net investment in a foreign operation to the extent that the hedge is effective; or
• qualifying cash flow hedges to the extent the hedge is effective.
Translation differences in the income statement accounts are included in ‘net trading income’. Translation differences related to the disposal of available-for-sale securities are considered an inherent part of the capital gains or losses recognized in ‘results from financial transactions’.
Foreign operationsThe assets and liabilities of foreign operations, including goodwill and fair value adjustments arising on acquisition, are translated into euro at spot exchange rates at the reporting date. The income and expenses of foreign operations are translated into euro at average exchange rates of the year.
Foreign currency differences are recognized in other comprehensive income, and presented in the foreign currency translation reserve (translation reserve) in equity. However, if the foreign operation is a non-wholly owned subsidiary, then the relevant proportion of the translation difference is allocated to non-controlling interests. When a foreign operation is disposed of such that control, significant influence or joint control is lost, the cumulative amount in the translation reserve related to that foreign operation is reclassified to the income statement as part of the gain or loss on disposal.
When the Bank disposes of only part of its interest in a subsidiary that includes a foreign operation while retaining control, the relevant proportion of the cumulative amount is reattributed to non-controlling interests. When the Bank disposes of only part of its investment in an associate or joint venture that includes a foreign operation while retaining significant influence or joint control, the relevant proportion of the cumulative amount is reclassified to the income statement.
When the settlement of a monetary item receivable from or payable to a foreign operation is neither planned nor likely in the foreseeable future, foreign currency differences arising from such item are considered to form part of the net investment in the foreign operation and are recognized in other comprehensive income, and presented in the translation reserve in equity.
54
Cre
dit E
urop
e Ba
nk N
V A
nnua
l Rep
ort 2
015
No
tes
to C
onso
lid
ated
Fin
anci
al S
tate
men
ts
Notes to Consolidated Financial Statements
Hedge of a net investment in a foreign operationRefer to note j.
c) Financial assets and liabilities RecognitionThe Bank initially recognizes financial assets and liabilities on the date that they are originated. All other financial instruments (including regular way purchases and sales of financial assets) are recognized on the trade date, which is the Bank becomes a party to the contractual provisions of the instrument. Forward purchases and sales other than those requiring delivery within the timeframe established by regulation or market convention are recognized as forward transactions until settlement.
A financial asset or financial liability is measured initially at fair value plus, for an item not classified at ‘fair value through profit or loss’, transaction costs that are directly attributable to its acquisition or issue.
ClassificationsFinancial assetsThe Bank classifies its financial assets in one of the following categories:• Loans and receivables• Held to maturity• Available for sale• At fair value through profit or loss and within the category as: - Held for trading - Designated at fair value through profit and loss.Financial liabilitiesThe Bank classifies its financial liabilities, other than financial guarantees and loan commitments, as measured at amortised cost or fair value through profit and loss.
Derecognition
Financial assetsThe Bank derecognizes a financial asset (or, where applicable, a part of a financial asset or part of a group of similar financial assets) when:
• the contractual rights to the cash flows from the financial asset expire;
• the Bank retains the contractual rights to receive cash flows of the financial asset, but assumes a contractual obligation (‘pass-through’ arrangement) to pay the cash flows in full without material delay to a third party; or
• it transfers the rights to receive the contractual cash flows in a transaction in which substantially all the risks and rewards
of ownership of the financial asset are transferred or in which the Bank neither transfers nor retains substantially all the risks and rewards of ownership and it does not retain control of the financial asset.
Any interest in transferred financial assets that qualify for derecognition that is created or retained by the Bank is recognized as a separate asset or liability. On derecognition of a financial asset, the difference between the carrying amount of the asset (or the carrying amount allocated to the portion of the asset transferred), and the sum of (i) the consideration received (including any new asset obtained less any new liability assumed) and (ii) any cumulative gain or loss that had been recognized in other comprehensive income is recognized in the income statement.
The Bank enters into transactions whereby it transfers assets recognized on its balance sheet, but retains either all or substantially all of the risks and rewards of the transferred asset, or a portion of them. If all or substantially all risks and rewards are retained, then the transferred assets are not derecognized from the balance sheet. Transfers of assets with retention of all risks and rewards include, for example, securities lending and repurchase transactions.
In transactions in which the Bank neither retains nor transfers substantially all the risks and rewards of ownership of a financial asset and it retains control over the asset, the Bank continues to recognize the asset to the extent of its continuing involvement, determined by the extent to which it is exposed to changes in the value of the transferred asset. Continuing involvement that takes the form of a guarantee over the transferred asset is measured at the lower of the original carrying amount of the asset and the maximum amount of the consideration that the Bank could be required to repay.
In certain transactions the Bank retains the obligation to service the transferred financial asset for a fee. The transferred asset is derecognized if it meets the derecognition criteria. An asset or liability is recognized for the servicing contract, depending on whether the servicing fee is more than adequate (asset) or is less than adequate (liability) for performing servicing.
The Bank securitizes various loans and advances to customers, which generally result in the sale of these assets to securitization vehicles, which in turn issue securities to investors. Interests in the securitized financial assets may be retained in the form of senior or subordinated tranches, interest-only strips or other residual interests (retained

55
Credit Europe Bank N
V Annual Report 20
15N
otes to con
solidated
finan
cial statemen
ts
Notes to consolidated financial statements
interests). Retained interests are primarily recorded in available-for-sale investment securities and carried at fair value. Gains or losses on securitization depend in part on the carrying amount of the transferred financial asset, allocated between the financial assets derecognized and the retained interests based on their relative fair value at the date of the transfer. Gains or losses on securitization are recorded in results from financial transactions.
Financial liabilitiesA financial liability is derecognized when the obligation under the liability is discharged, cancelled or expires. Where an existing financial liability is replaced by another from the same lender on substantially different terms, or the terms of an existing liability are substantially modified, such an exchange or modification is treated as a derecognition of the original liability and the recognition of a new liability, and the difference in the respective carrying amounts is recognized in the income statement.
Offsetting and collateralThe Bank enters into master netting arrangements with counterparties wherever possible, and when appropriate, obtains collateral. The Bank receives and gives collateral in the form of cash and marketable securities in respect of derivatives, sale and repurchase agreements, reverse sale and repurchase agreements, securities lending and securities borrowing transactions.
Financial assets and liabilities are offset and the net amount presented in the statement of financial position when, and only when, the Bank • currently has a legally enforceable right to set off the
recognized amounts; and• intends either to settle on a net basis, or to realise the asset
and settle the liability simultaneously.
Due to differences in the timing of actual cash flows, derivatives with positive and negative fair values are not netted, even if they are held with the same counterparty. Also current accounts with positive and negative balances held with the same counterparties are not netted.
Amortised cost measurementThe ‘amortised cost’ of a financial asset or liability is the amount at which the financial asset or liability is measured at initial recognition, minus principle repayments, plus or minus the cumulative amortization using the effective interest method of any difference between the initial amount recognized and the maturity amount, minus any reduction
for impairment. The amortization is recognized in the income statement under interest income.
Fair value measurement‘Fair value’ is the price that would be received to sell an asset or paid to transfer a liability in an orderly transaction between market participants at the measurement date in the principal or, in its absence, the most advantageous market to which the Bank has access at that date. The fair value of a liability reflects its non-performance risk.
When available, the Bank measures the fair value of an instrument using quoted prices in an active market for that instrument. A market is regarded as active if transactions for the asset or liability take place with sufficient frequency and volume to provide pricing information on an ongoing basis.
If a market for a financial instrument is not active, the Bank establishes fair value using a valuation technique. Valuation techniques include using recent arm’s length transactions between knowledgeable, willing parties (if available), reference to the current fair value of other instruments that are substantially the same, discounted cash flow analyses and option-pricing models. The chosen valuation technique makes maximum use of relevant observable inputs, relies as little as possible on unobservable inputs specific to the Bank, incorporates all factors that market participants would consider in setting a price, and is consistent with accepted economic methodologies for pricing financial instrument. Inputs to valuation techniques reasonably represent market expectations and measures of the risk-return factors inherent in the financial instrument. The Bank calibrates valuation techniques and tests them for validity using prices from observable current market transactions in the same instrument or based on other available observable market data.
Assets and long positions are measured at a bid price, liabilities and short positions are measured at an ask price. Fair values reflect the credit risk of the instrument and include adjustments to take account of the credit risk of the Bank entity and the counterparty where appropriate. Fair value estimates obtained from models are adjusted for any other factors, such as liquidity risk or model uncertainties; to the extent that the Bank believes a third-party market participant would take them into account in pricing a transaction. The best evidence of the fair value of a financial instrument at initial recognition is the transaction price (i.e. the fair value of the consideration given or received). However, in some cases, the fair value of a financial instrument on initial recognition may be different to its transaction price. If such fair value is
56
Cre
dit E
urop
e Ba
nk N
V A
nnua
l Rep
ort 2
015
No
tes
to C
onso
lid
ated
Fin
anci
al S
tate
men
ts
Notes to Consolidated Financial Statements
evidenced by comparison with other observable current market transactions in the same instrument (i.e. without modification or repackaging) or based on a valuation technique whose variables only include data from observable markets, then the difference is recognized in the income statement (net trading income) on initial recognition of the instrument. In other cases the difference is not recognized in the income statement immediately but is recognized over the life of the instrument on an appropriate basis or when the instrument is redeemed, transferred or sold, or the fair value becomes observable.
The principal methods and assumptions used by the Bank in determining the fair value of financial instruments are:• Fair values for trading and financial investments are
determined using market prices from active markets. If no quoted prices are available from an active market, the fair value is determined using discounted cash-flow models. Discount factors are based on the swap curve (observable in the market), plus a spread reflecting the characteristics of the instrument.
• Fair values for derivative financial instruments are obtained from active markets or determined using, as appropriate, discounted cash-flow models. Discount factors are based on the swap curve (observable in the market), plus a spread reflecting the characteristics of the instrument.
• Fair values for loans and deposits are determined using discounted cash-flow models based on the Bank’s current incremental lending rates for similar types of loans. For variable-rate loans that re-price frequently and have no significant change in credit risk, fair values are approximated by the carrying amount.
• The fair value of loans that are quoted in active markets is determined using the quoted prices. The Bank uses valuation method to establish the fair value of instruments where prices quoted in active markets are not available. Parameter inputs to the valuation method are based on observable data derived from prices of relevant instruments traded in an active market. These valuation methods involve discounting future cash flows of loan with related yield curve plus spread on similar transactions and using recent offers if available.
• The carrying amounts are considered to approximate fair values for other financial assets and liabilities.
Identification and measurement of impairmentAt each balance sheet date, the Bank assesses whether there is any objective evidence that a financial asset or group of financial assets is impaired. A financial asset or a group of financial assets is deemed to be impaired if, and only if, there is objective evidence of impairment as a result of one or more events that occurred after the initial recognition of the asset
(an incurred ‘loss event’) and that loss event (or events) has an impact on the estimated future cash flows of the financial asset or group of financial assets that can be reliably estimated.
Objective evidence of impairment may include indications that the borrower or group of borrowers are experiencing significant financial difficulty, default or delinquency in interest or principal payments, restructuring of loans or advances by the Bank on terms that the Bank would not otherwise consider, indications that a borrower or issuer will enter bankruptcy, the disappearance of an active market for a security, deterioration in the value of collateral, or other observable data relating to a group of assets, such as adverse changes in the payment status of borrowers or issuers in the group, or economic conditions that correlate with defaults in the group.
i. Loans and receivables from customer and banksFor loans and receivables from customers and banks carried at amortized cost, the Bank first assesses whether objective evidence of impairment exists individually for significant financial assets or collectively for non-significant financial assets. If the Bank determines that no objective evidence of impairment exists for an individually assessed financial asset, whether significant or not, it includes the asset in a group of financial assets with similar credit-risk characteristics and collectively assesses them for impairment. Assets that are individually assessed for impairment and for which an impairment loss is, or continues to be, recognized are not included in a collective assessment of impairment.
If there is objective evidence that an impairment loss has been incurred, the loss is measured as the difference between the asset’s carrying amount and the present value of estimated future cash flows (excluding future expected credit losses that have not yet been incurred). The carrying amount of the asset is reduced through an allowance account and the loss is recognized in the income statement. The Bank suspends the accrual of interest on loans when it is determined to be a loss. Previously accrued but uncollected interest is not reversed at the time the loan ceases to accrue interest. Loans, together with the associated allowance accounts, are written off when there is no realistic prospect of future recovery and all collateral has been realized or has been transferred to the Bank.
If, in a subsequent year, the estimated impairment loss increases or decreases due to an event occurring after the impairment was recognized, the previously recognized impairment loss is increased or reduced by adjusting the allowance account. When any part of a claim is deemed uncollectible or forgiven, a write-off is charged to the

57
Credit Europe Bank N
V Annual Report 20
15N
otes to con
solidated
finan
cial statemen
ts
Notes to consolidated financial statements
allowance account. If a future write-off is later recovered, the recovery is credited to the ‘other operating income’.
The present value of estimated future cash flows is discounted at the financial asset’s original effective interest rate. If a loan has a variable interest rate, the discount rate for measuring any impairment loss is the current effective interest rate. The calculation of the present value of the estimated future cash flows of a collateralized financial asset reflects the cash flows that may result from foreclosure, less costs for obtaining and selling the collateral, whether or not foreclosure is probable.
A collective component of the total allowance is established for groups of homogenous loans that are not considered individually significant.
The collective allowance for groups of homogenous loans is established using statistical methods such as roll rate methodology. The roll rate methodology uses statistical analysis of historical data on delinquency to estimate the amount of loss.
The IBNR allowance covers credit losses inherent in portfolios of loans and advances with similar credit risk characteristics when there is objective evidence to suggest that they contain impaired items but the individual impaired items cannot yet be identified.
By definition, these are losses that cannot yet be attributed to particular transactions. Therefore, this provision is derived from the portfolio analysis, which is based on the homogenous exposure structures of the financial assets being analyzed. Financial assets are grouped on the basis of their credit-risk characteristics, such as type, geographical location, past-due status and other relevant factors.
Future cash flows on a group of financial assets that are collectively evaluated for impairment are estimated on the basis of historical loss experiences for assets with credit-risk characteristics similar to those in the group. Historical loss experiences are adjusted on the basis of current and observable data to reflect the effects of current conditions that did not affect the year on which the historical loss experience is based and to remove the effects of conditions in the historical period that do not exist currently. The methodology and assumptions used for estimate future cash flows are reviewed periodically by means of back testing to reduce any differences between loss estimates and actual loss experience.
Where possible, the Bank seeks to restructure loans rather than take possession of collateral. If the terms of a financial
asset are renegotiated or modified or an existing financial asset is replace with a new one due to financial difficulties of the borrower then an assessment is made whether the financial asset should be derecognized. If the cash flows of the renegotiated asset are substantially different, then the contractual rights to cash flows from the original financial asset are deemed to have expired. A substantial difference is defined, if the discounted present value of the cash flows under the new terms, including any fees paid net of any fees received, and discounting using the original effective interest rate, is at least 10 percent different from the discounted present value of the remaining cash flows of the financial asset. In this case the original financial asset is derecognized and the new financial asset is recognized at fair value. The impairment loss is measured as follows:• Iftheexpectedrestructuringdoesnotresultinderecognitionoftheexistingasset,theestimatedcashflowsarisingfromthemodifiedfinancialassetsareincludedinthemeasurementoftheexistingassetbasedontheirexpectedtimingandamountsdiscountedattheoriginaleffectiveinterestrateoftheexistingfinancialasset.
• Iftheexpectedrestructuringresultsinderecognitionoftheexistingasset,thentheexpectedfairvalueofthenewassetistreatedasthefinalcashflowfromtheexistingfinancialassetatthetimeofderecognition.Thisamountisdiscountedfromtheexpecteddateofderecognitiontothereportingdateusingtheoriginaleffectiveinterestrateoftheexistingfinancialasset.
Once the terms have been renegotiated, the loan is no longer considered past due. Management continuously reviews renegotiated loans to ensure that all criteria are met and that future payments are likely to occur. The loans continue to be subject to an individual or collective impairment assessment.
Impairment losses are recognized in the income statement (under net impairment loss on financial assets) and reflected in an allowance account against loans and advances. Contractual interest receipts are taken into account when the entity estimates the future cash flows of the instrument and are thus recognized upon receipt. If no contractual interest payments will be collected, the only interest income recognized is the unwinding of the discount on those cash flows expected to be received. When an event occurring after the impairment was recognized causes the amount of impairment loss to decrease, the decrease in impairment loss is reversed through the income statement.
ii. Held-to-maturity financial investmentsFor held-to-maturity investments, the Bank assesses individually whether there is objective evidence of impairment. If there is objective evidence that an impairment loss has been

58
Cre
dit E
urop
e Ba
nk N
V A
nnua
l Rep
ort 2
015
No
tes
to C
onso
lid
ated
Fin
anci
al S
tate
men
ts
Notes to Consolidated Financial Statements
incurred, the loss is measured as the difference between the asset’s carrying amount and the present value of estimated future cash flows discounted at the assets original effective interest rate. The carrying amount of the asset is reduced and the amount of the loss is recognized in the income statement.
If, in a subsequent year, the estimated impairment loss decreases because of an event occurring after the impairment was recognized, any amounts formerly charged are reversed through ‘net impairment loss on financial assets’.
iii. Available-for-sale financial assetsFor available-for-sale financial assets, the Bank assesses whether there is objective evidence that a financial asset or a group of financial assets is impaired at each balance sheet date.
In the case of equity investments classified as available-for-sale, objective evidence would include a significant or prolonged decline in the fair value of the investment below cost. ‘Significant’ or ‘prolonged’ are interpreted on a case-by-case. Generally the Bank considers a decline of 20% to be ‘significant’ and a period of nine months to be ‘prolonged’. Where there is evidence of impairment, impairment losses on available-for-sale investment securities are recognized by transferring the cumulative loss directly in equity to income statement. The cumulative loss that is removed from equity and recognized in income statement is the difference between the acquisition costs, net of any principal repayment and amortization, and the current fair value, less any impairment loss previously recognized in the income statement.
In the case of unquoted debt instruments classified as available-for-sale, the impairment loss is calculated as the difference between the carrying amount of the investment and the present value of estimated future cash flows, discounted at the current market rate of return for similar financial assets. Whether an impairment event has occurred is assessed for each debt instrument individually based on the impairment indicators relevant for that instrument.
Interest based on market rates is accrued at the effective interest rate on the reduced carrying amount of the asset, and is recorded as part of ‘interest and similar income’.
If, in a subsequent year, the fair value of a debt instrument increases and the increase can be objectively related to an event occurring after the impairment loss was recognized in the income statement, the impairment loss is reversed through the income statement. However, any subsequent recovery in
the fair value of an impaired available-for-sale equity security is recognized directly in equity.
d) Cash and cash equivalents‘Cash and cash equivalents’, as referred to in the cash flows statement, comprises cash on hand and balances with central banks with an insignificant risk of a change in value. Cash and cash equivalents are carried at amortized cost in the statement of financial position.
The cash flows statement, based on the indirect method of calculation, gives details of the source of cash and cash equivalents that became available during the year, and the application of these cash and cash equivalents over the course of the year. The cash flows are analyzed into cash flows from operations, including banking, investment and financing activities. Movements in loans and receivables and inter-bank deposits are included in cash flows from operating activities. Investment activities comprise sales and redemptions in respect of financial investments, and property and equipment.
The issuing of shares, and the borrowing and repayment of long-term funds are treated as financing activities. Movements due to currency translation differences and the effects of the consolidation of business acquisitions, where of material significance, are eliminated from the cash flows figures.
e) Trading assets and liabilities (excluding derivatives held for trading)Trading assets and liabilities are those assets and liabilities that the Bank acquires or incurs principally for the purpose of selling or repurchasing in the near future, or holds as part of portfolio that is managed together for short-term profit or position taking.
Trading assets and liabilities are initially recognized and subsequently measured at fair value in the statement of financial position with transaction costs taken directly to income statement. Interest income or expense is recorded in ‘net interest income’ according to the terms of the contract. All changes in fair value, except for the interest accruals, are recognized as part of ‘results from financial transactions’ in the income statement. Trading assets and liabilities are not reclassified subsequent to their initial recognition.
f) Available-for-sale financial assets‘Available-for-sale financial assets’ are instruments that are designated as such or do not qualify to be classified as ‘fair value through profit or loss’ or ‘held-to-maturity’. They may be sold in response to liquidity needs or changes in market conditions. After initial measurement, available-for-sale financial assets

59
Credit Europe Bank N
V Annual Report 20
15N
otes to con
solidated
finan
cial statemen
ts
Notes to consolidated financial statements
are subsequently measured at fair value. Unrealized gains and losses are recognized directly in equity in the ‘fair value reserve’. When the asset is disposed of, or is determined to be impaired, the cumulative gain or loss previously recognized in equity is recognized in the income statement in ‘results from financial transactions’. Interest earned while holding available-for-sale investmentsis reported as interest income using the effective interest rate. The losses arising from impairment of such investments are recognized in the income statement as ‘net impairment loss on financial assets’.
g) Held-to-maturity investments‘Held-to-maturity investments’ are non-derivative assets with fixed or determinable payments and fixed maturity that the Bank has the intention and ability to hold to maturity, and which are not designated as at ‘fair value through profit or loss’ or as ‘available-for-sale’. After initial measurement, held-to-maturity investments are subsequently measured at amortized cost using the effective interest rate method, less any provision for impairment.
h) Loans and receivables ‘Loans and receivables’ (excluding forfeiting loans) are non-derivative financial assets with fixed or determinable payments and fixed maturities that are not quoted in an active market. They are not entered into with the intention of immediate or short-term resale. Loans and receivables are initially measured at fair value plus incremental direct costs and subsequently measured at amortised cost using the effective interest method. When the Bank chooses to designate the loans and receivables as measured at fair value through profit or loss, they are measured at fair value with face value changes recognized immediately in the income statement.
Loans and receivables also include finance lease receivables in which the Bank is the lessor.
i) Derivatives held for tradingA derivative financial instrument is a financial contract between two parties where payments are dependent on movements in price of one or more underlying financial instruments, references, rates or indices. Derivatives include currency and cross-currency swaps, forward foreign-exchange contracts, interest-rate swaps, currency options, equity options, bonds options, futures and credit-default swaps. Derivatives are recorded at fair value and carried as assets when their fair value is positive and as liabilities when their fair value is negative. Derivative financial instruments are subsequently re-measured at fair value. Changes in the fair value of derivatives are included in ‘net trading income’.
Derivatives embedded in other financial instruments are treated as separate derivatives and recorded at fair value if their economic characteristics and risks are not closely related to those of the host contract, and the host contract is not itself held for trading or designated at fair value through profit or loss. The embedded derivatives separated from the host are carried at fair value in the trading portfolio with changes in fair value recognized in the income statement under ‘net trading income’.
j) Derivatives held for risk management purposes and hedge accountingDerivatives held for risk management purposes (i.e. asset-liability management) include all derivative assets and liabilities that are not classified as ‘trading assets and liabilities’. Derivatives held for risk-management purposes are measured at fair value in the statement of financial position. All gains and losses arising on derivatives held for risk management purpose but not designated in a hedge accounting relationship are presented under net interest income.
The Bank designates certain derivatives held for risk management purposes and certain non-derivative financial instruments as hedging instruments in qualifying hedging relationships. On initial designation of the hedge, the Bank formally documents the relationship between the hedging instrument(s) and hedged item(s), including the risk-management objective and strategy in undertaking the hedge transaction, together with the method that will be used to assess the effectiveness of the hedging relationship. The Bank makes an assessment, both at the inception of the hedge relationship as well as an ongoing basis, of whether the hedging instrument(s) is (are) expected to be highly effective in offsetting the changes in the fair value or cash flows of the respective hedged item(s) during the period for which the hedge is designated, and whether the actual results of each hedge are within a range of 80-125 percent.
These hedging relationships are discussed below.
Fair value hedgesWhen a derivative is designated as the hedging instrument in a hedge of the change in fair value of a recognised asset or liability or a firm commitment that could affect profit or loss, changes in the fair value of the derivative are recognised immediately in the statement of income together with changes in the fair value of the hedged item that are attributable to the hedged risk.
If the hedging derivative expires or sold, terminated or exercised, or the hedge no longer meets the criteria for fair value hedge

60
Cre
dit E
urop
e Ba
nk N
V A
nnua
l Rep
ort 2
015
No
tes
to C
onso
lid
ated
Fin
anci
al S
tate
men
ts
Notes to Consolidated Financial Statements
accounting, or the hedge designation is revoked, then hedge accounting is discontinued prospectively. However, if the derivative is novated to a central counterparty by both parties as a consequence of laws or regulations without changes in its terms except for those that are necessary for the novation, then the derivative is not considered as expired or terminated.
Any adjustment up to the point of discontinuation to a hedged item for which the effective interest method is used is amortised to the statement of income as part of the recalculated effective interest rate of the item over its remaining life.
Net investment hedgesWhen a derivative or a non-derivative financial liability is designated as the hedging instrument in a hedge of a net investment in a foreign operation, the effective portion of changes in the fair value of the hedging instrument is recognized directly in equity, in the hedging reserve. Any ineffective portion of changes in the fair value of the derivative is recognized immediately in income statement. The amount recognized in equity is removed and included in income statement on disposal of the foreign operations.
Cash-flow hedgesThe effective portion of changes in the fair value of derivatives that are designated and qualify as cash flow hedges are recognized in equity. The gain or loss relating to the ineffective portion is recognized immediately in the income statement. Amounts accumulated in equity are reclassified to the income statement in the periods in which the hedged cash flows affect profit or loss.
When a derivative is designated as the hedging instrument in a hedge of the variability in cash flows attributable to a particular risk associated with a recognised asset or liability that could affect profit or loss, the effective portion of changes in the fair value of the derivative is recognised in the other comprehensive income and presented in the hedging reserve within equity. Any ineffective portion of changes in the fair value of the derivative is recognised immediately in the statement of income. The amount recognised in the other comprehensive income is reclassified to the statement of income as a reclassification adjustment in the same period as the hedged cash flows affect profit or loss, and in the same line item in the statement of income and other comprehensive income.
If the hedging derivative expires or sold, terminated, or exercised, or the hedge no longer meets the criteria for cash flow hedge accounting, or the hedge designation is revoked, then
hedge accounting is discontinued prospectively. However, if the derivative is novated to a central counterparty by both parties as a consequence of laws or regulations without changes in its terms except for those that are necessary for the novation, then the derivative is not considered as expired or terminated.
k) Repurchase transactions and reverse repo transactionsTransactions where financial instruments, such as loans and securities, are sold under a commitment to repurchase (repos) at a predetermined price or are purchased under a commitment to resell (reverse repo) are treated as collateralized borrowing and lending transactions. The legal title of the financial instrument subject to resale or repurchase commitments is transferred to the lender. Financial instruments transferred under a repurchase commitment are henceforth included in the relevant items of the Bank’s statement of financial position, such as ‘loans and receivables - customers’ and financial investments, while the borrowing is recorded in ‘due to banks’. Financial instruments received under a resale commitment are recorded in the off-balance sheet accounts, unless sold.
Income and expenses arising from repurchase and resale commitments, being the difference between the selling and the purchase price, are accrued over the period of the transaction and recorded in the income statement as ‘interest and similar income’ or ‘interest expense and similar charges’.
l) Leasing Determining whether an arrangement is, or contains, a lease is based on the substance of the arrangement and requires an assessment of whether the fulfilment of the arrangement depends on using a specific asset or assets and the arrangement conveys a right to use the asset.
i. Bank as a lesseeFinance leases, which substantially transfer all the risks and benefits incidental to ownership of the leased item to the Bank, are capitalized at the inception of the lease at the fair value of the leased property or, if lower, at the present value of the minimum lease payments, and are included in ‘property and equipment’ with the corresponding liability to the lessor included in ‘other liabilities’. Lease payments are apportioned between the finance charges and reduction of the lease liability to achieve a constant rate of interest on the remaining balance of the liability. Finance charges are charged directly to the income statement as ‘interest and similar expenses’.
Capitalized leased assets are depreciated over the shorter of the estimated useful life of the asset and the lease term if there

61
Credit Europe Bank N
V Annual Report 20
15N
otes to con
solidated
finan
cial statemen
ts
Notes to consolidated financial statements
is no reasonable certainty that the Bank will obtain ownership by the end of the lease term.Operating lease payments are not recognized on the statement of financial position. Any rentals payable are accounted for on a straight-line basis over the lease term and included in ‘general and administrative expenses’.
ii. Bank as a lessorFinance leases, where the Bank substantially transfers all the risks and benefits incidental to ownership of the leased item to the lessee, are included on the statement of financial position as ‘loans and receivables - customers’. A receivable is recognized over the leasing period at an amount equal to the present value of the lease payments using the implicit rate of interest and including any guaranteed residual value. All income resulting from the receivable is included under ‘interest and similar income’ in the income statement.
m) Property and equipmentProperty and equipment is stated at cost less accumulated depreciation and any accumulated impairment. Borrowing costs, if any, are included in the cost of property and equipment in case they are directly attributable to the acquisition, construction or production of the asset. Changes in the expected useful life are accounted for by changing the amortization period or method, as appropriate, and treated as changes in accounting estimates.
Depreciation is calculated on property and equipment using the straight-line method to allocate their cost to their residual values over their estimated useful lives as follows:
Buildings 30-60years
Furnitureandfixtures 3-20years
ITequipment 3-10years
Vehicles 3-30years
LeaseholdimprovementsOverthetermofrespective
leasesor3-5years
An item of property and equipment is derecognized upon disposal or when no future economic benefits are expected from its use or disposal. Any gain or loss arising on derecognition of the asset (calculated as the difference between the net disposal proceeds and the carrying amount of the asset) is recognized in ‘other operating income’ in the income statement.
n) Investment Property Investment property is initially measured at cost and subsequently at fair value, with any change therein recognised
in profit or loss within either “other operating income” or “other impairment losses”.
o) Intangible assetsi. SoftwareIntangible assets mainly include the value of computer software. Software acquired by the Bank is measured on initial recognition at cost. Following initial recognition, software is carried at cost less any accumulated amortization and any accumulated impairment losses. Intangible assets are amortized over the useful economic life and are assessed for impairment whenever there is an indication that the intangible asset may be impaired. The amortization period and the amortization method are reviewed at least at each financial year-end. The amortization expense on intangible assets is recognized in the income statement in ‘depreciation and amortization’.
Expenditure on internally developed software is recognized as asset when the Bank is able to demonstrate its intention and ability to complete the development and use the software in a manner that will generate future economic benefits and can reliably measure the costs to complete development. The capitalized costs of internally developed software include all costs directly attributable to developing the software, and are amortized over its useful life. Internally developed software is stated at capitalized cost, less accumulated amortization and any accumulated impairment losses.
Amortization is calculated using the straight-line method over their estimated useful life of software, from the date it is available to use. The estimated useful life of software is three to ten years.
ii. GoodwillGoodwill arises on the acquisition of subsidiaries. Goodwill arising on the acquisition of a non-controlling interest in a subsidiary represents the excess of the cost of the additional investment over the carrying amount of the interest in the net assets acquired at the date of exchange. Subsequent to initial recognition, goodwill is measured at cost less accumulated impairment losses.
p) Assets held for saleThe Bank takes possession of collateral it holds as security. The Bank books these assets as ‘held for sale’. These assets are not used for the daily banking transactions and the management intends to sell these assets in the future in their present conditions. They are initially measured at fair value less costs at acquisition. After initial measurement, non-current assets held for sale are subsequently measured at fair value. Changes
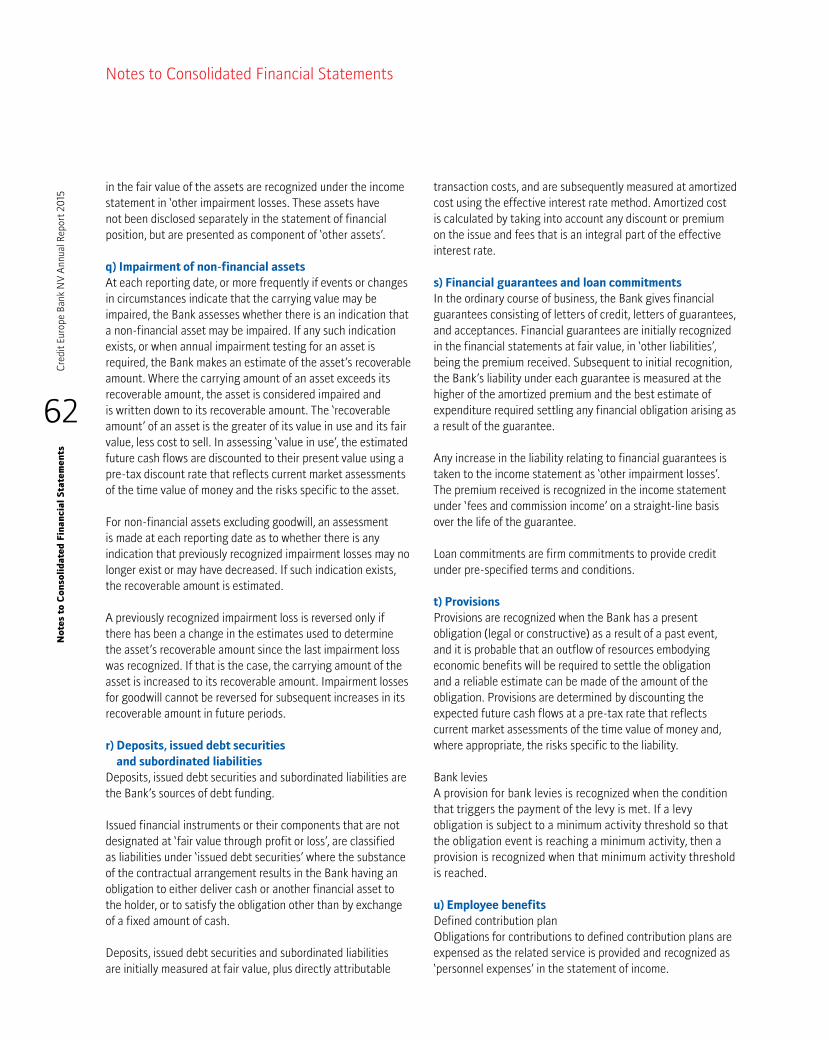
62
Cre
dit E
urop
e Ba
nk N
V A
nnua
l Rep
ort 2
015
No
tes
to C
onso
lid
ated
Fin
anci
al S
tate
men
ts
Notes to Consolidated Financial Statements
in the fair value of the assets are recognized under the income statement in ‘other impairment losses. These assets have not been disclosed separately in the statement of financial position, but are presented as component of ‘other assets’.
q) Impairment of non-financial assetsAt each reporting date, or more frequently if events or changes in circumstances indicate that the carrying value may be impaired, the Bank assesses whether there is an indication that a non-financial asset may be impaired. If any such indication exists, or when annual impairment testing for an asset is required, the Bank makes an estimate of the asset’s recoverable amount. Where the carrying amount of an asset exceeds its recoverable amount, the asset is considered impaired and is written down to its recoverable amount. The ‘recoverable amount’ of an asset is the greater of its value in use and its fair value, less cost to sell. In assessing ‘value in use’, the estimated future cash flows are discounted to their present value using a pre-tax discount rate that reflects current market assessments of the time value of money and the risks specific to the asset.
For non-financial assets excluding goodwill, an assessment is made at each reporting date as to whether there is any indication that previously recognized impairment losses may no longer exist or may have decreased. If such indication exists, the recoverable amount is estimated.
A previously recognized impairment loss is reversed only if there has been a change in the estimates used to determine the asset’s recoverable amount since the last impairment loss was recognized. If that is the case, the carrying amount of the asset is increased to its recoverable amount. Impairment losses for goodwill cannot be reversed for subsequent increases in its recoverable amount in future periods. r) Deposits, issued debt securities
and subordinated liabilitiesDeposits, issued debt securities and subordinated liabilities are the Bank’s sources of debt funding.
Issued financial instruments or their components that are not designated at ‘fair value through profit or loss’, are classified as liabilities under ‘issued debt securities’ where the substance of the contractual arrangement results in the Bank having an obligation to either deliver cash or another financial asset to the holder, or to satisfy the obligation other than by exchange of a fixed amount of cash.
Deposits, issued debt securities and subordinated liabilities are initially measured at fair value, plus directly attributable
transaction costs, and are subsequently measured at amortized cost using the effective interest rate method. Amortized cost is calculated by taking into account any discount or premium on the issue and fees that is an integral part of the effective interest rate.
s) Financial guarantees and loan commitmentsIn the ordinary course of business, the Bank gives financial guarantees consisting of letters of credit, letters of guarantees, and acceptances. Financial guarantees are initially recognized in the financial statements at fair value, in ‘other liabilities’, being the premium received. Subsequent to initial recognition, the Bank’s liability under each guarantee is measured at the higher of the amortized premium and the best estimate of expenditure required settling any financial obligation arising as a result of the guarantee.
Any increase in the liability relating to financial guarantees is taken to the income statement as ‘other impairment losses’. The premium received is recognized in the income statement under ‘fees and commission income’ on a straight-line basis over the life of the guarantee.
Loan commitments are firm commitments to provide credit under pre-specified terms and conditions.
t) ProvisionsProvisions are recognized when the Bank has a present obligation (legal or constructive) as a result of a past event, and it is probable that an outflow of resources embodying economic benefits will be required to settle the obligation and a reliable estimate can be made of the amount of the obligation. Provisions are determined by discounting the expected future cash flows at a pre-tax rate that reflects current market assessments of the time value of money and, where appropriate, the risks specific to the liability.
Bank leviesA provision for bank levies is recognized when the condition that triggers the payment of the levy is met. If a levy obligation is subject to a minimum activity threshold so that the obligation event is reaching a minimum activity, then a provision is recognized when that minimum activity threshold is reached.
u) Employee benefitsDefined contribution planObligations for contributions to defined contribution plans are expensed as the related service is provided and recognized as ‘personnel expenses’ in the statement of income.

63
Credit Europe Bank N
V Annual Report 20
15
v) Income taxesi. Current taxCurrent tax assets and liabilities for current and prior years are measured at the amount expected to be recovered from, or paid to, the tax authorities. The tax rates and tax laws used to compute the amount are those that are enacted, or substantively enacted, by the balance sheet date. ii. Deferred income taxDeferred corporate income tax is recorded, using the liability method, on all taxable temporary differences arising between the carrying amounts of assets and liabilities for financial reporting purposes and the amounts used for taxation purposes, except for differences not deductible for tax purposes and initial recognition of assets and liabilities that affect neither accounting nor taxable profit.
Deferred tax liabilities and assets are recognized when it is probable that the future economic benefits resulting from the reversal of taxable temporary differences will flow to or from the Bank. Deferred tax assets are recognized only to the extent that it is probable that future taxable profit will be available against which the deferred tax asset can be utilized. The carrying value of deferred tax assets is reviewed at each balance sheet date and reduced to the extent that it is no longer probable that sufficient taxable profit will be available to allow all or part of the deferred tax asset to be utilized. Unrecognized deferred tax assets are reassessed at each balance sheet date and are recognized to the extent that it has become probable that future taxable profit will allow the deferred tax asset to be recovered.
Deferred tax assets and liabilities are measured at the tax rates that are expected to apply in the year when the asset is realized or the liability is settled, based on tax rates (and tax laws) that have been enacted or substantively enacted at the balance sheet date. Current tax and deferred tax relating to items recognized directly in equity are also recognized in equity and not in the income statement. Deferred tax assets and deferred tax liabilities are offset if a legally enforceable right exists to offset current tax assets against current tax liabilities, and the deferred taxes relate to the same taxable entity and the same taxation authority.
w) Recognition of income and expensesRevenue is recognized to the extent that it is probable that the economic benefits will flow to the Bank and the revenue can be reliably measured. The following specific recognition criteria must also be met before revenue is recognized:i. Interest income and expenses
Interest income and expenses are recognized in the statement of income using the effective interest method. The ‘effective interest rate’ is the rate that exactly discounts the estimated future cash payments and receipts through the expected life of the financial asset or financial liability (or, where appropriate, a shorter period) to the carrying amount of the financial asset or financial liability. When calculating the effective interest rate, the Bank estimates future cash flows considering all contractual terms of the financial instrument, but not future credit losses.The calculation of the effective interest rate includes transaction costs and fees and points paid or received that are an integral part of the effective interest rate. Transaction costs include incremental costs that are directly attributable to the acquisition or issue of a financial asset or financial liability.All gains and losses arising on derivatives held for risk management purpose but not designated in a hedge accounting relationship are presented under net interest income.
ii. Fees and commissions incomeThe Bank earns fee and commission income from a diverse range of services it provides to its customers. Fees and commissions for the provision of services over a period of time are generally recognized on an accrual basis. Loan commitment fees for loans that are likely to be drawn down and other credit related fees are deferred (together with any incremental costs), and are recognized as an adjustment to the effective interest rate of the loan.
Commission and fees arising from negotiating or participating in the negotiation of a transaction for a third party are recognized on completion of the underlying transaction. Management and service fees are recognized based on the applicable service contracts. Fees for bank transfers and other banking transaction services are recorded as income when collected.
iii. Net trading income‘Net trading income’ comprises gains and losses arising from changes in the fair value and disposal of financial assets and liabilities held for trading, and includes dividends received from trading instruments. Realized and unrealized gains and losses on derivative financial instruments held for trading are recognized under net trading income.
iv. Results from financial transactionsResults from financial transactions include gains and losses on the sale of financial instruments not classified as held for trading. Dividend income from financial investments is
No
tes to consolid
ated fin
ancial statem
ents
Notes to consolidated financial statements
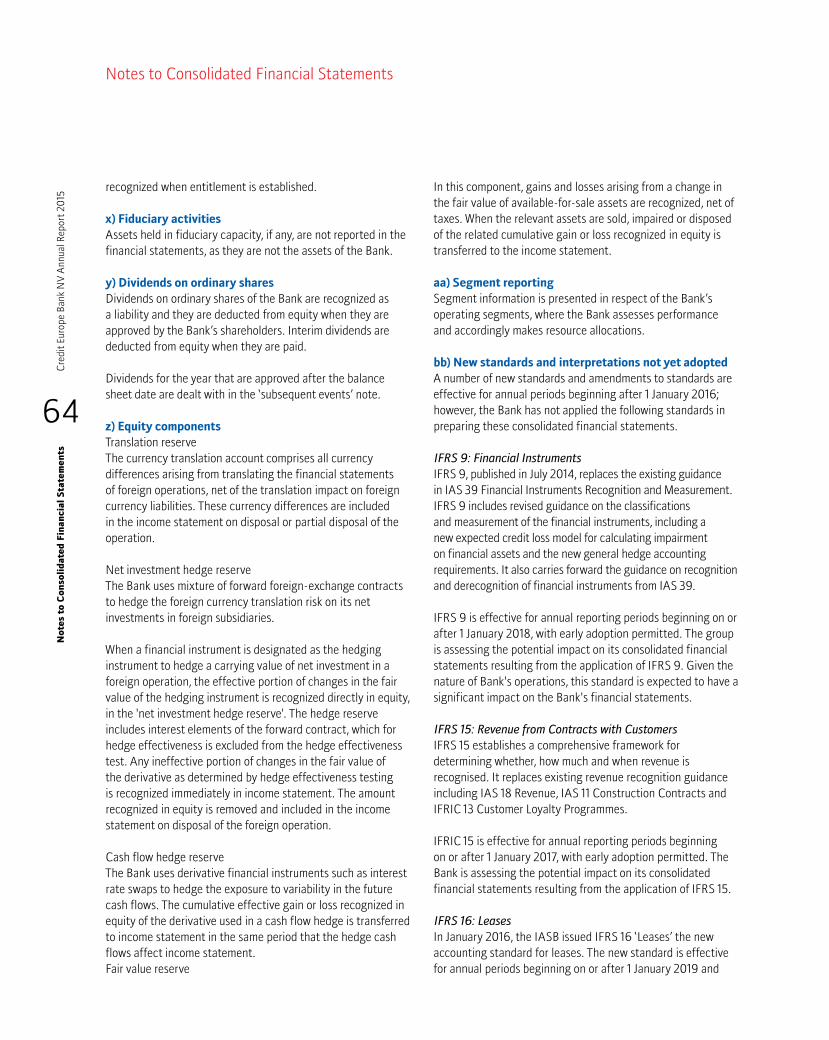
No
tes
to C
onso
lid
ated
Fin
anci
al S
tate
men
ts
64
Cre
dit E
urop
e Ba
nk N
V A
nnua
l Rep
ort 2
015
Notes to Consolidated Financial Statements
recognized when entitlement is established.
x) Fiduciary activitiesAssets held in fiduciary capacity, if any, are not reported in the financial statements, as they are not the assets of the Bank.
y) Dividends on ordinary sharesDividends on ordinary shares of the Bank are recognized as a liability and they are deducted from equity when they are approved by the Bank’s shareholders. Interim dividends are deducted from equity when they are paid.
Dividends for the year that are approved after the balance sheet date are dealt with in the ‘subsequent events’ note.
z) Equity componentsTranslation reserveThe currency translation account comprises all currency differences arising from translating the financial statements of foreign operations, net of the translation impact on foreign currency liabilities. These currency differences are included in the income statement on disposal or partial disposal of the operation.
Net investment hedge reserveThe Bank uses mixture of forward foreign-exchange contracts to hedge the foreign currency translation risk on its net investments in foreign subsidiaries.
When a financial instrument is designated as the hedging instrument to hedge a carrying value of net investment in a foreign operation, the effective portion of changes in the fair value of the hedging instrument is recognized directly in equity, in the 'net investment hedge reserve'. The hedge reserve includes interest elements of the forward contract, which for hedge effectiveness is excluded from the hedge effectiveness test. Any ineffective portion of changes in the fair value of the derivative as determined by hedge effectiveness testing is recognized immediately in income statement. The amount recognized in equity is removed and included in the income statement on disposal of the foreign operation.
Cash flow hedge reserveThe Bank uses derivative financial instruments such as interest rate swaps to hedge the exposure to variability in the future cash flows. The cumulative effective gain or loss recognized in equity of the derivative used in a cash flow hedge is transferred to income statement in the same period that the hedge cash flows affect income statement.Fair value reserve
In this component, gains and losses arising from a change in the fair value of available-for-sale assets are recognized, net of taxes. When the relevant assets are sold, impaired or disposed of the related cumulative gain or loss recognized in equity is transferred to the income statement.
aa) Segment reportingSegment information is presented in respect of the Bank’s operating segments, where the Bank assesses performance and accordingly makes resource allocations.
bb) New standards and interpretations not yet adoptedA number of new standards and amendments to standards are effective for annual periods beginning after 1 January 2016; however, the Bank has not applied the following standards in preparing these consolidated financial statements.
IFRS 9: Financial Instruments IFRS 9, published in July 2014, replaces the existing guidance in IAS 39 Financial Instruments Recognition and Measurement. IFRS 9 includes revised guidance on the classifications and measurement of the financial instruments, including a new expected credit loss model for calculating impairment on financial assets and the new general hedge accounting requirements. It also carries forward the guidance on recognition and derecognition of financial instruments from IAS 39.
IFRS 9 is effective for annual reporting periods beginning on or after 1 January 2018, with early adoption permitted. The group is assessing the potential impact on its consolidated financial statements resulting from the application of IFRS 9. Given the nature of Bank's operations, this standard is expected to have a significant impact on the Bank's financial statements.
IFRS 15: Revenue from Contracts with Customers IFRS 15 establishes a comprehensive framework for determining whether, how much and when revenue is recognised. It replaces existing revenue recognition guidance including IAS 18 Revenue, IAS 11 Construction Contracts and IFRIC 13 Customer Loyalty Programmes.
IFRIC 15 is effective for annual reporting periods beginning on or after 1 January 2017, with early adoption permitted. The Bank is assessing the potential impact on its consolidated financial statements resulting from the application of IFRS 15.
IFRS 16: LeasesIn January 2016, the IASB issued IFRS 16 ‘Leases’ the new accounting standard for leases. The new standard is effective for annual periods beginning on or after 1 January 2019 and
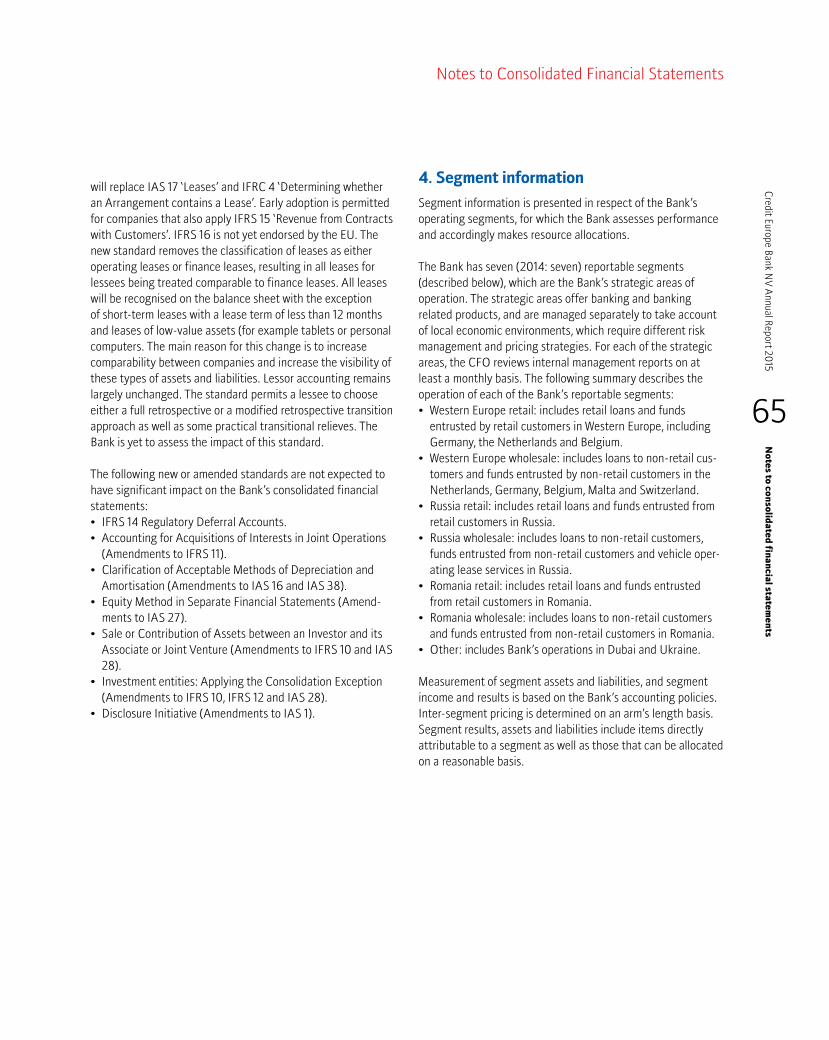
65
Credit Europe Bank N
V Annual Report 20
15N
otes to con
solidated
finan
cial statemen
ts
Notes to Consolidated Financial Statements
will replace IAS 17 ‘Leases’ and IFRC 4 ‘Determining whether an Arrangement contains a Lease’. Early adoption is permitted for companies that also apply IFRS 15 ‘Revenue from Contracts with Customers’. IFRS 16 is not yet endorsed by the EU. The new standard removes the classification of leases as either operating leases or finance leases, resulting in all leases for lessees being treated comparable to finance leases. All leases will be recognised on the balance sheet with the exception of short-term leases with a lease term of less than 12 months and leases of low-value assets (for example tablets or personal computers. The main reason for this change is to increase comparability between companies and increase the visibility of these types of assets and liabilities. Lessor accounting remains largely unchanged. The standard permits a lessee to choose either a full retrospective or a modified retrospective transition approach as well as some practical transitional relieves. The Bank is yet to assess the impact of this standard.
The following new or amended standards are not expected to have significant impact on the Bank’s consolidated financial statements:• IFRS14RegulatoryDeferralAccounts.• AccountingforAcquisitionsofInterestsinJointOperations(AmendmentstoIFRS11).
• ClarificationofAcceptableMethodsofDepreciationandAmortisation(AmendmentstoIAS16andIAS38).
• EquityMethodinSeparateFinancialStatements(Amend-mentstoIAS27).
• SaleorContributionofAssetsbetweenanInvestoranditsAssociateorJointVenture(AmendmentstoIFRS10andIAS28).
• Investmententities:ApplyingtheConsolidationException(AmendmentstoIFRS10,IFRS12andIAS28).
• DisclosureInitiative(AmendmentstoIAS1).
4. Segment information
Segment information is presented in respect of the Bank’s operating segments, for which the Bank assesses performance and accordingly makes resource allocations.
The Bank has seven (2014: seven) reportable segments (described below), which are the Bank’s strategic areas of operation. The strategic areas offer banking and banking related products, and are managed separately to take account of local economic environments, which require different risk management and pricing strategies. For each of the strategic areas, the CFO reviews internal management reports on at least a monthly basis. The following summary describes the operation of each of the Bank’s reportable segments:• WesternEuroperetail:includesretailloansandfundsentrustedbyretailcustomersinWesternEurope,includingGermany,theNetherlandsandBelgium.
• WesternEuropewholesale:includesloanstonon-retailcus-tomersandfundsentrustedbynon-retailcustomersintheNetherlands,Germany,Belgium,MaltaandSwitzerland.
• Russiaretail:includesretailloansandfundsentrustedfromretailcustomersinRussia.
• Russiawholesale:includesloanstonon-retailcustomers,fundsentrustedfromnon-retailcustomersandvehicleoper-atingleaseservicesinRussia.
• Romaniaretail:includesretailloansandfundsentrustedfromretailcustomersinRomania.
• Romaniawholesale:includesloanstonon-retailcustomersandfundsentrustedfromnon-retailcustomersinRomania.
• Other:includesBank’soperationsinDubaiandUkraine.
Measurement of segment assets and liabilities, and segment income and results is based on the Bank’s accounting policies. Inter-segment pricing is determined on an arm’s length basis. Segment results, assets and liabilities include items directly attributable to a segment as well as those that can be allocated on a reasonable basis.
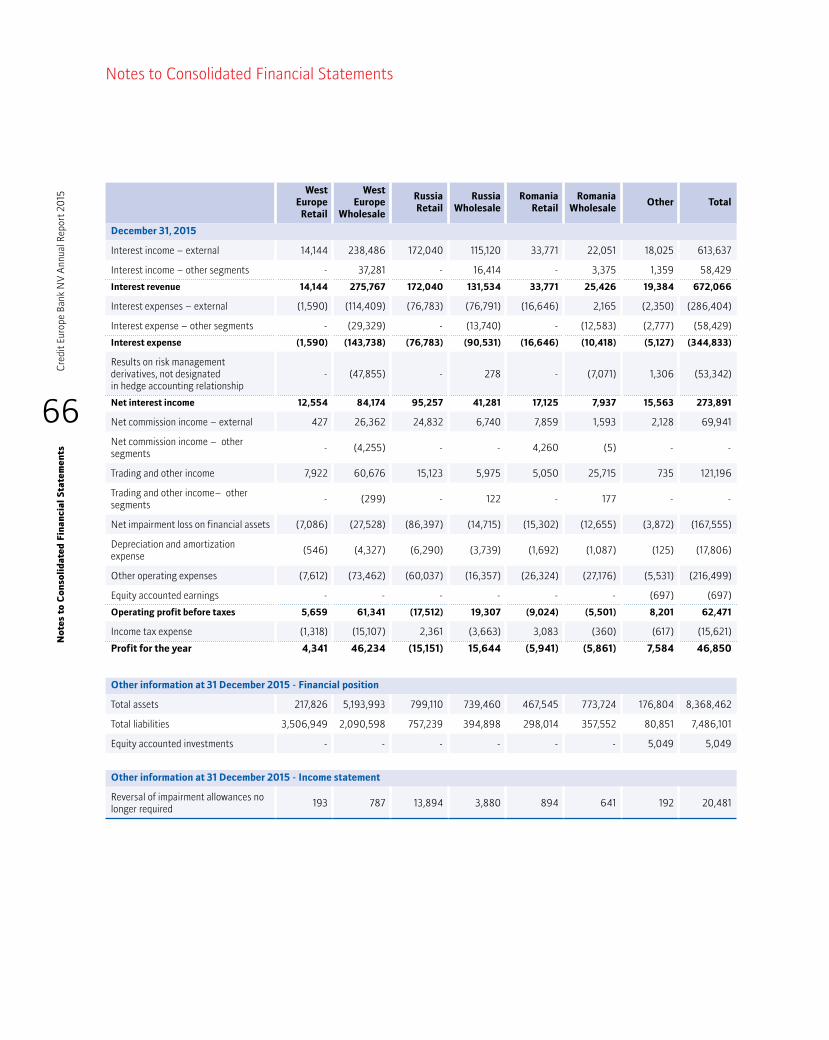
66
Cre
dit E
urop
e Ba
nk N
V A
nnua
l Rep
ort 2
015
No
tes
to C
onso
lid
ated
Fin
anci
al S
tate
men
ts
Notes to Consolidated Financial Statements
West
EuropeRetail
West Europe
Wholesale
RussiaRetail
Russia Wholesale
RomaniaRetail
Romania Wholesale
Other Total
December 31, 2015
Interest income – external 14,144 238,486 172,040 115,120 33,771 22,051 18,025 613,637
Interest income – other segments - 37,281 - 16,414 - 3,375 1,359 58,429
Interest revenue 14,144 275,767 172,040 131,534 33,771 25,426 19,384 672,066
Interest expenses – external (1,590) (114,409) (76,783) (76,791) (16,646) 2,165 (2,350) (286,404)
Interest expense – other segments - (29,329) - (13,740) - (12,583) (2,777) (58,429)
Interest expense (1,590) (143,738) (76,783) (90,531) (16,646) (10,418) (5,127) (344,833)
Results on risk management derivatives, not designated in hedge accounting relationship
- (47,855) - 278 - (7,071) 1,306 (53,342)
Net interest income 12,554 84,174 95,257 41,281 17,125 7,937 15,563 273,891
Net commission income – external 427 26,362 24,832 6,740 7,859 1,593 2,128 69,941
Net commission income – other segments - (4,255) - - 4,260 (5) - -
Trading and other income 7,922 60,676 15,123 5,975 5,050 25,715 735 121,196
Trading and other income– other segments - (299) - 122 - 177 - -
Net impairment loss on financial assets (7,086) (27,528) (86,397) (14,715) (15,302) (12,655) (3,872) (167,555)
Depreciation and amortization expense (546) (4,327) (6,290) (3,739) (1,692) (1,087) (125) (17,806)
Other operating expenses (7,612) (73,462) (60,037) (16,357) (26,324) (27,176) (5,531) (216,499)
Equity accounted earnings - - - - - - (697) (697)
Operating profit before taxes 5,659 61,341 (17,512) 19,307 (9,024) (5,501) 8,201 62,471
Income tax expense (1,318) (15,107) 2,361 (3,663) 3,083 (360) (617) (15,621)
Profit for the year 4,341 46,234 (15,151) 15,644 (5,941) (5,861) 7,584 46,850
Other information at 31 December 2015 - Financial position
Total assets 217,826 5,193,993 799,110 739,460 467,545 773,724 176,804 8,368,462
Total liabilities 3,506,949 2,090,598 757,239 394,898 298,014 357,552 80,851 7,486,101
Equity accounted investments - - - - - - 5,049 5,049
Other information at 31 December 2015 - Income statement
Reversal of impairment allowances no longer required 193 787 13,894 3,880 894 641 192 20,481
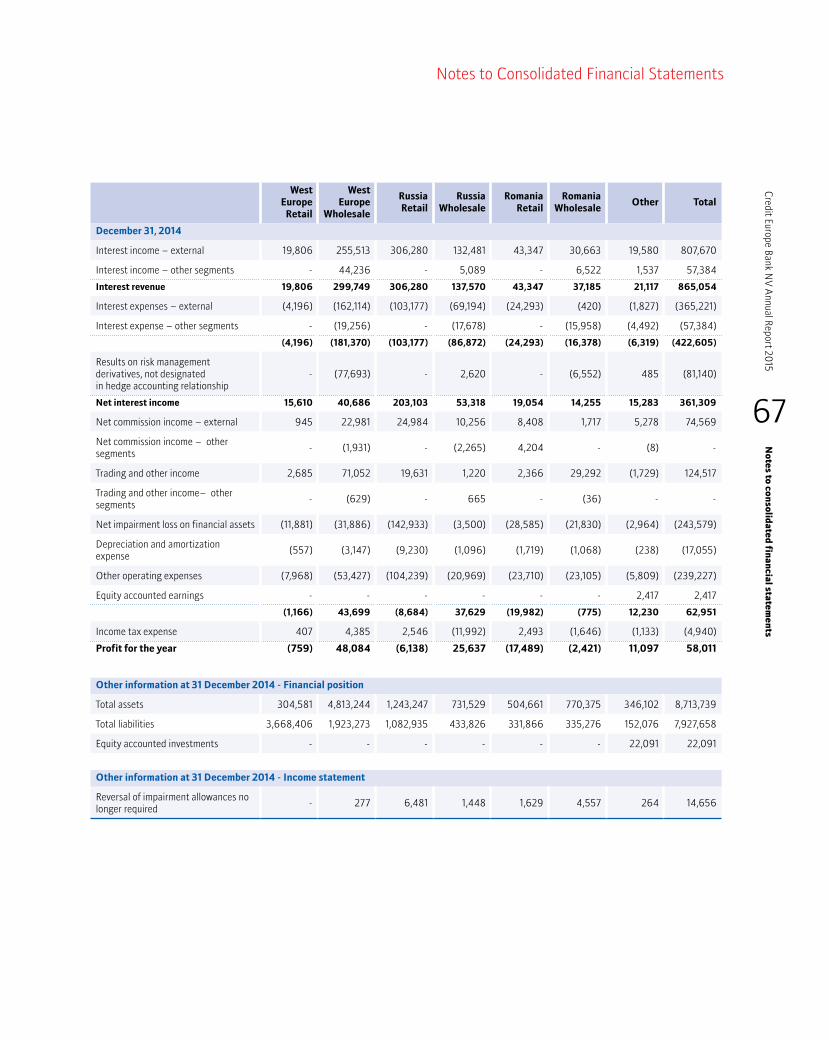
67
Credit Europe Bank N
V Annual Report 20
15N
otes to con
solidated
finan
cial statemen
ts
Notes to Consolidated Financial Statements
West
EuropeRetail
West Europe
Wholesale
RussiaRetail
Russia Wholesale
RomaniaRetail
Romania Wholesale
Other Total
December 31, 2014
Interest income – external 19,806 255,513 306,280 132,481 43,347 30,663 19,580 807,670
Interest income – other segments - 44,236 - 5,089 - 6,522 1,537 57,384
Interest revenue 19,806 299,749 306,280 137,570 43,347 37,185 21,117 865,054
Interest expenses – external (4,196) (162,114) (103,177) (69,194) (24,293) (420) (1,827) (365,221)
Interest expense – other segments - (19,256) - (17,678) - (15,958) (4,492) (57,384)
(4,196) (181,370) (103,177) (86,872) (24,293) (16,378) (6,319) (422,605)
Results on risk management derivatives, not designated in hedge accounting relationship
- (77,693) - 2,620 - (6,552) 485 (81,140)
Net interest income 15,610 40,686 203,103 53,318 19,054 14,255 15,283 361,309
Net commission income – external 945 22,981 24,984 10,256 8,408 1,717 5,278 74,569
Net commission income – other segments - (1,931) - (2,265) 4,204 - (8) -
Trading and other income 2,685 71,052 19,631 1,220 2,366 29,292 (1,729) 124,517
Trading and other income– other segments - (629) - 665 - (36) - -
Net impairment loss on financial assets (11,881) (31,886) (142,933) (3,500) (28,585) (21,830) (2,964) (243,579)
Depreciation and amortization expense (557) (3,147) (9,230) (1,096) (1,719) (1,068) (238) (17,055)
Other operating expenses (7,968) (53,427) (104,239) (20,969) (23,710) (23,105) (5,809) (239,227)
Equity accounted earnings - - - - - - 2,417 2,417
(1,166) 43,699 (8,684) 37,629 (19,982) (775) 12,230 62,951
Income tax expense 407 4,385 2,546 (11,992) 2,493 (1,646) (1,133) (4,940)
Profit for the year (759) 48,084 (6,138) 25,637 (17,489) (2,421) 11,097 58,011
Other information at 31 December 2014 - Financial position
Total assets 304,581 4,813,244 1,243,247 731,529 504,661 770,375 346,102 8,713,739
Total liabilities 3,668,406 1,923,273 1,082,935 433,826 331,866 335,276 152,076 7,927,658
Equity accounted investments - - - - - - 22,091 22,091
Other information at 31 December 2014 - Income statement
Reversal of impairment allowances no longer required - 277 6,481 1,448 1,629 4,557 264 14,656

68
Cre
dit E
urop
e Ba
nk N
V A
nnua
l Rep
ort 2
015
No
tes
to C
onso
lid
ated
Fin
anci
al S
tate
men
ts
Notes to Consolidated Financial Statements
5. Cash and balances at central banks
This item includes cash on hand and deposits with central banks in countries in which the Bank has a presence.
December 31, 2015 December 31, 2014
Balances with central banks 488,048 323,587
Cash on hand 44,091 51,743
Total 532,139 375,330
Deposits at central banks include reserve deposits amounting to EUR 106,437 (2014: EUR 104,397), which represents the mandatory deposit and is not available in the Bank’s day-to-day operations.
6. Financial assets at fair value through profit or loss
December 31, 2015 December 31, 2014
Financial assets held for trading
Government bonds 4,312 8,009
Equity instruments 1,832 1,305
Bank bonds 1,434 2,524
Corporate bonds - 7,346
Total 7,578 19,184
As of December 31, 2015, EUR 6,616 (2014: EUR 19,184) of the total is listed securities.As of December 31, 2015, there is no financial asset that may be sold or re-pledged under repurchase agreements (2014: none ).Gains and losses on changes in fair value of trading instruments are recognized in ‘net trading income’.
7. Financial investments
December 31, 2015 December 31, 2014
Available-for-sale financial investments 1,022,454 1,243,658
Total 1,022,454 1,243,658
As of December 31, 2015, the fair value of financial assets that may be sold or re-pledged under repurchase agreements is EUR 106,767 (2014: EUR 137,691). These transactions are conducted under terms that are normal and customary to standard lending, and securities borrowing and lending activities, as well as requirements determined by exchanges where the Bank acts as an intermediary.
December 31, 2015 December 31, 2014
Available-for-sale portfolio
Government bonds 480,144 651,829
Bank bonds 336,955 368,374
Forfeiting loans 152,846 187,022
Equities 29,407 15,320
Corporate bonds 23,102 21,113
Total 1,022,454 1,243,658
As of December 31, 2015, EUR 844,226 (2014: EUR 1,041,707) of the total is listed securities and EUR 178,228 (2014: EUR 201,951) is non-listed financial instruments.

69
Credit Europe Bank N
V Annual Report 20
15N
otes to con
solidated
finan
cial statemen
ts
Notes to Consolidated Financial Statements
The movement in investment securities may be summarized as follows:
December 31, 2015 December 31, 2014
Balance at the beginning of the year 1,243,658 1,550,003
Additions 4,365,415 6,363,230
Disposals (sale and redemption) (4,607,694) (6,684,292)
Net changes in fair value 8,702 21,844
Amounts written off (483) -
Exchange differences 12,856 (7,127)
Balance at the end of the year 1,022,454 1,243,658
8. Loans and receivables - banks
LAR1 December 31, 2015 December 31, 2014
Placements with other banks 442,554 349,340
Loans and advances 8,933 15,809
Subtotal 451,487 365,149
Allowance for impairment (925) (925)
Total 450,562 364,224
Placements with other banks that are not available in the Bank’s day-to-day operations amount to EUR 162,201 (2014: EUR 117,386).
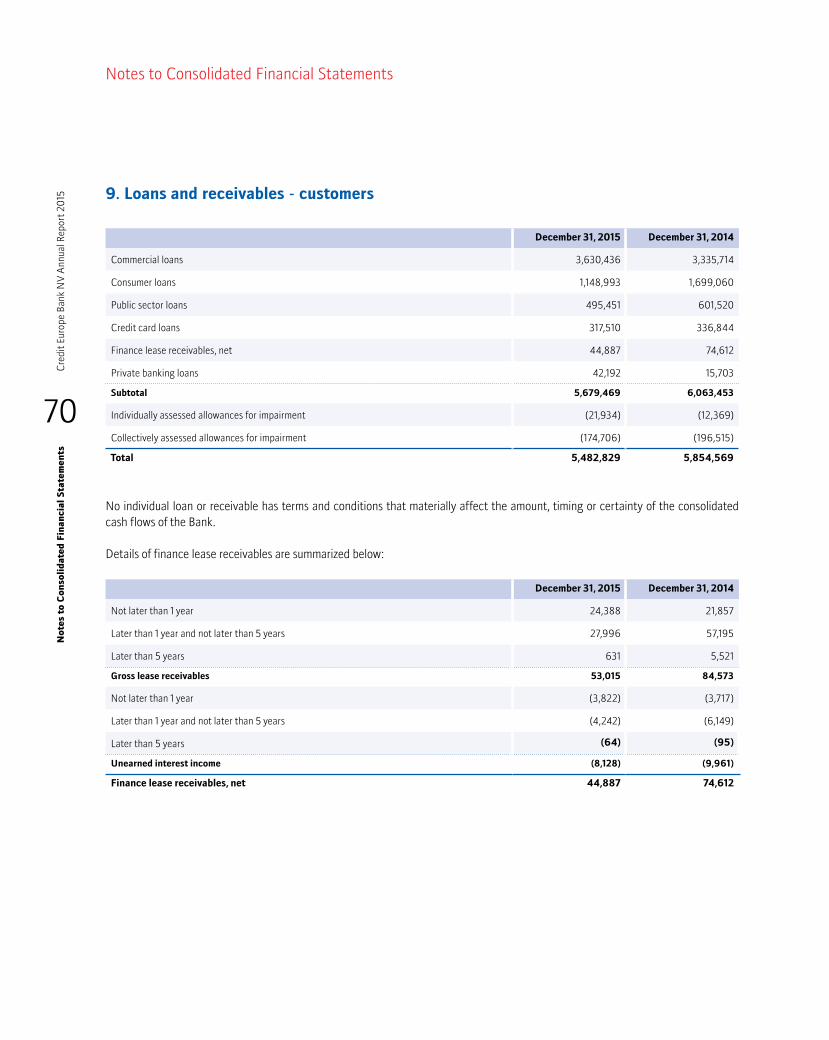
70
Cre
dit E
urop
e Ba
nk N
V A
nnua
l Rep
ort 2
015
No
tes
to C
onso
lid
ated
Fin
anci
al S
tate
men
ts
Notes to Consolidated Financial Statements
9. Loans and receivables - customers
December 31, 2015 December 31, 2014
Commercial loans 3,630,436 3,335,714
Consumer loans 1,148,993 1,699,060
Public sector loans 495,451 601,520
Credit card loans 317,510 336,844
Finance lease receivables, net 44,887 74,612
Private banking loans 42,192 15,703
Subtotal 5,679,469 6,063,453
Individually assessed allowances for impairment (21,934) (12,369)
Collectively assessed allowances for impairment (174,706) (196,515)
Total 5,482,829 5,854,569
No individual loan or receivable has terms and conditions that materially affect the amount, timing or certainty of the consolidated cash flows of the Bank.
Details of finance lease receivables are summarized below:
December 31, 2015 December 31, 2014
Not later than 1 year 24,388 21,857
Later than 1 year and not later than 5 years 27,996 57,195
Later than 5 years 631 5,521
Gross lease receivables 53,015 84,573
Not later than 1 year (3,822) (3,717)
Later than 1 year and not later than 5 years (4,242) (6,149)
Later than 5 years (64) (95)
Unearned interest income (8,128) (9,961)
Finance lease receivables, net 44,887 74,612

71
Credit Europe Bank N
V Annual Report 20
15N
otes to C
onsolid
ated Fin
ancial S
tatemen
ts
Notes to Consolidated Financial Statements
10. Loan impairment charges and allowances
December 31, 2015 December 31, 2014
Balance at the beginning of the year 209,809 255,376
New impairment allowances 187,515 258,235
Reversal of impairment allowances no longer required (20,481) (14,656)
Amounts written off (149,476) (188,378)
Currency translation differences (30,287) (100,768)
Reclassifications 485 -
Balance at the end of the year 197,565 209,809
Breakdown of balance at the end of the year
Consumer loans 119,920 150,587
Commercial loans 46,039 30,401
Credit card loans 25,343 24,299
Finance lease receivables 5,338 3,597
Loans to banks 925 925
Total 197,565 209,809
Net impairment loss on financial assets in income statement December 31, 2015 December 31, 2014
New impairment allowances 187,515 258,235
Reversal of impairment allowances no longer required (20,481) (14,656)
Net impairment loss on financial assets 167,034 243,579
In 2015, EUR 521 (2014: none) of the credit loss charge recognized in income statement is related to financial investment held as available-for-sale.
Individually assessed allowances for impairment December 31, 2015 December 31, 2014
Balanceatthebeginningoftheyear 13,294 15,374
Newimpairmentallowances 56,286 81,954
Reversalofimpairmentallowancesnolongerrequired (507) (3,687)
Amountswrittenoff (37,113) (70,625)
Currencytranslationdifferences (9,101) (9,722)
Balance at the end of the year 22,859 13,294
Collectively assessed allowances for impairment December 31, 2015 December 31, 2014
Balanceatthebeginningoftheyear 196,515 240,002
Newimpairmentallowances 131,229 176,281
Reversalofimpairmentallowancesnolongerrequired (19,974) (10,969)
Amountswrittenoff (112,363) (117,753)
Currencytranslationdifferences (21,186) (91,046)
Reclassifications 485 -
Balance at the end of the year 174,706 196,515

72
Cre
dit E
urop
e Ba
nk N
V A
nnua
l Rep
ort 2
015
No
tes
to C
onso
lid
ated
Fin
anci
al S
tate
men
ts
Notes to Consolidated Financial Statements
11. Derivative financial instruments
In the ordinary course of business, the Bank enters into various types of transactions that involve derivative financial instruments. A derivative financial instrument is a financial contract between two parties where payments depend on movements in price in one or more underlying financial instruments, reference rates or indices. Derivative financial instruments include forwards, swaps, futures, credit default swaps and options.
The table below shows the fair values of derivative financial instruments, recorded as assets and liabilities, together with their notional amounts. The notional amount, recorded gross, is the amount of a derivative’s underlying asset, reference rate or index, and is the basis on which changes in the value of derivatives are measured. The notional amounts indicate the volume of transactions outstand-ing at the year-end and are indicative of neither the market nor the credit risk.
December 31, 2015 December 31, 2014
Nominal Amounts
Fair values -assets
Fair values -liabilities
Nominal Amounts
Fair values -assets
Fair values -liabilities
Derivatives held for trading
Interest rate derivatives
Swaps - - - 26,746 5,165 146
Futures - - - 45,500 - 1
Options (purchased) 24,320 - - 21,679 44 -
Options (sold) (24,320) - - (1,252) - 7 Subtotal - - - 92,673 5,209 154
Currency derivatives
Swaps 5,508,508 137,325 153,358 5,797,055 141,153 196,095
Forwards 964,715 45,692 47,738 1,063,654 23,880 13,632
Options (purchased) 2,663,600 84,989 - 2,710,811 85,207 -
Options (sold) (2,670,382) - 85,226 (2,701,146) - 85,197 Subtotal 6,466,441 268,006 286,322 6,870,374 250,240 294,924
Other derivatives
Commodity swaps 158,797 41,285 40,095 36,634 2,578 2,481
Equity options (purchased) 201,633 6,385 - 311,875 8,785 -
Equity options (sold) (201,633) - 6,385 (311,849) - 8,785 Subtotal 158,797 47,670 46,480 36,660 11,363 11,266
Total derivatives 6,625,238 315,676 332,802 6,999,707 266,812 306,344
Derivative financial instruments held or issued for trading purposes: Most of the Bank’s derivative trading activities relate to asset and liability management of the Bank and deals with customers who are normally laid off with counterparties. The Bank may also take positions with the expectation of profiting from favourable movements in prices, rates on indices.
Forwards and futures: Forwards and futures contracts are contractual agreements to buy or sell a specified financial instrument at a specific price and date in the future. Forwards are customized contracts transacted in the over-the-counter market. Futures contracts are transacted in standardized amounts on regulated exchanges and are subject to daily cash margin requirements.
Swaps: Swaps are contractual agreements between two parties to exchange movements in interest or foreign-currency rates, com-modities or equity indices based on specified notional amounts.
Options: Options are contractual agreements that convey the right, but not the obligation for the purchaser, either to buy or sell a specific amount of a financial instrument at a fixed price, either at a fixed future date or at any time within a specified period.

73
Credit Europe Bank N
V Annual Report 20
15N
otes to C
onsolid
ated Fin
ancial S
tatemen
ts
Notes to Consolidated Financial Statements
Fair value hedgesThe Bank uses interest rate swaps to hedge its exposure to changes in fair values of its fixed rate EUR customer deposits and cross-currency swaps to hedge its exposure to market interest rates on certain loans and advances.
The fair value of derivatives designated as fair value hedges are as follows:
December 31, 2015 December 31, 2014
Nominal Amounts
Fair values -assets
Fair values -liabilities
Nominal Amounts
Fair values -assets
Fair values -liabilities
Instrument type:
Interest rate swaps 136,738 6,215 - 136,738 8,089 -
Currency swaps (134,247) - 2,287 (89,333) - 4,914
Total 2,491 6,215 2,287 47,405 8,089 4,914
During 2015, EUR 95 loss relating to the ineffective portion of fair value hedges was recognized in the income statement (2014: EUR 54 loss).
Net investment hedgesThe Bank uses a mixture of foreign exchange contracts to hedge the foreign currency translation risk on its net investment in foreign subsidiaries.
The fair value of derivatives designated as net investment hedges is as follows:
December 31, 2015 December 31, 2014
Nominal Amounts
Fair values -assets
Fair values -liabilities
Nominal Amounts
Fair values -assets
Fair values -liabilities
Instrument type:
Currency swaps 1,061,944 106,379 43,021 1,186,842 174,526 45,264
Total 1,061,944 106,379 43,021 1,186,842 174,526 45,264
During 2015, EUR 22 loss relating to the ineffective portion of net investment hedges was recognized in the income statement (2014: EUR 85 gain). Cash flow hedgesThe Bank uses cross-currency swaps to hedge part of its foreign currency risk related with USD denominated assets.
The fair value of derivatives designated as cash flow hedge is as follows:
December 31, 2015 December 31, 2014
Nominal Amounts
Fair values -assets
Fair values -liabilities
Nominal Amounts
Fair values -assets
Fair values -liabilities
Instrument type:
Currency swaps 190,489 22,488 75,203 50,000 1,498 6,024
Total 190,489 22,488 75,203 50,000 1,498 6,024
During 2015 no losses relating to the ineffective portion of cash flow hedges was recognized in the income statement (2014: none).
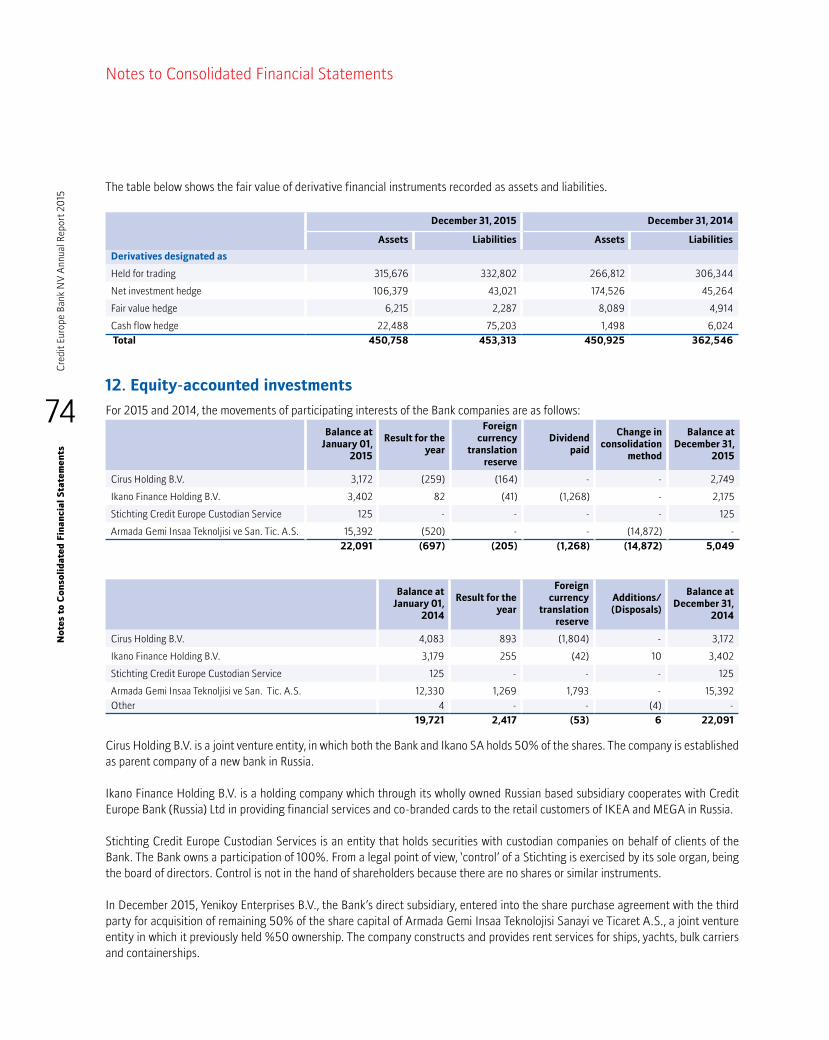
74
Cre
dit E
urop
e Ba
nk N
V A
nnua
l Rep
ort 2
015
No
tes
to C
onso
lid
ated
Fin
anci
al S
tate
men
ts
Notes to Consolidated Financial Statements
The table below shows the fair value of derivative financial instruments recorded as assets and liabilities.
December 31, 2015 December 31, 2014
Assets Liabilities Assets Liabilities
Derivatives designated as
Held for trading 315,676 332,802 266,812 306,344
Net investment hedge 106,379 43,021 174,526 45,264
Fair value hedge 6,215 2,287 8,089 4,914
Cash flow hedge 22,488 75,203 1,498 6,024 Total 450,758 453,313 450,925 362,546
12. Equity-accounted investments
For 2015 and 2014, the movements of participating interests of the Bank companies are as follows:
Balance at
January 01, 2015
Result for the year
Foreign currency
translation reserve
Dividend paid
Change in consolidation
method
Balance at December 31,
2015
Cirus Holding B.V. 3,172 (259) (164) - - 2,749
Ikano Finance Holding B.V. 3,402 82 (41) (1,268) - 2,175
Stichting Credit Europe Custodian Service 125 - - - - 125
Armada Gemi Insaa Teknoljisi ve San. Tic. A.S. 15,392 (520) - - (14,872) - 22,091 (697) (205) (1,268) (14,872) 5,049
Balance at January 01,
2014
Result for the year
Foreign currency
translation reserve
Additions/ (Disposals)
Balance at December 31,
2014
Cirus Holding B.V. 4,083 893 (1,804) - 3,172
Ikano Finance Holding B.V. 3,179 255 (42) 10 3,402
Stichting Credit Europe Custodian Service 125 - - - 125
Armada Gemi Insaa Teknoljisi ve San. Tic. A.S. 12,330 1,269 1,793 - 15,392 Other 4 - - (4) - 19,721 2,417 (53) 6 22,091
Cirus Holding B.V. is a joint venture entity, in which both the Bank and Ikano SA holds 50% of the shares. The company is established as parent company of a new bank in Russia. Ikano Finance Holding B.V. is a holding company which through its wholly owned Russian based subsidiary cooperates with Credit Europe Bank (Russia) Ltd in providing financial services and co-branded cards to the retail customers of IKEA and MEGA in Russia.
Stichting Credit Europe Custodian Services is an entity that holds securities with custodian companies on behalf of clients of the Bank. The Bank owns a participation of 100%. From a legal point of view, ‘control’ of a Stichting is exercised by its sole organ, being the board of directors. Control is not in the hand of shareholders because there are no shares or similar instruments.
In December 2015, Yenikoy Enterprises B.V., the Bank’s direct subsidiary, entered into the share purchase agreement with the third party for acquisition of remaining 50% of the share capital of Armada Gemi Insaa Teknolojisi Sanayi ve Ticaret A.S., a joint venture entity in which it previously held %50 ownership. The company constructs and provides rent services for ships, yachts, bulk carriers and containerships.
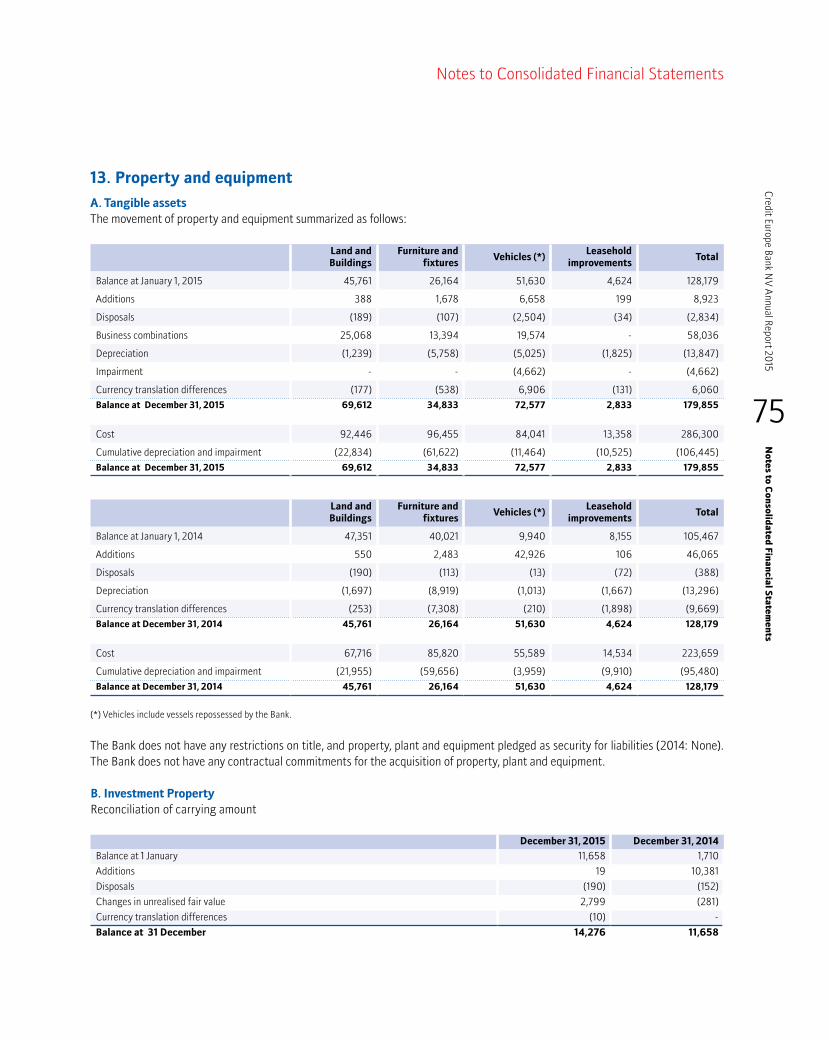
75
Credit Europe Bank N
V Annual Report 20
15N
otes to C
onsolid
ated Fin
ancial S
tatemen
ts
Notes to Consolidated Financial Statements
13. Property and equipment
A. Tangible assetsThe movement of property and equipment summarized as follows:
Land and Buildings
Furniture and fixtures
Vehicles (*)Leasehold
improvementsTotal
Balance at January 1, 2015 45,761 26,164 51,630 4,624 128,179
Additions 388 1,678 6,658 199 8,923
Disposals (189) (107) (2,504) (34) (2,834)
Business combinations 25,068 13,394 19,574 - 58,036
Depreciation (1,239) (5,758) (5,025) (1,825) (13,847)
Impairment - - (4,662) - (4,662)
Currency translation differences (177) (538) 6,906 (131) 6,060
Balance at December 31, 2015 69,612 34,833 72,577 2,833 179,855
Cost 92,446 96,455 84,041 13,358 286,300
Cumulative depreciation and impairment (22,834) (61,622) (11,464) (10,525) (106,445)Balance at December 31, 2015 69,612 34,833 72,577 2,833 179,855
Land and Buildings
Furniture and fixtures
Vehicles (*)Leasehold
improvementsTotal
Balance at January 1, 2014 47,351 40,021 9,940 8,155 105,467
Additions 550 2,483 42,926 106 46,065
Disposals (190) (113) (13) (72) (388)
Depreciation (1,697) (8,919) (1,013) (1,667) (13,296)
Currency translation differences (253) (7,308) (210) (1,898) (9,669)
Balance at December 31, 2014 45,761 26,164 51,630 4,624 128,179
Cost 67,716 85,820 55,589 14,534 223,659
Cumulative depreciation and impairment (21,955) (59,656) (3,959) (9,910) (95,480)Balance at December 31, 2014 45,761 26,164 51,630 4,624 128,179
(*) Vehicles include vessels repossessed by the Bank.
The Bank does not have any restrictions on title, and property, plant and equipment pledged as security for liabilities (2014: None). The Bank does not have any contractual commitments for the acquisition of property, plant and equipment.
B. Investment PropertyReconciliation of carrying amount
December 31, 2015 December 31, 2014
Balanceat1January 11,658 1,710
Additions 19 10,381
Disposals (190) (152)
Changesinunrealisedfairvalue 2,799 (281)
Currencytranslationdifferences (10) -
Balance at 31 December 14,276 11,658
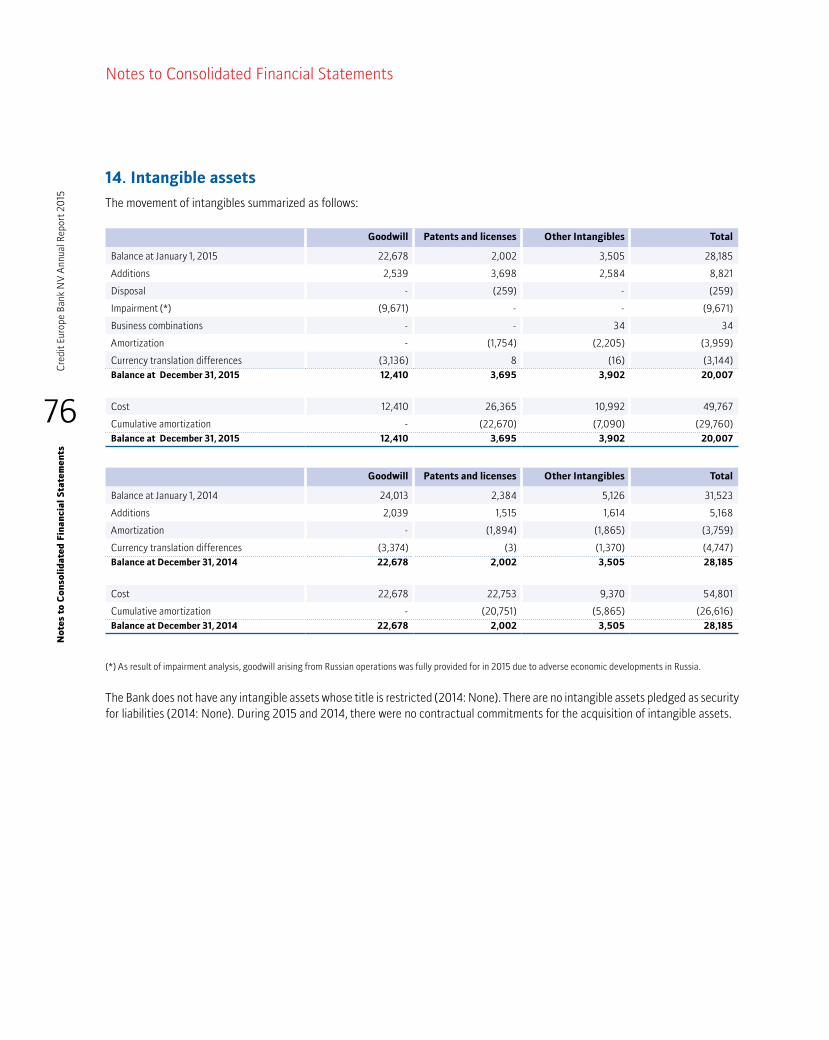
76
Cre
dit E
urop
e Ba
nk N
V A
nnua
l Rep
ort 2
015
No
tes
to C
onso
lid
ated
Fin
anci
al S
tate
men
ts
Notes to Consolidated Financial Statements
14. Intangible assets
The movement of intangibles summarized as follows:
Goodwill Patents and licenses Other Intangibles Total
Balance at January 1, 2015 22,678 2,002 3,505 28,185
Additions 2,539 3,698 2,584 8,821
Disposal - (259) - (259)
Impairment (*) (9,671) - - (9,671)
Business combinations - - 34 34
Amortization - (1,754) (2,205) (3,959)
Currency translation differences (3,136) 8 (16) (3,144)Balance at December 31, 2015 12,410 3,695 3,902 20,007
Cost 12,410 26,365 10,992 49,767
Cumulative amortization - (22,670) (7,090) (29,760)Balance at December 31, 2015 12,410 3,695 3,902 20,007
Goodwill Patents and licenses Other Intangibles Total
Balance at January 1, 2014 24,013 2,384 5,126 31,523
Additions 2,039 1,515 1,614 5,168
Amortization - (1,894) (1,865) (3,759)
Currency translation differences (3,374) (3) (1,370) (4,747)Balance at December 31, 2014 22,678 2,002 3,505 28,185
Cost 22,678 22,753 9,370 54,801
Cumulative amortization - (20,751) (5,865) (26,616)Balance at December 31, 2014 22,678 2,002 3,505 28,185
(*) As result of impairment analysis, goodwill arising from Russian operations was fully provided for in 2015 due to adverse economic developments in Russia.
The Bank does not have any intangible assets whose title is restricted (2014: None). There are no intangible assets pledged as security for liabilities (2014: None). During 2015 and 2014, there were no contractual commitments for the acquisition of intangible assets.

77
Credit Europe Bank N
V Annual Report 20
15N
otes to C
onsolid
ated Fin
ancial S
tatemen
ts
Notes to Consolidated Financial Statements
15. Other assets
December 31, 2015 December 31, 2014
Assets held for sale 88,446 76,230
POS, plastic cards and ATM related receivables 18,460 31,781
Items in the course of settlement 17,700 14,724
Receivables from DNB 15,978 13,192
Prepayments to suppliers 11,094 10,606
Tax related receivables 6,685 13,844
Materials and supplies 4,584 2,487
Accounts receivable 3,751 4,756
Deferred acquisition costs 2,280 5,084
Amounts held as guarantee 1,542 3,730
Other assets 3,414 5,048
Total 173,934 181,482
‘Assets held for sale’ represents collaterals repossessed after clients were not able to meet their payment obligations.
16. Due to banks
December 31, 2015 December 31, 2014
Time deposits 347,427 509,754
Syndication loan 70,053 140,447
Current accounts 51,574 123,475
Total 469,054 773,676
The amount of repo transactions in time deposits is EUR 46,529 (2014: EUR 120,869).
17. Due to customers
December 31, 2015 December 31, 2014
Retail time deposits 2,339,862 2,646,133
Retail saving and demand deposits 1,656,820 1,485,716
Corporate time deposits 865,093 1,000,718
Corporate demand deposits 605,246 655,611
Total 5,467,021 5,788,178
As of December 31, 2015, the Bank maintained customer deposit balances of EUR 360,870 (2014: EUR 392,173), which were pledged to the Bank as collateral for loans and off-balance sheet credit instruments granted by the Bank.
As of December 31, 2015, EUR 2,670,154 (2014: EUR 2,825,426) of deposits from customers are expected to be settled more than 12 months after the balance sheet date.
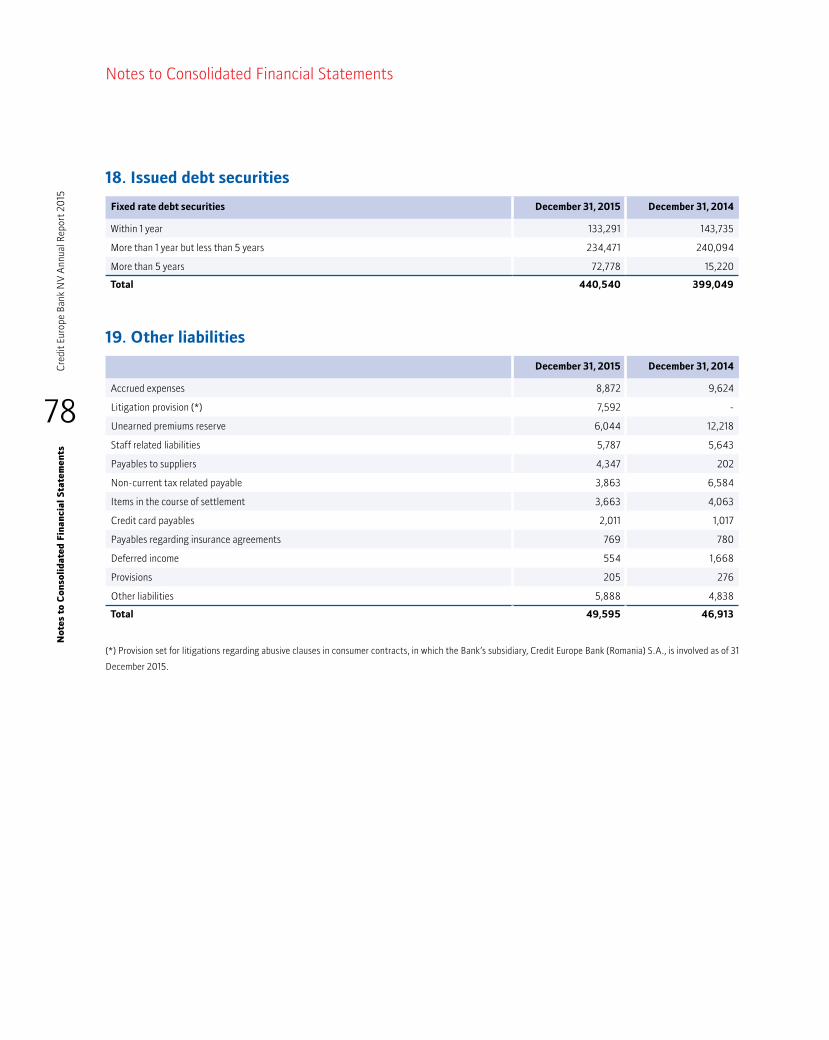
78
Cre
dit E
urop
e Ba
nk N
V A
nnua
l Rep
ort 2
015
18. Issued debt securities
Fixed rate debt securities December 31, 2015 December 31, 2014
Within 1 year 133,291 143,735
More than 1 year but less than 5 years 234,471 240,094
More than 5 years 72,778 15,220
Total 440,540 399,049
19. Other liabilities
December 31, 2015 December 31, 2014
Accrued expenses 8,872 9,624
Litigation provision (*) 7,592 -
Unearned premiums reserve 6,044 12,218
Staff related liabilities 5,787 5,643
Payables to suppliers 4,347 202
Non-current tax related payable 3,863 6,584
Items in the course of settlement 3,663 4,063
Credit card payables 2,011 1,017
Payables regarding insurance agreements 769 780
Deferred income 554 1,668
Provisions 205 276
Other liabilities 5,888 4,838
Total 49,595 46,913
(*) Provision set for litigations regarding abusive clauses in consumer contracts, in which the Bank’s subsidiary, Credit Europe Bank (Romania) S.A., is involved as of 31
December 2015.
No
tes
to C
onso
lid
ated
Fin
anci
al S
tate
men
ts
Notes to Consolidated Financial Statements

79
Credit Europe Bank N
V Annual Report 20
15
20. Subordinated liabilities
Issued liabilities qualify as subordinated debt if claims by the holders are subordinated to all other current and future liabilities of, respectively, the Bank and other Group companies. These liabilities, except for the subordinated bonds issued by Credit Europe Bank Ltd. on November 12, 2012 for an amount of USD 250 million, qualify as capital, taking into account remaining maturities, for the purpose of determining the consolidated capital adequacy ratio for DNB.
Year of maturity December 31, 2015 December 31, 2014
USD 250 million subordinated notes with a fixed interest rate of 8.50 % p.a. 2019 137,406 133,388
USD 50 million Tier II loan with a fixed interest rate of 10 % p.a. 2022 46,327 41,562
USD 400 million Tier II loan with a fixed interest rate of 8 % p.a. 2023 378,014 338,751
Total 561,747 513,701
21. Capital and reserves
December 31, 2015 December 31, 2014
Share capital 632,464 429,500
Share premium 163,748 266,712
Retained earnings 444,444 406,757
Fair value reserve 201 (12,716)
Translation reserve (328,982) (317,300)
Hedging reserve (31,348) 11,299
Equity attributable to shareholders of the Parent Company 880,527 784,252
Equity attributable to non-controlling interests 1,834 1,829
Total equity 882,361 786,081
As of December31,2015,theauthorizedsharecapitalisEUR1,000million(2014:EUR1,000million)andconsistsofEUR1,000mil-lion(2014:EUR1,000million)ordinaryshareswithafacevalueofEUR1.Thecalled-upandpaid-incapitalconsistsof632.5million(2014:429.5million)ordinaryshareswithafacevalueofEUR1.
Translation reserveThe translation reserve comprises all foreign exchange differences arising from the translation of the financial statements of foreign operations.
Hedging reserveThe hedging reserve comprises the effective portion of the cumulative net change in the fair value of hedging instruments used in hedges of net investment in foreign operations and in cash flow hedges.
Fair value reservesThe fair value reserve includes the cumulative net change in the fair value of available-for-sale investments, excluding impairment losses, until the investment is derecognized or impaired.
No
tes to Con
solidated
Finan
cial Statem
ents
Notes to Consolidated Financial Statements

80
Cre
dit E
urop
e Ba
nk N
V A
nnua
l Rep
ort 2
015
22. Net interest income
January 1-
December 31, 2015
January 1-
December 31, 2014
Interest income from:
Loans and receivables – customers valued at amortized cost 539,654 720,093
Financial investments 49,036 43,037
Derivative financial instruments - hedge accounting 10,869 26,202
Loans and receivables – banks valued at amortized cost 6,493 6,052
Interest on financial lease 6,035 9,718
Financial assets held for trading 1,409 2,129
Cash and balances at central banks valued at amortized cost 141 439
Subtotal 613,637 807,670
Interest expense from:
Due to customers valued at amortized cost 129,994 161,309
Issued debt securities valued at amortized cost 56,787 57,095
Subordinated liabilities valued at amortized cost 51,413 53,238
Due to banks valued at amortized cost 33,834 56,577
Derivative financial instruments - hedge accounting 14,168 37,002
Cash and balances at central banks valued at amortized cost 208 -
Subtotal 286,404 365,221
Results on risk management derivatives, not designated in hedge accounting relationship (53,342) (81,140)
Total 273,891 361,309
No
tes
to C
onso
lid
ated
Fin
anci
al S
tate
men
ts
Notes to Consolidated Financial Statements
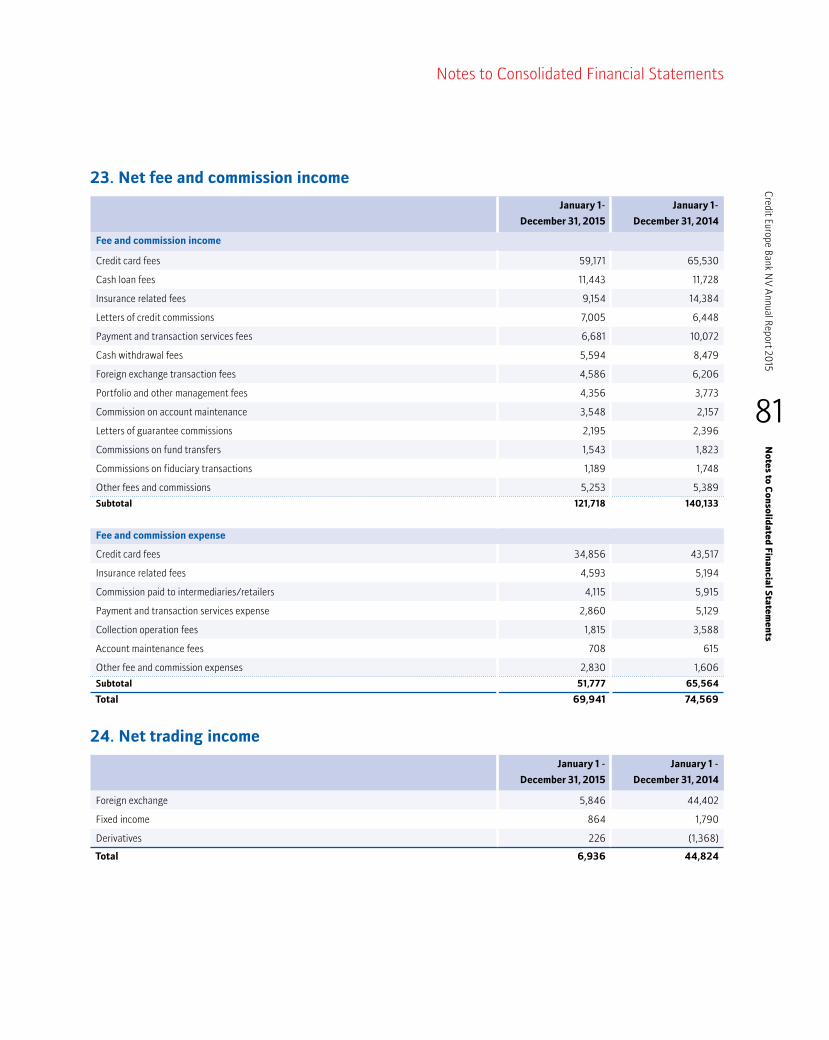
81
Credit Europe Bank N
V Annual Report 20
15
23. Net fee and commission income
January 1-
December 31, 2015
January 1-
December 31, 2014
Fee and commission income
Credit card fees 59,171 65,530
Cash loan fees 11,443 11,728
Insurance related fees 9,154 14,384
Letters of credit commissions 7,005 6,448
Payment and transaction services fees 6,681 10,072
Cash withdrawal fees 5,594 8,479
Foreign exchange transaction fees 4,586 6,206
Portfolio and other management fees 4,356 3,773
Commission on account maintenance 3,548 2,157
Letters of guarantee commissions 2,195 2,396
Commissions on fund transfers 1,543 1,823
Commissions on fiduciary transactions 1,189 1,748
Other fees and commissions 5,253 5,389
Subtotal 121,718 140,133
Fee and commission expense
Credit card fees 34,856 43,517
Insurance related fees 4,593 5,194
Commission paid to intermediaries/retailers 4,115 5,915
Payment and transaction services expense 2,860 5,129
Collection operation fees 1,815 3,588
Account maintenance fees 708 615
Other fee and commission expenses 2,830 1,606
Subtotal 51,777 65,564
Total 69,941 74,569
24. Net trading income
January 1 -
December 31, 2015
January 1 -
December 31, 2014
Foreign exchange 5,846 44,402
Fixed income 864 1,790
Derivatives 226 (1,368)
Total 6,936 44,824
No
tes to Con
solidated
Finan
cial Statem
ents
Notes to Consolidated Financial Statements
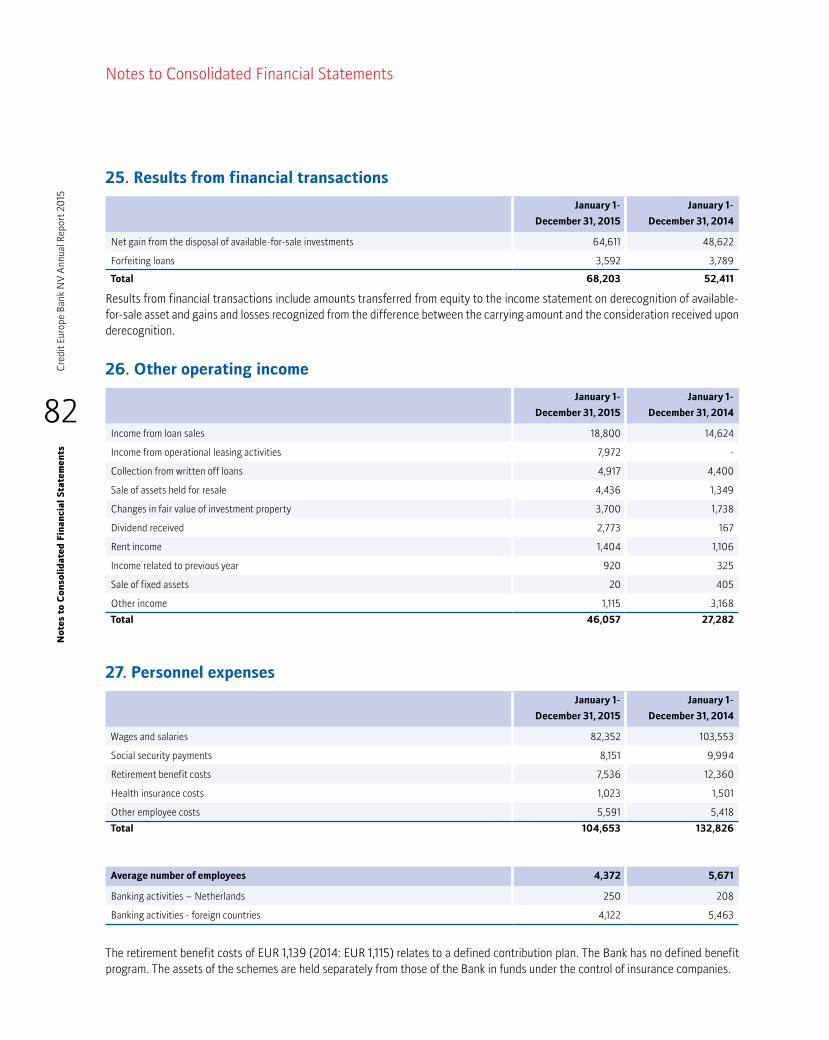
82
Cre
dit E
urop
e Ba
nk N
V A
nnua
l Rep
ort 2
015
No
tes
to C
onso
lid
ated
Fin
anci
al S
tate
men
ts
Notes to Consolidated Financial Statements
25. Results from financial transactions
January 1-
December 31, 2015
January 1-
December 31, 2014
Net gain from the disposal of available-for-sale investments 64,611 48,622
Forfeiting loans 3,592 3,789
Total 68,203 52,411
Results from financial transactions include amounts transferred from equity to the income statement on derecognition of available-for-sale asset and gains and losses recognized from the difference between the carrying amount and the consideration received upon derecognition.
26. Other operating income
January 1-
December 31, 2015
January 1-
December 31, 2014
Income from loan sales 18,800 14,624
Income from operational leasing activities 7,972 -
Collection from written off loans 4,917 4,400
Sale of assets held for resale 4,436 1,349
Changes in fair value of investment property 3,700 1,738
Dividend received 2,773 167
Rent income 1,404 1,106
Income related to previous year 920 325
Sale of fixed assets 20 405
Other income 1,115 3,168
Total 46,057 27,282
27. Personnel expenses
January 1-
December 31, 2015
January 1-
December 31, 2014
Wages and salaries 82,352 103,553
Social security payments 8,151 9,994
Retirement benefit costs 7,536 12,360
Health insurance costs 1,023 1,501
Other employee costs 5,591 5,418
Total 104,653 132,826
Average number of employees 4,372 5,671
Banking activities – Netherlands 250 208
Banking activities - foreign countries 4,122 5,463
The retirement benefit costs of EUR 1,139 (2014: EUR 1,115) relates to a defined contribution plan. The Bank has no defined benefit program. The assets of the schemes are held separately from those of the Bank in funds under the control of insurance companies.
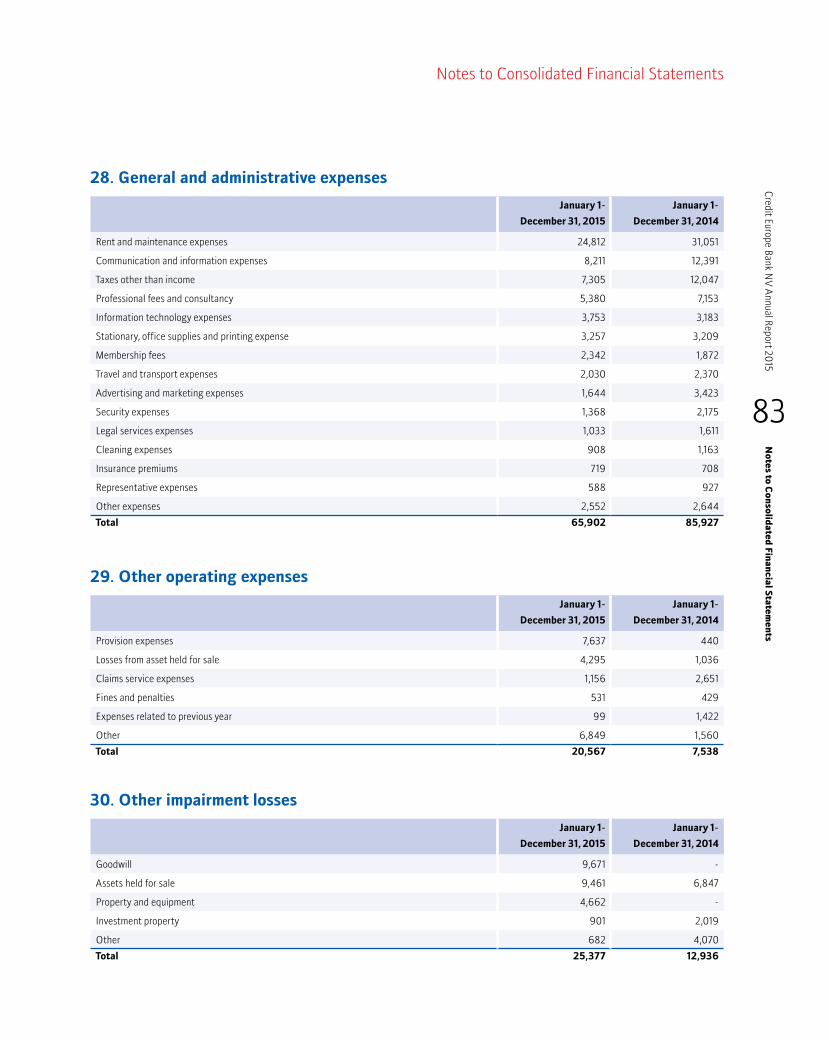
83
Credit Europe Bank N
V Annual Report 20
15N
otes to C
onsolid
ated Fin
ancial S
tatemen
ts
Notes to Consolidated Financial Statements
28. General and administrative expenses
January 1-
December 31, 2015
January 1-
December 31, 2014
Rent and maintenance expenses 24,812 31,051
Communication and information expenses 8,211 12,391
Taxes other than income 7,305 12,047
Professional fees and consultancy 5,380 7,153
Information technology expenses 3,753 3,183
Stationary, office supplies and printing expense 3,257 3,209
Membership fees 2,342 1,872
Travel and transport expenses 2,030 2,370
Advertising and marketing expenses 1,644 3,423
Security expenses 1,368 2,175
Legal services expenses 1,033 1,611
Cleaning expenses 908 1,163
Insurance premiums 719 708
Representative expenses 588 927
Other expenses 2,552 2,644
Total 65,902 85,927
29. Other operating expenses
January 1-
December 31, 2015
January 1-
December 31, 2014
Provision expenses 7,637 440
Losses from asset held for sale 4,295 1,036
Claims service expenses 1,156 2,651
Fines and penalties 531 429
Expenses related to previous year 99 1,422
Other 6,849 1,560
Total 20,567 7,538
30. Other impairment losses
January 1-
December 31, 2015
January 1-
December 31, 2014
Goodwill 9,671 -
Assets held for sale 9,461 6,847
Property and equipment 4,662 -
Investment property 901 2,019
Other 682 4,070
Total 25,377 12,936

84
Cre
dit E
urop
e Ba
nk N
V A
nnua
l Rep
ort 2
015
31. Taxation
The NetherlandsCorporate income tax is levied at the rate of 25% on the worldwide income of resident companies, which is determined by modifying accounting income for certain exclusions and allowances for tax purposes for the year 2015. A unilateral decree for the avoidance of double taxation provides relief for resident companies from Dutch tax on income, such as foreign business profits derived through a permanent establishment abroad, if no tax treaty applies. Under the Dutch taxation system, tax losses can be carried forward to be offset against future taxable income for nine years. Tax losses can be carried back to offset profits for up to one year. Companies must file their tax returns within six months following the close of the tax year to which they relate, unless the company applies for an extension (normally an additional nine months). Tax returns are open for five years from the date of final assessment of the tax return during which time the tax authorities have the right to audit tax returns, and the related accounting records on which they are based, and may issue re-assessments based on their findings. Beginning from January 1, 2007, the Bank formed a ‘fiscal unity’ with its Parent company. As a result of the fiscal unity, all profits and losses of the fiscal unity members are ‘consolidated’ for tax purposes. The main advantages of a fiscal unity are that tax losses of one company can be offset against profits of another company and assets can be transferred to another company without recognizing income at the moment of transfer.
Russian Federation The taxation system in the Russian Federation is characterised by frequent changes in legislation, official pronouncements and court decisions, which are often unclear, contradictory and subject to varying interpretation by different tax authorities. Taxes are subject to review and investigation by a number of authorities, which have the authority to impose severe fines, penalties and interest charges. A tax year remains open for review by the tax authorities during the three subsequent calendar years; however, under certain circumstances, a tax year may remain open for a longer period. Recent events in the Russian Federation suggest that the tax authorities are taking a more assertive position in their interpretation and enforcement of tax legislation Starting from 1 January 2012 new transfer pricing rules came into force in Russia. These provide the possibility for tax authorities to make transfer pricing adjustments and impose additional tax liabilities in respect of controllable transactions if their prices deviate from the market range or profitability range. According to the provisions of transfer pricing rules, the taxpayer should sequentially apply five market price determination methods prescribed by the Tax Code. Tax liabilities arising from transactions between companies are determined using actual transaction prices. It is possible, with the evolution of the interpretation of transfer pricing rules in the Russian Federation and changes in the approach of the Russian tax authorities, that such transfer prices could be challenged. Since the current Russian transfer pricing rules became effective relatively recently, the impact of any such challenge cannot be reliably estimated; however, it may be significant to the financial position and/or the overall operations of the Group. These circumstances may create tax risks in the Russian Federation that are substantially more significant than in other countries. Management believes that it has provided adequately for tax liabilities based on its interpretations of applicable Russian tax legislation, official pronouncements and court decisions. However, the interpretations of the relevant authorities could differ and the effect on the financial position of the Group, if the authorities were successful in enforcing their interpretations, could be significant.
The applicable tax rate for current tax and deferred tax is 20% (2014: 20%).
No
tes
to C
onso
lid
ated
Fin
anci
al S
tate
men
ts
Notes to Consolidated Financial Statements

85
Credit Europe Bank N
V Annual Report 20
15
Romania The applicable tax rate for current and deferred tax is 16% (2014: 16%). The Romanian Government has a number of agencies that are authorized to conduct audits (controls) of Romanian companies, as well as foreign companies doing business in Romania. These controls are similar in nature to tax audits performed by tax authorities in many countries, but may extend not only to tax matters, but to other legal and regulatory matters in which the applicable agency may be interested. The statute of limitations period in Romania is of 5 years (extended to 10 years in case tax evasion is suspected by the tax authorities). When management is aware of specific circumstances where there is the probability of fine, appropriate reserves are established for such contingencies. It is likely that the Bank’s consolidated subsidiaries in Romania will continue to be subject to controls from time to time for violations and alleged violations of existing and new laws and regulations. Although, the Bank’s consolidated subsidiaries in Romania can contest the allegations of violations and resulting penalties when management believe there is cause to do so, the adoption or implementation of laws or regulations in Romania could have a material effect on the Bank’s consolidated subsidiaries in Romania. The effective tax rate as per 31 December 2015 amounts to 16%.
Switzerland Corporate tax in Switzerland is a combination of Canton and Federal tax. Cantonal tax is levied at the effective rate of 23.36% on the net profit of the related period and at the effective rate of 0.401% on the shareholders’ equity of the related period. Federal tax is levied at the rate of 8.50% on the net profit of the related period. Since the tax expenses are tax deductible, the effective net tax rate is around 24%.
In addition to the cantonal and federal taxes, another ‘professional’ tax is levied at various effective rates on the average of the last two years’ gross revenue figures, rent expenses and number of employees.
Under the Swiss taxation system, tax losses can be carried forward to be offset against future taxable income for seven years. Companies must file their tax returns within four months following the close of the tax year to which they relate, unless the company applies for an extension. Tax returns are open for five years from the date of final assessment of the tax return, during which time the tax authorities have the right to audit tax returns, and the related accounting records on which they are based, and may issue re-assessments based on their findings.
Ukraine The applicable tax rate for corporate profit is 18% (2014: 18%). The tax amount defined by the Bank could be re-assessed by the tax authorities during the three subsequent calendar years after the date of submitting the respective tax return; however, under certain circumstances this period could be longer. Therefore, the Bank should keep its primary documents related to tax returns until the beginning of the tax audit, but for no less than three years.
Tax losses can be carried forward to be offset against future taxable income for the next taxable years after the year when this loss appeared. In case the tax losses are declared to the Tax Authority for the period of four consecutive tax years, Tax Authority gains the right to perform unscheduled audit.
Starting from 1 January 2011 new Tax Code of Ukraine was adopted that implies certain changes in tax accounting. In particular Tax code stipulates the gradual decrease in corporate income tax rates from 25% as of 1 January 2011 to 18% as of 1 January 2014.
No
tes to Con
solidated
Finan
cial Statem
ents
Notes to Consolidated Financial Statements

86
Cre
dit E
urop
e Ba
nk N
V A
nnua
l Rep
ort 2
015
No
tes
to C
onso
lid
ated
Fin
anci
al S
tate
men
ts
Notes to Consolidated Financial Statements
January 1- December 31, 2015 January 1- December 31, 2014
Effective tax rate 25.01% 7.85%
Income tax expense recognized in the income statement
Current income tax (10,221) (18,243)
Current income tax charge (9,749) (16,373)
Adjustment in respect of current income tax of previous year (472) (1,870)
Deferred income tax (5,400) 13,303
Relating to origination and reversal of temporary differences (5,400) 14,436
The effect of change in tax rate - (1,133)
Income tax reported in income statement (15,621) (4,940)
December 31, 2015 December 31, 2014
Income tax expense recognized in equity
Deferred income tax 3,306 1,105
Fair value reserve 3,559 954
Cash flow hedge (241) 183
Revaluation surplus (12) (32)
Income tax reported in equity 3,306 1,105
Reconciliation of income tax January 1- December 31, 2015 January 1- December 31, 2014
Operating profit before tax 62,471 62,951
Statutory tax rate 25% 25%At statutory income tax (15,618) (15,738)
Income not subject to tax 1,485 170
Expenditure not allowable for income tax purposes (3,935) (2,623)
Utilization of previously unrecognized deferred tax assets 8,155 6,032
Effect of different income tax rates in other countries (1,434) 4,762
Equity allocation to branches 537 2,231
Adjustment to prior years (472) (1,870)
Utilization of previously unrecognized tax losses (303) (159)
Other (4,036) 2,255
Income tax (15,621) (4,940)
December 31, 2015 December 31, 2014
Deferred Tax Assets and Liabilities Assets Liabilities Net Assets Liabilities Net
Tax losses carried forward 4,502 - 4,502 13,833 - 13,833
Loans and receivables 10,774 (4,330) 6,444 5,736 (6,409) (673)
Cash flow hedge - (173) (173) 903 - 903
Property, plant and equipment 160 (3,061) (2,901) 442 (2,381) (1,939)
General risk provision - (25,617) (25,617) - (22,813) (22,813)
Due to banks - (133) (133) - (50) (50)
Available for sale securities 348 (2,600) (2,252) 3,198 (6,081) (2,883)
Assets held for sale 3,177 - 3,177 1,462 - 1,462
Other 3,011 (2,015) 996 2,168 (1,091) 1,077
21,972 (37,929) (15,957) 27,742 (38,825) (11,083)
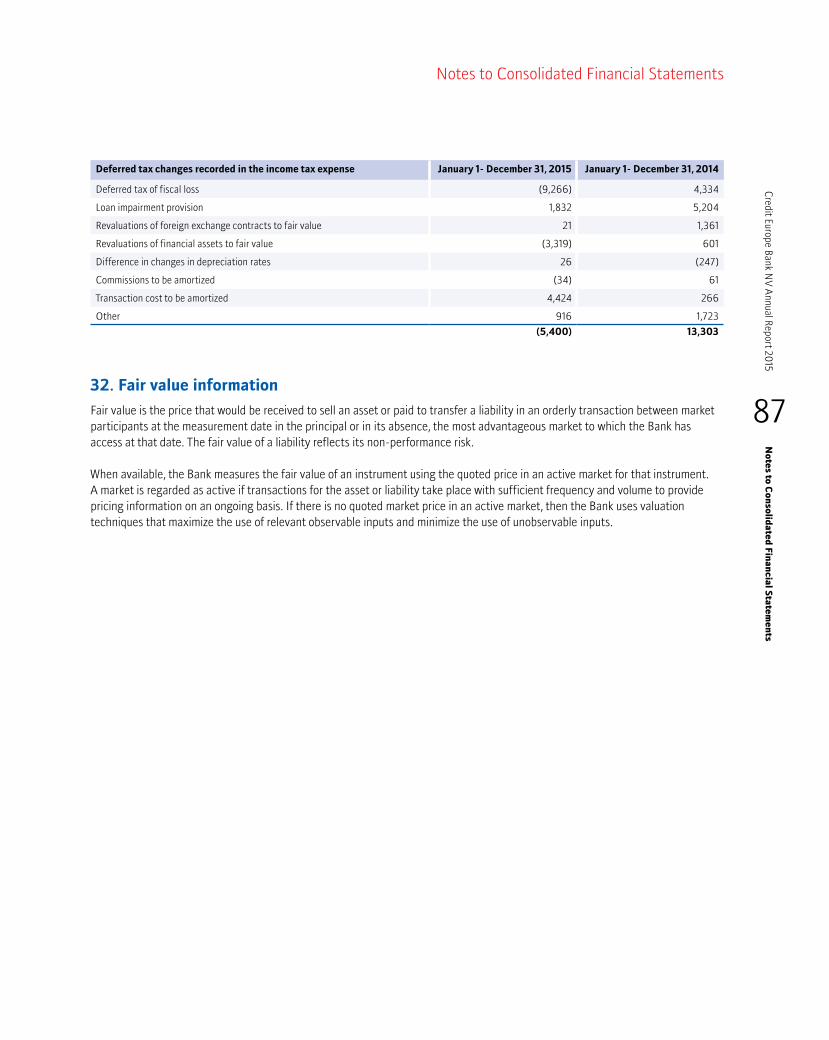
87
Credit Europe Bank N
V Annual Report 20
15N
otes to C
onsolid
ated Fin
ancial S
tatemen
ts
Notes to Consolidated Financial Statements
Deferred tax changes recorded in the income tax expense January 1- December 31, 2015 January 1- December 31, 2014
Deferred tax of fiscal loss (9,266) 4,334
Loan impairment provision 1,832 5,204
Revaluations of foreign exchange contracts to fair value 21 1,361
Revaluations of financial assets to fair value (3,319) 601
Difference in changes in depreciation rates 26 (247)
Commissions to be amortized (34) 61
Transaction cost to be amortized 4,424 266
Other 916 1,723
(5,400) 13,303
32. Fair value information
Fair value is the price that would be received to sell an asset or paid to transfer a liability in an orderly transaction between market participants at the measurement date in the principal or in its absence, the most advantageous market to which the Bank has access at that date. The fair value of a liability reflects its non-performance risk.
When available, the Bank measures the fair value of an instrument using the quoted price in an active market for that instrument. A market is regarded as active if transactions for the asset or liability take place with sufficient frequency and volume to provide pricing information on an ongoing basis. If there is no quoted market price in an active market, then the Bank uses valuation techniques that maximize the use of relevant observable inputs and minimize the use of unobservable inputs.
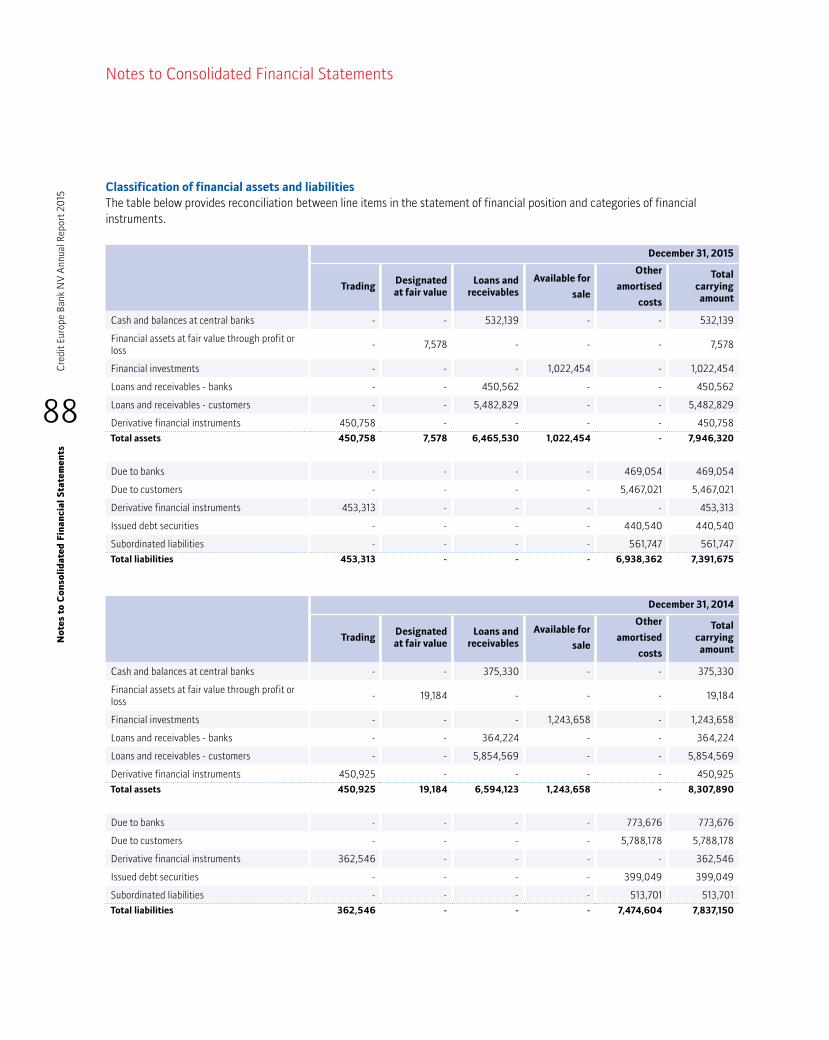
88
Cre
dit E
urop
e Ba
nk N
V A
nnua
l Rep
ort 2
015
No
tes
to C
onso
lid
ated
Fin
anci
al S
tate
men
ts
Notes to Consolidated Financial Statements
Classification of financial assets and liabilities The table below provides reconciliation between line items in the statement of financial position and categories of financial instruments.
December 31, 2015
TradingDesignated at fair value
Loans and receivables
Available for
sale
Other
amortised
costs
Total carrying amount
Cash and balances at central banks - - 532,139 - - 532,139
Financial assets at fair value through profit or loss - 7,578 - - - 7,578
Financial investments - - - 1,022,454 - 1,022,454
Loans and receivables - banks - - 450,562 - - 450,562
Loans and receivables - customers - - 5,482,829 - - 5,482,829
Derivative financial instruments 450,758 - - - - 450,758
Total assets 450,758 7,578 6,465,530 1,022,454 - 7,946,320
Due to banks - - - - 469,054 469,054
Due to customers - - - - 5,467,021 5,467,021
Derivative financial instruments 453,313 - - - - 453,313
Issued debt securities - - - - 440,540 440,540
Subordinated liabilities - - - - 561,747 561,747
Total liabilities 453,313 - - - 6,938,362 7,391,675
December 31, 2014
TradingDesignated at fair value
Loans and receivables
Available for
sale
Other
amortised
costs
Total carrying amount
Cash and balances at central banks - - 375,330 - - 375,330
Financial assets at fair value through profit or loss - 19,184 - - - 19,184
Financial investments - - - 1,243,658 - 1,243,658
Loans and receivables - banks - - 364,224 - - 364,224
Loans and receivables - customers - - 5,854,569 - - 5,854,569
Derivative financial instruments 450,925 - - - - 450,925
Total assets 450,925 19,184 6,594,123 1,243,658 - 8,307,890
Due to banks - - - - 773,676 773,676
Due to customers - - - - 5,788,178 5,788,178
Derivative financial instruments 362,546 - - - - 362,546
Issued debt securities - - - - 399,049 399,049
Subordinated liabilities - - - - 513,701 513,701
Total liabilities 362,546 - - - 7,474,604 7,837,150

89
Credit Europe Bank N
V Annual Report 20
15N
otes to C
onsolid
ated Fin
ancial S
tatemen
ts
Notes to Consolidated Financial Statements
Fair value hierarchy The fair value hierarchy consists of three levels, depending upon whether fair values are determined based on quoted prices in an active market (Level 1), valuation techniques with observable inputs (Level 2) or valuation techniques that incorporate inputs which are unobservable and which have significant impact on the fair value of the instrument (Level 3):Valuation ModelsThe Bank measures fair values using the following fair value hierarchy, which reflects the significance of the inputs used in making the measurements.
• Level 1: This category includes inputs that are quoted market prices (unadjusted) in active markets for identical instruments. These are instruments where the fair value can be determined directly from prices which are quoted in active, liquid markets and where the instrument observed in the market is representative of that being priced in the Bank’s portfolio.
• Level 2: This category includes inputs other than quoted prices included within Level 1 that are observable either directly (i.e. as prices) or indirectly (i.e. derived from prices). This category includes instruments valued using: quoted market prices in active markets for similar instruments; quoted prices for identical or similar instruments in markets that are considered less than active; or other valuation techniques in which all significant inputs are directly or indirectly observable from market data.
• Level 3: This category includes all instruments where the valuation technique uses inputs based on unobservable data, which could have a significant effect on the instrument’s valuation. This category includes instruments that are valued based on quoted prices for similar instruments where significant, unobservable adjustments or assumptions are required to reflect differences between instruments. Unobservable in this context means that there is little or no current market data available from which the price at which an arm’s length transaction would be likely to occur can be derived.
The Bank uses following assumptions to estimate the fair value of financial instruments:Equity securities: Fair values of publicly traded equity securities are based on quoted market prices where available. In the case of where no quoted market is available, fair value is determined based on quoted prices for similar securities or other valuation techniques. Valuation techniques include discounted cash flow models and transaction multiple methods.
Debt securities: Fair values are based on quoted market prices, where available. Quoted market prices may be obtained from an exchange, dealer, broker, pricing service or regulatory service. If quoted prices in an active market are not available, fair value is based on an analysis of available market inputs, which may include values obtained from one or more pricing services or by a valuation technique that discounts expected future cash flows using a market interest rate curves, referenced credit spreads and maturity of the investment.
Derivative assets and liabilities: Derivatives are valued using valuation techniques. The valuation techniques and inputs depend on the type of derivative and the nature of the underlying instruments. Observable prices or model inputs are usually available in the market for exchange-traded derivatives and simple over-the-counter derivatives. Availability of observable market prices and model inputs reduces the need for management judgement and estimation and also reduces the uncertainty associated with determining fair values. The principal techniques used to value these instruments are based on discounted cash flows, Black-Scholes option models and Monte Carlo simulation. These valuation models calculate the present value of expected future cash flows. Inputs to valuation models are determined from observable market data where possible. The inputs used include prices available from exchanges, dealers, brokers or providers of consensus pricing, yield curves, credit spreads, default rates, recovery rates, volatility of underlying interest rates, equity prices and foreign currency exchange rates. These inputs are determined with reference to quoted prices, recently executed trades, independent market quotes, where available.
Fair value estimates obtained from models are adjusted for any other factors, such as liquidity risk or model uncertainties; to the extent that the Bank believes that a third party market participant would take them into account in pricing a transaction. Fair values reflect the credit risk of the instrument and include adjustments to take account of the credit risk of the Bank entity and the counterparty where appropriate. For measuring derivatives, fair values take into account both credit valuation adjustments (CVA) and debit valuation adjustments (DVA). In assessing the counterparty risk the Bank accounts for the following aspects: the default probability of the counterparty, the default probability of the Bank itself, the nature of transactions and the impact of risk mitigants such as netting and collateralisation for each counterparty individually.
90
Cre
dit E
urop
e Ba
nk N
V A
nnua
l Rep
ort 2
015
No
tes
to C
onso
lid
ated
Fin
anci
al S
tate
men
ts
Notes to Consolidated Financial Statements
Loans to customers designated as available for sale: Fair values of loans are determined by reference to similar instruments trading in active markets and valuation models where all inputs are observable. These models calculate the present value of expected future cash flows. The inputs used include prices available from dealers, brokers or providers of consensus pricing, yield rates and currency exchange rates.
Valuation frameworkThe Bank has an established control framework with respect to the measurement of fair values. This framework includes a Product Control function, which is independent of front office management and reports to the Chief Financial Officer, and which has overall responsibility for independently verifying the results of trading and investment operations and all significant fair value measurements. Specific controls include:• verification of observable pricing;• re-performance of model valuations;• analysis and investigation of significant daily valuation movements
When third party confirmation, such as broker quotes or pricing services, is used to measure fair value, Product Control assesses and documents the evidence obtained from the third parties to support the conclusion that such valuations meet the requirements of IFRS. This includes:• verifying that the broker or pricing service is approved by the Bank for use in pricing the relevant type of financial instrument;• understanding how the fair value has been arrived at and the extent to which it represents actual market transactions;• when prices for similar instruments are used to measure fair value, how these prices have been adjusted to reflect the
characteristics of the instrument subject to the measurement; and• if a number of quotes for the same financial instrument have been obtained, then how fair value has been determined using these
quotes.
Significant valuation issues are reported to the Asset Liability Committee (ALCO).
Level 3 Financial assets and liabilitiesSecurity fair value measurements using significant inputs that are unobservable in the market due to limited activity or a less liquid market are classified as Level 3 in the fair value hierarchy. Such measurements include securities valued using internal models or a combination of multiple valuation techniques, such as weighting of internal models and vendor or broker pricing, where the unobservable inputs are significant to the overall fair value measurement. As of 31 December 2015, securities classified as Level 3 include certain diversified payment rights securities.During 2015, EUR 14,806 securities were transferred out of Level 3 to Level 2 due to change in inputs used in measuring the fair value of the assets. As of December 31, 2015 these assets are valued based on unadjusted price quotes in a non-active market. Loans and receivable classified under Level 3 consist of trading loans valued using discounted cash flow technique that incorporate brokers’ quotes as indicative value with no attached commitment to transact at that price.Changes in the unobservable inputs used in the valuation of Level 3 financial assets would not have a significant impact on equity and net income.
ReconciliationThe following table shows a reconciliation from the beginning balances to the ending balances for fair value measurements in the Level 3 of the fair value hierarchy.

91
Credit Europe Bank N
V Annual Report 20
15N
otes to C
onsolid
ated Fin
ancial S
tatemen
ts
Notes to Consolidated Financial Statements
December 31, 2015 December 31, 2014
Financial
Investments - AFS
Financial Investments - Loans and
receivable
Total
Financial
Investments
- AFS
Financial
Investments
- Loans and
receivable
Total
Balance at January 1 14,929 187,022 201,951 13,163 180,826 193,989
Total gains and losses
- in net trading income - 3,592 3,592 1,766 3,789 5,555
- in OCI - (97) (97) - (345) (345)
Purchases 30,397 1,015,319 1,045,716 - 1,007,575 1,007,575
Settlements - (1,052,991) (1,052,991) - (1,004,823) (1,004,823)
Transfers (14,806) - (14,806) - - -
Balance at year end 30,520 152,845 183,365 14,929 187,022 201,951
Financial instruments measured at fair value The table below analyses financial instruments measured at fair value, by the level in the fair value hierarchy into which the fair value measurement is categorized. The amounts are based on the values recognized in the statement of financial position.
December 31, 2015 Note Level 1 Level 2 Level 3 Total
Financial assets
Trading assets 6 6,617 961 - 7,578
Derivative assets held for risk management and trading 11 - 450,758 - 450,758
Financial investments 7 763,048 76,041 183,365 1,022,454 Total 769,665 527,760 183,365 1,480,790
Financial liabilities
Derivative assets held for risk management 11 - 453,313 - 453,313 Total - 453,313 - 453,313
December 31, 2014 Note Level 1 Level 2 Level 3 Total
Financial assets
Trading assets 6 19,184 - - 19,184
Derivative assets held for risk management
and trading11 - 450,925 - 450,925
Financial investments 7 994,634 47,073 201,951 1,243,658
Total 1,013,818 497,998 201,951 1,713,767
Financial liabilities
Derivative assets held for risk management 11 - 362,546 - 362,546 Total - 362,546 - 362,546
No securities were transferred from Level 1 to Level 2 of the fair value hierarchy in 2015.
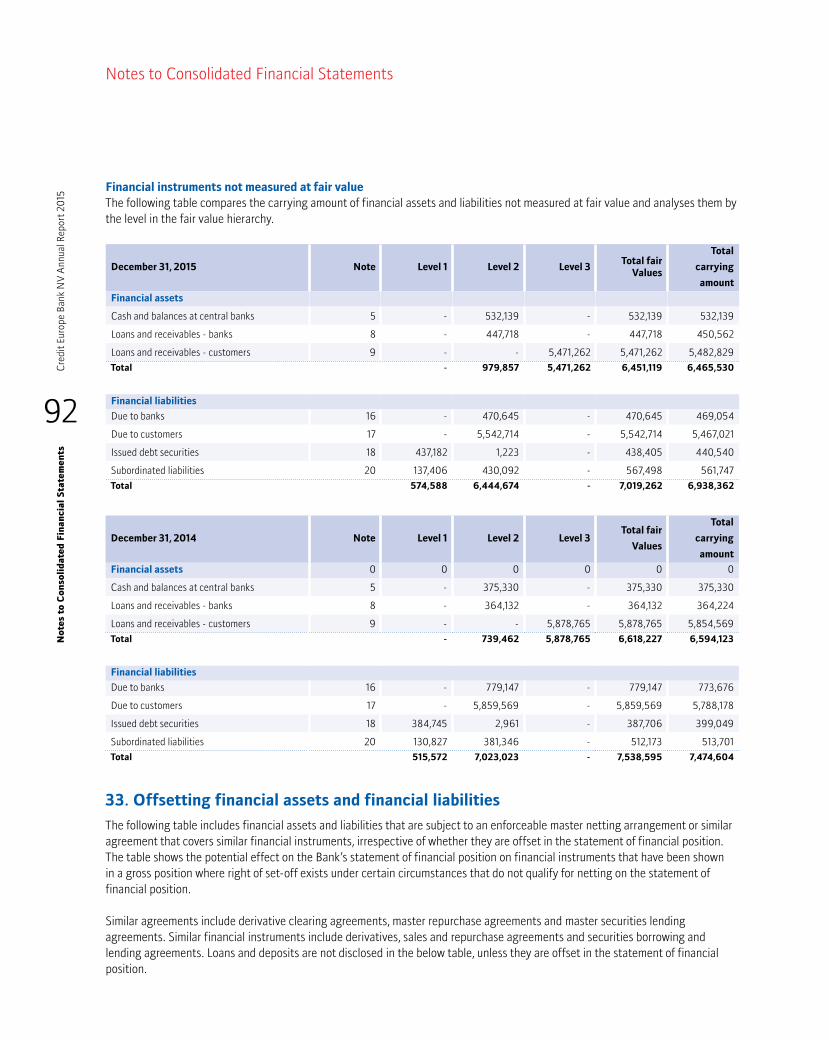
92
Cre
dit E
urop
e Ba
nk N
V A
nnua
l Rep
ort 2
015
No
tes
to C
onso
lid
ated
Fin
anci
al S
tate
men
ts
Notes to Consolidated Financial Statements
Financial instruments not measured at fair value The following table compares the carrying amount of financial assets and liabilities not measured at fair value and analyses them by the level in the fair value hierarchy.
December 31, 2015 Note Level 1 Level 2 Level 3Total fair
Values
Total
carrying
amount
Financial assets
Cash and balances at central banks 5 - 532,139 - 532,139 532,139
Loans and receivables - banks 8 - 447,718 - 447,718 450,562
Loans and receivables - customers 9 - - 5,471,262 5,471,262 5,482,829
Total - 979,857 5,471,262 6,451,119 6,465,530
Financial liabilities
Duetobanks 16 - 470,645 - 470,645 469,054
Due to customers 17 - 5,542,714 - 5,542,714 5,467,021
Issued debt securities 18 437,182 1,223 - 438,405 440,540
Subordinated liabilities 20 137,406 430,092 - 567,498 561,747
Total 574,588 6,444,674 - 7,019,262 6,938,362
December 31, 2014 Note Level 1 Level 2 Level 3Total fair
Values
Total
carrying
amount
Financial assets 0 0 0 0 0 0
Cash and balances at central banks 5 - 375,330 - 375,330 375,330
Loans and receivables - banks 8 - 364,132 - 364,132 364,224
Loans and receivables - customers 9 - - 5,878,765 5,878,765 5,854,569
Total - 739,462 5,878,765 6,618,227 6,594,123
Financial liabilities
Duetobanks 16 - 779,147 - 779,147 773,676
Due to customers 17 - 5,859,569 - 5,859,569 5,788,178
Issued debt securities 18 384,745 2,961 - 387,706 399,049
Subordinated liabilities 20 130,827 381,346 - 512,173 513,701
Total 515,572 7,023,023 - 7,538,595 7,474,604
33. Offsetting financial assets and financial liabilities
The following table includes financial assets and liabilities that are subject to an enforceable master netting arrangement or similar agreement that covers similar financial instruments, irrespective of whether they are offset in the statement of financial position. The table shows the potential effect on the Bank’s statement of financial position on financial instruments that have been shown in a gross position where right of set-off exists under certain circumstances that do not qualify for netting on the statement of financial position.
Similar agreements include derivative clearing agreements, master repurchase agreements and master securities lending agreements. Similar financial instruments include derivatives, sales and repurchase agreements and securities borrowing and lending agreements. Loans and deposits are not disclosed in the below table, unless they are offset in the statement of financial position.
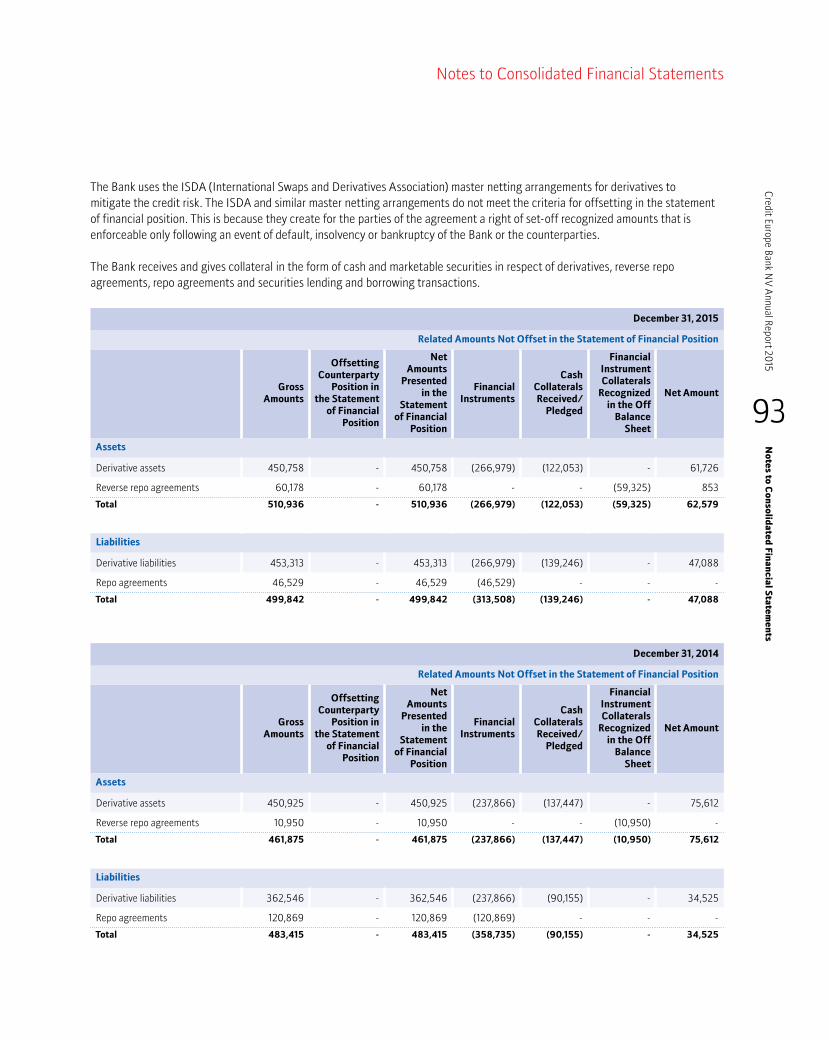
93
Credit Europe Bank N
V Annual Report 20
15N
otes to C
onsolid
ated Fin
ancial S
tatemen
ts
Notes to Consolidated Financial Statements
The Bank uses the ISDA (International Swaps and Derivatives Association) master netting arrangements for derivatives to mitigate the credit risk. The ISDA and similar master netting arrangements do not meet the criteria for offsetting in the statement of financial position. This is because they create for the parties of the agreement a right of set-off recognized amounts that is enforceable only following an event of default, insolvency or bankruptcy of the Bank or the counterparties.
The Bank receives and gives collateral in the form of cash and marketable securities in respect of derivatives, reverse repo agreements, repo agreements and securities lending and borrowing transactions.
December 31, 2015
Related Amounts Not Offset in the Statement of Financial Position
Gross
Amounts
Offsetting Counterparty
Position in the Statement
of Financial Position
Net Amounts
Presented in the
Statement of Financial
Position
Financial Instruments
Cash Collaterals Received/
Pledged
Financial Instrument Collaterals
Recognized in the Off
Balance Sheet
Net Amount
Assets
Derivative assets 450,758 - 450,758 (266,979) (122,053) - 61,726
Reverse repo agreements 60,178 - 60,178 - - (59,325) 853
Total 510,936 - 510,936 (266,979) (122,053) (59,325) 62,579
Liabilities
Derivative liabilities 453,313 - 453,313 (266,979) (139,246) - 47,088
Repo agreements 46,529 - 46,529 (46,529) - - -
Total 499,842 - 499,842 (313,508) (139,246) - 47,088
December 31, 2014
Related Amounts Not Offset in the Statement of Financial Position
Gross
Amounts
Offsetting Counterparty
Position in the Statement
of Financial Position
Net Amounts
Presented in the
Statement of Financial
Position
Financial Instruments
Cash Collaterals Received/
Pledged
Financial Instrument Collaterals
Recognized in the Off
Balance Sheet
Net Amount
Assets
Derivative assets 450,925 - 450,925 (237,866) (137,447) - 75,612
Reverse repo agreements 10,950 - 10,950 - - (10,950) -
Total 461,875 - 461,875 (237,866) (137,447) (10,950) 75,612
Liabilities
Derivative liabilities 362,546 - 362,546 (237,866) (90,155) - 34,525
Repo agreements 120,869 - 120,869 (120,869) - - -
Total 483,415 - 483,415 (358,735) (90,155) - 34,525

94
Cre
dit E
urop
e Ba
nk N
V A
nnua
l Rep
ort 2
015
No
tes
to C
onso
lid
ated
Fin
anci
al S
tate
men
ts
Notes to Consolidated Financial Statements
34. Commitments and contingencies
To meet the financial needs of customers, the Bank issues various irrevocable commitments and contingent liabilities. Even though these obligations may not be recognized on the statement of financial position, they do contain credit risk and are, therefore, part of the overall risk of the Bank. In many instances, the amount recognized on the statement of financial position for incurred obligations does not represent the loss potential of the arrangement in full.
Letters of credit, guarantees and acceptances commit the Bank to make payments on behalf of customers, contingent on the failure of the customer to perform under the terms of the contract. Guarantees carry the same credit risk as loans. Credit guarantees can be in the form of bills of exchange, irrevocable letters of credit, advance payment guarantees, or endorsement liabilities from bills rediscounted.
Commitments to extend credit represent contractual commitments to make loans and revolving credits. Commitments generally have fixed expiration dates, or other termination clauses. Since commitments may expire without being drawn upon, the total contract amounts do not necessarily represent future cash requirements. With respect to credit risk on commitments to extend the credit, the Bank is potentially exposed to loss in an amount equal to the total unused commitments. However, the likely amount of loss is less than the total unused commitments since most commitments to extend credit are contingent upon customers maintaining specific standards. The Bank monitors the term to maturity of credit commitments because longer-term commitments generally have a greater degree of credit risk than shorter-term commitments.
January 1- December
31, 2015
January 1- December
31, 2014
Contingent liabilities with respect to irrevocable letters of credit - import 244,506 302,816
Contingent liabilities with respect to letters of guarantee granted - corporates 68,712 90,900
Contingent liabilities with respect to irrevocable letters of credit - export 53,988 24,327
Contingent liabilities with respect to letters of guarantee granted - banks 33,159 29,243
Contingent liabilities with respect other guarantees 671 841
Total non-cash loans 401,036 448,127
Revocable credit-line commitments 381,441 509,171
Credit-card limits 307,984 535,677
Total 1,090,461 1,492,975
Litigation claimsLitigation is a common occurrence in the banking industry due to the nature of the business. The Bank has an established protocol for dealing with such legal claims. Once professional advice has been obtained and the amount of damages reasonably estimated, the Bank makes adjustments to account for any adverse effects the claims might have on its financial standing.
As at 31 December 2015, the Bank’s subsidiary, Credit Europe Bank (Romania) S.A., is involved in number of litigations regarding abusive clauses in consumer contracts., for which provision at amount of EUR 7,592 is already provided for in the consolidated statement of financial position. Additionally, Credit Europe Bank (Romania) S.A. performed a comprehensive assessment for the entire retail loan portfolio in order to determine the maximum exposure to risk in respect of potential litigations to be initiated by customers. As result, as at 31 December 2015, the Bank recognized a contingent liability at amount of EUR 12,353.

95
Credit Europe Bank N
V Annual Report 20
15N
otes to C
onsolid
ated Fin
ancial S
tatemen
ts
Notes to Consolidated Financial Statements
Lease commitmentsThe Bank leases a number of buildings and cars under operating leases. Non-cancellable operating lease rentals are payable as follows:
Operating lease commitment - bank as lessee and rent commitments December 31, 2015 December 31, 2014
Not later than 1 year 8,578 11,742
Later than 1 year and not later than 5 years 12,417 16,387
Total 20,995 28,129
Operating lease commitment - bank as lessor December 31, 2015 December 31, 2014
Not later than 1 year 7,568 -
Later than 1 year and not later than 5 years 8,467 -
Total 16,035 -
The Bank leases a number of premises and equipment under operating lease. The leases typically run for an initial period of one to five years, with an option to renew the lease after that date. Lease payments are usually changed annually to reflect market rentals. None of the leases includes contingent rentals.
During the current year EUR 20,431 was recognized as an expense in the statement of income in respect of operating leases (2014: EUR 15,382).
35. Related parties
TheBank’sParentCompanyisCreditEuropeGroupN.V.,TheNetherlands,andtheUltimateParentCompanyisFIBAHoldingA.Ş.,Turkey,bothultimatelycontrolledbyasingleindividual,Mr.HüsnüÖzyeğin.
Parties are considered related if one party has the ability to control the other party or exercise significant influence over the other party in financial and operating decisions. The Bank enters into transactions with its Parent company, ultimate parent company and otherrelatedpartiescontrolledbyMr.HüsnüÖzyeğinintheordinarycourseofbusinessatcommercialinterestandcommissionrates. The Bank provides general banking services to related parties including current accounts, time deposits, fx transactions, fiduciary transactions, brokerage activities and custodian services. All loans and advances to related parties are performing advances, and are free of any provision for possible credit losses.
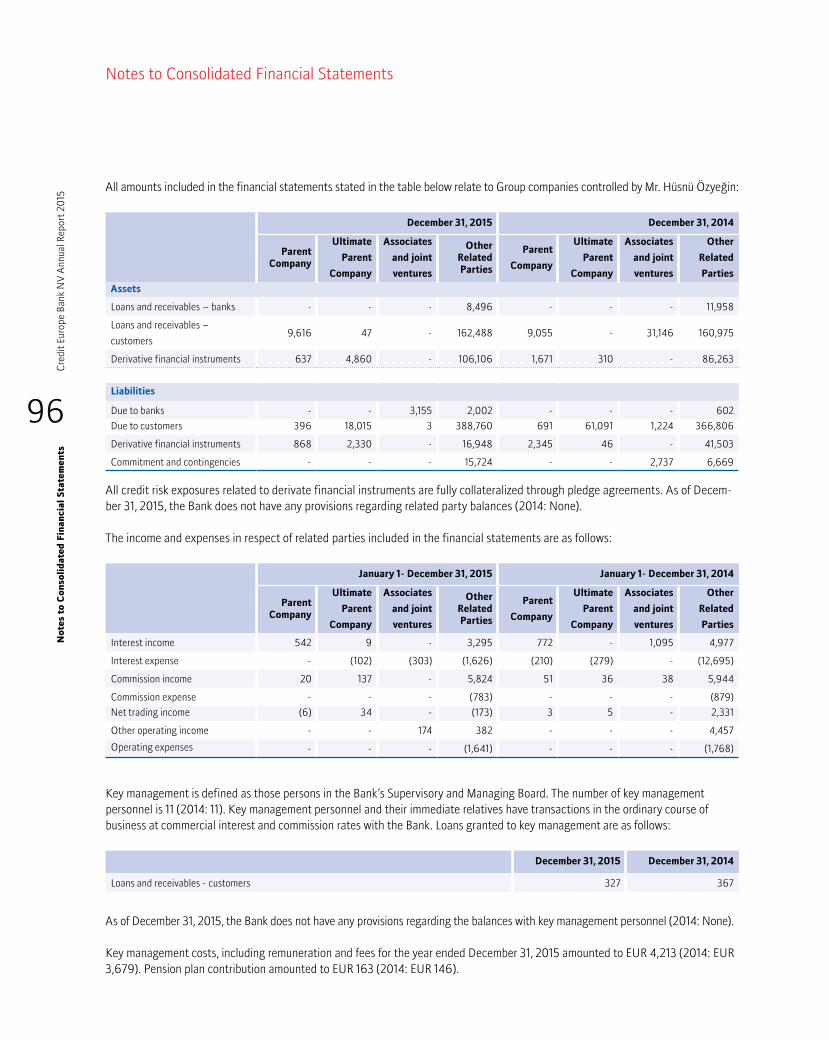
96
Cre
dit E
urop
e Ba
nk N
V A
nnua
l Rep
ort 2
015
No
tes
to C
onso
lid
ated
Fin
anci
al S
tate
men
ts
Notes to Consolidated Financial Statements
AllamountsincludedinthefinancialstatementsstatedinthetablebelowrelatetoGroupcompaniescontrolledbyMr.HüsnüÖzyeğin:
December 31, 2015 December 31, 2014
Parent
Company
Ultimate
Parent
Company
Associates
and joint
ventures
Other Related Parties
Parent
Company
Ultimate
Parent
Company
Associates
and joint
ventures
Other
Related
Parties
Assets
Loans and receivables – banks - - - 8,496 - - - 11,958
Loans and receivables –
customers9,616 47 - 162,488 9,055 - 31,146 160,975
Derivative financial instruments 637 4,860 - 106,106 1,671 310 - 86,263
Liabilities
Due to banks - - 3,155 2,002 - - - 602
Duetocustomers 396 18,015 3 388,760 691 61,091 1,224 366,806
Derivative financial instruments 868 2,330 - 16,948 2,345 46 - 41,503
Commitment and contingencies - - - 15,724 - - 2,737 6,669
Allcreditriskexposuresrelatedtoderivatefinancialinstrumentsarefullycollateralizedthroughpledgeagreements.AsofDecem-ber31,2015,theBankdoesnothaveanyprovisionsregardingrelatedpartybalances(2014:None).
Theincomeandexpensesinrespectofrelatedpartiesincludedinthefinancialstatementsareasfollows:
January 1- December 31, 2015 January 1- December 31, 2014
Parent
Company
Ultimate
Parent
Company
Associates
and joint
ventures
Other Related Parties
Parent
Company
Ultimate
Parent
Company
Associates
and joint
ventures
Other
Related
Parties
Interest income 542 9 - 3,295 772 - 1,095 4,977
Interest expense - (102) (303) (1,626) (210) (279) - (12,695)
Commission income 20 137 - 5,824 51 36 38 5,944
Commission expense - - - (783) - - - (879)
Nettradingincome (6) 34 - (173) 3 5 - 2,331
Other operating income - - 174 382 - - - 4,457
Operatingexpenses - - - (1,641) - - - (1,768)
Key management is defined as those persons in the Bank’s Supervisory and Managing Board. The number of key management personnel is 11 (2014: 11). Key management personnel and their immediate relatives have transactions in the ordinary course of business at commercial interest and commission rates with the Bank. Loans granted to key management are as follows:
December 31, 2015 December 31, 2014
Loans and receivables - customers 327 367
As of December 31, 2015, the Bank does not have any provisions regarding the balances with key management personnel (2014: None).
Key management costs, including remuneration and fees for the year ended December 31, 2015 amounted to EUR 4,213 (2014: EUR 3,679). Pension plan contribution amounted to EUR 163 (2014: EUR 146).

97
Credit Europe Bank N
V Annual Report 20
15N
otes to C
onsolid
ated Fin
ancial S
tatemen
ts
Notes to Consolidated Financial Statements
36. Intra-Group balances
Intra-group balances that are eliminated during consolidation process:
December 31, 2015 December 31, 2014
Assets
Financial investments 56,157 104,303
Loans and receivables - banks(*) 412,255 480,158
Loans and receivables – customers 171,455 159,576
Derivative financial instruments 84,815 13,084
Other assets 62 1,057
Liabilities
Due to banks 579,101 639,414
Due to customers 4,609 2,823
Derivative financial instruments 84,815 13,084
Issued debt securities 34,949 35,904
Subordinated liabilities 21,208 65,896
Other liabilities 62 1,057
Commitments and contingencies 40,156 74,353
January 1- December
31, 2015
January 1- December
31, 2014
Interest income 58,429 57,384
Interest expense (58,429) (57,384)
Commission income 4,260 4,204
Commission expense (4,260) (4,204)
(*) Includes EUR 2,794 exposure fully collateralized by securities (2014: EUR 15,562).
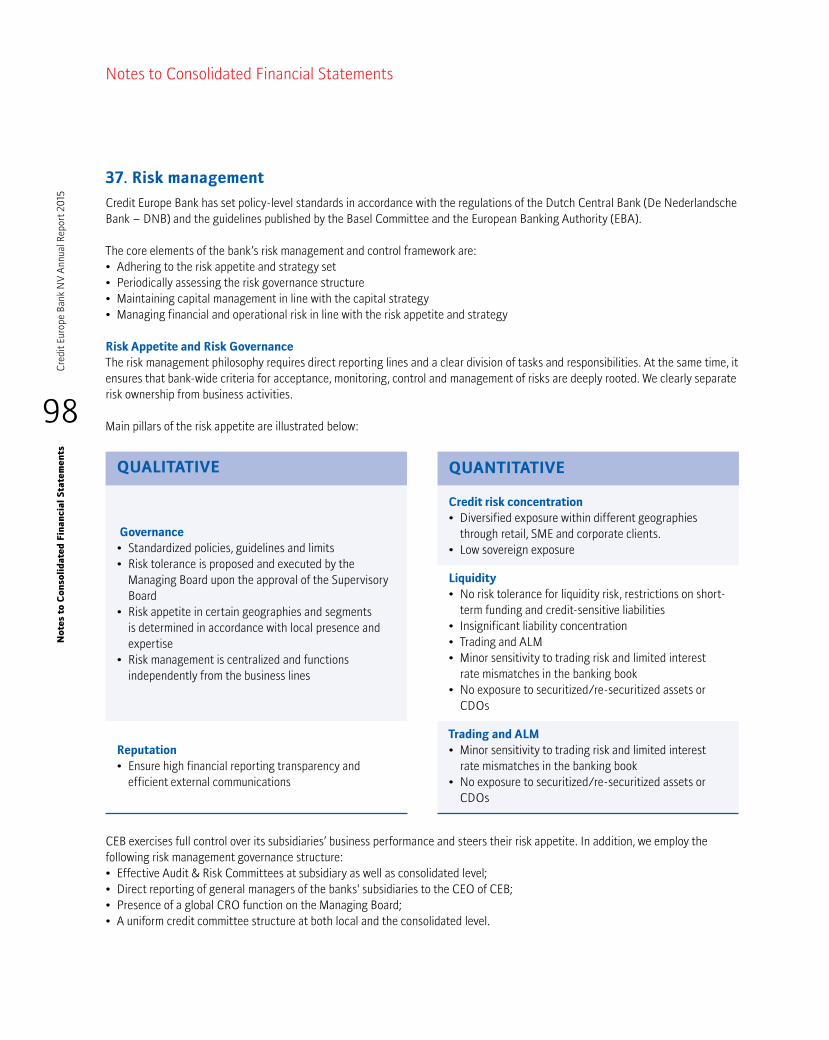
98
Cre
dit E
urop
e Ba
nk N
V A
nnua
l Rep
ort 2
015
No
tes
to C
onso
lid
ated
Fin
anci
al S
tate
men
ts
Notes to Consolidated Financial Statements
37. Risk management
Credit Europe Bank has set policy-level standards in accordance with the regulations of the Dutch Central Bank (De Nederlandsche Bank – DNB) and the guidelines published by the Basel Committee and the European Banking Authority (EBA).
The core elements of the bank’s risk management and control framework are:• Adhering to the risk appetite and strategy set• Periodically assessing the risk governance structure• Maintaining capital management in line with the capital strategy • Managing financial and operational risk in line with the risk appetite and strategy
Risk Appetite and Risk GovernanceThe risk management philosophy requires direct reporting lines and a clear division of tasks and responsibilities. At the same time, it ensures that bank-wide criteria for acceptance, monitoring, control and management of risks are deeply rooted. We clearly separate risk ownership from business activities.
Main pillars of the risk appetite are illustrated below:
QUALITATIVE QUANTITATIVE
Governance• Standardized policies, guidelines and limits• Risk tolerance is proposed and executed by the
Managing BoardupontheapprovaloftheSupervisoryBoard
• Risk appetite in certain geographies and segments is determinedinaccordancewithlocalpresenceandexpertise
• Riskmanagementiscentralizedandfunctionsindependentlyfromthebusinesslines
Credit risk concentration• Diversified exposure within different geographies
through retail, SME and corporate clients. • Low sovereign exposure
Liquidity• No risk tolerance for liquidity risk, restrictions on short-
term funding and credit-sensitive liabilities• Insignificant liability concentration• Trading and ALM• Minor sensitivity to trading risk and limited interest
rate mismatches in the banking book• No exposure to securitized/re-securitized assets or
CDOs
Reputation• Ensure high financial reporting transparency and
efficient external communications
Trading and ALM• Minor sensitivity to trading risk and limited interest
rate mismatches in the banking book• No exposure to securitized/re-securitized assets or
CDOs
CEB exercises full control over its subsidiaries’ business performance and steers their risk appetite. In addition, we employ the following risk management governance structure:• Effective Audit & Risk Committees at subsidiary as well as consolidated level;• Direct reporting of general managers of the banks' subsidiaries to the CEO of CEB;• Presence of a global CRO function on the Managing Board;• A uniform credit committee structure at both local and the consolidated level.
99
Credit Europe Bank N
V Annual Report 20
15N
otes to C
onsolid
ated Fin
ancial S
tatemen
ts
Notes to Consolidated Financial Statements
The Audit and Risk Committee (ARC) at the consolidated level plays a pivotal role in CEB’s risk governance framework. ARC meets 4 times a year and receives regular reports and updates on the Bank’s actual risk appetite with respect to the approved risk appetite statement. The Committee reviews and monitors the limits for individual types of risks and takes decisions whether principal risks have been properly identified and are being appropriately managed. ARC also makes assessments on the existing risk management capacity / know-how of the Bank and raises action items / investment plans –where necessary- to reach the desired level.
In line with the ARC recommendations we continued to invest in the Bank’s risk management systems in 2014, including but not limited to the streamlining of the credit process, particularly with regard to capital planning, and implementing integrated stress testing tools.
Capital ManagementA capital level commensurate with the Bank’s risk profile is the key to financial resilience. CEB operates with an optimum level and mix of capital resources. A centralized regulatory/internal capital management model plays a major role in this process. The internal capital model incorporates detailed scenario analyses of key risk factors and their potential effects on income statement and the Bank’s capital base under different assumptions. This framework is designed to ensure CEB has sufficient capital resources to meet the capital requirements of DNB, as well as those of local regulators in our operating countries.
It further ensures that we have capital available to meet our own risk appetite and internal guidelines. We place great emphasis on the strength of our capital base as a way to maintain investor, creditor and market confidence, and to sustain future business development.
CEB allocates assets in accordance with the risk-return thresholds defined in our risk appetite statement. Business units are required to fully understand the inherent risk-reward profile of their business and to generate a specific level of return on regulatory/internal capital requirements. The CEB risk strategy has proved its value, not only by providing consistently strong financial results, but also by yielding consistently robust returns on equity.
The Bank’s capital-management objectives are to:• Maintain sufficient capital resources to meet the DNB’s minimum regulatory capital requirements.• Ensure that locally regulated subsidiaries can meet their minimum capital requirements.• Achieve adequate capital levels to support the bank’s risk appetite and internal capital requirements.• Maintain a strong capital base to reassure investors, creditors and markets, and to sustain future business development.
To support its capital-management objectives, the Bank takes into account:• Possible volatility in anticipated demand for capital caused by new business opportunities, including acquisitions, or by
deterioration in the credit quality of the Bank’s assets• Possible volatility of reported profits and other capital resources compared with forecast.• Capital ratio sensitivity to foreign-exchange-rate movements. Regulatory CapitalStarting from January 1, 2015, CEB and all its subsidiaries are subject to CRD IV (Capital Requirement Derivative) rules: • Directive 2013/36/EU of the European Parliament and of the Council of 26 June 2013 on access to the activity of credit
institutions and the prudential supervision of credit institutions and investment firms, amending Directive 2002/87/EC and repealing Directives 2006/48/EC and 2006/49/EC
• Regulation (EU) no 575/2013 of the European Parliament and of the Council of 26 June 2013 on prudential requirements for credit institutions and investment firms and amending Regulation (EU) No 648/2012
The Bank applies the standardized approach for credit risk, market risks and operational risk. Banks are expected to meet the capital-requirements constraints imposed by the Basel III accord.

100
Cre
dit E
urop
e Ba
nk N
V A
nnua
l Rep
ort 2
015
No
tes
to C
onso
lid
ated
Fin
anci
al S
tate
men
ts
Notes to Consolidated Financial Statements
The Bank’s total own funds consist of Core Tier I capital (also named as common Equity Tier I, CET 1), Additional Tier I capital (AT 1) and Tier II capital. The various elements making up both components are presented in the table below:
December 31, 2015 December 31, 2014
Total Equity 882,361 786,081
• Current year profit (1) (46,814) (58,032)
• Eligible 1st half year profit after approval - 41,027
• Non-eligible minority interest (2) (1,111) (1,121)
• Deductions from revaluation Reserve - AFS (201) 12,716
Prudential filters
• Cash flow hedge reserve (643) 173
• Prudent valuation (1,598) (1,707)
• Intangible asset (2) (19,725) (27,837)
• Deferred tax assets that rely on future profitability and do not arise from temporary
differences (2)(1,801) (2,628)
• transitional adjustments to CET1 Capital (3) 80 (2,544)
Core Tier I 810,548 746,128
Perpetual Tier I capital - -
Additional Tier I - -
Total Tier I capital 810,548 746,128
Tier II capital
Subordinated capital 413,337 370,644
Total Tier II capital 413,337 370,644
Total own funds 1,223,885 1,116,772
(1) Current year profit is excluded from total own funds based on article 26, point 2 of CRR IV
(2) Under CRD IV frame, additional items listed below shall be deducted fully by 31 December 2018 to enhance own funds quality:
• Non-eligible minority interest
• Other intangible asset (Non-solvency deductible under Basel II framework)
• Deferred tax assets that rely on future profitability and do not arise from temporary differences
(3) Transitional adjustment is permitted to apply the calculation referred in article 473 (2) and (3) of CRD IV by deducting fully under prudential filter and
adding 60% back to total own funds

101
Credit Europe Bank N
V Annual Report 20
15N
otes to C
onsolid
ated Fin
ancial S
tatemen
ts
Notes to Consolidated Financial Statements
The Bank and its individually supervised subsidiaries have complied with all externally imposed capital requirements throughout the reporting period and maintained their capital ratios above the regulatory minimum ratios.
Solvency ratio December 31, 2015 December 31, 2014
• Capital ratio 17.57% 16.69%
• Tier I ratio 11.63% 11.15%
• Core Tier I 11.63% 11.15%
RWA 6,966,729 6,691,399
Credit riskCredit risk is defined as the current or prospective threat to the bank’s earnings and capital as a result of counterparty’s failure to comply with financial or other contractual obligations.
Credit risk constitutes the most significant risk of the bank and arises mainly from its trade-finance, lending, treasury, mortgage and leasing businesses.
Concentration limitsThe bank has established maximum concentration limits –in terms of both nominal and capital consumption- over country, industry and single-name concentrations to manage concentration risk in its loan portfolio.
Credit risk is managed by following tools and principles:
Risk mitigationCEB actively uses collateral management as the major risk mitigation mechanism. Collaterals are managed and followed-up in processes fully supported by the bank’s banking system by means of collateral-transaction linkages, blocked accounts and system checking of collateralization.
In particular, specialized lending is run through on collaterals and documentation. Valuation reports, survey report updates, insurance policies management are followed up systematically. Outsourcing is also utilized by Collateral Management Agreements and Collateral Monitoring Agreements with expert collateral management agents who have the management and reporting capabilities on the site of the collateral.
CEB follows legal certainty and operational requirements as a pre-requisite for consideration risk mitigation effects of the collaterals. Legal department conducts in-depth legal review confirming the enforceability of the collateral arrangements under the law applicable to these arrangements in all relevant jurisdictions.
Collateral value should not have a material positive correlation with the credit quality of the provider. The market value of the collateral should be appraised at least annually or more often whenever there is a reason to believe that a significant decrease in its market value has occurred. Internal Rating
Models and ScorecardsCEB uses a centralized internal rating system, which is the primary tool for quantifying counterparty credit risk at the consolidated level. CEB borrower rating system employs a fundamental credit analysis supplemented by statistical models, as appropriate, in accordance with the analytical methodology.
The obligor rating framework has several building blocks to ensure that qualitative and quantitative risk drivers of corporate default are inherent in the rating process.
102
Cre
dit E
urop
e Ba
nk N
V A
nnua
l Rep
ort 2
015
No
tes
to C
onso
lid
ated
Fin
anci
al S
tate
men
ts
Notes to Consolidated Financial Statements
Since 2011, Internal Rating System model coverage has been extended with new specialized lending models, which ensure more robust estimation of initial risk parameters for transactional lending portfolios. In line with the CEB NV lending practices, seven sub-classes of specialized lending, namely structured trade finance, marine object finance, marine project (shipbuilding) finance, income producing real estate finance, real estate development finance, object finance and other project finance, are separately identified within the corporate asset class regarding the applied rating criteria.
CEB has established a centre of excellence for retail risk management responsible for scoring, risk based pricing, algorithm development, stress testing, monitoring and reporting. The centre is composed of highly skilled statisticians, bankers, econometrists, database programmers and risk managers. The team has worked in projects in several countries including Russia, Romania, Germany, Turkey and Belgium. Now through their efforts, all banking entities are taking the right risk with the right interest margin.
Stress testingThe Bank puts stress-testing and capital planning at the centre of its internal capital assessment process. The factual starting point of the capital planning process is the three year business plan which reflects the baseline assumptions on the global economy. Macroeconomic assumptions are mainly based on a survey of multiple sources to ensure objectivity and consistency. Then, the Bank identifies the potential threats to its business plan and capital adequacy based on a set of adverse scenarios.
Having a hypothetical stress testing framework, the bank’s stress-testing methodology discourages both under-and over-reliance on internal data. The magnitude of the shocks varied across different portfolios based on their expected default correlation with the systematic risks which materialize under the adverse scenario.
The bank’s credit-risk stress tests shock both default- and recovery-related risk parameters. In particular, risk concentrations in the portfolio are penalized with harsher shocks. The bank’s stress-testing methodology does not aim to make accurate forecasts of the downturns, but instead aims to capture the tail loss by simulating the unexpected and the undesirable.
37. a. Credit exposure
Maximum credit-risk exposureThe Bank identifies its maximum credit exposure as the sum of all transactions that may potentially expose the Bank to credit losses, should the counterparty not fulfil its contractual obligations. The maximum credit exposure presented in the table below comprises on- and off-balance sheet items. Credit exposure is measured without taking account of any collateral held or other credit enhancements.
Maximum credit-risk exposure, net of impairment allowancesOn-balance sheet items are presented at their gross carrying amount, gross of impairment allowances. Derivative financial instruments are assessed at fair value of future cash flows.The off-balance credit risk exposure comprises:• Letters of guarantee granted and letters of credit issued or confirmed, shown at the maximum amount that the Bank would have
to pay if the guarantees or letters of credit are called upon; and,• Undrawn credit-card limits • Revocable credit line commitments are excluded as they do not create credit risk.

103
Credit Europe Bank N
V Annual Report 20
15N
otes to C
onsolid
ated Fin
ancial S
tatemen
ts
Notes to Consolidated Financial Statements
December 31, 2015 December 31, 2014
Balance sheet items
Balances with central banks 488,048 323,587
Financial assets designated at fair value through profit or loss 7,578 19,184
Financial investments 1,022,454 1,243,658
Loans and receivables - banks 451,487 365,149
Loans and receivables - customers 5,679,469 6,063,453
Derivative financial instruments 450,758 450,925
Subtotal 8,099,794 8,465,956
Off- balance sheet items
Issued letters of guarantee 102,542 120,984
Issued irrevocable letters of credit 298,494 327,143
Undrawn credit-card limits 307,984 535,677
Total off-balance sheet* 709,020 983,804
Maximum credit risk exposure 8,808,814 9,449,760
*Excluding revocable credit line commitments.
The Bank considers items such as ‘other credit commitments and contingent liabilities’ as a part of its maximum credit risk exposure. However, these are not included in tables below since they are composed of credit facilities that are either revocable or can be cancelled unconditionally by the Bank, and therefore bear insignificant credit risk.
Concentration of credit exposureConcentration risk normally arises when number of counterparties operates in the same geographical region or within the same economic sector, and thus is affected to the same extent as economic, political and other conditions.
37.b. Sector concentration
The Bank monitors its credit exposure within the following counterparty groups: corporate customers, banks and central governments, retail customers, SME customers, and residential mortgage loans. Exposure to corporate customers is presented, broken down by industry, according to the internal sector definitions.

104
Cre
dit E
urop
e Ba
nk N
V A
nnua
l Rep
ort 2
015
No
tes
to C
onso
lid
ated
Fin
anci
al S
tate
men
ts
Notes to Consolidated Financial Statements
December 31, 2015 December 31, 2014
On-balance sheet
Off-balance sheet
Total
exposure(*)
% of total
exposureTotal
exposure(*)% of total
exposure
Exposure to central governments and financial institutions
Exposure to central governments and central banks 488,048 - 488,048 47.75% 323,587 43.84%
Exposure to financial institutions 451,487 82,525 534,012 52.25% 414,440 56.16%
Total exposure to central governments and
financial institutions939,535 82,525 1,022,060 100.00% 738,027 100.00%
Corporate exposure
Realestate 602,995 4,112 607,107 13.72% 591,986 13.83%
Construction & installation 412,053 41,874 453,927 10.23% 191,650 4.48%
Leisure & tourism 418,243 4,809 423,052 9.54% 214,045 5.00%
Shipping & shipyards 320,162 1,882 322,044 7.26% 362,303 8.48%
Iron & steel 189,540 80,735 270,275 6.09% 172,138 4.02%
Financial services & investments 243,054 2,400 245,454 5.53% 304,018 7.11%
Energy/coal 240,204 3,296 243,500 5.49% 320,269 7.49%
Oil & derivatives 123,765 100,236 224,001 5.05% 437,306 10.22%
Transportation, logistics & warehousing 151,007 2,191 153,198 3.45% 100,956 2.36%
Textile, clothing, ready-made wearing &
leather133,425 14,008 147,433 3.32% 56,982 1.33%
Petrochemical, plasticizers & derivatives 88,416 23,077 111,493 2.51% 145,705 3.41%
Retail 83,102 2,694 85,796 1.93% 73,059 1.71%
Fertilizers 73,037 55 73,092 1.65% 110,357 2.58%
Soft commodities & agricultural products 67,178 - 67,178 1.51% 116,454 2.72%
Food, beverage & tobacco 54,963 4,156 59,119 1.33% 62,015 1.45%
Building materials 52,237 - 52,237 1.18% 37,472 0.88%
Telecommunications 42,960 - 42,960 0.97% 29,864 0.70%
Media & publishing 35,050 5 35,055 0.79% 31,565 0.74%
Public loans 495,451 - 495,451 11.17% 601,519 14.06%
Other 292,512 30,421 322,933 7.28% 317,605 7.43%
Total exposure to corporate clients and
private banking4,119,354 315,951 4,435,305 100.00% 4,277,268 100.00%
Exposure to retail customers and SMEs
Exposure to retail customers 994,240 307,984 1,302,224 69.61% 2,057,700 75.63%
Exposure secured by residential real estate 472,465 - 472,465 25.26% 514,488 18.91%
Exposure to SME 93,410 2,560 95,970 5.13% 148,510 5.46%
Total exposure to retail customers and SMEs 1,560,115 310,544 1,870,659 100.00% 2,720,698 100.00%
Total credit risk exposure* 6,619,004 709,020 7,328,024 100.00% 7,735,993 100.00%
*Excluding financial assets and derivatives.
The top five industries account for 46.82% (2014: 47.13%) of the total corporate portfolio, reflecting the traditional business areas of the Bank where it possesses strong expertise and profound industry practice.

105
Credit Europe Bank N
V Annual Report 20
15N
otes to C
onsolid
ated Fin
ancial S
tatemen
ts
Notes to Consolidated Financial Statements
37.c. Geographical concentration
The following table provides the distribution of the Bank’s credit exposure by risk country as of December 31, 2015:
December 31, 2015
Russia Turkey Romania UkraineOther
emerging markets
Developed markets
Total exposure
Balance sheet items
Demand deposits with central banks 15,353 - 101,647 1,504 - 369,544 488,048
Financial assets designated at fair value through profit or loss - 472 1,372 - - 5,734 7,578
Financial investments 121,470 267,681 205,724 8,052 66,648 352,879 1,022,454
Loans and receivables - banks 77,655 46,409 19,777 473 2,272 304,901 451,487
Loans and receivables - customers 1,559,287 1,327,452 923,403 58,142 106,206 1,704,979 5,679,469
Derivative financial instruments 1,558 138,060 12 - - 311,128 450,758
Total balance sheet 1,775,323 1,780,074 1,251,935 68,171 175,126 3,049,165 8,099,794
Off-balance sheet items 225,542 135,361 124,354 261 71,162 152,340 709,020
Total credit-risk exposure 2,000,865 1,915,435 1,376,289 68,432 246,288 3,201,505 8,808,814
The following table provides the distribution of the Bank’s credit exposure by risk country as of December 31, 2014:
December 31, 2014
Russia Turkey Romania UkraineOther
emerging markets
Developed markets
Total exposure
Balance sheet items
Demand deposits with central banks 18,953 - 70,945 10,090 - 223,599 323,587
Financial assets designated at fair value through profit or loss - 2,525 1,305 - 7,346 8,008 19,184
Financial investments 178,311 374,125 283,803 9,503 12,053 385,863 1,243,658
Loans and receivables - banks 100,045 37,858 18,691 8,645 10,983 188,927 365,149
Loans and receivables - customers 2,089,224 1,054,427 949,058 77,269 46,202 1,847,273 6,063,453
Derivative financial instruments 240 79,437 309 2,138 26 368,775 450,925
Total balance sheet 2,386,773 1,548,372 1,324,111 107,645 76,610 3,022,445 8,465,956
Off-balance sheet items 473,277 79,441 113,199 806 21,613 295,468 983,804
Total credit-risk exposure 2,860,050 1,627,813 1,437,310 108,451 98,223 3,317,913 9,449,760
37.d. Collaterals and other credit enhancements obtained
The Bank’s credit policy requires that the loan extension process is conducted with strong evidence of the customer’s ability to repay the loan. Collaterals are also actively used for the purposes of credit risk mitigation. In the tables below, collaterals are aggregated into two groups:
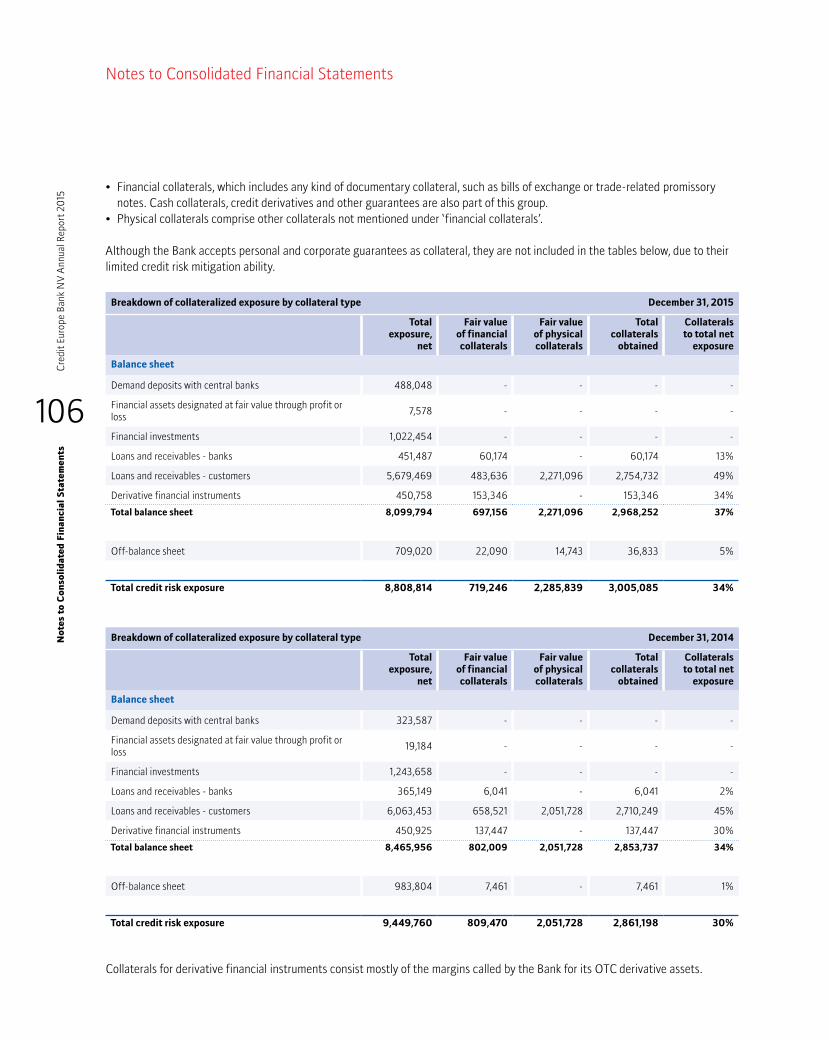
106
Cre
dit E
urop
e Ba
nk N
V A
nnua
l Rep
ort 2
015
No
tes
to C
onso
lid
ated
Fin
anci
al S
tate
men
ts
Notes to Consolidated Financial Statements
• Financial collaterals, which includes any kind of documentary collateral, such as bills of exchange or trade-related promissory notes. Cash collaterals, credit derivatives and other guarantees are also part of this group.
• Physical collaterals comprise other collaterals not mentioned under ‘financial collaterals’.
Although the Bank accepts personal and corporate guarantees as collateral, they are not included in the tables below, due to their limited credit risk mitigation ability.
Breakdown of collateralized exposure by collateral type December 31, 2015
Total
exposure, net
Fair value of financial collaterals
Fair value of physical collaterals
Total collaterals
obtained
Collaterals to total net
exposure
Balance sheet
Demand deposits with central banks 488,048 - - - -
Financial assets designated at fair value through profit or loss 7,578 - - - -
Financial investments 1,022,454 - - - -
Loans and receivables - banks 451,487 60,174 - 60,174 13%
Loans and receivables - customers 5,679,469 483,636 2,271,096 2,754,732 49%
Derivative financial instruments 450,758 153,346 - 153,346 34%
Total balance sheet 8,099,794 697,156 2,271,096 2,968,252 37%
Off-balance sheet 709,020 22,090 14,743 36,833 5%
Total credit risk exposure 8,808,814 719,246 2,285,839 3,005,085 34%
Breakdown of collateralized exposure by collateral type December 31, 2014
Total
exposure, net
Fair value of financial collaterals
Fair value of physical collaterals
Total collaterals
obtained
Collaterals to total net
exposure
Balance sheet
Demand deposits with central banks 323,587 - - - -
Financial assets designated at fair value through profit or loss 19,184 - - - -
Financial investments 1,243,658 - - - -
Loans and receivables - banks 365,149 6,041 - 6,041 2%
Loans and receivables - customers 6,063,453 658,521 2,051,728 2,710,249 45%
Derivative financial instruments 450,925 137,447 - 137,447 30%
Total balance sheet 8,465,956 802,009 2,051,728 2,853,737 34%
Off-balance sheet 983,804 7,461 - 7,461 1%
Total credit risk exposure 9,449,760 809,470 2,051,728 2,861,198 30%
Collaterals for derivative financial instruments consist mostly of the margins called by the Bank for its OTC derivative assets.
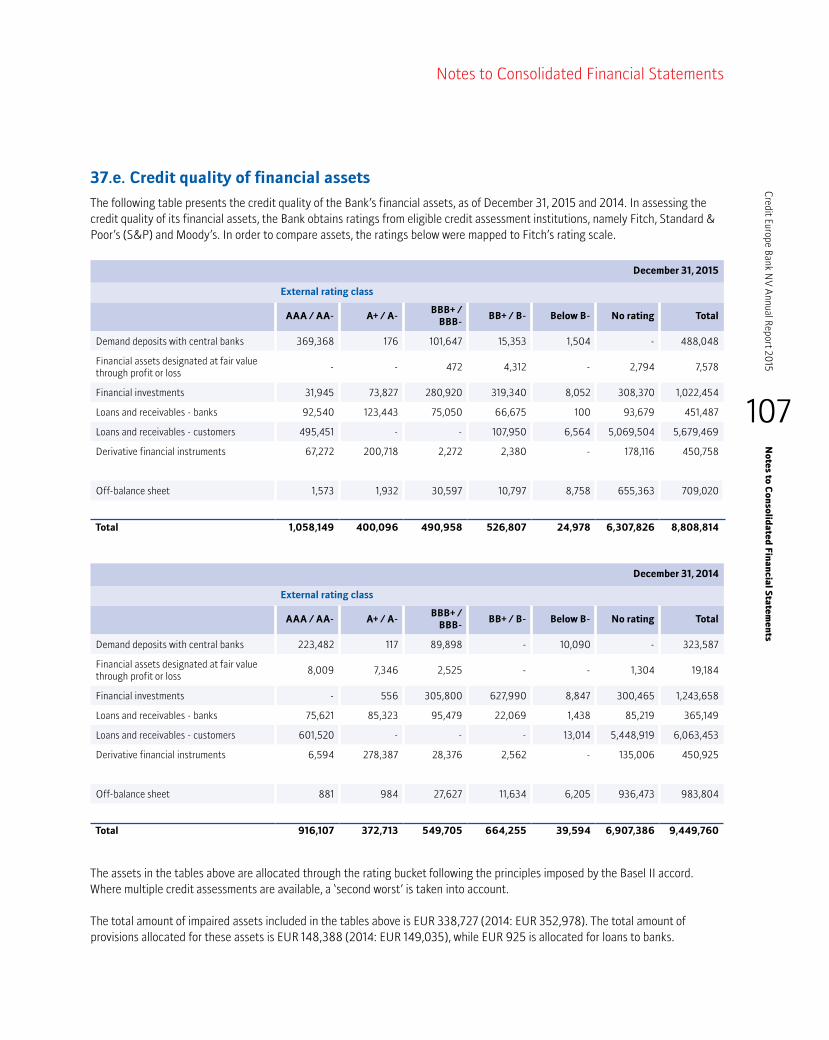
107
Credit Europe Bank N
V Annual Report 20
15N
otes to C
onsolid
ated Fin
ancial S
tatemen
ts
Notes to Consolidated Financial Statements
37.e. Credit quality of financial assets
The following table presents the credit quality of the Bank’s financial assets, as of December 31, 2015 and 2014. In assessing the credit quality of its financial assets, the Bank obtains ratings from eligible credit assessment institutions, namely Fitch, Standard & Poor’s (S&P) and Moody’s. In order to compare assets, the ratings below were mapped to Fitch’s rating scale.
December 31, 2015
External rating class
AAA / AA- A+ / A-BBB+ /
BBB-BB+ / B- Below B- No rating Total
Demand deposits with central banks 369,368 176 101,647 15,353 1,504 - 488,048
Financial assets designated at fair value through profit or loss - - 472 4,312 - 2,794 7,578
Financial investments 31,945 73,827 280,920 319,340 8,052 308,370 1,022,454
Loans and receivables - banks 92,540 123,443 75,050 66,675 100 93,679 451,487
Loans and receivables - customers 495,451 - - 107,950 6,564 5,069,504 5,679,469
Derivative financial instruments 67,272 200,718 2,272 2,380 - 178,116 450,758
Off-balance sheet 1,573 1,932 30,597 10,797 8,758 655,363 709,020
Total 1,058,149 400,096 490,958 526,807 24,978 6,307,826 8,808,814
December 31, 2014
External rating class
AAA / AA- A+ / A-BBB+ /
BBB-BB+ / B- Below B- No rating Total
Demand deposits with central banks 223,482 117 89,898 - 10,090 - 323,587
Financial assets designated at fair value through profit or loss 8,009 7,346 2,525 - - 1,304 19,184
Financial investments - 556 305,800 627,990 8,847 300,465 1,243,658
Loans and receivables - banks 75,621 85,323 95,479 22,069 1,438 85,219 365,149
Loans and receivables - customers 601,520 - - - 13,014 5,448,919 6,063,453
Derivative financial instruments 6,594 278,387 28,376 2,562 - 135,006 450,925
Off-balance sheet 881 984 27,627 11,634 6,205 936,473 983,804
Total 916,107 372,713 549,705 664,255 39,594 6,907,386 9,449,760
The assets in the tables above are allocated through the rating bucket following the principles imposed by the Basel II accord. Where multiple credit assessments are available, a ‘second worst’ is taken into account.
The total amount of impaired assets included in the tables above is EUR 338,727 (2014: EUR 352,978). The total amount of provisions allocated for these assets is EUR 148,388 (2014: EUR 149,035), while EUR 925 is allocated for loans to banks.

108
Cre
dit E
urop
e Ba
nk N
V A
nnua
l Rep
ort 2
015
No
tes
to C
onso
lid
ated
Fin
anci
al S
tate
men
ts
Notes to Consolidated Financial Statements
Loans and receivables - customersThe next section provides a detailed overview of the credit quality of the Bank’s loans and advances portfolio. CEB’s current Loan Assessment and Impairment Policy is aligned with the industry practices and regulatory requirements. Our loan classification approach is based on the respective recovery capabilities and debtors’ creditworthiness levels, providing the management and the external stakeholders a detailed and a transparent overview of the portfolio’s credit quality. At the beginning of 2015 the Bank revised its Loan Assessment and Impairment Policy according to the EBA’s technical standards on non-performing and forbearance exposures. The major change in the policy is the replacement of “Watch-list” definition with the term “Sub-standard”, which is a more objective and extensive monitoring group.
CEB differentiates between the following categories of assets in the loan portfolio:• “Performing loans” cover corporate, retail, SME loans on which payments are made according to the contractual terms,
repayment problems are not expected in the future and which are totally recoverable (collectable).• “Sub-standard” term has different implications for corporate and retail & SME clients. From corporate banking perspective
it includes performing forborne loans and loans of customers who are rated between 9 and 11 according to the internal rating master scale. For retail & SME customers the term means loans with a delay in contractual payment of no more than 90 days.
• Non-Performing Loans (NPL) includes loans and receivables with limited (doubtful) recovery prospects. These clients:• have limited means for total recovery because their repayment capacity is inadequate to cover payments on respective terms;
they are likely to lead to losses if these problems are not solved; or,• are in a situation where full or partial recovery prospects are fully dependent on the outcome of the liquidation of the
underlying assets or recourse to the guarantor; or,• have suffered significant credit quality deterioration; or,• have delayed the capital and/or interest payments for more than 90 days as of the day of their payment date.
To be able to monitor delinquent corporate loans in a more structured way the Bank developed NPL & forbearance screens on solo level and strive to spread the system across subsidiaries.
Impairment allowancesThe Bank aims to maintain sufficient reserves to cover its incurred losses. According to its policy, the Bank differentiates between:• Provisionsforindividuallyassessed assets• Provisions for collectively assessed assets
Individual AssessmentAll Sub-standard and NPL customers are analysed individually, regardless of size. Performing loans are subject to individual assessment only if they are deemed ‘significant’. The ‘significance criterion’ is established at global level, and amounts to EUR 1 million. In terms of individual assessment, the trigger point for impairment is formal classification of an account as exhibiting serious financial problems and where any further deterioration is likely to lead to failure. Two key inputs to the cash flow calculation are the valuation of all security and collateral and the timing of all asset realizations.
Collective AssessmentThe Bank identifies loans to be evaluated for impairment on an individual basis and segments the remainder of the portfolio into groups of loans with similar credit characteristics. CEB classifies its corporate portfolio either on an obligor or a transactional rating scale, where corresponding probability of default “PD” or expected loss “EL” figures are readily available.
The Bank calculates collective impairment allowances for retail portfolios using the dynamic statistical model, based on analysis of the portfolio’s default and recovery rates according to historical data. The same approach is implemented across the Bank’s entities, with adjustment for specific local conditions. The methodology remained unchanged in 2015.

109
Credit Europe Bank N
V Annual Report 20
15N
otes to C
onsolid
ated Fin
ancial S
tatemen
ts
Notes to Consolidated Financial Statements
37.f. Credit quality of loans and advances to customers
The following tables provide a breakdown of the Bank’s loans and advances to customers per credit-quality group, defined above. It also shows the allocation of provisions and collaterals obtained per group.
December 31, 2015
Gross loans
Provisions
for
individually
assessed
assets (-)
Provisions
for
collectively
assessed
assets (-)
Net loansFinancial
collateral
Physical
collateral
Total
collateral
Collateral
to net
loans
Corporate loans 4,119,354 (20,968) (18,794) 4,079,592 449,457 1,673,583 2,123,040 52%
Performing loans 3,765,467 - (17,198) 3,748,269 449,281 1,423,473 1,872,754 50%
Sub-Standard Loans 239,646 - (1,568) 238,078 176 166,130 166,306 70%
NPL 114,241 (20,968) (28) 93,245 - 83,980 83,980 90%Retail loans (incl. mortgages) 1,466,705 - (145,465) 1,321,240 30,524 517,729 548,253 41%
Performing loans 1,155,933 - (18,800) 1,137,133 17,053 394,383 411,436 36%
Sub-Standard Loans 110,482 - (7,990) 102,492 5,338 51,242 56,580 55%
NPL 200,290 - (118,675) 81,615 8,133 72,104 80,237 98%
SME loans 93,410 (966) (10,447) 81,997 3,655 79,784 83,439 102%
Performing loans 68,396 - (2,140) 66,256 3,655 62,665 66,320 100%
Sub-Standard Loans 4,509 - (556) 3,953 - 4,353 4,353 110%
NPL 20,505 (966) (7,751) 11,788 - 12,766 12,766 108%Total exposure 5,679,469 (21,934) (174,706) 5,482,829 483,636 2,271,096 2,754,732 50%
Total NPL 335,036 (21,934) (126,454) 186,648 8,133 168,850 176,983 95%
December 31, 2014
Gross loans
Provisions
for
individually
assessed
assets (-)
Provisions
for
collectively
assessed
assets (-)
Net loansFinancial
collateral
Physical
collateral
Total
collateral
Collateral
to net
loans
Corporate loans 3,881,257 (12,109) (13,790) 3,855,358 604,433 1,178,567 1,783,000 46%
Performing loans 3,421,193 - (13,790) 3,407,403 601,085 752,388 1,353,473 40%
Sub-Standard Loans 342,752 (1,378) - 341,374 1,883 334,070 335,953 98%
NPL 117,312 (10,731) - 106,581 1,465 92,109 93,574 88%
Retail loans (incl. mortgages) 2,036,509 (260) (174,969) 1,861,280 49,029 773,109 822,138 44%
Performing loans 1,735,383 - (34,116) 1,701,267 40,586 631,140 671,726 39%
Sub-Standard Loans 81,635 - (8,405) 73,230 - 55,252 55,252 75%
NPL 219,491 (260) (132,448) 86,783 8,443 86,717 95,160 110%
SME loans 145,687 - (7,756) 137,931 5,059 100,052 105,111 76%
Performing loans 123,642 - (1,824) 121,818 5,059 81,053 86,112 71%
Sub-Standard Loans 5,870 - (336) 5,534 - 6,774 6,774 122%
NPL 16,175 - (5,596) 10,579 - 12,225 12,225 116%Total exposure 6,063,453 (12,369) (196,515) 5,854,569 658,521 2,051,728 2,710,249 46%
Total NPL 352,978 (10,991) (138,044) 203,943 9,908 191,051 200,959 99%
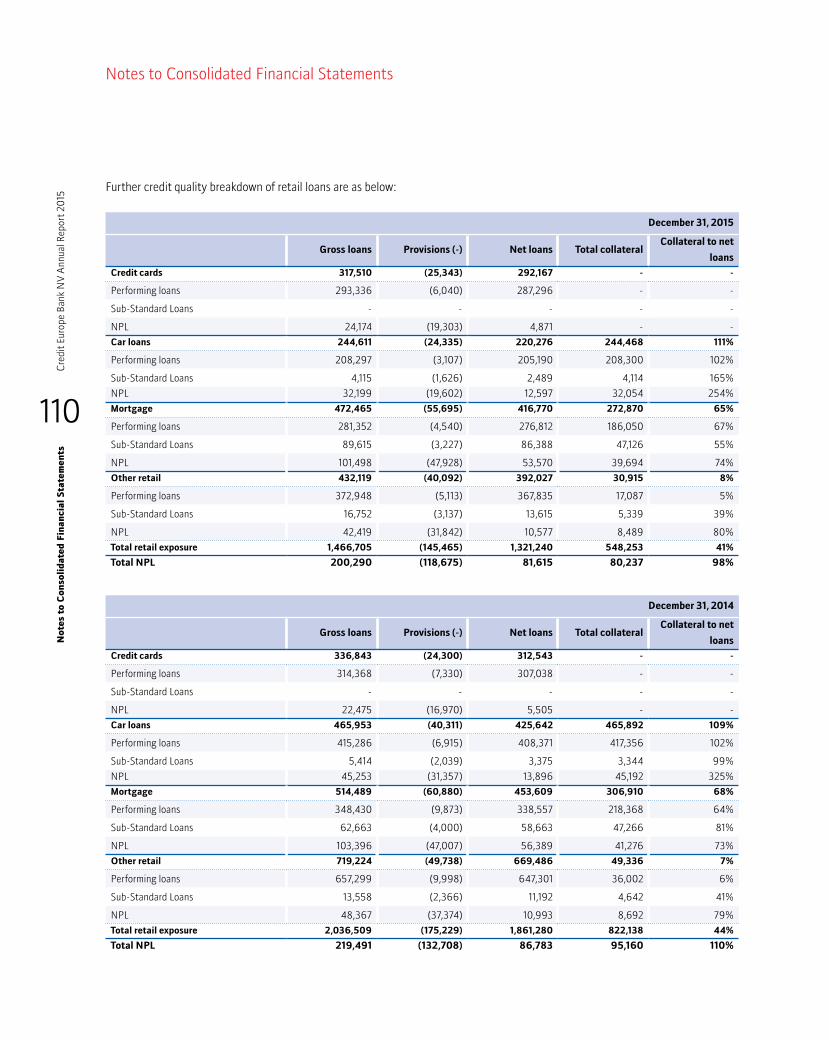
110
Cre
dit E
urop
e Ba
nk N
V A
nnua
l Rep
ort 2
015
No
tes
to C
onso
lid
ated
Fin
anci
al S
tate
men
ts
Notes to Consolidated Financial Statements
Further credit quality breakdown of retail loans are as below:
December 31, 2015
Gross loans Provisions (-) Net loans Total collateral Collateral to net
loans
Credit cards 317,510 (25,343) 292,167 - -
Performing loans 293,336 (6,040) 287,296 - -
Sub-Standard Loans - - - - -
NPL 24,174 (19,303) 4,871 - -Car loans 244,611 (24,335) 220,276 244,468 111%
Performing loans 208,297 (3,107) 205,190 208,300 102%
Sub-Standard Loans 4,115 (1,626) 2,489 4,114 165%
NPL 32,199 (19,602) 12,597 32,054 254%
Mortgage 472,465 (55,695) 416,770 272,870 65%
Performing loans 281,352 (4,540) 276,812 186,050 67%
Sub-Standard Loans 89,615 (3,227) 86,388 47,126 55%
NPL 101,498 (47,928) 53,570 39,694 74%Other retail 432,119 (40,092) 392,027 30,915 8%
Performing loans 372,948 (5,113) 367,835 17,087 5%
Sub-Standard Loans 16,752 (3,137) 13,615 5,339 39%
NPL 42,419 (31,842) 10,577 8,489 80%Total retail exposure 1,466,705 (145,465) 1,321,240 548,253 41%
Total NPL 200,290 (118,675) 81,615 80,237 98%
December 31, 2014
Gross loans Provisions (-) Net loans Total collateral Collateral to net
loans
Credit cards 336,843 (24,300) 312,543 - -
Performing loans 314,368 (7,330) 307,038 - -
Sub-Standard Loans - - - - -
NPL 22,475 (16,970) 5,505 - -Car loans 465,953 (40,311) 425,642 465,892 109%
Performing loans 415,286 (6,915) 408,371 417,356 102%
Sub-Standard Loans 5,414 (2,039) 3,375 3,344 99%
NPL 45,253 (31,357) 13,896 45,192 325%
Mortgage 514,489 (60,880) 453,609 306,910 68%
Performing loans 348,430 (9,873) 338,557 218,368 64%
Sub-Standard Loans 62,663 (4,000) 58,663 47,266 81%
NPL 103,396 (47,007) 56,389 41,276 73%Other retail 719,224 (49,738) 669,486 49,336 7%
Performing loans 657,299 (9,998) 647,301 36,002 6%
Sub-Standard Loans 13,558 (2,366) 11,192 4,642 41%
NPL 48,367 (37,374) 10,993 8,692 79%Total retail exposure 2,036,509 (175,229) 1,861,280 822,138 44%
Total NPL 219,491 (132,708) 86,783 95,160 110%
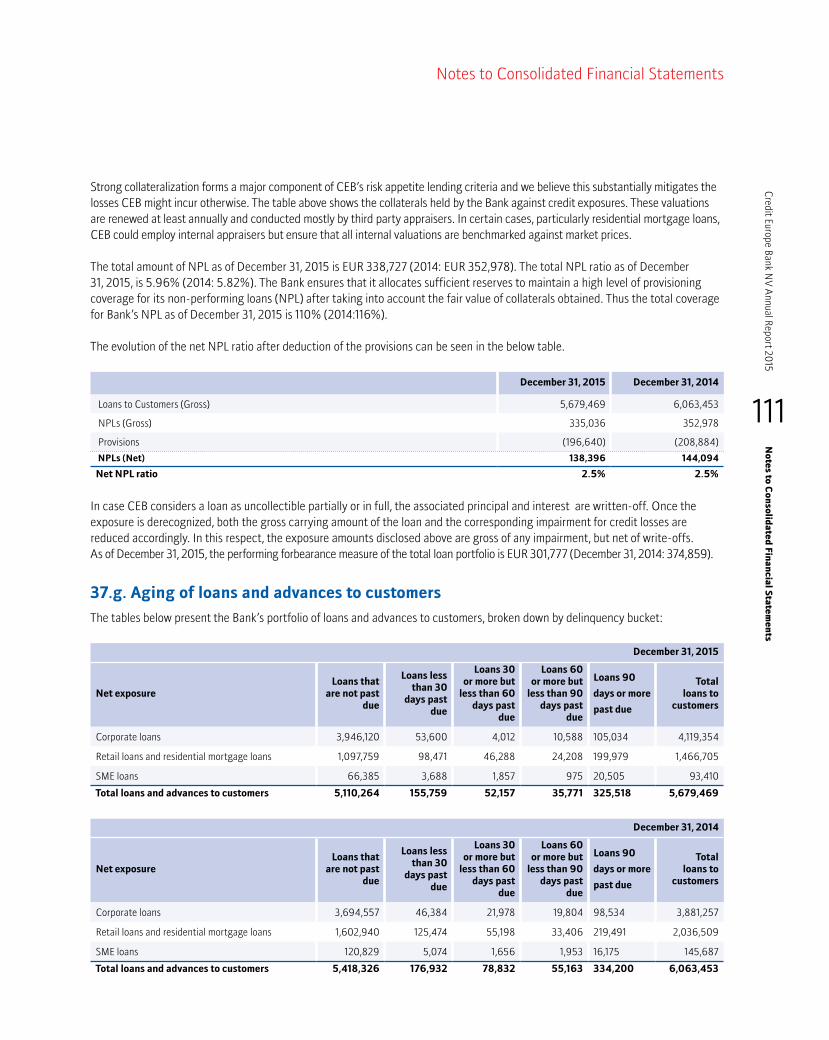
111
Credit Europe Bank N
V Annual Report 20
15N
otes to C
onsolid
ated Fin
ancial S
tatemen
ts
Notes to Consolidated Financial Statements
Strong collateralization forms a major component of CEB’s risk appetite lending criteria and we believe this substantially mitigates the losses CEB might incur otherwise. The table above shows the collaterals held by the Bank against credit exposures. These valuations are renewed at least annually and conducted mostly by third party appraisers. In certain cases, particularly residential mortgage loans, CEB could employ internal appraisers but ensure that all internal valuations are benchmarked against market prices.
The total amount of NPL as of December 31, 2015 is EUR 338,727 (2014: EUR 352,978). The total NPL ratio as of December 31, 2015, is 5.96% (2014: 5.82%). The Bank ensures that it allocates sufficient reserves to maintain a high level of provisioning coverage for its non-performing loans (NPL) after taking into account the fair value of collaterals obtained. Thus the total coverage for Bank’s NPL as of December 31, 2015 is 110% (2014:116%).
The evolution of the net NPL ratio after deduction of the provisions can be seen in the below table.
December 31, 2015 December 31, 2014
Loans to Customers (Gross) 5,679,469 6,063,453
NPLs (Gross) 335,036 352,978
Provisions (196,640) (208,884)
NPLs (Net) 138,396 144,094
Net NPL ratio 2.5% 2.5%
In case CEB considers a loan as uncollectible partially or in full, the associated principal and interest are written-off. Once the exposure is derecognized, both the gross carrying amount of the loan and the corresponding impairment for credit losses are reduced accordingly. In this respect, the exposure amounts disclosed above are gross of any impairment, but net of write-offs.As of December 31, 2015, the performing forbearance measure of the total loan portfolio is EUR 301,777 (December 31, 2014: 374,859).
37.g. Aging of loans and advances to customers
The tables below present the Bank’s portfolio of loans and advances to customers, broken down by delinquency bucket:
December 31, 2015
Net exposureLoans that
are not past due
Loans less than 30
days past due
Loans 30 or more but
less than 60 days past
due
Loans 60 or more but
less than 90 days past
due
Loans 90
days or more
past due
Total loans to
customers
Corporate loans 3,946,120 53,600 4,012 10,588 105,034 4,119,354
Retail loans and residential mortgage loans 1,097,759 98,471 46,288 24,208 199,979 1,466,705
SME loans 66,385 3,688 1,857 975 20,505 93,410
Total loans and advances to customers 5,110,264 155,759 52,157 35,771 325,518 5,679,469
December 31, 2014
Net exposureLoans that
are not past due
Loans less than 30
days past due
Loans 30 or more but
less than 60 days past
due
Loans 60 or more but
less than 90 days past
due
Loans 90
days or more
past due
Total loans to
customers
Corporate loans 3,694,557 46,384 21,978 19,804 98,534 3,881,257
Retail loans and residential mortgage loans 1,602,940 125,474 55,198 33,406 219,491 2,036,509
SME loans 120,829 5,074 1,656 1,953 16,175 145,687
Total loans and advances to customers 5,418,326 176,932 78,832 55,163 334,200 6,063,453

112
Cre
dit E
urop
e Ba
nk N
V A
nnua
l Rep
ort 2
015
No
tes
to C
onso
lid
ated
Fin
anci
al S
tate
men
ts
Notes to Consolidated Financial Statements
37.h. Geographical concentration of loans advanced to customers, broken down by counterparty type
The following tables breaks down customers’ loans and receivables by risk country:
December 31, 2015
Gross exposure Russia Romania Turkey Ukraine
Other
emerging
markets
Developed
markets
Total
exposure
Corporate loans 754,775 331,668 1,327,452 55,874 106,206 1,543,379 4,119,354
Performing loans 681,569 242,237 1,276,074 32,772 106,206 1,426,609 3,765,467
Sub-Standard Loans 30,453 63,623 16,793 13,969 - 114,808 239,646
NPL 42,753 25,808 34,585 9,133 - 1,962 114,241 Retail loans (incl. mortgages) 761,685 541,152 - 2,268 - 161,600 1,466,705
Performing loans 668,585 337,190 - 778 - 149,380 1,155,933
Sub-Standard Loans 9,110 92,987 - 252 - 8,133 110,482
NPL 83,990 110,975 - 1,238 - 4,087 200,290
SME loans 42,827 50,583 - - - - 93,410
Performing loans 37,369 31,027 - - - - 68,396
Sub-Standard Loans 418 4,091 - - - - 4,509
NPL 5,040 15,465 - - - - 20,505
Total exposure 1,559,287 923,403 1,327,452 58,142 106,206 1,704,979 5,679,469
December 31, 2014
Gross exposure Russia Romania Turkey Ukraine
Other
emerging
markets
Developed
markets
Total
exposure
Corporate loans 811,739 310,849 1,054,427 73,288 46,202 1,584,752 3,881,257
Performing loans 774,424 206,636 929,051 52,177 45,009 1,413,896 3,421,193
Sub-Standard Loans 857 80,343 90,774 4,883 - 165,895 342,752
NPL 36,458 23,870 34,602 16,228 1,193 4,961 117,312
Retail loans (incl. mortgages) 1,191,372 578,635 - 3,981 - 262,521 2,036,509
Performing loans 1,087,707 397,360 - 1,454 - 248,862 1,735,383
Sub-Standard Loans 10,472 66,636 - 1,004 - 3,523 81,635
NPL 93,193 114,639 - 1,523 - 10,136 219,491
SME loans 86,113 59,574 - - - - 145,687
Performing loans 85,804 37,838 - - - - 123,642
Sub-Standard Loans 14 5,856 - - - - 5,870
NPL 295 15,880 - - - - 16,175
Total exposure 2,089,224 949,058 1,054,427 77,269 46,202 1,847,273 6,063,453

113
Credit Europe Bank N
V Annual Report 20
15N
otes to C
onsolid
ated Fin
ancial S
tatemen
ts
Notes to Consolidated Financial Statements
37.i. Liquidity risk
The Bank defines liquidity risk as the current or prospective risk to earnings and capital arising from an institution’s inability to meet its liabilities when they come due. CEB considers funding and liquidity as a major source of risk. CEB’s minor and very limited tolerance towards liquidity risk is explicitly reflected its high internal liquidity buffer requirements and strict definition of liquid assets (or counterbalancing capacity).
The Bank monitors its liquidity position on a daily basis and conducts regular liquidity stress testing and it is perceived as an important risk indicator by Asset/Liability Committee (ALCO), Audit and Risk Committee (ARC) and the Supervisory Board. The Bank identifies the following items as the key liquidity-risk drivers:• Withdrawalofdeposits:The Bank should withstand a severe meltdown in its non-maturity deposits through deploying its avail-
able liquid assets. The severity is defined as a 40% loss in the saving-account balance in a period of one month.• Erosioninvalueofliquidassets: The Bank applies a 75% haircut for the securities that are not eligible for re-financing through
the European Central Bank (ECB). The remaining qualifying securities are taken into account after adding nominal 5% on top of the existing haircuts applied by the ECB. The policy also incorporates a scenario of material price drops, which in return further decrease the re-financing capacity.
• Erosioninvalueofliquidassets:The Bank applies a 75% haircut for the securities that are not eligible for re-financing through the European Central Bank (ECB). The remaining qualifying securities are considered after applying certain haircuts according to their external ratings.
• Additionalcollateralrequirements:The Bank has sensitivity to certain FX parities due to its involvement in swap markets. The Bank might face intensive margin calls from the counterparties if certain FX rates move in the adverse direction. The Bank meas-ures the required liquidity under worse-than-expected FX market conditions.
The Board and senior management ensure that the Bank's funding strategy and its implementation are consistent with their expressed risk tolerance. The board delegates responsibility for establishing specific liquidity-risk policies and practices to the ALCO. ALCO is responsible for ensuring that measurement systems adequately identify and quantify the Bank’s liquidity exposure and that reporting systems communicate accurate and relevant information about the level and sources of that exposure.
Any violation of the liquidity policy and predefined limits is reported to ALCO. In the case of limit excess during market turmoil, ALCO calls an immediate meeting to discuss options to bring the liquidity to its desired levels. This can include slowing down and/or ceasing to enter into new commitments, selling assets from trading and AFS portfolios, and increasing spreads to attract new long-term funds on the consumer and corporate sides, as defined in the Bank’s contingency-funding plan. To mitigate liquidity risk, the Bank diversifies funding sources as customer deposits and funds borrowed from abroad and it keeps certain level of assets as cash and cash equivalents.
Liquidity gaps as a result of size and maturity mismatches in assets and liabilities also generate liquidity risk. Liquidity-gap analysis is done on a monthly basis, to be submitted to ALCO, or more frequently when required. It distributes all on-balance sheet assets’ and liabilities’ expected cash flows in predefined maturity bands according to remaining contractual maturity.

114
Cre
dit E
urop
e Ba
nk N
V A
nnua
l Rep
ort 2
015
No
tes
to C
onso
lid
ated
Fin
anci
al S
tate
men
ts
Notes to Consolidated Financial Statements
Based on remaining maturity December 31, 2015
Up to 1 month
1–3 months3–12
months1-5 Year
Over 5 years
Maturity not
applicableTotal
Assets
Cash and balances at central banks 532,139 - - - - - 532,139
Financial assets designated at FVPL 961 - - 472 4,313 1,832 7,578
Financial investments 6,119 61,183 278,473 264,963 382,309 29,407 1,022,454
Loans and receivables – banks 406,109 17,385 17,059 10,009 - - 450,562
Loans and receivables – customers 1,119,233 427,140 683,217 2,113,666 952,925 186,648 5,482,829
Tangible and intangible assets - - - - - 214,138 214,138
Other assets 70,496 84,287 238,575 120,111 27,792 117,501 658,762
Total assets 2,135,057 589,995 1,217,324 2,509,221 1,367,339 549,526 8,368,462
Liabilities
Due to banks 186,210 157,716 99,891 25,237 - - 469,054
Due to customers 1,397,857 308,181 1,090,829 1,828,945 841,209 - 5,467,021
Issued debt securities 805 77,110 228,065 134,560 - - 440,540
Other liabilities 102,694 78,933 207,478 101,833 27,893 28,908 547,739
Subordinated liabilities - - - 137,406 424,341 - 561,747
Total liabilities 1,687,566 621,940 1,626,263 2,227,981 1,293,443 28,908 7,486,101
Cumulative liquidity gap 447,491 415,546 6,607 287,847 361,743 882,361 882,361
Based on remaining maturity December 31, 2014
Up to 1 month
1–3 months3–12
months1-5 Year
Over 5 years
Maturity not
applicableTotal
Assets
Cash and balances at central banks 375,330 - - - - - 375,330
Financial assets designated at FVPL - - - 12,160 5,719 1,305 19,184
Financial investments - 184,949 142,266 238,869 662,254 15,320 1,243,658
Loans and receivables – banks 338,870 6,819 18,535 - - - 364,224
Loans and receivables – customers 1,570,375 488,773 902,764 1,901,502 787,212 203,943 5,854,569
Tangible and intangible assets - - - - - 168,022 168,022
Other assets 76,220 80,979 241,025 137,357 31,652 121,519 688,752
Total assets 2,360,795 761,520 1,304,590 2,289,888 1,486,837 510,109 8,713,739
Liabilities
Due to banks 383,618 236,373 122,603 31,082 - - 773,676
Due to customers 1,155,090 508,400 1,299,262 2,583,042 242,384 - 5,788,178
Issued debt securities 2,536 76,169 264,542 40,582 15,220 - 399,049
Other liabilities 100,068 103,596 138,430 53,756 22,379 34,825 453,054
Subordinated liabilities - - - 133,388 380,313 - 513,701
Total liabilities 1,641,312 924,538 1,824,837 2,841,850 660,296 34,825 7,927,658
Cumulative liquidity gap 719,483 556,465 36,218 (515,744) 310,797 786,081 786,081

115
Credit Europe Bank N
V Annual Report 20
15N
otes to C
onsolid
ated Fin
ancial S
tatemen
ts
Notes to Consolidated Financial Statements
Management expects that the cash flows from certain financial assets and liabilities will be different from their contractual terms either because management has the discretionary ability to manage the cash flows or because past experience indicates that cash flows will differ from contractual terms.
Current accounts and demand deposits from customers are distributed in accordance with the average monthly withdrawal behaviour of customers over the last 7 years on the basis of management's belief that despite of these funds from customers being on demand, diversification of these deposits by number and type of depositors, and the past experience of the Group, indicates that these deposits provide a stable source of funding.
As at December 31, 2015 and 2014, the contractual maturities of customer deposits are as follows:
December 31, 2015 December 31, 2014
Up to 1 month 2,934,749 2,951,291
1-3 months 320,095 419,983
3-12 months 896,098 996,011
1-5 years 1,136,064 1,178,509
Over 5 year 180,015 242,384
Total 5,467,021 5,788,178
37.j. Market risks
Market risk is defined as the current or prospective threat to the Bank’s earnings and capital as a result of adverse market movements in market prices (security and derivative prices, as well as interest rates and foreign exchange rates) or in parameters such as volatility and correlations. The trading portfolio includes financial instruments, such as securities, derivatives and loans to financial institutions, which are exposed to short-term price/interest-rate fluctuations. Eligible positions should be in line with the guidelines and principles set out in the market-risk policy. No eligible positions and financial instruments approved by ALCO are monitored within the scope of the banking book. In line with its business plan, the Bank has a ‘minor’ risk appetite in market risk. The Bank aims to regularly measure and monitor its market risk associated with adverse market movements affecting the trading components of its Treasury and FI portfolio. It measures its market risk using different approaches - standard and internal models.
Bank risk tolerance in the form of limits is determined to manage market risk efficiently and keep it within these limits. Risk limits, such as the Value-at-Risk (VaR) limit, notional limits and sensitivity limits, are set by considering the primary risk factors. In case of a limit breach, ALCO is convened to determine strategy and take necessary actions to restore the outstanding exposure within limits in a certain period of time.
The Bank measures the market risk of its trading book and the foreign-exchange risk of its banking book by using an internal historical simulation method, based on VaR methodology. VaR defines the maximum loss not exceeded with a given probability over a given period of time under normal market conditions. However, this approach fails to capture exceptional losses under extreme market conditions; that is why market risk measurement is complemented by periodic stress-testing analysis.
The internal historical simulation method of VaR model is used for risk-monitoring purposes and whereas regulatory capital for market risk is calculated and reported quarterly according to the Standard Approach, as specified in the DNB’s market-risk regulations.
The internal historical simulation method is used starting from January 2013. The last 250 historical daily returns of market risk factors are used to stress the current trading positions to estimate possible fluctuations caused by market movements while keeping the portfolio fixed.
The internal limit for the 10-day trading portfolio, with VaR at 99% - confidence interval, is EUR 8 million (2014: EUR 8 million). This implies that diversified VaR from foreign-exchange risk and interest-rate risk in the trading book should not exceed this level.

116
Cre
dit E
urop
e Ba
nk N
V A
nnua
l Rep
ort 2
015
No
tes
to C
onso
lid
ated
Fin
anci
al S
tate
men
ts
Notes to Consolidated Financial Statements
Other market risks, such as liquidity, re-pricing and interest-rate risk, on the banking book are measured and monitored through sensitivity and gap analyses, detailed in subsequent sections.
Value-at-risk figures - Trading Book (2015) TotalDiversification
effectInterest-rate risk
Foreign-exchange risk
Average 293 88% 264 62
Maximum 601 103% 602 233
Minimum 14 21% - 8
Period-end 202 98% 192 15
Value-at-risk figures - Trading Book (2014) TotalDiversification
effectInterest-rate risk
Foreign-exchange risk
Average 1,075 87% 1,156 126
Maximum 2,655 100% 2,692 400
Minimum 95 65% 82 12
Period-end 160 96% 155 12
37.k. Interest-rate risk in the banking book
One of the Bank’s major risks under Pillar II is the interest-rate risk on the banking book. The Bank defines interest-rate risk as the current or prospective risk to earnings and capital arising from adverse movements in interest rates. The trading book is also subject to interest-rate risk, but this type of risk is dealt with under the Market Risk: Value-at-Risk section. The Bank has a ‘minor’ risk tolerance towards interest-rate risk in its banking book.
The Bank’s interest-rate risk is monitored for the banking book by means of static re-pricing gap and interest rate sensitivity analyses once a month at all levels and for each major currency in use. Interest-rate sensitivity on the banking book is calculated according to the economic-value approach.
Interest-rate sensitivity in the banking book is calculated according to the economic-value approach. All future cash flows, arising solely from on- and off- balance sheet assets and liabilities are discounted back to their present values with zero-coupon yield curves to see the impact of interest-rate changes on the economic value of the Bank. The impact of the curve with the maximum net gain or loss compared to a benchmark curve is analyzed.
Interest-rate sensitivity in the banking book is measured by means of PV01 method. The PV01 method is based on flat upward shifts of each currency’s yield curve in magnitudes of one basis point. The economic value impact of these shifts on the banking book is then analyzed. PV01 analysis is complemented with 200 basis-points (bps) scenarios, which consist of the parallel shifts of the yield curves by shifting short-term rates and long-term rates for each individual currency. The interest rate risk on the banking book, excluding the trading book has been calculated as EUR 67.7 million for 2015 with 200 basis point upward parallel rate shock (2014: EUR 69.3 million).
The impact of the curve with the maximal net gain or loss compared to a benchmark curve is then analyzed.Determination of economic internal capital to be set aside to cover potential interest-rate risk in the banking book is based on a Historical Simulation method. Historical economic values of the current banking book are calculated by discounting the re-pricing gaps in each of the major currencies with historical month-end zero-coupon swap curves in pre-defined maturity buckets. Once historical economic values are obtained, an economic value change distribution is created using a rolling window of one year.The interest rate repricing gap table below is prepared to determine the Bank’s exposure to interest rate risk as a result of maturity mismatches in its balance sheet. Repricing is based on remaining days to maturity for fixed rate instruments and next repricing date for floating rate instruments.

117
Credit Europe Bank N
V Annual Report 20
15N
otes to C
onsolid
ated Fin
ancial S
tatemen
ts
Notes to Consolidated Financial Statements
December 31, 2015
Up to 1 month
1–3 months3–12
months1-5 Year
Over 5 years
Non-interest-bearing items(*)
Total
Assets
Cash and balances at central banks 475,910 - - - - 56,229 532,139
Financial assets designated at FVPL - - - 459 4,000 3,119 7,578
Financial investments 21,734 199,369 157,868 281,334 321,241 40,908 1,022,454
Loans and receivables - banks 237,936 7,376 26,227 - - 179,023 450,562
Loans and receivables - customers 1,689,950 791,370 1,245,135 1,398,910 158,222 199,242 5,482,829
Tangible and intangible assets - - - - - 214,138 214,138
Other assets - - - - - 658,762 658,762
Total assets 2,425,530 998,115 1,429,230 1,680,703 483,463 1,351,421 8,368,462
Liabilities
Due to banks 162,519 204,692 94,306 5,001 - 2,536 469,054
Due to customers 2,284,450 374,993 847,779 1,203,633 176,426 579,740 5,467,021
Issued debt securities 805 77,110 228,065 134,560 - - 440,540
Other liabilities - - - - - 547,739 547,739
Subordinated liabilities - - - 561,747 - - 561,747
Total liabilities 2,447,774 656,795 1,170,150 1,904,941 176,426 1,130,015 7,486,101
Off-balanceinterest-sensitivitygap 32,295 118,696 (137,402) (38,369) (15,979) - (40,759)
Net gap 10,051 460,016 121,678 (262,607) 291,058 221,406 620,196
(*) Non-interest-bearing items are not taken into account in the net gap.
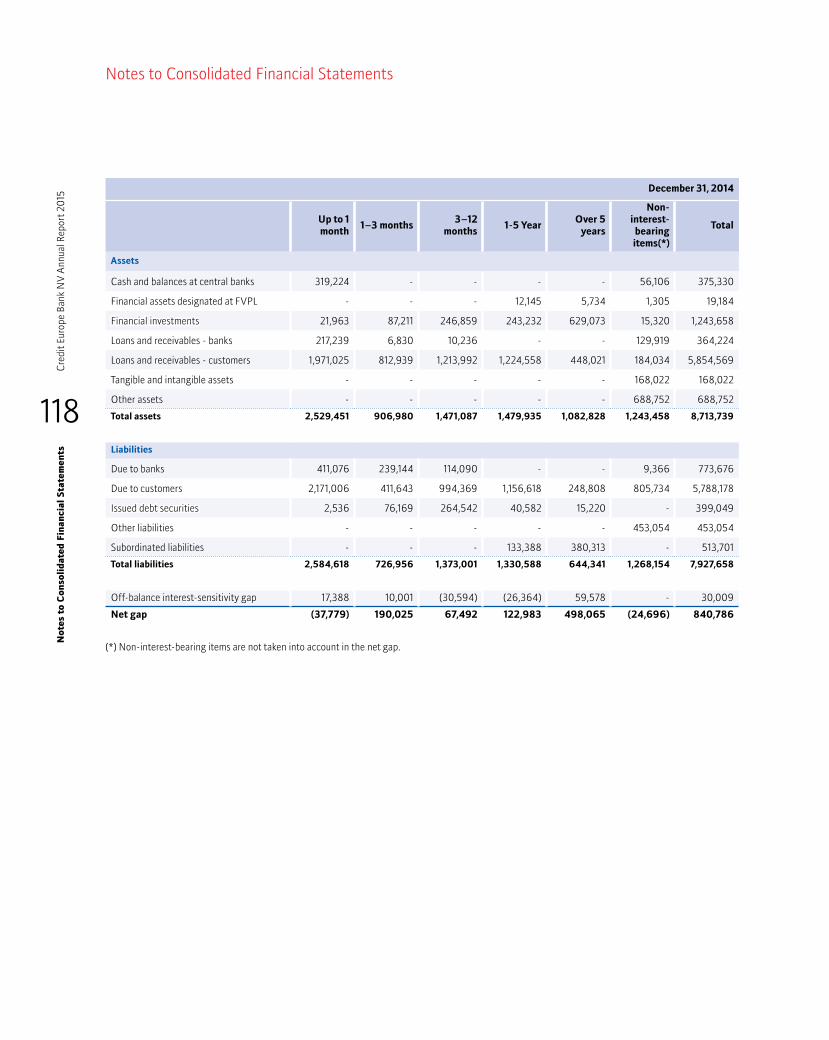
118
Cre
dit E
urop
e Ba
nk N
V A
nnua
l Rep
ort 2
015
No
tes
to C
onso
lid
ated
Fin
anci
al S
tate
men
ts
Notes to Consolidated Financial Statements
December 31, 2014
Up to 1 month
1–3 months3–12
months1-5 Year
Over 5 years
Non-interest-bearing items(*)
Total
Assets
Cash and balances at central banks 319,224 - - - - 56,106 375,330
Financial assets designated at FVPL - - - 12,145 5,734 1,305 19,184
Financial investments 21,963 87,211 246,859 243,232 629,073 15,320 1,243,658
Loans and receivables - banks 217,239 6,830 10,236 - - 129,919 364,224
Loans and receivables - customers 1,971,025 812,939 1,213,992 1,224,558 448,021 184,034 5,854,569
Tangible and intangible assets - - - - - 168,022 168,022
Other assets - - - - - 688,752 688,752
Total assets 2,529,451 906,980 1,471,087 1,479,935 1,082,828 1,243,458 8,713,739
Liabilities
Due to banks 411,076 239,144 114,090 - - 9,366 773,676
Due to customers 2,171,006 411,643 994,369 1,156,618 248,808 805,734 5,788,178
Issued debt securities 2,536 76,169 264,542 40,582 15,220 - 399,049
Other liabilities - - - - - 453,054 453,054
Subordinated liabilities - - - 133,388 380,313 - 513,701
Total liabilities 2,584,618 726,956 1,373,001 1,330,588 644,341 1,268,154 7,927,658
Off-balanceinterest-sensitivitygap 17,388 10,001 (30,594) (26,364) 59,578 - 30,009
Net gap (37,779) 190,025 67,492 122,983 498,065 (24,696) 840,786
(*) Non-interest-bearing items are not taken into account in the net gap.

119
Credit Europe Bank N
V Annual Report 20
15N
otes to C
onsolid
ated Fin
ancial S
tatemen
ts
Notes to Consolidated Financial Statements
37.l. Currency risk
The Bank takes on exposure to effects of fluctuations in the prevailing foreign currency exchange rates on its financial position and cash flows.
The Bank enters into foreign currency forward transactions and swap transactions to decrease foreign currency position risk.
The Bank’s position limits on currency risk are determined according to the foreign currency net position standard ratio determined by the DNB.
The Bank has control limits for the positions of forward transactions, options and other similar agreements. The credit risk arising from these instruments is managed together with the risks resulting from market fluctuations. The Bank monitors the risks of forward transactions, options and other similar agreements, reviews open positions with the ALCO and takes appropriate action where deemed necessary.
Consolidated subsidiaries and associates determine position limits related to currency risk as determined by local regulatory bodies. Subsidiaries established abroad conduct their operations in the currencies of the countries they are incorporated in. DNB sets the foreign currency limit to 15% of the Bank’s Total Own Funds.
The result of structural foreign exchange positions on the Bank’s net investments in foreign subsidiaries and branches, together with any related net investment hedges (see note 11), is recognized in equity.
Foreign-exchange risk of the position held is calculated with VaR methodology and reported daily for the Bank level and monthly on a consolidated level. The VaR limits and other market risks related issues are monitored by the Risk Management Department and discussed in weekly ALCO meetings.
The currency position, taking off-balance sheet derivative transactions into account, is at insignificant levels as of December 31, 2015 and December 31, 2014. The positions are taken in line with the Bank’s risk management policies.
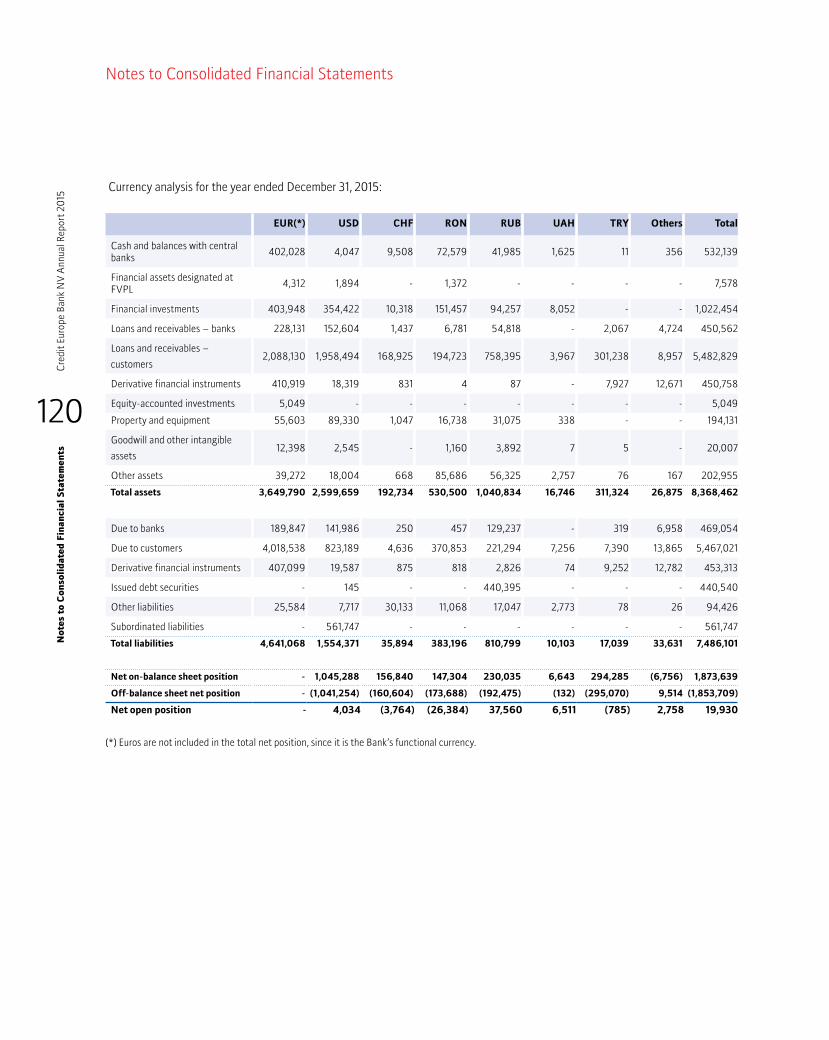
Currency analysis for the year ended December 31, 2015:
EUR(*) USD CHF RON RUB UAH TRY Others Total
Cash and balances with central banks 402,028 4,047 9,508 72,579 41,985 1,625 11 356 532,139
Financial assets designated at FVPL 4,312 1,894 - 1,372 - - - - 7,578
Financial investments 403,948 354,422 10,318 151,457 94,257 8,052 - - 1,022,454
Loans and receivables – banks 228,131 152,604 1,437 6,781 54,818 - 2,067 4,724 450,562
Loans and receivables –
customers2,088,130 1,958,494 168,925 194,723 758,395 3,967 301,238 8,957 5,482,829
Derivative financial instruments 410,919 18,319 831 4 87 - 7,927 12,671 450,758
Equity-accounted investments 5,049 - - - - - - - 5,049
Propertyandequipment 55,603 89,330 1,047 16,738 31,075 338 - - 194,131
Goodwill and other intangible
assets12,398 2,545 - 1,160 3,892 7 5 - 20,007
Other assets 39,272 18,004 668 85,686 56,325 2,757 76 167 202,955
Total assets 3,649,790 2,599,659 192,734 530,500 1,040,834 16,746 311,324 26,875 8,368,462
Due to banks 189,847 141,986 250 457 129,237 - 319 6,958 469,054
Due to customers 4,018,538 823,189 4,636 370,853 221,294 7,256 7,390 13,865 5,467,021
Derivative financial instruments 407,099 19,587 875 818 2,826 74 9,252 12,782 453,313
Issued debt securities - 145 - - 440,395 - - - 440,540
Other liabilities 25,584 7,717 30,133 11,068 17,047 2,773 78 26 94,426
Subordinated liabilities - 561,747 - - - - - - 561,747
Total liabilities 4,641,068 1,554,371 35,894 383,196 810,799 10,103 17,039 33,631 7,486,101
Net on-balance sheet position - 1,045,288 156,840 147,304 230,035 6,643 294,285 (6,756) 1,873,639
Off-balance sheet net position - (1,041,254) (160,604) (173,688) (192,475) (132) (295,070) 9,514 (1,853,709)
Net open position - 4,034 (3,764) (26,384) 37,560 6,511 (785) 2,758 19,930
(*) Euros are not included in the total net position, since it is the Bank’s functional currency.
120
Cre
dit E
urop
e Ba
nk N
V A
nnua
l Rep
ort 2
015
No
tes
to C
onso
lid
ated
Fin
anci
al S
tate
men
ts
Notes to Consolidated Financial Statements
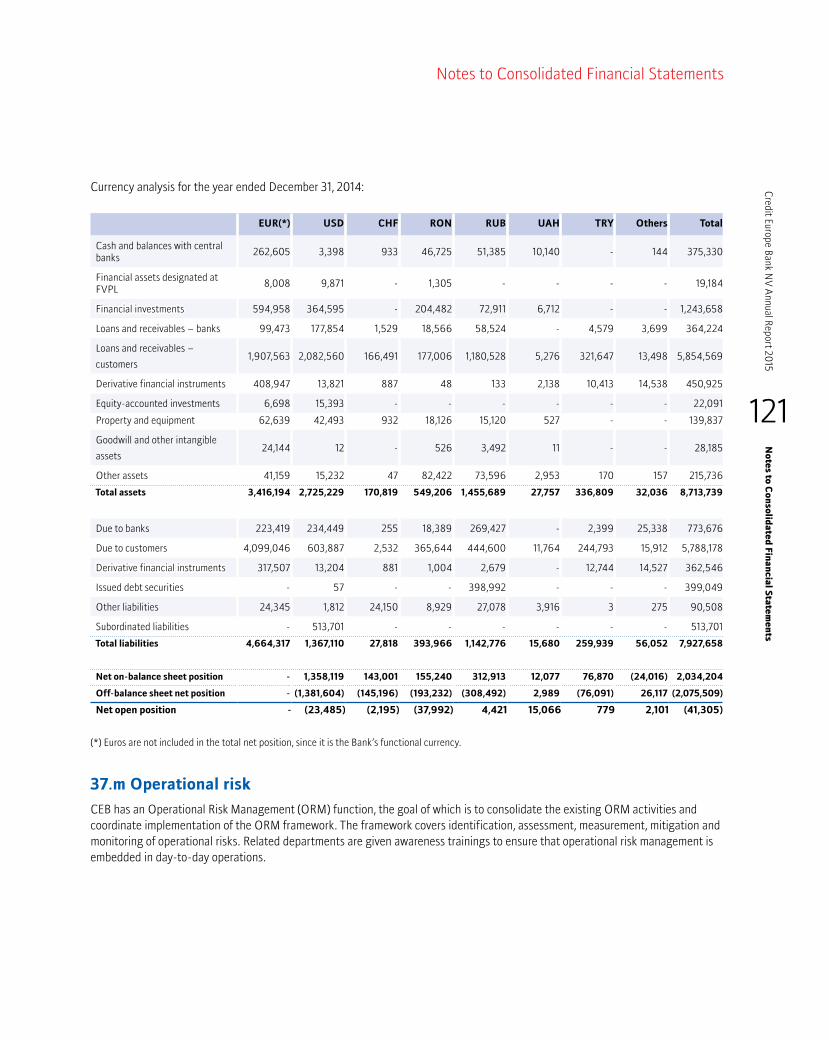
Currency analysis for the year ended December 31, 2014:
EUR(*) USD CHF RON RUB UAH TRY Others Total
Cash and balances with central banks 262,605 3,398 933 46,725 51,385 10,140 - 144 375,330
Financial assets designated at FVPL 8,008 9,871 - 1,305 - - - - 19,184
Financial investments 594,958 364,595 - 204,482 72,911 6,712 - - 1,243,658
Loans and receivables – banks 99,473 177,854 1,529 18,566 58,524 - 4,579 3,699 364,224
Loans and receivables –
customers1,907,563 2,082,560 166,491 177,006 1,180,528 5,276 321,647 13,498 5,854,569
Derivative financial instruments 408,947 13,821 887 48 133 2,138 10,413 14,538 450,925
Equity-accounted investments 6,698 15,393 - - - - - - 22,091
Propertyandequipment 62,639 42,493 932 18,126 15,120 527 - - 139,837
Goodwill and other intangible
assets24,144 12 - 526 3,492 11 - - 28,185
Other assets 41,159 15,232 47 82,422 73,596 2,953 170 157 215,736
Total assets 3,416,194 2,725,229 170,819 549,206 1,455,689 27,757 336,809 32,036 8,713,739
Due to banks 223,419 234,449 255 18,389 269,427 - 2,399 25,338 773,676
Due to customers 4,099,046 603,887 2,532 365,644 444,600 11,764 244,793 15,912 5,788,178
Derivative financial instruments 317,507 13,204 881 1,004 2,679 - 12,744 14,527 362,546
Issued debt securities - 57 - - 398,992 - - - 399,049
Other liabilities 24,345 1,812 24,150 8,929 27,078 3,916 3 275 90,508
Subordinated liabilities - 513,701 - - - - - - 513,701
Total liabilities 4,664,317 1,367,110 27,818 393,966 1,142,776 15,680 259,939 56,052 7,927,658
Net on-balance sheet position - 1,358,119 143,001 155,240 312,913 12,077 76,870 (24,016) 2,034,204
Off-balance sheet net position - (1,381,604) (145,196) (193,232) (308,492) 2,989 (76,091) 26,117 (2,075,509)
Net open position - (23,485) (2,195) (37,992) 4,421 15,066 779 2,101 (41,305)
(*) Euros are not included in the total net position, since it is the Bank’s functional currency.
37.m Operational risk
CEB has an Operational Risk Management (ORM) function, the goal of which is to consolidate the existing ORM activities and coordinate implementation of the ORM framework. The framework covers identification, assessment, measurement, mitigation and monitoring of operational risks. Related departments are given awareness trainings to ensure that operational risk management is embedded in day-to-day operations.
121
Credit Europe Bank N
V Annual Report 20
15N
otes to C
onsolid
ated Fin
ancial S
tatemen
ts
Notes to Consolidated Financial Statements
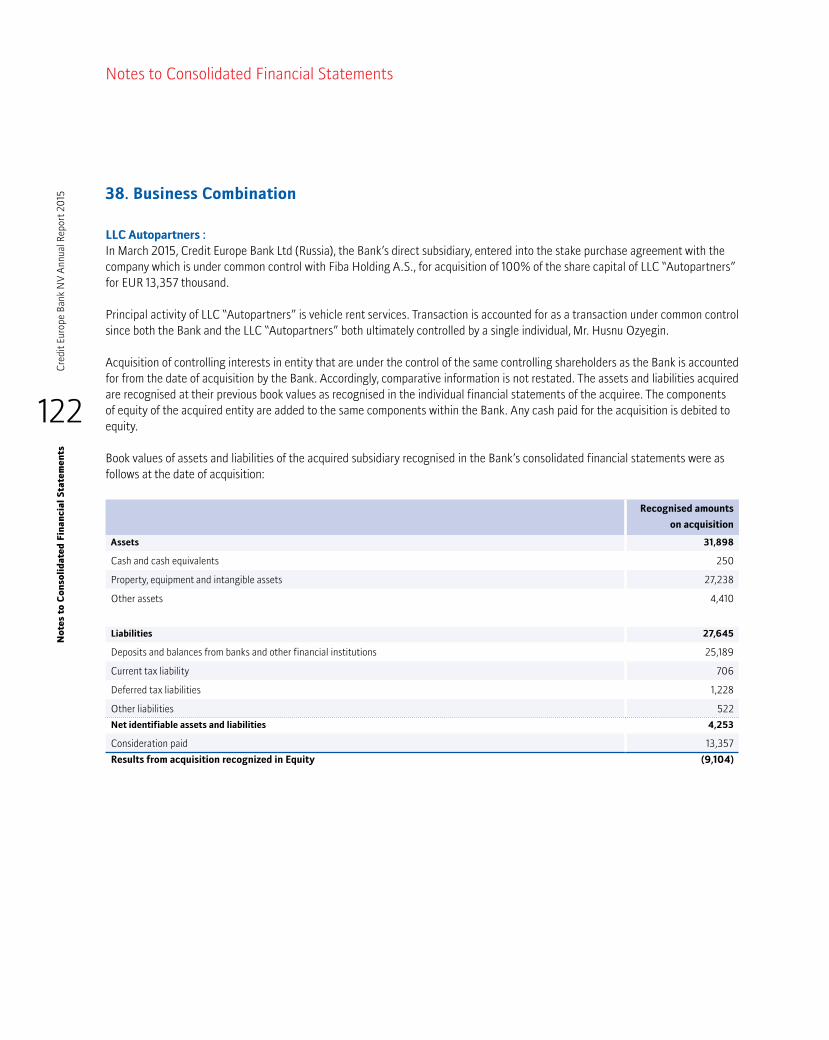
122
Cre
dit E
urop
e Ba
nk N
V A
nnua
l Rep
ort 2
015
No
tes
to C
onso
lid
ated
Fin
anci
al S
tate
men
ts
Notes to Consolidated Financial Statements
38. Business Combination
LLC Autopartners :In March 2015, Credit Europe Bank Ltd (Russia), the Bank’s direct subsidiary, entered into the stake purchase agreement with the company which is under common control with Fiba Holding A.S., for acquisition of 100% of the share capital of LLC “Autopartners” for EUR 13,357 thousand.
Principal activity of LLC “Autopartners” is vehicle rent services. Transaction is accounted for as a transaction under common control since both the Bank and the LLC “Autopartners” both ultimately controlled by a single individual, Mr. Husnu Ozyegin.
Acquisition of controlling interests in entity that are under the control of the same controlling shareholders as the Bank is accounted for from the date of acquisition by the Bank. Accordingly, comparative information is not restated. The assets and liabilities acquired are recognised at their previous book values as recognised in the individual financial statements of the acquiree. The components of equity of the acquired entity are added to the same components within the Bank. Any cash paid for the acquisition is debited to equity.
Book values of assets and liabilities of the acquired subsidiary recognised in the Bank’s consolidated financial statements were as follows at the date of acquisition:
Recognised amounts
on acquisition
Assets 31,898
Cash and cash equivalents 250
Property, equipment and intangible assets 27,238
Other assets 4,410
Liabilities 27,645
Deposits and balances from banks and other financial institutions 25,189
Current tax liability 706
Deferred tax liabilities 1,228
Other liabilities 522
Net identifiable assets and liabilities 4,253
Consideration paid 13,357
Results from acquisition recognized in Equity (9,104)
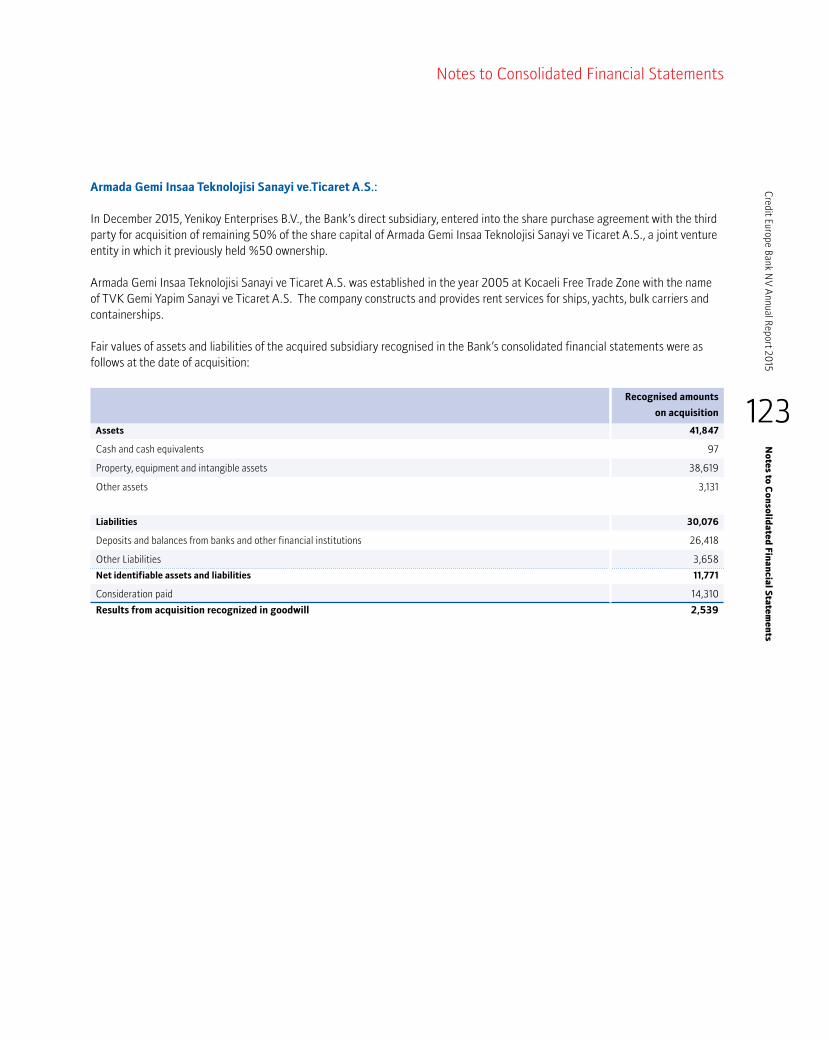
123
Credit Europe Bank N
V Annual Report 20
15N
otes to C
onsolid
ated Fin
ancial S
tatemen
ts
Notes to Consolidated Financial Statements
Armada Gemi Insaa Teknolojisi Sanayi ve.Ticaret A.S.:
In December 2015, Yenikoy Enterprises B.V., the Bank’s direct subsidiary, entered into the share purchase agreement with the third party for acquisition of remaining 50% of the share capital of Armada Gemi Insaa Teknolojisi Sanayi ve Ticaret A.S., a joint venture entity in which it previously held %50 ownership.
Armada Gemi Insaa Teknolojisi Sanayi ve Ticaret A.S. was established in the year 2005 at Kocaeli Free Trade Zone with the name of TVK Gemi Yapim Sanayi ve Ticaret A.S. The company constructs and provides rent services for ships, yachts, bulk carriers and containerships.
Fair values of assets and liabilities of the acquired subsidiary recognised in the Bank’s consolidated financial statements were as follows at the date of acquisition:
Recognised amounts
on acquisition
Assets 41,847
Cash and cash equivalents 97
Property, equipment and intangible assets 38,619
Other assets 3,131
Liabilities 30,076
Deposits and balances from banks and other financial institutions 26,418
Other Liabilities 3,658
Net identifiable assets and liabilities 11,771
Consideration paid 14,310
Results from acquisition recognized in goodwill 2,539
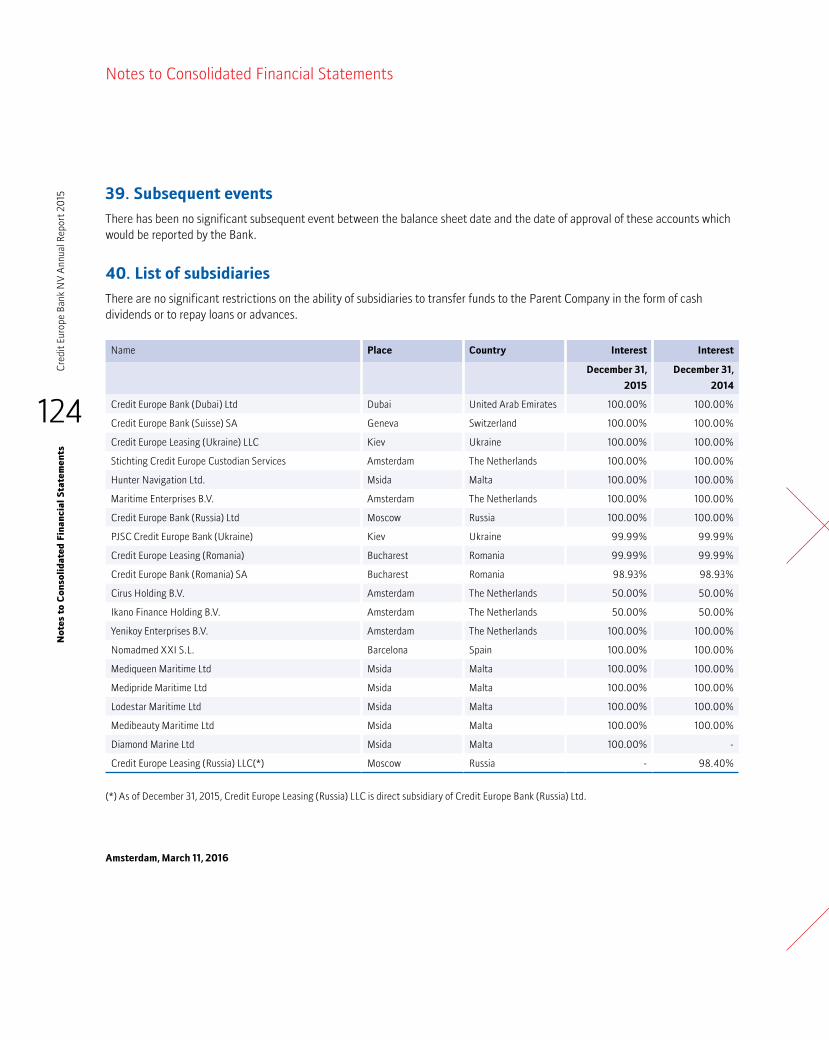
124
Cre
dit E
urop
e Ba
nk N
V A
nnua
l Rep
ort 2
015
No
tes
to C
onso
lid
ated
Fin
anci
al S
tate
men
ts
Notes to Consolidated Financial Statements
39. Subsequent events
There has been no significant subsequent event between the balance sheet date and the date of approval of these accounts which would be reported by the Bank.
40. List of subsidiaries
There are no significant restrictions on the ability of subsidiaries to transfer funds to the Parent Company in the form of cash dividends or to repay loans or advances.
Name Place Country Interest Interest
December 31,
2015
December 31,
2014
Credit Europe Bank (Dubai) Ltd Dubai United Arab Emirates 100.00% 100.00%
Credit Europe Bank (Suisse) SA Geneva Switzerland 100.00% 100.00%
Credit Europe Leasing (Ukraine) LLC Kiev Ukraine 100.00% 100.00%
Stichting Credit Europe Custodian Services Amsterdam The Netherlands 100.00% 100.00%
Hunter Navigation Ltd. Msida Malta 100.00% 100.00%
Maritime Enterprises B.V. Amsterdam The Netherlands 100.00% 100.00%
Credit Europe Bank (Russia) Ltd Moscow Russia 100.00% 100.00%
PJSC Credit Europe Bank (Ukraine) Kiev Ukraine 99.99% 99.99%
Credit Europe Leasing (Romania) Bucharest Romania 99.99% 99.99%
Credit Europe Bank (Romania) SA Bucharest Romania 98.93% 98.93%
Cirus Holding B.V. Amsterdam The Netherlands 50.00% 50.00%
Ikano Finance Holding B.V. Amsterdam The Netherlands 50.00% 50.00%
Yenikoy Enterprises B.V. Amsterdam The Netherlands 100.00% 100.00%
Nomadmed XXI S.L. Barcelona Spain 100.00% 100.00%
Mediqueen Maritime Ltd Msida Malta 100.00% 100.00%
Medipride Maritime Ltd Msida Malta 100.00% 100.00%
Lodestar Maritime Ltd Msida Malta 100.00% 100.00%
Medibeauty Maritime Ltd Msida Malta 100.00% 100.00%
Diamond Marine Ltd Msida Malta 100.00% -
Credit Europe Leasing (Russia) LLC(*) Moscow Russia - 98.40%
(*) As of December 31, 2015, Credit Europe Leasing (Russia) LLC is direct subsidiary of Credit Europe Bank (Russia) Ltd.
Amsterdam, March 11, 2016

Parent Company Financial StatementsAs of and for the year ended December 31, 2015

126
Cre
dit E
urop
e Ba
nk N
V A
nnua
l Rep
ort 2
015
Sta
tem
ent
of F
inan
cial
Pos
itio
n
Statement of Financial Position
Notes December 31, 2015 December 31, 2014
Assets
Cash and balances with central banks a 360,578 223,201
Amount due from banks b 679,834 688,000
Loans and advances to customers c 3,467,042 3,387,108
Debt securities d 433,892 594,436
•Trading 4,784 8,192
•Available-for-sale 429,108 586,244
Derivatives e 457,778 411,640
Investments in Group companies f 694,915 696,333
Intangible assets g 12,399 24,143
Property and equipment h 50,804 48,311
Other assets i 41,983 46,970
Total assets 6,199,225 6,120,142
Liabilities
Amounts due to banks j 230,933 208,037
Customer deposits k 4,215,999 4,395,724
Derivatives e 399,487 316,830
Other liabilities l 29,948 25,788
Provision f 17,990 9,198
Subordinated loans m 424,341 380,313
Total liabilities 5,318,698 5,335,890
Equity
Share capital n 632,464 429,500
Share premium 163,748 266,712
Legal reserves (48,400) (1,885)
•Fair value reserve 201 (12,716)
•Affiliated companies 306,177 311,257
•Currency translation differences (328,982) (317,300)
•Net investment hedge (31,994) 11,472
•Cash flow hedge 646 (173)
•Tangibles 5,552 5,575
Other reserves 89,925 60,695
Unappropriated result 42,790 29,230
Total equity 880,527 784,252
Total equity and liabilities 6,199,225 6,120,142
Commitment and contingencies p 386,322 433,875

127
Credit Europe Bank N
V Annual Report 20
15N
otes to C
onsolid
ated Fin
ancial S
tatemen
ts
Statement of Income
January 1- December 31, 2015
January 1-
December 31, 2014
Profit for the year of the Parent Company after taxes 42,790 29,230
Profit for the year participating interests after taxes 4,024 28,802
Profit for the year 46,814 58,032

128
Cre
dit E
urop
e Ba
nk N
V A
nnua
l Rep
ort 2
015
Sta
tem
ents
of
Ch
ang
es in
Equ
ity
Statements of Changes in Equity
Issued capital
Share premium
Legal reserves
Other reserves
Unappropriated
resultsTotal
At January 1, 2015 429,500 266,712 (1,885) 60,695 29,230 784,252
Change in fair value reserve - - 12,917 - - 12,917
Change in currency translation reserve - - (11,682) - - (11,682)
Change in tangible assets revaluation reserve - - (23) - - (23)
Change in hedging reserve - - (42,647) - - (42,647)
Total income and expense for the year recognized directly in equity
- - (41,435) - - (41,435)
Increase in share capital 100,000 - - - - 100,000
Transfer from share premium 102,964 (102,964) - - - -
Equity decrease resulting from business combinations - - (9,104) - - (9,104)
Profit for the year - - 4,024 - 42,790 46,814
Transfer from retained earnings - - - 29,230 (29,230) -
At December 31, 2015 632,464 163,748 (48,400) 89,925 42,790 880,527
Issued capital
Share premium
Legal reserves
Other reserves
Unappropriated
resultsTotal
At January 1, 2014 429,500 163,748 (16,413) 23,267 37,428 637,530
Change in fair value reserve - - 18,933 - - 18,933
Change in currency translation reserve - - (183,206) - - (183,206)
Change in tangible assets revaluation reserve - - 61 - - 61
Change in hedging reserve - - 149,938 - - 149,938
Total income and expense for the year recognized directly in equity
- - (14,274) - - (14,274)
Conversion of debt to equity - 102,964 - - - 102,964
Profit for the year - - 28,802 - 29,230 58,032
Transfer from retained earnings - - - 37,428 (37,428) -
At December 31, 2014 429,500 266,712 (1,885) 60,695 29,230 784,252

129
Credit Europe Bank N
V Annual Report 20
15S
um
mary of sig
nifican
t accoun
ting
policies
Basis of preparation
The Parent Company financial statements of Credit Europe Bank N.V. (CEB, the Bank) have been prepared in accordance with accounting principles in the Netherlands as embodied in Part 9 of Book 2 of the Netherlands Civil Code. Based on article 2:362.8 of the Netherlands Civil Code, the valuation principles applied in the Parent Company financial statements are based on International Financial Reporting Standards (IFRS), as used for the preparation of the Consolidated Financial Statements of the Bank.
The accounting policies that are used in the preparation of these parent financial statements are consistent with the accounting policies used in preparation of the Consolidated Financial Statements of the Bank, as set out in those financial statements.
The additional accounting policies that are specific to the Parent Company Financial Statements of CEB are set out below.
The profit and loss account is drawn up in accordance with article 402 of Book 2 of the Dutch Civil Code.
Investment in subsidiariesThe Group companies are stated at their net asset value, determined on the basis of IFRS, as applied in the Consolidated Financial Statements of the Bank. For details on the accounting policies applied for the Group companies, refer to the notes to the Consolidated Financial Statements as shown earlier in this document.
Dividend incomeDividend income from investments in subsidiaries is recognized when the right to receive payment is established.
Going concernHaving made appropriate enquiries, the Board is satisfied that the Company as a whole have adequate resources to continue operational businesses for the foreseeable future and therefore continued to adopt the going concern basis in preparing the financial statements.
Summary of significant accounting policies
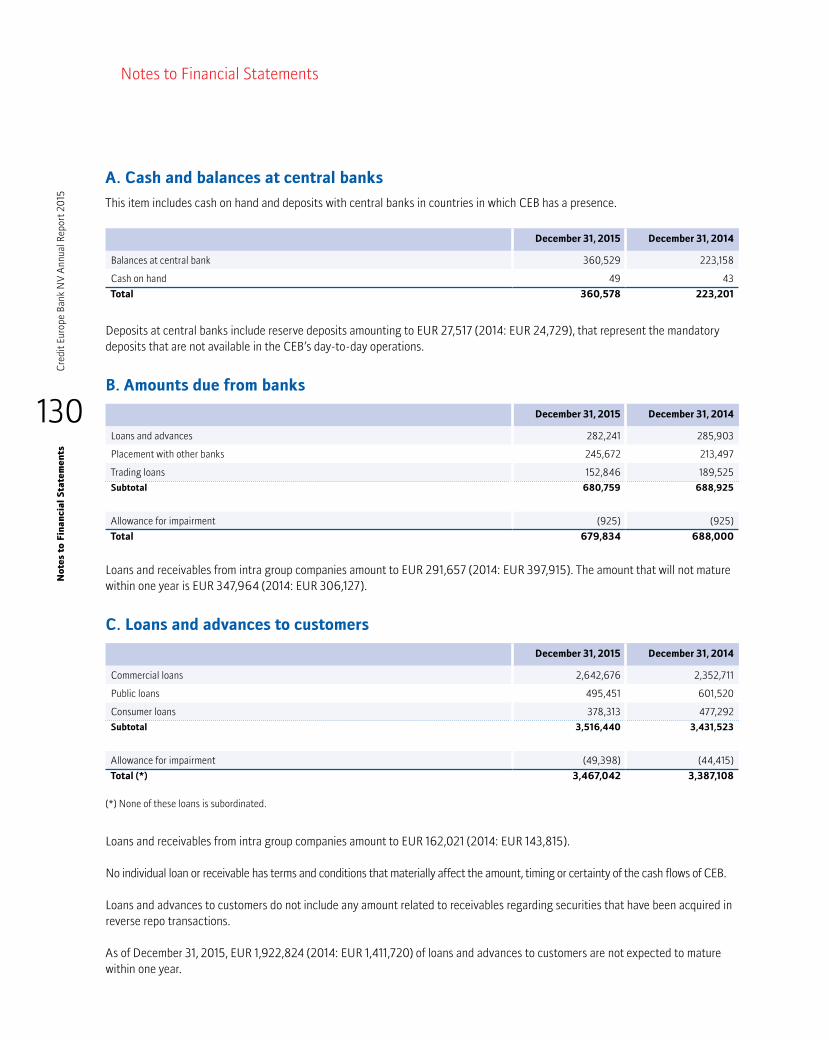
130
Cre
dit E
urop
e Ba
nk N
V A
nnua
l Rep
ort 2
015
No
tes
to F
inan
cial
Sta
tem
ents
A. Cash and balances at central banks
This item includes cash on hand and deposits with central banks in countries in which CEB has a presence.
December 31, 2015 December 31, 2014
Balances at central bank 360,529 223,158
Cash on hand 49 43
Total 360,578 223,201
Deposits at central banks include reserve deposits amounting to EUR 27,517 (2014: EUR 24,729), that represent the mandatory deposits that are not available in the CEB’s day-to-day operations.
B. Amounts due from banks
December 31, 2015 December 31, 2014
Loans and advances 282,241 285,903
Placement with other banks 245,672 213,497
Trading loans 152,846 189,525
Subtotal 680,759 688,925
Allowance for impairment (925) (925)
Total 679,834 688,000
Loans and receivables from intra group companies amount to EUR 291,657 (2014: EUR 397,915). The amount that will not mature within one year is EUR 347,964 (2014: EUR 306,127).
C. Loans and advances to customers
December 31, 2015 December 31, 2014
Commercial loans 2,642,676 2,352,711
Public loans 495,451 601,520
Consumer loans 378,313 477,292
Subtotal 3,516,440 3,431,523
Allowance for impairment (49,398) (44,415)
Total (*) 3,467,042 3,387,108
(*) None of these loans is subordinated.
Loans and receivables from intra group companies amount to EUR 162,021 (2014: EUR 143,815).
No individual loan or receivable has terms and conditions that materially affect the amount, timing or certainty of the cash flows of CEB.
Loans and advances to customers do not include any amount related to receivables regarding securities that have been acquired in reverse repo transactions.
As of December 31, 2015, EUR 1,922,824 (2014: EUR 1,411,720) of loans and advances to customers are not expected to mature within one year.
Notes to Financial Statements
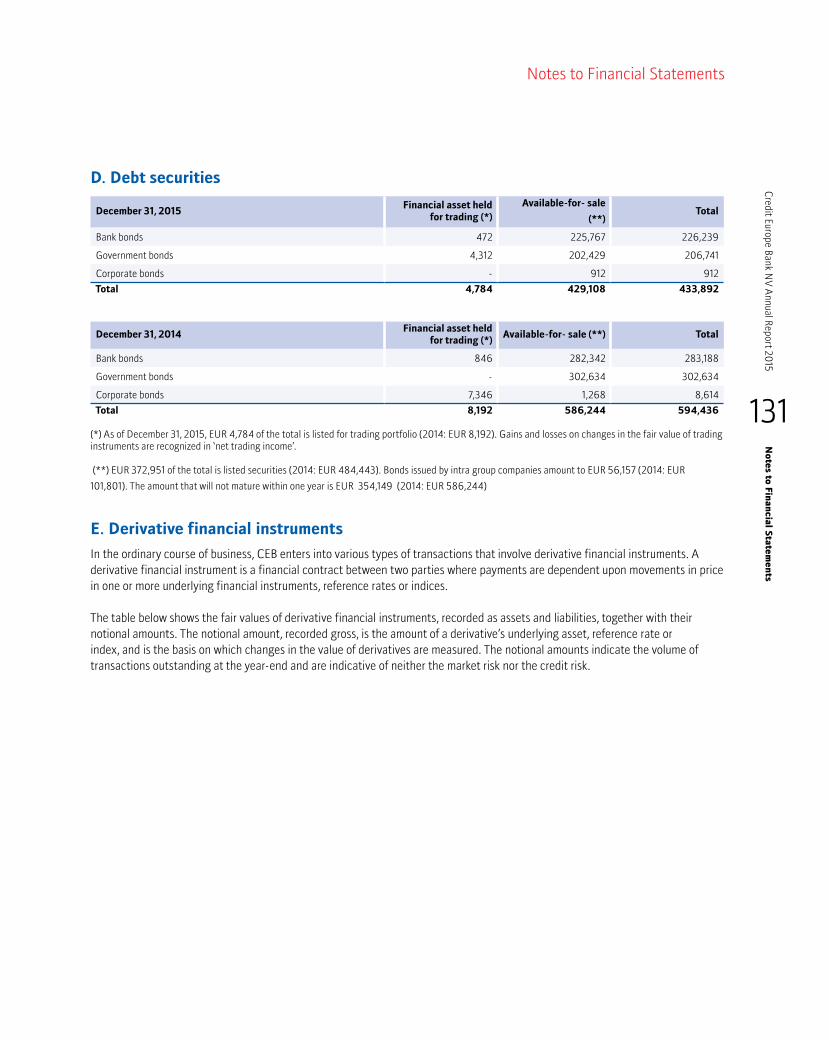
131
Credit Europe Bank N
V Annual Report 20
15N
otes to Fin
ancial S
tatemen
ts
Notes to Financial Statements
D. Debt securities
December 31, 2015Financial asset held
for trading (*)Available-for- sale
(**)Total
Bank bonds 472 225,767 226,239
Government bonds 4,312 202,429 206,741
Corporate bonds - 912 912
Total 4,784 429,108 433,892
December 31, 2014Financial asset held
for trading (*)Available-for- sale (**) Total
Bank bonds 846 282,342 283,188
Government bonds - 302,634 302,634
Corporate bonds 7,346 1,268 8,614
Total 8,192 586,244 594,436
(*) As of December 31, 2015, EUR 4,784 of the total is listed for trading portfolio (2014: EUR 8,192). Gains and losses on changes in the fair value of trading instruments are recognized in ‘net trading income’.
(**) EUR 372,951 of the total is listed securities (2014: EUR 484,443). Bonds issued by intra group companies amount to EUR 56,157 (2014: EUR
101,801). The amount that will not mature within one year is EUR 354,149 (2014: EUR 586,244)
E. Derivative financial instruments
In the ordinary course of business, CEB enters into various types of transactions that involve derivative financial instruments. A derivative financial instrument is a financial contract between two parties where payments are dependent upon movements in price in one or more underlying financial instruments, reference rates or indices.
The table below shows the fair values of derivative financial instruments, recorded as assets and liabilities, together with their notional amounts. The notional amount, recorded gross, is the amount of a derivative’s underlying asset, reference rate or index, and is the basis on which changes in the value of derivatives are measured. The notional amounts indicate the volume of transactions outstanding at the year-end and are indicative of neither the market risk nor the credit risk.

132
No
tes
to F
inan
cial
Sta
tem
ents
Cre
dit E
urop
e Ba
nk N
V A
nnua
l Rep
ort 2
015
Notes to Financial Statements
December 31, 2015 December 31, 2014
Derivatives held for tradingNominal Amounts
Fair values -assets
Fair values -liabilities
Nominal Amounts
Fair values
-assetsFair values -liabilities
Interest rate derivatives
Swaps - - - 8,102 3,026 65
Futures - - - 45,500 - 1
Options (purchased) 24,320 - - 21,679 44 -
Options (sold) (24,320) - - (1,252) - 7
Subtotal - - - 74,029 3,070 73
Currency derivatives
Swaps 4,637,985 237,101 244,993 4,665,562 146,144 196,343
Forwards 652,641 33,577 35,688 672,490 14,714 5,246
Options (purchased) 845,128 27,649 - 1,104,071 54,615 -
Options (sold) (845,128) - 27,831 (1,094,406) - 54,605
Subtotal 5,290,626 298,327 308,512 5,347,717 215,473 256,194
Other derivatives
Commodity swaps 158,797 41,285 40,095 36,634 2,578 2,481
Equity options (purchased) 199,712 5,572 - 310,144 7,904 -
Equity options (sold) (199,712) - 5,572 (310,118) - 7,904
Subtotal 158,797 46,857 45,667 36,660 10,482 10,385
Total derivatives 5,449,423 345,184 354,179 5,458,406 229,025 266,652
Derivative financial instruments held or issued for trading purposes:MostoftheBank’sderivatives-tradingactivitiesrelatetoassetandliabilitymanagementfortheBankanddealswithcustomerswhoarenormallylaidoffwithcounterparties.TheBankmayalsotakepositionswiththeexpectationofprofitingfromfavourablemovementsinpricesorratesonindices.Nohedgeaccountinghasbeenapplied.
Forwards and futures: Forwards and futures contracts are contractual agreements to buy or sell a specified financial instrument at a specific price and date in the future. Forwards are customized contracts transacted in the over-the-counter market. Future contracts are transacted in standardized amounts on regulated exchanges and are subject to daily cash margin requirements.
Swaps: Swaps are contractual agreements between two parties to exchange movements in interest or foreign-currency rates, commodities or equity indices based on specified notional amounts.
Options: Options are contractual agreements that convey the right, but not the obligation for the purchaser, either to buy or sell a specific amount of a financial instrument at a fixed price, either at a fixed future date or at any time within a specified period.

133
Credit Europe Bank N
V Annual Report 20
15N
otes to Fin
ancial S
tatemen
ts
Notes to Financial Statements
Derivatives held for risk management
Fair value hedgesThe Bank uses interest rates swaps to hedge its exposure to changes in fair values of its fixed rate EUR customer deposits and cross currency swaps to hedge its exposure to market interest rates on certain loans and advances.
The fair value of derivatives designated as fair value hedges are as follows:
December 31, 2015 December 31, 2014
Nominal Amounts
Fair values -assets
Fair values -liabilities
Nominal Amounts
Fair values
-assetsFair values -liabilities
Instrument type:
Interest rate forwards and swaps 136,738 6,215 - 136,738 8,089 -
Currency swaps (134,247) - 2,287 (89,333) - 4,914
Total 2,491 6,215 2,287 47,405 8,089 4,914
Net investment hedgesThe Bank uses a mixture of foreign exchange contracts to hedge the foreign currency translation risk on its net investment in foreign subsidiaries.
The fair value of derivatives designated as net investment hedges are as follows:
December 31, 2015 December 31, 2014
Nominal Amounts
Fair values -assets
Fair values -liabilities
Nominal Amounts
Fair values
-assetsFair values -liabilities
Instrument type:
Currency swaps 1,061,944 106,379 43,021 1,186,842 174,526 45,264
Total 1,061,944 106,379 43,021 1,186,842 174,526 45,264
The table below shows the fair value of derivative financial instruments recorded as assets and liabilities.
December 31, 2015 December 31, 2014
Assets Liabilities Assets Liabilities
Derivatives for
Held for trading 345,184 354,179 229,025 266,652
Fair value hedges 106,379 43,021 174,526 45,264
Net investment hedges 6,215 2,287 8,089 4,914
Total 457,778 399,487 411,640 316,830
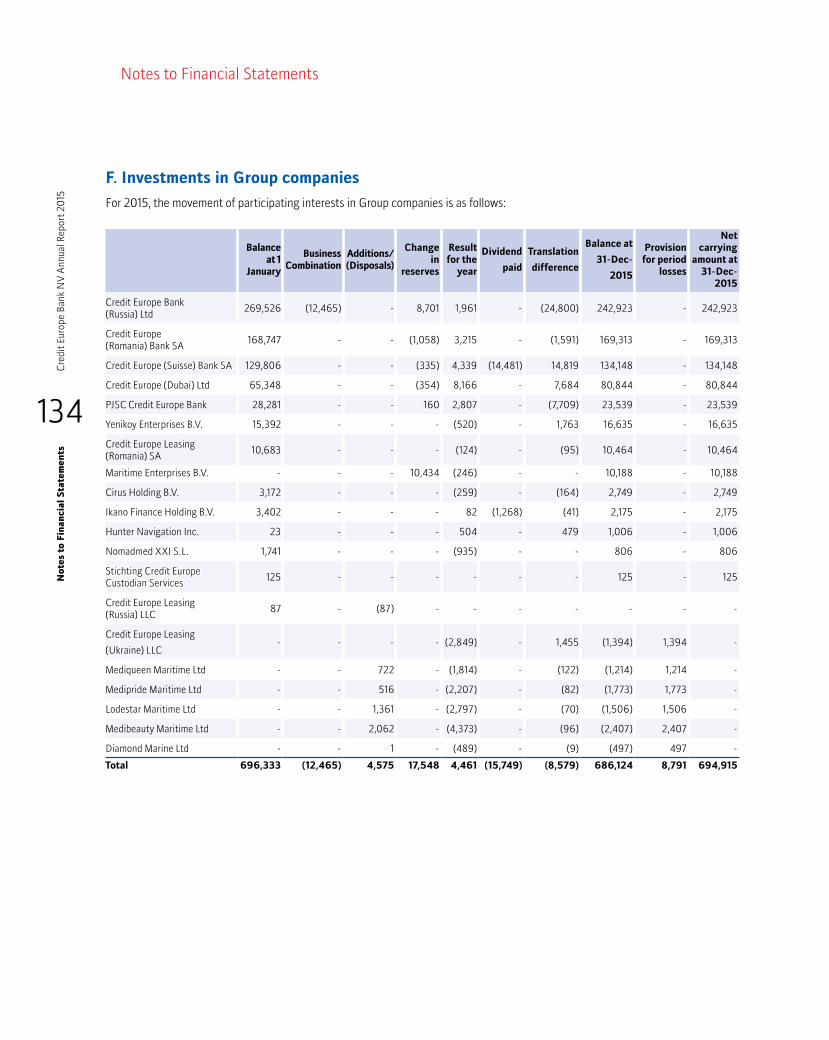
134
No
tes
to F
inan
cial
Sta
tem
ents
Cre
dit E
urop
e Ba
nk N
V A
nnua
l Rep
ort 2
015
Notes to Financial Statements
F. Investments in Group companies
For 2015, the movement of participating interests in Group companies is as follows:
Balance at 1
January
Business Combination
Additions/ (Disposals)
Change in
reserves
Result for the
year
Dividend
paid
Translation
difference
Balance at
31-Dec-
2015
Provision for period
losses
Net carrying
amount at 31-Dec-
2015
Credit Europe Bank (Russia) Ltd 269,526 (12,465) - 8,701 1,961 - (24,800) 242,923 - 242,923
Credit Europe (Romania) Bank SA 168,747 - - (1,058) 3,215 - (1,591) 169,313 - 169,313
Credit Europe (Suisse) Bank SA 129,806 - - (335) 4,339 (14,481) 14,819 134,148 - 134,148
Credit Europe (Dubai) Ltd 65,348 - - (354) 8,166 - 7,684 80,844 - 80,844
PJSC Credit Europe Bank 28,281 - - 160 2,807 - (7,709) 23,539 - 23,539
Yenikoy Enterprises B.V. 15,392 - - - (520) - 1,763 16,635 - 16,635
Credit Europe Leasing (Romania) SA 10,683 - - - (124) - (95) 10,464 - 10,464
MaritimeEnterprisesB.V. - - - 10,434 (246) - - 10,188 - 10,188
Cirus Holding B.V. 3,172 - - - (259) - (164) 2,749 - 2,749
Ikano Finance Holding B.V. 3,402 - - - 82 (1,268) (41) 2,175 - 2,175
Hunter Navigation Inc. 23 - - - 504 - 479 1,006 - 1,006
Nomadmed XXI S.L. 1,741 - - - (935) - - 806 - 806
Stichting Credit Europe Custodian Services 125 - - - - - - 125 - 125
Credit Europe Leasing (Russia) LLC 87 - (87) - - - - - - -
Credit Europe Leasing
(Ukraine) LLC - - - - (2,849) - 1,455 (1,394) 1,394 -
Mediqueen Maritime Ltd - - 722 - (1,814) - (122) (1,214) 1,214 -
Medipride Maritime Ltd - - 516 - (2,207) - (82) (1,773) 1,773 -
Lodestar Maritime Ltd - - 1,361 - (2,797) - (70) (1,506) 1,506 -
Medibeauty Maritime Ltd - - 2,062 - (4,373) - (96) (2,407) 2,407 -
Diamond Marine Ltd - - 1 - (489) - (9) (497) 497 -
Total 696,333 (12,465) 4,575 17,548 4,461 (15,749) (8,579) 686,124 8,791 694,915
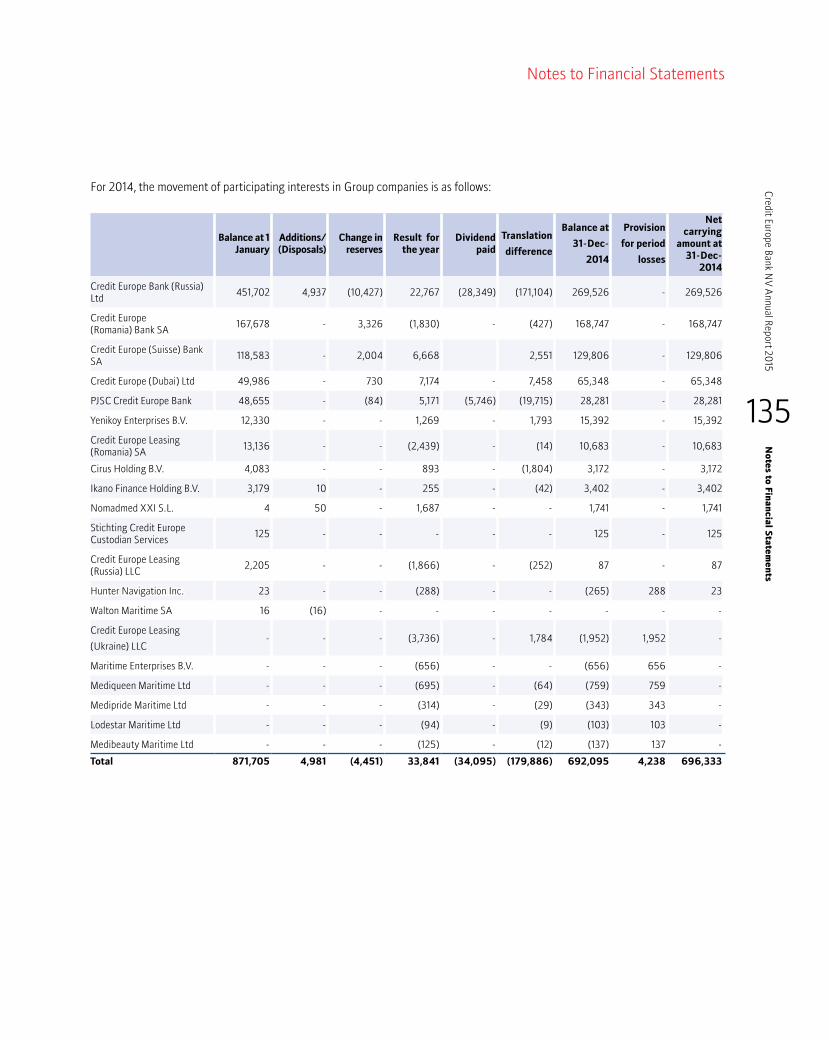
135
No
tes to Finan
cial Statem
ents
Credit Europe Bank N
V Annual Report 20
15
Notes to Financial Statements
For 2014, the movement of participating interests in Group companies is as follows:
Balance at 1 January
Additions/ (Disposals)
Change in reserves
Result for the year
Dividend paid
Translation
difference
Balance at
31-Dec-
2014
Provision
for period
losses
Net carrying
amount at 31-Dec-
2014
Credit Europe Bank (Russia) Ltd 451,702 4,937 (10,427) 22,767 (28,349) (171,104) 269,526 - 269,526
Credit Europe (Romania) Bank SA 167,678 - 3,326 (1,830) - (427) 168,747 - 168,747
Credit Europe (Suisse) Bank SA 118,583 - 2,004 6,668 2,551 129,806 - 129,806
Credit Europe (Dubai) Ltd 49,986 - 730 7,174 - 7,458 65,348 - 65,348
PJSC Credit Europe Bank 48,655 - (84) 5,171 (5,746) (19,715) 28,281 - 28,281
Yenikoy Enterprises B.V. 12,330 - - 1,269 - 1,793 15,392 - 15,392
Credit Europe Leasing (Romania) SA 13,136 - - (2,439) - (14) 10,683 - 10,683
CirusHoldingB.V. 4,083 - - 893 - (1,804) 3,172 - 3,172
Ikano Finance Holding B.V. 3,179 10 - 255 - (42) 3,402 - 3,402
Nomadmed XXI S.L. 4 50 - 1,687 - - 1,741 - 1,741
Stichting Credit Europe Custodian Services 125 - - - - - 125 - 125
Credit Europe Leasing (Russia) LLC 2,205 - - (1,866) - (252) 87 - 87
Hunter Navigation Inc. 23 - - (288) - - (265) 288 23
Walton Maritime SA 16 (16) - - - - - - -
Credit Europe Leasing
(Ukraine) LLC - - - (3,736) - 1,784 (1,952) 1,952 -
Maritime Enterprises B.V. - - - (656) - - (656) 656 -
Mediqueen Maritime Ltd - - - (695) - (64) (759) 759 -
Medipride Maritime Ltd - - - (314) - (29) (343) 343 -
Lodestar Maritime Ltd - - - (94) - (9) (103) 103 -
Medibeauty Maritime Ltd - - - (125) - (12) (137) 137 -
Total 871,705 4,981 (4,451) 33,841 (34,095) (179,886) 692,095 4,238 696,333

136
No
tes
to F
inan
cial
Sta
tem
ents
Cre
dit E
urop
e Ba
nk N
V A
nnua
l Rep
ort 2
015
Notes to Financial Statements
G. Intangible assets
The book value of intangibles is as follows:
GoodwillPatents and
licenses Total
Balance at January 1, 2015 22,678 1,465 24,143
Addition - 2,150 2,150
Impairment (*) (9,671) - (9,671)
Amortization - (839) (839)
Currency translation difference (3,136) (248) (3,384)
Balance at December 31, 2015 9,871 2,528 12,399
Balance at January 1, 2014 24,013 1,739 25,752
Addition 2,039 942 2,981
Disposal - (4) (4)
Amortization - (1,212) (1,212)
Currency translation difference (3,374) - (3,374)
Balance at December 31, 2014 22,678 1,465 24,143
(*) As result of impairment analysis, goodwill arising from Russian operations was fully provided for in 2015 due to adverse economic developments in Russia.
H. Property and equipment
A. Tangible AssetsThe book value of property and equipment is as follows:
BuildingsFurniture and
fixturesVehicles
Leasehold improvements
Total
Balance at January 1, 2015 41,921 1,787 - 3 43,711
Additions 79 311 - - 390
Disposals (132) - - - (132)
Depreciation (1,024) (440) - (1) (1,465)
Balance at December 31, 2015 40,844 1,658 - 2 42,504
BuildingsFurniture and
fixturesVehicles
Leasehold improvements
Total
Balance at January 1, 2014 42,874 1,918 4 4 44,800
Additions 327 316 - - 643
Disposals - (48) (4) - (52)
Depreciation (1,280) (399) - (1) (1,680)
Balance at December 31, 2014 41,921 1,787 - 3 43,711
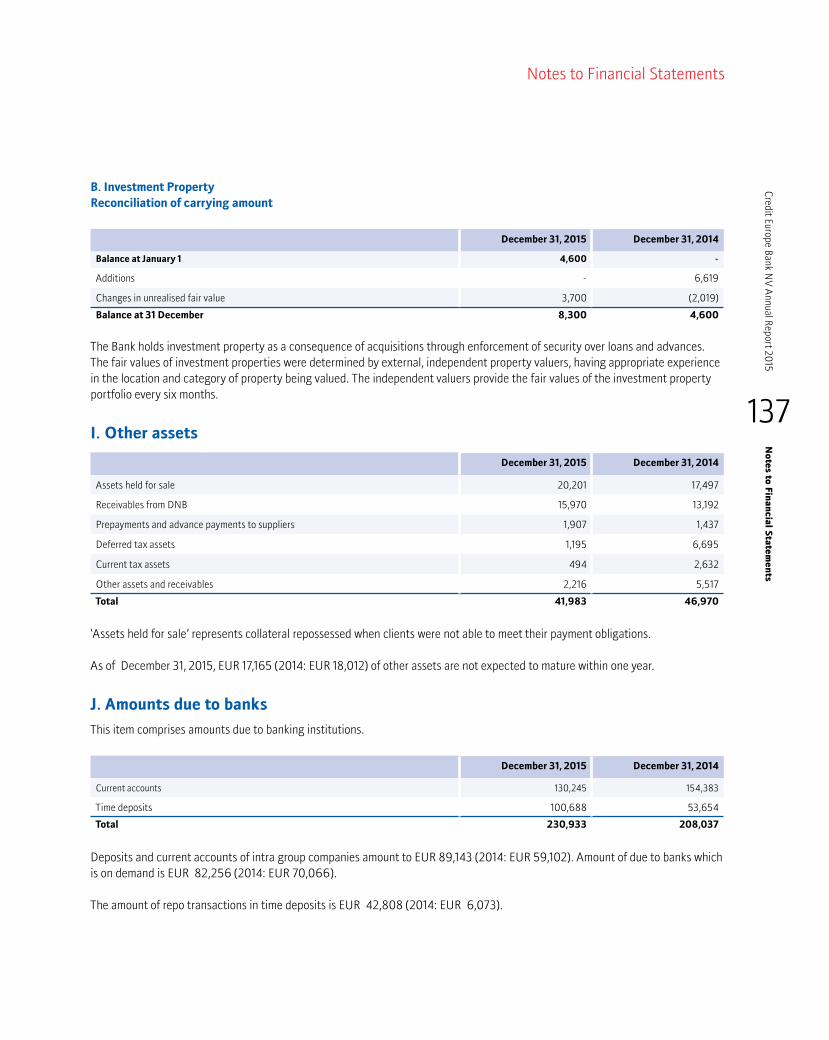
137
No
tes to Finan
cial Statem
ents
Credit Europe Bank N
V Annual Report 20
15
Notes to Financial Statements
B. Investment PropertyReconciliation of carrying amount
December 31, 2015 December 31, 2014
Balance at January 1 4,600 -
Additions - 6,619
Changes in unrealised fair value 3,700 (2,019)
Balance at 31 December 8,300 4,600
The Bank holds investment property as a consequence of acquisitions through enforcement of security over loans and advances. The fair values of investment properties were determined by external, independent property valuers, having appropriate experience in the location and category of property being valued. The independent valuers provide the fair values of the investment property portfolio every six months.
I. Other assets
December 31, 2015 December 31, 2014
Assets held for sale 20,201 17,497
Receivables from DNB 15,970 13,192
Prepayments and advance payments to suppliers 1,907 1,437
Deferred tax assets 1,195 6,695
Current tax assets 494 2,632
Other assets and receivables 2,216 5,517
Total 41,983 46,970
‘Assets held for sale’ represents collateral repossessed when clients were not able to meet their payment obligations.
As of December 31, 2015, EUR 17,165 (2014: EUR 18,012) of other assets are not expected to mature within one year.
J. Amounts due to banks
This item comprises amounts due to banking institutions.
December 31, 2015 December 31, 2014
Current accounts 130,245 154,383
Time deposits 100,688 53,654
Total 230,933 208,037
Deposits and current accounts of intra group companies amount to EUR 89,143 (2014: EUR 59,102). Amount of due to banks which is on demand is EUR 82,256 (2014: EUR 70,066).
The amount of repo transactions in time deposits is EUR 42,808 (2014: EUR 6,073).
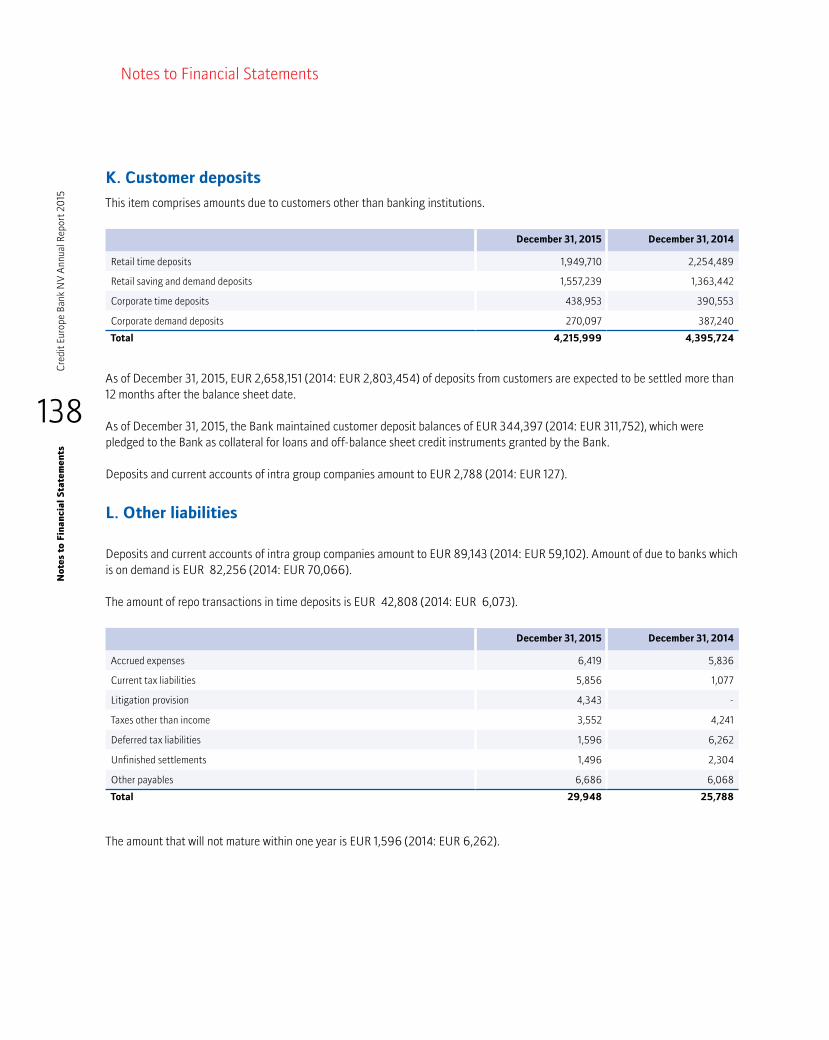
K. Customer deposits
This item comprises amounts due to customers other than banking institutions.
December 31, 2015 December 31, 2014
Retail time deposits 1,949,710 2,254,489
Retail saving and demand deposits 1,557,239 1,363,442
Corporate time deposits 438,953 390,553
Corporate demand deposits 270,097 387,240
Total 4,215,999 4,395,724
As of December 31, 2015, EUR 2,658,151 (2014: EUR 2,803,454) of deposits from customers are expected to be settled more than 12 months after the balance sheet date.
As of December 31, 2015, the Bank maintained customer deposit balances of EUR 344,397 (2014: EUR 311,752), which were pledged to the Bank as collateral for loans and off-balance sheet credit instruments granted by the Bank.
Deposits and current accounts of intra group companies amount to EUR 2,788 (2014: EUR 127).
L. Other liabilities
Deposits and current accounts of intra group companies amount to EUR 89,143 (2014: EUR 59,102). Amount of due to banks which is on demand is EUR 82,256 (2014: EUR 70,066).
The amount of repo transactions in time deposits is EUR 42,808 (2014: EUR 6,073).
December 31, 2015 December 31, 2014
Accrued expenses 6,419 5,836
Current tax liabilities 5,856 1,077
Litigation provision 4,343 -
Taxes other than income 3,552 4,241
Deferred tax liabilities 1,596 6,262
Unfinished settlements 1,496 2,304
Other payables 6,686 6,068
Total 29,948 25,788
The amount that will not mature within one year is EUR 1,596 (2014: EUR 6,262).
138
No
tes
to F
inan
cial
Sta
tem
ents
Cre
dit E
urop
e Ba
nk N
V A
nnua
l Rep
ort 2
015
Notes to Financial Statements

M. Subordinated liabilities
Issued liabilities qualify as subordinated debt if claims by the holders are subordinated to all other current and future liabilities of CEB. This liability qualifies as capital, taking into account remaining maturities, for the purpose of determining the consolidated capital adequacy ratio for the Dutch Central Bank (De Nederlandsche Bank - DNB).
Year of maturity December 31, 2015 December 31, 2014
USD 400 million Tier II loan with a fixed interest rate of 8% per annum 2023 378,014 338,751
USD 50 million Tier II loan with a fixed interest rate of 10% per annum 2022 46,327 41,562
Total 424,341 380,313
The Bank had not any defaults on principal, interest or other breaches with respect to its subordinated liabilities during the years ended 2015 and 2014.
N. Share capital
The authorized share capital is EUR 1,000 million (2014: EUR 1,000 million) and comprises 1,000 million (2014: 1,000 million) ordinary shares with a face value of EUR 1.
The called-up and paid-in capital consists of 632.5 million (2014: 429.5 million) ordinary shares with a face value of EUR 1.
O. Legal reserves
Under Dutch GAAP, legal reserves are required in certain circumstance. The objective of these legal reserves is to protect the creditors (i.e. the bank is only allowed to pay out profits to its shareholders that it has realized or can realize when the bank wants to). Legal reserves only relate to the Bank Financial Statements and are not applicable to the Consolidated Financial Statements. Profits of participations cannot be paid out to the Bank due to local legal requirements.
For CEB, the following legal reserves are important:• Participations reserve • Currency translation differences reserve • Revaluation for AFS instruments reserve • Hedge accounting reserve
In determining legal reserves deferred taxes on AFS instruments and revaluation reserves of buildings are taken into account. Deferred taxes attributable to equity are calculated on the difference between IFRS and tax values of AFS instruments and buildings. Hedge accounting reserves are subject to the participation exemption regime according to Dutch tax laws. Accordingly, profits and losses from participations are not taxable in The Netherlands. Due to the participation exemption regime, in practice, the participation hedge results are carried into statement of income for tax purposes and then exempted from taxable profit.
P. Commitments and contingencies
To meet the financial needs of customers, the Bank issues various irrevocable commitments and contingent liabilities. Even though these obligations may not be recognized on the balance sheet, they do contain credit risk and are, therefore, part of the overall risk of the Bank. In many instances, the amount recognized on the balance sheet for incurred obligations does not represent the loss potential of the arrangement in full.
Letters of credit, guarantees and acceptances commit the Bank to make payments on behalf of customers, contingent on the failure of the customer to perform under the terms of the contract. Guarantees carry the same credit risk as loans. Credit guarantees can be in the form of bills of exchange, irrevocable letters of credit, advance payment guarantees and endorsement liabilities from bills rediscounted.
139
No
tes to Finan
cial Statem
ents
Credit Europe Bank N
V Annual Report 20
15
Notes to Financial Statements

140
No
tes
to F
inan
cial
Sta
tem
ents
Cre
dit E
urop
e Ba
nk N
V A
nnua
l Rep
ort 2
015
Notes to Financial Statements
Commitments to extend credit represent contractual commitments to make loans and revolving credits. Commitments generally have fixed expiration dates, or other termination clauses. Since commitments may expire without being drawn upon, the total contract amounts do not necessarily represent future cash requirements. With respect to credit risk on commitments to extend credit, the Bank is potentially exposed to loss equal to the total unused commitments.
However, the likely amount of loss is less than the total unused commitments since most commitments to extend credit are contingent upon customers maintaining specific standards. The Bank monitors the term-to-maturity of credit commitments because longer-term commitments generally have a greater degree of credit risk than shorter-term commitments.
December 31, 2015 December 31, 2014
Contingent liabilities with respect to irrevocable letters of credit - import 221,857 281,862
Contingent liabilities with respect to irrevocable letters of credit - export 43,344 20,199
Contingent liabilities with respect to letters of guarantee granted - corporates 36,945 35,594
Contingent liabilities with respect to letters of guarantee granted - banks 32,543 74,072
Total non-cash loans 334,689 411,727
Revocable credit-line commitments 51,633 22,148
Total 386,322 433,875
Q. Litigation claims
Litigation is a common occurrence in the Banking industry due to the nature of the business. The Bank has an established protocol for dealing with such legal claims. Once professional advice has been obtained and the amount of damages reasonably estimated, the Bank makes adjustments to account for any adverse effects the claims may have on its financial standing.
R. Rental and lease contracts
The Bank leases a number of property and equipment under operating lease. The amounts can be specified as follows:Operating lease commitment - Bank as lessee and rent commitments;
December 31, 2015 December 31, 2014
Not later than 1 year 220 243
Later than 1 year and not later than 5 years 295 180
Total 515 423
S. Remuneration
Key management costs including remuneration and fees;
December 31, 2015 December 31, 2014
Total remuneration to supervisory board members 1,158 1,146
Total remuneration to managing board members 3,055 2,533
Total 4,213 3,679

141
No
tes to Finan
cial Statem
ents
Credit Europe Bank N
V Annual Report 20
15
Notes to Financial Statements
Pension plan contribution amount is EUR 163 (2014: EUR 146).
Managing Board December 31, 2015 December 31, 2014
Loans and advances
Outstanding at 1 January 367 44
Granted during the year 33 365
Repaid during the year (73) (42)
Outstanding at 31 December 327 367
These transactions were concluded at staff terms and market rates. The average interest rate on fixed-interest loans in EUR provided to the Managing Board members was 6.05% in 2015 (2014: 6.05%). There is no guarantee provided to Managing and Supervisory Board members.
Amsterdam, March 11, 2016
Supervisory Board: Managing Board:Hector De Beaufort Murat BasbayMurat Özyeğin ŞenolAloğluFrits Deiters Umut BayoğluMehmetGüleşci ScottCheungKorkmaz Ilkorur Levent Karaca Onur Umut

142
Cre
dit E
urop
e Ba
nk N
V A
nnua
l Rep
ort 2
015
Oth
er I
nfo
rmat
ion
Other Information
Proposed profit appropriation
The profit is appropriated pursuant to Article 31 of the Articles of Association of CEB; the relevant stipulations are as follows:• The profits shall be at the disposal of the General Meeting of Shareholders.• Dividends may be paid only up to an amount that does not exceed the distributable part of net assets.• Dividends shall be paid after adoption of the annual accounts from which it appears that payment of dividends is permissible.
It is proposed to appropriate net profit pursuant to the Articles of Association, as follows:
Proposed profit appropriation
Net profit 46,814
Addition to retained earnings pursuant to Article 31 of the Articles of Association 46,814
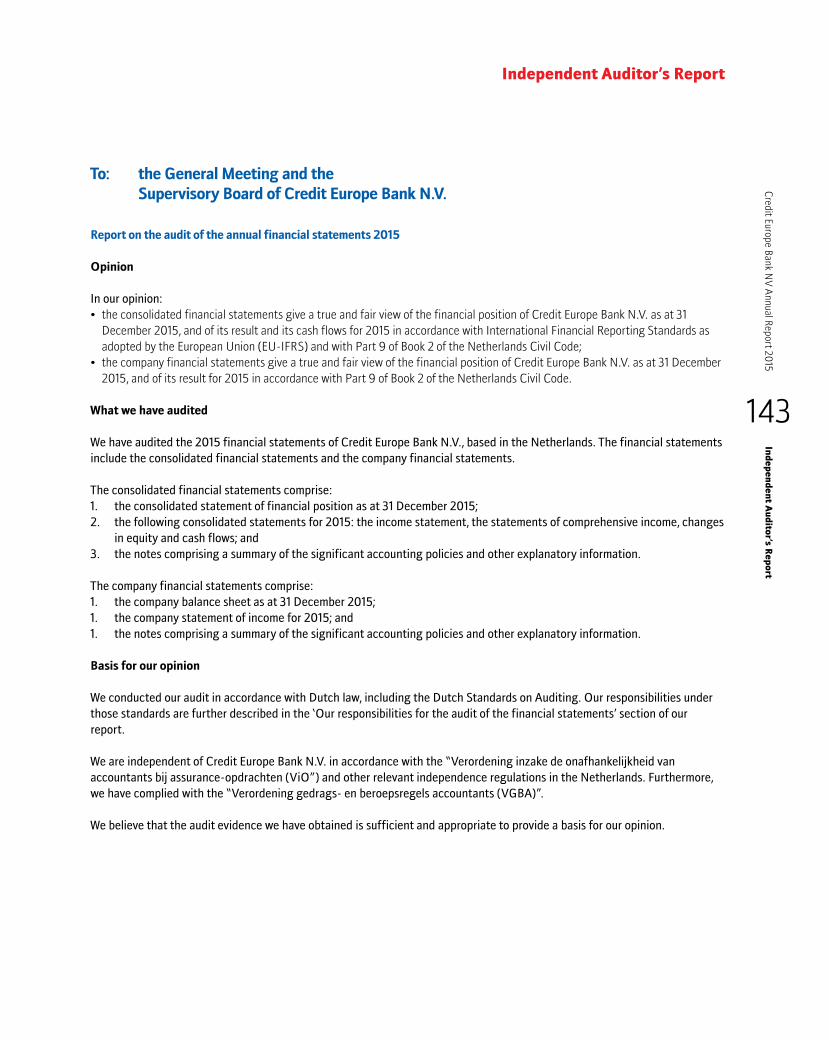
143
Ind
epen
den
t Au
ditor’s R
eport
Credit Europe Bank N
V Annual Report 20
15
To: the General Meeting and the Supervisory Board of Credit Europe Bank N.V.
Report on the audit of the annual financial statements 2015
Opinion
In our opinion:• the consolidated financial statements give a true and fair view of the financial position of Credit Europe Bank N.V. as at 31
December 2015, and of its result and its cash flows for 2015 in accordance with International Financial Reporting Standards as adopted by the European Union (EU-IFRS) and with Part 9 of Book 2 of the Netherlands Civil Code;
• the company financial statements give a true and fair view of the financial position of Credit Europe Bank N.V. as at 31 December 2015, and of its result for 2015 in accordance with Part 9 of Book 2 of the Netherlands Civil Code.
What we have audited
We have audited the 2015 financial statements of Credit Europe Bank N.V., based in the Netherlands. The financial statements include the consolidated financial statements and the company financial statements.
The consolidated financial statements comprise: 1. the consolidated statement of financial position as at 31 December 2015; 2. the following consolidated statements for 2015: the income statement, the statements of comprehensive income, changes
in equity and cash flows; and 3. the notes comprising a summary of the significant accounting policies and other explanatory information.
The company financial statements comprise: 1. the company balance sheet as at 31 December 2015;1. the company statement of income for 2015; and 1. the notes comprising a summary of the significant accounting policies and other explanatory information.
Basis for our opinion
We conducted our audit in accordance with Dutch law, including the Dutch Standards on Auditing. Our responsibilities under those standards are further described in the ‘Our responsibilities for the audit of the financial statements’ section of our report.
We are independent of Credit Europe Bank N.V. in accordance with the “Verordening inzake de onafhankelijkheid van accountants bij assurance-opdrachten (ViO”) and other relevant independence regulations in the Netherlands. Furthermore, we have complied with the “Verordening gedrags- en beroepsregels accountants (VGBA)”.
We believe that the audit evidence we have obtained is sufficient and appropriate to provide a basis for our opinion.
Independent Auditor’s Report
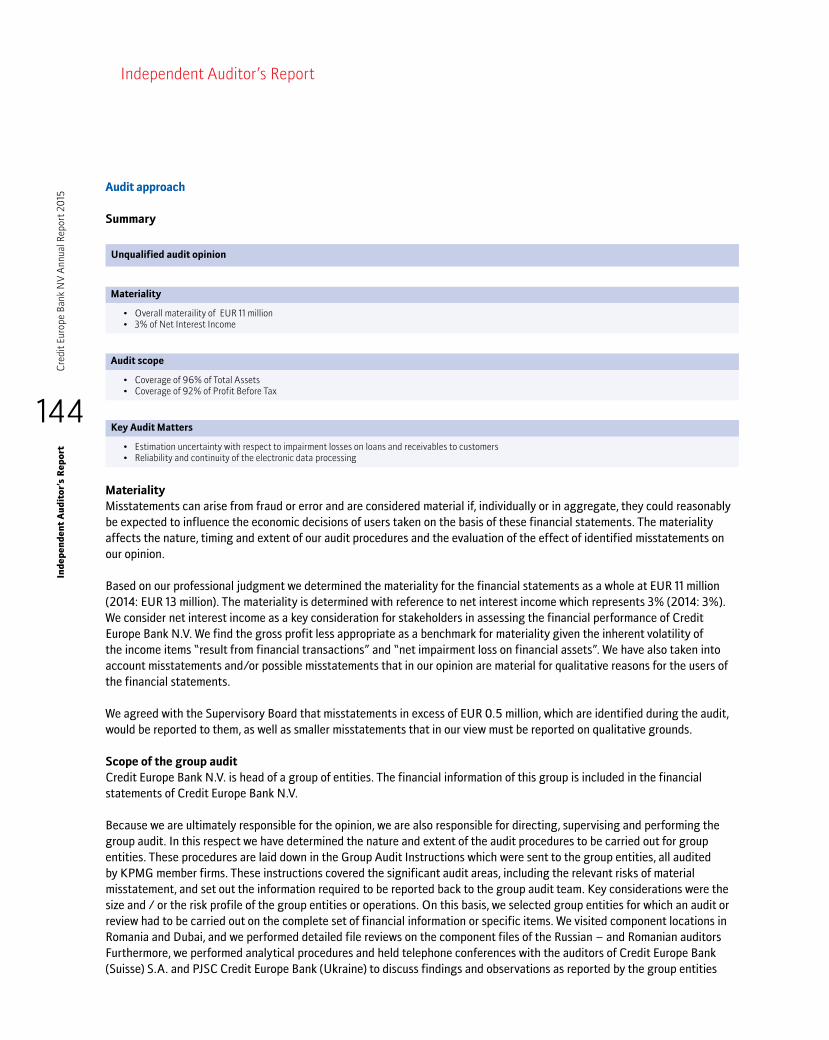
144
Cre
dit E
urop
e Ba
nk N
V A
nnua
l Rep
ort 2
015
Ind
epen
den
t A
ud
itor
’s R
epor
t
Audit approach
Summary
Unqualified audit opinion
Materiality
• Overall materaility of EUR 11 million• 3% of Net Interest Income
Audit scope
• Coverage of 96% of Total Assets• Coverage of 92% of Profit Before Tax
Key Audit Matters
• Estimation uncertainty with respect to impairment losses on loans and receivables to customers • Reliability and continuity of the electronic data processing
MaterialityMisstatements can arise from fraud or error and are considered material if, individually or in aggregate, they could reasonably be expected to influence the economic decisions of users taken on the basis of these financial statements. The materiality affects the nature, timing and extent of our audit procedures and the evaluation of the effect of identified misstatements on our opinion.
Based on our professional judgment we determined the materiality for the financial statements as a whole at EUR 11 million (2014: EUR 13 million). The materiality is determined with reference to net interest income which represents 3% (2014: 3%). We consider net interest income as a key consideration for stakeholders in assessing the financial performance of Credit Europe Bank N.V. We find the gross profit less appropriate as a benchmark for materiality given the inherent volatility of the income items “result from financial transactions” and “net impairment loss on financial assets”. We have also taken into account misstatements and/or possible misstatements that in our opinion are material for qualitative reasons for the users of the financial statements.
We agreed with the Supervisory Board that misstatements in excess of EUR 0.5 million, which are identified during the audit, would be reported to them, as well as smaller misstatements that in our view must be reported on qualitative grounds.
Scope of the group auditCredit Europe Bank N.V. is head of a group of entities. The financial information of this group is included in the financial statements of Credit Europe Bank N.V.
Because we are ultimately responsible for the opinion, we are also responsible for directing, supervising and performing the group audit. In this respect we have determined the nature and extent of the audit procedures to be carried out for group entities. These procedures are laid down in the Group Audit Instructions which were sent to the group entities, all audited by KPMG member firms. These instructions covered the significant audit areas, including the relevant risks of material misstatement, and set out the information required to be reported back to the group audit team. Key considerations were the size and / or the risk profile of the group entities or operations. On this basis, we selected group entities for which an audit or review had to be carried out on the complete set of financial information or specific items. We visited component locations in Romania and Dubai, and we performed detailed file reviews on the component files of the Russian – and Romanian auditors Furthermore, we performed analytical procedures and held telephone conferences with the auditors of Credit Europe Bank (Suisse) S.A. and PJSC Credit Europe Bank (Ukraine) to discuss findings and observations as reported by the group entities
Independent Auditor’s Report

145
Credit Europe Bank N
V Annual Report 20
15In
dep
end
ent A
ud
itor’s Rep
ort
Independent Auditor’s Report
in order to corroborate our assessment that there are no significant risks of material misstatement within these remaining components.
By performing the procedures mentioned above, together with additional procedures at group level, we have been able to obtain sufficient and appropriate audit evidence about the group’s financial information to provide an opinion about the financial statements.
Our key audit mattersKey audit matters are those matters that, in our professional judgment, were of most significance in our audit of the financial statements. We have communicated the key audit matters to the Supervisory Board. The key audit matters are not a comprehensive reflection of all matters discussed.
These matters were addressed in the context of our audit of the financial statements as a whole and in forming our opinion thereon, and we do not provide a separate opinion on these matters.
Estimation uncertainty with respect to impairment losses on loans and receivables to customers
Loans and receivables are measured at amortized cost less impairments. Certain aspects of the accounting for loan loss impairments require significant judgment, such as the identification of loans that are deteriorating, the assessment of objective evidence for impairment, the value of collateral and the assessment of the recoverable amount. Credit Europe Bank N.V. determines impairments through an individual impairment assessment of (individually significant) loans, and in addition to that, for loans not individually tested, through a collective impairment.The accounting policy on recognition and measurement of impairment on loans and receivables is included in note 3.c.i in the financial statements. Credit Europe Bank N.V. provides loans and receivables to corporate and retail customers, that account for 65% of total assets. The loans are provided to customers from various countries, with a concentration of customers from developed markets consisting of 30% share of total loans and receivables (2014: 30%), Russia as 27% (2014: 34%), Turkey as 23% (2014: 17%) and Romania as 16% (2014: 16%).
Due to size of the loans and receivables, the concentration risks, and the inherent complexity and subjectivity of the estimation of the impairment losses, we treat impairment of loans and receivables as a key audit matter.
Our responseWe have performed audit procedures aimed at the design, implementation and operating effectiveness of internal controls within the approval, recording and monitoring of loans and receivables. We assessed the controls regarding the identification of impairment triggers and the calculation of individual impairments. For the collective impairments we assessed the controls related to the use of methodologies, inputs and assumptions in calculating the collectively assessed impairments for loan losses.
In addition to the testing of internal controls, we also performed detailed audit procedures on a sample basis on individual credit files. These procedures were to assess the correct identification of impairment triggers and, when impairment triggers exist, the plausibility of managements’ judgments and assumptions by comparing these judgments and assumptions to available financial and other internal and external information. With respect to the collective provisions, we have, among others compared the assumptions used to historical and recent loan loss statistics for essential parameters.
In our audit work we took into account the fact that the macro-economic conditions continued to be in downward trend, in particular in Russia and Ukraine following the Ukraine crisis, the lower oil prices and decreased trading volumes.
Our observation
Based on our audit procedures we assessed that the impairment of loans and receivables are balanced and in accordance with the accounting policies on
page 56.
Profit before tax
Fullscopeaudits
Auditproceduresatgrouplevel
Total assets
Fullscopeaudits
Auditproceduresatgrouplevel
Outofscope Outofscope
146
Cre
dit E
urop
e Ba
nk N
V A
nnua
l Rep
ort 2
015
Ind
epen
den
t A
ud
itor
’s R
epor
t
Independent Auditor’s Report
Reliability and continuity of the electronic data processing
DescriptionCredit Europe Bank is highly dependent on its IT systems for the continuity of its operations and reliable financial reporting. Credit Europe Bank it is continuously improving the efficiency and effectiveness of the IT-infrastructure and the reliability and continuity of the electronic data processing. We have therefore identified this as a key audit matter.
Our responseWe have assessed the implementation and execution of the controls, such as access management, change management, computer operations and business continuity policies & procedures, to ensure reliability and continuity of the IT systems, to the extent necessary within the scope of our audit and ensure compliance. For that purpose we included IT-auditors and IT infrastructure specialists in our audit team, both at the level of the parent company as well as at the level of the local group entities. Our procedures included the assessment of the implemented controls, technical audits, internal controls testing and review of IAD reports.
Our observation
As a result of our procedures, we did not identify any material shortcomings regarding the reliability and continuity of the electronic data processing.
Responsibilities of the Managing Board and the Supervisory Board for the financial statementsThe managing board is responsible for the preparation and fair presentation of the financial statements in accordance with EU-IFRS and with Part 9 of Book 2 of the Netherlands Civil Code and for the preparation of the report by the managing board in accordance with Part 9 of Book 2 of the Netherlands Civil Code. Furthermore, the managing board is responsible for such internal control as the managing board determines is necessary to enable the preparation of the financial state-ments that are free from material misstatement, whether due to errors or fraud.
As part of the preparation of the financial statements, the managing board is responsible for assessing the company’s ability to continue as a going concern. Based on the financial reporting framework mentioned, the managing board should prepare the financial statements using the going concern basis of accounting unless the managing board either intends to liquidate the company or to cease operations, or has no realistic alternative but to do so. The managing board report should disclose events and circumstances that may cast significant doubt on the company’s ability to continue as a going concern in the financial statements.
The Supervisory Board is responsible for overseeing the company’s financial reporting process.
Our responsibilities for the audit of financial statementsOur objective is to plan and perform the audit to obtain sufficient and appropriate audit evidence for our opinion. Our audit has been performed with a high, but not absolute, level of assurance, which means we may not have detected all errors and fraud. For a further description of our responsibilities in respect of an audit of financial statements we refer to the website of the professional body for accountants in the Netherlands (NBA) www.nba.nl/standardtexts-auditorsreport.
Report on other legal and regulatory requirementsReport on the report by the managing board report and the other informationPursuant to legal requirements of Part 9 of Book 2 of the Netherlands Civil Code (concerning our obligation to report about the managing board report and other information): • We have no deficiencies to report as a result of our examination whether the managing board report, to the extent we can
assess, has been prepared in accordance with Part 9 of Book 2 of the Netherlands Civil Code, and whether the information as required by Part 9 of Book 2 of the Netherlands Civil Code has been annexed.
• We report that the report by the managing board, to the extent we can assess, is consistent with the financial statements.

147
Credit Europe Bank N
V Annual Report 20
15In
dep
end
ent A
ud
itor’s Rep
ort
Independent Auditor’s Report
EngagementWe were appointed by the Supervisory Board as auditor of Credit Europe Bank N.V. as of the audit for year 2007 and have operated as statutory auditor ever since then. Due to rotation requirements, the audit for the year 2016 will be our last year of audit of the financial statements.
Amstelveen, 11 March 2016KPMG Accountants N.V.
M. Frikkee RA


Head office
Credit Europe Bank NVKarspeldreef 6a1101 CJ AmsterdamThe Netherlandst�31(0)203576300f�31(0)203576301www.crediteuropebank.com www.crediteurope.nl
Branches
Credit Europe Bank NV Niederlassung DeutschlandUntermainkai 27-28 60329 Frankfurt/MainGermanyt�49(0)692562600f�49(0)6925626033www.crediteurope.de
Credit Europe Bank NVFrankrijklei 1212000 Antwerpen Belgiumt�32(0)32065671f�32(0)32065611www.crediteurope.be
Credit Europe Bank NVMalta BranchTower Road 143/2Sliema SLM 1604Maltat�356(0)22602100f�356(0)22602190www.crediteurope.com.mt
Representative offices
Credit Europe Bank NVIstanbul Temsilcilik OfisiEski Büyükdere Caddesi No: 22Park Plaza Kat 10Maslak 34398 IstanbulTurkeyt�90(0)2123660101f�90(0)2123660105
Credit Europe Bank NVUnit 4609, Plaza 66,1266 Nanjing West RoadShanghai 200040Chinat�86(0)2161361818f�86(0)2162885365
Direct subsidiaries
Credit Europe Bank LtdOlimpiyskiy prospect, 14Moscow 129090 Russiat�7(0)4957254040f�7(0)4957254041www.crediteurope.ru
Credit Europe Leasing LLCLeningradskiy Prospect 74A Moscow 125315 Russiat�7(0)4957255656f�7(0)4957255444www.crediteuropeleasing.ru
Credit Europe Bank (Romania) SAAnchor Plaza Building, B section26Z Timisoara Blvd., 6th districtBucharestRomaniat�40(0)214064000f�40(0)213172066www.crediteurope.ro
Credit Europe Bank (Suisse) SA12, Rue du Mt. Blanc1211 GenevaSwitzerlandt�41(0)228391919f�41(0)228391900www.crediteurope.ch
CJSC Credit Europe Bank (Ukraine)2, Mechnikova Str.9th Floor ‘Parus’ Business Center01601, KievUkrainet�380(0)443906733f�380(0)443906717www.crediteurope.com.ua
PJSC Credit Europe Bank101, Volodymyrska Str.01033, KievUkrainet�380(0)443906733f�380(0)443906717www.crediteurope.com.ua
Credit Europe Bank (Dubai) LtdCurrency House Office Building 1Level 7, Unit 7Al Fattan Area, DIFCDubaiUnited Arab Emiratest�97144387100f�97144387175

Our Network
Western Europe•CorporateBankingandtradefinanceservicesfromtheNetherlands,SwitzerlandandMalta•PrivatebankingservicesfromSwitzerland•Strongfocusondirectbankingservices
•RetailBankingservicestoalmosthalfamillioncustomersinGermany,theNetherlands,BelgiumandMalta
•MultilingualcontactcenterinFrankfurt
Russia•ActiveinRetail,Corporate,CommercialandSMEBanking
Romania•ActiveinRetailandCommercialBanking
Ukraine•ActiveinCorporate,
CommercialandSMEBanking
Turkey•RepresentativeofficeinIstanbul
Outside Europe•TradefinanceservicesfromtheDubaiInternational
FinancialCentreintheUnitedArabEmirates•RepresentativeofficeinShanghai,China
www.crediteuropebank.com