2015 csfwc proceedings mned - nita...
TRANSCRIPT
Cumberland-Shenandoah Fruit Workers
Conference
December
3rd & 4th, 2015
Winchester, Virginia
PROCEEDINGS
91st Annual

2
(FOR ADMINISTRATIVE USE ONLY)
Proceedings of the
Cumberland‐Shenandoah
Fruit Workers Conference
91st Annual Meeting
December 3rd and 4th, 2015
Hampton Inn and Conference Center
Winchester, VA
Mizuho Nita
Alson H. Smith Jr. Agricultural Research and Extension Center
Virginia Polytechnic Institute
Winchester, VA

3
Table of Contents List of past and current exextive officers .......................................................................................... 5
2015 Cumberland‐Shenandoah Fruit Workers Conference Participants ............................................ 6
2015 CSFWC Program ....................................................................................................................... 9
Business and Financial Reports .............................................................................................. 14 2015 CSFWC Conference Business Meeting Minutes ....................................................................... 15
Treasurer’s Report ......................................................................................................................... 17
Call of the States ................................................................................................................... 19 CALL OF THE STATES – MARYLAND ................................................................................................. 20
CALL OF THE STATES – NEW JERSEY ................................................................................................ 21
Call of the States – New York 2015 ................................................................................................. 24
CALL OF THE STATES – PENNSYLVANIA ........................................................................................... 28
CALL OF THE STATES – VIRGINIA ..................................................................................................... 31
CALL OF STATES – WEST VIRGINIA .................................................................................................. 33
Breakout session: Entomology............................................................................................... 34 PARASITIZATION OF DROSOPHILIDS IN VIRGINIA SMALL FRUIT CROPPING SYSTEMS ...................... 35
James C. E. Wahls and Douglas G. Pfeiffer
HUNTING DOWN THE HUNTERS: H. HALYS EGG DAMAGE AND NATURAL ENEMIES ........................ 41
William R. Morrison III1, Clarissa R. Mathews2, Tracy C. Leskey1
CHARACTERIZATION OF THE FEEDING INJURY CAUSED BY HALYOMORPHA HALYS NYMPHS ON
APPLE AND PEACH AT HARVEST ..................................................................................................... 42
Angelita L. Acebes1,*, Tracy C. Leskey2, and J. Christopher Bergh1
HANDS ON APPLE IPM PROJECT ON NORTHEASTERN NY ORCHARDS .............................................. 43
Anna Wallis
EVALUATION OF A NOVEL ATTRACT‐&‐KILL TECHNOLOGY FOR CONTROL OF ORIENTAL BEETLE IN
BLUEBERRIES USING SPLAT‐ORB‐A&K™ .......................................................................................... 44
Cesar Rodriguez‐Saona1, Robert Holdcraft1, and Agenor Mafra‐Neto2
ASSESSMENT OF SOIL TREATMENT WITH NEEM CAKE ON BACTROCERA DORSALIS LARVAL
MORTALITY IN THE LAB .................................................................................................................. 49
Assa Balayara and Douglas G. Pfeiffer
EVALUATION OF NATIVE NEW YORK ENTOMOPATHOGENIC NEMATODES FOR BIOCONTROL OF
PLUM CURCULIO IN APPLE ORCHARDS ........................................................................................... 52
T. Lessord1, A. Agnello1, T. Testa2, E. Shields2, K. Wickings1
Ambrosia beetle (Xylosandrus germanus) infestations and management trials in high‐density apple
orchards ......................................................................................................................................... 55
Arthur Agnello, Deborah Breth, Abagail Davis and Elizabeth Tee
Breakout session: Plant Pathology ......................................................................................... 58 MANAGEMENT OF PEACH DISEASES: INTEGRATION OF NEW FUNGICIDES WITH STANDARDS ........ 59
Norman Lalancette and Lorna Blaus
MANAGEMENT OF PEACH BLOSSOM BLIGHT AND RUSTY SPOT ...................................................... 69
Norman Lalancette, Lorna Blaus, and Stephanie Rossi
Efficacy and crop safety of kasugamycin:control of bacterial spot on peach ................................... 74

4
Norman Lalancette, Lorna Blaus, and Stephanie Rossi
2015 EVALUATION OF PROGRAMS TO MANAGE BACTERIAL SPOT AND BROWN ROT ON PEACH IN
PENNSYLVANIA .............................................................................................................................. 90
Kari. A. Peter, Brian L. Lehman, and Carl E. Bower
2015 EVALUATION OF REGISTERED AND UNREGISTERED FUNGICIDES TO MANAGE APPLE DISEASES
IN PENNSYLVANIA .......................................................................................................................... 94
Kari. A. Peter, Brian L. Lehman, and Carl E. Bower
Determining efficacy of pruning wounds protection treatments against Botryosphaeria infection on
wine grapes.................................................................................................................................... 98
Gregory Klinger and Mizuho Nita
SCREENING FOR QOI RESISTANCE AMONG SEVERAL COLLETOTRICHUM SPECIES ASSOCIATED WITH
RIPE ROT OF GRAPE FOUND IN VA VINEYARDS ............................................................................. 100
Amanda Bly, Mizuho Nita
2015 EVALUATION OF PROGRAMS TO MANAGE BLOSSOM BLIGHT ON GALA IN PENNSYLVANIA . 101
Brian L. Lehman, Carl E. Bower, and Kari A. Peter
Organic Fungicide and Wine Grape Cultivar Trial Updates ............................................................ 103
Sabrina Hartley, and Mizuho Nita
Mid Atlantic Tree Fruit Integrated Pest Information Platform for Extension and Education (iPiPE)
Update ......................................................................................................................................... 104
Mahfuz Rahman and Erin Young
NPN MEMBRANE GRAPEVINE VIRUS SAMPLING TECHNIQUE FOR EFFICIENT NUCELIC ACID STORAGE
AND TESTING ............................................................................................................................... 105
Taylor Jones and Mizuho Nita
Fungicide performance trials on downy mildew, powdery mildew, black rot, and ripe rot. ........... 107
Mizuho Nita, Sabrina Hartley, and Amanda Bly
Highlights of Fire Blight Testing on Apple, 2015 ............................................................................ 113
Highlights of Apple Fungicide Testing, 2015 .................................................................................. 113
Disease Control and Phytotoxicity by Copper /Double Nickel Mixtures on Peach ......................... 113
Keith Yoder
Breakout session: Horticulture ............................................................................................ 161 LIFELINE™: A UNIQUE GLUFOSINATE FORMULATION FOR WEED CONTROL IN TREE FRUIT & VINE
CROPS .......................................................................................................................................... 162
TONY ESTES
HIGH DENSITY ORCHARDS IN THE MID‐ATLANTIC: FIELD TESTING ROOTSTOCKS FROM THE GENEVA
BREEDING PROGRAM ................................................................................................................... 163
A. Wallis
FINE‐TUNING FERTILIZER RECOMMENDATIONS FOR YOUNG APPLE TREES IN HIGH‐DENSITY
PLANTINGS................................................................................................................................... 164
Ashley Thompson and Gregory Peck
Acknowledgement .............................................................................................................. 175
5
List of past and current exextive officers 2016
President: James Walgenbach (NCSU)
Secretary/Treasure: Chris Bergh (VT)
President‐elect: Greg Krawczyk (PSU)
Immidiate‐past president: Mizuho Nita (VT)
2015
President: Mizuho Nita (VT)
Secretary/Treasure: Chris Bergh (VT)
President‐elect: James Walgenbach (NCSU)
Immidiate‐past president: Author Agnello (Cornell)

6
2015 Cumberland-Shenandoah Fruit Workers Conference Participants
Last Name First Name Affiliation Email
Acebes Angel Virginia Tech [email protected]
Agnello Art Cornell University [email protected]
Atanassov Atanas Rutgers University [email protected]
Balayara Assa Virginia Tech [email protected]
Beaulieu Justin University of Maryland [email protected]
Beatty Daniel Crop Protection Services [email protected]
Bergh Chris Virginia Tech [email protected]
Bly Amanda Virginia Tech [email protected]
Borden Matt Virginia Tech [email protected]
Bower Carl Pennsylvania State University [email protected]
Brandt Nate USDA/ARS [email protected]
Bush Haley USDA/ARS [email protected]
Carroll Juliet Cornell University [email protected]
Colitas Jim Marrone Bio Innovations [email protected]
Cox Kerik Cornell University [email protected]
Crim Larry USDA/ARS [email protected]
Cullum John USDA/ARS [email protected]
Davis Linda Wilbur‐Ellis [email protected]
Dimock Mike Certis [email protected]
Donahue Dan Cornell University [email protected]
Ellis Nik Norden Agricultural [email protected]
Engelman Jean Virginia Tech [email protected]
Ernest Emmalea University Delaware [email protected]
Estes Tony UPI [email protected]
Eve Jim Eve Farms Service, LLC [email protected]
Failon Brian True North Foliar
Frank Daniel West Virginia University [email protected]
Ganske Don DuPont [email protected]
Gohil Hemant NJ Cooperative Extension [email protected]
Gut Larry Michigan State University [email protected]
Hancock Torri USDA/ARS [email protected]
Hannig Greg DuPont [email protected]
Harper Jay Pennsylvania State University [email protected]
Hartley Sabrina Virginia Tech [email protected]
Highland Brett Certis [email protected]
Holowid John Arysta [email protected]
Hull Larry Hull Pest Management Services [email protected]
Irish‐Brown Amy Michigan State University [email protected]
Jentsch Peter Cornell University [email protected]

7
Johnson Tim Marrone Bio Innovations [email protected]
Jones Sharon USDA/ARS [email protected]
Jones Taylor Virginia Tech [email protected]
Kirfman Gary Valent USA [email protected]
Kleczewski Victoria DuPont [email protected]
Klinger Greg Virginia Tech [email protected]
Kon Thomas Pennsylvania State University [email protected]
Krawczyk Greg Pennsylvania State University [email protected]
Lachance Michael Virginia Tech [email protected]
Lalancette Norman Rutgers University [email protected]
Laub Curt Virginia Tech [email protected]
Leahy Kathleen Polaris Orchard Management [email protected]
Lehman Brian Pennsylvania State University [email protected]
Leskey Tracy USDA/ARS [email protected]
Lessord Tessa Cornell University [email protected]
Mackintosh Bill Crop Protection Services [email protected]
Mackintosh Taylor Mackintosh Fruit Farm [email protected]
Morrison Rob USDA/ARS [email protected]
Morton Vince Luxemborg‐Pamol [email protected]
Nicolosi Brandon USDA/ARS
Nielsen Anne Rutgers University [email protected]
Nita Mizuho Virginia Tech [email protected]
O'Donnell Catherine Wilbur‐Ellis [email protected]
Ogburn Emily North Carolina State University [email protected]
Outwater Cory Michigan State University [email protected]
Peter Kari Pennsylvania State University [email protected]
Pfeiffer Doug Virginia Tech [email protected]
Plasters Kevin Helena
Poling Brittany USDA/ARS [email protected]
Rahman Mahfuz West Virginia University [email protected]
Rice Kevin USDA/ARS [email protected]
Rodriguez‐Saona Cesar Rutgers University [email protected]
Rose Ann USDA/ARS [email protected]
Rosenberger David Cornell University [email protected]
Rouse Bob Agriculturalist LLC [email protected]
Rucker Ann Rutgers University [email protected]
Schmitt David Rutgers University [email protected]
Schoof Steve North Carolina State University [email protected]
Schupp Jim Pennsylvania State University [email protected]
Schut Kara Wilbur‐Ellis [email protected]
Shaak Lauren Pennsylvania State University [email protected]
Shannon Mark Pathway Logic

8
Shearer Peter Oregon State University [email protected]
Short Brent USDA/ARS [email protected]
Shrader Meredith Virginia Tech [email protected]
Simons Jeff JMS Flower Farm [email protected]
Slack Suzanne Virginia Tech [email protected]
Snyder Wade USDA/ARS [email protected]
Stamm Greg CBC America [email protected]
Steffel Jim Lehigh Agri and Bio Services [email protected]
Stewart Amanda Virginia Tech [email protected]
Straub Valen Lehigh Agri and Bio Services
Sudeep Mathew Syngenta [email protected]
Sundin George Michigan State University [email protected]
Thompson Ashley Virginia Tech [email protected]
Travis Jim Pennsylvania State University [email protected]
Vega Andy New England Fruit Consultants
Villani Sara North Carolina State University [email protected]
Wahls James Virginia Tech [email protected]
Walgenbach Jim North Carolina State University [email protected]
Wallis Anna Cornell University [email protected]
Walsh Chris University of Maryland [email protected]
Webb Kevin USDA/ARS [email protected]
Wernstrom Brian Wilbur‐Ellis [email protected]
Whalen Joanne University Delaware [email protected]
Yoder Keith Virginia Tech [email protected]
Zemaitis Dan Wilbur‐Ellis [email protected]

9
2015 CSFWC Program
91st Annual Cumberland‐Shenandoah Fruit Workers Conference 2015 December 3‐4
Hampton Inn, Winchester, VA
Thursday, December 3rd 8:30 – 9:00 a.m. Registration 9:00 – 9:05 a.m. Call to order – Washington Room 9:09 – 10:00 a.m. Call of the States 10:00 – 10:45 a.m. General Session I: The Brown Marmorated Stink Bug Tale: From Chance
Encounters to Encountering Chances Tracy Leskey, USDA/ARS
10:45 – 11:00 a.m. Break 11:00 – 12:00 p.m. General Session II: Industry Update Roundtable
1. Update on Certis Biopesticides for Use in Eastern US Fruit Production, Brett Highland, Certis
2. New Arysta LifeScience, John Holowid, Arysta Life Science 3. Aprovia: New Fungicide for Apples and Grapes, Sudeep Mathew,
Syngenta 4. ProPhyt and Viathon Two Fungicides from Luxembourg Industries, Vince
Morton, Luxembourg‐Pamol 5. Uses of JMS Stylet‐Oil in a Grape and Apple Spray Program, Jeff Simons,
JMS Flower Farms 12:00 – 1:00 p.m. Lunch 1:00 – 5:00 p.m. Concurrent Sessions (note: Plant path session starts on 12:45)
Entomology – Washington Room Horticulture – Madison Room Plant Pathology ‐ Jefferson Room
3:00 – 3:15 p.m. Break 3:15 – 5:00 p.m. Resume concurrent sessions 5:30 – 7:30 p.m. Industry sponsored mixer Friday December 4th 8:00 – 9:00 a.m. Business Meeting 9:00 – 12:00 p.m. Concurrent Sessions Continued Noon Adjourn
Many thanks to our Industry sponsors: Albaugh, Arysta LifeScience, Bayer, Certis, DuPont, Gowan, Helena, JMS Flower Farms, Luxemburg–Pamol, Marrone Bio Innovations, Pathway, Syngenta, True
North Foliar, UPI, and Valent

10
Entomology Thursday, December 3 1:00‐1:15 Attractiveness of Male and Female Oriental Fruit Moth to Various Lure Components
Jim Walgenbach and Steve Schoof, North Carolina State University 1:15‐1:30 Effectiveness of Spotted Wing Drosophila Monitoring Traps
Larry Gut, Danielle, Kirkpatrick and James Miller, Michigan State University 1:30‐1:45 Parasitization of Drosophilids in Virginia Small Fruit Cropping Systems
James Wahls and Doug Pfeiffer, Virginia Tech 1:45‐2:00 Foraging Behavior of Spotted Wing Drosophila
Kevin Rice, Sharon Jones, Brent Short and Tracy Leskey, USDA/ARS 2:00‐2:15 Brown Marmorated Stink Bug Damage to Apples at Different Growth Stages
Throughout the Season Emily Ogburn and Jim Walgenbach, North Carolina State University
2:15‐2:30 Hunting Down the Hunters: H. halys Egg Damage And Natural Enemies William. Morrison III1, Clarissa Mathews2 and Tracy Leskey1, 1 USDA/ARS, 2 Shepherd University
2:30‐2:45 Characterization of the Feeding Injury Caused By Halymorpha halys Nymphs on Apple and Peach at Harvest Angelita Acebes‐Doria1, Chris Bergh1 and Tracy Leskey2, 1 Virginia Tech, 2 USDA/ARS
2:45‐3:00 Survey of Halyomorpha halys Natural Enemies in Northern Virginia, 2015 Chris Bergh1, Angelita Acebes‐Doria1 and Elijah Talamas2, 1Virginia Tech, 2USDA/ARS
3:00‐3:15 Break 3:15‐3:30 Changes In Monitoring and Management of Orchard Pests – 2015 PA and NC
Experience Greg Krawczyk1, James Walgenbach2 and Lauren Shaak2, 1 Penn State, 2North Carolina
State University 3:30‐3:45 Hands‐On Apple IPM Project in Northeastern NY Commercial Orchards Anna Wallis, Arthur Agnello and Harvey Reissig, Cornell University 3:45‐4:00 IPM‐CPR: Review of Tactics to Balance Pests and Beneficials Anne Nielsen, Brett Blaauw and Dean Polk, Rutgers University 4:00‐4:15 SPLAT‐OB‐A&K: A Novel Attract‐and‐Kill Technology for Oriental Beetle Control Cesar Rodriguez‐Saona1, Robert Holdcraft1 and Agenor Maria‐Neto2, 1Rutgers University,
2ISCA Technologies 4:15‐4:30 Mating Disruption for Control of Peachtree Borers in Small Block Orchards Daniel Frank and Stephen Starcher, West Virginia University 4:30‐4:45 Assessment of Soil Treatment with Neem Cake on Bactrocera dorsalis Larval Mortality
in the Lab Assa Balayara and Doug Pfeiffer, Virginia Tech 4:45‐5:00 Evaluation of Native New York Entomopathogenic Nematodes for Biocontrol Against
Plum Curculio in Apple Orchards Tessa Lessord, Arthur Agnello, and Elison Shields, Cornell University 5:00‐5:15 Ambrosia beetle (Xylosandrus germanus) Infestations and Management Trials in High‐
Density Apple Orchards Arthur Agnello, Deborah Breth, Abbey Davis and John Vandenberg, Cornell University

11
Plant Pathology Thursday, December 3 (note: session starts on 12:45) 12:45‐1:00 Contribution of Mid‐Season Cover Sprays to Management of Peach Brown Rot at
Harvest II Norman Lalancette, Lorna Blaus, Joshua Gager and Kyle McFarland, Rutgers University 1:00‐1:15 Management of Peach Blossom Blight, Rusty Spot, and Brown Rot Norman Lalancette, Lorna Blaus and Stephanie Rossi, Rutgers University 1:15‐1:30 Efficacy and Crop Safety of Kasugamycin: Control of Bacterial Spot of Peach Norman Lalancette, Lorna. Blaus and Stephanie Rossi, Rutgers University 1:30‐1:45 2015 Evaluation of Programs to Manage Brown Rot and Bacterial Spot on Peach in
Pennsylvania Kari Peter, Brian Lehman and Carl Bower, Pennsylvania State University 1:45‐2:00 2015 Evaluation of Registered and Unregistered Fungicides to Manage Apple Diseases
in Pennsylvania Kari Peter, Brian Lehman and Carl Bower, Pennsylvania State University 2:00‐2:15 Fungi and the Wood: The Fungi Associated with the Black Stem Borer and its Galleries
in Malus Katrin Ayer, Sara Villani, and Kerik Cox, Cornell University 2:15‐2:30 Determining Efficacy of Pruning Wound Protection Treatments Against Botryosphaeria
Infection on Wine Grapes Gregory Klinger and Mizuho Nita, Virginia Tech 2:30‐2:45 Baseline Sensitivities to SDHI Fungicides and Characterization of the sdhB Gene in
Venturia Inaequalis Sara Villani, Katrin Ayer and Kerik Cox, Cornell University 2:45‐3:00 Screening for QoI Resistance Among Several Colletotrichum Species Associated with
Ripe Rot of Grape Found in VA Vineyards Amanda Bly and Mizuho Nita, Virginia Tech Break 3:15‐3:30 2015 Evaluation of Programs to Manage Blossom Blight on Gala in Pennsylvania Brian Lehman, Carl Bower and Kari Peter, Pennsylvania State University 3:30‐3:45 Blossom Protect for Fire Blight Control: Efforts to Increase Flower Colonization by the
Yeast, Aureobasidium pullulans George Sundin, Suzanne Slack, Samantha Gebben, Cory Outwater and Matt Grieshop,
Michigan State University 3:45‐4:00 Possible Strategies for Using Actigard for Fire Blight Management George Sundin and Cory Outwater, Michigan State University 4:00‐4:30 Highlights of Fire Blight Testing on Apple, 2015
Highlights of Apple Fungicide Testing, 2015 Disease Control and Phytotoxicity by Copper /Double Nickel Mixtures on Peach Keith Yoder, Virginia Tech
4:30‐4:45 Organic Fungicide and Wine Grape Cultivar Trial Updates Sabrina Hartley and Mizuho Nita, Virginia Tech 4:30‐4:45 Mid‐Atlantic Tree Fruit Integrated Pest Information Platform for Extension and
Education Update Mahfuz Rahman and Erin Young, West Virginia University

12
4:45‐5:00 NPN Membrane Grapevine Virus Sampling Technique for Efficient Nucleic Acid Storage and Testing
Taylor Jones and Mizuho Nita, Virginia Tech 5:00‐5:15 Fungicide Performance Trials on Downy Mildew, Powdery Mildew, Black Rot, and Ripe
Rot of grape Mizuho Nita, Sabrina Hartley and Amanda Bly, Virginia Tech

13
Horticulture
Thursday, Dec 3 1:00‐1:15 Planting Hole Amendment and Mulch Effects on Blueberry Establishment and Yield in
Southern Delaware Emmalea Ernest, University of Delaware 1:15‐1:30 Lifeline Herbicide: A Unique Glufosinate Formulation for Tree, Nut and Vine Crops Tony Estes, United Phosphorus 1:30‐1:45 Evaluation of Mechanical and Hand Artificial Spur Extinction for Crop Load
Management of Apple Jim Schupp, Edwin Winzeler, Melanie Schupp and Tom Kon, Pennsylvania State
University 1:45‐2:00 Can Delta A Maturity Measurements Be Used to Predict Storage Scald and Internal
Breakdown? Chris Walsh, B. Redman and Y. Yu, University of Maryland 2:00‐2:15 Field Testing Advanced Selections from the Geneva Apple Rootstock Breeding Program
in the Mid‐Atlantic Anna Wallis, Bryan Butler, Doug Price, Julia Harshman, Christopher Walsh and Gennaro
Fazio, Cornell University 2:15‐2:30 Evaluation of the 'Golden Delicious' Pollen Tube Growth Model as a Timing Aid for
Blossom Thinners Thomas Kon1, James R. Schupp1, Keith Yoder2, Gregory Peck2 and Leon Combs2,
1Pennsylvania State University, 2Virginia Tech 2:30‐2:45 Fine‐Tuning Fertilizer Recommendations for Young Apple Trees in High‐Density
Plantings Ashley Thompson and Gregory Peck, Virginia Tech

14
Business and Financial Reports

15
2015 CSFWC Conference Business Meeting Minutes
December 4, 2015 Chris Bergh, Secretary/Treasurer
Called to order at 8:00 AM
Business meeting attendance = 33 (included CSFWC, Inc. Board members Walgenbach, Leskey,
Agnello, and Bergh, Nielsen absent)
Financial Report (Bergh)
Incorporation of CSFWC
Establishment of CSFWC, Inc. bank account at BB&T
Financial statement for 2014‐2015
Discussion of meeting cost and cost/attendee
Presentation of historical record (10‐yr) of meeting attendance and of number of
presentations per discipline
Jim Walgenbach led a discussion regarding the proposed restructuring of CSFWC
3 Executive committee members to organize annual meeting (3‐yr term as Past‐
President, President and President‐Elect)
For 2015, this would consist of Past President (Agnello), President (Nita), and President‐
Elect (Walgenbach)
President‐elect for 2016 will be Greg Krawczyk (nominated by Bergh, seconded by
Steffel) elected with none opposed
Executive Director (Ganske) not a Board member
Executive Director to serve as local arrangements, sending meeting announcements, e‐
mails, etc.
Executive Director not to be paid; gift via gift card, etc. acceptable for tax purposes
By‐laws need tweaking; can be amended by the Governing Board
Discussion of producing Proceedings
VT Scholar will be terminated in early 2016
Doug Pfeiffer to save all past Proceedings in Scholar for migration to new CSFWC
website
Nita agreed to create CSFWC website for Proceedings with link to PayPal, resources, e‐
mail list, etc.
Website to be password protected
Proceedings to be collated as a single PDF but with Table of Contents and paginated
Schupp moved to accept the proposed restructuring of the CSFWC, seconded by Bob Rouse,
carried with none opposed
Discussion of 2016 meeting
Maintain the same schedule
Will be held on Thursday – Friday, Dec 1‐2, 2016
Motion to accept dates for 2016 from Schupp, seconded by Leskey, carried with none
opposed

16
Discussion of food‐related concerns about lunch (quality/cost) and mixer (excessive
quantity inflates cost) and quality of beer/wine; Bergh agreed to discuss this with
Hampton Inn
Discussion of better lunch food and lighter mixer food, better mixer beverages led to
motion by Leskey to reconsider venue for 2016, seconded by Nita, carried with no
opposition
Discussion of other venue options in Winchester
Ganske agreed to look at other hotels
Motion to amend by Schupp to have Executive Committee decide upon 2016 venue,
seconded by Shearer
Discussion of industry update session during joint session and industry participation in meeting
Question about did we single out some companies to present; answer was no, all invited
and only those who responded were selected
Concerns about excessive length of some industry talks during joint session and that
most seemed more like sales pitch
Suggestion for a “call of the industry” session in conjunction with “call of the states”
Suggestion for industry reps to submit 15‐min presentations to appropriate break‐out
session if have something relevant from a research perspective
This discussion led to a motion by Leskey to enable the President (Walgenbach) to
consider all options with Executive Committee for 2016 meeting, seconded by Shearer,
carried with none opposed
Proceeding submission deadline of January 9, 2016 (Nita)
Proceeding submissions to be in Word with no pagination, NOT as PDF
Bergh motioned to adjourn at 9:45 AM, seconded by Lalancette, carried with none opposed

17
Treasurer’s Report

18

19
Call of the States

20
CALL OF THE STATES – MARYLAND
Bob Rouse Emeritus faculty
University of Maryland College Park, MD
The last two winters have been hard on vinifera European type grapes with a fair amount of winter
injury and death.
Let me review the weather in 2015:
We had a mild January but we hard January in March; March in April; July in May; August in June with
lots of rain from late May thru June;
We had July in July also July in August, September; October in both October and November; December
was more like a March.
We had issues with heat which lead to fruit maturity issues and internal breakdown with Asian pears. So
needless to say weather played a role.

21
CALL OF THE STATES – NEW JERSEY
David Schmitt – Fruit IPM Program Associate, Atanas Atanassov ‐ Fruit IPM Program Associate, Amy Raudenbush – Blueberry IPM Program Associate, and Dean Polk ‐ Statewide Fruit IPM Agent
Tree Fruit
Tree phenology in 2015 started out late but by midsummer had returned to about normal. Cropping was
very good in both pome and stone fruit despite several cold nights in late April. Monthly Temps and
rainfall were near normal for the year except for June. The Office of the State Climatologist recorded a
preliminary average of 8.29”, more than 4” inches above the 4.02” normal rainfall. In June 2015 a farm
in Gloucester County recorded 21 rain events totaling 10.4” for the month. Five of those rain events
totaled an inch or more.
Disease pressure is increasing in southern counties, primarily due to weather extremes. Fruit rots,
especially Colletotrichum spp. (bitter rot in apples, anthracnose in peaches), are difficult to control in
summers with frequent heavy rainfall. In apple, Empire and Granny Smith are highly susceptible. In
peach, Klondike, White Lady, Sugar Giant, Harrow Beauty, PF Lucky 13, and PF 23 are among the
varieties that frequently display anthracnose symptoms. Apple Scab is also becoming more difficult to
control as DMI resistance is suspected in some orchards and QoI resistance has been confirmed in 1
northern New Jersey orchard. Fall or late winter applications of urea along with leaf chopping have
helped to greatly reduce inoculum in infected orchards. We have also noted slight increases in brown
rot and peach scab incidence in southern counties.
Brown marmorated stink bug populations, while still present, have been trending lower during the past
several years, and were significantly reduced statewide as indicated by research and field observations.
Populations of native stinkbug species however, were very high in 2015, and mid to late summer
damage was significant in apple and some vegetable crops.
Internal worm damage in apple continues to be a challenge as more farms in southern counties
experience significant damage. Again frequent heavy rainfall appears to be a factor, making it difficult to
maintain insecticide coverage during egg hatch. Codling moth trap captures and injury have increased
on a number of farms. Two growers in northern counties had up to 5 percent fruit injury, but these
orchards were not adequately treated. Populations on some other farms have still been problematic
regardless of management practices. Growers have not widely adopted mating disruption for codling
moth control because of high costs and lack of production blocks in adequate shapes and sizes. Mating
disruption for oriental fruit moth (OFM) in peach has been more widely adopted and has been very
successful in orchards employing this technique. We have 4 generations of OFM in NJ. The first and forth
generation flights are the highest, with the mid summer generations being the lowest due to
management tactics. Under standard management practices we use a trap threshold of 6‐8 moths per
trap to initiate insecticide treatments. This rarely occurred during the summer months. About a third of
our peach growers have been using mating disruption of peach tree borers in recent years. Most of
them are following the scheme 2+1, or two consecutive years mating disruption with no mating
disruption or using chemical control of the third year. This strategy works well because traditional
postharvest chemical treatments of tree trunks and scaffold limbs are excluded from the program.
Although MD is a little more expensive than chemical control, growers who use it prefer the practice
compared to spraying, since it can be more effective and saves time and labor after harvest.

22
Statewide, tufted apple budmoth (TABM) trap captures have been on the increase for several years. In
many orchards pheromone trap captures exceeded 100 moths per trap per week. In most orchards
treatments for TABM overlapped with CM or OFM treatments. Neither the seasonal observation nor
postharvest fruit assessment revealed TABM injury in northern counties, but slight injury was noted this
year in southern counties. Spotted tentiform leafminer (STLM) trap captures also increased this year and
one southern county farm had significant injury. We have not seen this pest at these levels for many
years. A high percentage of biological control is still observed so it is unclear what caused the outbreak.
The return of these traditional pests raises questions about possible non target insecticide impacts on
biological control species and/or potential insecticide resistance by the target pests. This is troubling due
to the lack of effective alternatives.
In 2015, Comstock Mealybug was observed in southern and central NJ infesting Asian pear and apple in
in September. Injury was significant in Asian pears that were bagged improperly. High levels of
parasitism were observed in the field, however nymphs that were able to enter the bags were
protected. This is the first observation of this pest at economic injury levels in NJ.
Ambrosia beetle was a problem in one orchard in southern NJ again in 2015, although to a lesser extent
than 2014. One difference between last year and this is that in 2014 the beetles infested apple blocks
which had been injured by low temperatures following delayed dormant oil applications. No such tree
stress occurred in 2015, however blocks where infestation did occur this year seemed to be ones which
had high percentage of trunk cankers (presumably from B. dothidea). In 2015, the grower treated
aggressively early in the season with a delayed dormant chlorpyrifos application, and pre bloom
pyrethroid covers. It is not known how effective these applications were at preventing infestation. The
grower also placed fresh logs culled from prunings and baited with hand sanitizer on wooded borders as
a diversion. This method failed to attract beetles. In 2015 the insect was found infesting peach,
however tree decline was not observed. Peach does not appear to be a good host because of the
tendency to exude thick sap in wounds. Growers in other regions of the state have reported damage
from this pest after the outbreak last year. Prior to 2014 it was a long known pest of nursery stock but
had not been identified as a significant pest in fruit production. We have collected beetles from infested
apple wood but as of this report we have not yet identified which species or species complex is causing
damage in NJ orchards.
Pear psylla populations were difficult to control in southern counties due to high populations of adults
persisting into September. Heavy leaf feeding was observed through late summer, but overall growers
treated aggressively and had reasonably clean fruit at harvest. High populations were also noted in
northern counties but control was reported to be better. For several years we have suspected that
heavy feeding by nymphs late in the season may reduce cropping in the following season.
Blueberry
Overall the quality of the blueberry crop in New Jersey was good throughout the 2015 season. However,
New Jersey blueberry growers had approximately 20% loss from winter damage. In addition, a severe
storm with high winds occurred on June 23, 2015 during peak ‘Duke’ harvest, resulting in growers losing
anywhere from 0‐20% of their crop. Furthermore, the price did not reach desired levels of 18 to 20
dollars per crate; instead prices started out and remained around 14 dollars throughout the season.
Low prices were a result of the competition from other states providing blueberries during NJ’s harvest
time frame.

23
Detection of some primary blueberry pests such as the blueberry maggot (BBM) and spotted
wing drosophila (SWD) occurred during the week of June 14th. A total of 176 BBM traps and 66 SWD
traps were set in order to monitor populations in Atlantic and Burlington Counties. Early detection of
these pests allowed for growers to use appropriate management tactics to keep the pest populations
under control through June and July. Additionally, sharp nose leafhopper populations were low for the
first generation, but increased during their second generation, which is post‐harvest. Also, scale
populations were observed on the fruit this year. Monitoring efforts need to be emphasized in 2016 to
notify growers when scale crawlers are present. Lastly, weed management in blueberries was a concern
among growers in 2015. Specifically proper identification of the weeds present in the blueberry fields
and herbicide application timing to target select weeds in the field.
Tree Fruit Phenology – Southern Counties 2015
Pest Event or Growth Stage Approximate Date 2015 Observed Date
1/4" Green Tip Red Delicious March 31 +/‐ 13 Days April 14
Tight Cluster Red Delicious April 9 +/‐ 13 Days April 19
Pink Peach (Redhaven) April 4 +/‐ 15 Days April 19
Pink Apple (Red Delicious) April 14 +/‐ 12 Days April 22
Full Bloom Peach (Redhaven) April 9 +/‐ 14 Days April 27
Full Bloom Apple (Red Delicious) April 22 +/‐ 11 Days April 30
Petal Fall (Redhaven) April 22 +/‐ 10 Days May 4
Petal Fall (Red Delicious) April 27 +/‐ 14 Days May 6
Shuck Split (Redhaven) April 30+/‐ 11 Days May 11
Pit Hardening - Peach June 15 +/- 9 Days June 13

24
CALL OF THE STATES – NEW YORK 2015
Art Agnello1, Dave Kain1 & Peter Jentsch2 Dept. of Entomology, Cornell University
1NYS Agricultural Experiment Station, Geneva, NY 2Hudson Valley Research Lab, Highland, NY
Entomology It was difficult to get a good handle on the insect situation this season, mainly because it seemed relatively quiet with regard to many of the key pest species, but we never felt comfortable advising complacency while there was still time for something to rear up and cause late-breaking problems, which something did, eventually. The first part of the spring started out with nearly ideal tree (and insect) development weather — not much rain, moderate temperatures, and with a gradual warming trend that made New York resemble some states more to the south. That is, of course, until the last week of May, when some polar express cold blasts barreled their way through the landscape, followed by a sequence of storm fronts that made June one of the wettest on record (at least in WNY; the Hudson Valley perversely suffered from too little precipitation). This had the effect of suppressing many of insect flights and typical infestation patterns, although frequent rain events made it a challenge to keep the trees covered with preventive sprays. Things remained fairly unsettled into July, and we never really got into true summer temperature patterns until mid-August, with warm and dry weather continuing throughout most of September. Western NY On balance, insect pests were not too problematic, although a number of them needed some extra attention, as is common. As happened in 2014, the rainy spells helped to keep down mite numbers for much of the state, although some blocks in the Hudson Valley did run into population blow-ups. Unlike last year, San Jose scale infestations did not seem to be such a common concern, although woolly apple aphid, which is notable for being a dependable late summer complication, was present in a number of sites and posed some year-end difficulties. Codling moth and oriental fruit moth continued to be important drivers of many insect management programs, particularly in western NY, but didn't really gain strength until the later varieties were being harvested in October. A troubling number of WNY orchards were suddenly discovered with some substantial late codling moth infestations, even despite what otherwise would have been considered decent spray programs -- a situation that may herald the start of a decline in some of the not-quite-top tier worm materials, such as Assail and Belt. Apple maggot trap numbers this season were mysteriously low, and few infested apples were reported. Brown marmorated stink bug was once again extremely rare in WNY, similar to the low numbers reported throughout the mid-Atlantic, although there were trackable populations in parts of ENY and the Hudson Valley. Spotted wing drosophila showed up somewhat earlier this year, and continued as a more universal, and urgent, concern, still mostly for berry growers; our cherry and peach plantings will start to require more diligent oversight if this trend continues. The troublesome black stem borer, an ambrosia beetle that has been found as the cause of tree decline and death in numerous plantings in WNY, was also documented in several ENY counties this season. We've been assessing a few options as preventive trunk spray treatments, but still don't have much confidence in our ability to control them adequately.

25
Hudson Valley Factors Contributing To The 2015 Hudson Valley Insect Pest Management Anomalies. The start of the 2015 season began very dry in March, increasing above the average through April and May with rainfall accumulations of 2.20” in March (3.6” Ave.), 4.40” in April (3.8” Ave.), and 2.55” in May (4.4” Ave.). The month of June saw a significant increase in rain events totaling 7.31” (4.4” Ave.), with enough rain to produce moderate levels of apple scab infection, especially in newly planted blocks. Each week in July had less than 0.5” of rain, requiring near daily irrigation as only 1.23” fell (4.7” Ave.). August also experienced below average rainfall, with accumulations of only 3.34” (4.2” Ave.). Total rainfall for the March 1st through September 1st growing season totaled 21.03” of rain, slightly below the seasonal average of 25.1”. For the third straight year, Hudson Valley tree phenology was considerably later during the early stages of development of the season. However, by petal fall the season was only one day later than the 25-year mean. By harvest of McIntosh, Retain applications for fruit drop management were applied 4-5 days earlier than the calendar dates. McIntosh green tip (13 April) occurred 8 days later than the 25-year historical mean (see McIntosh phenology), two days shy of the latest recorded day. King bloom on McIntosh began on the 6th of May with the bloom period lasting 6-7 days. 80% PF in McIntosh occurred on 12 May. Bloom lasted 2.5 days fewer than the mean, with ample sunlight yielding strong pollination and conditions for fruit set, yet under conditions of severe water stress, which concerned tree fruit growers. Degree-day accumulations were about 45.5 DD43 / 39.2 DD43 higher than the average by petal fall (12th May of 527.8 DD43 / 304.5 DD50). By the 26th of May, McIntosh king fruit had sized to 18mm. From the onset of bloom to PF, temperature ranged between 49oF and 87oF followed by 10 days of mean high temps of 59 oF to 83oF after petal fall, generally cooler than normal. Tarnished Plant Bug (TPB) presence required timely applications for management in orchards with historical fruit damage. Dry conditions during the pre-bloom period favor TPB activity, requiring applications at both TC and PF. Applications showed significant reduction in fruit injury. Lower levels of injury in higher valued fruit such as Sweetango, Honeycrisp, Gala will require TPB management if culls from this insect exceed economic threshold. Plum Curculio (PC) required three applications beginning at 80% PF, followed by 1st and 2nd cover (for most varieties). PC damage began well after fruit set given the cool temperature we experienced. PC movement into orchards and oviposition was predicted to end on 3rd of June using predictive modeling of 308 DD50 from petal fall of McIntosh. Rains during the 1C period exceeded 3.0” up to the morning of June 2nd, with 305 DD50 accumulated toward the PC migration completion model. European apple sawfly (EAS) activity occurred in very low numbers this season with early varieties showing 1.8% injury in Ginger Gold and McIntosh cluster fruit evaluations. PC injury was also moderate, with 44.0.% and 22.8% injury, and TPB injury at 4.8% and 3.8% injury observed in Ginger Gold and McIntosh, respectively, on 6 June in untreated plots, with increasing damage noted in these plots at harvest. Codling moth (CM) 1st generation sustained adult flight occurred on 11th May with larval emergence predicted for 27th May using 220 DD50 from CM biofix. The internal lepidopteran complex, lesser appleworm (LAW), oriental fruit moth (OFM) and CM showed moderate levels of damage to apple, with frass produced by the internal lep complex appearing during mid-late June through early July. Moderate levels of damage from the internal lepidopteran complex was

26
observed with 7.5% and 7.0% damage from 1st generation evaluated on 28th June on Red Delicious. The 2nd generation adult sustained catch for the CM biofix occurred on 13th July, with management for larval emergence prediction using 250 DD50 to occur on 20 July. San Jose scale (SJS) crawler emergence was predicted to occur on 10 June using 1st adult capture on the 11th May 400 DD51 model. Nymphs were observed on fruit on the 18th of June, 8 days after the predicted emergence date. In general, SJS scale levels were high in infested trees. The infestation means ranged from 27.3% to 86% injury observed in HVRL research plots on 26th August. In conventionally treated orchards, the SJS has become a major insect pest to manage in apple, requiring targeted applications for multiple generations. A third generation was observed in mid-September causing to late season fruit. Overwintering larvae of the spotted green fruitworm (SGFW), redbanded leafroller (RBLR) and OBLR larvae during the pre-bloom period through fruit set remain a concern of most Hudson Valley and Lake Champlain pome fruit growers. The tools for use against the Lepidoptera complex are diverse in mode of action, are very effective and have excellent residual activity. Obliquebanded leafroller (OBLR) monitoring and management by tree fruit growers continues to be a high priority. Targeting up to three seasonal application windows while employing a single mode of action for each period, growers can achieve successful management of OBLR larvae. These include the pre-bloom through Petal Fall period for the overwintering generation, often using IGRs such as Proclaim and Intrepid, the summer generation using either Altacor / Belt or Delegate, and later in August applying either Altacor / Belt or Delegate. Recommendations for applications were made using insect phenology predictions for early emergence, using 340 DD50 from 29th of May biofix to manage emergence of larvae, predicted to occur on 14th of June. In general, low levels of leafroller feeding were observed on developing foliage and fruitlets this spring. Trap captures were moderate for 1st generation OBLR, averaging 6.3 / day during the peak periods (15 June). The 2nd generation flight of OBLR biofix was low during August, averaging 0.6 / day during the peak periods (10 August). We are seeing a trend of increasingly high levels of RBLR with mixed populations of tufted apple bud moth (TABM) and sparganothis fruitworm (SFW) during the season, contributing to the overall leafroller damage each year. Apple maggot (AM) emergence was late this season, with first emergence on 13th July. Threshold of 5 flies per trap per block was observed on the 10th of August. AM density was low to moderate throughout the region, with reduced emergence due to the lack of late season rainfall in July and early August. Low populations of adults were noted in the mid-Hudson Valley with seasonal accumulation totals near 40 flies per trap (mean n=4) by 31st August. Highest populations occurred late in the season as rainfall in August providing more ideal emergence conditions for the adult fly. The brown marmorated stink bug (BMSB), Halyomorpha halys, has been observed throughout the southern Hudson Valley for the past 6 years, with the first BMSB confirmation in December 2008. Since that time, increasing populations have been documented in urban environments and are present on many farms throughout the season in the lower to mid-Hudson Valley region. We have observed a second generation over the past two years, developing in mid-late August in HVRL voltinism studies. However, in 2015 we did not find adult egg laying after the development of 1st generation in our rearing chamber.

27
Although there appears to be stink bug feeding in apples this season, both BMSB and the green stink bug, Acrosternum hilare BMSB were found from mid-season through harvest on pome fruit in lower to mid-Hudson Valley, with increasing northern observations and fruit injury occurring in Columbia County in 2013. It has been found reproducing in deciduous trees such as Sugar Maple, Acer saccharum, White Ash, Fraxinus americana, Tree of Heaven, Ailanthus altissima, and eastern black walnut Juglans nigra in high numbers, with lower numbers observed in Staghorn Sumac, Rhus typhina, and wild grape, V. vinifera. Late season nymphs and adult trap captures of BMSB using Tedders traps (with a single site employing traditional black light traps), the USDA #10 lure and the Plaudai stali aggregation pheromone lure, methyl (E,E,Z)-2,4,6-decatrienoate, was observed along the orchard edges in Orange, Ulster, Dutchess and Columbia Counties throughout the season. In 2015, we monitored the population throughout NYS in 44 tree fruit orchard sites, employing a trap threshold of 10 total BMSB adults per trap to recommend threshold-based management timing for tree fruit production. We are presently recommending that growers access https://www.eddmaps.org/bmsbny/ for weekly updates on BMSB monitoring of adults and fruit injury requiring management. Spotted wing drosophila (SWD), Drosophila suzukii, (Matsumura) (Diptera: Drosophilidae) were first observed in NY by late August, 2011. We monitored SWD in four counties throughout the lower to mid-Hudson Valley this season, using baited traps across small fruit, grape and tree fruit. The first SWD trap captures were found in Ulster County the week of the 11th of June. A single female SWD was discovered in Warwick, Orange County using a baited Trécé trap, set during the week of June 15-22. By 16 July, evaluations of unsprayed ‘Summit’ sweet cherry showed infestations of fruit above 10%. However, in managed ‘Emperor Francis’ sweet cherry, a blush, yellow / red mid-late season variety, SWD injury was not observed. By the 30th of July SWD was found infesting berries in a homeowner blueberry patch. During the week leading up to the 25th of August, managed conventional patches of blackberry, red raspberry and blueberry were found to have 10% to 100% infestation levels. Growers who harvested frequently and kept to a 3-7 day spray program were able to maintain low infestations levels (<15%) this season. We are presently recommending that growers access http://www.eddmaps.org/project/project.cfm?proj=9 for weekly updates on SWD monitoring of adults and fruit injury for early season management.
28
CALL OF THE STATES – PENNSYLVANIA
Krawczyk, G., J. R. Schupp and K. Peter. The Pennsylvania State University
Fruit Research and Extension Center, Biglerville, PA
Horticulture Update: The 2014/2015 winter was another harsh one for the northern tier of PA, especially for the wine grapes and stone fruits in Erie County. Southern growing regions of PA came through the winter without injury, and experienced a strong bloom of tree fruits, with favorable weather for pollination and fruit set.
Moderately warm, mostly sunny weather predominated during the window for chemical thinning of apple, leading to predictable outcomes. The growing season was interspersed with rainfall at regular intervals. The result was a good crop with better than average fruit size, leading to an estimated 12.5 million bushels of apples, up 9% from average. A few growers in western Adams County experienced severe localized hail.
PA also picked a full crop of peaches and sweet cherries in 2015, with great size and quality. The pie cherry crop was very heavy, and sometimes stretched local resources to get them all harvested.
The fresh peach market experienced a mid-season slump in 2015, for the fourth season in a row. The crate market did recover somewhat, in late August. Some peach growers are downsizing their holdings of mid-season peach varieties.
Apple growers reported a tight supply of harvest labor. Fortunately, there were few rain delays during harvest and growers were able to get the large crop harvested. Apple fruit condition is good and apple sales are good. The movement to update apple orchards to better strains and better varieties on dwarfing rootstocks continues at a strong pace.
Plant pathology update: Pennsylvania had an interesting season weather-wise and it had an impact on tree fruit disease pressure: April saw 4.1 inches of rain; May with 2.94 inches; June with 13.53 inches; July with 3.0 inches; August with 7.12 inches (5 inches in one day); and September with 4.6 inches. Compared to 2014, we had almost 6 more inches of rain from April through the end of September in 2015.
Apple and pear diseases: Fire blight: It was another tough fire blight year; however, the fast bloom time most likely saved us from serious infection. Our fire blight experiments took place during an infection period and our first symptoms were one week after our inoculation – in contrast to 2014, where it took about 2.5 weeks to see infection. Some folks didn’t fare as well due to late blooming varieties. Unfortunately, any leftover cankers wreaked havoc in the orchard and a lot of shoot blight occurred beginning in mid-June until mid-August – the last incidence was attributed to the trees continuing to grow due to the rain received earlier in the summer.

29
Apple scab: This was a lighter scab infection year compared to 2014. In the untreated check, the incidence is not as high as the last 2 years (example: 2014 Rome Beauty leaves and fruit: 95% incidence; 2015 Rome Beauty leaves and fruit: 68% and 40% incidence, respectively). Due to a drier May, growers had time to spray prior to the few infection events. Although there were several infection events, there were not prolonged leaf wetness periods as experienced in 2014. For powdery mildew: We started to see in symptoms in mid-May; however, the rain kept anything from seriously taking off, especially when controlled early on. For cedar apple rust: The symptoms were late manifesting this year, most likely due to the dry early spring. However, infection picked up in late June – July, but there was little fruit infection this year. For apple fruit rots: We observed fruit rot early (July) and there was a high incidence observed in untreated check on Red Delicious at harvest. In addition, there were reports coming from the field and pack houses about a high incidence of bitter rot. The late August rains combined with the higher temperatures likely created a favorable disease environment. A consequence of the amount of rain during the season was there were several confirmed cases of Phytophthora root rots, which was problematic this year on trees newly planted to 4 years old.
Stone fruit diseases: For bacterial spot: This was slow taking off this year due to the dry May – early June. That all changed in late June – July when the conditions favored disease on a daily basis. A lot of reports came in with regard to phytotoxicity and using copper during the slow drying conditions (and being mistaken for bacterial spot). For cherry leaf spot: Slightly lighter disease pressure compared to last year. There were 7 infection periods in May; 10 infection periods in June. In contrast to 2014 were there were at least 20 infection periods by June 10. For cherry powdery mildew: Despite the rain, powdery mildew established in our tart cherry block very well – a good year. For fruit rots: Due to the high amount of rain at the end of June during cherry harvest, Alternaria rot and brown rot were a big issue this season; for peaches, the dry period during harvest in early – mid August helped keep the disease in check, especially when controlled. Like apples, Phytophthora root rots were an issue, particularly on newly planted tart cherry trees. Entomology update: During the 2015 season , the biofixes for our most common fruit pests occurred at very similar dates as during the the 2015 season: for OFM on April 26rd, STLM on April 12th, CM on May 07th, TABM May 12th and OBLR on May 27th.
Brown marmorated stink bug populations were not very abundant during the spring, however the numbers increased significantly during late summer and early fall. Overall for the entire season, the cumulative numbers of BMSB collected in traps utilizing the same pheromones and placed at the same locations as during the 2014 season were about 50 percent lower than during the previous season. Insecticides used against BMSB created increasing management challenges with scale insect, woolly apple aphid and European red mites. The other pests causing some control problem were pear psylla, plum curculio, and borers but in most cases the challenge was localized and limited to only few, individual orchards.
Despite increased overall insecticide usage for the control of BMSB, the internal fruit feeders such as codling moth and Oriental fruit moth and leafroller complex continued to generate some

30
control challenges in isolated orchards resulting again in rejections of fruit by Pennsylvania fruit processors (i.e., over 120 rejections with 80-20 CM: OFM split).
A new invasive insect pest, spotted lanternfly Lycorna delicatula (Hemiptera: Fulgoridae) discovered in 2014 season continues its spread to new areas and during the 2015 season was detected in 4 counties (south-east PA). The area where this new species was observed is currently quarantined by the Pennsylvania Department of Agriculture, as monitoring and detection surveys are planned for the 2015 season.

31
CALL OF THE STATES – VIRGINIA Chris Berg
Mizuho Nita
Keith Yoder
Alson H. Smith, Jr. Agricultural Research and Extension Center
Winchester, VA
Early season apple disease summary:
Most of the early season diseases had plenty of opportunity for infection this year.
Scab and cedar‐apple rust pressure was extremely heavy, with five primary scab infection periods and appearance of scab lesions by 27 Apr, followed by 11 more secondary scab periods to 3 Jun.
Six of these infection periods also favored cedar‐apple rust, with the first one 7 Apr and the last one 27 May. In spite of heavy cedar‐apple rust infection, fruit mostly escaped quince rust, which must infect during a fairly narrow window of blossom susceptibility from pink to petal fall stages.
Powdery mildew infection occurs during dry weather and there were 35 “mildew infection days” from 6 Apr until six weeks after petal fall. Over the past 21 years this number has ranged from 25‐49 days.
Fire Blight: Based on the Maryblyt 7 program, with first bloom open 17 Apr, fire blight infection was possible 20 Apr, 5‐7 May and possibly on late bloom 11‐12 May. Many trees still had some susceptible bloom 5‐7 May, but less by 11‐12 May.
There may have been a 13 Apr infection in areas where bloom was open as early as 11 Apr. There were some reports of canker blight and secondary fire blight following scattered hail events and thunderstorms.
Summer apple disease summary:
Sooty blotch and flyspeck (SBFS) fungal complex, we record accumulated wetting hours, starting 10 days after petal fall: chose 4 May as our petal fall start date for Winchester, and the start of wetting hour accumulation was from 14 May. As recorded by a hygrothermograph at 952 ft elevation at our AREC, we reached the 250‐hr threshold for specific treatment against the SBFS fungal complex on 13 Jun. By 17 Aug, we had accumulated 611 wetting hours.
Electronic recorders at 909 ft and 983 ft elevations showed 864 and 539 wetting hours, respectively by Aug 17. This represents an increase of 4.4 wet hours per foot of elevation drop from 983 to 909 ft since accumulation of wetting hours began 14 May. This is why we encourage growers to scout now SBFS, especially at lower elevations in orchards.
The rot organisms, especially bitter rot, are favored by warmer wetting periods. From mid‐May through August there were 22 possible “bitter rot infection periods” with some of the wetting occurring at temperatures 70º or higher.
Also, increased bitter rot pressure was likely wherever there were fire blight strikes. There were also indications of earlier infections by white rot in some commercial situations.

32
Grape Pathology:
Due to severe winter weather, we continued to observe winter injury on many of less winter hardy cultivars such as Merlot and Tannat. In addition, there were many incidence of crown gall due to these damaged vines.
The season was dry, but we have seen considerable cases of ripe rot outbreak, especially in the southern VA, but isolated cases were observed throughout the state.
Entomology:
There were several reports early in the 2015 season of ambrosia beetle infestations in apple orchards. This problem was especially pronounced on recently top‐worked trees and there were instances of significant tree mortality.
A prolonged bloom, during which the weather was cool with ample rain, appeared to have created an opportunity for green fruitworm to cause more injury in some apple orchards than is typical. This issue was also reported from Pennsylvania in the spring, but was not detected or diagnosed in Virginia until harvest.
Biofix dates for oriental fruit moth (April 18), codling moth (May 4) and tufted apple budmoth (May 16) at the Winchester AREC were within historical norms and there were few problems from these pests reported in 2015.
Overwintering populations of adult brown marmorated stink bug seem to have been adversely impacted by colder‐than‐average winter temperatures. This was reflected by the very low captures in pheromone‐baited traps through at least mid‐August.
In response, many apple growers reduced their inputs for this pest during much of the season. This appears to have resulted in many fewer woolly apple outbreaks than have been reported in recent years. There are increasing anecdotal reports of predatory mite populations in Virginia withstanding exposure to some of the broad spectrum insecticides used for brown marmorated stink bug, and in particular the synthetic pyrethroids.
Captures of brown stink bug and some other stink bug species in traps baited with commercial brown marmorated stink bug pheromone lures were much higher than usual and were sustained for much of the summer. As is typical, brown marmorated stink bug captures increased between late August and late September, although peak captures were substantially lower than have been recorded previously. The numbers of adult brown marmorated stink bug invading buildings in the fall was generally lower than we have observed previously, although this was site‐specific to some degree, and some homeowners reported heavy invasions.
The Asian egg parasitoid of brown marmorated stink bug, Trissolcus japonicus, was detected from two sentinel egg masses (late June and late August) deployed at the Winchester AREC. This survey included a total of 231 egg masses deployed at six sites along a west‐east transect extending from Winchester to south of Leesburg between early June and mid‐September. Native parasitoids were detected at all sites, and at a greater frequency than T. japonicus, but T. japonicus was detected only at the Winchester site.

33
CALL OF STATES – WEST VIRGINIA Mahfuz Rahman
West Virginia University, Morgantown, WV
Apple scab ascopsore release was relatively early in 2015. There have been a few infection periods in
early April. Scab infection and disease severity was high especially in the southern counties of WV. Spray
schedule that included Captan and Rally was not effective in controlling the disease. However, testing
for resistance against DMI fungicide could not confirm any resistance in the fungal isolates.
Rapid warming up in early May facilitated Fire blight infections. Orchards that missed a single spray
during an infection period had very high incidence and severity of Fire blight.
Late in the season, Cedar apple rust on susceptible varieties were very high.
Powdery mildew pressure was high on certain apple cultivar such as Ginger Gold.
Pheromone trap catch of Lesser peach tree borer was high starting in early May and peaked in late May.
Trap counts peaked again in late August with moderate population rest of the season.
Codling moth pheromone trap catch peaked on May 18 and gradually came down with low trap counts
during the rest of the season.
The state experienced serious outbreak of Tulip poplar weevil during the summer that gave most of the
Tulip poplar trees a gray to brown appearance.

34
Breakout session: Entomology
35
Not For Citation or Publication Without Consent of the Author
PARASITIZATION OF DROSOPHILIDS IN VIRGINIA SMALL FRUIT CROPPING
SYSTEMS
James C. E. Wahls and Douglas G. Pfeiffer Department of Entomology, Virginia Tech
Blacksburg, VA 24061
Within the last decade, two species of exotic drosphilids have invaded North America. Since its arrival in 2008, the spotted wing drosophila (Drosophila suzukii, henceforth SWD) has become a widespread economic pest of small soft-skinned fruits due to its ability to oviposit in intact, ripening fruit (Hauser 2011, Walsh et al. 2011). Less known is the African fig fly (Zaprionus indianus, henceforth AFF), which was discovered in Florida in 2005 (van der Linde et al. 2006). This tropical-subtropical species was already established in South America as an important pest of fig production, but also has a wide host range and has been documented as a highly adaptable species (van der Linde et al. 2006, da Mata et al. 2010). In Virginia, AFF is now often observed concurrently with late-season infestations of SWD, especially in vineyards (Pfeiffer 2012). Though SWD is the more important pest in North America, due to interactions with AFF, it was deemed appropriate to include AFF in this study. This study investigates the potential for using native parasitoids of drosophilids in Virginia as conservation biological control agents against SWD and AFF, and provides baseline information for future biological control endeavors regarding drosophilids. The project includes two objectives: 1) Use sentinel traps to determine which parasitoids of drosophilids are present in southwestern VA small fruit production, and if they can successfully attack SWD and/or AFF in the field, and 2) Perform parasitization bioassays in the laboratory to determine if native parasitoids can successfully attack SWD and/or AFF under controlled conditions. Sentinel Trapping Methodology:
During the 2015 field season, sentinel traps were placed in a cherry orchard, a caneberry field, a blueberry farm, and two vineyards in southwestern Virginia. Half of the sentinel traps contained a Petri dish with ~50 g of banana, the other half contained ~50 g of the same type of fruit as the cropping system. Prior to placement in the field, fruit was seeded with larvae of SWD, AFF, or Drosophila melanogaster, or left uninfested for control traps. Twelve to sixteen traps were placed on the edge and interior of each cropping system. Bait dishes were collected after 3-4 d in the field and subsequently replaced. Larvae/pupae were allowed to complete development in the laboratory and observed for fly/parasitoid emergence. For each crop type, 21-24 trapping days were accumulated per trap, excluding AFF sentinel traps, which had 6-8 trapping days per trap (Table 1). AFF sentinel traps were only placed out later in the season once AFF was detected in the system, so no AFF sentinel traps were placed in the cherry orchard because cherries are an early season crop.

36
Table 1. Date ranges and accumulated trapping days for sentinel trapping during 2015 field season.
Sentinel Trapping Results: The larval parasitoid Leptopilina spp. (Figitidae) was the most abundant parasitoid reared from the traps, and the generalist pupal parasitoid Pachycrepoideus vindemiae (Pteromalidae) was reared in lower numbers (Figure 1). Parasitoids emerged from baits that were in the cherry orchard and caneberry field, but not the blueberry farm or vineyards. In the cherry orchard, only one individual of P. vindemiae was reared from SWD, and this species has previously been documented to parasitize SWD in the field (Stacconi et al. 2013). All other parasitoids from both sites were reared from D. melanogaster or other ambient drosophilids that had infested the traps in the field. None were reared from AFF. Interestingly, in the cherry orchard, more parasitoids were reared from the banana bait dishes than the cherry bait dishes, while in the caneberry field, parasitoids were only reared from the caneberry bait dishes and not from the banana bait dishes (Figure 1). This raises the question, are parasitoids of drosophilids attracted to certain fruit odors more than others when it is time to oviposit? There was also an edge effect observed in that more parasitoids were reared from traps placed on the edge of the cropping system than those in the interior (Figure 2). There are several possible explanations for this observation: the parasitoids might be entering the system from the nearby wooded habitats; the edges of these sites were shadier, and therefore somewhat cooler than the interiors, and the parasitoids may prefer the shade/cooler temperature; there could simply be more wild hosts around the edges, so there would naturally be more parasitoids around the edges as well.
Crop Type Date Range (2015) Trapping Days (per trap)
Cherry 5/18 – 6/26 24
Caneberry 7/6 – 10/9 23
+Z. indianus 9/17 – 21, 10/6 – 9 (7)
Blueberry 8/6 – 9/15 21
+Z. indianus 9/4 – 8, 9/11 – 15 (8)
Grape 8/4 – 9/18 22
+Z. indianus 9/8 – 11, 9/15 – 18 (6)
All 5/18 – 10/9 92

37
Figure 1. Parasitoid emergence from sentinel traps with respect to bait type.
Figure 2. Parasitoid emergence from sentinel traps with respect to trap placement.
Parasitization Bioassay Methodology: Fifty 2nd-instar larvae of D. melanogaster, SWD, or AFF were placed in a 35-mm Petri dish filled with ~1 mm depth of rearing media. The larvae were then exposed to three mated females of Leptopilina for 72 h in a rearing bottle at 26ºC, with 12-h daylength. After 72 h, the parasitoids were removed from the bottle, and 10 “wandering” maggots were collected and observed under the microscope for parasitoid eggs and encapsulation (Figure 3). The remaining larvae were allowed to complete development in the incubator. This experiment was modeled after Kacsoh and Schlenke (2012), and had six replications for each fly species.

38
Figure 3. Posterior end of a parasitized Drosophila larva. Parasitoid eggs have been
encapsulated, indicated by the black spots. Parasitization Bioassay Results: Based on microscope observations, Leptopilina attacked SWD and D. melanogaster at a greater rate than they attacked AFF (Table 2). Observations indicated that D. melanogaster and AFF had a greater encapsulation rate than SWD, which is inconsistent with Kacsoh and Schlenke (2012), which showed SWD to be much more successful at encapsulation than D. melanogaster. It is unclear why these results were so different. However, once the remaining larvae completed development, results were more as expected (Figure 4). Leptopilina was able to successfully parasitize D. melanogaster, but not SWD or AFF. Why then were the microscope observations so inconsistent? Perhaps the environmental conditions were not optimal for SWD, and it took a longer time for larvae to complete the encapsulation process. Furthermore, in the case of D. melanogaster, where >80% of observed parasitoid eggs were encapsulated and yet 65% of flies were successfully parasitized, perhaps encapsulation occurs regardless and some parasitoid eggs/larvae are able to overcome it in D. melanogaster, but not in SWD or AFF. Table 2. Attack rates of Leptopilina on three drosophilid species and larval encapsulation rates of Leptopilina eggs by those species, based on microscope observations.
Fly Species
Mean Parasitized
Larvae Attack RateMean No. Eggs
Laid
Mean encapsulated
eggs Encapsulation
Rate
D. melanogaster 4.8 48% 10.2 8.5 83%
D. suzukii 5.7 57% 13.8 8.3 60%
Z. indianus 1.2 12% 1.5 1.3 87%

39
Figure 4. Survival, parasitization, and mortality rates of drosophilids exposed to 3 mated females of Leptopilina spp. for 72 h. Conclusions: Based on results from this study, we can conclude that native parasitoids in Virginia are not likely to be effective biological control agents against SWD or AFF. Sentinel traps did not produce a parasitoid that could attack either fly species with much success, and laboratory trials showed SWD and AFF are both unsuitable hosts for the native Leptopilina spp. that was tested. However, these results do support the case for classical biological control. Furthermore, the edge effect observed in our field study should be something to take note of when utilizing biological control for these pests. Next Steps: We will complete statistical analyses for the data presented here, and perform another parasitization bioassay using P. vindemiae. We will also investigate the relative attractiveness of different fruit odors to parasitoids of drosophilids with olfactometer bioassays. References: da Mata, R. A., R. Tidon, L. G. Côrtes, P. De Marco Jr., and J. A. F. Diniz-Filho. 2010. Invasive
and flexible: niche shift in the drosophilid Zaprionus indianus (Insecta, Diptera). Biol. Invasions 12: 1231-1241.
Hauser, M. 2011. A historic account of the invasion of Drosophila suzukii (Matsumura) (Diptera:
Drosophilidae) in the continental United States, with remarks on their identification. Pest Manage. Sci. 67: 1352-1357.
Kacsoh, B. Z., and T. A. Schlenke. 2012. High hemocyte load is associated with increased
resistance against parasitoids in Drosophila suzukii, a relative of D. melanogaster. PloS One 7: e34721.

40
Pfeiffer, D. G. 2012. Spotted wing drosophila in Virginia vineyards. Grape Press 28: 1, 5. Stacconi, M. V. R., A. Grassi, D. T. Dalton, B. Miller, M. Ouantar, A. Loni, C. Ioriatti, V. M.
Walton, and G. Anfora. 2013. First field records of Pachycrepoideus vendemiae as a parasitoid of Drosophila suzukii in European and Oregon small fruit production areas. Entomologia 1: 11-16.
van der Linde, K., G. J. Steck, K. Hibbard, J. S. Birdsley, L. M. Alonso, and D. Houle. 2006. First
records of Zaprionus indianus (Diptera: Drosophilidae), a pest species on commercial fruits from Panama and the United States of America. Fla. Entomol. 89: 402-404.
Walsh, D. B., M. P. Bolda, R. E. Goodhue, A. J. Dreves, J. Lee, D. J. Bruck, V. M. Walton, S. D.
O'Neal, and F. G. Zalom. 2011. Drosophila suzukii (Diptera: Drosophilidae): Invasive pest of ripening soft fruit expanding its geographic range and damage potential. J. Integ. Pest Manage. 2: 1-7.
Acknowledgements: Funding sources: Virginia Vineyards Association, Virginia Wine Board; Graduate advisory committee: Scott Salom, Jayesh Samtani; Parasitoid ID: Christine Dieckhoff; and from the Pfeiffer Lab: Meredith Shrader, Curt Laub, Corey Reidel.
41
HUNTING DOWN THE HUNTERS: H. HALYS EGG DAMAGE AND NATURAL ENEMIES
William R. Morrison III1, Clarissa R. Mathews2, Tracy C. Leskey1
1 USDA-ARS Appalachian Fruit Research Station, Kearneysville, WV 25430
2 Shepherd University, Shepherdstown, WV The brown marmorated stink bug, or Halyomorpha halys, is an invasive pest from Asia (Lee et al. 2013) that was accidentally introduced into the United States in the mid-1990s (Hoebeke and Carter, 2003). One reason that it has done so well in the United States is due to the fact that it lacks effective natural enemies in its introduced range, often referred to as the enemy-release hypothesis. However, it has now been present in the country for almost 20 years, so an inevitable question that arises is whether native natural enemies are beginning to recognize H. halys as a potential prey item. Natural enemies may recognize prey through a variety of mechanisms, including through the emission of plant volatiles signaling herbivore damage and via the emissions of kairomones from the prey itself. A kairomone is any chemical signal that benefits the receiver and harms the sender. One potential kairomone emitted by H. halys is the species’ recently identified two component male-produced aggregation pheromone (Khrimian et al., 2014). In the current study, we evaluated whether natural enemies were using this aggregation pheromone to preferentially attack H. halys egg masses in the vicinity. Specifically, our study evaluated whether deploying the pheromone with egg masses increased the predation rate, parasitism rate, or number of unemerged eggs remaining. To do this, we deployed freshly laid (<24 h old) sentinel egg masses either with or without 42 mg of the H. halys aggregation pheromone, and left them out for 72 h. We did this at eight sites arranged in two transects of roughly 40 km in Jefferson Co. and Berkeley Co., WV and in neighboring counties in Maryland and Virginia. Egg mass treatments were paired at each site, with ~ 100 m between each treatment. We took photographs before and after sentinel egg mass deployment to record the damage. We found that the presence of the aggregation pheromone did not significantly affect the predation rate, parasitism rate, or the number of unemerged eggs remaining. This suggests that native natural enemies are not using the aggregation pheromone as a kairmone. Future work may investigate other potential kairomones and plant volatiles for use by natural enemies of H. halys. References Hoebeke, E. R., and M. E. Carter. 2003. Halyomorpha halys (Stal) (Heteroptera : Pentatomidae): A polyphagous plant pest
from Asia newly detected in North America. Proc. Entomol. Soc. Washington 105: 225-237. Khrimian, A., A. Zhang, D. C. Weber, H. Y. Ho, J. R. Aldrich, K. E. Vermillion, M. A. Siegler, S. Shirali, F. Guzman, and
T. C. Leskey. 2014. Discovery of the aggregation pheromone of the brown marmorated stink bug (Halyomorpha halys) through the creation of stereoisomeric libraries of 1-bisabolen-3-ols. J. Nat. Prod. 77: 1708-1717.
Lee, D. H., B. D. Short, S. V. Joseph, J. C. Bergh, and T. C. Leskey. 2013a. Review of the biology, ecology, and management of Halyomorpha halys (Hemiptera: Pentatomidae) in China, Japan, and the Republic of Korea. Environ. Entomol. 42:

42
Not for Citation or Publication Without Consent of the Author
CHARACTERIZATION OF THE FEEDING INJURY CAUSED BY HALYOMORPHA HALYS NYMPHS ON APPLE AND PEACH AT HARVEST
Angelita L. Acebes1,*, Tracy C. Leskey2, and J. Christopher Bergh1
1AHS Agricultural Research and Extension Center, Virginia Tech, Winchester, VA 22602 2USDA-ARS, Appalachian Fruit Research Station, WV, 25430
Halyomorpha halys adults and nymphs feed on tree fruits. Feeding injury from adults has
been characterized but the injury from nymphs has not been examined systematically. We compared feeding injury at harvest from second and third instar nymphs, fourth and fifth instar nymphs, and adults that were caged on ‘Smoothee Golden’ apples and ‘Redhaven’ peaches in early June (peach and apple), late July (peach), and late August (apple). Individual apples and peaches were caged at fruit set and assigned to the following treatments (n=28/treatment): 1) control (no H. halys), 2) young nymphs or 3) adults early in the season, and 4) young nymphs, 5) older nymphs or 6) adults later in the season. Fruit in each treatment were exposed to 3-4 young nymphs, 2 older nymphs or 1-2 adults placed in the cages for 96 h and evaluated for external and internal feeding injury within 36 h after harvest. No injury was recorded from unexposed peaches or apples. The percentage of injured fruit and number of injuries per fruit varied significantly among the exposed treatments. Early-season feeding by young nymphs yielded the least injury to peaches and apples. In apples, the highest percentage of injured fruit and number of injuries per fruit were caused by late-season feeding by adults. In peaches, early-season adult feeding produced the highest percentage of injured fruit and injuries per fruit. More internal than external injury was recorded on peach and no such difference was observed on apple. These findings have relevant implications on the management of H. halys in fruit orchards.
Acknowledgments. We are greatly thankful for Jean Engelman, Chuck Ingels, Eliezer Doria and the student assistants for their excellent technical assistance. This material is based upon work that is supported by the National Institute of Food and Agriculture, U.S. Department of Agriculture, under award number #2011-51181-30937.

43
HANDS ON APPLE IPM PROJECT ON NORTHEASTERN NY ORCHARDS
Anna Wallis
CCE Eastern NY Commercial Horticulture Program 6064 Rte 22 Plattsburgh, NY 12901
Changes in the landscape of northern NY orchards over the past decade have
influenced the significant pests of these orchards. Changes have included the adoption of high density systems, new varieties and rootstocks, restrictions on availability of chemical controls, and climate change. While this region historically has low insect pressure relative to other areas, both growers and consultants in the region have reported increased presence of some pests, including San Jose scale, leaf rollers, codling moth, plum curculio, and other minor early season insects. Extensive IPM education was conducted in the 1990s throughout NY State as a way to control orchard pests while minimizing negative impacts. Due to the changes in climate, orchard design, and pests, growers have been slow to adopt IPM or reduced spray programs.
The objectives of this project was to document significant insect pests of commercial orchards in Northeastern NY and to test the efficacy of an established IPM protocol compared to grower standards. In addition, resources were used to provide training for growers on IPM and orchard IPM protocol.
Eight sites were established in Northeastern NY, with an IPM block (IPM) and grower standard block (GS) at each. Recommendations were given for the IPM blocks on a weekly basis, based on an established IPM protocol. This protocol used trap captures, scouting, and the NEWA forecasting system identify pest presence and life stages. Management decisions (spray recommendations) were made based on pre-decided thresholds. Differences in IPM and GS treatments was quantified by rating fruit damage by type and severity at the end of the season.
As expected, IPM recommendations were driven by plum curculio in the early part of the growing season, obliquebanded leafroller mid-summer, and apple maggot late in the summer; codling moth and oriental fruit moth presence and pressure was low. Total insect damage in IPM blocks was not different than GS blocks. All blocks were below a 5% acceptable damage threshold for all insects except tarnished plant bug, an insect that is presumably controlled by plum curculio sprays. Insecticide applications were between 1-4 fewer in IPM blocks than GS blocks. The time spent checking traps, scouting, and consulting the NEWA system was more than justified given time and money saved in reduced insecticide applications. Data is being collected to quantify this. Implementation of IPM protocol will depend on grower education, seasonal conditions, and changes in available materials and pest pressure. Efforts made this season were to train growers were well received and will continue next season.

44
Not for Citation or Publication Without Consent of the Author
EVALUATION OF A NOVEL ATTRACT-&-KILL TECHNOLOGY FOR CONTROL OF
ORIENTAL BEETLE IN BLUEBERRIES USING SPLAT-ORB-A&K™
Cesar Rodriguez-Saona1, Robert Holdcraft1, and Agenor Mafra-Neto2
1Rutgers University, P.E. Marucci Center, Chatsworth, NJ 08019
2ISCA Technologies, Riverside, CA 92517
Background: The oriental beetle (OB), Anomalia orientalis, (Fig. 1) was introduced into the US in the early 1900’s. The beetle’s distribution has gradually increased in the northeastern US, currently extending to the Midwestern states. In the past 2 decades, OB has been reported as a major white grub pest of ornamental nurseries and crops such as strawberry, blueberry and cranberry. Damage inflicted by OB results from the feeding of the larvae on the roots of the plant (adults reportedly do not feed). Blueberry bushes infested with OB grow smaller leaves and produce fewer fruits, are generally less healthy, and tend not to live as long as uninfested bushes. In severe cases, OB larvae are capable of destroying nearly the entire root system of the infested plant (Fig. 1), leading to its death. Current Control Methods:
Current chemical control for this pest is limited to soil applications of the neonicotinoid insecticide, imidacloprid. Aside from the high cost of application of this insect neurotoxin there have been increasing concerns regarding its use in recent years, due to the impact it may have on beneficial non-target organisms, such as natural enemies of crop pests or pollinators. There is also some fear that OB may develop resistance to this insecticide; if this were to occur, it would leave blueberry growers without any viable chemical control option to manage this pest in their fields. Furthermore, blueberry cultivation typically occurs where there is a high water table and sandy soils, such that applications of conventional insecticides pose a significant risk of groundwater contamination. In light of these concerns, the development of new and innovative strategies for OB management, such as the use of mating disruption (MD) or Attract-&-kill (A&K) technologies are of high priority.
The OB sex pheromone, isolated in the early 1990s, was identified as a 9:1 blend of (Z)-and (E)-7-tetradecen-2-one. Since then it has been successfully used in monitoring traps and has been implemented in a number of control strategies using MD. Previous MD pheromone formulations have achieved some success in reducing beetle trap captures within treated areas, proving that management of this pest through MD is indeed feasible in blueberry fields, but require a large input of time and manpower to deploy manually applied pheromone dispensers at the rate required to achieve effective control. SPLAT OB-MD and SPLAT OB-A&K Formulations:
Fig. 1. Oriental beetle adult male and grub damage to blueberries.

45
A long-lasting pheromone formulation that is highly effective, and that could be applied once during the blueberry field season using off-the-shelf equipment would be highly desirable. Such a formulation would increase the cost efficiency of OB control, especially if the product was amenable to mechanized rather than manual application, and could be applied to the ground, to avoid contamination of fruit and personnel. Application of the OB pheromone component in Specialized Pheromone Lure Application Technology (SPLAT) (ISCA Technologies) allows for a high density of small dollops which is optimal for control through competitive attraction which has been shown to be active during previous MD trials for this pest.
SPLAT OB may provide growers greater ease of use than other pheromone-based technologies, since the flowable quality allows for application of SPLAT OB-MD and SPLAT OB-A&K through various methods which include; manual application through spatulas or caulking guns, semi-mechanical application with use of traditional farm equipment like small and large tractors, and/or possible aerial applications in large areas. Mechanical application of this material has been demonstrated with an applicator mounted on existing farm equipment. In addition to the positive results achieved with the SPLAT OB-MD as a traditional MD product, the A&K version which incorporates the insecticide Δ-cypermethrin, may allow for a reduction in the quantity of semiochemical attractant necessary per unit area to achieve effective OB control. The reduction of the amount of pheromone needed will further lower cost since the pheromone is very expensive (technical grade OB pheromone can cost up to $6,500 per kg). A more cost-efficient and practical OB pheromone formulation would encourage growers to adopt these safer MD or A&K strategies instead of continuing to rely on conventional chemicals, improving the sustainability of the US blueberry industry. Initial Test of SPLAT OB-MD vs SPLAT OB-A&K, 2011:
A field study conducted in New Jersey blueberry fields in 2011 demonstrated that OB captures remained consistently low in SPLAT OB-MD and SPLAT OB-A&K treated plots (Fig. 2). The treatments were kept consistent at 1 gram of SPLAT per dollop, but were placed out at two densities: 250 & 500 dollops per hectare. A disruption index of > 95% was observed in all treated plots when compared to control plots. This study revealed that effective MD of OB can be achieved with as little as 250 (1 gram) point sources of SPLAT OB per hectare. Optimization of SPLAT OB-A&K Application Rate, 2014-2015:
In order to make the product cost efficient for blueberry growers, we further tested the minimum point source density of 250 point sources per hectare by reducing the amount of material from 1 g per point source to 0.5 g and 0.25 g. Field trials evaluating the performance of
Fig. 2. Results from 2011 trials to test the efficacy of SPLAT OB-MD and SPLAT OB A&K. *Disruption Index = [(avg. beetles / trap in control plots) – (avg. beetles / trap in treatment plots) / (avg. beetles/trap in control plots)] × 100. DI≥95% traditionally considered effective (Cardé, R.T., 2007. Perspectives Ecol Theor & IPM )

46
SPLAT OB-MD and SPLAT OB-A&K at these lessened application rates were carried out in three commercial blueberry farms in Hammonton, NJ, over two consecutive years. The following treatments were applied in June of 2014 and 2015: 1. Control; No SPLAT treatment. 2. SPLAT OB-MD: 250 dollops/ha, 0.25 g/dlp (1% (Z)-7-tetradecen-2-one). 3. SPLAT OB-MD: 250 dollops/ha, 0.50 g/dlp (1% (Z)-7-tetradecen-2-one). 4. SPLAT OB-A&K: 250 dollops/ha, 0.25 g/dlp (1% (Z)-7-tetradecen-2-one + 2% cypermethrin). 5. SPLAT OB-A&K: 250 dollops/ha, 0.50 g/dlp (1% (Z)-7-tetradecen-2-one + 2% cypermethrin).
For all SPLAT treatments, the formulation was applied to small strips of paper (Fig. 3) and placed on the ground at the base of blueberry plants, to ensure maximum impact on OB populations—sex pheromone-mediated mate finding and copulation is known to occur at or near the soil surface shortly after adult emergence, close to the emergence site. Treatments were assigned to plots in a randomized complete block design, with three replicate plots per treatment. Each plot was 1 hectare in size, with a minimum of 50 m spacing between plots. All fields received the grower’s standard fungicide and insecticide programs, but no applications of imidacloprid were made during the study. Efficacy of the various treatments for OB population suppression was evaluated on the following criteria: • Trap shutdown
Three traps (Trécé, Adair, OK) baited with 300 μg of (Z)-7-tetradecen-2-one were placed in each plot and monitored regularly (minimum of once per week) to determine the number of male beetles captured in treatment and control plots (Fig. 4). These traps were installed 2 weeks prior to SPLAT application, to compare data on OB activity before and after treatment. • Female-mimic lures
Attraction of male OB was assessed in each plot using five female-mimic traps, each containing a lure loaded with 0.3 μg of (Z)-7-tetradecen-2-one (Fig. 4) . Traps were placed in plots for three nights, and then retrieved to determine male presence. Female mimic traps were deployed in plots twice during the period of activity of OB in 2014 and three times in 2015. • Grub density
To directly assess the effects of SPLAT treatments on OB larval density in each plot we used a cup-cutter device to take soil samples near the base of blueberry bushes such that the samples included a portion of the root mass and any larvae feeding on those roots (Fig. 4). To evaluate the effect of the 2014 SPLAT treatments 12 bushes per plot were sampled in this manner during April 2015 looking for the overwintered grubs. To evaluate the 2015 treatments 30 bushes were sampled in late October 2015. All data from 2011-2015 trials were analyzed using one-way analysis of variance (ANOVA), with means separated via Tukey’s test (p≤0.05).
Results
Fig. 3. SPLAT dollop application.
Fig. 4. Methods used to evaluate SPLAT OB-MD and SPLAT OB-A&K.

47
2014 Trap shutdown.
Trap shutdown results suggest that effective MD and A&K of OB using SPLAT OB-MD or SPLAT OB-A&K can be achieved and sustained for 6 to 8 weeks in blueberry fields. The DIs suggest that 125 g of either formulation per hectare (1.25 g AI/ha) is effective when applied as 0.5 g point sources in blueberry fields (Fig. 5). Female-mimic lures (2014).
Beetle captures in traps baited with female-mimic lures were higher in control plots than in SPLAT-treated plots, across all replicates, formulations and application rates (Fig. 5). The plots treated with SPLAT formulations resulted in comparatively low OB trap captures, for both MD and A&K treatments and the A&K treatments. Grub density (2014).
Total counts of OB grubs found in soil samples taken in April 2015 were too variable to show any significant differences between treatments or control plots, though the trend seems to match the pattern seen in both types of trap data (Fig. 6). 2015 Trap shutdown.
As in the 2014 trial, the results of the 2015 study show significant reductions in OB trap captures in all SPLAT OB treated plots, for both A&K and MD, at both application rates (Fig. 7). Taken together, the results of this two-year study suggests that the smaller dollop sizes of 0.5 and 0.25 g for SPLAT OB are still sufficient to achieve effective control of OB through MD or A&K. In addition, these data indicate that with continued optimization, further reductions in the amount of AI required per hectare could be possible, especially with A&K formulations.
Fig. 5. Results from 2014 trials to test the efficacy of SPLAT OB-MD and SPLAT OB A&K.
Fig. 6. Results from 2014 trials for number of OB larvae among treatments.

48
Female-mimic lures (2015).
As in 2014, applications of SPLAT OB-MD and SPLAT OB-A&K achieved significant reductions in captures of male oriental beetles in traps baited with 0.3 μg pheromone lures (Fig. 7). SPLAT OB-A&K seems to have achieved a slightly higher degree of control than SPLAT OB-MD for MD, for both 0.25 g and 0.5 g dollop sizes. Conclusions 2011: A&K treatments were at least as effective as MD treatments in controlling OB, with all treatments providing over 95% control (DI) compared to untreated plots. 2014-2015: The lowest application rate for SPLAT-A&K (0.25 gram dollops at 100/ac) maintained a DI>93%, while the same rate of SPLAT-MD (0.25 gram dollops at 100/ac) repeatedly showed DI<90%. Acknowledgements .
We would like to acknowledge Atlantic Blueberry Co., Glossy Fruit Farms, Macrie Bros, Merlino Bros, and Oakcrest Farms for providing field sites. And Kris Dahl, Charles Corris, Andrew Lux, Mike Scullion, Sarah DeFalco, and Jennifer Frake for research assistance.
Fig. 7. Results from 2015 trials to test the efficacy of SPLAT OB-MD and SPLAT OB A&K.
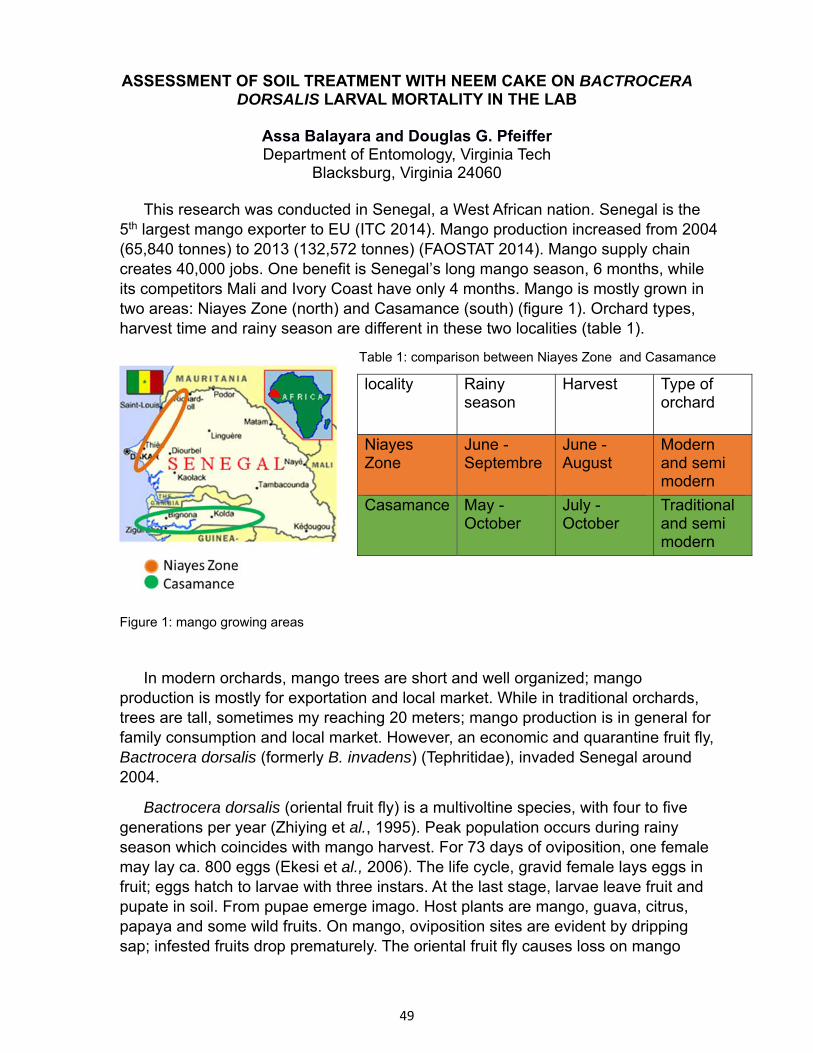
49
ASSESSMENT OF SOIL TREATMENT WITH NEEM CAKE ON BACTROCERA DORSALIS LARVAL MORTALITY IN THE LAB
Assa Balayara and Douglas G. Pfeiffer Department of Entomology, Virginia Tech
Blacksburg, Virginia 24060
This research was conducted in Senegal, a West African nation. Senegal is the 5th largest mango exporter to EU (ITC 2014). Mango production increased from 2004 (65,840 tonnes) to 2013 (132,572 tonnes) (FAOSTAT 2014). Mango supply chain creates 40,000 jobs. One benefit is Senegal’s long mango season, 6 months, while its competitors Mali and Ivory Coast have only 4 months. Mango is mostly grown in two areas: Niayes Zone (north) and Casamance (south) (figure 1). Orchard types, harvest time and rainy season are different in these two localities (table 1).
Table 1: comparison between Niayes Zone and Casamance
Figure 1: mango growing areas
In modern orchards, mango trees are short and well organized; mango production is mostly for exportation and local market. While in traditional orchards, trees are tall, sometimes my reaching 20 meters; mango production is in general for family consumption and local market. However, an economic and quarantine fruit fly, Bactrocera dorsalis (formerly B. invadens) (Tephritidae), invaded Senegal around 2004.
Bactrocera dorsalis (oriental fruit fly) is a multivoltine species, with four to five generations per year (Zhiying et al., 1995). Peak population occurs during rainy season which coincides with mango harvest. For 73 days of oviposition, one female may lay ca. 800 eggs (Ekesi et al., 2006). The life cycle, gravid female lays eggs in fruit; eggs hatch to larvae with three instars. At the last stage, larvae leave fruit and pupate in soil. From pupae emerge imago. Host plants are mango, guava, citrus, papaya and some wild fruits. On mango, oviposition sites are evident by dripping sap; infested fruits drop prematurely. The oriental fruit fly causes loss on mango
locality Rainy season
Harvest Type of orchard
Niayes Zone
June -Septembre
June -August
Modern and semi modern
Casamance May - October
July - October
Traditional and semi modern

50
production up to 50% in modern orchards and up 60% in traditional orchards (Ternoy 2006).
The objective of this work was to assess the effect of soil treatment with neem cake on Bactrocera dorsalis larval mortality in the lab. Our null hypothesis was: Bactrocera dorsalis larval mortality is not associated with soil treatment with neem cake.
Materials and Methods
Three soil treatments were used to test the hypothesis:
o Neem cake 1: NC1 (deoiled), 30g NC1 + 30g sand
o Neem cake 2: NC2 (oiled), 10g NC2 + 30g sand
o Control: 50g sand
17 third instar larvae were placed randomly per container (6 replicates).
Two weeks later, the number of emerged B. dorsalis and % larval mortality were recorded. Then, a Contingency Table Analysis was done with JMP software.
Results
Figure 2 shows proportion of living and dead larvae in control, NC1 and NC2.
Ratio of living and dead larvae is significantly different.
Figure 2: proportion of alive and dead larvae on control, NC1 and NC2
Soil treatment with NC1 and NC2 have higher % mortality over the control, 98%, 99% and 7%, respectively. P < 0.0001 rejects the null hypothesis, Bactrocera dorsalis larval mortality is associated with soil treatment with neem cake.
P< 0.0001

51
Conclusion
Soil treatment with neem cake has a larvicidal effect on B. dorsalis. Neem cake may be an alternative to chemical control of larvae of the oriental fruit fly. In Senegal where neem trees are grown naturally, neem cake should be used by farmers and sellers to control larvae population in their orchard or market places.
References
Ekesi, S., P. W. Nderitu, and I. Rwomushana. 2006. Field infestation, life history and demographic parameters of the fruit fly Bactrocera invadens (Diptera: Tephritidae). Bulletin of Entomological Research. 96: 379-386.
FAOSTAT (Food and Agriculture Organization of the United Nations- Statistic). 2014. http://faostat3.fao.org.
Ternoy, J., C. Poublanc, M. Diop, P. Nugawela. 2006. La chaine de valeurs mangue au Sénégal : analyse et cadre stratégique d’initiatives pour la croissance de la filière, Unité BDS du programme USAID Croissance économique, Dakar, Sénégal, Sept. 2006, 90 p.
ITC (International Trade Centre). 2014. http://www.intracen.org
Zhiying, Z., H. Dayu, and S. Yuping. 1995. On the population dynamics of Oriental fruit fly in Yunnan Province. Acta Phytophylacica Sinica. 22: 211-216
Acknowledgments:
I would like to thank: My committee members: L. Vaughan, C. Brewster and A. Baudoin. USAID/ERA project for financing my research. Kalilou Bodian and Elage Omar Dieng for their help with field and lab work. Lamine Diouf for his help and support. Faculty, staff and students in Entomology department. Family and Friends

52
NotforCitationorPublicationWithoutConsentoftheAuthor
EVALUATION OF NATIVE NEW YORK ENTOMOPATHOGENIC NEMATODES FOR BIOCONTROL OF PLUM CURCULIO IN APPLE ORCHARDS
T. Lessord1, A. Agnello1, T. Testa2, E. Shields2, K. Wickings1
1Dept.ofEntomology,CornellUniversity,GenevaNY14456,and2Ithaca,NY14853
PlumCurculio(PC)isaveryimportanteconomicpestinmanyfruittreesystems.Currentlythemainmanagementmethodforthispestistheregularapplicationofinsecticides.However,duetoincreasingrestrictionsontheuseoftheseinsecticides,professionalshavebeenseekingalternatives. In1990,andthenagainin2004,theShieldslabatCornellUniversitytrappedandisolatedseveralnativeentomopathogenicnematodestrainsfromnorthernNewYork.ThesehavebeenfoundtobepersistentinNewYorksoilsforuptoeightyears.Additionally,thesestrainshavebeenknowntobehighlyeffectiveasabiocontrolagentininthemanagementofAlfalfaSnoutBeetle,aspeciesinthesamefamilyasPC. Inlabassays,severalEPNspecieshavebeenfoundtobevirulentagainstPC,sothisinspiredinteresttotesttheefficacyofthepersistent,nativeNewYorkEPNstrainsinthefield.Steinernemacarpocapsae“NY‐001”andSteinernemafeltiae“NY‐04”werechosenspecificallyforPlumCurculioduetoanumberoffactors,andappliedtothefieldwithasprayermountedtothebackofanATV. Post‐inoculation,fieldtrapsweresetupbyinsertinga4”diameteracrylictubeintothesoilandaffixingatraptop,preventingPCescape.PClarvaewereadded,andadultemergencewasrecorded,andthuswewereabletoassessPCmortalityinfield‐inoculated,hand‐inoculated,andcontroltreatments.Thiswasdoneacrossfourfieldsites,The“DaviesFarm”managedbyRedJacketOrchards,Geneva,NY,andthreeNYSAESCornellfieldsites:“Empire,”“IdaRed,”and“Loomis.”
Afteranumberofyearsinthisscenario,thehighlyvariablenatureoffieldtrialspossessedustobringthisstudyintothelab.4”diameterPVCpipewascutinto6”lengthsandgivenabeveledtip.Thepipesweretheninsertedintothegroundtocollectanintactcolumnrepresentingtheparticularsoilprofileofeachofthefourfieldsitesnamedpreviously.Alayerofgreenhousefabricwasthenfastenedtothebottomofeachsoilcolumnwithacabletie.Thecolumnswerethenplacedinlargeplasticbins,andkeptatconstanttemperatureandmoisturefortheremainderoftheexperiment.Foreachsite,asetof15coreseachwasplacedinoneofthreecategories:EPNpersistence,EPNvirulenceagainstPC,andPCsurvivorship.
IntheEPNsurvivorshipcategory,coreswereinoculatedwithbothEPNspeciesatabout5,000‐7,000infectivejuvenilespercore,aconcentrationdeterminedtobeequivalenttowhatwouldbefoundinthefield.EPNpersistencewasthentestedapproximatelyevery4weeksbyinsertingascreencagecontainingawaxworm,(Galleriamellonella)anindicatororganism,intoaholeboredintothecore.Afteroneweek,waxwormmortalitywasassessed,andthenconfirmedtobeEPN‐causedbyamethodknownaswhitetrapping.TheEPNswerefoundtoestablishwellinthegivensoils,andpersistovermanymonths(Fig.1).
InPCsurvivorshipcores,tenlast‐instarPlumCurculiolarvaewereaddedtoeachcore,andatrapwassecuredtothetopofeachcore.PCemergencewasassessed,soassumptionsaboutbaselinePCmortalityineachofthefoursitescouldthenbemade.

53
InthecoreswhereEPNvirulenceagainstPCwastested,thecoreswereallinoculatedwithEPNsasabove,andEPNpresencewasconfirmedusingwaxworms.Thenthecoreswereeachinfestedwithtenlast‐instarPlumCurculiolarvae,andtrapsweresecuredtothetopofeachcoretopreventPCescape.PercentemergencewasthenusedtoassesspercentPCmortality.ItwasthencomparedtothebaselinePCmortalityinun‐inoculatedsoil,andvirulenceoftheentomopathogenicnematodeswasassessed(Fig.2).WhiletheEPNswerefoundtopersistandkillGalleria,thelackofsignificanttreatmenteffectsonPCmortalityindicatethattheEPNsmaynotbeabletolocateand/orkillPlumCurculio.
Duetothefactthatnematodesarehighlyaffectedbytheirenvironment,several
abioticsoilcharacteristicswerealsotested.Soilwaterholdingcapacityprovedtobeonlymarginallydifferentacrossthefourfieldsites(Fig.3),whereassoiltexturewassignificantlydifferentamongstthesites(Fig.4).
Fig. 1. EPN‐caused wax worm (Galleria)
mortality on Sep 14 and Oct 12, 2015, across
cores from all four field sites.
Fig. 3. Soil water holding capacity in each of four
field sites.
Fig. 4. Soil texture in each of four field sites.
Fig 2. Plum Curculio emergence in
EPN‐treated soil cores and untreated

54
CurrentandongoingstudiesincludeEPNvirulenceandpersistencetrialswitheachoftheEPNspeciesseparately,andare‐runofthesametrialswithbothSteinernemacarpocapsaeandSteinernemafeltiaetogether.Inaddition,aCarbonandNitrogenanalysisiscurrentlybeingrunonsoilfromeachofthefoursites.AcknowledgementsIwouldliketothankmycommittee,Dr.ArtAgnello,Dr.KyleWickings,andDr.ElsonShields.IwouldalsoliketothankAntonioTestaoftheShieldslabatCornellforhisadviceandinsightregardingEPNsandthewhitetrappingprocess.IthankForrestEnglish‐Loeb,EmilyPennock,andAbagailDavisforalloftheirhelpinthefield,aswellastheNewYorkStateAgricultureandMarketsSpecialtyCropBlockGrant,andtheSmith‐LeverFederalFormulaFunds.

55
AMBROSIA BEETLE (XYLOSANDRUS GERMANUS) INFESTATIONS AND MANAGEMENT TRIALS IN HIGH-DENSITY APPLE ORCHARDS
Arthur Agnello, Deborah Breth, Abagail Davis and Elizabeth Tee
Dept. of Entomology, Cornell University
Background The ambrosia beetle Xylosandrus germanus (Blandford) (Coleoptera: Curculionidae: Scolytinae), also known as the black stem borer, is a serious pest in ornamental tree nurseries and landscapes in North America. A native of Asia (mainly Japan, Korea, Vietnam, China, and Taiwan), it now occurs in central Europe and the US, first documented here in New York, in greenhouse-grown grape stems. Since then, it has become established in much of the United States. It has previously been noted as a pest in ornamental nurseries, with a wide host range including oak, elm, red maple, beech, and other hardwood species. It attacks and bores galleries into the wood of trunks or limbs of apparently healthy plants and those that are stressed, dying or recently dead. Galleries are excavated by the females, and comprise entrance tunnels, brood chambers containing eggs, and branch tunnels where young develop. The species is bivoltine and overwinters as adults, primarily females, in galleries of its host plants. The term "ambrosia beetle" refers to species that derive nourishment during the larval and adult stages from a mutualistic "ambrosia" fungus carried by the adult female in mycangia (internal pouches) and introduced into host plants during gallery excavation. The ambrosia fungus associated with X. germanus is Ambrosiella hartigii Batra, visible in the galleries as an abundant grayish-white mycelium growth. It is this fungal growth that the insects feed on, and not the host plant tissue. However, its presence signals the tree that it is under attack, and as the tree walls off its vascular system, symptoms develop including wilting, dieback, tree decline and death. In 2013, infestations of X. germanus were seen for the first time in commercial apple trees, in multiple western NY sites; some affected trees additionally exhibited fire blight symptoms. Indeed, one of the few instances of streptomycin-resistant fire blight in 2013 was obtained from an X. germanus infestation. In addition to fire blight, mycelium of Fusarium was observed in some heavily infested samples in 2013, and Nectria haematococca (Fusarium solani) was recovered from several beetles in 2014. By the end of 2013, hundreds of trees were removed in high density apple plantings during the middle of the growing season. In 2014, trapping and inspection efforts were initiated in the general apple-growing region along Lake Ontario. To date, at least 30 additional infestation sites have been documented, extending as far as to Long Island, and it appears that these ambrosia beetles may have been present in the area for some years before first detected, as they are now being found in nearly every orchard showing these tree decline symptoms; several hundred trees have already been destroyed. Current studies suggest that this species invades from nearby wooded areas, but there is relatively little research on movement of ambrosia beetles from wooded areas into nurseries or orchards. The insects attack stressed (including some apparently healthy) trees, boring into the trunk or limbs to create galleries where young develop. A variety of stressors, including flooding, drought, and freezing exposure have been identified as potential causes of physiological stress that preferentially attract ambrosia beetles. Trees under this type of stress produce several types of volatiles, among them ethanol, which has been documented to be a strong attractant to the beetles. In commercial ornamental tree nurseries, growers routinely rely on insecticide trunk sprays to prevent new infestation and colonization of trees by ambrosia beetles. For effective protection against these insects, pesticide applications must be closely timed with insect attack, applied repeatedly, and/or have long residual activity. A reliable monitoring system would give growers the ability to coordinate any needed control treatments with beetle activity. Ethanol-baited traps have been demonstrated to be useful for monitoring the flight activity of ambrosia beetles in ornamental nurseries.

56
Methods In 2015, we assessed black stem borer (BSB) adult occurrence and distribution in several New York apple growing regions, using ethanol-baited bottle traps hung on metal garden hangers at a 1-m height, placed along the edges of orchards bordered by hedgerows and woods likely to be a source of immigrating beetles. Additional traps were located (in the western NY orchards) adjacent to previously attacked trees, to verify their attractiveness. Traps were checked weekly starting at the end of April, before maximum temperatures of 20°C began to occur, and continuing until the first week of September. Traps were placed on 14 farms in Wayne Co., 19 farms in Orleans and Niagara Counties, 11 farms in the Hudson Valley, and 9 farms in the Champlain Valley. BSB adults were captured at nearly all of the sites, and were most numerous in the western NY locations. First activity was noted in WNY on May 5, and there were higher counts along the orchard edges than in the interiors. June 2 was the peak of beetle emergence from the overwintering sites, and 1st generation adults emerged from July 6-27. On August 5, the 2nd generation adults emerged, with catch continuing into September. The efficacy and practicality of trunk sprays using chlorpyrifos and two pyrethroid products (lambda-cyhalothrin and gamma-cyhalothrin) was evaluated against infestations of ambrosia beetles on two commercial farms having documented infestations (Sodus, NY and Medina, NY). All treatments were replicated in randomized complete plots at each of the individual test sites. Potted 2-yr old Mutsu trees from the nursery were placed in turn into larger pots, which were then flooded to induce stress and promote ethanol production. These potted trees were placed in the rows between the orchard trees, with 5 pots per replicate, and 4 replicates per treatment at each site. The trunks of the potted trees plus the orchard trees were sprayed using a handgun sprayer (Rears Nifty Pul-Tank) on May 7 and 8, before the start of major BSB flight. The treatments were:
chlorpyrifos (Lorsban Advanced); 1.5 qt/100 gal lambda-cyhalothrin (Warrior II); 2.56 fl oz/100 gal gamma-cyhalothrin (Declare); 2.05 fl oz/100 gal Untreated Check (potted trees only; orchard trees in Check plots sprayed with chlorpyrifos) Grower Standard (Lorsban 1.5 qt/100 gal applied by grower using airblast sprayer)
Treatment efficacy was assessed for evidence of new infestations by preliminary inspection of treated and untreated trees on July 9, after termination of the first flight. A final evaluation of the potted trees was conducted on August 19; these were destructively sampled to document all occurrences of holes, galleries, adults, and brood in the treated trees. Results In the Preliminary Evaluations, efficacy of the handgun treatments in the potted trees was not consistent between the two sites, with the Lorsban plots tending to have lower levels of infested trees than the Warrior plots at the Sodus site, but the opposite trend occurring at the Medina site (Table 1). Damage in the Lorsban airblast (Grower Standard) treatment was low at both sites; however, because these plots were situated in a different part of each orchard (to prevent the airblast application from interfering with the handgun treatments), there was almost certainly a site variability factor introduced in regard to BSB population pressure, so it is difficult to make any reliable inference about comparative treatment efficacy as a result. There were no significant treatment differences in percent infested trees in the established orchard trees. Results of the Final Evaluations varied somewhat between sites (Table 1). At Sodus, there was a slight trend toward lower infestations (infestation holes, presence of galleries, gallery contents) in the sprayed vs. Check treatments; however, there was no real separation among the handgun treatments. The Grower Standard was lower in all categories. At the Medina site, the Lorsban handgun treatment generally had the lowest infestations, with the pyrethroid products not performing as well. The Grower Standard was again lower in all categories.
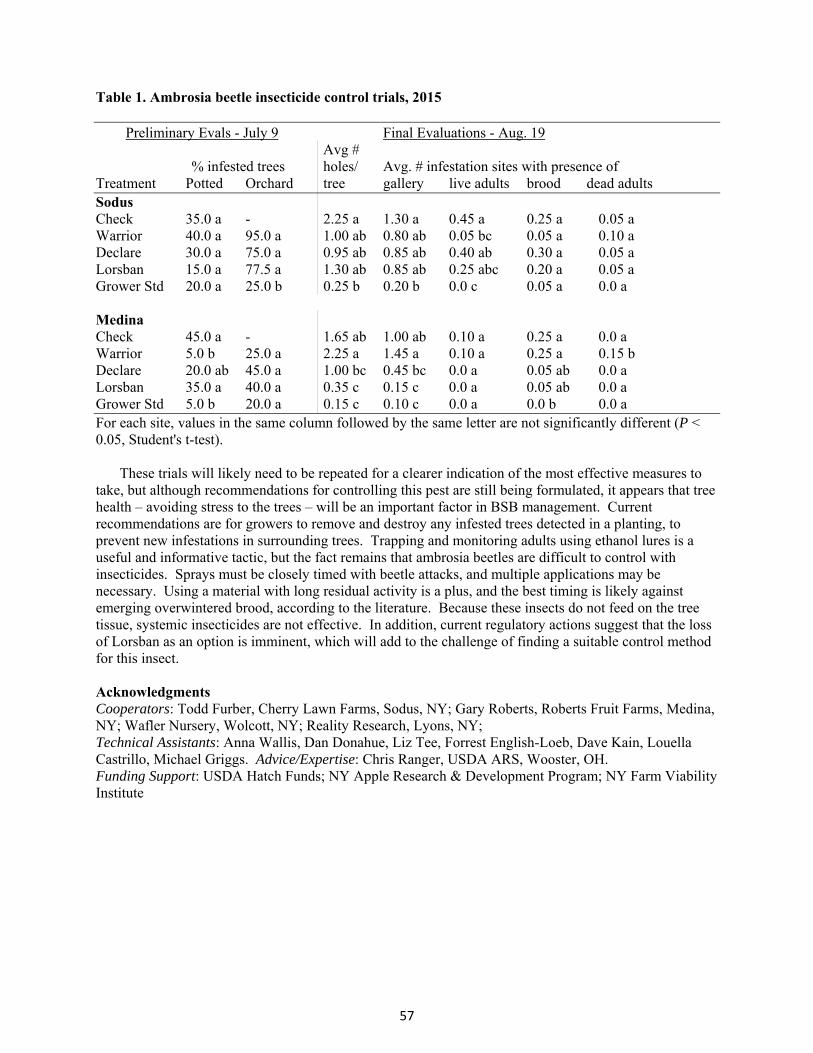
57
Table 1. Ambrosia beetle insecticide control trials, 2015 Preliminary Evals - July 9 Final Evaluations - Aug. 19 Avg # % infested trees holes/ Avg. # infestation sites with presence of Treatment Potted Orchard tree gallery live adults brood dead adults Sodus Check 35.0 a - 2.25 a 1.30 a 0.45 a 0.25 a 0.05 a Warrior 40.0 a 95.0 a 1.00 ab 0.80 ab 0.05 bc 0.05 a 0.10 a Declare 30.0 a 75.0 a 0.95 ab 0.85 ab 0.40 ab 0.30 a 0.05 a Lorsban 15.0 a 77.5 a 1.30 ab 0.85 ab 0.25 abc 0.20 a 0.05 a Grower Std 20.0 a 25.0 b 0.25 b 0.20 b 0.0 c 0.05 a 0.0 a Medina Check 45.0 a - 1.65 ab 1.00 ab 0.10 a 0.25 a 0.0 a Warrior 5.0 b 25.0 a 2.25 a 1.45 a 0.10 a 0.25 a 0.15 b Declare 20.0 ab 45.0 a 1.00 bc 0.45 bc 0.0 a 0.05 ab 0.0 a Lorsban 35.0 a 40.0 a 0.35 c 0.15 c 0.0 a 0.05 ab 0.0 a Grower Std 5.0 b 20.0 a 0.15 c 0.10 c 0.0 a 0.0 b 0.0 a For each site, values in the same column followed by the same letter are not significantly different (P < 0.05, Student's t-test). These trials will likely need to be repeated for a clearer indication of the most effective measures to take, but although recommendations for controlling this pest are still being formulated, it appears that tree health – avoiding stress to the trees – will be an important factor in BSB management. Current recommendations are for growers to remove and destroy any infested trees detected in a planting, to prevent new infestations in surrounding trees. Trapping and monitoring adults using ethanol lures is a useful and informative tactic, but the fact remains that ambrosia beetles are difficult to control with insecticides. Sprays must be closely timed with beetle attacks, and multiple applications may be necessary. Using a material with long residual activity is a plus, and the best timing is likely against emerging overwintered brood, according to the literature. Because these insects do not feed on the tree tissue, systemic insecticides are not effective. In addition, current regulatory actions suggest that the loss of Lorsban as an option is imminent, which will add to the challenge of finding a suitable control method for this insect. Acknowledgments Cooperators: Todd Furber, Cherry Lawn Farms, Sodus, NY; Gary Roberts, Roberts Fruit Farms, Medina, NY; Wafler Nursery, Wolcott, NY; Reality Research, Lyons, NY; Technical Assistants: Anna Wallis, Dan Donahue, Liz Tee, Forrest English-Loeb, Dave Kain, Louella Castrillo, Michael Griggs. Advice/Expertise: Chris Ranger, USDA ARS, Wooster, OH. Funding Support: USDA Hatch Funds; NY Apple Research & Development Program; NY Farm Viability Institute

58
Breakout session: Plant Pathology

59
MANAGEMENT OF PEACH DISEASES: INTEGRATION OF NEW FUNGICIDES WITH STANDARDS
Norman Lalancette and Lorna Blaus Rutgers University, Agricultural Research and Extension Center
Bridgeton, NJ 08302
This field study examined the efficacy of recently registered fungicides Fracture, Luna Sensation, and Oso when used in combination with current standards for control of peach blossom blight and brown rot. Programs alternated the new fungicide with the standard during the three bloom sprays and three pre-harvest fruit rot sprays. Programs that examine Fracture, Oso, and Fontelis alone were also included. For treatment comparison, the study had two types of standard programs: (i) a single chemistry standard using Rovral during bloom and Indar during pre-harvest; and (ii) a multi-chemistry program using Vangard / Rovral / Rally during bloom and Gem / Indar / Fontelis during pre-harvest. Although not main targets for evaluation, data were also taken for peach rusty spot and peach scab.
MATERIALS AND METHODS
Orchard Site. The experiment was conducted during the spring and summer of the 2015 growing season. The test block consisted of a 19-year-old ‘Encore’ peach orchard planted at 25 ft x 25 ft spacing. Treatments. Fungicide treatments were replicated four times in a randomized complete block design with single tree plots. Treatment trees were surrounded on all sides by non-sprayed buffer trees. A Rears Pak-Blast-Plot airblast sprayer calibrated to deliver 100 gal/A at 100 psi traveling at 2.5 mph was used for applications. All trees in the block received Ziram 76DF at 4 lb/A on 3 Apr for leaf curl control. Insecticides and miticides were applied as needed to the entire block using a commercial airblast sprayer. Treatment application dates and phenological timing are shown in Table 1.
Assessment. Blossom blight (Monilinia fructicola) was evaluated on 15-18 June by examining 20 shoots per tree. Rusty spot (Podosphaera leucotricha) was evaluated on 29 June by examining 40 fruit per tree. Scab (Fusicladium carpophilum) was evaluated on 1-2 Sep by examining 25 fruit per tree. Brown rot (M. fructicola) was evaluated at harvest on 4 Sep by examining all fruit on arbitrarily selected branches (~ 75 fruit / tree). For postharvest evaluations, 25 asymptomatic uninjured fruit were harvested from each replicate tree and placed on benches in a shaded greenhouse. Brown rot and other rots were evaluated at 4 and 7 days postharvest (DPH). Weather Data. Air temperatures and rainfall data were recorded by a Campbell Scientific 23X data logger located at the research station. This weather station is part of the Mesonet Network operated by the Office of the NJ State Climatologist. Observations

60
were taken every two minutes and summarized every hour. Hourly temperature and rainfall data were averaged and summed, respectively, for each day of the growing season (Table 1). Monthly temperature averages and rainfall accumulations were compared to the 30-year means or sums, respectively, for Bridgeton, NJ.
Statistical Analysis. Analyses of variance (ANOVA) and treatment mean comparisons were performed using the General Linear Models (GLM) procedure of SAS v9.4. The Bayesian Waller-Duncan means test was used to compare treatment means. Arcsin and log transformations were performed as needed for proportions and lesion count data, respectively, to correct for departures from the ANOVA assumptions.
RESULTS AND DISCUSSION
Environment. During the five-month experimental period, air temperatures were near normal in April, June, July, and Aug but 5°F above average for May (67 vs 62°F). Rainfall in April was slightly below normal relative to the 30-year average (3.25” vs 3.58”), while precipitation in May was 2.8” below normal (1.27” vs 4.07”). However, frequent rains in June resulted in a total monthly accumulation that was more than three times the 30-year normal. A total of 11.7” rainfall occurred in June versus the normal 3.37 inches. Precipitation greater than 0.09” was recorded on 16 days – more than half the days in the month (Table 1). Rainfall in July was also considerably higher than average, 7.15 inches versus the 30-year normal of 4.30 inches. But unlike June, this above-average performance was due to a few heavy rains that occurred during the first half of the month. Beginning in mid-July and throughout August, rainfall frequency and amount diminished considerably. Only 1.03 inches of rain was observed in August, versus the normal 4.18 inches. This dry period, which occurred during the pre-harvest fruit ripening period for this study, most likely reduced development of brown rot and other rots on fruit (Table 1). Blossom Blight. Blossom blight disease pressure in 2015 was very high relative to most previous growing seasons. On non-treated control trees, 67.5% of shoots were observed to have at least one blossom blight canker (Table 2). In comparison, canker incidence in 2009, 2010, 2011, and 2013 was 10, 24, 15, and 26%, respectively. Only incidence in 2012, a record 87.5% shoots with cankers, was higher than the current growing season. Regardless of the high disease pressure, all treatments significantly reduced canker incidence and severity (Table 2). The most effective treatments (% control), which were not significantly different from each other, were Rovral (96), Luna Sensation / Rovral / Luna Sensation (94), Rovral / Luna Sensation / Rovral (91), and Oso (87). Fracture alone was the least effective treatment at 50% control, but improved to 68 and 85% control when integrated with Rovral in treatments 5 and 4, respectively. Fontelis alone provided 83% control. The two multi-chemistry standard bloom programs in treatments 11 and 3, which consisted of Vangard, Rovral, and Rally for the pink, bloom, and petal fall sprays, respectively, yielded 63% and 80% control. These programs probably would have performed better had Rally not been used at petal fall. In a separate study conducted

61
this season in another block, Rally used alone for all three sprays at 5.0 oz/A yielded only 31% control. Vangard and Rovral are rated as good and excellent, respectively. Rusty Spot. Like other powdery mildew diseases, rusty spot is favored by relatively dry conditions. Thus, the frequent rains during the susceptible period between PF and 2C, especially during the second half of May and throughout June, made conditions quite unfavorable for rusty spot development (Table 1). On non-treated control trees, only about 12% of fruit became infected with an average of 0.14 lesions per fruit (Table 3). This disease level was considerably better than the 3.3% incidence observed in 2014, but well below the record high of 79% in 2012. Although disease pressure was low, nine of the ten fungicide programs (trts 2-10) did not significantly reduce rusty spot incidence or severity (Table 3). However, seven of these programs (treatments 2, 4-9) were primarily targeting blossom blight and brown rot and therefore did not have a fungicide added that would control rusty spot. Note Captan and Bravo provide minimal control of rusty spot; they are added for scab control. The two standard programs, treatments 3 and 11, had Rally added from PF-2C for management of rusty spot (Table 3). These two treatments had the lowest disease incidence, providing 68 and 84% control, respectively, with the latter showing a significant reduction. The only other program that targeted rusty spot was treatment 10, which had Oso applied between PF and 2C. This compound was not found to be effective, providing only 42% control. Scab. The same wet weather that was unfavorable for rusty spot development was favorable for scab development. Non-treated trees had 55% infected fruit with 35% of these fruit having 10 or more lesions (Table 4). Although scab was not a disease of interest in this study, a basic captan program was included in all treatments to help minimize disease severity on fruit and buildup of twig lesions (Table 4). All treatments had lower levels of scab than the non-treated control, but few statistical differences were observed. The use of Bravo at SS instead of captan, a modification that should improve control, did not significantly reduce scab in standard treatments 3 and 11. Oso was applied from SS through 2C in treatment 10 for evaluation of rusty spot efficacy. However, this timing could also influence scab control. However, scab results from this program indicate that Oso did not have any effect on scab. Of course, for a more definitive evaluation, the Oso should have been applied for all cover sprays. Brown Rot. Brown rot disease pressure was low during the month prior to harvest on 4 September. Only 1.03 inches rainfall occurred during August, versus the normal of 4.18 inches. This lack of rainfall limited build-up of inoculum on cultivars harvested prior to Encore. Furthermore, during the 23-day pre-harvest fruit ripening period from 12 Aug through 4 Sep, when the Encore fruit were most susceptible, a total of only 0.10 inches rainfall occurred. As a result of these conditions, only 20.1% of fruit were infected at harvest on non-treated control trees (Table 5). This amount was certainly better than the 12% incidence observed in this block in 2014, but short of the 44% recorded in 2013.

62
Under the light disease pressure encountered, all fungicide treatment programs were observed to significantly reduce brown rot at harvest (Table 5). Most treatments were not significantly different from each other or from either the Indar standard (trt 2) or multi-chemistry standard (trt 3). Numerically, the top four treatment programs (% control) at harvest were Indar (100%); Indar / Luna Sensation / Indar (97%); Fontelis (97%); and Oso 9 (95%). When applied alone during the pre-harvest period, Fracture provided 77% control at harvest (Table 5). Alternation of Fracture with the standard Indar during the three pre-harvest sprays did not significantly improve control. However, it may be worth nothing that the Indar / Fracture / Indar program had about half the amount of fruit rot as the all-Fracture program. Rainfall (0.42 inches) occurred on the day of harvest, and about half of the fruit (2 of 4 reps) became wet (Table 1). This likely infection period resulted in brown rot development during the post-harvest period. By four and seven days post-harvest, 33% and 57% of non-treated fruit, respectively, were observed to have brown rot (Table 5). At 4-DPH, all treatments had numerically less brown rot infected fruit than the non-treated control, but most of these differences were not significant (Table 5). Only the Indar standard (trt 2) had significantly less brown rotted fruit; it provided 88% control. At 7-DPH, higher brown rot levels allowed for somewhat better treatment mean separations (Table 5). At this time, only two programs, Fracture / Indar / Fracture (trt 5) and Gem / Oso / Oso (trt 11), had brown rot levels not significantly different from the non-treated control. All other treatments showed significant reductions in brown rot, although the levels of control were not high. Numerically, the top four programs (% control) were Indar (74%); Indar / Luna Sensation / Indar (56%); Luna Sensation / Indar / Luna Sensation (53%); and Oso (51%). Other Rots. At harvest no other rots were observed on fruit. At 7-DPH, 3% of non-treated fruit had Rhizopus rot; 0% had anthracnose; and 1% had rot from Phomopsis or Botryosphaeria spp.

63
Table 1. Weather and spray timings for 2015 growing season at the Rutgers Agricultural Research & Extension Center, Bridgeton, NJ. Sprays are indicated by bolded phenological stage. Units for daily average air temperature and rainfall accumulation are ºF and inches.
Date Temp Rain Spray Date Temp Rain Spray Date Temp Rain Spray
1-Apr 42 0 1-May 53 0 1-Jun 70 2.62
2-Apr 49 0 2-May 54 0 2-Jun 55 0.61
3-Apr 59 0.19 3-May 61 0 3-Jun 58 0.01
4-Apr 53 0.01 4-May 67 0 4-Jun 59 0.1
5-Apr 50 0 5-May 70 0.12 Petal Fall 5-Jun 61 0.01
6-Apr 56 0 6-May 67 0.01 6-Jun 68 0.01
7-Apr 57 0.17 7-May 64 0 7-Jun 64 0
8-Apr 41 0.04 8-May 65 0 8-Jun 71 1.18
9-Apr 40 0.01 9-May 68 0 9-Jun 73 0.64
10-Apr 48 0.12 10-May 71 0 10-Jun 71 0 2nd Cover
11-Apr 53 0 11-May 72 0 11-Jun 78 0
12-Apr 49 0 12-May 75 0 12-Jun 82 0
13-Apr 56 0 13-May 63 0 13-Jun 80 0
14-Apr 57 0.21 14-May 58 0 14-Jun 77 0.36
15-Apr 55 0 15-May 60 0 Shuck split
15-Jun 78 0.15
16-Apr 57 0 16-May 70 0 16-Jun 80 0.74
17-Apr 62 0.35 17-May 73 0 17-Jun 72 0
18-Apr 65 0 Pink 18-May 70 0.26 18-Jun 67 0.61
19-Apr 56 0 19-May 68 0.03 19-Jun 75 0.23
20-Apr 63 1.43 20-May 62 0 20-Jun 76 0.4
21-Apr 58 0.18 21-May 51 0.41 21-Jun 77 0.83
22-Apr 57 0 22-May 60 0 22-Jun 79 0
23-Apr 45 0 23-May 58 0 23-Jun 80 0.81
24-Apr 44 0 24-May 64 0 24-Jun 73 0 3rd Cover
25-Apr 43 0 Bloom 25-May 72 0 25-Jun 72 0.06
26-Apr 51 0 26-May 74 0.01 1st Cover 26-Jun 70 0.31
27-Apr 50 0 27-May 75 0.16 27-Jun 65 1.69
28-Apr 56 0 28-May 75 0.27 28-Jun 71 0.06
29-Apr 61 0 29-May 73 0 29-Jun 69 0
30-Apr 56 0.54 30-May 74 0 30-Jun 73 0.27
31-May 77 0

64
Table 1 – continued –
Date Temp Rain Spray Date Temp Rain Spray Date Temp Rain Spray
1-Jul 75 0.03 1-Aug 77 0 1-Sep 79 0
2-Jul 68 0.01 2-Aug 76 0 2-Sep 77 0
3-Jul 70 0 3-Aug 78 0 3-Sep 79 0 1-dph
4-Jul 72 0 4-Aug 81 0.04 6th Cover 4-Sep 75 0.42 Harvest
5-Jul 73 0 5-Aug 76 0.01
6-Jul 76 0 6-Aug 72 0.06
7-Jul 80 0 7-Aug 72 0.02
8-Jul 79 0.55 4th Cover 8-Aug 70 0
9-Jul 77 0.99 9-Aug 70 0
10-Jul 75 0 10-Aug 71 0.04
11-Jul 76 0 11-Aug 72 0.76
12-Jul 75 0 12-Aug 72 0
13-Jul 75 0 13-Aug 70 0
14-Jul 75 3.95 14-Aug 72 0
15-Jul 72 1.00 15-Aug 75 0
16-Jul 70 0 16-Aug 76 0
17-Jul 71 0 17-Aug 78 0 18-dph
18-Jul 78 0 18-Aug 77 0
19-Jul 82 0 19-Aug 79 0
20-Jul 83 0 20-Aug 78 0.08
21-Jul 80 0 21-Aug 77 0.02
22-Jul 74 0 5th Cover 22-Aug 73 0
23-Jul 71 0 23-Aug 69 0
24-Jul 72 0 24-Aug 73 0
25-Jul 74 0 25-Aug 76 0
26-Jul 77 0 26-Aug 69 0 9-dph
27-Jul 76 0.35 27-Aug 67 0
28-Jul 79 0 28-Aug 68 0
29-Jul 79 0 29-Aug 71 0
30-Jul 79 0.27 30-Aug 75 0
31-Jul 77 0 31-Aug 79 0
dph = days pre-harvest

65
Table 2. Blossom Blight Canker Incidence and Severity 1
Treatment
Rate / A
Timing
% Shoots w. Canker 2
# Cankers per Shoot 2
1 Non-treated control -------- -------- 67.5 a 1.36 a
2 Rovral 4F Captan 80WDG Indar 2F + Latron B-1956
1.5 pt 3.125 lb 9 fl oz + 8 fl oz
P, B, PF SS, 1C-6C 18, 9, 1 dph
2.5 f 0.03 e
3 Vangard 75WG Rovral 4F Rally 40WSP Bravo Ultrex 82.5WDG + Rally 40WSP Captan 80WDG + Rally 40WSP Captan 80WDG Gem 500SC Indar 2F + Latron B-1956 Fontelis 1.67SC
5 oz 1.5 pt 5 oz 3.3 lb + 5 oz 3.125 lb + 5 oz 3.125 lb 3.8 fl oz 9 fl oz + 8 fl oz 20 fl oz
P B PF SS 1C, 2C 3C-6C 18 dph 9 dph 1 dph 13.8 cde 0.15 de
4 Rovral 4F Fracture 2.1SC + Latron B-1956 Captan 80WDG Indar 2F + Latron B-1956 Fracture 2.1SC + Latron B-1956
1.5 pt 30.5 fl oz + 8 fl oz 3.125 lb 9 fl oz + 8 fl oz 30.5 fl oz + 8 fl oz
P, PF B SS, 1C-6C 18, 1 dph 9 dph 10.0 de 0.10 de
5 Fracture 2.1SC + Latron B-1956 Rovral 4F Captan 80WDG Fracture 2.1SC + Latron B-1956 Indar 2F + Latron B-1956
30.5 fl oz + 8 fl oz 1.5 pt 3.125 lb 30.5 fl oz + 8 fl oz 9 fl oz + 8 fl oz
P, PF B SS, 1C-6C 18, 1 dph 9 dph 21.3 bcd 0.24 cd
6 Fracture 2.1SC + Latron B-1956 Captan 80WDG Fracture 2.1SC + Latron B-1956
30.5 fl oz + 8 fl oz 3.125 lb 30.5 fl oz + 8 fl oz
P, B, PF SS, 1C-6C 18, 9, 1 dph 33.8 b 0.50 b
7 Luna Sensation 4.2F Rovral 4F Captan 80WDG Luna Sensation 4.2F Indar 2F + Latron B1956
5 fl oz 1.5 pt 3.125 lb 5 fl oz 9 fl oz + 8 fl oz
P, PF B SS, 1C-6C 18, 1 dph 9 dph 3.8 f 0.06 e
8 Rovral 4F Luna Sensation 4.2F Captan 80WDG Indar 2F + Latron B-1956 Luna Sensation 4.2F
1.5 pt 5 fl oz 3.125 lb 9 fl oz + 8 fl oz 5 fl oz
P, PF B SS, 1C-6C 18, 1 dph 9 dph 6.3 ef 0.06 e
9 Fontelis 1.67SC Captan 80WDG Fontelis 1.67SC
20 fl oz 3.125 lb 20 fl oz
P, B, PF SS, 1C-6C 18, 9, 1 dph 11.3 de
0.11 de
10 Oso 0.44SC + Latron B-1956 Captan 80WDG Oso 0.44SC + Latron B-1956
6.5 fl oz + 8 fl oz 3.125 lb 6.5 fl oz + 8 fl oz
P, B, PF, SS-2C 3C-8C 18, 9, 1 dph 8.8 ef 0.11 de
11 Vangard 75WG Rovral 4F Rally 40WSP Bravo Ultrex 82.5WDG + Rally 40WSP Captan 80WDG + Rally 40WSP Captan 80WDG Gem 500SC Oso 0.44SC + Latron B-1956
5 oz 1.5 pt 5 oz 3.3 lb + 5 oz 3.125 lb + 5 oz 3.125 lb 3.8 fl oz 6.5 fl oz + 8 fl oz
P B PF SS 1C, 2C 3C-6C 18 dph 9, 1 dph 25.0 bc 0.31 bc
1 Blossom blight treatments, rates, and application timings in boldface. 2 Means in same column with same letter do not differ significantly according to Waller-Duncan K-ratio t-test (α=0.05, K=100).

66
Table 3. Rusty Spot Incidence and Severity1
Treatment
Rate / A
Timing
% Infected Fruit 3
# Lesions per Fruit 3
1 Non-treated control -------- -------- 11.9 ab 0.14 ab
2 Rovral 4F Captan 80WDG Indar 2F + Latron B-1956
1.5 pt 3.125 lb 9 fl oz + 8 fl oz
P, B, PF SS, 1C, 2C-6C 18, 9, 1 dph 5.6 abc 0.06 abc
3 Vangard 75WG Rovral 4F Rally 40WSP Bravo Ultrex 82.5WDG + Rally 40WSP Captan 80WDG + Rally 40WSP Captan 80WDG Gem 500SC Indar 2F + Latron B-1956 Fontelis 1.67SC
5 oz 1.5 pt 5 oz 3.3 lb + 5 oz 3.125 lb + 5 oz 3.125 lb 3.8 fl oz 9 fl oz + 8 fl oz 20 fl oz
P B PF SS 1C, 2C 3C-6C 18 dph 9 dph 1 dph 3.8 bc 0.04 bc
4 Rovral 4F Fracture 2.1SC + Latron B-1956 Captan 80WDG Indar 2F + Latron B-1956 Fracture 2.1SC + Latron B-1956
1.5 pt 30.5 fl oz + 8 fl oz 3.125 lb 9 fl oz + 8 fl oz 30.5 fl oz + 8 fl oz
P, PF B SS, 1C-6C 18, 1 dph 9 dph 7.5 abc 0.08 abc
5 Fracture 2.1SC + Latron B-1956 Rovral 4F Captan 80WDG Fracture 2.1SC + Latron B-1956 Indar 2F + Latron B-1956
30.5 fl oz + 8 fl oz 1.5 pt 3.125 lb 30.5 fl oz + 8 fl oz 9 fl oz + 8 fl oz
P, PF B SS, 1C-6C 18, 1 dph 9 dph 14.4 a 0.14 a
6 Fracture 2.1SC + Latron B-1956 Captan 80WDG Fracture 2.1SC + Latron B-1956
30.5 fl oz + 8 fl oz 3.125 lb 30.5 fl oz + 8 fl oz
P, B, PF SS, 1C-6C 18, 9, 1 dph 11.9 ab 0.13 ab
7 Luna Sensation 4.2F Rovral 4F Captan 80WDG Luna Sensation 4.2F Indar 2F + Latron B1956
5 fl oz 1.5 pt 3.125 lb 5 fl oz 9 fl oz + 8 fl oz
P, PF B SS, 1C-6C 18, 1 dph 9 dph 6.9 abc 0.08 abc
8 Rovral 4F Luna Sensation 4.2F Captan 80WDG Indar 2F + Latron B-1956 Luna Sensation 4.2F
1.5 pt 5 fl oz 3.125 lb 9 fl oz + 8 fl oz 5 fl oz
P, PF B SS, 1C-6C 18, 1 dph 9 dph 8.1 abc 0.08 abc
9 Fontelis 1.67SC Captan 80WDG Fontelis 1.67SC
20 fl oz 3.125 lb 20 fl oz
P, B, PF SS, 1C-6C 18, 9, 1 dph 6.3 abc 0.07 abc
10 Oso 0.44SC + Latron B-1956 Captan 80WDG Oso 0.44SC + Latron B-1956
6.5 fl oz + 8 fl oz 3.125 lb 6.5 fl oz + 8 fl oz
P, B, PF, SS-2C 3C-8C 18, 9, 1 dph 6.9 abc 0.07 abc
11 Vangard 75WG Rovral 4F Rally 40WSP Bravo Ultrex 82.5WDG + Rally 40WSP Captan 80WDG + Rally 40WSP Captan 80WDG Gem 500SC Oso 0.44SC + Latron B-1956
5 oz 1.5 pt 5 oz 3.3 lb + 5 oz 3.125 lb + 5 oz 3.125 lb 3.8 fl oz 6.5 fl oz + 8 fl oz
P B PF SS 1C, 2C 3C-6C 18 dph 9, 1 dph 1.9 c 0.02 c
1 Rusty spot treatments, rates, and application timings in boldface. 2 Means in same column with same letter do not differ significantly according to Waller-Duncan K-ratio t-test (α=0.05, K=100).

67
Table 4. Scab Incidence and Severity1
Treatment
Rate / A
Timing
% Inf Fruit
% Fruit 1-10 Les 3
% Fruit >10 Les 3
1 Non-treated control -------- -------- 55 a 20 a 35 a
2 Rovral 4F Captan 80WDG Indar 2F + Latron B-1956
1.5 pt 3.125 lb 9 fl oz + 8 fl oz
P, B, PF SS, 1C, 2C-6C 18, 9, 1 dph 21 a 9 a 12 ab
3 Vangard 75WG Rovral 4F Rally 40WSP Bravo Ultrex 82.5WDG + Rally 40WSP Captan 80WDG + Rally 40WSP Captan 80WDG Gem 500SC Indar 2F + Latron B-1956 Fontelis 1.67SC
5 oz 1.5 pt 5 oz 3.3 lb + 5 oz 3.125 lb + 5 oz 3.125 lb 3.8 fl oz 9 fl oz + 8 fl oz 20 fl oz
P B PF SS 1C, 2C 3C-6C 18 dph 9 dph 1 dph 31 a 19 a 12 ab
4 Rovral 4F Fracture 2.1SC + Latron B-1956 Captan 80WDG Indar 2F + Latron B-1956 Fracture 2.1SC + Latron B-1956
1.5 pt 30.5 fl oz + 8 fl oz 3.125 lb 9 fl oz + 8 fl oz 30.5 fl oz + 8 fl oz
P, PF B SS, 1C-6C 18, 1 dph 9 dph 47 a 24 a 23 ab
5 Fracture 2.1SC + Latron B-1956 Rovral 4F Captan 80WDG Fracture 2.1SC + Latron B-1956 Indar 2F + Latron B-1956
30.5 fl oz + 8 fl oz 1.5 pt 3.125 lb 30.5 fl oz + 8 fl oz 9 fl oz + 8 fl oz
P, PF B SS, 1C-6C 18, 1 dph 9 dph 16 a 15 a 1 b
6 Fracture 2.1SC + Latron B-1956 Captan 80WDG Fracture 2.1SC + Latron B-1956
30.5 fl oz + 8 fl oz 3.125 lb 30.5 fl oz + 8 fl oz
P, B, PF SS, 1C-6C 18, 9, 1 dph 22 a 11 a 11 ab
7 Luna Sensation 4.2F Rovral 4F Captan 80WDG Luna Sensation 4.2F Indar 2F + Latron B1956
5 fl oz 1.5 pt 3.125 lb 5 fl oz 9 fl oz + 8 fl oz
P, PF B SS, 1C-6C 18, 1 dph 9 dph 26 a 12 a 14 ab
8 Rovral 4F Luna Sensation 4.2F Captan 80WDG Indar 2F + Latron B-1956 Luna Sensation 4.2F
1.5 pt 5 fl oz 3.125 lb 9 fl oz + 8 fl oz 5 fl oz
P, PF B SS, 1C-6C 18, 1 dph 9 dph 14 a 9 a 5 b
9 Fontelis 1.67SC Captan 80WDG Fontelis 1.67SC
20 fl oz 3.125 lb 20 fl oz
P, B, PF SS, 1C-6C 18, 9, 1 dph 31 a 19 a 12 ab
10 Oso 0.44SC + Latron B-1956 Captan 80WDG Oso 0.44SC + Latron B-1956
6.5 fl oz + 8 fl oz 3.125 lb 6.5 fl oz + 8 fl oz
P, B, PF, SS-2C 3C-8C 18, 9, 1 dph 42 a 20 a 22 ab
11 Vangard 75WG Rovral 4F Rally 40WSP Bravo Ultrex 82.5WDG + Rally 40WSP Captan 80WDG + Rally 40WSP Captan 80WDG Gem 500SC Oso 0.44SC + Latron B-1956
5 oz 1.5 pt 5 oz 3.3 lb + 5 oz 3.125 lb + 5 oz 3.125 lb 3.8 fl oz 6.5 fl oz + 8 fl oz
P B PF SS 1C, 2C 3C-6C 18 dph 9, 1 dph 50 a 24 a 26 ab
1 Scab treatments, rates, and application timings in boldface. 2 Means in same column with same letter do not differ significantly according to Waller-Duncan K-ratio t-test (α=0.05, K=100).

68
Table 5. Brown Rot Harvest and Post-Harvest Incidence 1
% Infected Fruit
Treatment Rate / A Timing Harvest 4-DPH 7-DPH
1 Non-treated control -------- -------- 20.1 a 33 a 57 ab
2 Rovral 4F Captan 80WDG Indar 2F + Latron B-1956
1.5 pt 3.125 lb 9 fl oz + 8 fl oz
P, B, PF SS, 1C, 2C-6C 18, 9, 1 dph 0.0 c 4 b 15 d
3 Vangard 75WG Rovral 4F Rally 40WSP Bravo Ultrex 82.5WDG + Rally 40WSP Captan 80WDG + Rally 40WSP Captan 80WDG Gem 500SC Indar 2F + Latron B-1956 Fontelis 1.67SC
5 oz 1.5 pt 5 oz 3.3 lb + 5 oz 3.125 lb + 5 oz 3.125 lb 3.8 fl oz 9 fl oz + 8 fl oz 20 fl oz
P B PF SS 1C, 2C 3C-6C 18 dph 9 dph 1 dph 1.9 bc 11 ab 35 bcd
4 Rovral 4F Fracture 2.1SC + Latron B-1956 Captan 80WDG Indar 2F + Latron B-1956 Fracture 2.1SC + Latron B-1956
1.5 pt 30.5 fl oz + 8 fl oz 3.125 lb 9 fl oz + 8 fl oz 30.5 fl oz + 8 fl oz
P, PF B SS, 1C-6C 18, 1 dph 9 dph 2.3 bc 16 ab 31 cd
5 Fracture 2.1SC + Latron B-1956 Rovral 4F Captan 80WDG Fracture 2.1SC + Latron B-1956 Indar 2F + Latron B-1956
30.5 fl oz + 8 fl oz 1.5 pt 3.125 lb 30.5 fl oz + 8 fl oz 9 fl oz + 8 fl oz
P, PF B SS, 1C-6C 18, 1 dph 9 dph 4.9 b 24 ab 62 a
6 Fracture 2.1SC + Latron B-1956 Captan 80WDG Fracture 2.1SC + Latron B-1956
30.5 fl oz + 8 fl oz 3.125 lb 30.5 fl oz + 8 fl oz
P, B, PF SS, 1C-6C 18, 9, 1 dph 4.7 bc 13 ab 34 cd
7 Luna Sensation 4.2F Rovral 4F Captan 80WDG Luna Sensation 4.2F Indar 2F + Latron B1956
5 fl oz 1.5 pt 3.125 lb 5 fl oz 9 fl oz + 8 fl oz
P, PF B SS, 1C-6C 18, 1 dph 9 dph 1.8 bc 12 ab 27 cd
8 Rovral 4F Luna Sensation 4.2F Captan 80WDG Indar 2F + Latron B-1956 Luna Sensation 4.2F
1.5 pt 5 fl oz 3.125 lb 9 fl oz + 8 fl oz 5 fl oz
P, PF B SS, 1C-6C 18, 1 dph 9 dph 0.7 bc 7 ab 25 cd
9 Fontelis 1.67SC Captan 80WDG Fontelis 1.67SC
20 fl oz 3.125 lb 20 fl oz
P, B, PF SS, 1C-6C 18, 9, 1 dph 0.7 bc 11 ab 32 cd
10 Oso 0.44SC + Latron B-1956 Captan 80WDG Oso 0.44SC + Latron B-1956
6.5 fl oz + 8 fl oz 3.125 lb 6.5 fl oz + 8 fl oz
P, B, PF, SS-2C3C-8C 18, 9, 1 dph 1.0 bc 14 ab 28 cd
11 Vangard 75WG Rovral 4F Rally 40WSP Bravo Ultrex 82.5WDG + Rally 40WSP Captan 80WDG + Rally 40WSP Captan 80WDG Gem 500SC Oso 0.44SC + Latron B-1956
5 oz 1.5 pt 5 oz 3.3 lb + 5 oz 3.125 lb + 5 oz 3.125 lb 3.8 fl oz 6.5 fl oz + 8 fl oz
P B PF SS 1C, 2C 3C-6C 18 dph 9, 1 dph 3.9 bc 18 ab 47 abc
1 Brown rot treatments, rates, and application timings in boldface; dph = days pre-harvest; DPH = days post-harvest. 2 Means in same column with same letter do not differ significantly according to Waller-Duncan K-ratio t-test (α=0.05, K=100).

69
MANAGEMENT OF PEACH BLOSSOM BLIGHT AND RUSTY SPOT
Norman Lalancette, Lorna Blaus, and Stephanie Rossi Rutgers University, Agricultural Research and Extension Center
Bridgeton, NJ 08302
Since blight-resistant cultivars are not available, peach blossom blight management requires fungicide applications at the pink, full bloom, and petal fall phenological stages. Management of peach rusty spot on susceptible cultivars requires fungicide applications at the petal fall, shuck-split, first cover, and second cover timings. Thus, any fungicide that can control both diseases would be ideal for the petal fall application timing. Given the above overlap in the petal fall timing, the main objective of this study was to identify those fungicides capable of providing effective control of both diseases. A secondary objective was to compare a variety of different fungicide chemistries for their ability to control each disease. Materials examined were Scala (anilinopyrimidine); Gem (QoI); Topsin-M (benzimidazole); Bravo Ultrex (chloronitrile); and Serenade Optimum (biological). In addition, the standard for blossom blight control, Rovral (dicarboximide), and the standard for rusty spot control, Rally (DMI), were also included for comparison. In order to properly determine the ability of each fungicide to control both diseases, each material was applied at all timings (petal fall through second cover). This meant that Rovral and Bravo Ultrex were applied “off label” (beyond petal fall and shuck-split, respectively). Thus, if these blossom blight materials were found to also provide effective control of rusty spot, then there use would be limited to these label restrictions.
MATERIALS AND METHODS
Orchard Site. The experiment was conducted during the spring and summer of the 2015 growing season. The test block consisted of a 20-year-old ‘Autumnglo’ peach orchard on ‘Lovell’ rootstock planted at 25 ft x 25 ft spacing. Treatments. Fungicide treatments were replicated four times in a randomized complete block design with single tree plots. Treatment trees were surrounded on all sides by non-sprayed buffer trees. A Rears Pak-Blast-Plot airblast sprayer calibrated to deliver 100 gal/A at 100 psi traveling at 2.5 mph was used for applications. An early season dormant spray for leaf curl control, typically Ziram, was not applied in 2015. Insecticides and miticides were applied as needed to the entire block using a commercial airblast sprayer. Treatment application dates and phenological timing are shown in Table 1.
Assessment. Blossom blight (Monilinia fructicola) was evaluated on 5-8 Jun by examining 20 shoots per tree. Rusty spot (Podosphaera leucotricha) was evaluated on 26 Jun by examining 40 fruit on each replicate tree. Weather Data. Air temperatures and rainfall data were recorded by a Campbell Scientific 23X data logger located at the research station. This weather station is part of the Mesonet Network operated by the Office of the NJ State Climatologist. Observations

70
were taken every two minutes and summarized every hour. Hourly temperature and rainfall data were averaged and summed, respectively, for each day of the growing season (Table 1). Monthly temperature averages and rainfall accumulations were compared to the 30-year means or sums, respectively, for Bridgeton, NJ.
Statistical Analysis. Analyses of variance (ANOVA) and treatment mean comparisons were performed using the General Linear Models (GLM) procedure of SAS v9.3. The Bayesian Waller-Duncan means test was used to compare treatment means. Arcsin and log transformations were performed as needed for proportions and lesion count data, respectively, to correct for departures from the ANOVA assumptions.
RESULTS AND DISCUSSION
Environment. During the three-month experimental period, air temperatures were near normal in April and June, but 5°F above average for May (67 vs 62°F). Rainfall in April was slightly below normal relative to the 30-year average (3.25” vs 3.58”), while precipitation in May was 2.8” below normal (1.27” vs 4.07”). However, frequent rains in June resulted in a total monthly accumulation that was more than three times the 30-year normal. A total of 11.7” rainfall occurred in June versus the normal 3.37 inches. Precipitation greater than 0.09” was recorded on 16 days – more than half the days in the month (Table 1).
Blossom Blight. Blossom blight disease pressure was very high for the orchard. More than 81% of shoots on non-treated control trees were infected with an average of about 3 cankers per shoot (Table 2). These levels were similar to those observed in 2012 when 81% of shoots were also infected. Temperatures and rainfall during the bloom period were favorable for infection. Significant rainfall occurred after the pink and bloom sprays (Table 1). Most fungicide treatments significantly reduced the incidence and severity of blossom blight canker formation (Table 2). The most effective treatments were Rovral, Scala, and Topsin-M. Under the heavy disease pressure conditions, these fungicides provided 72, 68, and 63% control, respectively. Reductions in cankers per shoot were 91, 89, and 87%, respectively, for these same fungicides. Gem, applied at its highest labeled rate, yielded 51% control and a 79% reduction in cankers per shoot. The rusty spot standard, Rally, was less effective than any of these materials, providing only 31% control. Under the heavy disease pressure of the study, both Bravo Ultrex and Serenade Optimum failed to provide significant control of blossom blight canker incidence. These materials did significantly reduce the number of cankers per shoot, but only by 26 and 38%, respectively. Rusty Spot. Since ‘Autumnglo’ is a highly susceptible cultivar, the incidence of rusty spot observed in 2015 was considered low to moderate, while the severity was deemed low. On average 36.3% of non-treated fruit were infected with only 0.53 lesions per fruit. (Table 3). The low rainfall month of May provided for a good start to the rusty spot epidemic, but the frequent rainfalls in June limited further infection.

71
Although disease pressure levels were at best “moderate” given the susceptibility of the cultivar, the levels obtained were more than adequate for obtaining mean separations in the statistical analyses. The standard Rally and Gem were the most effective, yielding 59 and 57% control, with a reduction of 66 and 64% in numbers of lesions per fruit, respectively. While Gem was applied at its maximum rate, Rally could have been applied up to 6 oz/A, which probably would have improved it efficacy. Generally, 5 to 6 oz/A is recommended for highly susceptible cultivars. None of the remaining fungicides examined in the study were observed to provide effective control of either rusty spot incidence or severity. Blossom Blight and Rusty Spot. Given the above results, none of the fungicide programs provided a high level of control for both diseases. Perhaps this outcome should be expected since powdery mildew fungi (rusty spot) often require different types of fungicide chemistries than fungi such as M. fructicola. The results of this study do not agree with those of a similar study conducted in the same block during 2014. In this prior work, Gem, Topsin-M, and Rovral provided good to excellent control of both blossom blight and rusty spot. However, disease levels for rusty spot were very low (15% infected fruit), and no mean separation was observed among any of the fungicide treatments (although all were less than the NTC). Of all seven materials examined in this study, Gem comes closest to providing simultaneous control of both diseases at petal fall. At this timing Gem also acts as an anti-sporulant for control of peach scab overwintering inoculum. This makes sense in that QoI inhibitors tend to be broad-spectrum. Nevertheless, while Gem effectively controls rusty spot, it is relatively weaker for blossom blight management. Thus, a program with Rovral or Scala at pink and full bloom followed by Gem at petal fall may be acceptable for blocks with low over-wintering inoculum levels of M. fructicola.

72
Table 1. Weather and spray timings for 2015 growing season at the Rutgers Agricultural Research & Extension Center, Bridgeton, NJ. Sprays are indicated by bolded phenological stage. Units for daily average air temperature and rainfall accumulation are ºF and inches.
Date Temp Rain Spray Date Temp Rain Spray Date Temp Rain Spray
1-Apr 42 0 1-May 53 0 1-Jun 70 2.62
2-Apr 49 0 2-May 54 0 2-Jun 55 0.61
3-Apr 59 0.19 3-May 61 0 3-Jun 58 0.01
4-Apr 53 0.01 4-May 67 0 Petal Fall 4-Jun 59 0.1
5-Apr 50 0 5-May 70 0.12 5-Jun 61 0.01
Blossom Blight
Assess
6-Apr 56 0 6-May 67 0.01 6-Jun 68 0.01
7-Apr 57 0.17 7-May 64 0 7-Jun 64 0
8-Apr 41 0.04 8-May 65 0 8-Jun 71 1.18
9-Apr 40 0.01 9-May 68 0 9-Jun 73 0.64
10-Apr 48 0.12 10-May 71 0 10-Jun 71 0 2nd Cover
11-Apr 53 0 11-May 72 0 11-Jun 78 0
12-Apr 49 0 12-May 75 0 12-Jun 82 0
13-Apr 56 0 13-May 63 0 13-Jun 80 0
14-Apr 57 0.21 14-May 58 0 Shuck Split
14-Jun 77 0.36
15-Apr 55 0 15-May 60 0 15-Jun 78 0.15
16-Apr 57 0 16-May 70 0 16-Jun 80 0.74
17-Apr 62 0.35 17-May 73 0 17-Jun 72 0
18-Apr 65 0 Pink 18-May 70 0.26 18-Jun 67 0.61
19-Apr 56 0 19-May 68 0.03 19-Jun 75 0.23
20-Apr 63 1.43 20-May 62 0 20-Jun 76 0.4
21-Apr 58 0.18 21-May 51 0.41 21-Jun 77 0.83
22-Apr 57 0 22-May 60 0 22-Jun 79 0
23-Apr 45 0 23-May 58 0 23-Jun 80 0.81
24-Apr 44 0 24-May 64 0 24-Jun 73 0
25-Apr 43 0 Bloom 25-May 72 0 25-Jun 72 0.06
26-Apr 51 0 26-May 74 0.01 26-Jun 70 0.31 Rusty Spot
Assess
27-Apr 50 0 27-May 75 0.16 27-Jun 65 1.69
28-Apr 56 0 28-May 75 0.27 1st Cover 28-Jun 71 0.06
29-Apr 61 0 29-May 73 0 29-Jun 69 0
30-Apr 56 0.54 30-May 74 0 30-Jun 73 0.27
31-May 77 0

73
Table 2. Blossom Blight Canker Incidence and Severity
Treatment
Rate / A
Timing 1
% Shoots w. Canker 2
# Cankers per Shoot 2
Non-treated control -------- -------- 81.3 a 3.06 a
Rovral 4F 1.5 pt P, B, PF, SS, 1C, 2C 22.5 d 0.28 e
Rally 40WSP 5.0 oz P, B, PF, SS, 1C, 2C 56.3 b 1.05 c
Scala 5SC 14.0 fl oz P, B, PF, SS, 1C, 2C 26.3 d 0.34 e
Gem 500SC 3.8 fl oz P, B, PF, SS, 1C, 2C 40.0 c 0.63 d
Topsin-M 70WP 1.5 lb P, B, PF, SS, 1C, 2C 30.0 cd 0.40 e
Bravo Ultrex 82.5WDG 3.3 lb P, B, PF, SS, 1C, 2C 82.5 a 2.26 b
Serenade Optimum 26.2WP 17.0 oz P, B, PF, SS, 1C, 2C 80.0 a 1.89 b
1 Blossom blight application timings in boldface. 2 Means in the same column with the same letter do not differ significantly according to the Waller-Duncan K-ratio t-test (α=0.05, K=100).
Table 3. Rusty Spot Incidence and Severity1
Treatment
Rate / A
Timing
% Infected Fruit 2
# Lesions /
Fruit 2
Non-treated control -------- -------- 36.3 ab 0.53 a
Rovral 4F 1.5 pt P, B, PF, SS, 1C, 2C 40.6 a 0.54 a
Rally 40WSP 5.0 oz P, B, PF, SS, 1C, 2C 15.0 c 0.18 c
Scala 5SC 14.0 fl oz P, B, PF, SS, 1C, 2C 33.8 ab 0.46 a
Gem 500SC 3.8 fl oz P, B, PF, SS, 1C, 2C 15.6 c 0.19 bc
Topsin-M 70WP 1.5 lb P, B, PF, SS, 1C, 2C 28.1 b 0.38 ab
Bravo Ultrex 82.5WDG 3.3 lb P, B, PF, SS, 1C, 2C 39.4 a 0.46 a
Serenade Optimum 26.2WP 17.0 oz P, B, PF, SS, 1C, 2C 35.0 ab 0.45 a
1 Rusty spot treatment application timings in boldface. 2 Means in the same column with the same letter do not differ significantly according to the Waller-Duncan K-ratio t-test (α=0.05, K=100).
74
EFFICACY AND CROP SAFETY OF KASUGAMYCIN: CONTROL OF BACTERIAL SPOT ON PEACH
Norman Lalancette, Lorna Blaus, and Stephanie Rossi
Rutgers University, Agricultural Research and Extension Center Bridgeton, NJ 08302
Infection of peach fruit by the bacterial spot pathogen Xanthomonas arboricola pv. pruni results in the formation of blackened, pitted lesions on the fruit epidermis. Infections that occur early in growing season result in larger, deeper pitted lesions, while those that occur in mid-to-late summer tend to be more numerous, but shallow. Infection of foliage, results in the formation of angular, black lesions that eventually shot-hole. If a sufficient number of lesions occur, the leaves become chlorotic and abscise. In disease favorable years, significant crop loss and defoliation can occur on susceptible cultivars. The purpose of this study was to examine the ability of the antibiotic kasugamycin, sold as Kasumin 2L, to manage bacterial spot on peach. Since the number of kasugamycin applications will be limited per season, treatments consisted of programs that integrated Kasumin with the registered antibiotic oxytetracycline (Mycoshield, FireLine). Programs that incorporated copper bactericide, such as Kocide, were also examined. In addition to providing full season coverage, the integration of these different bactericides also acts as a resistance management strategy. Finally, a full season program of Kasumin, applied with the non-ionic spreader-activator Regulaid, was included for determining the antibiotic’s lone efficacy.
MATERIALS AND METHODS
Orchard Site. The experiment was conducted in two separate orchards, both located at the Rutgers Agricultural Research and Extension Center, during the spring and summer of the 2015 growing season. The first or main test orchard consisted of highly susceptible O’Henry peach trees on Halford rootstock planted at 25 ft x 25 ft spacing. The second test orchard consisted of moderately susceptible Bounty peach trees on Baily rootstock, also planted at 25 ft x 25 ft spacing. This orchard was added to the study because of low fruit set in the main O’Henry test orchard. Treatments. Bactericide treatments were replicated four times in a randomized complete block design. Due to low fruit set, two trees were used per plot in the O’Henry orchard. Single tree plots were used in the Bounty orchard. Treatment trees were surrounded on all sides by non-sprayed buffer trees. A Rears Pak-Blast-Plot airblast sprayer calibrated to deliver 100 gal/A at 100 psi traveling at 2.5 mph was used for applications. Insecticides and miticides were applied as needed using a commercial airblast sprayer. Except for a leaf curl application on 3 April, consisting of Ziram 76DF at 4 lb/A, no additional fungicides were applied to either orchard during the course of the study. Bactericide treatment application dates and phenological timing are shown in Table 1.
Available water for spraying was acidic (pH=4.8). Thus, an alkaline buffer, potassium carbonate, was used to adjust pH of the water to 7.0 prior to mixing in the

75
bactericides. This pH correction was performed only for those applications that included the copper compound, Kocide 3000.
Assessment. Disease incidence, severity (lesion numbers), and “marketable fruit” assessments were performed on 19 June and 7 August in the Bounty orchard. Lesion counts were only performed for the first assessment. Fruit set was too low in the O’Henry orchard to allow two assessments, so only a single assessment at the end of the study on 7 August was performed in this orchard. A total of 25 fruit were examined per plot during each assessment. For the marketable fruit assessment, fruit were graded based on the size of lesions and the area of fruit surface they covered. Definitions for the grades, which are used commercially by NJ growers, are given in the data table footnotes. Infection of leaves by the bacterial spot pathogen X. arboricola pv. pruni results in the formation of leaf spots, shot-holing, and defoliation. Foliar assessments for all three of these symptoms were performed on 19 June and 3 August in the Bounty orchard and on 25 June and 4 August in the O’Henry orchard. During each assessment, the number of missing leaves and leaves with lesions and shot-holes were counted on each of five vegetative shoots per plot. Results were presented as % leaves infected, % leaves infected and shot-holed, and % leave abscised. An overall shoot rating (OSR) was also performed based on the percentage of leaf area infected and shot-holed. Weather Data. Air temperatures and rainfall data were recorded by a Campbell Scientific 23X data logger located at the research station. This weather station is part of the Mesonet Network operated by the Office of the NJ State Climatologist. Observations were taken every two minutes and summarized every hour. Hourly temperature and rainfall data were averaged and summed, respectively, for each day of the growing season (Table 1). Monthly temperature averages and rainfall accumulations were compared to the 30-year means or sums, respectively, for Bridgeton, NJ. Statistical Analysis. Analyses of variance (ANOVA) and treatment mean comparisons were performed using the General Linear Models (GLM) procedure of SAS v9.4. The Bayesian Waller-Duncan means test was used to compare treatment means. Arcsin and log transformations were performed as needed for proportions and lesion count data, respectively, to correct for departures from the ANOVA assumptions.
RESULTS
Environment. During the four-month experimental period, air temperatures were near normal in April, June, and July but 5°F above average for May (67 vs 62°F). Rainfall in April was slightly below normal relative to the 30-year average (3.25” vs 3.58”), while precipitation in May was 2.8” below normal (1.27” vs 4.07”). However, frequent rains in June resulted in a total monthly accumulation that was more than three times the 30-year normal. A total of 11.7” rainfall occurred in June versus the normal 3.37 inches. Precipitation greater than 0.09” was recorded on 16 days – more than half the days in the month. Rainfall in July was also considerably higher than average, 7.15 inches versus the 30-year normal of 4.30 inches. However, unlike June, this above-average performance was due to a few heavy rains (Table 1).

76
Fruit Infection on Bounty. Disease pressure, particularly severity, on moderately susceptible Bounty fruit was relatively low. At the time of the first assessment in mid-June, 39% of non-treated control fruit were infected, but only 1.7 lesions per fruit were observed (Table 2). At this time, 99% of control fruit were saleable (market grades 1+2). By mid-August, fruit disease incidence for non-treated fruit increased to 56%, but total marketable fruit had only declined to 96% (Table 3). Under these low disease pressure conditions, no bactericide treatment program significantly reduced bacterial spot incidence or severity or significantly increased fruit marketability at either assessment (Tables 2 & 3). Most fruit had only one or two small lesions which increased incidence but were not sufficient to lower fruit quality, and the bactericide programs were not able to eliminate these few infections. Although the bactericide treatments did not significantly reduce disease levels relative to the control, a few differences were observed between bactericide treatments during the first assessment. At this time, the first four applications of Kasumin and Mycoshield in the block programs had been applied and therefore allow for direct comparison of the two antibiotics. Both incidence and severity for Mycoshield treated fruit were significantly less than observed for fruit treated with Kasumin (Table 2). Incidence was 22% lower for the Mycoshield treatment (29% vs 51%) and lesion density was about one-seventh (1.0 vs 7.4 lesions per fruit). Fruit Infection on O’Henry. As expected, disease pressure was considerably higher on highly susceptible O’Henry fruit. At the end of the study, 93% of non-treated fruit were infected with an average 97 lesions per fruit (Table 4). As a result of this greater disease severity, only 58% of control fruit were marketable, with 37% grade 1. Disease incidence and severity levels were generally lower for the full season Kasumin and two block programs relative to the control, but the reductions were not statistically significant (Table 4). Similarly, these three treatments had higher percent of fruit in grade 1 and grades 1+2 compared to the control. For example, the Kasumin / Mycoshield block program yielded 72% marketable fruit, which was 14% higher than the control. However, this and other increases in saleable fruit were not significant. The addition of the copper bactericide Kocide 3000 to the antibiotic programs resulted in significant reductions in disease incidence and severity and significant increases in both grade 1 fruit and total saleable fruit (Table 4). Fruit disease incidence was reduced by 21 to 32% and lesion density by 64 to 71%. Total marketable fruit was 85 to 86%, of which 67 to 70% was grade 1. Of course, these improvements resulted in significant reductions in culled fruit for the two treatments. Foliar Infection on Bounty. At the time of the first assessment in mid-June, which assesses the effect of the first four bactericide applications, 25% of leaves on non-treated shoots were infected and shot-holed with 5.4% defoliation (Table 5). The Kasumin and Mycoshield treatments in the two block programs lowered the level of leaf infection and defoliation, but only two of the six treatment means were significantly less than the control means. In contrast, the two programs that had antibiotic + copper mixtures [for the first four sprays] had significantly higher levels of leaf infection, shot-holing, and defoliation. This increase in shot-holing and defoliation was most likely due to the phytotoxic effect of copper, which has been well documented in past studies.

77
However, the increase in % infected leaves cannot be explained by addition of copper since copper injury and bacterial spot lesions can be readily distinguished on foliage. By early August, 73% of leaves on control trees were infected and shot-holed and 21% had abscised (Table 6). The full season Kasumin program and both block programs did not provide any significant reductions in these two dependent variables. The two copper-containing programs had significantly higher % infected and shot-holed leaves and % defoliation as a result of copper injury. Interestingly, the % infected leaves for these two programs did not increase between the two assessments. This outcome indicates that these programs prevented new bacterial spot leaf infections during the second half of the season. Since the antibiotic-only block programs failed to show a similar response, the prevention of new leaf infections was most likely due to Kocide. Foliar Infection on O’Henry. At the time of the first assessment on 25June, about 40% of leaves on non-treated trees were infected and shot-holed with 11% defoliation (Table 7). By early August, almost 100% of the highly susceptible O’Henry leaves on control trees were infected and shot-holed with 33% defoliation (Table 8). At both assessments, most of the treatment means were not significantly different from the non-treated control means (Tables 7 & 8). That is, the bactericide programs appeared to have little efficacy at controlling foliar infection on highly susceptible O’Henry. However, both programs with copper had significantly less infected leaves than the control, indicating that these programs were having some impact at reducing disease development on foliage. Unfortunately, the shot-holing and leaf drop caused by the copper tended to negate any reductions in disease levels. Phytotoxicity. Foliar injury was observed in late July on trees that had been previously sprayed with Kasumin four to six times. Affected leaves had chlorotic patches that eventually turned brown and necrotic. The dead regions would detach, leaving fairly large holes. Injury was mostly along leaf edges, although patches were also observed near the leaf middles. See photos at end of report. The injury was only seen on older leaves and was not very prominent (a random sample of 10 shoots would probably miss it). The injury was only observed on ‘Bounty’ trees. No symptoms were seen on O’Henry, but these trees had much foliar infection and shot-holing from bacterial spot which may have masked any phytotoxic effect.
CONCLUSION
Antibiotics. The antibiotic treatment programs examined in this study consisted of the two Kasumin / Mycoshield block programs and the Kasumin full season program. On highly susceptible O’Henry peach, none of these programs provided any significant control of disease incidence and severity on fruit or leaf infection and defoliation on shoots. Although these three programs yielded higher levels of marketable fruit in grades 1 and grades 1+2 than the control, none of these increases were significant. For example, the Kasumin full season program yielded 74% marketable fruit versus 58% for the non-treated control. This amount of saleable fruit is “respectable” given the high susceptibility of the cultivar. Nevertheless, under the conditions of the study, this difference was not statistically significant.

78
Two factors are proposed as possible causes for the lack of efficacy by the antibiotics. The treatment protocol for the study stipulated a 7 to 10 day spray interval with a maximum of eight applications per season. Thus, in order to equally cover the infectious period from shuck-split in early May through the end of July, sprays were applied at 10-day intervals. This agrees with the typical summer cover spray interval range of 10 to 14 days. However, this timing is primarily for fungicide applications, which provide reasonably long residual activity. The antibiotic programs would probably have benefited from shorter spray intervals given their shorter residual activity (2-3 days for Mycoshield; Kasumin unknown). But, of course, use of shorter intervals would have required additional applications beyond the protocol’s specification. For example, a 7-day interval would have required 12 applications for the same time period. A second factor that could explain the antibiotic programs’ lack of efficacy was the unusually high amounts of rainfall that occurred, particularly throughout June and the first half of July. During the 32 day period from 2C through 5C (31 May to 2 July), a total of 16 rainfalls ≥ 0.10 in occurred for a total of 11.73 in of rain (Table 0). No doubt that these frequent and heavy rainfalls would have made the short residual activity of Mycoshield, and perhaps Kasumin (?) practically non-existent. And to make matters worse, temperatures during the rainy last three weeks of June and first two weeks of July were quite favorable for bacterial growth (optimum at 75-84°F). Thus, infection periods would have been occurring at a time when antibiotic activity was compromised. The applications probably lowered epiphytic bacterial populations temporarily, but the continuous, favorable conditions allowed rapid population rebounds. No doubt frequent, unusually high rainfalls and long spray intervals were a deadly combination in the 2015 growing season, especially on highly susceptible O’Henry. Further testing is needed to better discern kasugmycin’s efficacy, particularly under more typical rainfall conditions and shorter spray intervals. Copper. Given the inability of the three antibiotic-based programs to significantly reduce bacterial spot on O’Henry under the conditions of the study, one can conclude that the efficacy of the antibiotic + copper programs was primarily due to the activity of the copper component. The fact that both these integrated programs resulted in very similar levels of fruit infection and proportions of marketable fruit was also evidence that the copper bactericide, in this case Kocide 3000, was the efficacious element of the programs. The relatively high rate of Kocide 3000 used in the study may be responsible for the effective fruit disease control on O’Henry, especially with the longer spray interval and considerable amounts of rainfall. The recommended rate for Kocide 3000 30DF, when used for consecutive summer cover sprays on peach, is 1.65 oz per acre. This amount provides 0.5 oz metallic copper per acre (equivalent to the former standard Tenn-Cop 5E at 8 fl oz/A). The rate used in the study, 8 oz/A, is therefore 4.8 times more concentrated. Given the high rate of copper used, the test trees no doubt suffered high levels of defoliation (nearly 50%), but the trade-off was a higher percentage of grade 1 and total saleable fruit. However, had 7-day spray intervals been used and/or more normal levels
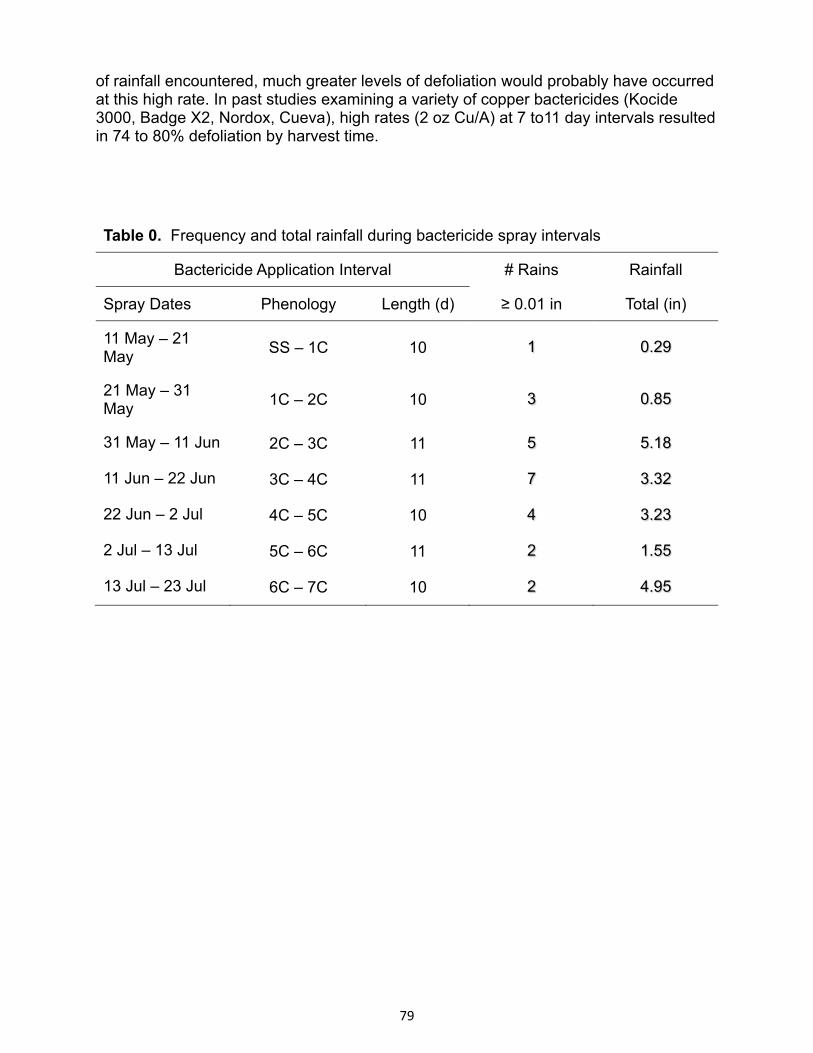
79
of rainfall encountered, much greater levels of defoliation would probably have occurred at this high rate. In past studies examining a variety of copper bactericides (Kocide 3000, Badge X2, Nordox, Cueva), high rates (2 oz Cu/A) at 7 to11 day intervals resulted in 74 to 80% defoliation by harvest time.
Table 0. Frequency and total rainfall during bactericide spray intervals
Bactericide Application Interval # Rains Rainfall
Spray Dates Phenology Length (d) ≥ 0.01 in Total (in)
11 May – 21 May
SS – 1C 10 1 0.29
21 May – 31 May
1C – 2C 10 3 0.85
31 May – 11 Jun 2C – 3C 11 5 5.18
11 Jun – 22 Jun 3C – 4C 11 7 3.32
22 Jun – 2 Jul 4C – 5C 10 4 3.23
2 Jul – 13 Jul 5C – 6C 11 2 1.55
13 Jul – 23 Jul 6C – 7C 10 2 4.95

80
Table 1. Weather and spray timings for 2015 growing season at the Rutgers Agricultural Research & Extension Center, Bridgeton, NJ. Sprays are indicated by bolded phenological stage. Units for daily average air temperature and rainfall accumulation are ºF and inches.
Date Temp Rain Spray Date Temp Rain Spray Date Temp Rain Spray
1-Apr 42 0 1-May 53 0 1-Jun 70 2.62
2-Apr 49 0 2-May 54 0 2-Jun 55 0.61
3-Apr 59 0.19 3-May 61 0 3-Jun 58 0.01
4-Apr 53 0.01 4-May 67 0 4-Jun 59 0.10
5-Apr 50 0 5-May 70 0.12 5-Jun 61 0.01
6-Apr 56 0 6-May 67 0.01 6-Jun 68 0.01
7-Apr 57 0.17 7-May 64 0 7-Jun 64 0
8-Apr 41 0.04 8-May 65 0 8-Jun 71 1.18
9-Apr 40 0.01 9-May 68 0 9-Jun 73 0.64
10-Apr 48 0.12 10-May 71 0 10-Jun 71 0
11-Apr 53 0 11-May 72 0 Shuck split
11-Jun 78 0 3rd Cover
12-Apr 49 0 12-May 75 0 12-Jun 82 0
13-Apr 56 0 13-May 63 0 13-Jun 80 0
14-Apr 57 0.21 14-May 58 0 14-Jun 77 0.36
15-Apr 55 0 15-May 60 0 15-Jun 78 0.15
16-Apr 57 0 16-May 70 0 16-Jun 80 0.74
17-Apr 62 0.35 17-May 73 0 17-Jun 72 0
18-Apr 65 0 18-May 70 0.26 18-Jun 67 0.61
19-Apr 56 0 19-May 68 0.03 19-Jun 75 0.23
20-Apr 63 1.43 20-May 62 0 20-Jun 76 0.40
21-Apr 58 0.18 21-May 51 0.41 1st Cover 21-Jun 77 0.83
22-Apr 57 0 22-May 60 0 22-Jun 79 0 4th Cover
23-Apr 45 0 23-May 58 0 23-Jun 80 0.81
24-Apr 44 0 24-May 64 0 24-Jun 73 0
25-Apr 43 0 25-May 72 0 25-Jun 72 0.06
26-Apr 51 0 26-May 74 0.01 26-Jun 70 0.31
27-Apr 50 0 27-May 75 0.16 27-Jun 65 1.69
28-Apr 56 0 28-May 75 0.27 28-Jun 71 0.06
29-Apr 61 0 29-May 73 0 29-Jun 69 0
30-Apr 56 0.54 30-May 74 0 30-Jun 73 0.27
31-May 77 0 2nd Cover

81
Table 1 – continued –
Date Temp Rain Spray Date Temp Rain Spray Date Temp Rain Spray
1-Jul 75 0.03 1-Aug 77 0
2-Jul 68 0.01 5th Cover 2-Aug 76 0
3-Jul 70 0 3-Aug 78 0 Final Foliage Assess
4-Jul 72 0 4-Aug 81 0.04
5-Jul 73 0 5-Aug 76 0.01
6-Jul 76 0 6-Aug 72 0.06
7-Jul 80 0 7-Aug 72 0.02Final Fruit
Assess
8-Jul 79 0.55 8-Aug 70 0
9-Jul 77 0.99 9-Aug 70 0
10-Jul 75 0 10-Aug 71 0.04
11-Jul 76 0 11-Aug 72 0.76
12-Jul 75 0 12-Aug 72 0
13-Jul 75 0 6th Cover 13-Aug 70 0
14-Jul 75 3.95 14-Aug 72 0
15-Jul 72 1.00 15-Aug 75 0
16-Jul 70 0 16-Aug 76 0
17-Jul 71 0 17-Aug 78 0
18-Jul 78 0 18-Aug 77 0
19-Jul 82 0 19-Aug 79 0
20-Jul 83 0 20-Aug 78 0.08
21-Jul 80 0 21-Aug 77 0.02
22-Jul 74 0 22-Aug 73 0
23-Jul 71 0 7th Cover 23-Aug 69 0
24-Jul 72 0 24-Aug 73 0
25-Jul 74 0 25-Aug 76 0
26-Jul 77 0 26-Aug 69 0
27-Jul 76 0.35 27-Aug 67 0
28-Jul 79 0 28-Aug 68 0
29-Jul 79 0 29-Aug 71 0
30-Jul 79 0.27 30-Aug 75 0
31-Jul 77 0 31-Aug 79 0

82
TABLE 2. Bacterial Spot on Bounty Fruit: Assessment #1 (19 June)
Treatment
Rate / A
Timing
% Infected Fruit2
# Lesions / Fruit2
% Fruit in Category1
Market Grade 12
Market Grades 1+22
Cull2
Non-treated control -------- ------ 39 ab 1.7 ab 93 a 99 a 1 a
Kasumin Full Season
Kasumin 2L3 64 fl oz SS, 1C-7C 49 ab 3.3 ab 90 a 95 a 5 a
Kasumin / Mycoshield Block Programs
Kasumin 2L
Mycoshield 17WP
64 fl oz
12 oz
SS, 1C-3C
4C-7C 51 a 7.4 a 89 a 96 a 4 a
Mycoshield 17WP
Kasumin 2L
12 oz
64 fl oz
SS, 1C-3C
4C-7C 29 b 1.0 b 87 b 95 a 5 a
Antibiotic + Copper Mixture / Alternation Programs
Kasumin 2L + Kocide 3000 30DF4
Mycoshield 17WP
Kocide 3000 30DF4
64 fl oz + 8 oz
12 oz
8 oz
SS, 1C-3C
4C, 6C
5C, 7C 29 b 1.5 ab 96 a 97 a 3 a
Mycoshield 17WP + Kocide 3000 30DF4
Kasumin 2L
Kocide 3000 30DF4
12 oz + 8 oz
64 fl oz
8 oz
SS, 1C-3C
4C, 6C
5C, 7C 36 ab 1.2 b 94 a 100 a 0 a
1 Market grade 1 = total lesion area no larger than 1/8” diameter; Market grade 2 = total lesion area no larger than 3/16” diameter and no single lesion larger than 1/8”; Cull = total lesion area larger than 3/16” and/or single lesion larger than 1/8”.
2 Means in the same column with the same letter do not differ significantly according to the Waller-Duncan K-ratio t-test (α=0.05, K=100).
3 Regulaid added to Kasumin full season treatment at rate of 1 pt / 100 gal.
4 Spray water adjusted to pH=7.0 with potassium carbonate prior to addition of bactericides.
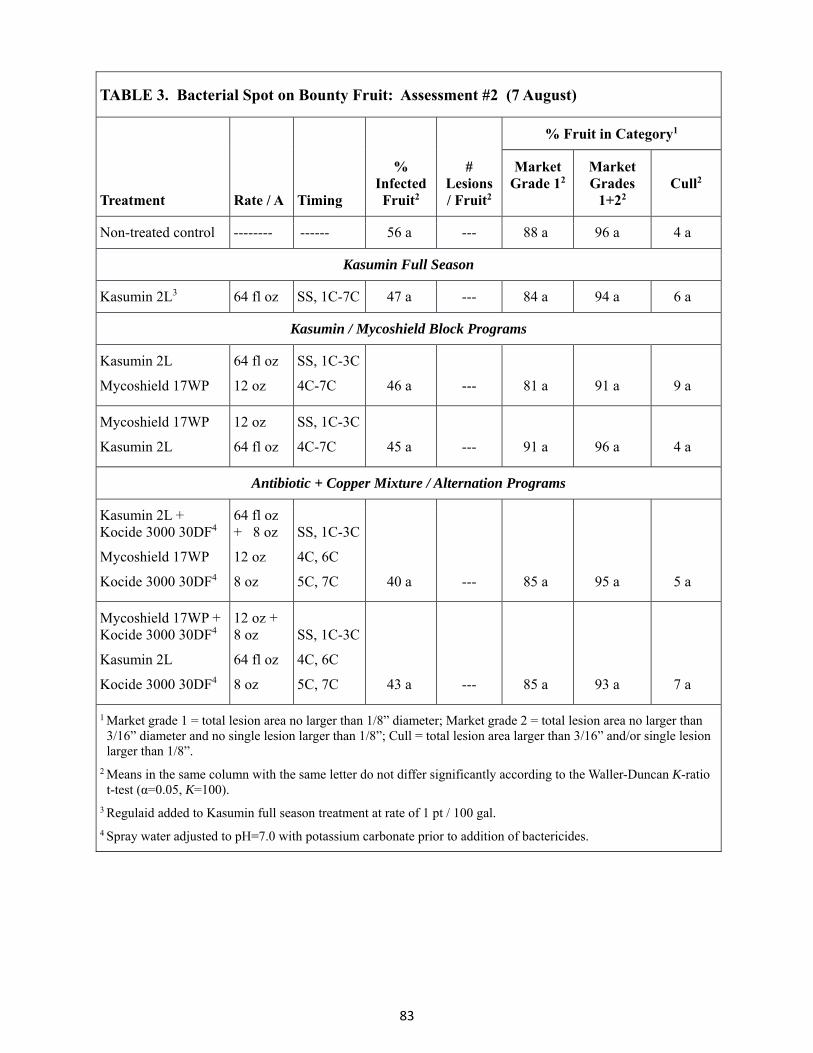
83
TABLE 3. Bacterial Spot on Bounty Fruit: Assessment #2 (7 August)
Treatment
Rate / A
Timing
% Infected Fruit2
# Lesions / Fruit2
% Fruit in Category1
Market Grade 12
Market Grades
1+22
Cull2
Non-treated control -------- ------ 56 a --- 88 a 96 a 4 a
Kasumin Full Season
Kasumin 2L3 64 fl oz SS, 1C-7C 47 a --- 84 a 94 a 6 a
Kasumin / Mycoshield Block Programs
Kasumin 2L
Mycoshield 17WP
64 fl oz
12 oz
SS, 1C-3C
4C-7C 46 a --- 81 a 91 a 9 a
Mycoshield 17WP
Kasumin 2L
12 oz
64 fl oz
SS, 1C-3C
4C-7C 45 a --- 91 a 96 a 4 a
Antibiotic + Copper Mixture / Alternation Programs
Kasumin 2L + Kocide 3000 30DF4
Mycoshield 17WP
Kocide 3000 30DF4
64 fl oz + 8 oz
12 oz
8 oz
SS, 1C-3C
4C, 6C
5C, 7C 40 a --- 85 a 95 a 5 a
Mycoshield 17WP + Kocide 3000 30DF4
Kasumin 2L
Kocide 3000 30DF4
12 oz + 8 oz
64 fl oz
8 oz
SS, 1C-3C
4C, 6C
5C, 7C 43 a --- 85 a 93 a 7 a
1 Market grade 1 = total lesion area no larger than 1/8” diameter; Market grade 2 = total lesion area no larger than 3/16” diameter and no single lesion larger than 1/8”; Cull = total lesion area larger than 3/16” and/or single lesion larger than 1/8”.
2 Means in the same column with the same letter do not differ significantly according to the Waller-Duncan K-ratio t-test (α=0.05, K=100).
3 Regulaid added to Kasumin full season treatment at rate of 1 pt / 100 gal.
4 Spray water adjusted to pH=7.0 with potassium carbonate prior to addition of bactericides.

84
TABLE 4. Bacterial Spot on O’Henry Fruit (7 August)
Treatment
Rate / A
Timing
% Infected Fruit2
# Lesions /
Fruit2
% Fruit in Category1
Market Grade 12
Market Grades
1+22
Cull 2
Non-treated control -------- ------ 93 a 96.8 a 37 c 58 b 42 a
Kasumin Full Season
Kasumin 2L3 64 fl oz SS, 1C-7C 87 ab 64.4 a 45 c 74 ab 26 ab
Kasumin / Mycoshield Block Programs
Kasumin 2L
Mycoshield 17WP
64 fl oz
12 oz
SS, 1C-3C
4C-7C 90 a 86.0 a 50 abc 72 ab 28 ab
Mycoshield 17WP
Kasumin 2L
12 oz
64 fl oz
SS, 1C-3C
4C-7C 87 ab 101.4 a 46 bc 64 b 36 a
Antibiotic + Copper Mixture / Alternation Programs
Kasumin 2L + Kocide 3000 30DF4
Mycoshield 17WP
Kocide 3000 30DF4
64 fl oz + 8 oz
12 oz
8 oz
SS, 1C-3C
4C, 6C
5C, 7C 72 bc 28.2 b 67 ab 85 a 15 b
Mycoshield 17WP + Kocide 3000 30DF4
Kasumin 2L
Kocide 3000 30DF4
12 oz + 8 oz
64 fl oz
8 oz
SS, 1C-3C
4C, 6C
5C, 7C 61 c 34.4 b 70 a 86 a 14 b
1 Market grade 1 = total lesion area no larger than 1/8” diameter; Market grade 2 = total lesion area no larger than 3/16” diameter and no single lesion larger than 1/8”; Cull = total lesion area larger than 3/16” and/or single lesion larger than 1/8”.
2 Means in the same column with the same letter do not differ significantly according to the Waller-Duncan K-ratio t-test (α=0.05, K=100).
3 Regulaid added to Kasumin full season treatment at rate of 1 pt / 100 gal.
4 Spray water adjusted to pH=7.0 with potassium carbonate prior to addition of bactericides.

85
TABLE 5. Bacterial Spot on Bounty Foliage: Assessment #1 (19 June)
Treatment
Rate / A
Timing
% Infected Leaves1, 2
% Infected & Shot-holed
Leaves1, 2
% Abscised Leaves2
Overall Shoot
Rating2, 3
Non-treated control -------- ------ 25.0 bc 25.3 bc 5.4 b 3.0 bc
Kasumin Full Season
Kasumin 2L4 64 fl oz SS, 1C-7C 33.5 b 36.0 b 0.0 c 3.6 b
Kasumin / Mycoshield Block Programs
Kasumin 2L
Mycoshield 17WP
64 fl oz
12 oz
SS, 1C-3C
4C-7C 16.2 cd 16.6 c 0.4 c 2.4 c
Mycoshield 17WP
Kasumin 2L
12 oz
64 fl oz
SS, 1C-3C
4C-7C 10.0 d 11.6 c 1.3 bc 2.0 c
Antibiotic + Copper Mixture / Alternation Programs
Kasumin 2L + Kocide 3000 30DF5
Mycoshield 17WP
Kocide 3000 30DF5
64 fl oz + 8 oz
12 oz
8 oz
SS, 1C-3C
4C, 6C
5C, 7C 58.2 a 71.4 a 27.4 a 5.0 a
Mycoshield 17WP + Kocide 3000 30DF5
Kasumin 2L
Kocide 3000 30DF5
12 oz + 8 oz
64 fl oz
8 oz
SS, 1C-3C
4C, 6C
5C, 7C 54.7 a 67.2 a 27.0 a 4.9 a
1 Infected leaves = leaves with at least one lesion (can have shot-holes); Infected & Shot-holed = infected leaves + leaves with only shot-holes.
2 Means in the same column with the same letter do not differ significantly according to the Waller-Duncan K-ratio t-test (α=0.05, K=100).
3 Overall shoot rating (OSR) = % leaf area infected or shot-holed (1=0%; 2=1-15%; 3=15-25%; 4=25-45%; 5>= 45%)
4 Regulaid added to Kasumin full season treatment at rate of 1 pt / 100 gal.
5 Spray water adjusted to pH=7.0 with potassium carbonate prior to addition of bactericides.

86
TABLE 6. Bacterial Spot on Bounty Foliage: Assessment #2 (3 August)
Treatment
Rate / A
Timing
% Infected Leaves1, 2
% Infected & Shot-holed
Leaves1, 2
% Abscised Leaves2
Overall Shoot
Rating2, 3
Non-treated control -------- ------ 70.7 a 72.8 c 20.8 b 3.9 b
Kasumin Full Season
Kasumin 2L4 64 fl oz SS, 1C-7C 77.7 a 89.7 abc 25.5 b 4.8 ab
Kasumin / Mycoshield Block Programs
Kasumin 2L
Mycoshield 17WP
64 fl oz
12 oz
SS, 1C-3C
4C-7C 67.1 a 74.4 c 24.8 b 3.7 b
Mycoshield 17WP
Kasumin 2L
12 oz
64 fl oz
SS, 1C-3C
4C-7C 70.6 a 81.1 bc 20.7 b 4.1 ab
Antibiotic + Copper Mixture / Alternation Programs
Kasumin 2L + Kocide 3000 30DF5
Mycoshield 17WP
Kocide 3000 30DF5
64 fl oz + 8 oz
12 oz
8 oz
SS, 1C-3C
4C, 6C
5C, 7C 58.8 a 100.0a 48.1 a 5.0 a
Mycoshield 17WP + Kocide 3000 30DF5
Kasumin 2L
Kocide 3000 30DF5
12 oz + 8 oz
64 fl oz
8 oz
SS, 1C-3C
4C, 6C
5C, 7C 57.4 a 95.9 ab 50.3 a 5.0 a
1 Infected leaves = leaves with at least one lesion (can have shot-holes); Infected & Shot-holed = infected leaves + leaves with only shot-holes.
2 Means in the same column with the same letter do not differ significantly according to the Waller-Duncan K-ratio t-test (α=0.05, K=100).
3 Overall shoot rating (OSR) = % leaf area infected or shot-holed (1=0%; 2=1-15%; 3=15-25%; 4=25-45%; 5>= 45%)
4 Regulaid added to Kasumin full season treatment at rate of 1 pt / 100 gal.
5 Spray water adjusted to pH=7.0 with potassium carbonate prior to addition of bactericides.

87
TABLE 7. Bacterial Spot on O’Henry Foliage: Assessment #1 (25 June)
Treatment
Rate / A
Timing
% Infected Leaves1, 2
% Infected & Shot-holed
Leaves1, 2
% Abscised Leaves2
Overall Shoot
Rating2, 3
Non-treated control -------- ------ 39.9 a 39.9 a 11.1 bc 3.5 ab
Kasumin Full Season
Kasumin 2L4 64 fl oz SS, 1C-7C 45.2 a 48.0 a 9.0 c 4.2 ab
Kasumin / Mycoshield Block Programs
Kasumin 2L
Mycoshield 17WP
64 fl oz
12 oz
SS, 1C-3C
4C-7C 30.9 a 36.3 a 5.9 c 3.8 ab
Mycoshield 17WP
Kasumin 2L
12 oz
64 fl oz
SS, 1C-3C
4C-7C 32.7 a 32.7 a 3.9 c 3.4 b
Antibiotic + Copper Mixture / Alternation Programs
Kasumin 2L + Kocide 3000 30DF5
Mycoshield 17WP
Kocide 3000 30DF5
64 fl oz + 8 oz
12 oz
8 oz
SS, 1C-3C
4C, 6C
5C, 7C 34.9 a 48.7 a 23.8 a 4.5 a
Mycoshield 17WP + Kocide 3000 30DF5
Kasumin 2L
Kocide 3000 30DF5
12 oz + 8 oz
64 fl oz
8 oz
SS, 1C-3C
4C, 6C
5C, 7C 42.1 a 54.0 a 17.7 ab 4.5 a
1 Infected leaves = leaves with at least one lesion (can have shot-holes); Infected & Shot-holed = infected leaves + leaves with only shot-holes.
2 Means in the same column with the same letter do not differ significantly according to the Waller-Duncan K-ratio t-test (α=0.05, K=100).
3 Overall shoot rating (OSR) = % leaf area infected or shot-holed (1=0%; 2=1-15%; 3=15-25%; 4=25-45%; 5>= 45%)
4 Regulaid added to Kasumin full season treatment at rate of 1 pt / 100 gal.
5 Spray water adjusted to pH=7.0 with potassium carbonate prior to addition of bactericides.

88
TABLE 8. Bacterial Spot on O’Henry Foliage: Assessment #2 (4 August)
Treatment
Rate / A
Timing
% Infected Leaves1, 2
% Infected & Shot-holed
Leaves1, 2
% Abscised Leaves2
Overall Shoot
Rating2, 3
Non-treated control -------- ------ 93.3 a 99.7 a 32.8 bc 3.8 b
Kasumin Full Season
Kasumin 2L4 64 fl oz SS, 1C-7C 91.3 a 100.0 a 49.6 a 3.6 b
Kasumin / Mycoshield Block Programs
Kasumin 2L
Mycoshield 17WP
64 fl oz
12 oz
SS, 1C-3C
4C-7C 89.2 a 97.1 a 22.9 c 3.8 b
Mycoshield 17WP
Kasumin 2L
12 oz
64 fl oz
SS, 1C-3C
4C-7C 91.5 a 96.5 a 37.7 abc 3.4 b
Antibiotic + Copper Mixture / Alternation Programs
Kasumin 2L + Kocide 3000 30DF5
Mycoshield 17WP
Kocide 3000 30DF5
64 fl oz + 8 oz
12 oz
8 oz
SS, 1C-3C
4C, 6C
5C, 7C 72.3 b 97.2 a 44.4 ab 4.6 a
Mycoshield 17WP + Kocide 3000 30DF5
Kasumin 2L
Kocide 3000 30DF5
12 oz + 8 oz
64 fl oz
8 oz
SS, 1C-3C
4C, 6C
5C, 7C 65.8 b 96.7 a 51.4 a 4.7 a
1 Infected leaves = leaves with at least one lesion (can have shot-holes); Infected & Shot-holed = infected leaves + leaves with only shot-holes.
2 Means in the same column with the same letter do not differ significantly according to the Waller-Duncan K-ratio t-test (α=0.05, K=100).
3 Overall shoot rating (OSR) = % leaf area infected or shot-holed (1=0%; 2=1-15%; 3=15-25%; 4=25-45%; 5>= 45%)
4 Regulaid added to Kasumin full season treatment at rate of 1 pt / 100 gal.
5 Spray water adjusted to pH=7.0 with potassium carbonate prior to addition of bactericides.

89
Possible Kasumin Injury on ‘Bounty’ Peach Leaves

90
Not for Citation or Publication Without Consent of the Author
2015 EVALUATION OF PROGRAMS TO MANAGE BACTERIAL SPOT AND BROWN
ROT ON PEACH IN PENNSYLVANIA
Kari. A. Peter, Brian L. Lehman, and Carl E. Bower Penn State University, Fruit Research & Extension Center,
Biglerville, PA 17307
Bacterial spot management evaluation Programs to control bacterial spot were evaluated in the 2006 Peach and Nectarine Orchard
located at the Penn State Fruit Research and Extension. The spray programs conducted in the Peach and Nectarine Orchard were evaluated in 4 cultivar plots, which included ‘Eastern Glo,’ ‘Beekman,’ ‘Snow King,’ and ‘Sweet Dream’ with ‘Red Haven’ as guard trees in between treatment plots. Treatments were arranged in a randomized complete block with 4 replications. Treatments were applied using a boom sprayer at 400 psi, delivering 100 gal/A. Application timings were as follows: Petal fall/Shuck split (PF/SS; 4 May); 1st Cover (1C; 14 May); 2nd Cover (2C; 26 May); 3rd Cover (3C; 10 June); 4th Cover (4C; 23 June); 5th Cover (5C; 2 July); 6th Cover (6C; 17 July); 7th Cover (7C; 29 July). Standard insecticide and fungicide maintenance programs were applied to the entire orchard with an airblast or boom sprayer delivering 100 gal/A at 400 psi. Weather data was recorded with a Decagon weather monitoring system. Rainfall totals for April, May, June, July, and August were 4.12, 2.94, 13.54, 3.0, and 7.12 inches, respectively. Disease pressure was very light early in the season and disease assessment occurred late July for disease and/or injury incidence. On July 20, 2015, 10 shoots per treatment/tree/rep were evaluated for missing leaves and each tree was assessed an overall defoliation % using a rating scale: 1: 0%; 2: 1-15%; 3: 15 – 25%; 4: 25 – 45%; 5: 45 – 100%. At the end of the season, 25 fruit per treatment/tree/rep (100 in total/treatment) for the % area of the fruit infected with bacterial spot using the following rating scale: 0: 0%; 1: 1-3%; 2: 4-8%; 3: 9-15%; 4: 15-25%; 5: 25-45%; 6: >45%. The scale used for both was converted and mean % area covered shown. ‘Eastern Glo,’ ‘Beekman,’ and ‘Sweet Dream’ performed similarly and their data were combined (Table 1). The ‘Snow King’ data was not included due few fruit being produced on this variety this year. Data was analyzed using analysis of variance and the Fisher’s Protected LSD Test used to determine the mean separation. Bacterial spot is a difficult disease to control when conditions are optimal. For the 2015 season, disease pressure was not high until approximately mid to late June. Early observations of disease did not occur until this time – this is contrast to 2014 where there were excellent conditions for bacterial spot early in the season (May) resulting in high disease pressure throughout the entire season. Typical control for bacterial spot is the use of the antibiotic oxytetracycline and copper from the appearance of the first green tissue. Oxytetracycline suppresses the bacteria and does not kill is, as well as only persists for approximately 48 hrs after application; copper is phytotoxic to peach/nectarine tree leaves, but the fruit are typically resistant to copper damage. When conditions are favorable, growers typically spray for disease control every 7-10 days. This year, we evaluated Cueva and Kocide separately and in combination with Double Nickel and Serenade Optimum to assess disease control and the phytotoxicity of different coppers. In addition, lime was added in rotation with Kocide. Lime is typically added to bluestone copper in the case of Bordeaux mixture. Lime has bactericide properties, so the question was asked whether or not lime by itself could provide control for bacterial spot. Disease control on fruit (Table 1): All copper treatments (with one exception) had less disease incidence compared to the untreated check and oxytetracycline treatment (Treatment 2, FireLine). For the Kocide - Lime rotation treatment, disease incidence was similar to the untreated check; however, the % area of the fruit infected was significantly less than the untreated and oxytetracycline treatment. To really determine the effect of the lime as a control, a Kocide treatment where it was sprayed every other time alone would be the proper control to use to evaluate the bacterial spot control property of lime. All

91
copper treatments (Treatments 3 – 9) were similar with regard to the % area infected – all had significantly less area of the fruit infected with bacterial spot compared to the untreated and oxytetracycline treatments. The addition of Double Nickel or Serenade Optimum did not appear to increase efficacy of control. Leaf defoliation (Table 1): It is typically hard to discern the difference between bacterial spot disease and copper injury; often times, both will be on the same leaf. The leaf defoliation data is more to assess the severity of the copper phytotoxicity as opposed to disease control. As far as leaf defoliation to the tree caused by copper phytotoxicity, the Cueva treatments had significantly greater percentage of the tree affected by defoliation compared to the Kocide, untreated check, and oxytetracycline treatments. Copper is more phytotoxic in acidic solutions and the difference in phytoxocity may be due to the pH of Cueva and Kocide: at the rates evaluated, Cueva is slightly more acidic (pH 5.52) than Kocide (pH 6.52). The addition of Double Nickel or Serenade Optimum did not appear to abate the phytotoxic effect of the copper, nor did they affect the pH of the copper-biocide solution. Brown rot management evaluation Fungicide programs were evaluated to manage late season brown rot infection on peach. Twenty-year old ‘Loring’ peach trees were used for the trial. Treatments were arranged in a randomized complete block with 4 replications as single tree treatments. Treatments were applied using a boom sprayer at 400 psi, delivering 100 gal/A at a 10 -14 day interval, with the exception of the last three treatments; the application timing was as follows: 10% Bloom (10% B; 20 April); Bloom (B; 25 April); Petal Fall (PF; 30 April); Shuck Split (SS; 8 May); 1st Cover (1C; 19 May); 2nd Cover (2C; 28 May); 3rd Cover (3C; 16 June); 4th Cover (4C; 30 June); 5th Cover (5C; 15 July); 18 days preharvest (18 dPH; 28 July); 9 days preharvest (9 d PH; 6 August); 1 day preharvest (8C; 19 August). Standard insecticide management program was applied to the treatments with an airblast or boom sprayer delivering 100 gal/A at 400 psi. For the evaluation, fruit were harvested on 14 August with 25 fruit collected per treatment per rep (total evaluated: 100 fruit per treatment). The weather was warm and relatively dry during the 18 day period prior to harvest; only 0.56 inches of rain fell during that time period. Clean fruit were harvested and fruit were kept at room temperature (~72°F) for 7 days. Fruit were evaluated 3 days postharvest, 5 days postharvest, and 7 days postharvest. At 3 and 5 days postharvest, rotting fruit were discarded, with only uninfected fruit remaining at those time points (i.e., 100 fruit were at 3 day postharvest; however, less fruit were remaining to evaluate at 5 day and 7 day). Overall is the number of brown rot detected in total after 7 days postharvest. Data was analyzed using analysis of variance and the Fisher’s Protected LSD Test used to determine the mean separation. Controlling brown rot (Table 2): Brown rot is a difficult disease to control and fungicide resistance wreaks havoc, particularly for the SI and QoI fungicides. Unfortunately, all programs performed similarly and were not statistically different than the untreated check. Indar was used at the 9 fl oz/A rate; however, it can be used at 12 oz/A rate on peaches and nectarines, which might have helped brown rot control if used at that rate for this study. Fracture, which is a product derived from germinating sweet lupine plants, may have the potential to be used in a resistance management program, but should be evaluated using chemicals at the highest labeled rate (Treatment 3). Cueva by itself and Cueva + Double Nickel do not appear to offer brown rot management (Treatments 4 and 5). In this research block, QoI and SI resistance may also be contributing to poor brown rot management (Treatments 2 and 6).

92
Table 1. 2015 Evaluation of copper and antibiotic treatments to control bacterial spot on peach cultivars ‘Eastern Glo,’ ‘Beekman,’ ‘Sweet Dream’
Leaves - defoliation Fruit
Treatment & Rate/A Timing1 # Missing % tree %
incidence % area infected
1 Untreated -- 14.3 d2 13.9 c 91.7 ab 5.1 b 2 FireLine 1. 5 lb PF/SS – 7C 9.7 e 10.8 c 92.3 ab 6.5 a 3 Cueva 2 qt + Double Nickel 1 qt PF/SS – 7C 21.2 bc 41.0 a 88.0 bc 4.1 c 4 Cueva 2 qt PF/SS – 7C 26.4 a 28.9 b 85.0 cd 3.3 c 5 Kocide 0.5 lb
Kocide 0.2 lb PF/SS – 2C 3C – 7C
21.4 bc 27.7 c 82.4 d 3.8 c
6 Kocide 0.5 lb + Serenade Optimum 14 oz Kocide 0.2 lb + Serenade Optimum 14 oz
PF/SS – 2C 3C – 7C
18.7 c 17.9 c 85.3 cd 3.6 c
7 Cueva 2 qt + Serenade Optimum 14 oz PF/SS – 7C 29.2 a 33.8 ab 88.0 bc 3.4 c 8 Kocide 0.5 lb + Double Nickel 1 qt
Kocide 0.2 lb + Double Nickel 1 qt PF/SS – 2C 3C – 7C
22.5 b 18.8 c 87.7 bc 4.0 c
9 Kocide 0.5 lb Kocice 0.2 lb Hydrated lime 2.0 lb
PF/SS, 2C 4C, 6C 1C, 3C, 5C, 7C
15.2 d 12.7 c 98.9 a 4.0 c
1Application timings were as follows: Petal fall/Shuck split (PF/SS; 4 May); 1st Cover (1C; 14 May); 2nd Cover (2C; 26 May); 3rd Cover (3C; 10 June); 4th Cover (4C; 23 June); 5th Cover (5C; 2 July); 6th Cover (6C; 17 July); 7th Cover (7C; 29 July)
2Values within columns follow by the same letter(s) are not significantly different (P ≤ 0.05) according to Fisher's Protected LSD test.
Table 2. 2015 Evaluation of fungicide treatments to control peach brown rot on ‘Loring’
% Incidence of brown rot Treatment & Rate/A Timing1 3 d 5 d 7 d Overall 1 Untreated -- 19 a2 18.7 a 25.3 a 47 a 2 Rovral 4F 1.5 pt
Captan 3 lb Indar 9 fl oz + LI 700 1 qt
10% B, B, PF SS – 5C 18 d PH, 9 d PH, 1 d PH
17 a 24.9 a 20.6 a 47 a
3 Rovral 4F 1.5 pt Captan 3 lb Indar 9 fl oz + LI 700 1 qt Fracture 24.4 oz + LI 700 1 qt
10% B, B, PF SS – 5C 18 d PH, 1 d PH 9 d PH
7 a 10.6 a 13.0 a 28 a
4 Cueva 2 qt + Double Nickel 1 qt Captan 3 lb Cueva 2 qt + Double Nickel 1 qt
10% B, B, PF SS – 5C 18 d PH, 9 d PH, 1 d PH
25 a 24.8 a 19.9 a 51 a
5 Cueva 2 qt Captan 3 lb Cueva 2qt
10% B, B, PF SS – 5C 18 d PH, 9 d PH, 1 d PH
14 a 30.5 a 19.7 a 50 a
6 Rovral 4F 1.5 pt Captan 3 lb Gem 3.8 fl oz Indar 9 fl oz + LI 700 1 qt Merivon 6.7 fl oz
10% B, B, PF SS – 5C 18 d PH 9 d PH 1 d PH
19 a 15.3 a 11.3 a 41 a
1Application timing was as follows: 10% Bloom (10% B; 20 April); Bloom (B; 25 April); Petal Fall (PF; 30 April); Shuck Split (SS; 8 May); 1st Cover (1C; 19 May); 2nd Cover (2C; 28 May); 3rd Cover (3C; 16 June); 4th Cover (4C; 30 June); 5th Cover (5C; 15 July); 18 days preharvest (18 dPH; 28 July); 9 days preharvest (9 d PH; 6 August); 1 day preharvest (8C; 19 August).
2Values within columns follow by the same letter(s) are not significantly different (P ≤ 0.05) according to Fisher's Protected LSD test.

93
Acknowledgements: We are grateful for the support from Agrosource, Certis, Bayer CropScience, and FMC. Thanks to Bashar Jarjour for treatment applications; Sarah Bardsley, Josh Hersl, Drew May, Katie Shoemaker, and Johannah Williams for assisting with data collection; and to Milton Loyer for assistance with data analysis.

94
Not for Citation or Publication Without Consent of the Author
2015 EVALUATION OF REGISTERED AND UNREGISTERED FUNGICIDES TO
MANAGE APPLE DISEASES IN PENNSYLVANIA
Kari. A. Peter, Brian L. Lehman, and Carl E. Bower Penn State University, Fruit Research & Extension Center,
Biglerville, PA 17307 Fungicide programs including registered and unregistered products were evaluated to control early summer diseases (apple scab, Venturia inaequalis), as well as summer diseases (flyspeck, Zygophiala jamaicensis; sooty blotch, Diplocarpon mali; and fruit rots, such as black rot, Botrysphaeria obtuse; white rot, B. dothidea; and bitter rot, Colletotrichum gloeosporioides). The efficacy trials were conducted in the 5-Culitvar (5C) orchard at the Penn State Fruit Research and Extension Center, which is arranged with 5 tree plots planted with ‘Rome Beauty’, ‘Golden Delicious’, ‘Stayman’, ‘Cortland’, and ‘Red Delicious’. Treatments were arranged in a randomized complete block with 4 replications. Only ‘Rome Beauty’, ‘Golden Delicious’, and ‘Red Delicious’ were evaluated since ‘Cortland’ and ‘Stayman’ trees were missing in several replicates. Treatments were applied using a boom sprayer at 400 psi, delivering 100 gal/A. Treatment applications were made on 8 – 15 day intervals for early diseases; 10 -14 day intervals for summer diseases starting at tight cluster on 21 April through eighth cover on 2 September. A standard insecticide maintenance program was applied to the entire orchard with an airblast or boom sprayer delivering 100 gal/A at 400 psi. Weather data was recorded with a Decagon weather monitoring system and apple scab infection periods were monitored using the Modified Mills table. Rainfall totals for April, May, June, July, and August were 4.12, 2.94, 13.54, 3.0, and 7.12 inches, respectively. For each treatment, incidence of apple scab on leaves was determined by randomly selecting 10 shoots per tree per replication, counting all of the leaves per shoot and recording the number of leaves exhibiting disease at the end of July. To evaluate fruit disease incidence (scab, sooty blotch, flyspeck, and general rots), 25 fruit per tree/treatment/replicate (total: 100 fruit/treatment) were evaluated. In addition, fruit russet was also evaluated using a scale rating: 0 to 5, with 0 as clean and 5 as severe russet. Mean percent disease incidence and russet severity were calculated; data was analyzed using analysis of variance and the Fisher’s Protected LSD Test determined the mean separation.
This was a relatively light scab year, due to the dry May we experienced. Primary apple scab infection took place from 8 April until 15 June and, although scab infection periods occurred, we did not have days of prolonged leaf wetness like we did during 2014. Consequently, the leaf and fruit infections were relatively light (Table 1). For the most part, all test treatments performed similarly for disease control on leaves, with some exceptions. Treatment 3 was considered our standard treatment seasonal program. Treatments 3 (standard program using manzate, captan, and sulfur during the early season), 8 (ISK unregistered product IKF-54111), and 10 (Luna Sensation rotated with Topguard early) had a higher incidence of scab on leaves. The highest performing treatments with the lowest incidence statistically of leaf scab were Treatments 5 and 6 (Kenja with and without manzate); Treatments 13 – 16 (GWN-10411 at different rates); Treatment 18 and 19 (Merivon); Treatment 20 (Vangard, manzate + captan, and Inspire Super). The other remaining treatments fell in the middle of the highest and lowest incidence; however, fruit scab incidence was 0 – 1% among all treatments (except the untreated check) and not statistically different from one another.
Where conditions lacked for early summer diseases, we made up for during the summer. We had very wet conditions from mid-June through early August, then again late August through early September. These conditions were very favorable for sooty blotch, flyspeck, and

95
rots. Across cultivars, the majority of the treatments performed better than the untreated checks (Treatments 1, 2) for managing summer diseases (Table 1). The exceptions were Treatments 12 – 16 (GWN 104011 at different rates + Induce)—this product does not appear to have adequate control for managing summer diseases (also includes rots) and would be best used for early summer disease control. Red Delicious was the cultivar most sensitive to rots. On the untreated check, early rot incidence was observed as early as late July. As far as efficacy, the majority of the treatments were not statistically different from each other, despite the incidence ranging from 8 – 47%. Another observation is the product Oso (Treatment 20), which was used in 5 out of the 7 summer cover sprays, seems to do well controlling sooty blotch and flyspeck; however, a little weaker for rots.
Golden Delicious is most susceptible to russetting and this year several treatments had adverse effects on fruit finish. To some degree, all treatments, including the untreated check, had recordable russetting; however, the untreated check and Treatment 3 performed the best with regard to minimal russetting. Treatments 2, 4, 9 – 11, and 20 performed similar to the untreated; Treatments 5, 6, 12, 17 – 19 had slightly higher russetting. Treatment 7 (Kenja + Silwet + IB18220), Treatment 8 (IKF-54111 + Silwet), Treatments 13 – 16 (GWN 10411 different rates + Induce) had the highest russet rating. It is interesting to note that all of these treatments (7, 13 – 16) include a nonionic surfactant full season. This is important to note with these unregistered products. Either another adjuvant should be considered in the evaluation or the adjuvant eliminated to prevent damage to fruit finish, especially for sensitive cultivars.

96
Table 1. 2015 Evaluation of registered and unregistered fungicides to manage apple diseases in Pennsylvania
% Incidence
Rome Beauty
R. Delicious
G. Delicious
Treatment & Rate/A Timing1 Scab-
Lvs
Scab - Fruit
Rots Sooty blotch
Fly-speck
Russet3 (0 - 5)
1 Untreated -- 68.3 a2 40 a 35 a-c 94 a 95 a 1.28 jk 2 Treated early/No summer program -- 19.7 bc 3 b 32 a-c 40 c 49 b 1.34 h-j 3 Manzate Pro-Stick 6 lb
Captan 80 WDG 3 lb Microthiol Disperss 6 lb Indar 8 fl oz + LI 700 1 pt Captan Gold 3 lb Topsin M 1 lb Captan Gold 3.5 lb
TC – PF TC – PF TC, P/EB 1C, 3C 2C, 3C, 4C, 6C, 8C 2C, 4C, 6C, 8C 5C, 7C
25. 2 b 3 b 18 bc 2 d 2 c 1.09 k
4 Manzate Pro-Stick 6 lb Captan 80 WDG 3 lb Microthiol Disperss 6 lb Indar 8 fl oz + LI 700 1 pt Captan Gold 3 lb Merivon 5.5 oz + Silwet 0.03% v/v Captan Gold 3. 5 lb
TC – PF TC – PF TC, P/EB 1C, 3C 2C, 3C, 4C, 6C, 8C 2C, 4C, 6C, 8C 5C, 7C
12.2 de 0 b 12 c 0 d 1 c 1.33 h-j
5 KENJA 12.5 fl oz + Silwet 0.1% v/v TC – 8C 7.9 e-g 0 b 27 a-c 4 d 2 c 1.86 e 6 KENJA 12.5 fl oz + Silwet 0.1%v/v
Manzate 3 lb TC – 8C TC – 8C
3.5 fg 0 b 8 c 0 d 0 c 1.51 g-i
7 KENJA 9.4 fl oz + Silwet 0.1%v/v IB18220 6.34 fl oz
TC – 8C TC – 8C
12.9 c-e 0 b 10 c 0 d 1 c 2.49 d
8 IKF-54111 13.7 fl oz + Silwet 0.1% v/v TC – 8C 21.0 b 0 b 25 a-c 0 d 2 c 3.05 a 9 Indar 2F 10 fl oz + LI 700 1 pt
Captan Gold 3 lb TC – 8C TC – 8C
12.3 de 0 b 28 a-c 0 d 0 c 1.47 g-j
10 Luna Sensation 5.0 fl oz Topguard 13 fl oz Indar 2F 8.0 fl oz + LI 700 1 pt Manzate Pro-Stick 3 lb Captan Gold 3 lb Luna Sensation 5.0 fl oz Serenade Optimum 16 oz
TC, PF P/EB, B, 1C 2C – 4C TC – 2C 3C – 6C 5C, 6C 7C, 8C
26.7 b 0 b 29 a-c 0 d 0 c 1.31 ij
11 Luna Tranquility 11.2 fl oz Topguard 13 fl oz Indar 2F 8.0 fl oz + LI 700 1 pt Manzate Pro-Stick 3 lb Captan Gold 3 lb Luna Sensation 5.0 fl oz Serenade Optimum 16 oz
TC, PF P/EB, B, 1C 2C - 4C TC – 2C 3C – 6C 5C, 6C 7C, 8C
13.4 c-e 0 b 10 c 0 d 0 c 1.31 ij
12 Luna Tranquility 11.2 fl oz Serenade Optimum 20 oz ProPhyt 4 pt Topguard 13 fl oz Indar 2F 8.0 fl oz + LI 700 1 pt Manzate Pro-Stick 3 lb Captan Gold 3 lb Luna Sensation 5.0 fl oz Serenade Optimum 16 oz
TC, PF P/EB, B P/EB, B 1C 2C – 4C TC, PF – 2C 3C – 6C 5C, 6C 7C, 8C
10.5 ef 1 b 20 a-c 0 d 0 c 1.6 fg
13 GWN-10411 SC 2 fl oz + Induce 0.25% v/v TC – 8C 3.2 fg 0 b 34 a-c 47 c 53 b 2.64 b-d 14 GWN-10411 SC 3 fl oz + Induce 0.25% v/v TC – 8C 1.7 g 1 b 33 a-c 53 bc 46 b 2.82 b 15 GWN-10411 SC 4 fl oz + Induce 0.25% v/v TC – 8C 1.5 g 0 b 41 ab 46 c 46 b 2.6 cd 16 GWN-10411 SC 5 fl oz + Induce 0.25% v/v TC – 8C 1.2 g 1 b 47 a 68 b 66 b 2.76 bc 17 Vivando 2.5 SC 15 fl oz + Silwet 0.1% v/v
Manzate Pro-Stick 3 lb Captan Gold 3 lb Ziram 3 lb Topsin M 1 lb
TC – 2C TC – 2C 3C – 8C 3C – 6C 7C, 8C
19.5 b-d 0 b 27 a-c 3 d 4 c 1.75 ef

97
(table 1 continued)
% Incidence
Rome Beauty
R. Delicious
G. Delicious
Treatment & Rate/A Timing1
Scab- Lvs
Scab - Fruit
Rots Sooty blotch
Fly-speck
Russet (0 - 5)
18 Merivon 4 fl oz + Silwet 0.1% v/v Manzate Pro-Stick 3 lb Captan Gold 3 lb Ziram 3 lb Topsin M 1 lb
TC – 2C TC – 2C 3C – 8C 3C – 6C 7C, 8C
2.5 g 0 b 34 a-c 0 d 0 c 1.53 gh
19 Merivon 4 fl oz + Silwet 0.1% v/v Captan Gold 3 lb Ziram 3 lb Topsin M 1 lb
TC – 2C TC – 8C 3C – 6C 7C, 8C
4.5 fg 0 b 24 a-c 0 d 0 c 1.93 e
20 Vangard 75 WG 5 oz Microthiol Disperss 6 lb Manzate Pro-Stick 6 lb Captan Gold 2.5 lb Inspire Super 2.82 EW 12 fl oz Aprovia 0.83 EC 7 fl oz Oso 6.5 fl oz + LI 700 1 pt Captan Gold 3 lb Ziram 3 lb
TC P/EB B B PF 1C 2C, 4C, 6C – 8C 3C, 5C 3C, 5C
4.5 fg 0 b 41 ab 0 d 1 c 1.4 g-j
1Application timings: Tight Cluster (TC, 21, 24 April); Pink/Early Bloom (P/EB, 29 April); Full Bloom (FB, 7 May); Petal Fall (PF, 14 May); 1st Cover (1C, 29 May); 2nd Cover (2C, 11 June); 3rd Cover (3C, 28 June); 4th Cover (4C, 7 July); 5th Cover (5C, 20 - 21 July); 6th Cover (6C, 30 July); 7th Cover (7C, 14 August), 8th Cover (8C, 2-3 Sept). 2Values within columns follow by the same letter(s) are not significantly different (P ≤ 0.05) according to Fisher's Protected LSD test.
Acknowledgements: We are grateful for the support from BASF, Bayer CropScience, Certis, FMC, Gowan, ISK, Syngenta, and UPI. Thanks to Bashar Jarjour for treatment applications; Josh Hersl, Drew May, Katie Shoemaker, and Johannah Williams for assisting with data collection; and to Milton Loyer for assistance with data analysis.

98
Not for citation
DETERMINING EFFICACY OF PRUNING WOUNDS PROTECTION TREATMENTS
AGAINST BOTRYOSPHAERIA INFECTION ON WINE GRAPES
Gregory Klinger and Mizuho Nita
AHS Jr. AREC Winchester, VA 22602
Fungi in the family Botryosphaeriaceae are commonly endophytic and/or pathogenic on a variety of woody plants, including grapevines. At least 22 species, of which Neofusicoccum parvum, Lasiodiplodia theobromae, Botryosphaeria dothidea, and Diplodia seriata are typically considered most pathogenic, are known to harmfully infect grapevines (Bertsch et al. 2013), invading the xylem tissues when they become exposed by pruning or mechanical damage to the trunk (Amponsah et al. 2012). Typical disease symptoms caused by these fungi include wedge shaped cankers in the infected wood, brown streaking on the wood surface below the bark, shoot dieback, and leaf dropping (Bertsch et al. 2013). Over several years, these symptoms turn into a noticeable deterioration in vine vigor that is referred to as grapevine decline. The result of this are vineyards that lose productivity and have to be replanted much quicker than they otherwise would. The spread of Botryosphaeria canker infection in vineyards is primarily a result of pruning. A number of studies have evaluated different cultural and chemical management strategies on the spread of Botryosphaeria infections in vineyards. Some of the strategies have included remediation of heavily infected vines by cutting back to near the graft union, double pruning- pruning once during the dormant season and then pruning again during periods late in the dormant season when disease is less likely to spread, and the application of various fungicides to pruning wounds. Results of these strategies have been mixed: remediation is effective but time-consuming and too expensive, double pruning also seems to reduce disease incidence but is time-consuming, and fungicidal applications having various degrees of success, with Topsin M the most effective fungicide at reducing Bot disease incidence in California. The trial was conducted at six different vineyard locations in northern VA in 2013-14. Treatments were 1) Topsin-M, 2) double pruning, and 3) regular pruning (check). Experimental design was randomized complete block design with four blocks. Topsin-M treatment was applied in mid-April for Topsin-M, the first cut in the double pruning was conducted in early march and second cut was conducted in mid-April, and regular pruning was conducted in mid-April in both years. Assessment was done in approximately one month after the application of the treatment. 3-5 stabs from the first year cane were collected per vine for detection of Botryosphaeria species. The nested PCR procedure was used to detect the Botryosphaeria pathogens in our samples, which entailed two rounds of PCR, the second one using a primer set designed to amplify a fragment contained within the amplified product of the first one. The first primer set was a universal ITS region primer set (ITS4 and ITS5 primers). The PCR product was diluted 100-fold

99
in nuclease free water, and then used it as DNA template for our second reaction. The second reaction used a set of primers, BoitsA and BoitsB, that were shown to specifically amplify DNA from Bot species known to potentially cause disease in grapevines, but was shown to not amplify DNA of other grapevine trunk pathogens or other common fungi. A select number of putative positive results obtained with this method were sequenced to verify results. Results From our main study, we collected 1203 total samples, and 708, or 58.8%, were positive. Treatment effect was examined with generalized linear mixed models to account for the random effects of replication (block) on our study and to account for the non-normal distribution of our data. Because our treatments were not equally distributed among different years, locations, and varieties, we analyzed each of these separately. There were no significant differences between treatments for any of these at an alpha=0.05 level, but two year-location-variety datasets, the 2014 AREC Cabernet Sauvignon and the 2014 Marker Miller Riesling, did have differences between treatments that were significant at an alpha=0.1 level, which is considered to be weakly significant.

100
Not for citation
SCREENING FOR QOI RESISTANCE AMONG SEVERAL COLLETOTRICHUM SPECIES ASSOCIATED WITH RIPE ROT OF GRAPE FOUND IN VA VINEYARDS
Amanda Bly, Mizuho Nita AHS Jr. AREC
Winchester, VA 22602
Ripe rot of grape is a fungal disease caused by two Colletotrichum species complexes, C. acutatum and C. gloeosporioides. Infection first appears as a dark lesion with concentric rings which in time envelops the entire grape, resulting in the late season rot as the name implies. Spores are spread to neighboring berries when water splashes during precipitation events. This disease can result in significant crop loss and off flavors in wine made with infected fruit, making management strategies important.
At this time a limited number of chemical options are available for controlling ripe rot. Among the fungicides recommended for management of ripe rot are the QoI group, or strobilurins, which prevent the production of ATP in the fungal cell. While these fungicides are effective, they are commonly associated with fungicide resistance due to the specificity of their mode of action, meaning a single mutation can result in a resistant population. A common, but not exclusive, source of insensitivity is mutation of the Cytochrome β gene at codon 143 (Ishii et al., 2001).This research examines the prevalence of QoI insensitivity among 283 Colletotrichum isolates collected throughout Virginia during 2013. Isolates were screened using a QoI amended media and later data was compared with results from PCR-RFLP.
For the fungicide-amended media assay, petri dishes containing PDA amended with 100 ppm azoxystrobin (Abound, 22.9% a.i. azoxystrobin, Syngenta Crop Protection) and 1,000 ppm SHAM (salicylhydroxamic acid) were inoculated with each of the isolates using a mycelial plug and then incubated at 25oC. The presence or absence of growth with exposure to azoxystrobin amended media was examined after 3 and 6 days. PCR-RFLP was utilized to detect a point mutation (G143A) of the cytochrome β gene (Ishii et al., 2001). The primers GCCBF1 and RSCBR2 were used to amplify a fragment of 120 base pairs. This fragment was then digested with a restriction enzyme Fnu4HI (aka Satl) which cuts the fragment at codon 143 if the mutation is present, creating two fragments 65 and 55 base pairs in size. Gels did reveal fragments fitting this description, although some also had an additional banding. The preliminary results showed that after six days of incubation, 28% of isolates grew on the fungicide-amended media, and thus showed signs of insensitivity. The PCR-RFLP results indicated that 16% of the isolates expressed signs of G143A mutation. The higher percentage with the fungicide-amended media assay was expected, since there is more than one kind of mutation that can lead to insensitivity, while the PCR-RFLP assay was designed to test for only one mutation.

101
Not for Citation or Publication Without Consent of the Author
2015 EVALUATION OF PROGRAMS TO MANAGE BLOSSOM BLIGHT ON GALA IN
PENNSYLVANIA
Brian L. Lehman, Carl E. Bower, and Kari A. Peter Penn State University, Fruit Research & Extension Center,
Biglerville, PA 17307
A trial evaluating the effectiveness of bactericide programs to control the blossom blight phase of fire blight was conducted at the Penn State Fruit Research and Extension Center in Biglerville, PA. Various bio-pesticide treatments were tested for their efficacy and compared to a standard streptomycin treatment. Twelve year-old ‘Gala’ trees on M.7 rootstocks were used and single tree treatments were arranged in a randomized complete block with four replications. Three branches were selected per tree and 25 - 30 blossom clusters were tagged on each branch. Treatments were applied in the morning using a backpack motorized mist blower until mist run-off on 29 April (20% Bloom), 1 May (80% Bloom), 4 May (100% Bloom), and 7 May (Petal Fall). A fourth treatment spray was included due very favorable weather conditions for disease development experienced during the trial. Late afternoon on the day of the treatment application, blossoms on tagged branches were inoculated with a bacterial suspension of 1x10⁷ Erwinia amylovora cells/ml using a spray bottle. Blossoms were inoculated on 29 April and 1 May. Blossom clusters were evaluated on 19 May for infection. A cluster was rated infected if at least one blossom had fire blight symptoms. Total fire blight shoot strikes on the tree were also counted on 19 June. Weather data was recorded with a Decagon weather monitoring system, and fire blight (MaryBlyt 7.1) infection periods were reported. Depending on the cultivar and location, bloom was occurring for approximately three weeks in May: fire blight infection periods occurred May 3 – 9; May 10 – 12; May 16; May 17 – May 19. As a result, any infection established during our trial was able to establish extremely well. Mean percent incidence was calculated and data was analyzed using analysis of variance and the Fisher’s Protected LSD Test determined the mean separation.
This was an excellent year for fire blight and the disease pressure was exceptional for conducting
these evaluations for 18 different management programs (2 untreated checks) to control blossom blight. We observed symptoms (oozing blossoms) less than a week after infection. Unfortunately, the ideal conditions experienced this year in Pennsylvania overwhelmed the bio-pesticide treatments (Treatments 3 – 12) and little control was achieved as shown in Table 1. To reinforce the ideal conditions for disease development, the treatment using the conventional control streptomycin had only 47% control (Treatment 13). This is contrast to 2014, where close to 80% control was achieved (data not shown). Overall, the treatments which included streptomycin (Treatments 13 – 16) fared much better for control than the bio-pesticide treatments and were not statistically different than when streptomycin was used alone with the exception of treatment 14. The treatments including Serenade Optimum (Treatments 14 – 16) in rotation with streptomycin did not statistically differ from each other; however, blossom blight control was significantly less when Serenade Optimum was used as a first spray in a Serenade Optimum/ streptomycin rotation (Treatment 14) compared to when streptomycin was used alone (Treatment 13). Of the bio-pesticide treatments, Blossom Protect showed the most promise (despite the numbers in 2015). Blossom Protect was evaluated at Penn State in 2014 and 40% control was observed. This product doesn’t seem to perform as well as how it has been observed on West Coast and perhaps timing and concentration may need to be altered for East Coast conditions. Ideally these programs should continue to be evaluated in 2016. No phytotoxicity was observed for any treatment (foliage or fruit).
For Treatments 18 – 20, we were curious if use during the previous season of Actigard, a
systemic acquired resistance inducer, and Apogee, a plant growth regulator and possible resistance

102
inducer, may have residual effects for managing fire blight the next season. Unfortunately, the positive effects of Actigard and Apogee are strictly relegated to in-season use and there is no residual carry-over to the next season. Table 1. Comparing biopesticide and conventional treatments to manage blossom blight. Treatment & Rate/A Timing1 % Control % Incidence # Strikes in June 1 Untreated - Uninoculated -- 100 h2 0.0 h 18.8 fg
2 Untreated - Inoculated -- 0 a - c 86.9 a - c 81.0 ab
3 Fire Quencher 2 pt 1 – 4 - 1 a – c 87.7 a - c 85.8 a
4 Blossom Protect 1.25 lb + Buffer Protect 8.75 lb
1 – 4 15 c – e 73.5 c - e 16.3 e -g
5 Cueva 2 qt 1 – 4 2 a - c 85.5 a - c 37.5 c - f
6 Bloomtime 5.28 oz 1 – 4 - 8 a 93.7 a 74.5 ab
7 Blossom Protect 1.25 lb + Buffer Protect 8.75 lb Fire Quencher 2 pt
1, 2 3, 4
25 d – f 65.5 d - f 30.8 d - g
8 Fire Quencher 2 pt Cueva 2 qt
1, 2 3, 4
5 a – c 82.7 a - c 28.3 e - g
9 Fire Quencher 2 pt Bloomtime 5.28 oz
1, 2 3, 4
2 a – c 84.8 a - c 57.3 b - d
10 Serenade Optimum 20 oz Cueva 2 qt
1, 2 3, 4
- 4 a 90.2 a 24.0 e - g
11 Serenade Optimum 20 oz 1 – 4 0 a – c 87.2 a - c 57.0 b - d
12 Serenade Optimum 20 oz + ProPhyt 4 pt
1 – 4 7 a - d 80.5 a - d 40.1 c - e
13 FireWall 1.5 lb 1 – 4 47 g 46.4 g 7.0 g
14 Serenade Optimum 20 oz FireWall 1.5 lb
1, 3 2, 4
29 ef 62.1 ef 4.3 g
15 FireWall 1.5 lb Serenade Optimum 20 oz
1, 3 2, 4
38 fg 53.6 fg 11.8 fg
16 FireWall 1.5 lb Serenade Optimum 20 oz + ProPhyt 4 pt
1, 3 2, 4
41 fg 51.8 fg 21.8 e -g
17 Cueva 2 qt + Double Nickel 1 qt 1 – 4 14 b – e 75.2 b - e 41.3 c - e
18 Apogee 12 oz @ Spring 2014 (residual control?)
2 sprays 3 a – c 84.3 a - c 59.0 a - c
19 Actigard @ Spring 2014 (residual control?)
2 sprays - 3 ab 89.8 ab 75.8 ab
20 Actigard @ Fall 2014 (residual control?)
3 sprays 0 a – c 86.8 a - c 56.0 b - d
1Applied treatments using a backpack mist blower until mist run-off: 1 (20% Bloom; 29 April); 2 (80% Bloom; 1 May); 3 (100% Bloom; 4 May); 4 (Petal Fall; 7 May). Standard insecticide and fungicide maintenance programs were applied to the entire orchard with an airblast sprayer. 2Values within columns follow by the same letter(s) are not significantly different (P ≤ 0.05) according to Fisher's Protected LSD test.
Acknowledgements: We are grateful for the support from Agrosource, Certis, Bayer CropScience, IR-4, and Syngenta. Thanks to Teresa Krawczyk for helping with treatment applications; to Josh Hersl, Taylor Hess, Drew May, Hanna Laukaitis, Katie Shoemaker, Kate Thomas, and Johannah Williams for assisting with data collection; and to Milton Loyer for assistance with data analysis.
103
Not for citation
ORGANIC FUNGICIDE AND WINE GRAPE CULTIVAR TRIAL UPDATES
Sabrina Hartley, and Mizuho Nita AHS Jr. AREC
Winchester, VA 22602
Interest in organic production of quality wine grapes has increased due to rising environmental
concerns among growers and consumers. Development of grape diseases is influenced by variety of
factors, such as presence/absence of disease organisms, environmental conditions, cultural practice,
susceptibility of cultivar, etc. In 2012 we planted our organic trial vineyard to help answer some of
questions and concerns. Our goal is to test the effect of grape cultivars and OMRI‐certified fungicides
under diseases‐prone environmental condition of Virginia.
The organic trial vineyard was planted at the Virginia Tech AREC in Winchester, Virginia in 2012.
Vineyard layout consists of, 5’x9’ vine to row spacing, cane pruned to vertical shoot positioning trellis
system. It is divided into two plots (A & B) which contain 4 grape cultivars each. Plot A contains hybrids:
‘Vidal Blanc’, ‘Corot Noir’, NY 95 (‘Allandale’), and a Vitis vinifera, ‘Petit Manseng’. Plot B contains
hybrids: ‘Chambourcin’, ‘Chelois’, ‘Vignoles’, and V. vinifera, ‘Cabernet Franc’. Treatments were applied
on a 2‐week basis (with an exception of at bloom application, which might have applied less than two
weeks from the previous application), with a 4‐gal backpack hand‐pumped air sprayer, regulated to 21
psi by a Gate CFValve system through a single boom with a TeeJet 8003VS flat fan nozzle. Plot A
contained four treatments, three organic and one conventional; OA: Champ (fixed copper) at 3 lb/A, OB:
Champ with Serenade Optium at 1 lb/A, OC: Champ with Serenade Optium and Regaila at 4 qt/A, C:
Conventional Mancozeb at 3 lb/A and occasional Quintec (4 oz/A), and Prophyt (3 pt/A). Plot B
treatments were replications of OC and C. Treatments were replicated 4 times per plot, with a border of
3 vines of Allandele between replicates. We are unable to use the OMRI certified sulfur as a fungicide in
this trial due to sulfur sensitivities of multiple hybrid varieties.
Data collections from 2013‐2015 revealed cultivar selection had a strong effect on the disease
development. Vidal and Cabernet Franc proved to be the most susceptible to downy mildew, while
other cultivars demonstrate more resistance. Petit Manseng and Corot Noir developed powdery mildew
infection in all treatments, but with a lower severity with Serenade Optimum treatments. Although
there was no major development in 2013‐2014, black rot incidence increased significantly by 2015 on all
organic treatments. This increase probably occurred due to the increase of disease pressure in the
vineyard, and the results indicated lack of efficacy of tested OMRI‐certified fungicides, and. In summary,
selection of proper cultivars that suit the location is the key factor for the successful organic production,
and there is still concern on the management of black rot, even with more disease resistant cultivars.

104
Mid Atlantic Tree Fruit Integrated Pest Information Platform for Extension and Education (iPiPE) Update
Mahfuz Rahman and Erin Young
West Virginia University Morgantown, West Virginia 26506
Pest outbreak and spread on agricultural commodities has the potential to negatively impact food security for ever expanding population of the world. Timely pest (pathogens, insects, and weeds) scouting and utilization of data can guide stakeholders in agriculture to a wide range of decisions and activities to minimize damage from pests. Primary scouting data when submitted to a common online platform can also be utilized for advanced derivative products such as pest distribution map, prediction/alert based on model, new IPM tools with expert commentary to lower the pest management cost, minimize environmental impacts of pest management practices and make management sustainable. Suitable weather condition and large geographical areas with varied topography in the Mid-Atlantic states (WV, VA, MD and PA) allows for the production of tree fruits. The majority of orchards in WV are located in the eastern panhandle counties whereas most VA orchards are in Northern Shenandoah Valley and along the slopes of the Blue Ridge Mountains. Many of the orchards in PA and MD are within 100 miles from eastern panhandle of WV. Many invasive and emerging insects, diseases and weeds pose threat to the Mid-Atlantic tree fruit industry. Due to high relative humidity during the growing season, disease management often is more challenging and IPM approaches are necessary in order to obtain a sustainable management. During the first year of the project in 2015, stakeholders from the region were informed about the objective of the project, electronic data submission to a common platform and long-term benefits to the industry. A mobile app for pest scouting data submission was developed, which is available to the stakeholders online: https://play.google.com/store/apps/details?id=com.zedxinc.ag.mobile.nappobs&hl=en More than 300 pest observations from tree fruit were submitted to the common iPiPE platform and disease forecast model for Glomerella leaf spot was developed, which will be further validated in the upcoming season. In general, the model revealed that disease risk increases when temperatures are between 11 and 33o C (optimum 25o C) and when the canopy is wet for >3 hours per day, decreases <3 hour per day. IPM elements were developed for apple, cherry, peach and pear, which is available online http://ed.ipipe.org/ipm-elements/tree-fruit-mid-atlantic-ipm-elements. Fruit growers will be immensely benefitted from the outcome of the project and help in sustainability of tree fruit industry in the mid-Atlantic region.

105
Not for Citation or Publication
Without Consent of the Author
NPN MEMBRANE GRAPEVINE VIRUS SAMPLING TECHNIQUE FOR EFFICIENT NUCELIC ACID STORAGE AND TESTING
Taylor Jones and Mizuho Nita
Alson H. Smith, Jr. Agricultural Research and Extension Center Virginia Tech, Winchester, VA 22601
Among perennial crop worldwide, the most number of viruses (> 60) have been detected
from grapevines (Martelli and Boudon-Padieu 2006; Rayapati 2012). A majority of these viruses are considered as minor threats to production, in that they either display less economic significance or have limited geographical distribution; however, there are several viruses that are considered a major threat due to high economic importance (Martelli and Boudon-Padieu 2006; Rayapati 2012). Examples being the grapevine leafroll complex, rugose wood complex, degeneration/decline disease complex, and fleck disease complex (Martelli and Boudon-Padieu 2006). Until recently, very limited information has been available about grapevine viruses and associated vectors in Virginia vineyards. A statewide survey of commercial vineyards in Virginia (VA), USA and surrounding states was recently conducted during 2009 through 2014 seasons for the presence of fourteen grapevine viruses: Grapevine leafroll-associated virus (GLRaV)-1, -2, -3, -4, -4 strain 5, -4 strain 9, Grapevine rupestris stem pitting associated virus (GRSPaV), Grapevine virus A (GVA), Grapevine virus B (GVB), Grapevine fleck virus (GFkV), Tomato ringspot virus (ToRSV), Grapevine Pinot gris virus (GpgV), Grapevine vein clearing virus (GVCV), and Grapevine red blotch associated virus (GRBaV). All but GVCV and GpgV were found in VA.
With this knowledge, better methods of nucleic acid storage and testing are necessary. A virus sampling and testing method involving the use of various membranes (such as FTA cards and NPN membranes) that are capable of binding to nucleic acid and keeping virus integrity at room temperature for long periods of time (P. G. S. Chang et al. 2011; P. S. Chang and Tolin 2008, 2010; Notte et al. 1997; Osman and Rowhani 2006) could be a promising method for our lab. Plant sap can be blotted onto these membranes prior to use in multiple assays such as PCR, RT-PCR, qRT-PCR, and TBIA (P. G. S. Chang et al. 2011). These techniques have been shown to be effective for use to detect grapevine viruses (Notte et al. 1997; Osman and Rowhani 2006) as well as cucumoviruses and potyviruses (P. G. S. Chang et al. 2011). However, the current methods for grapevine testing have not been developed for red blotch and require the use of a sterile lab environment. A membrane-based method that could be used in the field by growers would have significant application and help advance the field of grapevine virus detection.
A method for sampling using a NPN membrane was developed for growers to use on their own in the form of a kit using common items. Thin cuttings of petioles are used to fill up the bottom of a medicine cup (about 250mg). 1 mL of a buffer (either previously used grapevine extraction buffer, ELISA buffer or FTA buffer) is added (either 1ml or .5ml, both seem to work) and tissue will be crushed using a sterile, wooden “tongue depressor” stick. The solution is then blotted to a NitroPure nitrocellulose membrane, and then mailed back to the laboratory using the postal service. From there, the membranes can be stored for months and contain reusable nucleic acid for all viruses we test for. Previously used RT-PCR, PCR, and qRT-PCR for grapevine viruses can be used from these membranes to identify viruses in the sap by following standard

106
protocols, and using a 1mm punchout of the sampled membrane, denatured and vortexed in a grapevine extraction serum (Jones et al. 2015) with 1 or 2ul of solution being used in the PCR reaction tubes.
To summarize, the matrix of these membranes preserves the integrity of viruses without the need for refrigeration while the major advantage of the membrane-based sampling technology is its robustness; the ability to store membranes for long periods of time at room temperature without compromising quality(P. G. S. Chang et al. 2011; P. S. Chang and Tolin 2008, 2010). This membrane-based sampling technique for grapevine viruses should enable growers to sample on their own time without reducing the quality of the grapevine sample taken. Acknowledgements: Work was supported by the Virginia Wine Board. We thank the commercial vineyards in Virginia for their participation in the studies. Chang,P.G.S.,McLaughlin,W.A.,&Tolin,S.A.(2011).TissueblotimmunoassayanddirectRT‐PCR
ofcucumovirusesandpotyvirusesfromthesameNitroPurenitrocellulosemembrane.[Article].JournalofVirologicalMethods,171(2),345‐351,doi:10.1016/j.jviromet.2010.11.018.
Chang,P.S.,&Tolin,S.A.(2008).DetectionandpartialcharacterizationofthreeRNAvirusesusingimprovedmembrane‐basedtechnologies.[MeetingAbstract].Phytopathology,98(6),S214‐S214.
Chang,P.S.,&Tolin,S.A.(2010).NitrocellulosemembranesasasolidmatrixforCucumbermosaicvirusimmuno‐detectionandsubgroupidentificationbyRT‐PCR.[MeetingAbstract].Phytopathology,100(6),S173‐S173.
Jones,T.,Rayapati,N.,&Nita,M.(2015).OccurrenceofGrapevineleafrollassociatedvirus‐2,−3andGrapevinefleckvirusinVirginia,U.S.A.,andfactorsaffectingvirusinfectedvines.EuropeanJournalofPlantPathology,1‐14,doi:10.1007/s10658‐015‐0605‐z.
Martelli,G.P.,&Boudon‐Padieu,E.(2006).Directoryofinfectiousdiseasesofgrapevines.(Vol.55):InternationalCentreforAdvancedMediterraneanAgronomicStudies.OptionsMéditerraneennés,Ser.B,StudiesandResearch.55:59‐75.
Notte,P.l.,Minafra,A.,&Saldarelli,P.(1997).Aspot‐PCRtechniqueforthedetectionofphloem‐limitedgrapevineviruses.JournalofVirologicalMethods,66(1),103‐108,doi:10.1016/s0166‐0934(97)00038‐4.
Osman,F.,&Rowhani,A.(2006).ApplicationofaspottingsamplepreparationtechniqueforthedetectionofpathogensinwoodyplantsbyRT‐PCRandreal‐timePCR(TaqMan).JournalofVirologicalMethods,133(2),130‐136,doi:10.1016/j.jviromet.2005.11.005.
Rayapati,N.(2012).VirusDiseases.http://wine.wsu.edu/research‐extension/plant‐health/virology/virus‐diseases/.AccessedNovember2012.

107
Not for citation
FUNGICIDE PERFORMANCE TRIALS ON DOWNY MILDEW, POWDERY MILDEW,
BLACK ROT, AND RIPE ROT.
Mizuho Nita, Sabrina Hartley, and Amanda Bly AHS Jr. AREC
Winchester, VA 22602
The powdery trial was conducted in ‘Chardonnay’ grapevines planted in 2012, trained to a vertical shoot positioning system with bilateral cordons, with a spacing of 5 ft between vines and 10 ft between rows. Plots consisted of three consecutive vines and were arranged in a randomized complete block design with four blocks. Treatments were applied with a 4-gal backpack hand-pumped air sprayer, regulated to 21 psi by a Gate CFValve system through a single boom with a TeeJet 8003VS flat fan nozzle. Prior to the experimental treatment, all vines were treated with Dithane 75DF (3 lb/A) and Microthiol Disperss (3 lb/A) on 28 April, and 11 May. Treatments were applied 11- to 13-day interval based on grape’s growth stages: prebloom (21 May), at bloom (1 Jun), fruit set (12 Jun), and pea-size berry (25 Jun). Double Nickel/Oso, and two WXF15005 treatments were started on 21 May (prebloom). Dithane, Microthiol D, and Rally (3.4 oz/A) were applied to check, standard, and Quintec/Rally on 21 May. Only Vitagrow/NHarmony treatment had a different spray schedule where Vitagrow was alternated with NHarmony in every 15 days from 28 April through the end of the trial. All, but standard, Vitagrow/NHarmony and Double Nickel/Oso, treatments were tank-mixed with Revus (8 fl oz/A) in order to suppress downy mildew infection. Powdery mildew was visually assessed on 22 Jun. Although treatment were continued until 25 Jun, we did not assess on later dates due to very high disease levels we observed. Of the three vines used for each treatment replication, the outer cordons adjacent to the next treatment were not assessed in order to avoid recording the effects from fungicide drift. Sixty leaves and thirty clusters per plot were arbitrary selected and assessed. Downy mildew and black rot trials were conducted with ‘Merlot’ grapes planted in 2009, trained to a vertical shoot positioning (VSP) system with bilateral cordons, with a spacing of 5 ft between vines and 10 ft between rows. Plots consisted of three consecutive vines and were arranged in a randomized complete block design with four blocks. Treatments were applied with a 4-gal backpack hand-pumped air sprayer, regulated to 21 psi by a Gate CFValve system through a single boom with a TeeJet 8003VS flat fan nozzle. Prior to the downy mildew experimental treatment, all vines were treated with Dithane 75DF (3 lb/A) and Microthiol Disperss (3 lb/A) on 28 Apr and 11 May, and Dithane, Microthiol D, and Rally (5 oz/A) on 21 May to control various diseases. All treatments were applied three times according to the following schedule: at bloom (5 Jun), fruit set (15 Jun), and pea-size (29 Jun). All treatments were tank-mixed with Microthiol D (3 lb/A) and either Vivando (15 Jun) or Quintec (6 Jun and 29 Jun) in order to suppress powdery mildew infection. Prior to the black rot experimental treatment, all vines were treated with Dithane 75DF (3 lb/A) and Microthiol Disperss (3 lb/A) on 28 Apr and 11 May, and Dithane, Microthiol D, and Rally (5 oz/A) on 21 May to control various diseases. All treatments were applied three times according to the following schedule: at bloom (5 Jun), fruit set (15 Jun), and pea-size (29 Jun). All treatments were tank-mixed with Microthiol D (3 lb/A) and either Vivando (15 Jun) or Quintec (6 Jun and 29 Jun) in order to suppress powdery mildew infection. Downy mildew symptoms were visually assessed on 8 Jul. Black rot symptoms were visually assessed on 8 Jul. Of the three vines used for each treatment replication, outer cordons adjacent to the next treatment were not assessed in order to avoid recording the effects from fungicide drift. Sixty leaves and thirty clusters were arbitrary selected and assessed per plot. Botrytis and Ripe rot trial was conducted with ‘Chardonnay’ grapes planted in 2009, trained to a vertical shoot positioning (VSP) system with bilateral cordons, with a spacing of 5 ft between vines and 10 ft

108
between rows. Plots consisted of two consecutive vines and were arranged in a randomized complete block design with five blocks. Treatments were applied with a 4-gal backpack hand-pumped air sprayer, regulated to 21 psi by a Gate CFValve system through a single boom with a TeeJet 8003VS flat fan nozzle. Throughout the experiment, all vines were treated with: Dithane 75DF (3 lb/A) and Microthiol Disperss (3 lb/A) on 28 Apr and 11 May; Dithane, Microthiol D, and Revus Top (3.4 oz/A) on 22 May and 12 Jun; Prophyt (2 qt/A) on 20 Jun; Prophyt, Dithane, and Microthiol D on 25 Jun; Armicarb (2.5 lb/A) on 7 Jun; Ranman (13.5 floz/A) and Microthiol D (4.5lb/A) on 9 Jul; Prophyt , Champ (3 lb/A) and Microthiol D (6 lb/A) on 24 Jul; and Champ and Microthiol D (6 lb/A) on 21 Aug, to control various diseases. Majority of treatments were applied three times according to the following schedule: at bloom (1 Jun), bunch closure (9 Jul), and veraison (6 Aug). Bloom treatments were tank mixed with Viviando (10.5), Ridomil MZ (2.5 lb/A), and Dithane 75DF; at bunch closure and veraison treatments were tank-mixed with Microthiol D (3 lb/A), and Ranman in order to suppress powdery mildew and downy mildew infection. Exceptions in the application timing were Serenade alternated with Luna Tranquility, Flint alternated with Luna Experience and Luna Tranquility, and both had an additional treatment of Luna Experience on 22 May (pre-bloom). Also, two PhD treatments received an additional treatment on 24 Aug (two weeks after veraison). Botrytis and ripe rot symptoms were visually assessed on 4 Aug. Twenty clusters were arbitrary selected and assessed per plot. Statistical analyses: The estimated percentage of infected area (disease severity) per leaf or per cluster and presence or absence of diseased tissue per leaf or cluster (disease incidence) were recorded. The generalized linear mixed model (PROC GLIMMIX) and linear mixed model (PROC MIXED) procedures in SAS were used to conduct the analysis of variance for disease incidence and severity, respectively. Treatment was considered a fixed effect, and block was considered a random effect. Results Powdery mildew: Bud break of Chardonnay at Winchester was on 22 April and 50% bloom on 2 Jun. Rainfall in 2015 was below average. The amount of precipitation at Winchester was about 4.1 in. between bud break and bloom, and 1.4 and 1.5 in. during June and July, respectively. The dry weather promoted development of powdery mildew. Mean leaf incidence of powdery mildew among different treatments ranged from 94% to 99.6% and disease severity varied from 21% to 49%. Cluster disease incidence and severity per treatment ranged from 75% to 100% and 61% to 92%, respectively. Treatment differences were highly significant (P < 0.05) for all disease measurements but not with disease incidence on cluster (P = 0.24), due to very high disease incidence with all treatments. With disease severity, a good separation of treatment means was found. Despite of high powdery mildew pressure, Quintec/Rally and Double Nickel/Oso treatments resulted in significantly lower leaf and cluster disease severity than the untreated check and the standard (sulfur). Other “soft” approach materials were not able to provide significant reduction in powdery mildew and often resulted in significantly higher disease incidence or severity than the check, with an exception on VitaGrow/NHarmony treatment, which resulted in significantly higher leaf disease severity, but significantly lower cluster disease severity. However, I should note that this treatment resulted in very high degree of downy mildew. Downy Mildew: Bud break of Merlot at Winchester was on 28 April and 50% bloom on 6 Jun. Rainfall in 2015 was below average. The amount of precipitation at Winchester was about 4.1 in. between bud break and bloom, and 1.4 and 1.5 in. during June and July, respectively. Disease incidence and severity on leaves varied from 71% to 99.7% and 8% to 47%, respectively. Disease incidence and severity on clusters varied from 14% to 27% and 1% to 3%, respectively. Treatment effect was significant on both leaf incidence and severity (P < 0.001), while treatment effect on downy mildew cluster incidence and severity was not significant (P > 0.05). Both mancozeb and CX10250 alternated with mancozeb resulted in significantly lower disease incidence and severity than the check. The check and CX10250 alone treatments were not significantly different from each other on both leaf incidence and severity, indicating that the difference observed with CX10250 alternative with mancozeb treatment was probably due to the effect of mancozeb applied at 10 days after first application.
109
Black rot: Disease incidence and severity on the leaf ranged from 0 to 27% and 0 to 2%, respectively, and disease incidence and severity on the cluster varied from 0 to 81% and 0 to 21%, respectively. Treatment effect was significant on all the measurements (P < 0.001). All treatments resulted in significantly lower disease incidence and severity on both leaf and cluster. As expected, QoI (pyraclostrobin in Pristine) and DMI (tebuconazole in Viathon) provided excellent control of black rot. In addition, Syngenta program 1 and 2 (products are not disclosed) provided very good control against black rot. Aprovia (SDHI) with a higher rate showed numerically lower disease incidence and severity on both leaves and clusters; however, it was not significantly (P > 0.05) different from the lower rate. Botrytis and Ripe rot: Bud break of Chardonnay at Winchester was on 22 April and 50% bloom on 2 Jun. Rainfall in 2015 was below average. The amount of precipitation at Winchester was about 4.1 in. between bud break and bloom, and 1.4, 1.5, and 1.1 in. during June, July, and Aug, respectively. Most likely due to the dry spell during the month of Aug, Botrytis did not develop in the field. There were only two treatments with disease incidence and severity of 1 and 0.01%, respectively. Consequently, there was no significant effect of treatment on Botrytis. On the other hand, ripe rot developed, and treatment effect on both disease incidence and severity was significant (P < 0.05). Ripe rot incidence varied from 4 to 53% and severity ranged from 0.1 to 4.6%. While Luna Experience resulted in relatively lower ripe rot incidence and severity, other combinations with Luna Tranquility did not suppress ripe rot; therefore, DMI (tebuconazole) component of Luna Experience probably has efficacy against ripe rot while SDHI may not be the best material for ripe rot management. Relatively lower ripe rot incidence and severity with PhD and Oso suggested that Poloxyn-D may have some efficacy against ripe rot pathogens. Although it was not statistically significant, numerically lower disease incidence and severity with two PhD treatments compared with Oso suggested either the rate (PhD contains more a.i) or the late season application after veraison may provide efficacy against late season infection by ripe rot pathogens.

110
Tables for each trial
Powdery mildew on the
Leaf Cluster
Treatment and rate/Az Days after first applicationy
Incidence (%)x
Severity (%)x
Incidence (%)x
Severity (%)x
Revus 7 fl oz (Check) 11, 35 Prophyt 64 fl oz 22 94.6 c 35.1 c 100.0 82.0 bc Microthiol D 3 lb (Standard) 11, 22, 35 98.3 ab 38.0 bc 100.0 86.4 ab Quintec 4 fl oz Rally 5 oz
11, 35 0, 22 95.0 bc 21.9 d 100.0 60.7 e
Double Nickel 2.5 lb + Champ 3 lb Oso 6.5 oz + Prophyt 3 qt
0, 35 11, 22 94.2 c 20.6 d 100.0 75.8 cd
VitaGrow 44 oz Nharmony 6 oz
-19, 11, 41 -4, 26 99.2 a 48.9 a 75.0 71.3 d
WXF-1% 0, 11, 22, 35 99.6 a 38.9 b 100.0 91.5 a
WXF-0.5% 0, 11, 22, 35 98.8 a 39.0 b 100.0 89.4 a
z All rates are calculated on a per-acre basis using 100 gal of water, all treatments were tank-mixed with Revus (7 fl oz).
y The first application of experimental treatments (with an exception of VitaGrow/Nharmony) was made on 21 May 2015 (day 0 in the table).
x Numbers presented are mean percentage per treatment. Numbers followed by the same letter were not significantly different (LSD with alpha = 0.05)

111
Downy mildew on the
Leaves Clusters
Treatment and rate/Az Days after first applicationy
Incidence (%)x
Severity (%)x
Incidence (%)x
Severity (%)x
Sulfur 3lb (Check) 0, 10, 23 99.5 a 46.6 a 17.3 0.7 Mancozeb 3 lb (Standard) 0, 10 Ziram 3 lb 23 71.6 b 8.3 b 13.9 2.8
CX10250 4.5 oz 0, 10, 23 96.9 a 45.1 a 20.0 2.7CX10250 4.5 oz Mancozeb 3 lb
0, 23 10 70.8 b 8.5 b 26.9 1.2
z All rates are calculated on a per-acre basis using 100 gal of water. y First treatment application was 5 June 2015 (day 0 in the table). x Numbers presented are mean percentage per treatment. Numbers followed by the same letter
were not significantly different (LSD with alpha = 0.05)
Black rot on the
Leaves Clusters
Treatment and rate/Az Days after first applicationy
Incidence (%)x
Severity (%)x
Incidence (%)x
Severity (%)x
Revus 8 fl oz, + Quintec 4 oz + Sulfur 3lb (Check) 0, 10, 23 26.7 a 1.95 a 81.3 a 21.1 a Pristine (standard) Zirum 3 lb
0, 10 23 0 d 0 b 0 d 0 c
Aprovia 8.5 fl oz Zirum 3 lb
0,10 23
7.2 b 0.16 b 38.6 b 7.7 b
Aprovia 10.5 fl oz Zirum 3 lb
0, 10 23 5.0 bc 0.14 b 31.6 b 4.6 b
Syngenta 1 0, 10, 23 1.3 cd 0.01 b 17.3 c 0.4 c
Syngenta 2 0, 10, 23 0.8 d 0.01 b 1.3 d 0.1 c Viathon 5.13 oz Zirum 3 lb
0, 10 23 0.2 cd 0.04 b 0 d 0 c
z All rates are calculated on a per-acre basis using 100 gal of water. All treatments were tank-mixed with Microthiol D (3 lb/A) y First treatment application was 5 June 2015 (day 0 in the table). x Numbers presented are mean percentage per treatment.

112
Botrytis on the clusters Ripe Rot on the clusters
Treatment and rate/Az Days after first applicationy Incidence (%)x Severity (%)x Incidence (%)x Severity (%)x
Elevate 0.75lb Rovral 1.5 pt (Standard)
0, 62 32 0 0 5.0 efg 0.22 ef
Luna Experience 8 fl oz 0, 32, 62 0 0 4.0 fg 0.22 ef
Switch 14 oz 0, 32, 62 0 0 7.0 cg 0.65 cdef
Syngenta 1 0, 32, 62 0 0 53.0 a 4.62 a
Syngenta 2 0, 32, 62 0 0 9.5 cdefg 0.60 cdef
Syngenta 3 0, 32, 62 0 0 11.0 bcdf 0.81 bcdef
Syngenta 4 0, 32, 62 0 0 16.0 bc 0.70 bcdef
Syngenta 5 0, 32, 62 0 0 5.0 efg 0.17 ef
Vivando 10.5oz (Control) 0 0 0 Ranman 13.5oz 32, 62 0 0 12.0 bcde 1.37 bc
PhD 6.2 oz 0, 32, 62, 80 0 0 3.0 g 0.07 f PhD 6.2 oz Vangard 7 oz
0, 80 32, 62 0 0 5.3 efg 0.84 bcdef
Serenade 17oz Luna Tranquility 8 fl oz
0, -13, 32, 62 0 0 21.0 b 1.60 b
Luna Experience 8 fl oz Serenade 17oz Luna Tranquility 8 fl oz
0 32 62 0 0 15.8 bc 0.92 bcdef
Luna Tranquility 8 fl oz Serenade 17oz Luna Experience 8 fl oz
0 32 62 1 0.01 20.0 b 1.19 bcd
Flint 2 oz Luna Experience 8 fl oz Luna Tranquility 8 fl oz
0 -13, 32 62 0 0 14.0 bcd 0.65 cdef
Oso 6.5 oz Vangard 7 oz
0, 62 32 0 0 6.2 defg 0.39 def
Oso 6.5 oz 0, 32, 62 1 0.01 20.0 b 1.09 bcde
z All rates are calculated on a per-acre basis using 100 gal of water. Treatments applied at 0 days, were tank mixed with Vivando; treatments at 32, and 62 days after the first treatment were tank-mixed with Ranman and Sulfur. y First treatment application was 1 June 2015 (day 0 in the table). Two treatments were started 13 days prior to the other treatment. x Numbers presented are mean percentage per treatment.

113
HIGHLIGHTS OF FIRE BLIGHT TESTING ON APPLE, 2015 HIGHLIGHTS OF APPLE FUNGICIDE TESTING, 2015
DISEASE CONTROL AND PHYTOTOXICITY BY COPPER /DOUBLE NICKEL MIXTURES ON PEACH
Keith Yoder
TABLE OF CONTENTS
TITLE PAGE
Seasonal disease developments for the Winchester, VA area and Virginia Tech AREC, 2015. ..................................................................................................... 3
Wetting periods favorable for apple scab infection; accumulated wetting hours ........................... 4
Efficacy and phytotoxicity of biopesticides for the control of fireblight on Gala apple, 2015. (Table 1) .................................................................................................................... 5-6
Suppression of fire blight blossom blight on Idared apple, 2015. (Table 2) ................................ 7-8
Early season timing of coppers and Regalia for fire blight and scab control on Idared apple, 2015. (Table 3) ....................................................................................................... 9-10
Shoot blight suppression, summer disease control, and fruit finish, by post-bloom copper applications on Gala apple, 2015. (Tables 4 and 5) ................................................................................. 11-12
Disease control by experimental and registered fungicides and mixtures on Golden Delicious, Idared, and York Imperial apples, 2015. (Table 6-13) . ................................................... 13-21
Control of powdery mildew and other diseases by experimental fungicides and mixed schedules on Idared apple, 2015. (Tables 14-17) .................................................................................. 22-26
Evaluation of mixed fungicide schedules for broad spectrum disease control on Stayman and Idared, apples, 2015. (Tables 18-23) ........................................................................................... 27-33
Disease control by fungicides first applied for after-infection scab control on Fuji apple, 2015. (Tables 24-26) ............................................................................................ 34-37
Scab and broad spectrum disease control by fungicides first applied at late bloom on Fuji apple, 2015. (Tables 27-29) .................................................................................... 38-41
Evaluation of experimental and registered cover spray fungicide combinations for disease control on York apple, 2015. (Tables 30 and 31) .............................................. 42-44
Disease control and phytotoxicity by copper/Double Nickel treatments on Redhaven peach, 2015. (Tables 32 and 33) .................................................................................... 45-47
Evaluation of Cueva/Double Nickel treatments on Loring peach and Redgold nectarine, 2015 (Tables 33-36) ....................................................................................... 48-49

114
Efficacy and phytotoxicity of biopesticides for the control of fireblight on Gala apple, 2015.
Sixteen treatments were compared for fireblight blossom blight control and fruit finish effects. Treatments included a non-treated, non-inoculated control (Trt #0) and a non-treated inoculated control (Trt #1). Treatments #0-9 were included as part of an IR-4 Biopesticide protocol. These treatment schedules involved selected biopesticide products allowable for organic apple production. Biopesticide products included a yeast (Blossom Protect, Aureobasidium pullulans strains DSM14940 and DSM 14941), three bacterial products (Bloomtime, Pantoea agglomerans, strain E325; Serenade Opti, Bacillus subtilis QST713 strain; Double Nickel LC, Bacillus amyloliquefaciens strain D747) and a bacteriophage (Fire Quencher). A copper product (Cueva, copper octanoate) was included in several IR-4 treatments as well as some privately supported treatments (#10-14). Conventional production antibiotic standards included streptomycin (Firewall) and oxytetracycline (FireLine). The test was established on 14-yr-old trees in four randomized blocks using single-tree replications. The goal was to select treatment days according to the protocol with an inoculation day to be the day before a relatively warm day, which would be as favorable for natural infection as possible. Treatments were applied dilute to run-off in the morning of: 18 Apr (Pk, Pink, trts #10 & 11 only); 22 Apr (early bloom, B1, trts #2-16); 27 Apr (mid-bloom, B2, trts #2-16); 29 Apr (late-bloom, B3, trts #2-16); 4 May (PF, petal fall, trts #2-16). Two selected branches per tree, each with about 25 blossom clusters, were inoculated by spraying to wet with a bacterial suspension containing 1X10⁶ Erwinia amylovora cells/ml two hours after the morning application 29 Apr. Infection data are based on counts of number of blossom clusters with petals present on the inoculated branches at the time of inoculation. A cluster was rated as infected if it had at least one blossom with any fire blight symptoms on 15 May. Cover spray fungicide (Captan 80WDG 3 lb/A) was applied to the entire test area with an airblast sprayer 24 Jun, 9 Jul, 23 Jul, and 6 Aug. Conventional maintenance insecticides were applied with an airblast sprayer to the entire test block as needed.
Inoculation resulted in strong fire blight test conditions. The conventional streptomycin standard (Trt #15, Firewall) performed as expected under these conditions, with good suppression of cluster infection compared to the non-treated, inoculated control (#1, Table 1). Several biopesticide products also contributed to significant (p=0.05) suppression of fire blight infection of flower clusters, including the straight schedule of Blossom Protect (#3) and the sequential combination schedule of Serenade Opti/Cueva (#9). Straight schedules of Fire Quencher (#2), Bloomtime (#5), and Double Nickel (#10) did not give significant control. Cueva gave significant control at the 1.5 pt rate but not at 1.0 pt per 100 gal; however the combination of Cueva 1 pt + Double Nickel (#13, as well as Cueva 1.5 pt rate in #14) did give significant control. All treatments gave significant suppression of scab lesions, with Blossom Protect and Cueva + Double Nickel providing the most suppression. No treatment significantly (p=0.05) increased the russet or opalescence rating compared to non-treated trees; however, Cueva 1.5 pt and Fire Quencher/Bloomtime significantly reduced the percentage of fruit in the X-Fancy USDA grade for russet.
APPLE (Malus domestica ‘Fulford Gala’) K. S. Yoder, A. E. Cochran II, Fireblight; Erwinia amylovora W. S. Royston, Jr., and S. W. Kilmer Scab Venturia inaequalis Virginia Tech Ag. Research & Ext. Center 595 Laurel Grove Road Winchester, VA 22602

115
Table 1. Suppression of fire blight blossom blight and scab, and fruit finish ratings on Gala apple. 2015. Virginia Tech AREC, Winchester.
Timing Fire blight Scab Fruit finish ratings Bloom app. # % clusters % lesions Finish ratings (0-5)* USDA grade for russet** Treatment and rate/100 gal Pk 1 2 3 PF infected control / fruit russet opalescence % X-Fancy % X-Fcy/Fcy0 No treatment-no inoculation -- -- -- -- -- 6.8a -- 33 d 2.1ab 1.7a 75ab 91a 1 No treatment- inoculated with #2-16 -- -- -- -- -- 65.4 fg -- 29 cd 1.8a 1.4a 74ab 90a 2 Fire Quencher 8 fl oz -- X X X X 68.5g -4.7 21 a-c 2.2ab 1.3a 58a-c 86a 3 Blossom Protect 5 oz + Buffer Protect 35 oz -- X X X X 41.6c-e 36.4 18 a 2.3ab 1.5a 49a-c 82a 4 Cueva 1.5 pt -- X X X X 27.0bc 58.7 22 a-c 2.5ab 1.8a 39c 79a 5 Bloomtime 1.3 oz -- X X X X 59.1e-g 9.6 23 a-c 2.5ab 1.9a 52a-c 72a 6 Blossom Protect 5 oz + Buffer Protect 35 oz
Fire Quencher 8 fl oz -- X
-- X--
--X
--X
41.5c-e 36.5 21 ab 2.2ab 1.8a 61a-c 83a
7 Fire Quencher 8 fl oz Cueva 1.5 pt
-- X--
X--
--X
--X
53.6d-g 18.0 20 ab 2.3ab 1.4a 55a-c 82a
8 Fire Quencher 8 fl oz Bloomtime 1.3 oz
-- X--
X--
--X
--X
64.6 fg 1.2 27 b-d 2.7b 1.9a 41c 62a
9 Serenade Opti 5 oz Cueva 1.5 pt
-- X--
X--
--X
--X
35.8cd 45.3 21 a-c 2.2ab 2.0a 56a-c 88a
10 Double Nickel LC 8 fl oz X X X X X 60.2e-g 8.0 21 ab 1.9ab 1.1a 66a-c 91a
11 Double Nickel LC 8 fl oz FireWall 6 oz
X--
--X
X--
X
X30.2bc 53.8 20 ab 1.7a 1.3a 78a 93a
12 Cueva 1 pt X X X X 54.8d-g 16.2 21 a-c 2.4ab 1.5a 47bc 66a 13 Cueva 1 pt + Double Nickel LC 8 fl oz X X X X 42.6c-e 34.9 18 a 2.5ab 1.9a 54a-c 70a 14 Cueva 1.5 pt + Double Nickel LC 8 fl oz X X X X 46.0c-f 29.7 19 a 2.1ab 1.7a 64a-c 86a 15 FireWall 6 oz X X X X 15.5ab 76.3 22 a-c 2.1ab 1.6a 59a-c 86a 16 FireWall 6 oz + FireLine 6 oz X X X X 32.3bc 50.6 21 a-c 2.5ab 1.8a 52a-c 71a Mean separation by Waller-Duncan K-ratio t-test (p=0.05). Four single-tree replications. Dilute rates based on 400 gal/A.
Treatments applied dilute to runoff with a single nozzle handgun as follows: 18 Apr (Pink, trts #10 & 11 only); 22 Apr (early bloom, B1, all treatments); 27 Apr (mid-bloom, B2, trts #2-16); 29 Apr (late-bloom, B3, trts #2-16); 4 May (PF, petal fall, trts #2-16).
Two selected branches per tree, each with about 25 blossom clusters, were inoculated by spraying to wet with a bacterial suspension containing 1X10⁶ Erwinia amylovora cells/ml two hours after a morning application 29 Apr. Infection data are based on counts of number of blossom clusters with petals present on the inoculated branch at the time of inoculation. A cluster was rated as infected if it had at least one blossom with any fire blight symptoms on 15 May.
* Fruit finish rated on a scale of 0-5 (0=perfect finish; 5=severe russet or opalescence).
** USDA grades after downgrading by russet presumed not to be caused by mildew.

116
APPLE (Malus domestica ‘Idared’) K. S. Yoder, A. E. Cochran II, W. S. Royston, Jr.,Fire blight; Erwinia amylovora S. W. Kilmer, M. A. Borden, and J.K. Repass Scab; Venturia inaequalis Virginia Tech Ag. Research & Extension Center 595 Laurel Grove Road Winchester, VA 22602
Suppression of fire blight blossom blight on Idared apple, 2015.
Treatments involving seven different products were compared to streptomycin (Firewall), alone and in integrated schedules, for blossom blight control and fruit finish effects. The test was established in four randomized blocks on 32-yr-old trees using single-tree replications with border rows between treatment rows. The test strategy was to make applications in the morning before inoculating in the evening in anticipation of a relatively warm day to follow. Treatments were applied to both sides of the tree with a Swanson Model DA-400 airblast sprayer at 100 gallons per acre: 15 Apr (Pink, #14 only); 20 Apr (early bloom, Bl 1, all treatments); 29 Apr (mid-bloom, Bl 2, treatments #1 and #3-16); 5 May (late bloom/petal fall, PF, all treatments). Four selected branches per tree, each with about 25 blossom clusters, were inoculated by spraying to wet with a bacterial suspension containing 1X10⁶ Erwinia amylovora cells/ml in the evenings of 20 Apr and 29 Apr. Trees were not inoculated after the third (late bloom/petal fall) application 5 May. Infection data were based on counts of number of blossom clusters present on the inoculated branch at the time of the first inoculation. A cluster was rated as infected if it had at least one blossom with any fire blight symptoms on 13 May. Maintenance insecticides were applied to the entire block with a commercial airblast sprayer. Scab and fruit finish were rated 4 Sep on 25-fruit samples harvested from each replicate tree 1 Sep.
Inoculation resulted in strong blossom blight test conditions. The streptomycin standard (Firewall), performed as expected under these conditions with significant suppression of cluster infection, not only by the one with the complete bloom application schedule (#1), but also the treatment (#2) that received only the early bloom and petal fall applications. However, treatment #2 was significantly less effective, indicating the importance of the mid-bloom application. With the exception of FireLine applied alone (#8), all treatments involving materials applied in various combinations, also gave various degrees of control. These included Serenade Optimum (applied alone, #3), Serenade Optimum + ProPhyt (#4), Serenade Optimum + ProPhyt alternated with FireWall (#5), FireWall alternated with Serenade Optimum + Regulaid (#6), or FireWall alternated with Serenade Optimum + ProPhyt (#7), and combinations of Actigard tank-mixed or alternated with FireLine. Actigard + Taegro (#13), BioPath +ProPhyt alternated with FireWall(#14), and two formulations of Kasumin (#15 and #16) also significantly suppressed blossom blight. Treatments #6 and #7 involving FireWall alternated with Serenade Optimum + Regulaid (#6) or FireWall alternated with Serenade Optimum + ProPhyt (#7), were significantly more effective than when the mid-bloom application was omitted from the FireWall schedule (#2), suggesting the benefit of including Serenade at the mid-bloom timing in the alternating program. Also, BioPath + ProPhyt (#14) performed similarly to Serenade (#5) in a rotation with FireWall positioned at mid-bloom.
Early season weather was very favorable for scab development during the treatment application period, with five primary scab infection periods and appearance of scab lesions about 27 Apr, followed by 11 more secondary scab periods to 3 Jun. Treatments involving Serenade Optimum + ProPhyt (#4) and BioPath + ProPhyt (#14), had significantly less fruit infected with scab than one other treatment, but were not significantly better than non-treated trees. No treatment significantly affected fruit finish compared to non-treated trees.

117
Table 2. Suppression of fire blight blossom blight and scab on Idared apple. 2015. Block 15. VT-AREC, Winchester. Fire blight Scab infection Fruit finish Bloom. # % clusters % % lesions ratings (0-5)* Treatment and rate/A Pk 1 2 PF infected control fruit /fruit russet opalescence 0 No treatment -- -- -- -- 85.9g -- 86ab 7.8a 1.5a 1.2a
1 FireWall 17 1.5 lb + Regulaid 1 pt/100gal -- X X X 47.8a 44 91ab 6.3a 1.5a 0.9a
2 FireWall 17 1.5 lb + Regulaid 1 pt/100gal -- X -- X 69.5ef 19 84ab 5.7a 1.5a 1.0a
3 Serenade Optimum 20 oz -- X X X 62.7b-f 27 85ab 6.0a 1.7a 1.2a
4 Serenade Optimum 20 oz + ProPhyt 2 qt -- X X X 68.6d-f 20 66a 2.9a 1.6a 1.3a
5 Serenade Optimum 20 oz + Regulaid 1 pt FireWall 17 1.5 lb + Regulaid 1 pt /100 gal
----
X --
--X
X--
64.8c-f 25 80ab 5.1a 1.6a 1.3a
6 FireWall 17 1.5 lb + Regulaid 1 pt/100 gal Serenade Optimum 20 oz + Regulaid 1 pt
----
X --
--X
X--
48.6ab 43 87ab 5.5a 1.3a 1.2a
7 FireWall 17 1.5 lb + Regulaid 1 pt /100 gal Serenade Optimum 20 oz + ProPhyt 2 qt
----
X --
--X
X--
52.9a-c 38 76ab 4.8a 1.8a 1.4a
8 FireLine 1 lb -- X X X 75.1 fg 13 85ab 5.6a 2.1a 1.6a
9 Actigard 50WG 2 oz + Regulaid 1 pt FireLine 17 1 lb + Regulaid 1 pt/100 gal
-- X --X
X 69.9ef 19 79ab 5.5a 1.5a 1.2a
10 Actigard 50WG 2 oz + FireLine 17 1 lb + Regulaid 1 pt/100 gal
-- X X X 70.0ef 19 81ab 6.2a 2.1a 1.5a
11 Actigard 50WG 1 oz + FireLine 17 1 lb + Regulaid 1 pt/100 gal
-- X X X 68.4d-f 20 76ab 5.2a 1.6a 1.5a
12 Actigard 50WG 2 oz + Regulaid 1 pt FireLine 17 1 lb + Regulaid 1 pt/100 gal
-- X --X
X 55.3a-d 36 91b 4.7a 1.3a 1.0a
13 Actigard 50WG 2 oz + Taegro ECO 5.2 oz + Kinetic 1 pt/100 gal
-- X X X 65.3c-f 24 77ab 4.5a 1.4a 1.2a
14 BioPath 1 qt BioPath 1 pt+ ProPhyt 2 qt FireWall 17 1.5 lb + Regulaid 1 pt/100 gal
X----
-- X --
----X
X--
60.2a-e 30 66a 3.4a 1.3a 1.2a
15 Kasumin 2L 2 qt + Regulaid 1 pt/100gal X X X 71.4ef 17 85ab 5.3a 1.6a 1.3a 16 Kasumin 8L 1 pt + Regulaid 1 pt/100gal X X X 58.0a-e 32 89ab 6.9a 1.4a 1.3a Mean separation by Waller-Duncan K-ratio t-test (p=0.05). Four single-tree replications with border rows between treatment rows. * Fruit finish rated on a scale of 0-5 (0=perfect finish; 5=severe russet or opalescence). Applied airblast at 100 gal / acre as follows: 15 Apr (Pink, #14 only); 20 Apr (early bloom, Bl 1, all trts); 29 Apr (mid-bloom, Bl 2, all trts except #2); 5 May (late bloom/petal fall, PF, all trts). Four selected branches per tree, each with about 25 blossom clusters, were inoculated by spraying to wet with a bacterial suspension containing 1X10⁶ Erwinia amylovora cells/ml in the evenings of 20 Apr and 29 Apr. Infection data were based on counts of number of blossom clusters present on the inoculated branch at the time of the first inoculation. A cluster was rated as infected if it had at least one blossom with any fire blight symptoms on 13 May.
118
APPLE (Malus domestica ‘Idared') K. S. Yoder, A. E. Cochran II, Fire blight; Erwinia amylovora W. S. Royston, Jr., S. W. Kilmer, Scab; Venturia inaequalis M. A. Borden, and J. Repass Fruit finish; russet, opalescence Virginia Tech Agr. Res. & Ext. Center 595 Laurel Grove Road Winchester, VA 22602
Early season timing of coppers and Regalia for fire blight and scab control on Idared apple, 2015.
Ten treatments were compared for fire blight blossom blight and scab suppression, and for potential fruit finish effects. The test was conducted on 28-yr-old Idared/M.111 trees in a randomized block design with four single-tree replicates separated by border rows. The test strategy was generally to make bloom applications in the morning before inoculating in the evening in anticipation of a relatively warm day to follow. Treatments were applied dilute to runoff with a single nozzle handgun at 300-400 psi as follows: 17 Apr (Pink, trts #2-10 only); 20 Apr (early bloom, B1, all treatments); 29 Apr (mid-bloom, B2, all treatments); 5 May (late bloom/petal fall, PF, all treatments); 23 May, (1st cover,1C, treatments #2-10 only). Four selected branches per tree, each with about 25 blossom clusters, were inoculated by spraying to wet with a bacterial suspension containing 1X10⁶ Erwinia amylovora cells/ml in the evenings of 20 Apr and 29 Apr. Trees were not inoculated after the fourth or fifth applications 5 May and 23 May. Infection data were based on counts of number of blossom clusters present on the inoculated branch at the time of the first inoculation. A cluster was rated as infected if it had at least one blossom with any fire blight symptoms on 18 May. Maintenance insecticides were applied to the entire block with a commercial airblast sprayer. Scab and fruit finish were rated 8 Sep on 25-fruit samples harvested from each replicate tree 2 Sep.
Inoculation resulted in strong fire blight test conditions. The streptomycin standard (Firewall), performed as expected under these conditions, with significant suppression of cluster infection. NU-COP 50DF 4 oz gave control almost equal to FireWall. Significant blossom blight suppression was also provided by NU-COP HB alone and with Double Nickel, Regalia 8 fl oz and Regalia 8 fl oz + Magna-Bon CS2005. Early season weather was naturally favorable for scab development during the treatment application period, with five primary scab infection periods and appearance of scab lesions about 27 Apr, followed by 11 more secondary scab periods to 3 Jun. All treatments significantly reduced scab incidence, with the most effective control by NU-COP related treatments. However, the NU-COP related treatments also significantly increased the amount of russet and opalescence, compared to non-treated fruit.

119
Table 3. Suppression of fire blight blossom blight and scab on Idared apple. 2015. Idared. Virginia Tech AREC, Winchester. Timing Fireblight Scab infection Fruit finish Bloom app. # % clusters % % lesions ratings (0-5)* Treatment and rate/100 gal Pk 1 2 PF 1C infected control fruit /fruit russet opalescence 0 No treatment -- -- -- -- -- 90.3d -- 98d 10.9e 1.5a 1.2a 1 FireWall 17 6 oz + Regulaid 1 pt -- X X X -- 48.1a 47 82c 4.5 b-d 1.7a 1.4ab 2 NU-COP 50DF 4 oz X X X X X 50.5a 44 26a 1.0a 3.0b 2.1bc 3 NU-COP HB 3 oz X X X X X 65.6ab 27 19a 0.6a 3.3b 1.6a-c 4 NU-COP HB 3 oz + Double Nickel LC 8 fl oz X X X X X 64.8ab 28 12a 0.3a 3.0b 2.1c 5 Regalia 8 fl oz X X X X X 77.7bc 14 76bc 4.2bc 1.7a 1.2a 6 Regalia 8 fl oz + Magna-Bon CS2005 4.5 fl oz X X X X X 78.5bc 13 73bc 3.9bc 1.8a 1.5a-c 7 Regalia 16 fl oz X X X X X 87.3cd 3 80c 5.4cd 1.7a 1.2a 8 Regalia 16 fl oz + CS2005 4.5 fl oz X X X X X 79.6b-d 12 59b 2.3ab 1.9a 1.4a-c 9 Magna-Bon CS2005 4.5 fl oz X X X X X 82.7b-d 8 83c 6.6d 2.0 a 1.7a-c 10 CS2005 4.5 fl oz + Double Nickel LC 8 fl oz X X X X X 85.6cd 5 84c 5.7cd 1.9a 1.7a-c
Mean separation by Waller-Duncan K-ratio t-test (p=0.05). Four single-tree replications with border rows between treatment rows.
* Fruit finish rated on a scale of 0-5 (0=perfect finish; 5=severe russet or opalescence).
Applied dilute to runoff with a single nozzle handgun as follows: 17 Apr (Pink, trts #2-10 only); 20 Apr (early bloom, B1, all trts); 29 Apr (mid-bloom, B2, all trts); 5 May (late bloom/petal fall, B3/PF, all trts); 23 May, (1st cover,1C, treatments #2-10 only).
Four selected branches per tree, each with about 25 blossom clusters, were inoculated by spraying to wet with a bacterial suspension containing 1X10⁶ Erwinia amylovora cells/ml in the evenings of 20 Apr and 29 Apr. Trees were not inoculated after the fourth and fifth applications 5 May and 23 May. Infection data were based on counts of number of blossom clusters present on the inoculated branch at the time of the first inoculation. A cluster was rated as infected if it had at least one blossom with any fire blight symptoms on 18 May.

120
APPLE (Malus domestica ‘Gala’) K. S. Yoder, A. E. Cochran II, Scab; Venturia inaequalis W. S. Royston, Jr., S. W. Kilmer, Cedar-apple rust; Gymnosporangium juniperi-virginianae M. A. Borden, and J.K. Repass Quince rust; Gymnosporangium clavipes Virginia Tech Ag. Res. & Ext. Center Sooty blotch; disease complex 595 Laurel Grove Road Fly speck; Zygophiala jamaicensis Winchester, VA 22602 Rots (unspecified) White rot; Botryosphaeria dothidea Bitter rot; Colletotrichum spp. Alternaria rot; Alternaria spp. Fruit finish
Shoot blight suppression, summer disease control, and fruit finish, by post-bloom copper applications on Gala apple, 2015.
Five treatments were compared for shoot blight suppression, summer disease control and fruit finish effects on 14-yr-old Gala/M.26 trees. The test was conducted in a randomized block design with four single-tree replicates. No fungicides were applied before the treatment series began at late petal fall. Treatments were applied dilute to run-off as 1st-7th covers (1C-7C): 18 May, 29 May, 12 Jun, 25 Jun, 9 Jul, 23 Jul, and 13 Aug. The inoculation approach in this shoot blight test was to inoculate three actively-growing shoot tips near the top of each test tree to favor secondary spread under the treatment series. Three shoot tips per tree were inoculated 14 May 2015 by dipping scissors in a suspension containing 1X10⁶ streptomycin-sensitive E. amylovora cells/ml, then cutting across the shoot tip. All other diseases developed from inoculum naturally present in the test area. Shoot blight strikes were counted 7 Aug. Fruit data are based on 25-fruit sample per rep harvested from each of four single-tree reps 26 Aug and placed in cold storage. Fruit were moved to ambient warm temperatures with initial fruit evaluation 1 Sep and final evaluation for storage rots after 8 days incubation at ambient temperatures 71-92F. Rally 1.0 oz per 100 gal was applied to the entire test block to inhibit earlier cedar-apple and quince rust infection. Maintenance materials applied to the entire test block with a commercial airblast sprayer during the test period included: Admire Pro, Altacor, Assail, Asana XL, BioCover MLT, Calypso, Delegate, Imidan, and Lannate LV.
Post-inoculation weather was not very favorable for secondary shoot tip infection from inoculations in the tops of trees, and there was no significant difference in the number of shoot blight strikes per tree (Table 4). No fungicides had been applied in this test block previously, and scab lesions from 7-10 Apr infection periods began to appear the week of Apr 27 and there were five additional secondary infection periods before the first test application and 11 more in the month following the first application. Under this severe disease pressure and delayed application conditions, there was no significant control of scab incidence or lesions per fruit. Rust disease incidence was also light and variable, following the Rally application 18 May, but it is likely that most of the scab was resistant to SI fungicides. Under moderate sooty blotch/flyspeck (SBFS) and rot pressure, Cueva 2 pt + Double Nickel (Trt #3) provided control of sooty blotch and bitter rot significantly better than Cueva 1 pt + Double Nickel (Trt #1). This was comparable to Captan (Trt #5) and almost as strong as Captan for flyspeck control. Cueva 1 pt + Double Nickel (Trt #1) gave significant control of sooty blotch/flyspeck (SBFS) and bitter rot; however this combination had significantly more SBFS and bitter rot than Cueva 1 pt alone, indicating a reduction in control by including Double Nickel. A treatment sequence that alternated Cueva 1 pt + Double Nickel with Captan and ended with three applications of OSO (Trt #4) was slightly weaker on SBFS than Captan (#5) and Cueva 2 pt + Double Nickel (Trt #3), and because of higher incidence of Alternaria and white rots, was also significantly weaker in the “any rot” category. Under these test conditions, there was no significant positive or negative fruit finish effect by any treatment (Table 4).

121
Table 4. Shoot blight and early disease suppression and fruit finish on Gala apples, 2015. Virginia Tech AREC, Winchester.
Shoot % fruit infected or scab lesions/fruit at harvest Fruit finish ratings ((0-5)* blight strikes Scab Cedar- Quince Bitter Russet Opalescence Treatment and rate/ 100 gal dilute Timing /tree % fruit les/fruit apple rust rust rot rating rating 0 Non-treated control --- 3.8 a 96a 9.4a 4a 6 a 4a 1.6a 1.4a 1 Cueva 1 pt + Double Nickel LC 8 fl oz 1C-7C 1.8 a 87a 6.2a 3 a 0 a 2a 1.5a 1.5a 2 Cueva 1 pt 1C-7C 2.5 a 89a 7.5a 2a 1 a 5a 1.7a 1.7a 3 Cueva 2 pt + Double Nickel LC 8 fl oz 1C-7C 2.0 a 85a 7.6a 8 a 0 a 0a 1.0a 1.2a 4 Cueva 1 pt + Double Nickel LC 8 fl oz
Captan 80WDG 7.5 oz OSO 5%SC 6.5 fl oz + B-1956 8 fl oz
1C, 3C2C, 4C5C-7C
4.5 a 93a 8.9a 0a 1 a 5a 1.7a 1.6a
5 Apogee 6 oz + Choice 1 qt + LI-700 1 pt + FireWall 8 oz + Captan 80WDG 7.5 oz Captan 80WDG 7.5 oz
1C
2C-7C 1.0 a 89a 6.7a 3a 0 a 1a 1.4a 1.0a
Mean separation by Waller-Duncan K-ratio t-test (p=0.05). Dilute rates based on 400 gpa. Four single-tree reps. Three shoot tips per tree inoculated 14 May. Fire blight strikes per tree counted 7 Aug ‘15. Counts of 25-fruit samples per tree picked 1 Sep. Treatment dates: First-7th covers (1C-7C): 18 May, 29 May, 12 Jun, 25 Jun, 9 Jul, 23 Jul, and 13 Aug. * Fruit finish rated on a scale of 0-5 (0=perfect finish; 5=severe russet). Table 5. Summer diseases and post-harvest rot suppression on Gala apple, 2015.
% fruit or fruit area infected Rot incidence following 8 days’ incubation at 71-92F* Sooty blotch Flyspeck any Bitter White Alternaria Treatment and rate/ 100 gal dilute Timing fruit % area fruit % area rot rot rot Rot
0 Non-treated control --- 100e 14.3e 100d 16.5 f 49 b 38c 0a 18a 1 Cueva 1 pt + Double Nickel LC 8 fl oz 1C-7C 54d 5.2d 82c 7.8e 42 b 34bc 5b 4a 2 Cueva 1 pt 1C-7C 31c 2.4c 72bc 4.9d 16 a 8a 1ab 8a 3 Cueva 2 pt + Double Nickel LC 8 fl oz 1C-7C 0a 0a 36a 2.1b 10 a 8a 1ab 2a 4 Cueva 1 pt + Double Nickel LC 8 fl oz
Captan 80WDG 7.5 oz OSO 5%SC 6.5 fl oz + B-1956 8 fl oz
1C, 3C2C, 4C5C-7C 5b 0.3b 37ab 2.6c 42 b 15ab 11b 15a
5 Apogee 6 oz + Choice 1 qt + LI-700 1 pt + FireWall 8 oz + Captan 80WDG 7.5 oz Captan 80WDG 7.5 oz
1C
2C-7C 0a 0a 16a 0.9a 13 a 12a 1ab 1a Mean separation by Waller-Duncan K-ratio t-test (p=0.05). Four single-tree replications. a Treatments applied as: First-7th covers (1C-7C): 18 May, 29 May, 12 Jun, 25 Jun, 9 Jul, 23 Jul, and 13 Aug.
* Postharvest fruit counts are means of 25-fruit samples picked from each of four single-tree reps 26 Aug and placed into cold storage until the initial fruit evaluation 1 Sep; fruit were incubated and again rated after 8 days at ambient temperatures 71-92F (mean 82.2F).

122
APPLE (Malus domestica ‘Golden Delicious’, ‘Idared’, ‘York’) K. S. Yoder, A. E. Cochran II, Scab; Venturia inaequalis W. S. Royston, Jr., S. W. Kilmer, Powdery mildew; Podosphaera leucotricha A.G.F. Engelman, M. A. Borden, Cedar-apple rust; Gymnosporangium juniperi-virginianae and J.K. Repass Quince rust; Gymnosporangium clavipes Virginia Tech Ag. Res. & Ext. Center Sooty blotch; disease complex 595 Laurel Grove Road Flyspeck; Zygophiala jamaicensis Winchester, VA 22602 Brooks spot; Mycosphaerella pomi Rots (unspecified) Bitter rot; Colletotrichum spp. White rot; Botryosphaeria dothidea Alternaria rot; Alternaria spp. Fruit finish
Disease control by experimental and registered fungicides and mixtures on Golden Delicious, Idared, and York
Imperial apples, 2015.
Seventeen experimental or registered combination treatment schedules were compared on three-tree sets of 15-yr-old trees. The test was conducted in a randomized block design with four replicates separated by non-treated border rows. Test rows had been non-treated border rows in 2014, which allowed mildew inoculum pressure to stabilize on 2015 test trees. Fungicide treatments were applied to both sides of the tree on each indicated application date with a Swanson Model DA-400 airblast sprayer at 100 gal/A as follows: 15 Apr (App. # 1, pink); 25 Apr (App. # 2, bloom); 6 May (App. # 3, PF); Apps. #4-10: 20 May, 5 Jun, 18 Jun, 2 Jul, 16 Jul, 31 Jul, 13 Aug. Inoculum placed over each Golden Delicious test tree included cedar rust galls, wild blackberry canes with the sooty blotch and flyspeck fungi, and bitter rot mummies 27 Apr. Other diseases developed from inoculum naturally present in the test area, including cedar-apple rust inoculum from red cedars in the vicinity. Maintenance sprays, applied to the entire test block included Admire Pro, Altacor, Assail, Asana XL, BioCover MLT, Calypso, Delegate, Imidan, Lannate LV, and Movento. Foliar data are from counts of ten shoots per replicate tree: 22 Jun (Golden Delicious) and 23 Jul (Idared), and fruit data represent postharvest counts of 25 fruit per replicate tree. Idared fruit were sampled 22 Sep, placed in cold storage until 6 Oct, moved to ambient temperatures (54-84ºF, mean 71.0ºF) and rated 14 Oct and 27 Oct. Golden Delicious fruit were sampled 25 Sep, held in cold storage 21 days then moved 16 Oct to ambient temperatures (54-81ºF, mean 70.9ºF) and rated 26 Oct and 3 Nov. York fruit were sampled 6 Oct, placed in cold storage until 16 Oct moved to ambient temperatures (54-81ºF, mean 70.9ºF) and rated 29 Oct and 3 Nov. Percentage data were converted by the square root arcsin transformation for statistical analysis. The early season was favorable for development of powdery mildew, scab, and cedar-apple rust. Mildew conidia were present 6 Apr, and there were 35 dry weather “mildew infection days” from 6 Apr until mid-June, resulting in moderate infection of non-treated trees (Table 6). Merivon (Trts #6 and 7) had a strong suppressive effect on primary mildew development, and this generally carried over to excellent control on leaves, leaf area, and fruit. Treatments that involved Luna Tranquility or Luna Sensation rotated with Topguard (#3 and 4), Vivando (#8), and IL-54111 (#12) also had excellent control of mildew on leaves, leaf area, and fruit, although their primary ratings were lower than with Merivon. Treatments #1 and 2 were probably impacted by SI resistance, and treatments #14-17 lacked effective control because Vangard was used alone in the first application at pink. The first scab infection period occurred 7 Apr and primary lesions were present during a secondary period 30 Apr. This was followed by 19 more secondary scab infection periods through June. Scab resistant to SI and QoI fungicides has been present in the test area for several years, and this probably impacted control by Rally (#1 and 2) and Luna Sensation/Topguard (#3). Treatments #14-17, which began the season with Vangard, then rotated to Inspire Super / Aprovia, gave the best scab control overall (Table 7). There were ten cedar-apple rust infection periods from 7 Apr to 27 May, and the treatments that included rotations with SI fungicides generally gave the best rust control (Table 8). General “leaf spot” symptoms were likely related to partially inhibited rust lesions. Defoliation due to Golden Delicious leaf blotch was most suppressed by schedules that included mancozeb and Ziram (Table 8), but schedules involving only Vivando, Kenja, or IL-54111 had significantly more defoliation. Sooty blotch and flyspeck (SBFS) developed to nearly 100% on non-treated fruit of all cultivars (Table 9). The best SBFS control overall was with treatment #15 which had Inspire Super in applications 4-6, followed by Aprovia before ending with three applications of Captan + Ziram. Parallel treatments of Merivon + Manzate (#7) or Merivon + Captan/Captan + Ziram (#6) were also generally effective, as were schedules ending with two applications of Luna Sensation + Captan (#3-5). Supplementing Captan + Ziram with Indar in applications 8-10 significantly reduced sooty blotch incidence (#2 vs. #1). Treatments involving Kenja (#9-11) and IL-54111 (#12) also gave control under heavy SBFS pressure, but showed some weakness compared to more effective treatments. All treatments gave excellent control of Brooks spot under moderate disease pressure (Table 11). A mixture of postharvest rots included mostly bitter rot and some white rot as well as lower incidence of Alternaria (Tables 10-12). Control of rots varied somewhat with cultivar, but overall, the most effective treatments were #3-5, (ending with two applications of Luna Sensation + Captan), #6 (Merivon + Captan/Captan + Ziram), and #7 (Merivon + Manzate/Captan + Ziram). IL-54111 also provided good rot control on Golden Delicious (Table 10) and Idared (Table 11). Many treatments significantly reduced russetting or opalescence of one or more cultivars (Table 13); only treatment #16 had a significant deleterious effect with increased russetting and opalescence of York, but that treatment improved finish of Idared and Golden Delicious.

123
Table 6. Mildew control on Idared and Golden Delicious apples, 2015. Block 30, Virginia Tech AREC.
Mildew, % leaves, lf area or fruit infected Appli- Idared (%) Golden Delicious cation Primary lvs leaf % % lvs % leaf Treatment and rate/acre number rating* Inf. area fruit Inf. area 0 Non-treated control --- 1.9 h 37 gh 7 h 35 h 32 i 3 e 1 Rally 40WSP 5 oz + Manzate Pro-Stick 75DF 3 lb
Captan 80WDG 30 oz + Ziram 76DF 3 lb 1-7 8-10
4.9 c-e 25 d-f 4 d-g 11 cd 16 f-h 2 de
2 Rally 40WSP 5 oz + Manzate Pro-Stick 75DF 3 lb Indar 8 fl oz + Captan 80WDG 30 oz + Ziram 76DF 3 lb
1-7 8-10
4.8 c-e 31 f-h 4 e-h 12 c-f 23 hi 2 e
3 Luna Sensation 5 fl oz + Manzate Pro-Stick 75DF 3 lb Topguard 1.04SC 13 fl oz + Manzate 75DF 3 lb Indar 8 fl oz + Manzate Pro-Stick 75DF 3 lb Indar 8 fl oz + Captan 80WDG 30 oz Luna Sensation 5 oz + Captan 80WDG 30 oz
1 & 4 2, 3, 5
6 7-8 9-10
6.4 b 7 bc 1 a-c 4 ab 3 bc 1 bc
4 Luna Tranquility SC 11.2 fl oz + Manzate 75DF 3 lb Topguard 1.04SC 13 fl oz + Manzate Pro-Stick 75DF 3 lbIndar 8 fl oz + Manzate Pro-Stick 75DF 3 lb Indar 8 fl oz + Captan 80WDG 30 oz Luna Sensation 5 fl oz + Captan 80WDG 30 oz
1 & 4 2, 3, 5
6 7-8 9-10
5.9 bc 9 bc 2 b-d 1 ab 7 c-e 2 c-e
5 Luna Tranquility SC 11.2 fl oz + Manzate 75DF 3 lb Serenade Optimum 20 oz + ProPhyt 2 qt Topguard 1.04SC 13 fl oz + Manzate Pro-Stick 75DF 3 lbIndar 8 fl oz + Manzate Pro-Stick 75DF 3 lb Indar 8 fl oz + Captan 80WDG 30 oz Luna Sensation 5 fl oz + Captan 80WDG 30 oz
1 & 4 2-3 5 6
7-8 9-10
5.5 b-d 3 ab 1 ab 2 ab 5 bc 1 cd
6 Merivon 4 fl oz + Captan 80WDG 2 lb + Silwet L-77 114 mlCaptan 80WDG 30 oz + Ziram 76DF 3 lb
1-7 8-10
9.2 a 1 a <1 a 0 a <1 a <1 a
7 Merivon 4 fl oz + Manzate 3 lb + Silwet 114 ml/100 gal Captan 80WDG 30 oz + Ziram 76DF 3 lb
1-7 8-10
8.3 a 1 a <1 a 0 a 2 ab <1 b
8 Vivando 2.5SC 15 fl oz + Silwet L-77 114 ml/100 gal Captan 80WDG 30 oz + Ziram 76DF 3 lb
1-7 8-10
4.6 d-f 4 ab <1 ab 13 c-e 2 ab <1 b
9 Kenja 400SC 12.5 fl oz + Silwet L-77 12.8 fl oz/100 gal 1-10 3.4 g 19 d-f 3 d-g 27 gh 6 cd 2 c-e 10 Kenja 400SC 12.5 fl oz + Manzate Pro-Stick 75DF 3 lb +
Silwet L-77 12.8 fl oz/100 gal 1-10 4.1 e-g 18 de 3 c-f 5 bc 5 bc 1 bc
11 Kenja 400SC 9.4 fl oz + IB18220 3.6SC 6.34 fl oz + Silwet L-77 12.8 fl oz/100 gal 1-10
3.5 g 15 cd 3 b-e 17 d-g 4 bc 1 bc
12 IL-54111 475SC 13.7 fl oz + Silwet L-77 12.8 fl oz/100 gal 1-10 3.9 e-g 9 bc 2 b-d 10 c-e 2 ab <1 b 13 Manzate Pro-Stick 75DF 3 lb
Captan 80WDG 30 oz + Ziram 76DF 3 lb 1-4 5-10
3.7 fg 40 h 7 h 17 d-g 21 gh 3 e
14 Vangard 75WG 5 oz Inspire Super 2.82EW 12 fl oz Aprovia 0.83EC 7 fl oz Captan 80WDG 30 oz + Ziram 76DF 3 lb
1 4 & 7 5-6 8-10
3.4 g 31 f-h 5 gh 21 e-h 12 d-f 2 de
15 Vangard 75WG 5 oz Aprovia 0.83 7 fl oz Inspire Super 2.82EW 12 fl oz Captan 80WDG 30 oz + Ziram 76DF 3 lb
1 2, 7
4,5,6 8-10
3.8 e-g 26 e-g 4 e-h 6 bc 10 d-f 2 de
16 Vangard 75WG 5 oz Manzate 75DF 3 lb + Captan 80WDG 30 oz Inspire Super 2.82EW 12 fl oz Aprovia 0.83EC 7 fl oz Captan 80WDG 30 oz + Ziram 76DF 3 lb
1 2, 3 4, 7 5-6 8-10
4.1 e-g 27 e-g 6 f-h 9 cd 13 de 2 e
17 Vangard 75WG 5 oz Inspire Super 2.82EW 12 fl oz Fontelis 1.67SC 16 fl oz + Oil 1 qt Captan 80WDG 30 oz + Ziram 76DF 3 lb
1 2, 7
4,5,6 8-10
3.6 fg 27 e-h 5 f-h 25 f-h 14 fg 3 e
Mean separation by Waller-Duncan K-ratio t-test (p=0.05). Four reps, 10 shoots/tree 22 Jun (G. Delicious) or 23 Jul (Idared), or harvest counts of 25 Idared fruit per tree picked 22 Sep. * Suppressive effect rated on six primary mildew shoots/tree 2 Jun, scale: 1-10 (1= none; 10= excellent effect). Treatments applied at 100 gpa to both sides of the tree row on each application date: 15 Apr (App. # 1, pink); 25 Apr (App. # 2, bloom); 6 May (App. # 3, PF); Apps. 4-10: 20 May, 5 Jun, 18 Jun, 2 Jul, 16 Jul, 31 Jul, 13 Aug.
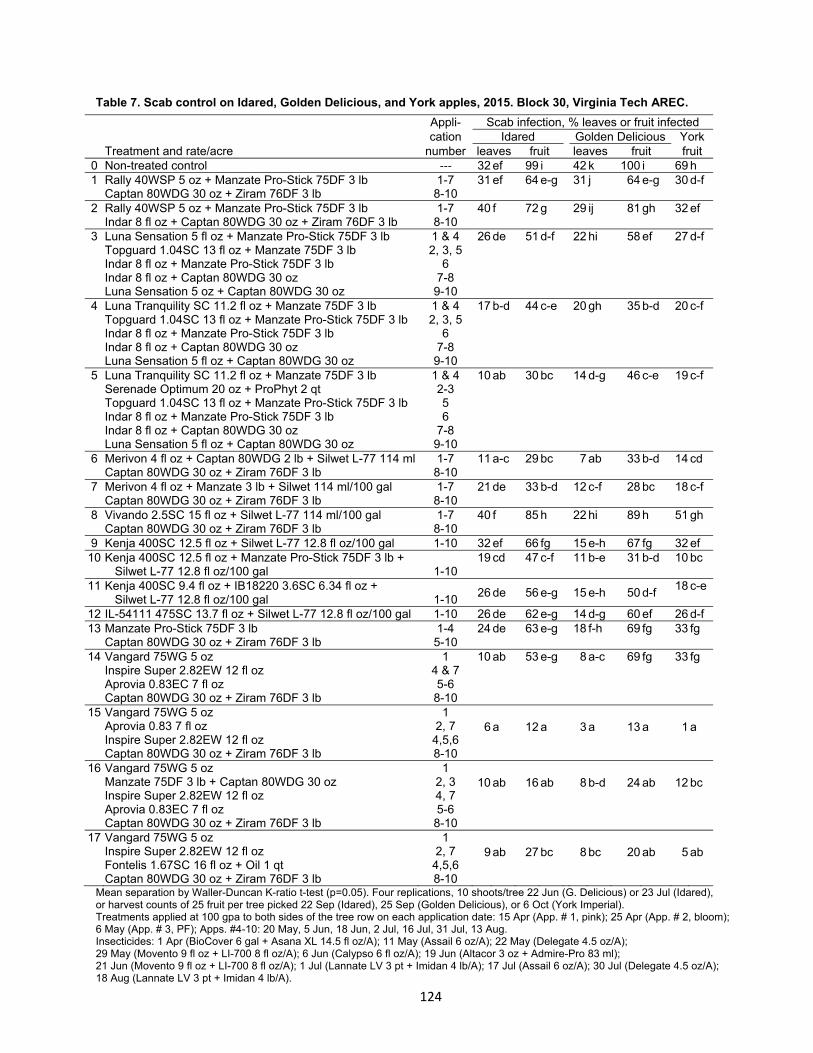
124
Table 7. Scab control on Idared, Golden Delicious, and York apples, 2015. Block 30, Virginia Tech AREC.
Appli- Scab infection, % leaves or fruit infected cation Idared Golden Delicious York Treatment and rate/acre number leaves fruit leaves fruit fruit 0 Non-treated control --- 32 ef 99 i 42 k 100 i 69 h 1 Rally 40WSP 5 oz + Manzate Pro-Stick 75DF 3 lb
Captan 80WDG 30 oz + Ziram 76DF 3 lb 1-7 8-10
31 ef 64 e-g 31 j 64 e-g 30 d-f
2 Rally 40WSP 5 oz + Manzate Pro-Stick 75DF 3 lb Indar 8 fl oz + Captan 80WDG 30 oz + Ziram 76DF 3 lb
1-7 8-10
40 f 72 g 29 ij 81 gh 32 ef
3 Luna Sensation 5 fl oz + Manzate Pro-Stick 75DF 3 lb Topguard 1.04SC 13 fl oz + Manzate 75DF 3 lb Indar 8 fl oz + Manzate Pro-Stick 75DF 3 lb Indar 8 fl oz + Captan 80WDG 30 oz Luna Sensation 5 oz + Captan 80WDG 30 oz
1 & 4 2, 3, 5
6 7-8 9-10
26 de 51 d-f 22 hi 58 ef 27 d-f
4 Luna Tranquility SC 11.2 fl oz + Manzate 75DF 3 lb Topguard 1.04SC 13 fl oz + Manzate Pro-Stick 75DF 3 lbIndar 8 fl oz + Manzate Pro-Stick 75DF 3 lb Indar 8 fl oz + Captan 80WDG 30 oz Luna Sensation 5 fl oz + Captan 80WDG 30 oz
1 & 4 2, 3, 5
6 7-8 9-10
17 b-d 44 c-e 20 gh 35 b-d 20 c-f
5 Luna Tranquility SC 11.2 fl oz + Manzate 75DF 3 lb Serenade Optimum 20 oz + ProPhyt 2 qt Topguard 1.04SC 13 fl oz + Manzate Pro-Stick 75DF 3 lbIndar 8 fl oz + Manzate Pro-Stick 75DF 3 lb Indar 8 fl oz + Captan 80WDG 30 oz Luna Sensation 5 fl oz + Captan 80WDG 30 oz
1 & 4 2-3 5 6
7-8 9-10
10 ab 30 bc 14 d-g 46 c-e 19 c-f
6 Merivon 4 fl oz + Captan 80WDG 2 lb + Silwet L-77 114 mlCaptan 80WDG 30 oz + Ziram 76DF 3 lb
1-7 8-10
11 a-c 29 bc 7 ab 33 b-d 14 cd
7 Merivon 4 fl oz + Manzate 3 lb + Silwet 114 ml/100 gal Captan 80WDG 30 oz + Ziram 76DF 3 lb
1-7 8-10
21 de 33 b-d 12 c-f 28 bc 18 c-f
8 Vivando 2.5SC 15 fl oz + Silwet L-77 114 ml/100 gal Captan 80WDG 30 oz + Ziram 76DF 3 lb
1-7 8-10
40 f 85 h 22 hi 89 h 51 gh
9 Kenja 400SC 12.5 fl oz + Silwet L-77 12.8 fl oz/100 gal 1-10 32 ef 66 fg 15 e-h 67 fg 32 ef 10 Kenja 400SC 12.5 fl oz + Manzate Pro-Stick 75DF 3 lb +
Silwet L-77 12.8 fl oz/100 gal 1-10 19 cd 47 c-f 11 b-e 31 b-d 10 bc
11 Kenja 400SC 9.4 fl oz + IB18220 3.6SC 6.34 fl oz + Silwet L-77 12.8 fl oz/100 gal 1-10
26 de 56 e-g 15 e-h 50 d-f 18 c-e
12 IL-54111 475SC 13.7 fl oz + Silwet L-77 12.8 fl oz/100 gal 1-10 26 de 62 e-g 14 d-g 60 ef 26 d-f 13 Manzate Pro-Stick 75DF 3 lb
Captan 80WDG 30 oz + Ziram 76DF 3 lb 1-4 5-10
24 de 63 e-g 18 f-h 69 fg 33 fg
14 Vangard 75WG 5 oz Inspire Super 2.82EW 12 fl oz Aprovia 0.83EC 7 fl oz Captan 80WDG 30 oz + Ziram 76DF 3 lb
1 4 & 7 5-6 8-10
10 ab 53 e-g 8 a-c 69 fg 33 fg
15 Vangard 75WG 5 oz Aprovia 0.83 7 fl oz Inspire Super 2.82EW 12 fl oz Captan 80WDG 30 oz + Ziram 76DF 3 lb
1 2, 7
4,5,6 8-10
6 a 12 a 3 a 13 a 1 a
16 Vangard 75WG 5 oz Manzate 75DF 3 lb + Captan 80WDG 30 oz Inspire Super 2.82EW 12 fl oz Aprovia 0.83EC 7 fl oz Captan 80WDG 30 oz + Ziram 76DF 3 lb
1 2, 3 4, 7 5-6 8-10
10 ab 16 ab 8 b-d 24 ab 12 bc
17 Vangard 75WG 5 oz Inspire Super 2.82EW 12 fl oz Fontelis 1.67SC 16 fl oz + Oil 1 qt Captan 80WDG 30 oz + Ziram 76DF 3 lb
1 2, 7
4,5,6 8-10
9 ab 27 bc 8 bc 20 ab 5 ab
Mean separation by Waller-Duncan K-ratio t-test (p=0.05). Four replications, 10 shoots/tree 22 Jun (G. Delicious) or 23 Jul (Idared), or harvest counts of 25 fruit per tree picked 22 Sep (Idared), 25 Sep (Golden Delicious), or 6 Oct (York Imperial). Treatments applied at 100 gpa to both sides of the tree row on each application date: 15 Apr (App. # 1, pink); 25 Apr (App. # 2, bloom); 6 May (App. # 3, PF); Apps. #4-10: 20 May, 5 Jun, 18 Jun, 2 Jul, 16 Jul, 31 Jul, 13 Aug. Insecticides: 1 Apr (BioCover 6 gal + Asana XL 14.5 fl oz/A); 11 May (Assail 6 oz/A); 22 May (Delegate 4.5 oz/A); 29 May (Movento 9 fl oz + LI-700 8 fl oz/A); 6 Jun (Calypso 6 fl oz/A); 19 Jun (Altacor 3 oz + Admire-Pro 83 ml); 21 Jun (Movento 9 fl oz + LI-700 8 fl oz/A); 1 Jul (Lannate LV 3 pt + Imidan 4 lb/A); 17 Jul (Assail 6 oz/A); 30 Jul (Delegate 4.5 oz/A); 18 Aug (Lannate LV 3 pt + Imidan 4 lb/A).

125
Table 8. Control of cedar-apple rust and “leaf spots” on Idared and Golden Delicious apples, 2015.
Appli- Cedar-apple rust “Leaf spots”* G.Del., % cation % leaves infected % lvs affected defoliation Treatment and rate/acre number Idared G. Del. Idared G. Del. 25 Sep**0 Non-treated control --- 40 i 47 j 21 i 16 e-g 41 h 1 Rally 40WSP 5 oz + Manzate Pro-Stick 75DF 3 lb
Captan 80WDG 30 oz + Ziram 76DF 3 lb 1-7 8-10
<1 a <1 ab 4 ab 14 b-f 13 a-d
2 Rally 40WSP 5 oz + Manzate Pro-Stick 75DF 3 lb Indar 8 fl oz + Captan 80WDG 30 oz + Ziram 76DF 3 lb
1-7 8-10
<1 a <1 ab 2 a 7 ab 11 a-c
3 Luna Sensation 5 fl oz + Manzate Pro-Stick 75DF 3 lb Topguard 1.04SC 13 fl oz + Manzate 75DF 3 lb Indar 8 fl oz + Manzate Pro-Stick 75DF 3 lb Indar 8 fl oz + Captan 80WDG 30 oz Luna Sensation 5 oz + Captan 80WDG 30 oz
1 & 4 2, 3, 5
6 7-8 9-10
<1 ab 2 b-d 5 b-d 16 e-g 11 a-c
4 Luna Tranquility SC 11.2 fl oz + Manzate 75DF 3 lb Topguard 1.04SC 13 fl oz + Manzate Pro-Stick 75DF 3 lbIndar 8 fl oz + Manzate Pro-Stick 75DF 3 lb Indar 8 fl oz + Captan 80WDG 30 oz Luna Sensation 5 fl oz + Captan 80WDG 30 oz
1 & 4 2, 3, 5
6 7-8 9-10
2 ab 4 cd 4 ab 20 gh 10 ab
5 Luna Tranquility SC 11.2 fl oz + Manzate 75DF 3 lb Serenade Optimum 20 oz + ProPhyt 2 qt Topguard 1.04SC 13 fl oz + Manzate Pro-Stick 75DF 3 lbIndar 8 fl oz + Manzate Pro-Stick 75DF 3 lb Indar 8 fl oz + Captan 80WDG 30 oz Luna Sensation 5 fl oz + Captan 80WDG 30 oz
1 & 4 2-3 5 6
7-8 9-10
2 ab 8 e 4 a-c 19 f-h 19 b-f
6 Merivon 4 fl oz + Captan 80WDG 2 lb + Silwet L-77 114 mlCaptan 80WDG 30 oz + Ziram 76DF 3 lb
1-7 8-10
3 bc 6 de 8 d-f 25 h 11 a-c
7 Merivon 4 fl oz + Manzate 3 lb + Silwet 114 ml/100 gal Captan 80WDG 30 oz + Ziram 76DF 3 lb
1-7 8-10
12 de 21 f-h 8 d-f 16 e-g 11 a-c
8 Vivando 2.5SC 15 fl oz + Silwet L-77 114 ml/100 gal Captan 80WDG 30 oz + Ziram 76DF 3 lb
1-7 8-10
18 e-g 28 hi 9 d-g 25 h 21 d-g
9 Kenja 400SC 12.5 fl oz + Silwet L-77 12.8 fl oz/100 gal 1-10 25 gh 29 hi 10 e-h 12 b-e 30 gh 10 Kenja 400SC 12.5 fl oz + Manzate Pro-Stick 75DF 3 lb +
Silwet L-77 12.8 fl oz/100 gal 1-10 29 h 32 i 12 f-h 15 d-g 13 a-d
11 Kenja 400SC 9.4 fl oz + IB18220 3.6SC 6.34 fl oz + Silwet L-77 12.8 fl oz/100 gal 1-10
<1 ab <1 a-c 2 a 9 a-d 20 c-f
12 IL-54111 475SC 13.7 fl oz + Silwet L-77 12.8 fl oz/100 gal 1-10 <1 a 0 a 2 a 6 a 23 e-g 13 Manzate Pro-Stick 75DF 3 lb
Captan 80WDG 30 oz + Ziram 76DF 3 lb 1-4 5-10
14 ef 16 f 7 c-e 12 b-f 9 a
14 Vangard 75WG 5 oz Inspire Super 2.82EW 12 fl oz Aprovia 0.83EC 7 fl oz Captan 80WDG 30 oz + Ziram 76DF 3 lb
1 4 & 7 5-6 8-10
21 f-h 28 hi 12 gh 13 c-g 25 fg
15 Vangard 75WG 5 oz Aprovia 0.83 7 fl oz Inspire Super 2.82EW 12 fl oz Captan 80WDG 30 oz + Ziram 76DF 3 lb
1 2, 7
4,5,6 8-10
18 e-g 25 g-i 15 h 15 e-g 12 a-d
16 Vangard 75WG 5 oz Manzate 75DF 3 lb + Captan 80WDG 30 oz Inspire Super 2.82EW 12 fl oz Aprovia 0.83EC 7 fl oz Captan 80WDG 30 oz + Ziram 76DF 3 lb
1 2, 3 4, 7 5-6 8-10
8 cd 17 fg 6 b-d 13 c-g 11 a-c
17 Vangard 75WG 5 oz Inspire Super 2.82EW 12 fl oz Fontelis 1.67SC 16 fl oz + Oil 1 qt Captan 80WDG 30 oz + Ziram 76DF 3 lb
1 2, 7
4,5,6 8-10
21 e-h 15 f 14 gh 8 a-c 14 a-e
Mean separation by Waller-Duncan K-ratio t-test (p=0.05). Four three-tree replications, 10 shoots/tree rated 22 Jun (G. Delicious) or 23 Jul (Idared), *”Leaf spots” refers to an unidentified, generic leafspot symptom, not a specific disease. ** Defoliation by Golden Delicious leaf blotch, rated on 10 shoots per tree 25 Sep. Treatments applied at 100 gpa to both sides of the tree row on each application date: 15 Apr (App. # 1, pink); 25 Apr (App. # 2, bloom); 6 May (App. # 3, PF); Apps. #4-10: 20 May, 5 Jun, 18 Jun, 2 Jul, 16 Jul, 31 Jul, 13 Aug.

126
Table 9. Control of sooty blotch and flyspeck on Golden Delicious, Idared and York Imperial apples, 2015.
Appli- % fruit infected cation Sooty blotch Flyspeck Treatment and rate/acre number G. Del. Idared York G. Del. Idared York
0 Non-treated control --- 100 e 99 g 98 e 100 h 99 g 91 d 1 Rally 40WSP 5 oz + Manzate Pro-Stick 75DF 3 lb
Captan 80WDG 30 oz + Ziram 76DF 3 lb 1-7 8-10 11 cd 33 f 12 d 15 c-g 39 f 39 c
2 Rally 40WSP 5 oz + Manzate Pro-Stick 75DF 3 lb Indar 8 fl oz + Captan 80WDG 30 oz + Ziram 76DF 3 lb
1-7 8-10 3 ab 16 c-f 1 ab 4 a-e 12 b-e 12 a-c
3 Luna Sensation 5 fl oz + Manzate Pro-Stick 3 lb Topguard 1.04SC 13 fl oz + Manzate 75DF 3 lb Indar 8 fl oz + Manzate Pro-Stick 75DF 3 lb Indar 8 fl oz + Captan 80WDG 30 oz Luna Sensation 5 oz + Captan 80WDG 30 oz
1 & 42, 3, 5
6 7-8 9-10 0 a 8 a-c 2 ab 0 a 4 ab 2 a
4 Luna Tranquility SC 11.2 fl oz + Manzate 75DF 3 lb Topguard 1.04SC 13 fl oz + Manzate Pro-Stick 3 lb Indar 8 fl oz + Manzate Pro-Stick 75DF 3 lb Indar 8 fl oz + Captan 80WDG 30 oz Luna Sensation 5 fl oz + Captan 80WDG 30 oz
1 & 42, 3, 5
6 7-8 9-10 0 a 18 c-f 3 a-d 1 ab 7 a-d 9 ab
5 Luna Tranquility SC 11.2 fl oz + Manzate 75DF 3 lb Serenade Optimum 20 oz + ProPhyt 2 qt Topguard 1.04SC 13 fl oz + Manzate Pro-Stick 3 lb Indar 8 fl oz + Manzate Pro-Stick 75DF 3 lb Indar 8 fl oz + Captan 80WDG 30 oz Luna Sensation 5 fl oz + Captan 80WDG 30 oz
1 & 42-3 5 6
7-8 9-10 3 ab 15 b-e 0 a 2 a-c 5 a-c 3 ab
6 Merivon 4 fl oz + Captan 80WDG 2 lb + Silwet 114 ml Captan 80WDG 30 oz + Ziram 76DF 3 lb
1-7 8-10 0 a 2 ab 1 ab 1 ab 10 a-d 15 a-c
7 Merivon 4 fl oz + Manzate 3 lb + Silwet 114 ml/100 galCaptan 80WDG 30 oz + Ziram 76DF 3 lb
1-7 8-10 0 a 1 a 0 a 2 a-d 1 a 12 ab
8 Vivando 2.5SC 15 fl oz + Silwet L-77 114 ml/100 gal Captan 80WDG 30 oz + Ziram 76DF 3 lb
1-7 8-10 11 d 21 c-f 6 b-d 19 fg 27 ef 25 bc
9 Kenja 400SC 12.5 fl oz + Silwet L-77 12.8 fl oz/100 gal 1-10 8 b-d 24 d-f 6 a-d 9 b-e 21 d-f 16 a-c10 Kenja 400SC 12.5 fl oz + Manzate Pro-Stick 3 lb +
Silwet L-77 12.8 fl oz/100 gal 1-10 3 a-c 18 c-f 4 a-d 2 a-d 7 a-c 24 a-c11 Kenja 400SC 9.4 fl oz + IB18220 3.6SC 6.34 fl oz +
Silwet L-77 12.8 fl oz/100 gal 1-10 10 cd 27 ef 6 b-d 10 e-g 16 b-e 13 a-c12 IL-54111 475SC 13.7 fl oz + Silwet L-77 12.8 fl oz 1-10 12 cd 15 b-e 4 a-d 12 d-g 14 b-e 15 a-c13 Manzate Pro-Stick 75DF 3 lb
Captan 80WDG 30 oz + Ziram 76DF 3 lb 1-4 5-10 4 a-d 24 d-f 3 a-c 20 g 39 f 12 a-c
14 Vangard 75WG 5 oz Inspire Super 2.82EW 12 fl oz Aprovia 0.83EC 7 fl oz Captan 80WDG 30 oz + Ziram 76DF 3 lb
1 4 & 75-6 8-10 1 ab 10 a-d 9 b-d 0 a 2 a 17 a-c
15 Vangard 75WG 5 oz Aprovia 0.83 7 fl oz Inspire Super 2.82EW 12 fl oz Captan 80WDG 30 oz + Ziram 76DF 3 lb
1 2, 7
4,5,68-10 1 ab 2 a 1 ab 2 a-d 1 a 1 a
16 Vangard 75WG 5 oz Manzate 75DF 3 lb + Captan 80WDG 30 oz Inspire Super 2.82EW 12 fl oz Aprovia 0.83EC 7 fl oz Captan 80WDG 30 oz + Ziram 76DF 3 lb
1 2, 3 4, 7 5-6 8-10 1 ab 28 ef 9 cd 0 a 8 a-c 16 a-c
17 Vangard 75WG 5 oz Inspire Super 2.82EW 12 fl oz Fontelis 1.67SC 16 fl oz + Oil 1 qt Captan 80WDG 30 oz + Ziram 76DF 3 lb
1 2, 7
4,5,68-10 1 ab 7 a-c 1 ab 9 c-f 16 c-e 15 a-c
Mean separation by Waller-Duncan K-ratio t-test (p=0.05). Four 3-tree replications. Harvest counts of 25 fruit per tree picked 22 Sep (Idared), 25 Sep (Golden Delicious), or 6 Oct (York Imperial).
Treatments applied at 100 gpa to both sides of the tree row on each application date: 15 Apr (App. # 1, pink); 25 Apr (App. # 2, bloom); 6 May (App. # 3, PF); Apps. #4-10: 20 May, 5 Jun, 18 Jun, 2 Jul, 16 Jul, 31 Jul, 13 Aug

127
Table 10. Control of post-storage rots on Golden Delicious apple, 2015.
% fruit infected Appli- 10 days incubation 18 days incubation cation Any Bitter White Any Bitter White Treatment and rate/acre number rot Rot Rot rot Rot rot 0 Non-treated control --- 38 b 23 b 14 b 55 c 34 c 20 d 1 Rally 40WSP 5 oz + Manzate Pro-Stick 75DF 3 lb
Captan 80WDG 30 oz + Ziram 76DF 3 lb 1-7
8-10 8 a 6 ab 2 a 13 ab 6 ab 4 ab 2 Rally 40WSP 5 oz + Manzate Pro-Stick 75DF 3 lb
Indar 8 fl oz + Captan 80WDG 30 oz + Ziram 76DF 3 lb 1-7
8-10 7 a 4 a 3 ab 13 ab 6 ab 5 a-c3 Luna Sensation 5 fl oz + Manzate Pro-Stick 75DF 3 lb
Topguard 1.04SC 13 fl oz + Manzate 75DF 3 lb Indar 8 fl oz + Manzate Pro-Stick 75DF 3 lb Indar 8 fl oz + Captan 80WDG 30 oz Luna Sensation 5 oz + Captan 80WDG 30 oz
1 & 42, 3, 5
6 7-8
9-10 3 a 1 a 1 a 7 ab 2 ab 5 bc 4 Luna Tranquility SC 11.2 fl oz + Manzate 75DF 3 lb
Topguard 1.04SC 13 fl oz + Manzate Pro-Stick 75DF 3 lbIndar 8 fl oz + Manzate Pro-Stick 75DF 3 lb Indar 8 fl oz + Captan 80WDG 30 oz Luna Sensation 5 fl oz + Captan 80WDG 30 oz
1 & 42, 3, 5
6 7-8
9-10 4 a 1 a 2 ab 8 ab 1 a 5 bc 5 Luna Tranquility SC 11.2 fl oz + Manzate 75DF 3 lb
Serenade Optimum 20 oz + ProPhyt 2 qt Topguard 1.04SC 13 fl oz + Manzate Pro-Stick 75DF 3 lbIndar 8 fl oz + Manzate Pro-Stick 75DF 3 lb Indar 8 fl oz + Captan 80WDG 30 oz Luna Sensation 5 fl oz + Captan 80WDG 30 oz
1 & 42-3 5 6
7-8 9-10 6 a 4 ab 2 ab 9 ab 5 ab 3 a-c
6 Merivon 4 fl oz + Captan 80WDG 2 lb + Silwet L-77 114 mlCaptan 80WDG 30 oz + Ziram 76DF 3 lb
1-7 8-10 1 a 1 a 0 a 1 a 1 a 0 a
7 Merivon 4 fl oz + Manzate 3 lb + Silwet 114 ml/100 gal Captan 80WDG 30 oz + Ziram 76DF 3 lb
1-7 8-10 3 a 2 a 1 a 5 ab 3 ab 2 ab
8 Vivando 2.5SC 15 fl oz + Silwet L-77 114 ml/100 gal Captan 80WDG 30 oz + Ziram 76DF 3 lb
1-7 8-10 4 a 4 ab 0 a 9 ab 5 ab 2 ab
9 Kenja 400SC 12.5 fl oz + Silwet L-77 12.8 fl oz/100 gal 1-10 10 a 7 ab 4 ab 24 b 16 bc 7 a-c10 Kenja 400SC 12.5 fl oz + Manzate Pro-Stick 75DF 3 lb +
Silwet L-77 12.8 fl oz/100 gal 1-10 10 a 9 ab 1 a 16 ab 10 ab 3 a-c11 Kenja 400SC 9.4 fl oz + IB18220 3.6SC 6.34 fl oz +
Silwet L-77 12.8 fl oz/100 gal 1-10 2 a 2 a 0 a 7 ab 3 ab 2 ab 12 IL-54111 475SC 13.7 fl oz + Silwet L-77 12.8 fl oz/100 gal 1-10 4 a 3 a 1 a 7 ab 5 ab 1 ab 13 Manzate Pro-Stick 75DF 3 lb
Captan 80WDG 30 oz + Ziram 76DF 3 lb 1-4
5-10 4 a 3 ab 0 a 9 ab 5 ab 1 ab 14 Vangard 75WG 5 oz
Inspire Super 2.82EW 12 fl oz Aprovia 0.83EC 7 fl oz Captan 80WDG 30 oz + Ziram 76DF 3 lb
1 4 & 75-6
8-10 8 a 5 ab 3 ab 21 b 8 ab 11 cd 15 Vangard 75WG 5 oz
Aprovia 0.83 7 fl oz Inspire Super 2.82EW 12 fl oz Captan 80WDG 30 oz + Ziram 76DF 3 lb
1 2, 7
4,5,68-10 4 a 2 a 2 a 12 ab 6 ab 6 b-d
16 Vangard 75WG 5 oz Manzate 75DF 3 lb + Captan 80WDG 30 oz Inspire Super 2.82EW 12 fl oz Aprovia 0.83EC 7 fl oz Captan 80WDG 30 oz + Ziram 76DF 3 lb
1 2, 34, 75-6
8-10 15 a 14 ab 2 ab 25 b 20 a-c 5 a-c17 Vangard 75WG 5 oz
Inspire Super 2.82EW 12 fl oz Fontelis 1.67SC 16 fl oz + Oil 1 qt Captan 80WDG 30 oz + Ziram 76DF 3 lb
1 2, 7
4,5,68-10 5 a 3 a 2 a 13 b 5 ab 5 bc
Mean separation by Waller-Duncan K-ratio t-test (p=0.05). Four 3-tree replications, 25 fruit / tree picked 25 Sep and placed in cold storage; moved 16 Oct to ambient temperatures (54-81ºF, mean 70.9ºF) and rated 26 Oct and 3 Nov. Treatments applied at 100 gpa to both sides of the tree row on each application date: 15 Apr (App. # 1, pink); 25 Apr (App. # 2, bloom); 6 May (App. # 3, PF); Apps. #4-10: 20 May, 5 Jun, 18 Jun, 2 Jul, 16 Jul, 31 Jul, 13 Aug.

128
Table 11. Control of Brooks spot and post-storage rots on Idared apple, 2015.
% fruit infected Rot incidence after Appli- 8 day counts 21days incubation cation Brooks Bitter Any Bitter White Treatment and rate/acre number spot rot rot Rot rot 0 Non-treated control --- 16 b 25 c 71 g 68 f 5 bc 1 Rally 40WSP 5 oz + Manzate Pro-Stick 75DF 3 lb
Captan 80WDG 30 oz + Ziram 76DF 3 lb 1-7 8-10 0 a 3 ab 15 c-f 9 a-e 6 c
2 Rally 40WSP 5 oz + Manzate Pro-Stick 75DF 3 lb Indar 8 fl oz + Captan 80WDG 30 oz + Ziram 76DF 3 lb
1-7 8-10 0 a 1 a 18 d-f 11 b-e 4 bc
3 Luna Sensation 5 fl oz + Manzate Pro-Stick 75DF 3 lb Topguard 1.04SC 13 fl oz + Manzate 75DF 3 lb Indar 8 fl oz + Manzate Pro-Stick 75DF 3 lb Indar 8 fl oz + Captan 80WDG 30 oz Luna Sensation 5 oz + Captan 80WDG 30 oz
1 & 4 2, 3, 5
6 7-8 9-10 0 a 3 ab 9 ab 8 a-c 2 a-c
4 Luna Tranquility SC 11.2 fl oz + Manzate 75DF 3 lb Topguard 1.04SC 13 fl oz + Manzate Pro-Stick 75DF 3 lbIndar 8 fl oz + Manzate Pro-Stick 75DF 3 lb Indar 8 fl oz + Captan 80WDG 30 oz Luna Sensation 5 fl oz + Captan 80WDG 30 oz
1 & 4 2, 3, 5
6 7-8 9-10 0 a 1 a 6 a-c 4 a-c 2 a-c
5 Luna Tranquility SC 11.2 fl oz + Manzate 75DF 3 lb Serenade Optimum 20 oz + ProPhyt 2 qt Topguard 1.04SC 13 fl oz + Manzate Pro-Stick 75DF 3 lbIndar 8 fl oz + Manzate Pro-Stick 75DF 3 lb Indar 8 fl oz + Captan 80WDG 30 oz Luna Sensation 5 fl oz + Captan 80WDG 30 oz
1 & 4 2-3 5 6
7-8 9-10 0 a 5 ab 18 d-f 15 de 0 a
6 Merivon 4 fl oz + Captan 80WDG 2 lb + Silwet L-77 114 mlCaptan 80WDG 30 oz + Ziram 76DF 3 lb
1-7 8-10 0 a 2 ab 5 a 3 a 0 a
7 Merivon 4 fl oz + Manzate 3 lb + Silwet 114 ml/100 gal Captan 80WDG 30 oz + Ziram 76DF 3 lb
1-7 8-10 0 a 1 a 5 a 4 ab 0 a
8 Vivando 2.5SC 15 fl oz + Silwet L-77 114 ml/100 gal Captan 80WDG 30 oz + Ziram 76DF 3 lb
1-7 8-10 0 a 3 ab 9 a-d 6 a-c 3 a-c
9 Kenja 400SC 12.5 fl oz + Silwet L-77 12.8 fl oz/100 gal 1-10 0 a 6 b 25 ef 19 e 2 ab 10 Kenja 400SC 12.5 fl oz + Manzate Pro-Stick 75DF 3 lb +
Silwet L-77 12.8 fl oz/100 gal 1-10 0 a 3 ab 12 a-d 11 a-e 0 a 11 Kenja 400SC 9.4 fl oz + IB18220 3.6SC 6.34 fl oz +
Silwet L-77 12.8 fl oz/100 gal 1-10 0 a 5 ab 13 a-f 13 c-e 1 ab 12 IL-54111 475SC 13.7 fl oz + Silwet L-77 12.8 fl oz/100 gal 1-10 1 a 2 ab 9 a-d 7 a-d 1 ab 13 Manzate Pro-Stick 75DF 3 lb
Captan 80WDG 30 oz + Ziram 76DF 3 lb 1-4 5-10 1 a 7 b 25 f 20 e 1 ab
14 Vangard 75WG 5 oz Inspire Super 2.82EW 12 fl oz Aprovia 0.83EC 7 fl oz Captan 80WDG 30 oz + Ziram 76DF 3 lb
1 4 & 7 5-6 8-10 0 a 2 ab 16 c-f 13 b-e 1 ab
15 Vangard 75WG 5 oz Aprovia 0.83 7 fl oz Inspire Super 2.82EW 12 fl oz Captan 80WDG 30 oz + Ziram 76DF 3 lb
1 2, 7
4,5,6 8-10 0 a 3 ab 15 b-f 14 c-e 1 ab
16 Vangard 75WG 5 oz Manzate 75DF 3 lb + Captan 80WDG 30 oz Inspire Super 2.82EW 12 fl oz Aprovia 0.83EC 7 fl oz Captan 80WDG 30 oz + Ziram 76DF 3 lb
1 2, 3 4, 7 5-6 8-10 0 a 6 ab 18 d-f 18 e 0 a
17 Vangard 75WG 5 oz Inspire Super 2.82EW 12 fl oz Fontelis 1.67SC 16 fl oz + Oil 1 qt Captan 80WDG 30 oz + Ziram 76DF 3 lb
1 2, 7
4,5,6 8-10 1 a 1 a 12 a-e 9 a-e 3 a-c
Mean separation by Waller-Duncan K-ratio t-test (p=0.05). Four 3-tree replications, 25 fruit / tree picked 22 Sep, placed in cold storage; moved 6 Oct to ambient temperatures (54-84ºF, mean 71.0ºF) and rated 14 Oct and 27 Oct. Treatments applied at 100 gpa to both sides of the tree row on each application date: 15 Apr (App. # 1, pink); 25 Apr (App. # 2, bloom); 6 May (App. # 3, PF); Apps. #4-10: 20 May, 5 Jun, 18 Jun, 2 Jul, 16 Jul, 31 Jul, 13 Aug.

129
Table 12. Control of post-storage rots on York Imperial apple, 2015.
Rot incidence after indicated days incubation Appli- 13 days 18 days incubation cation Any Bitter Any Bitter Alternaria White Treatment and rate/acre number rot Rot rot Rot rot rot 0 Non-treated control --- 24 bc 20 bc 42 de 36 de 7 b 2 ab1 Rally 40WSP 5 oz + Manzate Pro-Stick 75DF 3 lb
Captan 80WDG 30 oz + Ziram 76DF 3 lb 1-7 8-10 20 a-c 18 bc 34 c-e 28 c-e 5 ab 3 ab
2 Rally 40WSP 5 oz + Manzate Pro-Stick 75DF 3 lb Indar 8 fl oz + Captan 80WDG 30 oz + Ziram 76DF 3 lb
1-7 8-10 9 ab 9 ab 16 a-d 15 a-d 1 ab 0 a
3 Luna Sensation 5 fl oz + Manzate Pro-Stick 75DF 3 lb Topguard 1.04SC 13 fl oz + Manzate 75DF 3 lb Indar 8 fl oz + Manzate Pro-Stick 75DF 3 lb Indar 8 fl oz + Captan 80WDG 30 oz Luna Sensation 5 oz + Captan 80WDG 30 oz
1 & 4 2, 3, 5
6 7-8 9-10 4 ab 2 a 8 ab 7 a-c 2 ab 0 a
4 Luna Tranquility SC 11.2 fl oz + Manzate 75DF 3 lb Topguard 1.04SC 13 fl oz + Manzate Pro-Stick 75DF 3 lbIndar 8 fl oz + Manzate Pro-Stick 75DF 3 lb Indar 8 fl oz + Captan 80WDG 30 oz Luna Sensation 5 fl oz + Captan 80WDG 30 oz
1 & 4 2, 3, 5
6 7-8 9-10 8 a-c 6 ab 15 a-d 11 a-c 4 ab 0 a
5 Luna Tranquility SC 11.2 fl oz + Manzate 75DF 3 lb Serenade Optimum 20 oz + ProPhyt 2 qt Topguard 1.04SC 13 fl oz + Manzate Pro-Stick 75DF 3 lbIndar 8 fl oz + Manzate Pro-Stick 75DF 3 lb Indar 8 fl oz + Captan 80WDG 30 oz Luna Sensation 5 fl oz + Captan 80WDG 30 oz
1 & 4 2-3 5 6
7-8 9-10 6 ab 3 ab 15 a-d 10 a-c 3 ab 2 ab
6 Merivon 4 fl oz + Captan 80WDG 2 lb + Silwet L-77 114 mlCaptan 80WDG 30 oz + Ziram 76DF 3 lb
1-7 8-10 7 ab 5 ab 12 a-c 9 a-c 3 ab 0 a
7 Merivon 4 fl oz + Manzate 3 lb + Silwet 114 ml/100 gal Captan 80WDG 30 oz + Ziram 76DF 3 lb
1-7 8-10 9 a-c 6 ab 16 a-d 12 a-d 3 ab 1 ab
8 Vivando 2.5SC 15 fl oz + Silwet L-77 114 ml/100 gal Captan 80WDG 30 oz + Ziram 76DF 3 lb
1-7 8-10 3 ab 1 a 4 a 1 a 0 a 3 ab
9 Kenja 400SC 12.5 fl oz + Silwet L-77 12.8 fl oz/100 gal 1-10 4 ab 2 a 14 a-d 10 a-c 4 ab 0 a 10 Kenja 400SC 12.5 fl oz + Manzate Pro-Stick 75DF 3 lb +
Silwet L-77 12.8 fl oz/100 gal 1-10 14 a-c 10 a-c 29 b-e 24 c-e 0 a 5 b 11 Kenja 400SC 9.4 fl oz + IB18220 3.6SC 6.34 fl oz +
Silwet L-77 12.8 fl oz/100 gal 1-10 9 a-c 7 ab 15 a-d 14 a-d 3 ab 0 a 12 IL-54111 475SC 13.7 fl oz + Silwet L-77 12.8 fl oz/100 gal 1-10 12 a-c 14 a-c 26 a-e 19 b-d 6 ab 2 ab13 Manzate Pro-Stick 75DF 3 lb
Captan 80WDG 30 oz + Ziram 76DF 3 lb 1-4 5-10 8 a-c 7 a-c 19 a-e 15 b-d 0 a 4 ab
14 Vangard 75WG 5 oz Inspire Super 2.82EW 12 fl oz Aprovia 0.83EC 7 fl oz Captan 80WDG 30 oz + Ziram 76DF 3 lb
1 4 & 7 5-6 8-10 6 a-c 6 a-c 18 a-e 16 b-e 2 ab 1 ab
15 Vangard 75WG 5 oz Aprovia 0.83 7 fl oz Inspire Super 2.82EW 12 fl oz Captan 80WDG 30 oz + Ziram 76DF 3 lb
1 2, 7
4,5,6 8-10 1 a 1 a 4 a 3 ab 0 a 1 ab
16 Vangard 75WG 5 oz Manzate 75DF 3 lb + Captan 80WDG 30 oz Inspire Super 2.82EW 12 fl oz Aprovia 0.83EC 7 fl oz Captan 80WDG 30 oz + Ziram 76DF 3 lb
1 2, 3 4, 7 5-6 8-10 32 c 29 c 47 e 43 e 3 ab 1 ab
17 Vangard 75WG 5 oz Inspire Super 2.82EW 12 fl oz Fontelis 1.67SC 16 fl oz + Oil 1 qt Captan 80WDG 30 oz + Ziram 76DF 3 lb
1 2, 7
4,5,6 8-10 5 a-c 4 ab 7 ab 5 a-c 0 a 1 ab
Mean separation by Waller-Duncan K-ratio t-test (p=0.05). Four 3-tree replications, 25 fruit per tree picked 6 Oct and placed in cold storage; moved 16 Oct to ambient temperatures (54-81ºF, mean 70.9ºF) and rated 29 Oct and 3 Nov. Treatments applied at 100 gpa to both sides of the tree row on each application date: 15 Apr (App. # 1, pink); 25 Apr (App. # 2, bloom); 6 May (App. # 3, PF); Apps. #4-10: 20 May, 5 Jun, 18 Jun, 2 Jul, 16 Jul, 31 Jul, 13 Aug.

130
Table 13. Fruit finish of Golden Delicious, Idared and York Imperial apples, 2015.
Appli- Fruit finish rating (0-5) or USDA grade for russet* cation Russet rating (0-5) G. Del., % Opalescence Treatment and rate/acre number Idared York G. Del. Fancy/X-Fcy Idared York
0 Non-treated control --- 2.3 g 1.1 c-g 2.4 f-h 65 ef 2.1 g 1.0 ab 1 Rally 40WSP 5 oz + Manzate Pro-Stick 75DF 3 lb
Captan 80WDG 30 oz + Ziram 76DF 3 lb 1-7
8-10 2.1 fg 1.0 b-g 1.3 a-c 91 ab 1.1 d-f 0.8 ab
2 Rally 40WSP 5 oz + Manzate Pro-Stick 75DF 3 lb Indar 8 fl oz + Captan 80WDG 30 oz + Ziram 3 lb
1-7 8-10
2.0 c-g 0.9 a-g 1.3 a-c 87 a-c 1.0 a-e 0.8 ab
3 Luna Sensation 5 fl oz + Manzate Pro-Stick 3 lb Topguard 1.04SC 13 fl oz + Manzate 75DF 3 lb Indar 8 fl oz + Manzate Pro-Stick 75DF 3 lb Indar 8 fl oz + Captan 80WDG 30 oz Luna Sensation 5 oz + Captan 80WDG 30 oz
1 & 42, 3, 5
6 7-8
9-10
2.0 d-g 1.0 c-g 1.1 a 92 a 1.1 c-e 0.8 ab
4 Luna Tranquility SC 11.2 fl oz + Manzate 3 lb Topguard 1.04SC 13 fl oz + Manzate Pro-Stick 3 lbIndar 8 fl oz + Manzate Pro-Stick 75DF 3 lb Indar 8 fl oz + Captan 80WDG 30 oz Luna Sensation 5 fl oz + Captan 80WDG 30 oz
1 & 42, 3, 5
6 7-8
9-10
1.6 a-e 1.1 d-g 1.1 a 89 ab 0.8 a-c 1.2 a-c
5 Luna Tranquility SC 11.2 fl oz + Manzate 75DF 3 lbSerenade Optimum 20 oz + ProPhyt 2 qt Topguard 1.04SC 13 fl oz + Manzate Pro-Stick 3 lbIndar 8 fl oz + Manzate Pro-Stick 75DF 3 lb Indar 8 fl oz + Captan 80WDG 30 oz Luna Sensation 5 fl oz + Captan 80WDG 30 oz
1 & 42-3 5 6
7-8 9-10
1.7 a-f 0.8 a-f 1.8 c-e 76 c-e 0.8 a-c 0.8 ab
6 Merivon 4 fl oz + Captan 2 lb + Silwet 114 ml Captan 80WDG 30 oz + Ziram 76DF 3 lb
1-7 8-10
1.6 a-e 1.3 f-h 1.3 ab 93 a 0.7 ab 1.0 ab
7 Merivon 4 fl oz + Manzate 3 lb + Silwet Captan 80WDG 30 oz + Ziram 76DF 3 lb
1-7 8-10
1.3 a 0.8 a-e 1.6 b-d 90 ab 0.7 a 0.8 ab
8 Vivando 2.5SC 15 fl oz + Silwet L-77 114 ml/100 galCaptan 80WDG 30 oz + Ziram 76DF 3 lb
1-7 8-10
1.8 a-f 0.6 a-d 2.1 e-g 74 c-e 1.0 b-e 0.6 a
9 Kenja 400SC 12.5 fl oz + Silwet 12.8 fl oz/100 gal 1-10 1.8 b-f 1.3 gh 2.0 de 81 b-d 1.1 d-f 1.2 a-c 10 Kenja 400SC 12.5 fl oz + Manzate Pro-Stick 3 lb +
Silwet L-77 12.8 fl oz/100 gal 1-10 2.0 c-g 1.2 e-h 2.2 e-h 64 ef 1.1 d-f 1.1 ab
11 Kenja 400SC 9.4 fl oz + IB18220 3.6SC 6.34 fl oz + Silwet L-77 12.8 fl oz/100 gal 1-10
2.0 e-g 1.0 c-g 2.5 gh 67 d-f 1.4 f 1.0 ab
12 IL-54111 475SC 13.7 fl oz + Silwet 12.8 fl oz/100 gal 1-10 1.9 c-g 1.3 e-h 2.7 h 51 f 1.3 ef 1.4 bc 13 Manzate Pro-Stick 75DF 3 lb
Captan 80WDG 30 oz + Ziram 76DF 3 lb 1-4
5-10 2.1 fg 0.5 ab 1.8 de 76 c-e 1.0 b-e 0.6 a
14 Vangard 75WG 5 oz Inspire Super 2.82EW 12 fl oz Aprovia 0.83EC 7 fl oz Captan 80WDG 30 oz + Ziram 76DF 3 lb
1 4 & 75-6
8-10
1.6 a-e 1.4 gh 2.1 d-f 69 de 0.8 a-d 1.1 ab
15 Vangard 75WG 5 oz Aprovia 0.83 7 fl oz Inspire Super 2.82EW 12 fl oz Captan 80WDG 30 oz + Ziram 76DF 3 lb
1 2, 7
4,5,68-10
1.5 a-c 0.6 a-c 1.2 ab 91 a 0.9 a-d 0.5 a
16 Vangard 75WG 5 oz Manzate 75DF 3 lb + Captan 80WDG 30 oz Inspire Super 2.82EW 12 fl oz Aprovia 0.83EC 7 fl oz Captan 80WDG 30 oz + Ziram 76DF 3 lb
1 2, 3 4, 7 5-6
8-10
1.5 a-d 1.6 h 1.3 ab 95 a 0.8 a-c 1.9 c
17 Vangard 75WG 5 oz Inspire Super 2.82EW 12 fl oz Fontelis 1.67SC 16 fl oz + Oil 1 qt Captan 80WDG 30 oz + Ziram 76DF 3 lb
1 2, 7
4,5,68-10
1.4 ab 0.5 a 1.7 b-d 90 ab 0.8 a-c 0.7 ab
Mean separation by Waller-Duncan K-ratio t-test (p=0.05). Four 3-tree replications, Harvest counts of 25 fruit per tree picked 22 Sep (Idared), 25 Sep (Golden Delicious), or 6 Oct (York Imperial) * Fruit finish rated on a scale of 0-5 (0=perfect finish; 5=severe russet or opalescence). USDA Extra-fancy and fancy grades

131
after downgrading by russet presumed not to be caused by mildew. Treatments applied at 100 gpa to both sides of the tree row on each application date: 15 Apr (App. # 1, pink); 25 Apr (App. # 2, bloom); 6 May (App. # 3, PF); Apps. #4-10: 20 May, 5 Jun, 18 Jun, 2 Jul, 16 Jul, 31 Jul, 13 Aug.
132
APPLE (Malus domestica ‘‘Idared’) K. S. Yoder, A. E. Cochran II,
Powdery mildew; Podosphaera leucotricha W. S. Royston, Jr., S. W. Kilmer, Scab; Venturia inaequalis A.G.F. Engelman, M. A. Borden, Cedar-apple rust; Gymnosporangium juniperi-virginianae and J.K. Repass Brooks fruit spot; Mycosphaerella pomi Virginia Tech Agr. Res. & Ext. Center Sooty blotch; disease complex 595 Laurel Grove Road Flyspeck; Zygophiala jamaicensis Winchester, VA 22602 Bitter rot; Colletotrichum spp. White rot; Botryosphaeria dothidea Fruit finish
Control of powdery mildew and other diseases by experimental fungicides and mixed schedules on Idared apple, 2015.
Sixteen treatments involving experimental and registered combinations were directed at control of powdery mildew and other early season diseases in an area where SI and QoI fungicide effectiveness has been declining. The test was established as four randomized blocks on 34-yr-old trees using single-tree replications with border rows between treatment rows. Treatment rows had been used as non-treated border rows in 2014 to stabilize mildew inoculum pressure for 2015. Tree-row-volume was determined to require a 400 gal/A dilute base for adequate coverage. Fungicide treatments were applied to both sides of the tree on each application date with a Swanson Model DA-400 airblast sprayer at 100 gal/A as follows: 15 Apr (pink); 25 Apr (bloom); 6 May (petal fall); First –7th covers: 22 May, 5 Jun, 18 Jun, 2 Jul, 16 Jul, 31 Jul, and 13 Aug. Maintenance materials applied to the entire test block with the same equipment included: Admire Pro, Altacor, Asana XL, Assail, BioCover MLT, Calypso, Delegate, Imidan, and Movento. Inoculum over each Idared test tree included cedar rust galls and wild blackberry canes with the sooty blotch and flyspeck fungi and bitter rot mummies placed 28 Apr. Other diseases developed from inoculum naturally present in the test area. Foliar data represent averages of counts of ten terminal shoots per tree 20 Jul. Apparent suppressive effect on appearance of primary mildew was rated on six primary mildew shoots / tree, 3 Jun using a scale of 1-10 (1= none; 10= excellent effect). Post-harvest fruit counts are means of 25-fruit samples picked from each of four single-tree reps 23 Sep; first rated 5 Oct and then rated for rots after 21 days ambient warm incubation on 14 Oct. Percentage data were converted by the square root arcsin transformation for statistical analysis.
The early season was favorable for development of powdery mildew, scab, and cedar-apple rust. Mildew conidia were present 6 Apr, and there were 35 dry weather “mildew infection days” from 6 Apr until mid-June, resulting in moderate infection of non-treated trees (Table 14). Under these conditions, all treatments gave significant control of mildew. Merivon (Trt #1) had a strong suppressive effect on primary mildew development and good control of secondary infection of leaves and fruit, but two other treatments also gave excellent secondary control of mildew: #13 (Torino + Mettle) and #16 (Fontelis + Oil/Topguard). There were ten cedar-apple rust infection periods from 7 Apr to 27 May, and the treatments that included rotations with SI fungicides (Topguard or Mettle, #1-3, 11-13, 15 and 16) gave excellent control of cedar-apple rust (Table 15), compared to those which had only Manzate in combination with other fungicides (#5-10 and 14). The unidentified “leaf spots” noted in Table 15 were likely related to partially inhibited rust, but did not have any orange color to clearly identify them as such. The first scab infection period occurred 7 Apr and primary lesions were present during a secondary period 30 Apr. This was followed by 19 more secondary scab infection periods through June. Scab strains resistant to SI and QoI fungicides have been present in the test area for ten or more years, and this probably impacted control by any treatment that would have relied on those fungicides for control (Table 16). A significant difference in scab control on both leaves and fruit was related to whether Topguard (trt #15) or Fontelis (#16) was applied as the first application at pink, with the earlier Fontelis timing giving better control. This was reversed with these two treatments for “leaf spots” (Table 15), with the earlier Topguard and later Fontelis were more properly timed to provide a reduction in percent leaves affected. Under light Brooks spot pressure, all treatments gave complete control (Table 16). Because all treatments received Captan + Ziram in the schedule for the last two applications, any difference in sooty blotch and flyspeck were related to what was applied in earlier cover sprays (Table 16). Merivon, in applications #2, 4, 6 and 8 (trt #1), gave excellent SBSF control compared to Topguard or Fontelis in treatments #15 and 16. Under moderate rot pressure, all treatments gave adequate control of bitter rot and white rot (Table 17). Only two treatments gave any deleterious effect on fruit finish, a slight increase in opalescence by #8 and #12.

133
Table 14. Powdery mildew control on Idared apple, 2015. Block 15. Virginia Tech AREC, Winchester.
Primary Mildew infection (%) mildew leaf infection fruit infection Treatment and rate /A Timing effect* leaves lf. area % fruit area 0 Non-treated control --- 1.3 f 43 f 16 d 52 d 10 c 1 Topguard 10 fl oz
Merivon 4.18SC 4 fl oz+ Activator 90 1 qt/100 gal Captan 80WDG 30 oz + Ziram 76DF 3 lb
#1,3,5,7#2,4,6,8#9-10
5.1 a 15 a-e 2 a-c 14 a-c 2 ab
2 Topguard 10 fl oz Aprovia 0.83EC 4 fl oz + Activator 90 1 qt/100 gal Captan 80WDG 30 oz + Ziram 76DF 3 lb
#1,3,5,7#2,4,6,8#9-10
3.8 b-e 12 a-c 2 a-c 16 a-c 2 ab
3 Topguard 10 fl oz Aprovia 0.83EC 5.5 fl oz+ Activator 90 1 qt/100 gal Captan 80WDG 30 oz + Ziram 76DF 3 lb
#1,3,5,7#2,4,6,8#9-10
4.1 bc 23 e 4 c 13 a-c 2 ab
4 Topguard 10 fl oz Aprovia 0.83EC 7 fl oz+ Activator 90 1 qt/100 gal Captan 80WDG 30 oz + Ziram 76DF 3 lb
#1,3,5,7#2,4,6,8#9-10
2.9 e 12 a-c 2 a-c 23 c 4 b
5 GWN-10250 20EC 36 fl oz + Manzate 75DG 3 lb + Activator 90 1 qt/100 gal Captan 80WDG 30 oz + Ziram 76DF 3 lb
#8 #9-10
3.5 c-e 21 de 4 c 10 a-c 1 ab
6 GWN-10389 20EC 36 fl oz + Manzate 75DG 3 lb + Activator 90 1 qt/100 gal Captan 80WDG 30 oz + Ziram 76DF 3 lb
#8 #9-10
3.9 b-d 14 a-e 3 bc 7 a 1 a
7 GWN-10290 40EC 18 fl oz + Manzate 75DG 3 lb + Activator 90 1 qt/100 gal Captan 80WDG 30 oz + Ziram 76DF 3 lb
#8 #9-10
3.6 c-e 14 a-e 2 a-c 12 a-c 2 ab
8 Torino 10SC 5 fl oz + Manzate 75DG 3 lb + Activator 90 1 qt/100 gal Captan 80WDG 30 oz + Ziram 76DF 3 lb
#8 #9-10
3.2 c-e 16 b-e 3 bc 8 a-c 1 ab
9 Torino 10SC 6.5 fl oz + Manzate 75DG 3 lb + Activator 90 1 qt/100 gal Captan 80WDG 30 oz + Ziram 76DF 3 lb
#8 #9-10
3.4 c-e 14 a-e 2 a-c 10 a-c 1 ab
10 Torino 10SC 8 fl oz + Manzate 75DG 3 lb + Activator 90 1 qt/100 gal Captan 80WDG 30 oz + Ziram 76DF 3 lb
#8 #9-10
3.1 de 15 a-e 3 a-c 10 a 2 a
11 Mettle 125ME 10 fl oz + Manzate 75DG 3 lb + Activator 90 1 qt/100 gal Captan 80WDG 30 oz + Ziram 76DF 3 lb
#8 #9-10
3.9 b-d 13 a-d 2 a-c 7 a 1 a
12 Torino 10SC 5 fl oz + Mettle 125ME 10 fl oz + Manzate 75DG 3 lb + Activator 90 1 qt/100 gal Captan 80WDG 30 oz + Ziram 76DF 3 lb
#8 #9-10
3.8 b-e 15 b-e 3 a-c 15 a-c 3 b
13 Torino 10SC 8 fl oz + Mettle 125ME 10 fl oz + Manzate 75DG 3 lb + Activator 90 1 qt/100 gal Captan 80WDG 30 oz + Ziram 76DF 3 lb
#8 #9-10
4.6 ab 8 a 1 a 8 ab 1 a
14 Vivando 15 oz + Manzate Pro-Stick 75DG 3 lb + Activator 90 1 qt/100 gal Captan 80WDG 30 oz + Ziram 76DF 3 lb
#8 #9-10
3.6 c-e 13 a-d 2 a-c 18 a-c 3 ab
15 Topguard 10 fl oz Fontelis 1.76SC 20 fl oz+ Damoil 1 qt Captan 80WDG 30 oz + Ziram 76DF 3 lb
#1,3,5,7#2,4,6,8#9-10
3.6 c-e 16 c-e 3 a-c 21 bc 3 b
16 Fontelis 1.76SC 20 fl oz+ Damoil 1 qt Topguard 10 fl oz Captan 80WDG 30 oz + Ziram 76DF 3 lb
#1,3,5,7#2,4,6,8#9-10
3.2 c-e 8 ab 1 ab 12 a-c 2 ab
Mean separation by Waller-Duncan K-ratio t-test (p=0.05). Four reps; 10 shoots per tree rated 20 Jul, or counts of 25 fruit per tree harvested 23 Sep and rated 5 Oct.. Test rows were non-treated border rows in 2014 to stabilize mildew inoculum pressure for 2015. * Suppressive effect rated on six primary mildew shoots/tree 3 Jun, scale: 1-10 (1= none; 10= excellent effect). Treatment dates: 15 Apr (pink); 25 Apr (bloom); 6 May (petal fall); First –7th covers: 22 May, 5 Jun, 18 Jun, 2 Jul, 16 Jul, 31 Jul, 13 Aug.

134
Table 15. Control of cedar‐apple rust and “leaf spots” on Idared apple, 2015.
Cedar-apple rust “Leaf spots” % lvs lesions % lesions Treatment and rate/A App. # infected / leaf leaves / leaf 0 Non-treated control --- 23 h 0.9 bc 30 f 1.2 c 1 Topguard 10 fl oz
Merivon 4.18SC 4 fl oz+ Activator 90 1 qt/100 gal Captan 80WDG 30 oz + Ziram 76DF 3 lb
#1,3,5,7#2,4,6,8#9-10
3 cd 0.1 a 10 a-c 0.2 ab
2 Topguard 10 fl oz Aprovia 0.83EC 4 fl oz + Activator 90 1 qt/100 gal Captan 80WDG 30 oz + Ziram 76DF 3 lb
#1,3,5,7#2,4,6,8#9-10
2 c 0.1 a 9 a-c 0.2 ab
3 Topguard 10 fl oz Aprovia 0.83EC 5.5 fl oz+ Activator 90 1 qt/100 gal Captan 80WDG 30 oz + Ziram 76DF 3 lb
#1,3,5,7#2,4,6,8#9-10
2 c <0.1 a 15 c-e 0.5 ab
4 Topguard 10 fl oz Aprovia 0.83EC 7 fl oz+ Activator 90 1 qt/100 gal Captan 80WDG 30 oz + Ziram 76DF 3 lb
#1,3,5,7#2,4,6,8#9-10
<1 a-c <0.1 a 8 a-c 0.2 ab
5 GWN-10250 20EC 36 fl oz + Manzate 75DG 3 lb + Activator 90 1 qt/100 gal Captan 80WDG 30 oz + Ziram 76DF 3 lb
#8#9-10
13 fg 0.8 bc 9 a-c 0.1 a
6 GWN-10389 20EC 36 fl oz + Manzate 75DG 3 lb + Activator 90 1 qt/100 gal Captan 80WDG 30 oz + Ziram 76DF 3 lb
#8#9-10
11 ef 0.9 bc 13 b-e 0.5 ab
7 GWN-10290 40EC 18 fl oz + Manzate 75DG 3 lb + Activator 90 1 qt/100 gal Captan 80WDG 30 oz + Ziram 76DF 3 lb
#8#9-10
13 fg 1.0 bc 14 b-e 0.3 ab
8 Torino 10SC 5 fl oz + Manzate 75DG 3 lb + Activator 90 1 qt/100 gal Captan 80WDG 30 oz + Ziram 76DF 3 lb
#8#9-10
17 f-h 0.9 bc 20 d-f 0.8 bc
9 Torino 10SC 6.5 fl oz + Manzate 75DG 3 lb + Activator 90 1 qt/100 gal Captan 80WDG 30 oz + Ziram 76DF 3 lb
#8#9-10
16 f-h 1.2 c 13 b-e 0.3 ab
10 Torino 10SC 8 fl oz + Manzate 75DG 3 lb + Activator 90 1 qt/100 gal Captan 80WDG 30 oz + Ziram 76DF 3 lb
#8#9-10
18 gh 1.0 bc 16 c-e 0.4 ab
11 Mettle 125ME 10 fl oz + Manzate 75DG 3 lb + Activator 90 1 qt/100 gal Captan 80WDG 30 oz + Ziram 76DF 3 lb
#8#9-10
<1 a <0.1 a 7 ab 0.1 a
12 Torino 10SC 5 fl oz + Mettle 125ME 10 fl oz + Manzate 75DG 3 lb + Activator 90 1 qt/100 gal Captan 80WDG 30 oz + Ziram 76DF 3 lb
#8#9-10
<1 a <0.1 a 5 a 0.2 a
13 Torino 10SC 8 fl oz + Mettle 125ME 10 fl oz + Manzate 75DG 3 lb + Activator 90 1 qt/100 gal Captan 80WDG 30 oz + Ziram 76DF 3 lb
#8#9-10
<1 ab <0.1 a 10 a-c 0.3 ab
14 Vivando 15 oz + Manzate Pro-Stick 75DG 3 lb + Activator 90 1 qt/100 gal Captan 80WDG 30 oz + Ziram 76DF 3 lb
#8#9-10
6 de 0.4 ab 10 a-d 0.2 ab
15 Topguard 10 fl oz Fontelis 1.76SC 20 fl oz+ Damoil 1 qt Captan 80WDG 30 oz + Ziram 76DF 3 lb
#1,3,5,7#2,4,6,8#9-10
2 bc <0.1 a 10 a-c 0.2 ab
16 Fontelis 1.76SC 20 fl oz+ Damoil 1 qt Topguard 10 fl oz Captan 80WDG 30 oz + Ziram 76DF 3 lb
#1,3,5,7#2,4,6,8#9-10
1 a-c <0.1 a 21 ef 0.6 a-c
Mean separation by Waller-Duncan K-ratio t-test (p=0.05). Four reps; 10 shoots per tree rated 20 Jul.
*“Leaf spots” refers to an unidentified symptom; could be inhibited c-a rust, frogeye leaf spot or leaf injury.
Applied airblast at 100 gpa to both sides of the row on each application date as follows: 15 Apr (pink); 25 Apr (bloom); 6 May (petal fall); 1st-7th covers: 22 May, 5 Jun, 18 Jun, 2 Jul, 16 Jul, 31 Jul, 13 Aug.

135
Table 16. Scab and summer disease control on Idared apples, 2015.
Scab, % fruit inf. or lesions /fruit at harvest % lvs Scab Brooks Sooty Fly Treatment and rate /A Timing Inf. % fruit les/fruit spot blotch speck0 Non-treated control --- 48 e 90 g 9.5 g 7 b 99 f 82 d 1 Topguard 10 fl oz
Merivon 4.18SC 4 fl oz+ Activator 90 1 qt/100 gal Captan 80WDG 30 oz + Ziram 76DF 3 lb
#1,3,5,7 #2,4,6,8 #9-10
46 de 56 e 2.3 de 0 a 0 a 1 ab
2 Topguard 10 fl oz Aprovia 0.83EC 4 fl oz + Activator 90 1 qt/100 gal Captan 80WDG 30 oz + Ziram 76DF 3 lb
#1,3,5,7 #2,4,6,8 #9-10
30 ab 14 ab 0.2 a 0 a 13 bc 0 a
3 Topguard 10 fl oz Aprovia 0.83EC 5.5 fl oz+ Activator 90 1 qt/100 gal Captan 80WDG 30 oz + Ziram 76DF 3 lb
#1,3,5,7 #2,4,6,8 #9-10
22 a 13 a 0.2 a 0 a 16 bc 0 a
4 Topguard 10 fl oz Aprovia 0.83EC 7 fl oz+ Activator 90 1 qt/100 gal Captan 80WDG 30 oz + Ziram 76DF 3 lb
#1,3,5,7 #2,4,6,8 #9-10
30 a-c 14 ab 0.3 ab 0 a 16 bc 2 ab
5 GWN-10250 20EC 36 fl oz + Manzate 75DG 3 lb + Activator 90 1 qt/100 gal Captan 80WDG 30 oz + Ziram 76DF 3 lb
#8 #9-10
30 ab 29 bc 0.7 a-c 0 a 15 bc 1 ab
6 GWN-10389 20EC 36 fl oz + Manzate 75DG 3 lb + Activator 90 1 qt/100 gal Captan 80WDG 30 oz + Ziram 76DF 3 lb
#8 #9-10
32 a-d 36 c-e 0.9 a-c 0 a 14 bc 0 a
7 GWN-10290 40EC 18 fl oz + Manzate 75DG 3 lb + Activator 90 1 qt/100 gal Captan 80WDG 30 oz + Ziram 76DF 3 lb
#8 #9-10
37 b-e 40 c-e 1.2 a-d 0 a 7 b 2 ab
8 Torino 10SC 5 fl oz + Manzate 75DG 3 lb + Activator 90 1 qt/100 gal Captan 80WDG 30 oz + Ziram 76DF 3 lb
#8 #9-10
42 b-e 38 c-e 1.0 a-c 0 a 14 bc 2 ab
9 Torino 10SC 6.5 fl oz + Manzate 75DG 3 lb + Activator 90 1 qt/100 gal Captan 80WDG 30 oz + Ziram 76DF 3 lb
#8 #9-10
43 b-e 39 c-e 1.5 c-e 0 a 10 bc 5 bc
10 Torino 10SC 8 fl oz + Manzate 75DG 3 lb + Activator 90 1 qt/100 gal Captan 80WDG 30 oz + Ziram 76DF 3 lb
#8 #9-10
44 c-e 52 de 1.9 c-e 0 a 13 bc 0 a
11 Mettle 125ME 10 fl oz + Manzate 75DG 3 lb + Activator 90 1 qt/100 gal Captan 80WDG 30 oz + Ziram 76DF 3 lb
#8 #9-10
42 b-e 42 c-e 1.3 a-e 0 a 10 bc 0 a
12 Torino 10SC 5 fl oz + Mettle 125ME 10 fl oz + Manzate 75DG 3 lb + Activator 90 1 qt/100 gal Captan 80WDG 30 oz + Ziram 76DF 3 lb
#8 #9-10
34 a-d 37 c-e 1.1 a-c 0 a 9 bc 1 ab
13 Torino 10SC 8 fl oz + Mettle 125ME 10 fl oz + Manzate 75DG 3 lb + Activator 90 1 qt/100 gal Captan 80WDG 30 oz + Ziram 76DF 3 lb
#8 #9-10
44 c-e 42 c-e 1.4 b-e 0 a 24 cd 2 ab
14 Vivando 15 oz + Manzate Pro-Stick 75DG 3 lb + Activator 90 1 qt/100 gal Captan 80WDG 30 oz + Ziram 76DF 3 lb
#8 #9-10
42 b-e 53 e 2.3 e 0 a 15 bc 2 ab
15 Topguard 10 fl oz Fontelis 1.76SC 20 fl oz+ Damoil 1 qt Captan 80WDG 30 oz + Ziram 76DF 3 lb
#1,3,5,7 #2,4,6,8 #9-10
50 e 77 f 3.6 f 0 a 40 de 16 c
16 Fontelis 1.76SC 20 fl oz+ Damoil 1 qt Topguard 10 fl oz Captan 80WDG 30 oz + Ziram 76DF 3 lb
#1,3,5,7 #2,4,6,8 #9-10
22 a 32 cd 0.9 a-c 0 a 45 e 3 ab
Mean separation by Waller-Duncan K-ratio t-test (p=0.05). Four reps; 10 shoots per tree rated 20 Jul, or counts of 25 fruit per tree harvested 23 Sep and rated 5 Oct.. Treatment dates: 15 Apr (pink); 25 Apr (bloom); 6 May (petal fall); First –7th covers: 22 May, 5 Jun, 18 Jun, 2 Jul, 16 Jul, 31 Jul, 13 Aug.
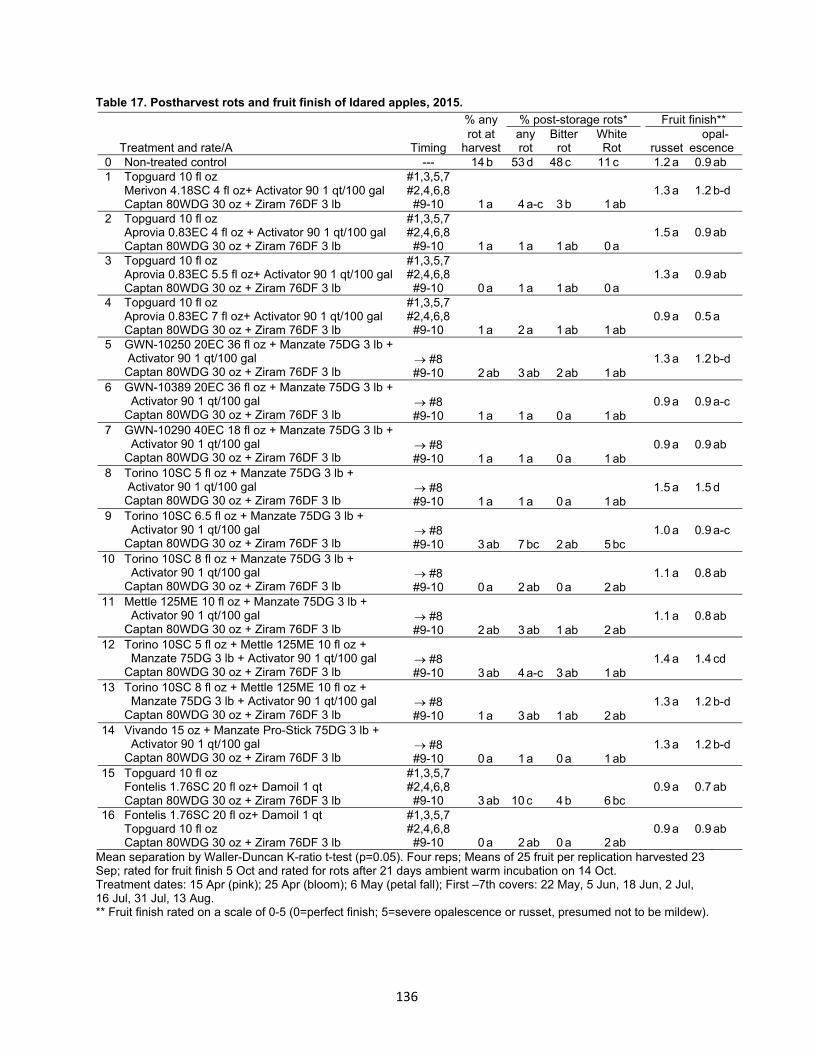
136
Table 17. Postharvest rots and fruit finish of Idared apples, 2015.
% any % post-storage rots* Fruit finish** rot at any Bitter White opal- Treatment and rate/A Timing harvest rot rot Rot russet escence 0 Non-treated control --- 14 b 53 d 48 c 11 c 1.2 a 0.9 ab 1 Topguard 10 fl oz
Merivon 4.18SC 4 fl oz+ Activator 90 1 qt/100 gal Captan 80WDG 30 oz + Ziram 76DF 3 lb
#1,3,5,7#2,4,6,8#9-10 1 a 4 a-c 3 b 1 ab
1.3 a 1.2 b-d
2 Topguard 10 fl oz Aprovia 0.83EC 4 fl oz + Activator 90 1 qt/100 gal Captan 80WDG 30 oz + Ziram 76DF 3 lb
#1,3,5,7#2,4,6,8#9-10 1 a 1 a 1 ab 0 a
1.5 a 0.9 ab
3 Topguard 10 fl oz Aprovia 0.83EC 5.5 fl oz+ Activator 90 1 qt/100 gal Captan 80WDG 30 oz + Ziram 76DF 3 lb
#1,3,5,7#2,4,6,8#9-10 0 a 1 a 1 ab 0 a
1.3 a 0.9 ab
4 Topguard 10 fl oz Aprovia 0.83EC 7 fl oz+ Activator 90 1 qt/100 gal Captan 80WDG 30 oz + Ziram 76DF 3 lb
#1,3,5,7#2,4,6,8#9-10 1 a 2 a 1 ab 1 ab
0.9 a 0.5 a
5 GWN-10250 20EC 36 fl oz + Manzate 75DG 3 lb + Activator 90 1 qt/100 gal Captan 80WDG 30 oz + Ziram 76DF 3 lb
#8 #9-10 2 ab 3 ab 2 ab 1 ab
1.3 a 1.2 b-d
6 GWN-10389 20EC 36 fl oz + Manzate 75DG 3 lb + Activator 90 1 qt/100 gal Captan 80WDG 30 oz + Ziram 76DF 3 lb
#8 #9-10 1 a 1 a 0 a 1 ab
0.9 a 0.9 a-c
7 GWN-10290 40EC 18 fl oz + Manzate 75DG 3 lb + Activator 90 1 qt/100 gal Captan 80WDG 30 oz + Ziram 76DF 3 lb
#8 #9-10 1 a 1 a 0 a 1 ab
0.9 a 0.9 ab
8 Torino 10SC 5 fl oz + Manzate 75DG 3 lb + Activator 90 1 qt/100 gal Captan 80WDG 30 oz + Ziram 76DF 3 lb
#8 #9-10 1 a 1 a 0 a 1 ab
1.5 a 1.5 d
9 Torino 10SC 6.5 fl oz + Manzate 75DG 3 lb + Activator 90 1 qt/100 gal Captan 80WDG 30 oz + Ziram 76DF 3 lb
#8 #9-10 3 ab 7 bc 2 ab 5 bc
1.0 a 0.9 a-c
10 Torino 10SC 8 fl oz + Manzate 75DG 3 lb + Activator 90 1 qt/100 gal Captan 80WDG 30 oz + Ziram 76DF 3 lb
#8 #9-10 0 a 2 ab 0 a 2 ab
1.1 a 0.8 ab
11 Mettle 125ME 10 fl oz + Manzate 75DG 3 lb + Activator 90 1 qt/100 gal Captan 80WDG 30 oz + Ziram 76DF 3 lb
#8 #9-10 2 ab 3 ab 1 ab 2 ab
1.1 a 0.8 ab
12 Torino 10SC 5 fl oz + Mettle 125ME 10 fl oz + Manzate 75DG 3 lb + Activator 90 1 qt/100 gal Captan 80WDG 30 oz + Ziram 76DF 3 lb
#8 #9-10 3 ab 4 a-c 3 ab 1 ab
1.4 a 1.4 cd
13 Torino 10SC 8 fl oz + Mettle 125ME 10 fl oz + Manzate 75DG 3 lb + Activator 90 1 qt/100 gal Captan 80WDG 30 oz + Ziram 76DF 3 lb
#8 #9-10 1 a 3 ab 1 ab 2 ab
1.3 a 1.2 b-d
14 Vivando 15 oz + Manzate Pro-Stick 75DG 3 lb + Activator 90 1 qt/100 gal Captan 80WDG 30 oz + Ziram 76DF 3 lb
#8 #9-10 0 a 1 a 0 a 1 ab
1.3 a 1.2 b-d
15 Topguard 10 fl oz Fontelis 1.76SC 20 fl oz+ Damoil 1 qt Captan 80WDG 30 oz + Ziram 76DF 3 lb
#1,3,5,7#2,4,6,8#9-10 3 ab 10 c 4 b 6 bc
0.9 a 0.7 ab
16 Fontelis 1.76SC 20 fl oz+ Damoil 1 qt Topguard 10 fl oz Captan 80WDG 30 oz + Ziram 76DF 3 lb
#1,3,5,7#2,4,6,8#9-10 0 a 2 ab 0 a 2 ab
0.9 a 0.9 ab
Mean separation by Waller-Duncan K-ratio t-test (p=0.05). Four reps; Means of 25 fruit per replication harvested 23 Sep; rated for fruit finish 5 Oct and rated for rots after 21 days ambient warm incubation on 14 Oct. Treatment dates: 15 Apr (pink); 25 Apr (bloom); 6 May (petal fall); First –7th covers: 22 May, 5 Jun, 18 Jun, 2 Jul, 16 Jul, 31 Jul, 13 Aug. ** Fruit finish rated on a scale of 0-5 (0=perfect finish; 5=severe opalescence or russet, presumed not to be mildew).
137
APPLE (Malus domestica ‘Stayman Winesap’, ‘Idared’) K. S. Yoder, A. E. Cochran II, Scab; Venturia inaequalis W. S. Royston, Jr., S. W. Kilmer, Powdery mildew; Podosphaera leucotricha A.G.F. Engelman, M. A. Borden, Cedar-apple rust; Gymnosporangium juniperi-virginianae and J.K. Repass Brooks fruit spot; Mycosphaerella pomi Virginia Tech Agr. Res. & Ext. Center Sooty blotch; disease complex 595 Laurel Grove Road Flyspeck; Zygophiala jamaicensis Winchester, VA 22602 Bitter rot; Colletotrichum spp. White rot; Botryosphaeria dothidea Alternaria rot; Alternaria spp. Fruit finish
Evaluation of mixed fungicide schedules for broad spectrum disease control on Stayman and Idared, apples, 2015.
Nine combination treatments were tested on 29-yr-old trees in an area where scab and mildew fungus resistance to SI fungicides has been present since 2004. The test was conducted in a randomized block design with four paired-cultivar replicate tree sets separated by non-treated border rows. Treatment rows had been used as non-treated border rows in 2014 to stabilize mildew inoculum pressure for 2015. Tree-row-volume was determined to require a 400 gal/A dilute base for adequate coverage. Fungicide treatments were applied to both sides of the tree on each application date with a Swanson Model DA-400 airblast sprayer at 100 gal/A as follows: 18 Apr (Pk, pink); 29 Apr (Bl, bloom); 9 May (PF, petal fall); 1st-7th covers: 22 May, 5 Jun, 18 Jun, 1 Jul, 17 Jul, 30 Jul, 13 Aug. Maintenance materials applied to the entire test block with the same equipment included: Admire Pro, Altacor, Assail, Asana XL, BioCover MLT, Calypso, Delegate, Imidan, and Movento. Inoculum, placed over each Idared test tree 30 Apr, included cedar rust galls, wild blackberry canes with the sooty blotch and flyspeck fungi, and bitter rot mummies. Other diseases developed from inoculum naturally present in the test area. Foliar data represent averages of counts of ten terminal shoots per tree 15 Jul (Idared) or 27 Aug (Stayman). Post-harvest fruit counts are means of 25-fruit samples picked from each of four paired-tree reps. Idared was sampled 22 Sep, and first rated 1 Oct, then rated again for rots after 22 days at 54-84ºF (mean 70ºF). Stayman was sampled 23 Sep, first rated 8 Oct, and then rated again after 21 days at 54-84ºF (mean 70ºF). Percentage data were converted by the square root arcsin transformation for statistical analysis.
Mildew pressure was moderately heavy in this test block. Mildew conidia were present 6 Apr, and there were 35 dry weather “mildew infection days” from 6 Apr until mid-June, resulting in moderate infection of non-treated trees (Table 18). Under these conditions, nearly all treatments gave significant suppression of mildew incidence on leaves and leaf area infected on both cultivars and on Stayman fruit, but were more variable on Idared fruit. The most effective mildew control was achieved by Topguard (trt #1) and Treatment #8 (Viathon + Microthiol + Manzate/Viathon). The first scab infection period occurred 7 Apr and primary lesions were present during a secondary period 30 Apr. This was followed by 19 more secondary scab infection periods through June. Scab strains resistant to SI fungicides have been present in the test area ten or more years and QoI- resistance has been in the test area at least three years, and this likely impacted control by all treatments involving those chemistries, resulting in generally weak control on leaves and fruit (Table 19). ProPhyt, in combination with Microthiol + Manzate, improved control on Idared leaves and fruit and Stayman leaves compared to Microthiol + Manzate alone (trt #7 vs. 9); substituting Viathon for ProPhyt in the pink -1C applications also improved scab control on Idared fruit (#8 vs. 7 & 9). There were ten cedar-apple rust infection periods from 7 Apr to 27 May, and the treatments that included rotations with SI fungicides through first cover (Topguard, #1 and Viathon, #8) gave excellent control of cedar-apple rust (Table 20) compared to those which had only Manzate/Koverall or scattered timings of SIs. The unidentified “leaf spots” noted in Table 20 were likely related to partially inhibited rust, but did not have any of the orange coloration to clearly identify them as such; treatment #8 also reduced the incidence of “leaf spots”. Under light Brooks spot pressure, all treatments gave complete control (Table 21). Under heavy sooty blotch and flyspeck (SBFS) pressure, all treatments gave good-excellent control. The strongest SBFS control was provided by treatments #7 and 8, compared to Trt #9 which did not include ProPhyt. Merivon + Captan at sixth cover also added a strong component to the schedules of treatments #7-9. The postharvest rot spectrum included mostly bitter rot, white rot and some Alternaria (Tables 22-23). Most treatments gave acceptable rot control considering the pressure and that some rots were secondary due to cracking from severe scab. No treatment significantly (p=0.05) increased the amount of russet or opalescence on either cultivar compared to non-treated fruit; treatment #5 significantly reduced the amount of opalescence on Idared compared to non-treated fruit.
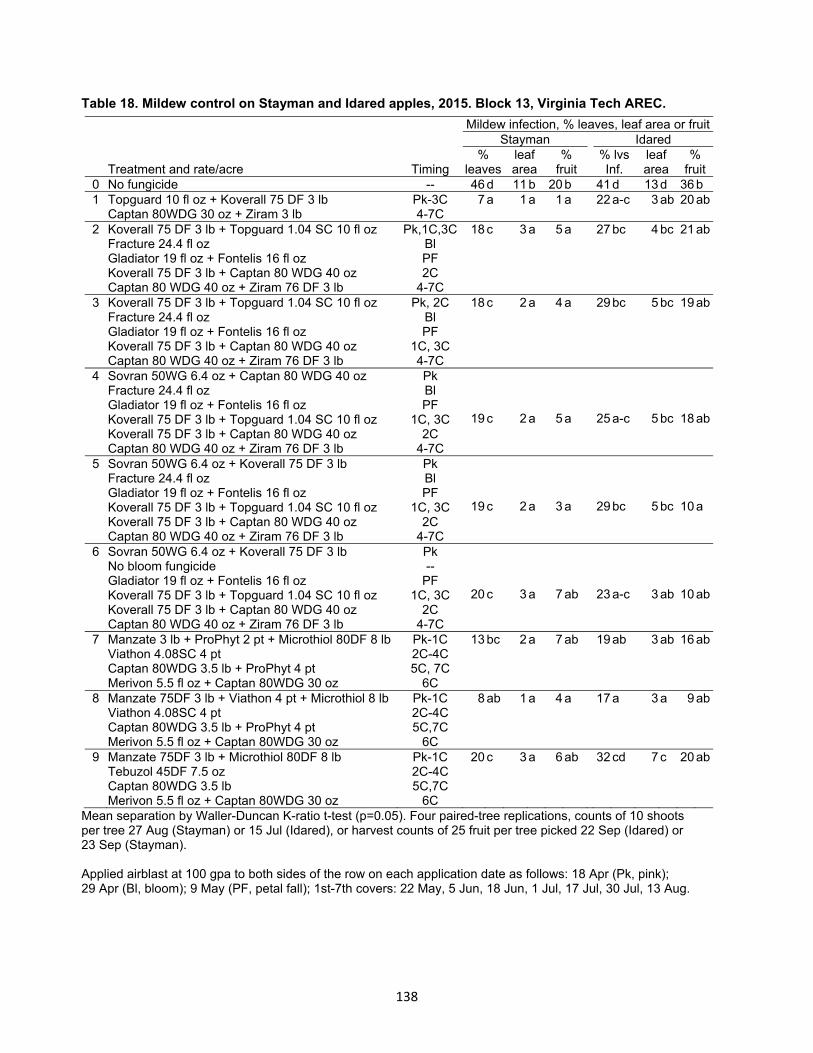
138
Table 18. Mildew control on Stayman and Idared apples, 2015. Block 13, Virginia Tech AREC.
Mildew infection, % leaves, leaf area or fruit Stayman Idared % leaf % % lvs leaf % Treatment and rate/acre Timing leaves area fruit Inf. area fruit
0 No fungicide -- 46 d 11 b 20 b 41 d 13 d 36 b 1 Topguard 10 fl oz + Koverall 75 DF 3 lb
Captan 80WDG 30 oz + Ziram 3 lb Pk-3C 4-7C
7 a 1 a 1 a 22 a-c 3 ab 20 ab
2 Koverall 75 DF 3 lb + Topguard 1.04 SC 10 fl oz Fracture 24.4 fl oz Gladiator 19 fl oz + Fontelis 16 fl oz Koverall 75 DF 3 lb + Captan 80 WDG 40 oz Captan 80 WDG 40 oz + Ziram 76 DF 3 lb
Pk,1C,3CBl PF 2C
4-7C
18 c 3 a 5 a 27 bc 4 bc 21 ab
3 Koverall 75 DF 3 lb + Topguard 1.04 SC 10 fl oz Fracture 24.4 fl oz Gladiator 19 fl oz + Fontelis 16 fl oz Koverall 75 DF 3 lb + Captan 80 WDG 40 oz Captan 80 WDG 40 oz + Ziram 76 DF 3 lb
Pk, 2C Bl PF
1C, 3C 4-7C
18 c 2 a 4 a 29 bc 5 bc 19 ab
4 Sovran 50WG 6.4 oz + Captan 80 WDG 40 oz Fracture 24.4 fl oz Gladiator 19 fl oz + Fontelis 16 fl oz Koverall 75 DF 3 lb + Topguard 1.04 SC 10 fl oz Koverall 75 DF 3 lb + Captan 80 WDG 40 oz Captan 80 WDG 40 oz + Ziram 76 DF 3 lb
Pk Bl PF
1C, 3C 2C
4-7C
19 c 2 a 5 a 25 a-c 5 bc 18 ab
5 Sovran 50WG 6.4 oz + Koverall 75 DF 3 lb Fracture 24.4 fl oz Gladiator 19 fl oz + Fontelis 16 fl oz Koverall 75 DF 3 lb + Topguard 1.04 SC 10 fl oz Koverall 75 DF 3 lb + Captan 80 WDG 40 oz Captan 80 WDG 40 oz + Ziram 76 DF 3 lb
Pk Bl PF
1C, 3C 2C
4-7C
19 c 2 a 3 a 29 bc 5 bc 10 a
6 Sovran 50WG 6.4 oz + Koverall 75 DF 3 lb No bloom fungicide Gladiator 19 fl oz + Fontelis 16 fl oz Koverall 75 DF 3 lb + Topguard 1.04 SC 10 fl oz Koverall 75 DF 3 lb + Captan 80 WDG 40 oz Captan 80 WDG 40 oz + Ziram 76 DF 3 lb
Pk --
PF 1C, 3C
2C 4-7C
20 c 3 a 7 ab 23 a-c 3 ab 10 ab
7 Manzate 3 lb + ProPhyt 2 pt + Microthiol 80DF 8 lbViathon 4.08SC 4 pt Captan 80WDG 3.5 lb + ProPhyt 4 pt Merivon 5.5 fl oz + Captan 80WDG 30 oz
Pk-1C 2C-4C 5C, 7C
6C
13 bc 2 a 7 ab 19 ab 3 ab 16 ab
8 Manzate 75DF 3 lb + Viathon 4 pt + Microthiol 8 lbViathon 4.08SC 4 pt Captan 80WDG 3.5 lb + ProPhyt 4 pt Merivon 5.5 fl oz + Captan 80WDG 30 oz
Pk-1C 2C-4C 5C,7C
6C
8 ab 1 a 4 a 17 a 3 a 9 ab
9 Manzate 75DF 3 lb + Microthiol 80DF 8 lb Tebuzol 45DF 7.5 oz Captan 80WDG 3.5 lb Merivon 5.5 fl oz + Captan 80WDG 30 oz
Pk-1C 2C-4C 5C,7C
6C
20 c 3 a 6 ab 32 cd 7 c 20 ab
Mean separation by Waller-Duncan K-ratio t-test (p=0.05). Four paired-tree replications, counts of 10 shoots per tree 27 Aug (Stayman) or 15 Jul (Idared), or harvest counts of 25 fruit per tree picked 22 Sep (Idared) or 23 Sep (Stayman). Applied airblast at 100 gpa to both sides of the row on each application date as follows: 18 Apr (Pk, pink); 29 Apr (Bl, bloom); 9 May (PF, petal fall); 1st-7th covers: 22 May, 5 Jun, 18 Jun, 1 Jul, 17 Jul, 30 Jul, 13 Aug.

139
Table 19. Scab control on Stayman and Idared apples, 2015. Block 13, Virginia Tech AREC.
Scab infection (%) Stayman Idared leaves lesions/ lvs lesions Treatment and rate/acre Timing inf. leaf fruit Inf. /leaf fruit
0 No fungicide -- 94 d 22.7 bc 100 e 48 cd 2.0 a 97 e 1 Topguard 10 fl oz + Koverall 75 DF 3 lb
Captan 80WDG 30 oz + Ziram 3 lb Pk-3C 4-7C
84 bc 18.9 b 69 bc 56 de 3.9 b 71 bc
2 Koverall 75 DF 3 lb + Topguard 1.04 SC 10 fl oz Fracture 24.4 fl oz Gladiator 19 fl oz + Fontelis 16 fl oz Koverall 75 DF 3 lb + Captan 80 WDG 40 oz Captan 80 WDG 40 oz + Ziram 76 DF 3 lb
Pk,1C,3CBl PF 2C
4-7C
91 d 22.3 bc 94 de 69 f 7.1 c 93 de
3 Koverall 75 DF 3 lb + Topguard 1.04 SC 10 fl oz Fracture 24.4 fl oz Gladiator 19 fl oz + Fontelis 16 fl oz Koverall 75 DF 3 lb + Captan 80 WDG 40 oz Captan 80 WDG 40 oz + Ziram 76 DF 3 lb
Pk, 2CBl PF
1C, 3C4-7C
88 b-d 14.7 b 61 b 65 f 5.7 bc 70 bc
4 Sovran 50WG 6.4 oz + Captan 80 WDG 40 oz Fracture 24.4 fl oz Gladiator 19 fl oz + Fontelis 16 fl oz Koverall 75 DF 3 lb + Topguard 1.04 SC 10 fl oz Koverall 75 DF 3 lb + Captan 80 WDG 40 oz Captan 80 WDG 40 oz + Ziram 76 DF 3 lb
Pk Bl PF
1C, 3C2C
4-7C
91 d 18.1 b 69 bc 55 de 4.1 b 77 bc
5 Sovran 50WG 6.4 oz + Koverall 75 DF 3 lb Fracture 24.4 fl oz Gladiator 19 fl oz + Fontelis 16 fl oz Koverall 75 DF 3 lb + Topguard 1.04 SC 10 fl oz Koverall 75 DF 3 lb + Captan 80 WDG 40 oz Captan 80 WDG 40 oz + Ziram 76 DF 3 lb
Pk Bl PF
1C, 3C2C
4-7C
93 d 28.3 c 84 cd 64 ef 6.3 c 86 cd
6 Sovran 50WG 6.4 oz + Koverall 75 DF 3 lb No bloom fungicide Gladiator 19 fl oz + Fontelis 16 fl oz Koverall 75 DF 3 lb + Topguard 1.04 SC 10 fl oz Koverall 75 DF 3 lb + Captan 80 WDG 40 oz Captan 80 WDG 40 oz + Ziram 76 DF 3 lb
Pk --
PF 1C, 3C
2C 4-7C
90 cd 21.7 bc 88 d 54 d 4.0 b 83 cd
7 Manzate 3 lb + ProPhyt 2 pt + Microthiol 80DF 8 lbViathon 4.08SC 4 pt Captan 80WDG 3.5 lb + ProPhyt 4 pt Merivon 5.5 fl oz + Captan 80WDG 30 oz
Pk-1C 2C-4C5C, 7C
6C
51 a 3.4 a 53 ab 30 a 0.7 a 42 a
8 Manzate 75DF 3 lb + Viathon 4 pt + Microthiol 8 lbViathon 4.08SC 4 pt Captan 80WDG 3.5 lb + ProPhyt 4 pt Merivon 5.5 fl oz + Captan 80WDG 30 oz
Pk-1C 2C-4C5C,7C
6C
45 a 2.8 a 32 a 35 ab 0.8 a 28 a
9 Manzate 75DF 3 lb + Microthiol 80DF 8 lb Tebuzol 45DF 7.5 oz Captan 80WDG 3.5 lb Merivon 5.5 fl oz + Captan 80WDG 30 oz
Pk-1C 2C-4C5C,7C
6C
80 b 17.3 b 56 b 42 bc 1.9 a 65 b
Mean separation by Waller-Duncan K-ratio t-test (p=0.05). Four paired-tree replications, counts of 10 shoots/tree 27 Aug (Stayman) or 15 Jul (Idared), or harvest counts of 25 fruit per tree picked 22 Sep (Idared) or 23 Sep (Stayman).
Applied airblast at 100 gpa to both sides of the row on each application date as follows: 18 Apr (Pk, pink); 29 Apr (Bl, bloom); 9 May (PF, petal fall); 1st-7th covers: 22 May, 5 Jun, 18 Jun, 1 Jul, 17 Jul, 30 Jul, 13 Aug.

140
Table 20. Cedar-apple rust control and “leaf spot” incidence on Stayman and Idared apples, 2015.
Cedar-apple rust “Leaf spots”* % leaves inf. % leaves affected Treatment and rate/acre Timing Stayman Idared Stayman Idared
0 No fungicide -- 33 c 56 c 56 g 33 c 1 Topguard 10 fl oz + Koverall 75 DF 3 lb
Captan 80WDG 30 oz + Ziram 3 lb Pk-3C 4-7C
0 a 4 a 15 b 13 ab
2 Koverall 75 DF 3 lb + Topguard 1.04 SC 10 fl oz Fracture 24.4 fl oz Gladiator 19 fl oz + Fontelis 16 fl oz Koverall 75 DF 3 lb + Captan 80 WDG 40 oz Captan 80 WDG 40 oz + Ziram 76 DF 3 lb
Pk,1C,3CBl PF 2C
4-7C
2 b 18 b 43 ef 21 bc
3 Koverall 75 DF 3 lb + Topguard 1.04 SC 10 fl oz Fracture 24.4 fl oz Gladiator 19 fl oz + Fontelis 16 fl oz Koverall 75 DF 3 lb + Captan 80 WDG 40 oz Captan 80 WDG 40 oz + Ziram 76 DF 3 lb
Pk, 2C Bl PF
1C, 3C 4-7C
6 b 16 b 35 de 25 bc
4 Sovran 50WG 6.4 oz + Captan 80 WDG 40 oz Fracture 24.4 fl oz Gladiator 19 fl oz + Fontelis 16 fl oz Koverall 75 DF 3 lb + Topguard 1.04 SC 10 fl oz Koverall 75 DF 3 lb + Captan 80 WDG 40 oz Captan 80 WDG 40 oz + Ziram 76 DF 3 lb
Pk Bl PF
1C, 3C 2C
4-7C
8 b 21 b 29 cd 16 ab
5 Sovran 50WG 6.4 oz + Koverall 75 DF 3 lb Fracture 24.4 fl oz Gladiator 19 fl oz + Fontelis 16 fl oz Koverall 75 DF 3 lb + Topguard 1.04 SC 10 fl oz Koverall 75 DF 3 lb + Captan 80 WDG 40 oz Captan 80 WDG 40 oz + Ziram 76 DF 3 lb
Pk Bl PF
1C, 3C 2C
4-7C
4 b 21 b 47 fg 17 b
6 Sovran 50WG 6.4 oz + Koverall 75 DF 3 lb No bloom fungicide Gladiator 19 fl oz + Fontelis 16 fl oz Koverall 75 DF 3 lb + Topguard 1.04 SC 10 fl oz Koverall 75 DF 3 lb + Captan 80 WDG 40 oz Captan 80 WDG 40 oz + Ziram 76 DF 3 lb
Pk --
PF 1C, 3C
2C 4-7C
6 b 22 b 31 c-e 17 b
7 Manzate 75DF 3 lb + ProPhyt 2 pt + Microthiol 80DF 8 lb Viathon 4.08SC 4 pt Captan 80WDG 3.5 lb + ProPhyt 4 pt Merivon 5.5 fl oz + Captan 80WDG 30 oz
Pk-1C 2C-4C 5C, 7C
6C
7 b 20 b 23 b-d 18 b
8 Manzate 75DF 3 lb + Viathon 4.08SC 4 pt + Microthiol 8 lbViathon 4.08SC 4 pt Captan 80WDG 3.5 lb + ProPhyt 4 pt Merivon 5.5 fl oz + Captan 80WDG 30 oz
Pk-1C 2C-4C 5C,7C
6C
0 a <1 a 6 a 6 a
9 Manzate 75DF 3 lb + Microthiol 80DF 8 lb Tebuzol 45DF 7.5 oz Captan 80WDG 3.5 lb Merivon 5.5 fl oz + Captan 80WDG 30 oz
Pk-1C 2C-4C 5C,7C
6C
3 b 18 b 22 bc 15 ab
Mean separation by Waller-Duncan K-ratio t-test (p=0.05). Four paired-tree replications, counts of 10 shoots per tree 27 Aug (Stayman) or 15 Jul (Idared). *“Leaf spots” refers to an unidentified symptom; could be inhibited c-a rust, frogeye leaf spot or an injury response. Applied airblast at 100 gpa to both sides of the row on each application date as follows: 18 Apr (Pk, pink); 29 Apr (Bl, bloom); 9 May (PF, petal fall); 1st-7th covers: 22 May, 5 Jun, 18 Jun, 1 Jul, 17 Jul, 30 Jul, 13 Aug.

141
Table 21. Summer disease control on Stayman and Idared apples, 2015. Virginia Tech-AREC.
Brooks % fruit infected spot (%), Sooty blotch Flyspeck Treatment and rate/acre Timing Idared Stayman Idared Stayman Idared
0 No fungicide -- 7 b 100 d 100 d 95 c 97 c 1 Topguard 10 fl oz + Koverall 75 DF 3 lb
Captan 80WDG 30 oz + Ziram 3 lb Pk-3C4-7C 0 a 12 a-c 14 bc
1 a 1 ab
2 Koverall 75 DF 3 lb + Topguard 1.04 SC 10 fl oz Fracture 24.4 fl oz Gladiator 19 fl oz + Fontelis 16 fl oz Koverall 75 DF 3 lb + Captan 80 WDG 40 oz Captan 80 WDG 40 oz + Ziram 76 DF 3 lb
Pk,1C,3CBl PF 2C
4-7C 0 a 19 c 11 a-c
3 a 3 ab 3 Koverall 75 DF 3 lb + Topguard 1.04 SC 10 fl oz
Fracture 24.4 fl oz Gladiator 19 fl oz + Fontelis 16 fl oz Koverall 75 DF 3 lb + Captan 80 WDG 40 oz Captan 80 WDG 40 oz + Ziram 76 DF 3 lb
Pk, 2CBl PF
1C, 3C4-7C 0 a 13 bc 13 a-c
2 a 1 ab 4 Sovran 50WG 6.4 oz + Captan 80 WDG 40 oz
Fracture 24.4 fl oz Gladiator 19 fl oz + Fontelis 16 fl oz Koverall 75 DF 3 lb + Topguard 1.04 SC 10 fl oz Koverall 75 DF 3 lb + Captan 80 WDG 40 oz Captan 80 WDG 40 oz + Ziram 76 DF 3 lb
Pk Bl PF
1C, 3C2C
4-7C 0 a 18 c 23 c
14 b 5 b 5 Sovran 50WG 6.4 oz + Koverall 75 DF 3 lb
Fracture 24.4 fl oz Gladiator 19 fl oz + Fontelis 16 fl oz Koverall 75 DF 3 lb + Topguard 1.04 SC 10 fl oz Koverall 75 DF 3 lb + Captan 80 WDG 40 oz Captan 80 WDG 40 oz + Ziram 76 DF 3 lb
Pk Bl PF
1C, 3C2C
4-7C 0 a 18 c 13 bc
1 a 10 b 6 Sovran 50WG 6.4 oz + Koverall 75 DF 3 lb
No bloom fungicide Gladiator 19 fl oz + Fontelis 16 fl oz Koverall 75 DF 3 lb + Topguard 1.04 SC 10 fl oz Koverall 75 DF 3 lb + Captan 80 WDG 40 oz Captan 80 WDG 40 oz + Ziram 76 DF 3 lb
Pk --
PF 1C, 3C
2C 4-7C 0 a 21 c 10 a-c
5 a 7 b 7 Manzate 3 lb + ProPhyt 2 pt + Microthiol 80DF 8 lb
Viathon 4.08SC 4 pt Captan 80WDG 3.5 lb + ProPhyt 4 pt Merivon 5.5 fl oz + Captan 80WDG 30 oz
Pk-1C2C-4C 5C, 7C
6C 0 a 3 ab 0 a
1 a 0 a 8 Manzate 75DF 3 lb + Viathon 4 pt + Microthiol 8 lb
Viathon 4.08SC 4 pt Captan 80WDG 3.5 lb + ProPhyt 4 pt Merivon 5.5 fl oz + Captan 80WDG 30 oz
Pk-1C2C-4C5C,7C
6C 0 a 3 a 2 ab
1 a 0 a 9 Manzate 75DF 3 lb + Microthiol 80DF 8 lb
Tebuzol 45DF 7.5 oz Captan 80WDG 3.5 lb Merivon 5.5 fl oz + Captan 80WDG 30 oz
Pk-1C2C-4C5C,7C
6C 0 a 16 c 15 a-c
2 a 3 ab Mean separation by Waller-Duncan K-ratio t-test (p=0.05). Four paired-tree replications, or harvest counts of 25 fruit per tree per tree picked 22 Sep (Idared) or 23 Sep (Stayman). Applied airblast at 100 gpa to both sides of the row on each application date as follows: 18 Apr (Pk, pink); 29 Apr (Bl, bloom); 9 May (PF, petal fall); 1st-7th covers: 22 May, 5 Jun, 18 Jun, 1 Jul, 17 Jul, 30 Jul, 13 Aug.

142
Table 22. Post-harvest rot incidence on Stayman apple, 2015. Virginia Tech-AREC.
% any Rot incidence after 21 days incubation* rot at Any bitter White Alternaria Treatment and rate/acre Timing harvest rot rot rot rot
0 No fungicide -- 7 b-d 33 e 21 c 8 cd 6 c 1 Topguard 10 fl oz + Koverall 75 DF 3 lb
Captan 80WDG 30 oz + Ziram 3 lb Pk-3C4-7C 5 b-d 7 bc 4 ab 2 ab 1 ab
2 Koverall 75 DF 3 lb + Topguard 1.04 SC 10 fl oz Fracture 24.4 fl oz Gladiator 19 fl oz + Fontelis 16 fl oz Koverall 75 DF 3 lb + Captan 80 WDG 40 oz Captan 80 WDG 40 oz + Ziram 76 DF 3 lb
Pk,1C,3CBl PF 2C
4-7C 13 d 21 de 4 ab 14 d 3 a-c 3 Koverall 75 DF 3 lb + Topguard 1.04 SC 10 fl oz
Fracture 24.4 fl oz Gladiator 19 fl oz + Fontelis 16 fl oz Koverall 75 DF 3 lb + Captan 80 WDG 40 oz Captan 80 WDG 40 oz + Ziram 76 DF 3 lb
Pk, 2CBl PF
1C, 3C4-7C 2 ab 6 ab 0 a 5 a-c 1 ab
4 Sovran 50WG 6.4 oz + Captan 80 WDG 40 oz Fracture 24.4 fl oz Gladiator 19 fl oz + Fontelis 16 fl oz Koverall 75 DF 3 lb + Topguard 1.04 SC 10 fl oz Koverall 75 DF 3 lb + Captan 80 WDG 40 oz Captan 80 WDG 40 oz + Ziram 76 DF 3 lb
Pk Bl PF
1C, 3C2C
4-7C 0 a 5 ab 0 a 0 a 5 bc 5 Sovran 50WG 6.4 oz + Koverall 75 DF 3 lb
Fracture 24.4 fl oz Gladiator 19 fl oz + Fontelis 16 fl oz Koverall 75 DF 3 lb + Topguard 1.04 SC 10 fl oz Koverall 75 DF 3 lb + Captan 80 WDG 40 oz Captan 80 WDG 40 oz + Ziram 76 DF 3 lb
Pk Bl PF
1C, 3C2C
4-7C 10 cd 19 c-e 7 b 11 cd 2 a-c 6 Sovran 50WG 6.4 oz + Koverall 75 DF 3 lb
No bloom fungicide Gladiator 19 fl oz + Fontelis 16 fl oz Koverall 75 DF 3 lb + Topguard 1.04 SC 10 fl oz Koverall 75 DF 3 lb + Captan 80 WDG 40 oz Captan 80 WDG 40 oz + Ziram 76 DF 3 lb
Pk --
PF 1C, 3C
2C 4-7C 5 b-d 8 b-d 2 a 5 b-d 1 ab
7 Manzate 3 lb + ProPhyt 2 pt + Microthiol 80DF 8 lbViathon 4.08SC 4 pt Captan 80WDG 3.5 lb + ProPhyt 4 pt Merivon 5.5 fl oz + Captan 80WDG 30 oz
Pk-1C2C-4C5C, 7C
6C 1 ab 1 a 1 a 0 a 0 a 8 Manzate 75DF 3 lb + Viathon 4 pt + Microthiol 8 lb
Viathon 4.08SC 4 pt Captan 80WDG 3.5 lb + ProPhyt 4 pt Merivon 5.5 fl oz + Captan 80WDG 30 oz
Pk-1C2C-4C5C,7C
6C 2 a-c 5 ab 1 a 3 a-c 0 a 9 Manzate 75DF 3 lb + Microthiol 80DF 8 lb
Tebuzol 45DF 7.5 oz Captan 80WDG 3.5 lb Merivon 5.5 fl oz + Captan 80WDG 30 oz
Pk-1C2C-4C5C,7C
6C 2 a-c 4 ab 1 a 2 ab 0 a Mean separation by Waller-Duncan K-ratio t-test (p=0.05). Four paired-tree replications. * Counts of 25 fruit per tree picked 23 Sep, first rated 8 Oct, then rated after 21 days at 54-84ºF (mean 70ºF). Applied airblast at 100 gpa to both sides of the row on each application date as follows: 18 Apr (Pk, pink); 29 Apr (Bl, bloom); 9 May (PF, petal fall); 1st-7th covers: 22 May, 5 Jun, 18 Jun, 1 Jul, 17 Jul, 30 Jul, 13 Aug.

143
Table 23. Post-harvest rot incidence on Idared apple, 2015. Virginia Tech-AREC.
% any Rot incidence after 22 days incubation* rot at Any Bitter White Alternaria Treatment and rate/acre Timing harvest rot rot rot rot
0 No fungicide -- 23 b 59 e 42 d 15 c 8 b 1 Topguard 10 fl oz + Koverall 75 DF 3 lb
Captan 80WDG 30 oz + Ziram 3 lb Pk-3C4-7C 0 a 4 a-c 1 ab 3 ab 0 a
2 Koverall 75 DF 3 lb + Topguard 1.04 SC 10 fl oz Fracture 24.4 fl oz Gladiator 19 fl oz + Fontelis 16 fl oz Koverall 75 DF 3 lb + Captan 80 WDG 40 oz Captan 80 WDG 40 oz + Ziram 76 DF 3 lb
Pk,1C,3CBl PF 2C
4-7C 2 a 2 ab 2 a-c 0 a 0 a 3 Koverall 75 DF 3 lb + Topguard 1.04 SC 10 fl oz
Fracture 24.4 fl oz Gladiator 19 fl oz + Fontelis 16 fl oz Koverall 75 DF 3 lb + Captan 80 WDG 40 oz Captan 80 WDG 40 oz + Ziram 76 DF 3 lb
Pk, 2CBl PF
1C, 3C4-7C 8 a 14 d 7 c 7 bc 0 a
4 Sovran 50WG 6.4 oz + Captan 80 WDG 40 oz Fracture 24.4 fl oz Gladiator 19 fl oz + Fontelis 16 fl oz Koverall 75 DF 3 lb + Topguard 1.04 SC 10 fl oz Koverall 75 DF 3 lb + Captan 80 WDG 40 oz Captan 80 WDG 40 oz + Ziram 76 DF 3 lb
Pk Bl PF
1C, 3C2C
4-7C 2 a 4 a-c 2 a-c 2 ab 0 a 5 Sovran 50WG 6.4 oz + Koverall 75 DF 3 lb
Fracture 24.4 fl oz Gladiator 19 fl oz + Fontelis 16 fl oz Koverall 75 DF 3 lb + Topguard 1.04 SC 10 fl oz Koverall 75 DF 3 lb + Captan 80 WDG 40 oz Captan 80 WDG 40 oz + Ziram 76 DF 3 lb
Pk Bl PF
1C, 3C2C
4-7C 3 a 7 cd 0 a 7 bc 0 a 6 Sovran 50WG 6.4 oz + Koverall 75 DF 3 lb
No bloom fungicide Gladiator 19 fl oz + Fontelis 16 fl oz Koverall 75 DF 3 lb + Topguard 1.04 SC 10 fl oz Koverall 75 DF 3 lb + Captan 80 WDG 40 oz Captan 80 WDG 40 oz + Ziram 76 DF 3 lb
Pk --
PF 1C, 3C
2C 4-7C 4 a 5 b-d 2 a-c 3 ab 0 a
7 Manzate 3 lb + ProPhyt 2 pt + Microthiol 80DF 8 lbViathon 4.08SC 4 pt Captan 80WDG 3.5 lb + ProPhyt 4 pt Merivon 5.5 fl oz + Captan 80WDG 30 oz
Pk-1C2C-4C5C, 7C
6C 0 a 8 cd 4 bc 5 b 0 a 8 Manzate 75DF 3 lb + Viathon 4 pt + Microthiol 8 lb
Viathon 4.08SC 4 pt Captan 80WDG 3.5 lb + ProPhyt 4 pt Merivon 5.5 fl oz + Captan 80WDG 30 oz
Pk-1C2C-4C5C,7C
6C 0 a 0 a 0 a 0 a 0 a 9 Manzate 75DF 3 lb + Microthiol 80DF 8 lb
Tebuzol 45DF 7.5 oz Captan 80WDG 3.5 lb Merivon 5.5 fl oz + Captan 80WDG 30 oz
Pk-1C2C-4C5C,7C
6C 4 a 6 cd 1 ab 5 b 0 a Mean separation by Waller-Duncan K-ratio t-test (p=0.05). Four paired-tree replications. * Counts of 25 fruit per tree picked 22 Sep, first rated 1 Oct, then rated after 22 days at 54-84ºF (mean 70ºF). Applied airblast at 100 gpa to both sides of the row on each application date as follows: 18 Apr (Pk, pink); 29 Apr (Bl, bloom); 9 May (PF, petal fall); 1st-7th covers: 22 May, 5 Jun, 18 Jun, 1 Jul, 17 Jul, 30 Jul, 13 Aug.

144
APPLE (Malus domestica ‘Fuji’) K. S. Yoder, A. E. Cochran II, Scab; Venturia inaequalis W. S. Royston, Jr., S. W. Kilmer, Powdery mildew; Podosphaera leucotricha A.G.F. Engelman, M. A. Borden, Cedar-apple rust; Gymnosporangium juniperi-virginianae and J.K. Repass Sooty blotch; disease complex Virginia Tech Agr. Res. & Ext. Center Flyspeck; Zygophiala jamaicensis 595 Laurel Grove Road Bitter rot; Colletotrichum spp. Winchester, VA 22602 White rot; Botryosphaeria dothidea Alternaria rot; Alternaria spp. Fruit finish Disease control by fungicides first applied for after-infection scab control on Fuji apple, 2015.
Ten treatments involving four SDHI-related products, alone and with Manzate or Ziram, were tested for apple scab control in post-infection regimes followed by successive applications. The first scab infection period occurred 7 Apr and primary lesions were present during a secondary period 30 Apr-1 May. No fungicides had been applied before the treatment series began 5 May (PF, petal fall), five days after the 30 Apr-1 May scab and rust infection period. Prior to the first planned application, another scab and rust infection period occurred 1-2 May. This was followed by 19 more secondary scab infection periods through June. Scab strains resistant to SI fungicides have been present in the test area ten or more years and QoI-resistance has been in the test area at least three years, and this likely impacted control by Flint (QoI) and Inspire Super (difenoconazole), reducing control on leaves and fruit. The treatments were applied dilute to runoff with a single-nozzle handgun at 250 psi in a randomized block design with four single-tree replications. Following the initial application, all treatments were re-applied as 1st-7th covers: 19 May, 5 Jun, 17 Jun, 30 Jun, 14 Jul, 28 Jul, and 12 Aug. Because of the delay in the initial application, foliar data are based on means of leaves beyond the eighth leaf on ten shoots per tree 6 Aug. Fruit data are based on 25 fruit per tree picked 30 Sep and held in cold storage until they were moved to ambient temperatures (57-80º F, mean 70.7º F) 15 Oct, and first rated 19 Oct then evaluated for rots 29 Oct after 14 days incubation. Maintenance insecticides, applied with an airblast sprayer, included: Admire-Pro, Asana XL, Altacor, Assail, BioCover MLT, Calypso, Carbaryl, Delegate, Imidan, Lannate LV, and Movento. Percentage data were converted by the square root arcsin transformation for statistical analysis.
Although there is confirmed DMI and QoI resistance in scab in the test area, under this heavy scab pressure there was slight suppression on leaves and fruit by Flint + Manzate, and somewhat better control by Inspire Super + Manzate (Table 24). Aprovia was the most effective treatment on foliage and fruit. On foliage, Merivon and Fontelis gave similar control, and Luna Tranquility was significantly weaker than the other SDHIs and was the only product whose control on foliage was improved by the addition of Manzate. Without Manzate on fruit, Aprovia was significantly more effective than Fontelis. On fruit, weaker control was improved by adding Manzate to Merivon and Luna Tranquility, but not to Fontelis. Under light mildew pressure, most treatments gave significant suppression on foliage and fruit. Inspire Super gave excellent control of cedar-apple rust on leaves and fruit (Table 25). The unidentified “leaf spots”, noted in Table 25, were likely related to partially inhibited rust, but did not have any orange coloration to clearly identify them as such. It is possible that the delayed application schedule increased the amount of rust exposed to the fungicides and Inspire Super, which gave the most cedar-apple rust control, also had the fewest leaf spot lesions. Carrying these schedules on through late season gave opportunity to test for control of summer diseases. As expected combination treatments involving Manzate followed by Ziram, gave excellent control of sooty blotch and flyspeck (SBFS) under sever disease pressure(Table 26). Aprovia, applied alone (trt #7), gave excellent control of SBFS and fruit rots while Luna Tranquility and Fontelis showed weaknesses for these diseases. No treatment significantly increased the severity of russet or opalescence, while Merivon significantly reduced the amount of opalescence.

145
Table 24. Control of scab and mildew by treatments first applied to Fuji apple at petal fall, 2015.
Block 8-West, Virginia Tech AREC, Winchester.
Scab .
beyond leaf #8 Fruit infection Mildew
% lvs lesions/ % fruit lesions/ % of % Treatment and rate/100 gal Timing* Inf. leaf Inf. fruit all leaves fruit
0 No fungicide --- 93e 26.5e 100d 24.4 e 6 e 10d
1 Inspire Super 3 fl oz+ Manzate 12 oz Inspire Super 3 fl oz + Ziram 76DF 12 oz
PF-4C5-7C
40bc 3.7ab 64b 4.8 c 3 d 1ab
2 Flint 50WG 0.5 oz+ Manzate 12 oz Flint 50WG 0.5 oz + Ziram 76DF 12 oz
PF-4C5-7C
74d 9.9d 76bc 5.9 c <1 bc 0a
3 Luna Tranquility SC 3 fl oz PF-7C 62d 8.8cd 88c 9.6 d <1 c 5cd
4 Luna Tranquility 3 fl oz + Manzate 12 oz Luna Tranquility 3 fl oz + Ziram 12 oz
PF-4C5-7C
46c 5.2bc 65b 4.0 a-c <1 a-c 2a-c
5 Merivon 1.25 fl oz PF-7C 42bc 3.9ab 73b 5.4 c 0 a 0a
6 Merivon 1.25 fl oz + Manzate 12 oz Merivon 1.25 fl oz + Ziram 76DF 12 oz
PF-4C5-7C
44c 3.5ab 47a 1.4 a <1 ab 0a
7 Aprovia 0.83EC 1.75 fl oz PF-7C 23a 1.1a 41a 1.8 ab 0 a 0a
8 Aprovia 1.75 fl oz + Manzate 75DF 12 ozAprovia 1.75 fl oz + Ziram 76DF 12 oz
PF-4C5-7C
28ab 1.3ab 36a 1.4 a <1 c 0a
9 Fontelis 1.67SC 4 fl oz PF-7C 38bc 2.9ab 71b 5.9 c <1 a-c 4b-d
10 Fontelis 4 fl oz + Manzate 12 oz Fontelis 4 fl oz + Ziram 76DF 12 oz
PF-4C5-7C
43c 4.7ab 67b 4.4 bc <1 a-c 2a-c
Mean separation by Waller-Duncan K-ratio t-test (p=0.05). Four single-tree replications, 10 shoots/tree rated 6 Aug. Fruit data are based on 25 fruit per tree picked 30 Sep and held in cold storage until they were moved to ambient temperatures 15 Oct and rated 19 Oct. * Treatment applications: No fungicides applied before treatment series began 5 May (PF,petal fall), five days after the 30 Apr-1 May scab and rust infection period. Prior to the first planned application, another scab and rust infection period occurred 1-2 May. Follow-up applications, as 1st-7th covers, were: 19 May, 5 Jun, 17 Jun, 30 Jun, 14 Jul, 28 Jul, and 12 Aug.
Pre-treatment infection periods: 7-8 Apr: 17 hr wet at 67-46° F; with 0.4 inch of rain. (scab and cedar-apple rust). 8-9 Apr: 16 hr wet at 48-44°, 0.2 in. rain (scab). 9-10 Apr: 18 hr split wetting at 50-58°, 0.34 in. rain (scab). 14-15 Apr: 30 hr wet at 70-45°, 18 hours above 55° with 0.62 in. rain (scab and rusts). 19-20 Apr: 15 hr wet at 67-50° with 1.12 in. of rain (scab and rusts). Scab lesions from 7-10 Apr infection periods began to appear week of 27 Apr. 30 Apr - 1 May: 14 hr wet at 63-54° with 0.21 in. of rain (scab and rusts). 1-2 May: 15 hr at 58-53° with 0.21 in. of rain (scab and rusts). .

146
Table 25. Control of rusts and “leaf spots” by treatments first applied at petal fall. Fuji apple, 2015. Block 8-West, Virginia Tech AREC.
Cedar-apple rust and “leaf spots”, leaf #9 and younger Cedar- Quince Fruit finish
Cedar-apple rust “Leaf spots” apple rust rust, rating (0-5)*
% lvs lesions/ % lvs lesions/ % fruit % fruit Opal- Treatment and rate/100 gal Timing* Inf. leaf affected leaf infected infected russet escence
0 No fungicide --- 47e 15.8e 53c 5.2 e 8b 2ab 1.8a 1.6b 1 Inspire Super 3 fl oz+ Manzate 12 oz
Inspire Super 3 fl oz + Ziram 76DF 12 oz PF-4C5-7C
9a 0.4a 22a 1.0 a 1ab 0a 1.5a 1.2ab
2 Flint 50WG 0.5 oz+ Manzate 12 oz Flint 50WG 0.5 oz + Ziram 76DF 12 oz
PF-4C5-7C
33b-d 5.3b 45bc 3.1 b-d 0a 0a 1.3a 1.1ab
3 Luna Tranquility SC 3 fl oz PF-7C 32b-d 7.9b-d 33ab 2.1 a-c 3ab 0a 1.7a 1.2ab 4 Luna Tranquility 3 fl oz + Manzate 12 oz
Luna Tranquility 3 fl oz + Ziram 12 oz PF-4C5-7C
44de 11.2d 42bc 3.8 c-e 5ab 3b 1.4a 1.1ab
5 Merivon 1.25 fl oz PF-7C 35b-e 8.1b-d 41bc 3.3 b-d 5ab 0a 1.7a 1.3ab 6 Merivon 1.25 fl oz + Manzate 12 oz
Merivon 1.25 fl oz + Ziram 76DF 12 oz PF-4C5-7C
41c-e 9.6cd 54c 4.1 de 6b 0a 1.4a 0.9a
7 Aprovia 0.83EC 1.75 fl oz PF-7C 27b 4.5b 40bc 3.0 b-d 0a 0a 1.6a 0.9ab 8 Aprovia 1.75 fl oz + Manzate 75DF 12 oz
Aprovia 1.75 fl oz + Ziram 76DF 12 oz PF-4C5-7C
27bc 4.8b 33ab 1.7 ab 3ab 0a 1.8a 1.2ab
9 Fontelis 1.67SC 4 fl oz PF-7C 33b-d 6.3bc 39bc 2.0 ab 4ab 1ab 1.9a 1.4ab 10 Fontelis 4 fl oz + Manzate 12 oz
Fontelis 4 fl oz + Ziram 76DF 12 oz PF-4C5-7C
29bc 7.6b-d 34ab 2.2 a-c 6ab 0a 1.7a 1.3ab
Mean separation by Waller-Duncan K-ratio t-test (p=0.05). Four single-tree replications, 10 shoots/tree rated 6 Aug. Fruit data are based on 25 fruit per tree picked 30 Sep and held in cold storage until they were moved to ambient temperatures 15 Oct and first rated 19 Oct then evaluated for rots 29 Oct after 14 days incubation. * Fruit finish rated on a scale of 0-5 (0 = perfect finish, 5 = severe russet or opalescence). Treatment applications: 5 May (PF, petal fall), five days after the 30 Apr-1 May scab and rust infection period. Follow-up applications, as 1st-7th covers, were: 19 May, 5 Jun, 17 Jun, 30 Jun, 14 Jul, 28 Jul, and 12 Aug.

147
Table 26. Control of summer diseases and rots by treatments first applied at petal fall. Fuji apple, Block 8-West, 2015 Virginia Tech AREC.
% fruit or fruit area infected % post-storage incubation rots*8 Sooty blotch Flyspeck Any Bitter White Alternaria Treatment and rate/100 gal Timing* % fruit % area % fruit % area rot rot rot rot 0 No fungicide --- 100c 17.3c 100e 16.0d 42 f 26e 16b 7a 1 Inspire Super 3 fl oz+ Manzate 12 oz
Inspire Super 3 fl oz + Ziram 76DF 12 oz PF-4C5-7C 1a 0.1a 1a 0.1a 13 de 8d 3a 2a
2 Flint 50WG 0.5 oz+ Manzate 12 oz Flint 50WG 0.5 oz + Ziram 76DF 12 oz
PF-4C5-7C 4a 0.2a 2a 0.1a 4 a-d 1ab 1a 2a
3 Luna Tranquility SC 3 fl oz PF-7C 29b 1.6b 47d 3.2c 11 c-e 7cd 3a 1a 4 Luna Tranquility 3 fl oz + Manzate 12 oz
Luna Tranquility 3 fl oz + Ziram 12 oz PF-4C5-7C 0a 0.0a 3ab 0.5ab 7 b-e 5b-d 1a 1a
5 Merivon 1.25 fl oz PF-7C 2a 0.1a 17bc 0.6a 6 a-d 3a-c 1a 2a 6 Merivon 1.25 fl oz + Manzate 12 oz
Merivon 1.25 fl oz + Ziram 76DF 12 oz PF-4C5-7C 5a 0.3a 3ab 0.2a 2 ab 1ab 0a 1a
7 Aprovia 0.83EC 1.75 fl oz PF-7C 2a 0.1a 4ab 0.2a 5 a-c 2a-c 1a 4a 8 Aprovia 1.75 fl oz + Manzate 75DF 12 oz
Aprovia 1.75 fl oz + Ziram 76DF 12 oz PF-4C5-7C 2a 0.1a 2a 0.1a 1 a 0a 1a 0a
9 Fontelis 1.67SC 4 fl oz PF-7C 21b 1.1b 31cd 1.7bc 18 e 10d 3a 7a 10 Fontelis 4 fl oz + Manzate 12 oz
Fontelis 4 fl oz + Ziram 76DF 12 oz PF-4C5-7C 2a 0.1a 7ab 0.4a 4 a-c 0a 1a 3a
Mean separation by Waller-Duncan K-ratio t-test (p=0.05). Four single-tree replications. *Treatment applications: No fungicides applied before treatment series began 5 May (petal fall), five days after the 30 Apr-1 May scab and rust infection period. Prior to the first planned application, another scab and rust infection period occurred 1-2 May. Follow-up applications, as 1st-7th covers, were: 19 May, 5 Jun, 17 Jun, 30 Jun, 14 Jul, 28 Jul, and 12 Aug. **Fruit data are based on 25 fruit per tree picked 30 Sep and held in cold storage until they were moved to ambient temperatures (57-80º F, mean 70.7º F) 15 Oct and first rated 19 Oct then evaluated for rots 29 Oct after 14 days’ incubation

148
. APPLE (Malus domestica ‘Fuji’) K. S. Yoder, A. E. Cochran II, Scab; Venturia inaequalis W. S. Royston, Jr., S. W. Kilmer, Powdery mildew; Podosphaera leucotricha A.G.F. Engelman, M. A. Borden, Cedar-apple rust; Gymnosporangium juniperi-virginianae and J.K. Repass Sooty blotch; disease complex Virginia Tech Agr. Res. & Ext. Center Flyspeck; Zygophiala jamaicensis 595 Laurel Grove Road Bitter rot; Colletotrichum spp. Winchester, VA 22602 White rot; Botryosphaeria dothidea Alternaria rot; Alternaria spp. Fruit finish Scab and broad spectrum disease control by fungicides first applied at late bloom on Fuji apple, 2015.
Fourteen treatments tested mixing partners with the SDHI-fungicides, Fontelis and Aprovia. Fontelis and Aprovia were each tested in combination with Manzate/Ziram, Ziram, Captan and ProPhyt, also Fontelis, Aprovia, Manzate/Ziram, Ziram, Captan and ProPhyt were each tested alone. The treatments were applied dilute to runoff with a single-nozzle handgun at 250 psi in a randomized block design with four single-tree replications as follows 29 Apr (late bloom); 12 May (late petal fall); 1st-6th covers: 27 May, 10 Jun, 24 Jun, 8 Jul, 22 Jul, 13 Aug. The first scab infection period had occurred 7 Apr and primary lesions were appearing the week of the first application. Soon after the first application, secondary scab and rust infection periods occurred 30 Apr-1 May and 1-2 May, and these were followed by 19 more secondary scab infection periods through June. Because of the delay in the initial application, foliar data (except mildew) are based on means of leaves beyond the eighth leaf on ten shoots per tree 30 Jul. Fruit data are based on 25 fruit per tree picked 30 Sep and held in cold storage until they were moved to ambient temperatures (57-80º F, mean 70.7º F) 15 Oct and first rated 21 Oct, then evaluated for rots 29 Oct after 14 days incubation. Maintenance insecticides, applied with an airblast sprayer, included Admire-Pro, Asana XL, Altacor, Assail, BioCover MLT, Calypso, Carbaryl, Delegate, Imidan, Lannate LV, and Movento. Percentage data were converted by the square root arcsin transformation for statistical analysis.
At these application rates, Aprovia was the more effective on foliage and fruit than Fontelis, whether applied alone or in combination with Manzate/Ziram, Ziram, Captan and ProPhyt (Table 27). When applied alone, each of the mixing partners also gave significant scab control on leaves and fruit. Under light mildew pressure, most treatments gave significant suppression on foliage and fruit (Table 27). Rust infection periods had occurred 14-15 Apr and 19-20 Apr and the treatments were not very effective for after-infection control on foliage; however Aprovia gave significant suppression of rust incidence on leaves, compared to the non-treated trees, but Fontelis did not (Table 28). Manzate was the only mixing partner that gave significant reduction in rust incidence under these conditions. All treatments significantly reduced the number of rust lesions per leaf, and all significantly reduced cedar-apple rust infection on fruit. The unidentified “leaf spots” shown in Table 28 were likely related to partially inhibited rust, but did not have any orange coloration to clearly identify them as such. There was no significant treatment effect on “leaf spots”. Extending these treatments into the late season gave opportunity to test them for control of summer diseases. Under moderately heavy summer disease pressures, all treatments gave significant control of sooty blotch/ flyspeck (SBFS), and post-incubation bitter rot, white rot and Alternaria rot. Among the mixing partners at these rates, Manzate/Ziram was the most effective for control of SBFS, ProPhyt was significantly more effective than Captan or Ziram for flyspeck, and Ziram was significantly weaker on white rot than other mixing partners. Aprovia was significantly more effective than Fontelis for control of SBFS and “any rot”. All mixing partners improved SBFS control by Fontelis or Aprovia alone. Compared to non-treated trees, no treatment significantly increased the severity of russet or opalescence. Russet was significantly reduced by Fontelis + Ziram, Aprovia, Aprovia + Manzate, and Aprovia + ProPhyt. Opalescence was significantly reduced by Fontelis + Ziram, Aprovia, Aprovia + Manzate, Aprovia + Ziram, Aprovia + Captan, Aprovia + ProPhyt and Ziram alone.

149
Table 27. Control of scab and powdery mildew by treatments first applied at late bloom. Fuji apple, 2015. Block 8-East, VT-AREC.
Scab infection Powdery mildew,
leaf #9 and younger fruit %, all leaves
% leaves lesions/ % fruit lesions/ % leaves % fruit Treatment and rate/100 gal dilute Timing Inf. leaf Inf. fruit infected infected
0 No fungicide --- 83g 21.8e 100h 20.4h 8d 15d
1 Fontelis 1.67SC 4 fl oz Bl-6C 59ef 8.2cd 90g 9.6g 2a-c 5a-d
2 Fontelis 4 fl oz + Manzate 12 oz Fontelis 4 fl oz + Ziram 76DF 12 oz
Bl-3C4-6C
57ef 7.0b-d 58c-e 3.4c-e 2a-c 5a-d
3 Fontelis 4 fl oz + Ziram 76DF 12 oz Bl-6C 66 f 10.8d 60c-e 3.3 c-e 2a-c 6b-d
4 Fontelis 4 fl oz + Captan 80WDG 12 oz Bl-6C 38cd 2.9a-c 44bc 2.0a-c 1a-c 3a-c
5 Fontelis 4 fl oz + ProPhyt 1 pt Bl-6C 34b-d 2.9a-c 69d-f 4.3d-f 1a 6a-c
6 Aprovia 0.83EC 1.75 fl oz Bl-6C 25a-c 1.3ab 25ab 0.8ab 1ab 1ab
7 Aprovia 0.83EC 1.75 fl oz + Manzate 75DF 12 oz Aprovia 0.83EC 1.75 fl oz + Ziram 76DF 12 oz
Bl-3C4-6C
25a-c 1.6ab 23a 0.4a 1ab 2ab
8 Aprovia 0.83EC 1.75 fl oz + Ziram 76DF 12 oz Bl-6C 27a-c 1.5ab 26ab 0.5ab 2a-c 2ab
9 Aprovia 0.83EC 1.75 fl oz + Captan 80WDG 12 oz Bl-6C 20ab 0.7a 19a 0.3a 1a-c 1ab
10 Aprovia 0.83EC 1.75 fl oz + ProPhyt 1 pt Bl-6C 16a 0.7a 24a 0.6ab 1a 1ab
11 Manzate 12 oz Ziram 76DF 12 oz
Bl-3C4-6C
49de 6.3a-d 64c-e 2.7b-d 3bc 0a
12 Ziram 76DF 12 oz Bl-6C 62ef 8.5cd 85 fg 5.7 f 2a-c 12cd
13 Captan 80WDG 12 oz Bl-6C 47de 3.4a-c 72d-f 3.6c-f 4c 2ab
14 ProPhyt 1 pt Bl-6C 33b-d 4.0a-c 79e-g 4.9ef 1ab 4a-c Mean separation by Waller-Duncan K-ratio t-test (p=0.05). Four single-tree reps, 10 shoots/tree 30 Jul or 25 fruit/tree 30 Sep and rated 21 Oct.
Dilute application to the point of runoff with a single nozzle handgun as follows: 29 Apr (late bloom); 12 May (late petal fall); First-6th covers: 27 May, 10 Jun, 24 Jun, 8 Jul, 22 Jul, 13 Aug.
Pre-treatment infection periods: 7-8 Apr:17 hr wet at 67-46° F; with 0.4 inch of rain (scab and cedar-apple rust); 8-9 Apr: 16 hr wet at 48-44°, 0.2 in. rain (scab). 9-10 Apr: 18 hr split wetting at 50-58°, 0.34 in. rain (scab); 14-15 Apr: 30 hr wet at 70-45°, 18 hours >55° with 0.62 in. rain (scab / rusts). 19-20 Apr: 15 hr wet at 67-50° with 1.12 in. of rain (scab and rusts). Scab lesions from 7-10 Apr infection periods appeared week of Apr 27. 30 Apr-1 May: 14 hr wet at 63-54° with 0.21 in. of rain (scab and rusts). 1-2 May: 15 hr at 58-53° with 0.21 in. of rain (scab and rusts).

150
Table 28. Cedar-apple rust, “leaf spots” and fruit finish by treatments first applied at late bloom. Fuji apple, 2015.
Cedar-apple rust and “leaf spots”,* leaf #9 and younger Cedar- Fruit finish
Cedar-apple rust “Leaf spots” apple rust ratings (0-5)**
% lvs lesions/ % lvs lesions/ % fruit opal- Treatment and rate/100 gal dilute Timing Inf. leaf Inf. leaf infected russet escence
0 No fungicide --- 35d 9.7e 32 a 2.1a 8c 2.0b 1.5c
1 Fontelis 1.67SC 4 fl oz Bl-6C 27b-d 3.4bc 30 a 1.9a 2b 1.9b 1.5c
2 Fontelis 4 fl oz + Manzate 12 oz Fontelis 4 fl oz + Ziram 76DF 12 oz
Bl-3C4-6C
22a-d 2.6ab 34 a 2.0a 1ab 1.4ab 1.1a-c
3 Fontelis 4 fl oz + Ziram 76DF 12 oz Bl-6C 19a-c 1.3a 28 a 1.2a 0a 1.3a 1.0ab
4 Fontelis 4 fl oz + Captan 80WDG 12 oz Bl-6C 20a-c 1.9ab 30 a 1.3a 0a 1.6ab 1.1a-c
5 Fontelis 4 fl oz + ProPhyt 1 pt Bl-6C 30cd 4.6cd 37 a 2.3a 0a 1.4ab 1.1a-c
6 Aprovia 0.83EC 1.75 fl oz Bl-6C 21a-c 2.3ab 33 a 1.7a 0a 1.3a 0.8a
7 Aprovia 0.83EC 1.75 fl oz + Manzate 75DF 12 oz Aprovia 0.83EC 1.75 fl oz + Ziram 76DF 12 oz
Bl-3C4-6C
11a 0.9a 28 a 1.1a 0a 1.1a 0.7a
8 Aprovia 0.83EC 1.75 fl oz + Ziram 76DF 12 oz Bl-6C 15ab 1.5a 19 a 0.9a 0a 1.5ab 0.9ab
9 Aprovia 0.83EC 1.75 fl oz + Captan 80WDG 12 oz Bl-6C 21a-c 2.1ab 26 a 1.0a 0a 1.5ab 0.9a
10 Aprovia 0.83EC 1.75 fl oz + ProPhyt 1 pt Bl-6C 21a-c 1.6ab 35 a 1.7a 0a 1.1a 0.7a
11 Manzate 12 oz Ziram 76DF 12 oz
Bl-3C4-6C
21a-c 2.2ab 35 a 1.3a 0a 2.0b 1.3bc
12 Ziram 76DF 12 oz Bl-6C 24b-d 3.4bc 26 a 1.2a 1ab 1.5ab 0.9a
13 Captan 80WDG 12 oz Bl-6C 25b-d 2.3ab 26 a 1.4a 2ab 1.6ab 1.1a-c
14 ProPhyt 1 pt Bl-6C 31cd 5.5d 31 a 2.1a 0a 1.6ab 1.1a-c Mean separation by Waller-Duncan K-ratio t-test (p=0.05). Four single-tree replications, 10 shoots per tree 30 Jul or 25 fruit per tree picked 30 Sep and rated 21 Oct. Treatment applications: 29 Apr (late bloom); 12 May (late petal fall); 1st-6th covers: 27 May, 10 Jun, 24 Jun, 8 Jul, 22 Jul, 13 Aug. “ Leaf spots” refers to an unidentified symptom; could be inhibited cedar-apple rust, frogeye leaf spot or an injury response. ** Fruit finish rated on a scale of 0-5 (0 = perfect finish, 5 = severe russet or opalescence. Insecticides: 1 Apr (BioCover MLT 6 gal + Asana XL 14.5 fl oz/A); 11 May (Assail 6 oz/A); 22 May (Delegate 4.5 oz /A); 29 May (Movento 9 fl oz + LI-700 8 fl oz/A); 6 Jun (Calypso 6 fl oz/A); 19 Jun (Altacor 3 oz + Admire-Pro 83 ml/A); 21 Jun (Movento 9 fl oz + LI-700 8 fl oz/A); 1 Jul (Lannate LV 3 pt + Imidan 4 lb/A); 16 Jul (Carbaryl 6 pt/A); 31 Jul (Assail 6 oz/A); 18 Aug (Altacor 3 oz + Admire-Pro 83 ml/A); 5 Sep (Delegate 4.5 oz /A).

151
Table 29. Control of summer diseases by treatments first applied at late bloom. Fuji apple, 2015. Block 8-East, Virginia Tech AREC.
% fruit or fruit area infected % post-storage incubation rots*
Sooty blotch Flyspeck Any Bitter White Alternaria
Treatment and rate/100 gal dilute Timing % fruit % area % fruit % area rot rot rot rot
0 No fungicide --- 100g 14.1h 100 g 10.7g 52 f 20e 17e 20e
1 Fontelis 1.67SC 4 fl oz Bl-6C 57 f 3.4g 76 f 5.1 f 18de 8d 7cd 6d
2 Fontelis 4 fl oz + Manzate 12 oz Fontelis 4 fl oz + Ziram 76DF 12 oz
Bl-3C4-6C 13de 0.7d-f 34 de 1.8de 6bc 3a-d 1ab 2a-d
3 Fontelis 4 fl oz + Ziram 76DF 12 oz Bl-6C 13de 0.8c-f 35 de 1.9de 5bc 1ab 1ab 2a-d
4 Fontelis 4 fl oz + Captan 80WDG 12 oz Bl-6C 3a-c 0.2a-c 27 c-e 1.5c-e 4b 3a-d 0a 1ab
5 Fontelis 4 fl oz + ProPhyt 1 pt Bl-6C 12c-e 0.6b-f 11 b 0.6b 4ab 2a-c 1ab 1ab
6 Aprovia 0.83EC 1.75 fl oz Bl-6C 20e 1.1 f 15 bc 0.8bc 6bc 2a-d 2a-c 2a-d
7 Aprovia 0.83EC 1.75 fl oz + Manzate 75DF 12 oz Aprovia 0.83EC 1.75 fl oz + Ziram 76DF 12 oz
Bl-3C4-6C 4a-d 0.2a-e 3 a 0.2a 3ab 0a 1ab 2a-c
8 Aprovia 0.83EC 1.75 fl oz + Ziram 76DF 12 oz Bl-6C 8b-e 0.4a-f 2 a 0.1a 4ab 4a-d 0a 1ab
9 Aprovia 0.83EC 1.75 fl oz + Captan 80WDG 12 oz Bl-6C 2ab 0.1ab 2 a 0.1as 0a 0a 0a 0a
10 Aprovia 0.83EC 1.75 fl oz + ProPhyt 1 pt Bl-6C 4a-d 0.2a-d 3 a 0.2a 7bc 2a-c 3a-c 2a-d
11 Manzate 12 oz Ziram 76DF 12 oz
Bl-3C4-6C 2a 0.1a 2 a 0.1a 9b-d 6cd 0a 3a-d
12 Ziram 76DF 12 oz Bl-6C 12de 0.6c-f 40 e 2.3e 28e 6b-d 16de 8 cd
13 Captan 80WDG 12 oz Bl-6C 15e 0.9ef 39 e 2.2e 15c-e 5a-d 5bc 7cd
14 ProPhyt 1 pt Bl-6C 10b-e 0.6b-f 25 b-d 1.1b-d 10b-d 1ab 6a-c 4b-d Mean separation by Waller-Duncan K-ratio t-test (p=0.05). Four single-tree replications, 10 shoots/tree 30 Jul or 25 fruit per tree picked 30 Sep and held incold storage. Moved to ambient warm temperatures 15 Oct and first rated 21 Oct. * Post-storage rots rated after 14 days incubation at ambient temperatures 57-80ºF (mean 70.7ºF).
Treatment applications: 29 Apr (late bloom); 12 May (late petal fall); 1st-6th covers: 27 May, 10 Jun, 24 Jun, 8 Jul, 22 Jul, 13 Aug.

152
APPLE (Malus domestica ‘Ramey York ) K. S. Yoder, A. E. Cochran II, Scab; Venturia inaequalis W. S. Royston, Jr., S. W. Kilmer, Powdery mildew; Podosphaera leucotricha A.G.F. Engelman, M. A. Borden, Cedar-apple rust; Gymnosporangium juniperi-virginianae and J.K. Repass Quince rust; Gymnosporangium clavipes Virginia Tech Agr. Res. & Ext. CenterSooty blotch; disease complex 595 Laurel Grove Road Flyspeck; Zygophiala jamaicensis Winchester, VA 22602 Bitter rot; Colletotrichum spp. White rot; Botryosphaeria dothidea Fruit finish Evaluation of experimental and registered cover spray fungicide combinations for disease control on York apple, 2015.
Fourteen treatments, applied in summer schedules, were compared during the mid-season cover spray period on 15-yr-old trees. The test was conducted in a randomized block design with four single-tree replicates separated by in-row border trees. No fungicides were applied until the first treatment application date 14 May. Dilute treatments were applied to runoff with a single nozzle handgun at 250 psi as first- eighth cover sprays: 14 May, 26 May, 9 Jun, 23 Jun, 7 Jul, 21 Jul, 3 Aug, 25 Aug. All diseases developed from inoculum naturally present in the test area. Foliar data are based on ten shoots per rep 18 Aug; counting only leaves younger than the 4th leaf (corresponding approximately to the time of the first treatment application). Fruit ratings are based on 25-fruit samples per replication picked 6 Oct, placed in cold storage until 16 Oct, then moved to ambient warm temperatures, first rated 22 Oct and final rating for rots 4 Nov after 19 days incubation at ambient temperatures (54-81º F, mean 70.8º F). Maintenance materials applied to the entire test block included: Admire Pro, Altacor, Assail, Asana XL, Biocover MLT, Calypso, Delegate, Imidan, Lannate LV, and Movento. Percentage data were converted by the square root arcsin transformation for statistical analysis.
The test was set up primarily to evaluate the treatments for summer disease control soon after petal fall, but scab lesions from 7-10 Apr and 14-15 Apr infections were already present in the test block when the treatment series began 14 May, lesions from five more infection periods were incubating, and 16 more secondary scab infection periods occurred through June. Also, it is known that scab strains resistant to SI fungicides have been present in the test area ten or more years and QoI-resistance has been in the test area at least three years, and this likely somewhat impacted control by Merivon (QoI) and Inspire Super (difenoconazole). Under these delayed application and resistance conditions, Merivon and Inspire Super-related treatments gave significant suppression, but Zn-Phite 2 qt (trt #9) gave the best control of scab on foliage and treatment #13 (Manzate + Ziram + ProPhyt) was best on fruit. ProPhyt (#10) alone gave significant scab suppression, as did Manzate + Ziram (#14), but their combination significantly improved control by either treatment separately. ProPhyt significantly improved control by Captan (#1 vs. 2) and Ziram (#11 vs. 12) on leaves, but less so on fruit. Control of rusts with the delayed applications was erratic with no significant differences in incidence on foliage, but differences in lesions per leaf. Inspire Super provided excellent control of quince rust and cedar-apple rust on fruit. Ziram also gave good control of quince rust and cedar-apple rust on fruit. The unidentified “leaf spots” shown in Table 30 were likely related to partially inhibited rust, but did not have any orange coloration to clearly identify them as such. However, there were significant treatment effects on “leaf spots” and some treatments with reduced leaf spot numbers (like Merivon + Ziram, #5) were not those that were rated as giving the best control of cedar-apple rust on leaves. The 250-hr accumulated wetting hour threshold for sooty blotch/flyspeck (SBFS) activity, accumulating from 14 May, was reached as early as 13 Jun, and this resulted in good test SBFS conditions. Under these conditions, the best treatments for sooty blotch were Merivon alone or + Captan, Inspire Super + Ziram, Omega + Ziram and Manzate + Ziram + ProPhyt. The best flyspeck treatments were Inspire Super + Ziram, Zn-Phite, and Ziram + ProPhyt. The best treatments for overall rot control were Merivon + Captan, Omega + Ziram, Captan, and Merivon + Ziram. The only deleterious effects on fruit finish were significant increases in russet and opalescence by Inspire Super + Ziram.

153
Table 30. Control of scab and other early season diseases by treatments first applied at first cover, 2015. Ramey York, VT AREC.
Scab Cedar-apple rust “Leaf spots” * % lvs lesions/ % lesions/ % lvs lesions/ % Quince % lvs lesions/ Treatment and rate/100 gal dilute Timing Inf. leaf fruit fruit Inf. leaf fruit rust, % Inf. leaf
0 No fungicide --- 94 i 18.8 ef 98 d 13.3 d 37 a 11.2 h 20 e 22 e 22 a-d 0.7 a-d 1 Captan 80WDG 15 oz 1-8C 87 hi 17.7 ef 77 bc 5.6 c 30 a 5.4 d-g 3 a-c 1 ab 33 d 0.9 b-d 2 Captan 80WDG 15 oz + ProPhyt 1 pt 1-8C 61 c-e 5.6 a-c 70 a-c 3.6 a-c 27 a 6.0 fg 7 a-d 14 de 25 a-d 0.7 a-d 3 Merivon 4.18SC 1.25 fl oz 1-8C 51 b-d 4.5 a-c 67 a-c 3.5 a-c 21 a 4.2 b-f 7 b-e 0 a 23 a-d 1.0 cd 4 Merivon 1.25 fl oz + Captan 80WDG 7.5 oz 1-8C 42 ab 3.5 ab 70 a-c 2.7 ab 23 a 5.6 e-g 6 a-d 4 a-c 20 a-c 0.6 a-d 5 Merivon 4.18SC 1.25 fl oz + Ziram 76DF 12 oz 1-8C 38 ab 2.6 a 62 ab 2.9 ab 18 a 3.3 a-d 6 a-d 10 c-e 15 a 0.3 a 6 Inspire Super 2.82EW 3 fl oz + Ziram 76DF 12 oz 1-8C 67 d-f 6.9 a-c 69 a-c 3.5 a-c 17 a 1.6 a 1 a 0 a 26 b-d 2.1 e 7 Omega 4SC 3.45 fl oz + Ziram 76DF 12 oz 1-8C 84 gh 15.3 de 70 a-c 2.7 ab 28 a 2.4 a-c 6 a-d 6 a-c 25 a-d 0.8 a-d 8 Zn-Phite 19.2 fl oz 1-8C 68 e-g 10.1 b-d 76 bc 4.6 bc 28 a 4.9 c-f 6 a-d 10 cd 16 ab 0.4 ab 9 Zn-Phite 2 qt 1-8C 28 a 1.8 a 67 a-c 3.6 a-c 39 a 6.7 fg 9 b-d 11 cd 28 cd 0.9 b-d
10 ProPhyt 1 pt 1-8C 47 bc 3.8 ab 82 c 4.4 a-c 38 a 7.6 g 7 a-d 7 b-d 24 a-d 1.1 d 11 Ziram 76DF 24 oz 1-8C 89 hi 23.0 f 68 a-c 2.7 ab 26 a 1.7 ab 1 a 7 a-d 28 cd 0.6 a-d 12 Ziram 76DF 24 oz + ProPhyt 1 pt 1-8C 67 d-f 10.7 cd 70 a-c 3.4 a-c 33 a 3.4 a-e 2 ab 1 ab 25 a-d 0.5 a-c 13 Manzate 12 oz + Ziram 12 oz + ProPhyt 1 pt
Ziram 76DF 24 oz + ProPhyt 1 pt 1-3C4-8C
61 c-e 6.4 a-c 55 a 2.2 a 25 a 1.6 a 9 c-e 9 c-e 17 ab 0.3 a
14 Manzate 12 oz + Ziram 76DF 12 oz Ziram 76DF 24 oz
1-3C4-8C
81 f-h 14.0 de 71 bc 2.7 ab 28 a 3.0 a-d 11 de 9 b-d 24 a-d 0.4 ab
Mean separation by Waller-Duncan K-ratio t-test (p=0.05). Four single-tree replications, Foliar rated were 5th leaf and younger on 10 shoots/tree, 18 Aug. Fruit ratings were of 25-fruit samples per replication, taken 6 Oct, placed in cold storage until 16 Oct, then moved to ambient warm temperatures and rated 22 Oct. * “Leaf spots” refers to an unidentified symptom; could be inhibited c-a rust, frogeye leaf spot or an injury response. Treatment applications: Dilute rates based on 400 gal/A equivalent. Applied dilute to runoff at 250 psi. Applied as 1st-8th covers: 14 May, 26 May, 9 Jun, 23 Jun, 7 Jul, 21 Jul, 3 Aug, 25 Aug.
Pre-treatment scab and rust infection periods: 7-8 Apr:17 hr at 67-46° F; 0.4 in. rain. (scab / c-a rust); 8-9 Apr: 16 hr at 48-44°, 0.2 in. rain (scab).9-10 Apr: 18 hr split 50-58°, 0.34 in. rain (scab); 14-15 Apr: 30 hr at 70-45°, 18 hours above 55° with 0.62 in. rain (scab and rusts). 19-20 Apr: 15 hr wet at 67-50° with 1.12 in. of rain (scab / rusts). Scab lesions from 7-10 Apr infection appeared week of 27 Apr. 30 Apr -May 1: 14 hr wet at 63-54° with 0.21 in. of rain (scab and rusts). 1-2 May: 15 hr at 58-53°, 0.21 in. of rain (scab and rusts). 5-6 May: 10 hr at 70-61°, 0.02 in. rain (scab and c-a rust) 6-7 May: 12 hr at 70-60°, 0.74 in. rain (scab and c-a rust)

154
Table 31. Summer disease control and fruit finish on Ramey York apple, 2015. Virginia Tech AREC.
% fruit or fruit area inf. at harvest % post-storage rots* Fruit finish
Sooty blotch Flyspeck Any Bitter White rating (0-5)**
Treatment and rate/100 gal dilute Timing fruit area fruit area rot rot rot russet opalescence
0 No fungicide --- 100 f 12.9 e 100 f 11.9 f 23 e 14 d 10 c 1.2 a 0.8 ab
1 Captan 80WDG 15 oz 1-8C 21 c-e 1.1 cd 47 e 2.6 e 4 a-c 0 a 4 a-c 1.5 ab 0.9 ab
2 Captan 80WDG 15 oz + ProPhyt 1 pt 1-8C 27 e 1.4 d 26 d 1.4 de 11 a-e 9 a-d 2 ab 1.6 ab 1.1 ab
3 Merivon 4.18SC 1.25 fl oz 1-8C 3 a 0.2 a 10 a-c 0.5 a-d 4 a-d 0 a 1 ab 1.4 ab 1.1 ab
4 Merivon 1.25 fl oz + Captan 80WDG 7.5 oz 1-8C 4 ab 0.2 ab 12 b-d 0.7 b-d 0 a 0 a 0 a 1.5 ab 1.1 ab
5 Merivon 4.18SC 1.25 fl oz + Ziram 76DF 12 oz 1-8C 9 ab 0.5 ab 18 cd 1.1 cd 5 a-d 1 a 1 ab 1.5 ab 0.9 ab
6 Inspire Super 2.82EW 3 fl oz + Ziram 76DF 12 oz 1-8C 6 ab 0.3 ab 3 a 0.2 ab 12 b-e 6 a-d 4 a-c 2.0 b 2.0 c
7 Omega 4SC 3.45 fl oz + Ziram 76DF 12 oz 1-8C 5 ab 0.3 ab 14 b-d 0.7 b-d 1 ab 3 ab 0 a 1.4 ab 1.2 ab
8 Zn-Phite 19.2 fl oz 1-8C 8 a-c 0.4 a-c 2 a 0.1 a 6 a-d 6 a-d 0 a 1.8 ab 1.3 ab
9 Zn-Phite 2 qt 1-8C 13 a-d 0.8 bc 8 a-c 0.4 a-c 6 a-d 3 ab 2 ab 1.2 a 0.8 a 10 ProPhyt 1 pt 1-8C 12 b-d 0.6 a-c 15 b-d 0.8 a-d 7 a-d 4 a-c 2 ab 1.1 a 0.8 a 11 Ziram 76DF 24 oz 1-8C 15 b-e 0.8 b-d 19 cd 1.1 cd 18 c-e 12 b-d 5 bc 1.7 ab 1.4 bc 12 Ziram 76DF 24 oz + ProPhyt 1 pt 1-8C 9 b-d 0.5 a-c 6 ab 0.3 ab 6 a-d 4 a-c 2 ab 1.6 ab 0.9 ab 13 Manzate 12 oz + Ziram 12 oz + ProPhyt 1 pt
Ziram 76DF 24 oz + ProPhyt 1 pt 1-3C4-8C
6 ab 0.3 ab 10 a-c 0.5 a-d 16 c-e 13 b-d 1 ab 1.5 ab 1.2 ab
14 Manzate 12 oz + Ziram 76DF 12 oz Ziram 76DF 24 oz
1-3C4-8C
24 de 1.3 cd 30 d 1.7 de 17 de 11 cd 4 a-c 1.6 ab 1.3 ab
Mean separation by Waller-Duncan K-ratio t-test (p=0.05). Four single-tree replications, Fruit ratings were of 25-fruit samples per replication, taken 6 Oct, placed in cold storage until 16 Oct, then moved to ambient warm temperatures and first rated 22 Oct. * Final rating for rots after 19 days incubation at ambient temperatures 54-81º F (mean 70.8º F). ** Fruit finish rated on a scale of 0-5 (0 = perfect finish, 5 = severe russet or opalescence. Treatment applications: No fungicides were applied until the first treatment application date. Dilute treatments were applied to runoff with a
single nozzle handgun at 250 psi as first‐ eighth cover sprays: 14 May, 26 May, 9 Jun, 23 Jun, 7 Jul, 21 Jul, 3 Aug, 25 Aug.

155
PEACH (Prunus persica ‘Redhaven) K. S. Yoder, A. E. Cochran II, W. S. Royston, Jr., Leaf curl; Taphrina deformans S. W. Kilmer, A. G. F. Engelman, Scab; Cladosporium carpophilum M. A. Borden, J. K. Repass Brown rot; Monilinia fructicola Virginia Tech Ag. Research & Extension Center Leaf injury/defoliation 595 Laurel Grove Road Winchester, VA 22602
Disease control and phytotoxicity by copper/Double Nickel treatments on Redhaven peach, 2015.
Nine treatments involving copper and Double Nickel were compared to standard programs for broad-spectrum disease control on 4-yr-old trees. The goal was to apply copper treatments at different rates and intervals to test the effect of Double Nickel on phytotoxic response and disease control. Test trees had been non-treated border trees in 2014 to allow the buildup of leaf curl and scab inoculum for the test in 2015. The test was set up in a randomized block design with four replications with non-treated in-row border trees between the test trees. Three brown rot mummies were placed in each test tree 2 Apr. Dilute treatments were applied to the point of run-off (approximately 200 gal/A) with a single nozzle handgun at 150-250 psi as follows: 6 Apr (App. 1, bud swell, trts #1-5 only); 9 Apr (App. 2, pink, all trts); 16 Apr (App. 3, full bloom, trts #1-6 only); 25 Apr (App. 4, petals off, all trts); 6 May (App. 5, shuck split, trts #1-6 only); 27 May (App. 6, 1st cover, all trts); 10 Jun (App. 7, 2nd cover, trts #1-6 only); 24 Jun (App. 8, 3rd cover, all trts); 7 Jul (App. 9, 4th cover, trts #1-6 only); 17 Jul (App. 10, 12 days pre-harvest, all trts). Leaf curl “strikes” were rated on 25 shoot tips per tree 5 May. Defoliation was rated on ten shoots, five on each side of the row, on 15 Jul. Commercial insecticides were applied to the entire test block at 1-2 wk intervals with a commercial airblast sprayer. Samples of 40 apparently rot-free fruit per replicate tree were harvested 29 Jul, rated for scab and fruit finish (copper injury). Fruit were selected for uniform ripeness, grouped into 20-fruit subsamples, and placed on fiber trays. One set was misted with de-ionized water, and the other subsample was inoculated with a suspension containing 20,000 M. fructicola conidia/ml. All fruit were incubated in polyethylene bags at ambient temperatures 72-85ºF (22-29C) before rating rot development at the indicated intervals.
Early season rains favored leaf curl infection. Bravo (Trt #1), applied at bud swell 6 Apr provided
better control than delaying the first application until 9 Apr (Trt #6). In general, Bravo was more effective for leaf curl control than NU-COP or Cueva copper treatments first applied at the same date. Combining Double Nickel (DN) with any copper product, rate, or at any application interval did not significantly affect control of leaf curl. After several applications it became apparent that some treatments were causing shothole injury and defoliation of older leaves on the shoots, and this was confirmed by ratings conducted 15 Jul. NU-COP treatments #4, #5, and #7 had similar amounts of injury, which was not significantly reduced by including DN (#5) or extending the interval (#7). These treatments also had significant amounts of fruit russet compared to other treatments and non-treated fruit. Cueva-related treatments had less defoliation, but DN significantly increased the amount of defoliation compared to Cueva 1 qt alone at the shorter interval (#4 vs. #3). Rains during shuck split and the early cover spray period resulted in heavy scab pressure, and the Bravo/sulfur treatments (#1 and #6) gave better scab control than any of the copper-related treatments. In several direct comparisons, including DN with copper did not significantly affect scab control, but in one case (#11 vs. #10), including DN with Cueva 1 pt significantly increased the number of scab lesions per fruit. All treatments were covered by Pristine in the pre-harvest spray and this probably delayed post-harvest brown rot development; however, there were still significant treatment differences related to the cover spray schedules. The NU-COP related treatments (#4, 5, and 7) had less brown rot, possibly due to delayed maturity as a result of defoliation. Generally, DN did not affect brown rot development, but it did reduce the amount of brown rot present on inoculated fruit after 6 days incubation (#11 vs. #10)
Table 32. Control of leaf curl and scab and defoliation by treatments on Redhaven peach, 2015. VT-AREC, Winchester.

156
Leaf curl, % of Defoliation, % fruit with Scab *
Treatment and rate/100 gal dilute Timing tip buds inf. 5
May % 15 Jul russet 29
Jul* % fruit lesions/fruit
0 No fungicide --- 18b-d 3ab 0a 100 f 69 f 1 Bravo Weather Stik 6F 1 pt Microfine Sulfur 90W 3 lb Pristine 38WG 6 oz
1-4 5-9 10
6a 1a 1a
39 a 5a
2 Cueva 1 qt Pristine 38WG 6 oz
1-9 10
14bc 11cd 1a 99 d-f 34cd
3 Cueva 1 qt + Double Nickel LC 8 fl oz Pristine 38WG 6 oz
1-9 10
17b-d 24e 0a 100 f 47de
4 NU‐COP HB 8 oz Pristine 38WG 6 oz
1-9 10
15b-d 68 f 36bc 91 bc 15ab
5 NU‐COP HB 8 oz + Double Nickel 8 fl oz Pristine 38WG 6 oz
1-9 10
13b 67 f 46c 86 b 13ab
6 Bravo Weather Stik 6F 1 pt Microfine Sulfur 90W 3 lb Luna Sensation 2.5 fl oz
2-4 5-9 10
12b 2a 3a
38 a 3a
7 NU‐COP HB 8 oz Pristine 38WG 6 oz
2,4,6,810
16b-d 58 f 23b 94 cd 24bc
8 Cueva 1 qt Pristine 38WG 6 oz
2,4,6,810
18b-d 7bc 0a 96 c-e
35cd
9 Cueva 1 qt + Double Nickel LC 8 fl oz Pristine 38WG 6 oz
2,4,6,810
20d 13cd 0a 100 f 47de
10 Cueva 1 pt Pristine 38WG 6 oz
2,4,6,810
19cd 17d 3a 98 d-f 39d
11 Cueva 1 pt + Double Nickel LC 8 fl oz Pristine 38WG 6 oz
2,4,6,810
15b-d 11cd 1a 99 ef 53e
Column mean separation by Waller-Duncan K-ratio t-test (p=0.05). Four single tree replications. Four single tree reps with non-treated border trees in row. Dilute application to run-off. Note: Trts #1-6 received every scheduled application including 9 Apr and later; Trts. #7-11 received only even-numbered applications. Application dates: 6 Apr (App. 1, bud swell, trts #1-5 only); 9 Apr (App. 2, pink, all trts); 16 Apr (App. 3, full bloom, trts #1-6 only); 25 Apr (App. 4, petals off, all trts); 6 May (App. 5, shuck split, trts #1-6 only); 27 May (App. 6, 1st cover, all trts); 10 Jun (App. 7, 2nd cover, trts #1-6 only); 24 Jun (App. 8, 3rd cover, all trts); 7 Jul (App. 9, 4th cover, trts #1-6 only); 17 Jul (App. 10, 12 days pre-harvest, all trts). Leaf curl counted 5 May; defoliation rated on ten shoots, five on each side of the row, on 15 Jul. * Harvest ratings of 40 fruit per replication, 29 Jul.

157
Table 33. Post-harvest brown rot development on Redhaven peach, 2015. Virginia Tech AREC, Winchester. % fruit with brown rot after indicated days incubation
Non‐inoculated fruit Inoculated fruit
Treatment and rate/100 gal dilute Timing 3 day 4 day 5 day 6 day 3 day 4 day 5 day 6 day
0 No fungicide ‐‐‐ 21 d 45 e 61 d 91 d 54 d 70 e 88 e 100 g
1 Bravo Weather Stik 6F 1 pt Microfine Sulfur 90W 3 lb Pristine 38WG 6 oz
1‐4 5‐9 10 5 a‐c 20 bc 35 c 55 c 13 a‐c 30 bc 58 d 76 ef
2 Cueva 1 qt Pristine 38WG 6 oz
1‐9 10 3 ab 18 cd 24 bc 40 c 16 bc 24 b 44 b‐d 51 bc
3 Cueva 1 qt + Double Nickel LC 8 fl oz Pristine 38WG 6 oz
1‐9 10 4 ab 8 bc 14 b 41 c 13 bc 20 b 35 b 49 b
4 NU‐COP HB 8 oz Pristine 38WG 6 oz
1‐9 10 0 a 0 a 1 a 8 ab 0 a 3 a 5 a 23 a
5 NU‐COP HB 8 oz + Double Nickel 8 fl oz Pristine 38WG 6 oz
1‐9 10 0 a 0 a 0 a 3 a 0 a 3 a 10 a 15 a
6 Bravo Weather Stik 6F 1 pt Microfine Sulfur 90W 3 lb Luna Sensation 2.5 fl oz
2‐4 5‐9 10 8 b‐d 24 c‐e 30 bc 46 c 8 a‐c 23 b 38 bc 56 b‐d
7 NU‐COP HB 8 oz Pristine 38WG 6 oz
2,4,6,810 3 ab 4 ab 4 a 11 b 3 ab 5 a 13 a 41 b
8 Cueva 1 qt Pristine 38WG 6 oz
2,4,6,810 8 a‐c 24 cd 28 bc 56 c 19 c 51 de 56 d 86 f
9 Cueva 1 qt + Double Nickel LC 8 fl oz Pristine 38WG 6 oz
2,4,6,810 6 bc 21 cd 25 bc 45 c 20 c 46 cd 55 cd 70 de
10 Cueva 1 pt Pristine 38WG 6 oz
2,4,6,810 13 cd 25 c‐e 30 bc 53 c 13 bc 31 b‐d 48 b‐d 69 de
11 Cueva 1 pt + Double Nickel LC 8 fl oz Pristine 38WG 6 oz
2,4,6,810 13 cd 35 de 39 c 55 c 16 c 46 cd 54 cd 66 c‐e
Column mean separation by Waller-Duncan K-ratio t-test (p=0.05). Four single-tree reps. Four single tree reps with non-treated border trees in row. Dilute application to run-off. Note: Treatments #1-6 received every scheduled application including 9 Apr and later;; Trts. #7-11 received only even-numbered apps. Application dates: 6 Apr (App. 1, bud swell, trts #1-5 only); 9 Apr (App. 2, pink, all trts); 16 Apr (App. 3, full bloom, trts #1-6 only); 25 Apr (App. 4, petals off, all trts); 6 May (App. 5, shuck split, trts #1-6 only); 27 May (App. 6, 1st cover, all trts); 10 Jun (App. 7, 2nd cover, trts #1-6 only); 24 Jun (App. 8, 3rd cover, all trts); 7 Jul (App. 9, 4th cover, trts #1-6 only); 17 Jul (App. 10, 12 days pre-harvest, all treatments). Actual harvest date was 29 Jul

158
PEACH (Prunus persica 'Loring') K. S. Yoder, A. E. Cochran II, W. S. Royston, Jr.,
Nectarine: (P. persica var. nucipersica ‘Redgold’) S. W. Kilmer, M. A. Borden and J. Repass Leaf curl; Taphrina deformans Va. Tech Ag. Res. and Ext. Center Scab; Cladosporium carpophilum 595 Laurel Grove Road Brown rot; Monilinia fructicola Winchester, VA 22602
Evaluation of Cueva/Double Nickel treatments on Loring peach and Redgold nectarine, 2015.
Four Cueva/Double Nickel treatments were compared for broad-spectrum disease control and phytotoxicity on 23-yr-old trees, focusing especially on scab in the pink to fifth cover spray period, and comparing dilute rates (approximately 200 gal/A for treatments #1 and 2) to per acre rates for airblast application at 100 gal/A (treatments #3 and 4). Dilute treatments were applied to the point of run-off with a single nozzle handgun at 350 psi. Treatments were applied in a randomized block design with four replications as follows: 9 Apr (pink); 16 Apr (full bloom); 25 Apr (petal fall); 6 May (shuck split); 1st through 5th covers (1C-5C): 27 May, 10 Jun, 24 Jun, 7 Jul, and 17 Jul. All treatments were covered with dilute pre-harvest (PH) applications of Pristine 6 oz/100gal 31 Jul (2-wk pre-harvest) and 11 Aug (3-day pre-harvest). Commercial insecticides were applied to the entire test block with an airblast sprayer. Leaf curl incidence was rated on 100 shoots per tree 11 May. Samples of 40 apparently rot-free fruit per replicate tree were harvested from both Loring and Redgold on 14 Aug, and scab was assessed on the 40fruit sample 14 Aug. Fruit were selected for uniform ripeness, grouped into 20-fruit subsamples, and placed on fiber trays. One set was misted with de-ionized water, and the other set was inoculated with a suspension of 25,000 M. fructicola conidia/ml. All fruit were incubated in polyethylene bags at ambient temperatures (74-87ºF) while rating rot development at the indicated intervals.
None of the treatments, first applied at pink, gave adequate control of leaf curl. Scab inoculum was high on the test trees, and weather during the early cover spray period was very favorable for infection. Under these strong test conditions, with nearly 100% of untreated fruit infected with scab, most treatments gave significant, although not outstanding control of percent Loring fruit infected, and also significantly reduced the lesions per fruit. Under heavier scab pressure on Redgold nectarine, no treatment significantly reduced percent fruit infected with scab, but all reduced lesions per fruit significantly, ranging from 56-81% reduction. All treatments significantly reduced brown rot on non-inoculated and inoculated peach and nectarine fruit. Treatment with the fewest infected fruit overall was Cueva alone. On inoculated peach, airblast application, Cueva alone had significantly fewer rotted fruit than in combination with Double Nickel after 4, 6, and 7 days’ incubation. On both inoculated and non-inoculated nectarine fruit, dilute application of Cueva alone had significantly fewer rotted fruit than Cueva combined with Double Nickel fruit at 5-day and 7-day incubation intervals. In this test, there was some shothole, but no defoliation. There was no indication of a fruit finish effect or delayed maturity on either peach or nectarine.

159
Table 34. Control of leaf curl and scab on Loring peach and Redgold nectarine, 2015.
Treatment and rate per Leaf curl, % Scab, % fruit inf. or lesions/fruit
100 gal for dilute application shoots infected Loring Redgold
or per acre airblast application Timing Loring Redgold fruit lesions fruit lesions
0 No fungicide --- 91a 88b 99b 31.9b 100 a 71.5b
1 Cueva 1 qt/100 gal Pristine 6 oz/100gal dilute
Pink-5CPH
56a 50a 69a 3.3a 98 a 13.6a
2 Cueva 1 qt + Double Nickel LC 8 fl oz/100 gal Pristine 6 oz/100gal dilute
Pink-5C
PH 74a 50a 68a 9.6a 91 a 26.2a
3 Cueva 2 qt/A Pristine 6 oz/100gal dilute
Pink-5CPH
49a 55a 71a 7.8a 95 a 21.4a
4 Cueva 2 qt + Double Nickel LC 1 pt/APristine 6 oz/100gal dilute
Pink-5CPH
74a 76ab 69a 3.5a 99 a 31.8a
Four single tree reps. Column mean separation by Waller-Duncan K-ratio t-test (p=0.05). Note: Data are aligned with the treatment timing most likely to have affected indicated disease.

160
Table 35. Treatment effects on postharvest brown rot development on Loring Peach, 2015. Treatment and rate per % fruit with brown rot after indicated days incubation
100 gal for dilute application Non-inoculated fruit Inoculated fruit
or per acre airblast application Timing 3 day 4 day 5 day 6 day 7day 3 day 4 day 5 day 6 day 7day
0 No fungicide --- 59b 73b 77b 90 b 100b 50b 75e 100b 100c 100c
1 Cueva 1 qt/100 gal Pristine 6 oz/100gal dilute
Pink-5CPH 0 a 3a 4 a 8 a 10a 0 a 3 b 5a 15a 28a
2 Cueva 1 qt + Double Nickel LC 8 fl oz/100 gal Pristine 6 oz/100gal dilute
Pink-5CPH 0 a 3a 3 a 12 a 20a 0 a 5 d 5a 23ab 35a
3 Cueva 2 qt/A Pristine 6 oz/100gal dilute
Pink-5CPH 0 a 4a 11a 15 a 23a 0 a 0 a 13a 23a 34a
4 Cueva 2 qt + Double Nickel LC 1 pt/A Pristine 6 oz/100gal dilute
Pink-5CPH 0 a 0a 0 a 7 a 17a 0 a 3 c 15a 42b 58b
Column mean separation by Waller-Duncan K-ratio t-test (p=0.05). Four single tree replications. Actual harvest date 14 Aug, 3 days after the last application.
Table 36. Treatment effects on postharvest brown rot development on Redgold Nectarine, 2015.
Treatment and rate per % fruit with brown rot after indicated days incubation
100 gal for dilute application Non-inoculated fruit Inoculated fruit
or per acre airblast application Timing 3 day 4 day 5 day 6 day 7day 3 day 4 day 5 day 6 day 7day
0 No fungicide --- 0 a 0a 20c 40 b 75d 0 a 5 a 30b 40a 85c
1 Cueva 1 qt/100 gal (dilute application) Pristine 6 oz/100gal dilute
Pink-5CPH 0 a 0a 0 a 1 a 3 a 0 a 1 a 1a 4 a 6a
2 Cueva 1 qt + Double Nickel LC 8 fl oz/100 gal Pristine 6 oz/100gal dilute
Pink-5CPH 0 a 3a 6 b 8 a 15c 0 a 4 a 10ab 11a 24b
3 Cueva 2 qt/A (airblast application) Pristine 6 oz/100gal dilute
Pink-5CPH 0 a 0a 0 a 2 a 5 b 0 a 3 a 8ab 8 a 20b
4 Cueva 2 qt + Double Nickel LC 1 pt/A (airblast) Pristine 6 oz/100gal dilute
Pink-5CPH 0 a 0a 0 a 3 a 5 b 0 a 3 a 8ab 17a 28b
Column mean separation by Waller-Duncan K-ratio t-test (p=0.05). Four single tree replications. Actual harvest date 14 Aug, 3 days after the last application.
161
Breakout session: Horticulture

162
LIFELINE™: A UNIQUE GLUFOSINATE FORMULATION FOR WEED CONTROL IN TREE FRUIT & VINE CROPS
TONY ESTES
UPI Field Development Abingdon, VA 24210
Lifeline is a non-selective post-emergent herbicide containing the active ingredient glufosinate ammonium. It is labeled for tree fruit & vine crops in the United States. Lifeline received EPA registration in September 2014 and is manufactured by UPI. Lifeline is formulated as a 2.34 lb/gal SL (aqueous solution) and is classified by the WSSA as a Group 10 herbicide with the mode of action being a glutamine synthatase inhibitor.
Lifeline is unique compared to other glufosinate formulations in that it is the only glufosinate
product that carries a “Caution” signal word on the label. It is broken down by microorganisms and does not bioaccumulate in soil or water. It has low mobility in the soil with a half-life of 1-3 weeks, dependent upon soil temperature, soil type and moisture. Lifeline also has low toxicity to adult bees, earthworms, birds and most beneficial arthropods.
Use rates for Lifeline are 48-82 fl oz/acre. Lower rates should be used on smaller weeds <3”, and higher rates on larger weeds. It can be applied broadcast, as a directed spray or spot treatment. Lifeline is a contact herbicide, so good coverage is essential. Water volume must be adequate for good coverage and should increase with dense foliage. Medium size droplets (300-400 microns) allow for better uptake into the leaf tissue. Research indicates that better weed control will be achieved if Lifeline herbicide is applied during the day, generally between mid-morning and 2 hours before sunset. Injury symptoms to the weeds usually occur within 3-5 days after application. It will take longer under cooler temperatures or if weeds are under drought stress.
For best results apply to young newly emerged weeds under high temperatures and humidity
with bright sunlight. Lifeline is effective on glyphosate resistant weeds.

163
HIGH DENSITY ORCHARDS IN THE MID-ATLANTIC: FIELD TESTING ROOTSTOCKS FROM THE GENEVA BREEDING PROGRAM
A. Wallis
Cornell Cooperative Extension ENYCHP, Plattsburgh, NY
C. S. Walsh, B. Butler, D. Price, J. Harshman, G. Fazio University of Maryland, College Park, MD
In high density orchard systems, dwarfing rootstocks are responsible for
providing size control, reduced vigor, and disease resistance; they may also influence yield and fruit quality. Rootstocks must be field tested with various scion varieties, in multiple geographic regions to determine their potential for commercial use.
Three rootstocks from the Geneva rootstock breeding program were tested for
their suitability for the hot, humid conditions of the Mid-Atlantic. G.41, G.202, and G.935, propagated in traditional stool bed, were grafted with Cripps Pink and Brookfield Gala. G.202 was also propagated in tissue culture (TC) for a total of four rootstock treatments (G.41, G.202, G202TC, and G.935). Trees were planted at the Western Maryland Research and Education Center in Keedysville, MD in 2010. The planting consisted of 7-tree panels, replicated 4 times in a Latin square design. Trees were spaced 6x12’ and trained to tall spindle system with 4 wires. From 2011 to 2015, data was taken on tree size, fruit quality, productivity, and tree survival.
Fruit quality (% red color, soluble solids (°Brix), firmness, starch content, height and diameter) was not significantly different for any of the rootstocks, for either cultivar. TC trees were consistently larger in terms of height, diameter, and trunk cross sectional area for both scions in 2012-13, which may be due to propagation method (stool bed vs. TC), or other factors, including nursery management. Gala on G.202 had significantly lower cumulative yield and smaller fruit size. Yield was not significantly affected for Cripps Pink. Storm events in July 2011 led to breakage of trees at the graft union, resulting in significant tree losses (Table 1). Similar losses have been reported elsewhere in Mid-Atlantic. In 2015, Brookfield Gala on all rootstocks experienced significant shoot blight; infections occurred at renewal pruning cuts in the new shoots. Additional research is necessary to investigate best practices for high density orchards in the Mid-Atlantic, to determine appropriate rootstock-scion combinations and to determine the differences between TC and stoolbed propagated rootstocks. . Table 1. 2015 Yield and Survival
Cripps Pink Brookfield Gala Rootstock Yield (kg/tree) Survival (%) Yield (kg/tree) Survival (% G.41 20.3 a 54 b 19.2 a 100 a G.935 13.1 a 68 b 22.7 a 96 a G.202 22.5 a 100 a 10.6 b 100 a G.202 (TC) 15.8 a 96 a 18.9 a 89 a

164
Not for citation or publication without consent of the authors
FINE-TUNING FERTILIZER RECOMMENDATIONS FOR YOUNG APPLE TREES IN HIGH-DENSITY PLANTINGS
Ashley Thompson and Gregory Peck
Alson H. Smith. Jr. AREC, Virginia Tech Winchester, VA 22601
There has been little nutrient management research for apple orchards conducted in Virginia in recent years despite changing planting systems and increased environmental concerns. As Virginia apple growers increase their plantings of high-density apple orchards, there is a great need to develop research-based fertilizer recommendations for young trees. The profitability of high-density orchard systems depends upon obtaining high fruit yields as soon as possible after planting. In order to achieve earlier fruiting, trees must have sufficient growth, which is traditionally achieved through the application of synthetic nitrogen fertilizers. Despite the increasing importance of nitrogen for young trees, there are many discrepancies regarding the fertilizer formulation, timing, and rate used in newly planted apple orchards. These differences might be due to costs, familiarity, and/or local availability of fertilizer products. Nutrient management affects tree growth, fruit yield and quality, and soil biological function; therefore, it is important to understand the practices that will best enhance high-density apple production in Virginia. Many growers choose to ground-apply synthetic nitrogen fertilizers, such as calcium nitrate or ammonium nitrate, while others are beginning to explore fertigation, a method that dispenses solubilized fertilizers through irrigation lines. Fertigation has become a common practice in both dry and humid apple growing regions. The use of fertigation has grown because applying fertilizers through this method allows growers to apply precise amounts of fertilizers directly to the root zone during times of high nutrient demand. Due to these characteristics, fertigation is a good method of nutrient application to reduce nitrogen leaching. This is particularly important in sensitive environmental areas, such as the Chesapeake Bay Watershed. Several apple growers in Virginia have already installed fertigation systems, and use them as their standard nutrient application method. However, Virginia lacks the research to fully evaluate the utility of fertigation systems in comparison with other common fertilization practices. In addition, there has been increased interest in using soil amendments, such as composts, as nutrient sources in apple orchards. The use of composts, in particular chicken litter, has become increasingly common because of its low cost and regional availability. Integrating carbon-based soil amendments (such as compost) along with synthetic nitrogen fertilizers may aid the long-term sustainability of the orchard agro-ecosystem by increasing soil quality and nutrient availability. Additional benefits of using compost include, reduced nitrogen loss to the environment, increased potential for nitrogen mineralization, greater water and nutrient utilization efficiency, reduced soil erosion in hillside orchards by increasing soil aggregate stability, increasing organic matter and mineral nutrient content, and cation exchange capacity. These qualities enhance plant and microbe availability of nutrients in the soil, and increase soil nutrient retention and soil water-holding capacity. Other benefits might include reducing fertilizer costs and increasing carbon sequestration in the soil by increasing soil microbial biomass. OBJECTIVES:
Compare different fertilizer sources and application methods for quickly establishing young apple trees.
Develop appropriate fertilizer recommendations for young apple trees in Virginia.

165
PROCEDURES: This project began in spring 2013 at the Alson H. Smith, Jr. AREC using ‘Red Delicious cv Schlect’ on a M.26 rootstock. A spur strain of Red Delicious was chosen because of its slow growth habit. The treatments chosen for this research are listed in Table 1. The total nitrogen applied to each treatment (except the control) was 60 lbs/acre. Finished composted material was acquired and applied each year. The amounts of other mineral nutrients and organic matter differed among treatments, and were not controlled for in this experiment (Table 2). Compost nutrient analysis was performed by Penn State Agricultural Analytical Services Lab (University Park, PA) prior to compost application. Fertigation applications began the last week of May, and occurred weekly for eight weeks. Each treatment was replicated four times in five-tree sets in a randomized complete block design. The end (buffer) trees, in each treatment were not used for data collection—therefore, only three trees per experimental unit were used for data collection. Trees were spaced five feet apart in the tree row. All trees were trained as a vertical-axe on a trellis system. In 2015, fruitlets were thinned to three per trunk cross sectional area on each tree. Irrigation was supplied through an in-line drip tube to replace water lost through evapotranspiration. All trees were uniformly treated in regards to pest, disease, and weed control. Table 1. Treatments for the fertilization study of ‘Red Delicious cv Schlect’/‘M.26’ at the AHS AREC in Winchester, VA.
Treatment Fertilization Timing 1 No fertilizer (control)
2 Calcium nitrate: two applications 30 lbs N/acre Post-plant and mid-season
3 Chicken litter compost: 60 lbs N/acre Post-plant 4 Yardwaste compost: 60 lbs N/acre Post-plant
5 Chicken litter compost 30 lb N/acre and calcium nitrate 30 lb N/acre Post-plant
6 Yardwaste compost: 30 lb N/acre and calcium nitrate: 30 lb N/acre Post-plant
7 Fertigation: 60 lbs N/ acre Weekly applications Orchard productivity was assessed by measuring the trunk cross sectional area (TCSA) each year. Leader growth was measured in 2014 and 2015, and flower cluster number was recorded during the spring of 2015. Fruit was harvested on September 14, 2015 to measure orchard productivity and fruit quality. Four fruit were selected from each tree in the three-tree set. Twelve fruit from each treatment and block were used to determine fruit quality and maturity. The fruit quality parameters measured included flesh firmness, size, weight, color, and soluble solid concentration. Flesh firmness, size, and weight were measures on a fruit texture analyzer (GÜSS Manufacturing Ltd., Strand, South Africa). Fruit starch content and ethylene production were also measured to determine the effects of fertilizer treatments on fruit maturity. Fruit starch was visually assessed using the Cornell Starch-Iodine Index. A 7890A Gas chromatograph (GC) (Agilent Technologies, Santa Clara, CA) was used to measure ethylene production. The soluble solid concentration of apple juice was measured using a hand-held refractometer (Atago, Tokyo, Japan). Orchard productivity included total yields and yield efficiency (yield/TCSA). Mineral nutrient uptake was measured yearly by leaf tests at the Penn State Agricultural Analytical Services Lab. The concentration of the macronutrients N, P, K, Ca and Mg, and the micronutrients Mn, Fe, Cu, B, Al, Zn, and Na were measured using the inductively coupled plasma (ICP)-dry ash method. Soil samples were collected 30 cm from the tree trunk to a depth of 10 cm each fall and sieved (US number 10). These samples were used for soil fertility analysis, carbon and nitrogen analysis, potentially mineralizable nitrogen, microbial biomass, and microbial respiration. Soil fertility was measured using Melich 1 extraction solution at the Virginia Tech Soil Testing Laboratory (Blacksburg, VA) soil pH, organic matter (OM), cation exchange capacity
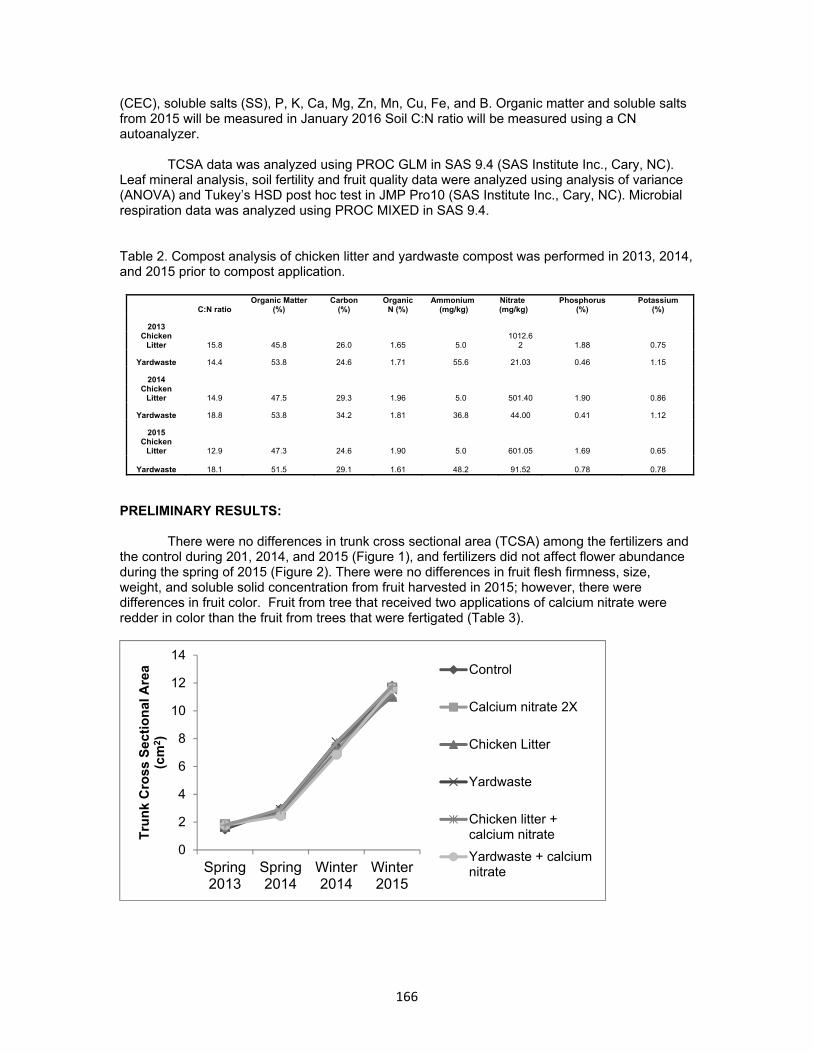
166
(CEC), soluble salts (SS), P, K, Ca, Mg, Zn, Mn, Cu, Fe, and B. Organic matter and soluble salts from 2015 will be measured in January 2016 Soil C:N ratio will be measured using a CN autoanalyzer.
TCSA data was analyzed using PROC GLM in SAS 9.4 (SAS Institute Inc., Cary, NC).
Leaf mineral analysis, soil fertility and fruit quality data were analyzed using analysis of variance (ANOVA) and Tukey’s HSD post hoc test in JMP Pro10 (SAS Institute Inc., Cary, NC). Microbial respiration data was analyzed using PROC MIXED in SAS 9.4.
Table 2. Compost analysis of chicken litter and yardwaste compost was performed in 2013, 2014, and 2015 prior to compost application.
C:N ratio Organic Matter
(%) Carbon
(%) Organic
N (%) Ammonium
(mg/kg) Nitrate
(mg/kg) Phosphorus
(%) Potassium
(%)
2013 Chicken
Litter 15.8 45.8 26.0 1.65 5.0 1012.6
2 1.88 0.75
Yardwaste 14.4 53.8 24.6 1.71 55.6 21.03 0.46 1.15
2014 Chicken
Litter 14.9 47.5 29.3 1.96 5.0 501.40 1.90 0.86
Yardwaste 18.8 53.8 34.2 1.81 36.8 44.00 0.41 1.12
2015 Chicken
Litter 12.9 47.3 24.6 1.90 5.0 601.05 1.69 0.65
Yardwaste 18.1 51.5 29.1 1.61 48.2 91.52 0.78 0.78
PRELIMINARY RESULTS: There were no differences in trunk cross sectional area (TCSA) among the fertilizers and the control during 201, 2014, and 2015 (Figure 1), and fertilizers did not affect flower abundance during the spring of 2015 (Figure 2). There were no differences in fruit flesh firmness, size, weight, and soluble solid concentration from fruit harvested in 2015; however, there were differences in fruit color. Fruit from tree that received two applications of calcium nitrate were redder in color than the fruit from trees that were fertigated (Table 3).
0
2
4
6
8
10
12
14
Spring2013
Spring2014
Winter2014
Winter2015
Tru
nk
Cro
ss S
ecti
on
al A
rea
(cm
2)
Control
Calcium nitrate 2X
Chicken Litter
Yardwaste
Chicken litter +calcium nitrate
Yardwaste + calciumnitrate

167
Figure 1. Tree growth was measured as trunk cross sectional area at planting, and again in the spring of 2014, the winter of 2014 and the winter of 2015 following fertilizer applications.
Figure 2. The number of flower clusters per tree in the spring of 2015. Table 3. Fruit quality and maturity was measured on samples of 12 fruit harvested from each treatment and block combination in 2015.
Fertilizer Firmness
(lb.) Size (mm) Weight
(g) Starch (1-
8) Color (%) Soluble solid concentration
(Brix°) Ethylene
(ppm)
Control 15.47 85.77 275.58 4.25 94.27 AB 14.05 19.26
Calcium nitrate 2X 15.42 86.14 286.88 4.30 95.32 A 14.60 23.12
Chicken Litter 15.47 84.82 269.38 4.56 94.9 AB 13.90 17.63
Yardwaste 15.31 86.20 276.69 4.45 93.44 AB 14.25 23.84 Chicken Litter + calcium nitrate 15.27 84.47 262.06 4.26 93.96 AB 13.75 16.07
Yardwaste + calcium nitrate 15.31 84.05 257.79 4.27 93.23 AB 13.95 20.83
Fertigation 15.72 83.56 255.25 4.27 92.4 B 13.70 25.05
Leaf nitrogen did not differ among treatments in 2013, 2014, or 2015. In 2013, there were
differences in leaf phosphorous, potassium, and aluminum concentrations among treatments (Table 4). The leaf phosphorous concentration was higher in the leaves of trees that received the chicken litter + calcium nitrate fertilizer compared to trees that were fertigated with calcium nitrate for eight weeks. Leaf pot concentration was higher in trees that received yardwaste + calcium nitrate fertilizer than in trees that were fertilized with received chicken litter + calcium nitrate, two application of calcium nitrate, or fertigation. The leaf aluminum concentration was higher in trees that were fertigated than in the trees that were fertilized with two applications of calcium nitrate,
0
10
20
30
40
50
60
70
80
Control Calciumnitrate 2X
Chickenlitter
Yardwaste Chickenlitter +
calciumnitrate
Yardwaste+ calcium
nitrate
Fertigation
Ave
rag
e fl
ow
er c
lust
er n
um
ber
per
tre
e
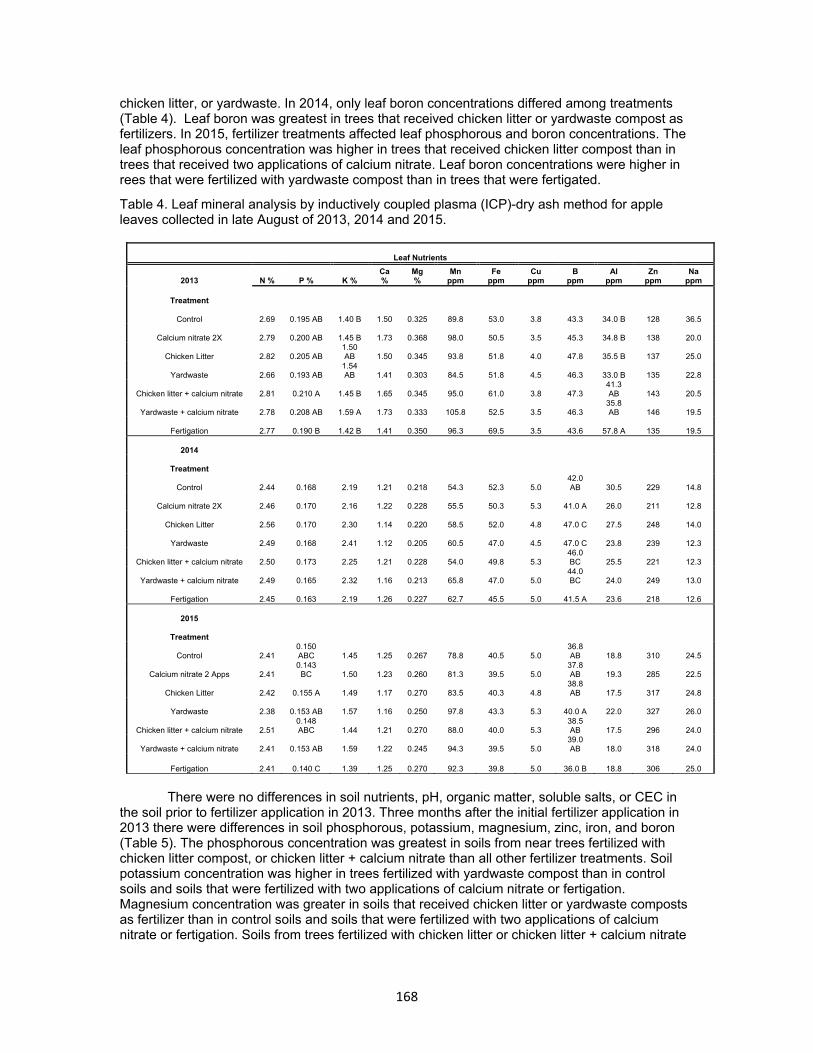
168
chicken litter, or yardwaste. In 2014, only leaf boron concentrations differed among treatments (Table 4). Leaf boron was greatest in trees that received chicken litter or yardwaste compost as fertilizers. In 2015, fertilizer treatments affected leaf phosphorous and boron concentrations. The leaf phosphorous concentration was higher in trees that received chicken litter compost than in trees that received two applications of calcium nitrate. Leaf boron concentrations were higher in rees that were fertilized with yardwaste compost than in trees that were fertigated.
Table 4. Leaf mineral analysis by inductively coupled plasma (ICP)-dry ash method for apple leaves collected in late August of 2013, 2014 and 2015.
Leaf Nutrients
2013 N % P % K % Ca %
Mg %
Mn ppm
Fe ppm
Cu ppm
B ppm
Al ppm
Zn ppm
Na ppm
Treatment
Control 2.69 0.195 AB 1.40 B 1.50 0.325 89.8 53.0 3.8 43.3 34.0 B 128 36.5
Calcium nitrate 2X 2.79 0.200 AB 1.45 B 1.73 0.368 98.0 50.5 3.5 45.3 34.8 B 138 20.0
Chicken Litter 2.82 0.205 AB 1.50 AB 1.50 0.345 93.8 51.8 4.0 47.8 35.5 B 137 25.0
Yardwaste 2.66 0.193 AB 1.54 AB 1.41 0.303 84.5 51.8 4.5 46.3 33.0 B 135 22.8
Chicken litter + calcium nitrate 2.81 0.210 A 1.45 B 1.65 0.345 95.0 61.0 3.8 47.3 41.3 AB 143 20.5
Yardwaste + calcium nitrate 2.78 0.208 AB 1.59 A 1.73 0.333 105.8 52.5 3.5 46.3 35.8 AB 146 19.5
Fertigation 2.77 0.190 B 1.42 B 1.41 0.350 96.3 69.5 3.5 43.6 57.8 A 135 19.5
2014
Treatment
Control 2.44 0.168 2.19 1.21 0.218 54.3 52.3 5.0 42.0 AB 30.5 229 14.8
Calcium nitrate 2X 2.46 0.170 2.16 1.22 0.228 55.5 50.3 5.3 41.0 A 26.0 211 12.8
Chicken Litter 2.56 0.170 2.30 1.14 0.220 58.5 52.0 4.8 47.0 C 27.5 248 14.0
Yardwaste 2.49 0.168 2.41 1.12 0.205 60.5 47.0 4.5 47.0 C 23.8 239 12.3
Chicken litter + calcium nitrate 2.50 0.173 2.25 1.21 0.228 54.0 49.8 5.3 46.0 BC 25.5 221 12.3
Yardwaste + calcium nitrate 2.49 0.165 2.32 1.16 0.213 65.8 47.0 5.0 44.0 BC 24.0 249 13.0
Fertigation 2.45 0.163 2.19 1.26 0.227 62.7 45.5 5.0 41.5 A 23.6 218 12.6
2015
Treatment
Control 2.41 0.150 ABC 1.45 1.25 0.267 78.8 40.5 5.0
36.8 AB 18.8 310 24.5
Calcium nitrate 2 Apps 2.41 0.143
BC 1.50 1.23 0.260 81.3 39.5 5.0 37.8 AB 19.3 285 22.5
Chicken Litter 2.42 0.155 A 1.49 1.17 0.270 83.5 40.3 4.8 38.8 AB 17.5 317 24.8
Yardwaste 2.38 0.153 AB 1.57 1.16 0.250 97.8 43.3 5.3 40.0 A 22.0 327 26.0
Chicken litter + calcium nitrate 2.51 0.148 ABC 1.44 1.21 0.270 88.0 40.0 5.3
38.5 AB 17.5 296 24.0
Yardwaste + calcium nitrate 2.41 0.153 AB 1.59 1.22 0.245 94.3 39.5 5.0 39.0 AB 18.0 318 24.0
Fertigation 2.41 0.140 C 1.39 1.25 0.270 92.3 39.8 5.0 36.0 B 18.8 306 25.0
There were no differences in soil nutrients, pH, organic matter, soluble salts, or CEC in
the soil prior to fertilizer application in 2013. Three months after the initial fertilizer application in 2013 there were differences in soil phosphorous, potassium, magnesium, zinc, iron, and boron (Table 5). The phosphorous concentration was greatest in soils from near trees fertilized with chicken litter compost, or chicken litter + calcium nitrate than all other fertilizer treatments. Soil potassium concentration was higher in trees fertilized with yardwaste compost than in control soils and soils that were fertilized with two applications of calcium nitrate or fertigation. Magnesium concentration was greater in soils that received chicken litter or yardwaste composts as fertilizer than in control soils and soils that were fertilized with two applications of calcium nitrate or fertigation. Soils from trees fertilized with chicken litter or chicken litter + calcium nitrate

169
contained more zinc than soils from trees that received two applications on calcium nitrate. Soils that received yardwaste + calcium nitrate were higher in manganese than soils that received chicken litter compost. Soil boron concentrations were greater in trees that received chicken litter, yardwaste, or chicken litter + calcium nitrate fertilizers than in the control and trees that received applications of calcium nitrate, or fertigation.
In 2014, soil phosphorous, potassium, magnesium and copper concentrations varied
significantly due to fertilizer applications (Table 5). Chicken litter compost applications significantly increased soil phosphoropus compared to the control, two applications of calcium nitrate, yardwaste, yardwaste + calcium nitrate, and fertigation. Soil potassium concentration was significantly higher in soils that received yardwaste compost applications compared to the control, and soils that received two applications of calcium nitrate or fertigation. Yardwaste compost applications also significantly increased soil magnesium concentrations compared to fertigation. Copper concentrations were significantly higher in control soils than in soils that received compost or compost + calcium nitrate as fertilizer.
After three years of fertilizer applications, soil pH, cation exchange capacity,
phosphorous, potassium, calcium, magnesium, zinc, manganese, and boron were different due to fertilizer applications (Table 5). The pH in soil amended with yardwaste compost was significantly higher than the pH of soils that received fertigation applications. Chicken litter and yardwaste composts increased cation exchange capacity compared to all other treatments. Soils that received chicken litter compost were higher in phosphorous than all other treatments. Yardwaste fertilized soils contained more potassium than soils amended with all other fertilizer, and the control. All compost and compost + calcium nitrate fertilizer amended soil contained significantly more potassium than soils that received two applications of calcium nitrate or fertigation. Soil calcium concentration was significantly higher in soils that were fertilized with chicken litter or yard waste composts than in the control soil, and soils that received two applications of nitrogen or fertigation. Chicken litter and yardwaste compost fertilized soil contained significantly higher concentrations of magnesium than the control soils, and soils that received all other fertilizers. Zinc concentrations were significantly higher in soils fertilized with chicken litter compost than in the control soil, and soils that were fertilized with two applications of calcium nitrate, yardwaste, yardwaste + calcium nitrate, and fertigation. Yardwaste fertilized soil contained significantly higher concentrations of manganese than control soils and all other fertilizer treatments. Boron concentrations were significantly higher in soils that received chicken litter or yardwaste composts than control soil or soils that received two applications of calcium nitrate or fertigation.
We will also be analyzing C:N samples for 2013, 2014, and 2015, potentially mineralizable nitrogen samples, and microbial biomass samples for 2015 in the coming months.

170
Table 5. Mehlich 1 extractable soil nutrients from soil samples taken 30 cm from the tree trunk to a depth of 10 cm following fertilizer applications in August of 2013, 2014, and 2015.
Extractable Soil Nutrients
2013 pH P ppm K ppm Ca ppm Mg ppm Zn ppm Mn ppm Cu ppm Fe ppm B ppm % OM SS ppm CEC meq/100g
Treatment
Control 6.4 21.5 B 125 C 1156 110 C 12.8 AB 50.3 AB 0.775 6.05 AB 0.525 BC 2.97 169 7.38
Calcium nitrate 2X 6.5 20.0 B 89.8 C 1307 96.5 C 10.1 B 42.9 AB 0.825 5.05 B 0.550 BC 3.08 304 7.65
Chicken Litter 6.7 132.8 A 144 BC 1710 161 A 15.6 A 39.0 B 0.750 5.15 AB 0.975 A 3.83 172 10.3
Yardwaste 6.8 35.5 B 241 A 1665 172 A 12.3 AB 55.3 AB 0.525 6.78 A 0.900 A 4.65 243 10.4
Chicken litter + calcium nitrate 6.7 109.8 A 144 BC 1791 152 BC 15.5 A 53.8 AB 0.575 4.45 B 0.925 A 4.30 220 10.6
Yardwaste + calcium nitrate 6.7 33.2 B 187 AB 1654 139 ABC 13.3 AB 58.2 A 0.450 5.70 AB 0.800 AB 4.60 275 10.0
Fertigation 6.3 17.3 B 113 C 1288 99.3 C 11.4 AB 48.6 AB 0.750 4.62 B 0.500 C 2.97 374 7.73
2014
Treatment
Control 6.6 27.0 BC 115.75 BC 1300 114.25 AB 13.5 15.1 1.225 A 5.73 0.570 2.80 134 8.1
Calcium nitrate 2X 6.6 18.0 C 76.75 C 1146 91.5 AB 9.1 13.3 0.950 AB 5.73 0.450 2.20 147 7.0
Chicken Litter 6.8 92.3 A 188.75 AB 1556 152 AB 14.7 16.0 0.800 B 5.55 0.800 2.88 237 9.6
Yardwaste 6.8 27.3 BC 246.5 A 1490 158 A 11.2 19.0 0.700 B 5.95 0.825 3.90 221 9.5
Chicken litter + calcium nitrate 6.9 68.8 AB 150.25 BC 1493 133.25 AB 13.0 12.6 0.725 B 4.75 0.775 3.85 221 9.0
Yardwaste + calcium nitrate 7.0 25.0 BC 181 AB 1468 127 AB 10.6 18.8 0.675 B 5.45 0.750 3.45 198 8.8
Fertigation 6.2 13.8 C 89 C 1079 87.5 B 9.0 11.3 0.975 AB 5.78 0.425 2.28 256 6.9
2015
Treatment
Control 6.9 AB 21.5 C 100.5 CD 1326 BC 111.5 BCD 14.2 BC 13.9 DE 0.950 5.75 0.625 BC N/A N/A 8.0 BC
Calcium nitrate 2X 6.7 AB 17.75 C 74 D 1383 BC 98.5 CD 12.2 BC 14.5 DE 0.750 5.30 0.600 BC N/A N/A 8.0 BC
Chicken Litter 6.9 AB 258 A 216.5 B 2317 A 253 A 21.2 A 24.1 BC 0.550 6.18 1.225 A N/A N/A 14.2 A
Yardwaste 7.3 A 49.75 C 326 A 2267 A 262 A 13.1 BC 35.3 A 0.625 7.48 1.325 A N/A N/A 14.3 A
Chicken litter + calcium nitrate 7.0 AB 145.5 B 164.75 BC 2024 AB 179 B 18.2 AB 18.7 CD 0.650 5.43 1.075 AB N/A N/A 12.0 AB
Yardwaste + calcium nitrate 7.2 AB 34.0 C 195.5 B 1840 ABC 160.25 BC 12.2 BC 26.3 B 0.425 5.95 0.950 AB N/A N/A 10.9 ABC
Fertigation 6.4 B 13.25 C 77.5 D 1152 C 79.75 D 11.7 C 12.1 E 0.926 4.83 0.500 C N/A N/A 7.1 C

171
There were no differences in potentially mineralizable nitrogen from soil samples
analyzed in 2014 (Figure 3.) Microbial respiration was significantly affected by fertilizer treatment in 2013 (Figure 4). Yardwaste applications increased microbial respiration compared to all other treatments. Yardwaste, chicken litter, and yardwaste + calcium nitrate increased microbial respiration compared to soil from control soil and soil that was fertilized with two applications of calcium nitrate and fertigation. In 2014, there were significant differences in microbial respiration (Figure 5). Microbial respiration was greater in soils that received chicken litter + calcium nitrate fertilizer than in control soil and soil from all other fertilizer treatments. Microbial respiration trends from 2013 continued in 2015. Yardwaste applications increased microbial respiration compared to all other treatments (Figure 6). The lowest respiration rates were in the control soil, and the soil that received two applications of calcium nitrate or fertigation. Yardwaste, chicken litter, and yardwaste + calcium nitrate increased microbial respiration significantly compared to soil from control soil and soil that was fertilized with two applications of calcium nitrate or fertigation.
0
2
4
6
8
10
12
14
16
18
20
Control Calciumnitrate2X
Chickenlitter
Yardwaste Chickenlitter+calciumnitrate
Yardwaste+calciumnitrate
Fertigationwith
calciumnitrate
µgNg‐1SDW

172
Figure 3. Potentially mineralizable nitrogen in the form of ammonia was measured from soil samples collected from the upper most 10 cm of soil 30 cm from the tree base during late August 2014.
Figure 4. In 2013 soil respiration was measured for six weeks on soil samples collected from the upper most 10 cm of soil 30 cm from the tree base during late August.
Figure 5. In 2014 soil respiration was measured for six weeks on soil samples collected from the upper most 10 cm of soil 30 cm from the tree base during late August.
0
1
2
3
4
5
6
7
7 14 21 28 35 42
mg
CO
2/ g
OD
W
Days
Control
Calcium nitrate X 2
Chicken Litter
Yardwaste
Chicken litter +calcium nitrateYardwaste +calcium nitrateFertigation
A
B
BC
C
0
1
2
3
4
5
6
7
7 14 21 28 35 42
mg
CO
2/ g
OD
W
Days
Control
Calcium nitrate 2X
Chicken Litter
Yardwaste
Chicken litter + calciumnitrateYardwaste + calciumnitrateFertigation
A
B

173
Figure 6. In 2015 soil respiration was measured for six weeks on soil samples collected from the upper most 10 cm of soil 30 cm from the tree base during late August. DISCUSSION AND CONCLUSION:
These findings suggest that fertilizer application does not significantly affect leaf nitrogen status, tree growth, or fruit quality during the first three years of orchard establishment. It is important to note that after planting in 2013, tree growth was negatively affected by extensive deer damage. A deer fence was installed after the initial damage, and no further damage has been recorded. Compost applications did improve soil health qualities, such as cation exchange capacity and microbial respiration. Data from microbial biomass, potentially mineralizable nitrogen, soil organic matter and C:N for 2015 will provide more insights into the effects of fertilizers on soil health and nitrogen availability. There are yearly mineral and organic matter variations among composts that determine the amount of plant available nitrogen released into the soil. The C:N ratio of composts should be between 25-30:1 to ensure N mineralization. In composts with C:N ratios greater than 30:1, nitrogen will be immobilized by soil microbes. Composts with C:N ratios less than 25:1, such as those used in this study, will contain excessive nitrogen that can be lost to volatilization or leaching.
Our current leaf mineral data does not show a clear trend over the course of three years.
However, certain mineral nutrients, particularly phosphorous and potassium were available in composts while they were not available from traditional synthetic fertilizers (Table 2). These minerals were significantly higher in both the soil and leaves of trees that received compost applications as indicated by the 2013 leaf mineral analysis and soil fertility data. Phosphorous and potassium concentrations were higher in soils fertilized with compost in 2014 and 2015, as well. However, phosphorous and potassium were not higher in leaf samples from trees that received compost in 2014, and only phosphorous was higher in leaf samples from trees fertilized with compost in 2015. In 2014 and 2015, boron was higher in the leaves of trees that received compost fertilizers. The increase in leaf boron was not correlated with increased soil boron concentrations in 2014. Soil boron was higher in compost-fertilized soils in 2013, but this was not correlated with increased leaf boron concentrations that year. While boron concentrations were higher in both leaves and soil where compost was applied. Plants depend on mass flow to uptake boron; therefore, changes in the soil water content following the installation of drip irrigation in 2013 may have affected boron uptake. Our current data suggests that applying composts, or
0
1
2
3
4
5
6
7
7 14 21 28 35 42
mg
CO
2/ g
OD
W
Days
Control
Calcium nitrate2X
Chicken Litter
Yardwaste
Chicken litter+calcium nitrate
Yardwaste +calcium nitrate
Fertigation
A
B
BC
C

174
composts in conjunction with calcium nitrate fertilizer increased phosphorous, potassium and boron in the leaves of young trees. Boron is essential for flower bud growth and development. Boron has been shown to increase pollen germination and pollen tube growth, which improves fruit set (Stanley and Lichtenberg, 1963). Current data suggests that ground applied boron will not increase fruit set, but may improve yield and fruit quality measures such as color, titratable acidity and soluble solid concentration (Wojcik et al., 1999; Wojcik et al., 2008). Like boron, phosphorous can increase fruit set, yield and fruit quality measures such as, fruit color and size (Neilsen et al., 2008). In addition, phosphorous applications increase the flower cluster number and flower intensity (Neilsen et al., 1990). In this study, higher leaf phosphorous, potassium, and boron concentrations were not correlated with increased fruit quality or greater flower abundance. This may have occurred because all plants used in this study had adequate phosphorous, potassium and boron nutrition.
Soil microbial respiration increased in soils amended with compost treatments compared to the control, fertigation and two applications of calcium nitrate treatments in 2013 and 2015. This indicates that soil microbes were able to utilize the carbon and organic matter in composts to sustain their populations throughout the duration of the experiment while microbes in treatments lacking added carbon and organic matter were less active as the experiment continued due to the decreased availability of a carbon energy source. Soil microbial activity throughout the growing season may make certain plant nutrients, such as N, slowly available throughout the growing season through the break down and conversion of organic matter to plant available nutrient sources. There were no clear trends in the 2014 respiration data. The lower C:N ratio and the increased readily available N content of the chicken litter + calcium nitrate may have caused this treatment to have increased respiration compared to the other treatments including the higher carbon compost alone treatments if essential nutrients were limiting. The amount of potentially mineralizable nitrogen was also numerically greatest in the chicken litter + calcium nitrate fertilized soil in 2014. Literature cited: Neilsen, G.H., E.J. Hogue, and P. Parchomchuk. 1990. Flowering of apple trees in the second year is increased by first-year P fertilization. HortScience. 25:1247-1250. Neilsen G.H., D. Neilsen, P. Toivonen and L. Herbert. 2008. Annual bloom-time phosphorous fertigation affects soil phosphorous, apple tree phosphorous nutrition, yield, and fruit quality. HortScience. 43:885-890. Stanley, R.G. and E.A. Lichtenberg. 1963. The effects of various boron compounds on in vitro germination of pollen. Physiologia Plantarum. 16:337-346. Wojcik, P., G. Cieslinski, and A. Mika. 1999. Apple Yield and Fruit Quality as Influenced by Boron Application. Journal of Plant Nutrition. 22:1365-1377. Wojcik, P., M. Wojcik, and K. Klamkowski. 2008. Response of apple trees to boron fertilization under conditions of low soil boron availability. Scientia Horticulturae. 116:58-64.

175
Acknowledgement
I thank all CSFWC members who contributed to this proceedings. I also
thank Ms. Amanda Bly for compiling this proceedings and also her aid at
the registration desk, and Ms. Sabrina Hartley for her help at the
registration desk.
1 September 2016
Mizuho Nita