2015 cyber claims study - netdiligence® 2015 cyber claims study i ... impacts of a breach,...
TRANSCRIPT

SPONSORED BY:
2 0 1 5C Y B E RCLAIMSS T U DY

NetDiligence® 2015 Cyber Claims Study i
TABLE OF CONTENTS
Introduction . . . . . . . . . . . . . . . . . . . . . . . . . . . . . . . . . . . . . . . . 1
Key Findings . . . . . . . . . . . . . . . . . . . . . . . . . . . . . . . . . . . . . . . . 3
A Look at the Overall Dataset . . . . . . . . . . . . . . . . . . . . . . . . . . . . . . 4
Records Exposed . . . . . . . . . . . . . . . . . . . . . . . . . . . . . . . . . . . 4
Costs . . . . . . . . . . . . . . . . . . . . . . . . . . . . . . . . . . . . . . . . . 6
Viewing the Data through Different Lenses . . . . . . . . . . . . . . . . . . . . . . . 11
Type of Data Exposed . . . . . . . . . . . . . . . . . . . . . . . . . . . . . . . . 11
Cause of Loss . . . . . . . . . . . . . . . . . . . . . . . . . . . . . . . . . . . . . 14
Business Sector . . . . . . . . . . . . . . . . . . . . . . . . . . . . . . . . . . . . 18
Size of Affected Organization (Based on Revenue) . . . . . . . . . . . . . . . . . 22
Insider Involvement . . . . . . . . . . . . . . . . . . . . . . . . . . . . . . . . . 25
Third-Party Breaches . . . . . . . . . . . . . . . . . . . . . . . . . . . . . . . . . 27
About First-Party Losses . . . . . . . . . . . . . . . . . . . . . . . . . . . . . . . . . 29
Conclusion . . . . . . . . . . . . . . . . . . . . . . . . . . . . . . . . . . . . . . . . . 30
Insurance Industry Participants . . . . . . . . . . . . . . . . . . . . . . . . . . . . . 31
Additional Insights from our Sponsors . . . . . . . . . . . . . . . . . . . . . . . . . 32
AllClearID . . . . . . . . . . . . . . . . . . . . . . . . . . . . . . . . . . . . . . . 32
RSM . . . . . . . . . . . . . . . . . . . . . . . . . . . . . . . . . . . . . . . . . . 35
Cipriani & Werner . . . . . . . . . . . . . . . . . . . . . . . . . . . . . . . . . . . 37
Symantec . . . . . . . . . . . . . . . . . . . . . . . . . . . . . . . . . . . . . . . 39
NetDiligence® Featured in 2015 Data Breach Investigation Report (DBIR) . . . . . . 41
About NetDiligence® . . . . . . . . . . . . . . . . . . . . . . . . . . . . . . . . . . . 44

NetDiligence® 2015 Cyber Claims Study 1
INTRODUCTIONThe fifth annual NetDiligence® Cyber Claims Study uses actual cyber liability insurance
reported claims to illuminate the real costs of incidents from an insurer’s perspective . Our
goal is to raise awareness about cyber risk within the risk manager community .
For this study, we asked insurance underwriters about data breaches and the claim losses
they sustained . We looked at the type of data exposed, the cause of loss, the business
sector in which the incident occurred and the size of the affected organization . We also
looked at the two additional data points: was there insider involvement and was a third-
party vendor responsible for the incident .
We then looked at the costs associated with Crisis Services (forensics, notification, credit/ID
monitoring, legal counsel and miscellaneous other), Legal Damages (defense and settle-
ment), Regulatory Action (defense and settlement) and PCI Fines .
This report summarizes our findings for a sampling of 160 data breach insurance claims,
155 of which involved the exposure of sensitive personal data in a variety of business sec-
tors . Two business interruption claims did not involve the loss of sensitive information and
three claims were for defense of class action lawsuits alleging wrongful data collection .
It is important to note that many of the claims submitted for this study remain ‘open’,
therefore aggregate costs as presented in this study represent “payouts to-date” . It is vir-
tually certain that additional payouts will be made on a significant portion of the claims in
our dataset and therefore the costs in this study are almost certainly understated .
The majority of claims submitted for this study are for smaller (Main Street) organizations
and our findings best represent that group .
Many insurers are leveraging legal counsel (Breach Coach®) early in the claims process
to minimize mistakes on the part of the affected organization . This tends to prevent or
minimize follow-on regulatory fines, legal defense and settlement costs .
Insurers are putting in place ‘preferred vendor panels’ with pre-negotiated rates
for Crisis Services costs, which we believe significantly reduces the cost of breach
response for policyholders of those insurance carriers . We estimate data breach
response costs for an uninsured organization could be up to 30% higher than costs for
an insured organization .
Note: We’ve added a new research database with anonymized data from all our claims studies to
the eRiskHub® for the exclusive use of eRiskHub licensors and their clients . For more information
about the eRiskHub, contact Mark Greisiger at mark .greisiger@netdiligence .com .
NetDiligence® 2015 Cyber Claims Study 2
Study Methodology
This study, although limited, is unique because it focuses on covered events and actual
claims payouts . We asked the major underwriters of cyber liability to submit claims payout
information based on the following criteria:
The incident occurred between 2012 and 2015
The victimized organization had some form of cyber or privacy liability coverage
We received claims information for 160 events that fit our selection criteria . Of those,
104 claims (65%) specified the number of records exposed and 132 claims (83%) included a
detailed breakout of what had been paid out so far . Many of the events submitted for this
year’s study were recent, which means many claims are still open and actual costs have
not yet been finalized .
Readers should keep in mind the following:
Our sampling is a small subset of all breaches . We estimate that our dataset represents
approximately 5% of the total number of cyber claims handled by all markets within the
specified time period .
Some of our data points are lower than other studies because we focus on claim
payouts for specific breach-related expenses and do not factor in other financial
impacts of a breach, including investigation and administration expenses, customer
defections, opportunity loss, etc .
Our numbers are empirical as they were supplied directly by the underwriters who paid
the claims .
Most claims submitted were for total insured losses and so included self-insured
retentions (SIRs), which ranged from $0 to $15 million .
NetDiligence® 2015 Cyber Claims Study 3
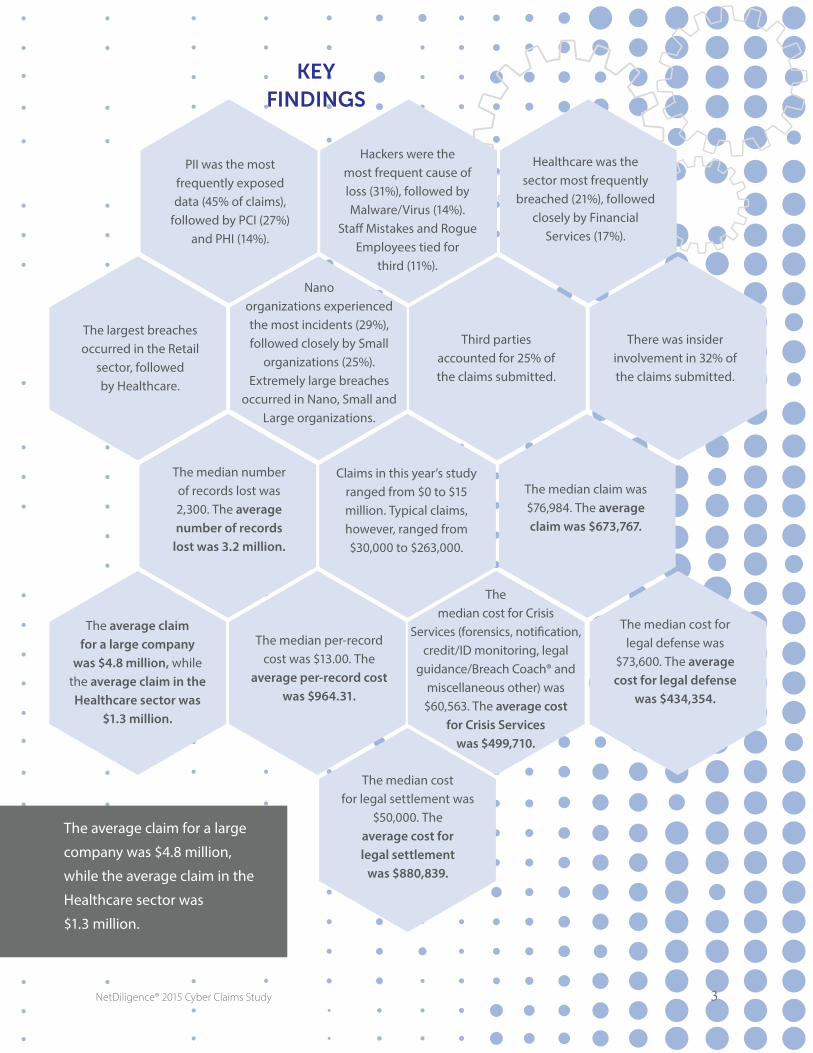
PII was the most frequently exposed data (45% of claims),
followed by PCI (27%) and PHI (14%).
Nano organizations experienced the most incidents (29%), followed closely by Small
organizations (25%). Extremely large breaches
occurred in Nano, Small and Large organizations.
The largest breaches occurred in the Retail
sector, followed by Healthcare.
The average claim for a large company
was $4.8 million, while the average claim in the Healthcare sector was
$1.3 million.
Hackers were the most frequent cause of loss (31%), followed by Malware/Virus (14%).
Staff Mistakes and Rogue Employees tied for
third (11%).
Healthcare was the sector most frequently
breached (21%), followed closely by Financial
Services (17%).
Third parties accounted for 25% of the claims submitted.
There was insider involvement in 32% of the claims submitted.
The median cost for legal defense was
$73,600. The average cost for legal defense
was $434,354.
The median number of records lost was 2,300. The average number of records
lost was 3.2 million.
The median per-record cost was $13.00. The
average per-record cost was $964.31.
Claims in this year’s study ranged from $0 to $15 million. Typical claims, however, ranged from $30,000 to $263,000.
The median cost for legal settlement was
$50,000. The average cost for legal settlement
was $880,839.
The median claim was $76,984. The average claim was $673,767.
The median cost for Crisis
Services (forensics, notification, credit/ID monitoring, legal
guidance/Breach Coach® and miscellaneous other) was
$60,563. The average cost for Crisis Services
was $499,710.
KEY FINDINGS
The average claim for a large
company was $4.8 million,
while the average claim in the
Healthcare sector was
$1.3 million.
NetDiligence® 2015 Cyber Claims Study 4
A LOOK AT THE OVERALL DATASETThere were 160 cyber claims submitted for this year’s study . Of that number, 155 claims
involved the loss, exposure or misuse of some type of personal sensitive data . The
remaining 5 incidents involved business interruption and wrongful data collection .
RECORDS EXPOSED
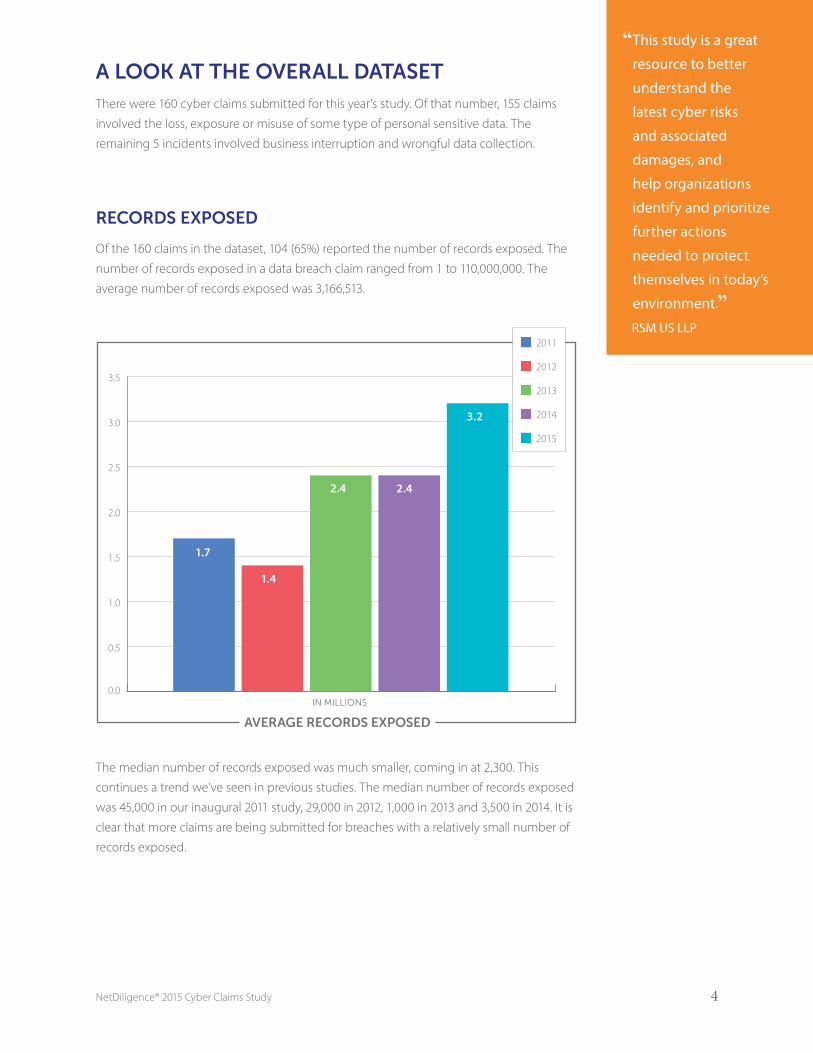
Of the 160 claims in the dataset, 104 (65%) reported the number of records exposed . The
number of records exposed in a data breach claim ranged from 1 to 110,000,000 . The
average number of records exposed was 3,166,513 .
The median number of records exposed was much smaller, coming in at 2,300 . This
continues a trend we’ve seen in previous studies . The median number of records exposed
was 45,000 in our inaugural 2011 study, 29,000 in 2012, 1,000 in 2013 and 3,500 in 2014 . It is
clear that more claims are being submitted for breaches with a relatively small number of
records exposed .
0.0
0.5
1.0
1.5
2.0
2.5
3.0
3.5
AVERAGE RECORDS EXPOSED
1.7
1.4
2.4 2.4
3.2
2011
2012
2013
2014
2015
IN MILLIONS
“ This study is a great
resource to better
understand the
latest cyber risks
and associated
damages, and
help organizations
identify and prioritize
further actions
needed to protect
themselves in today’s
environment.”RSM US LLP

NetDiligence® 2015 Cyber Claims Study 5
COST PER RECORD
Of the 160 claims in the dataset, 73 (46%) reported both the number of records lost
and the claim payout . The minimum cost per record was $0 and the maximum cost per
record was $35,000 .00 . The average cost per record was $964.31, while the median
cost was $13 .00 .
The industry appears to have reached a consensus that using a standard per-record cost
to estimate total breach cost is problematic . While there is clearly a direct correlation
between number of records lost and some costs (for example, notification), there is only
an indirect correlation for some costs (regulatory fines) and no discernable correlation
for other costs (forensics) . Relatively small breaches can incur significant costs for legal
(Breach Coach®) guidance, forensic investigation, regulatory fines, etc . For this reason, high per- record costs are possible regardless of breach size.
0
200
400
600
800
1,000
AVERAGE COST PER RECORD
2011
2012
2013
2014
2015
$1.36 $3.94
$307.04
$956.21 $964.31
Relatively small breaches can incur
significant costs for legal (Breach Coach®)
guidance, forensic investigation, regulatory
fines, etc. For this reason, high per-record
costs are possible regardless of breach size.
NetDiligence® 2015 Cyber Claims Study 6
COSTS
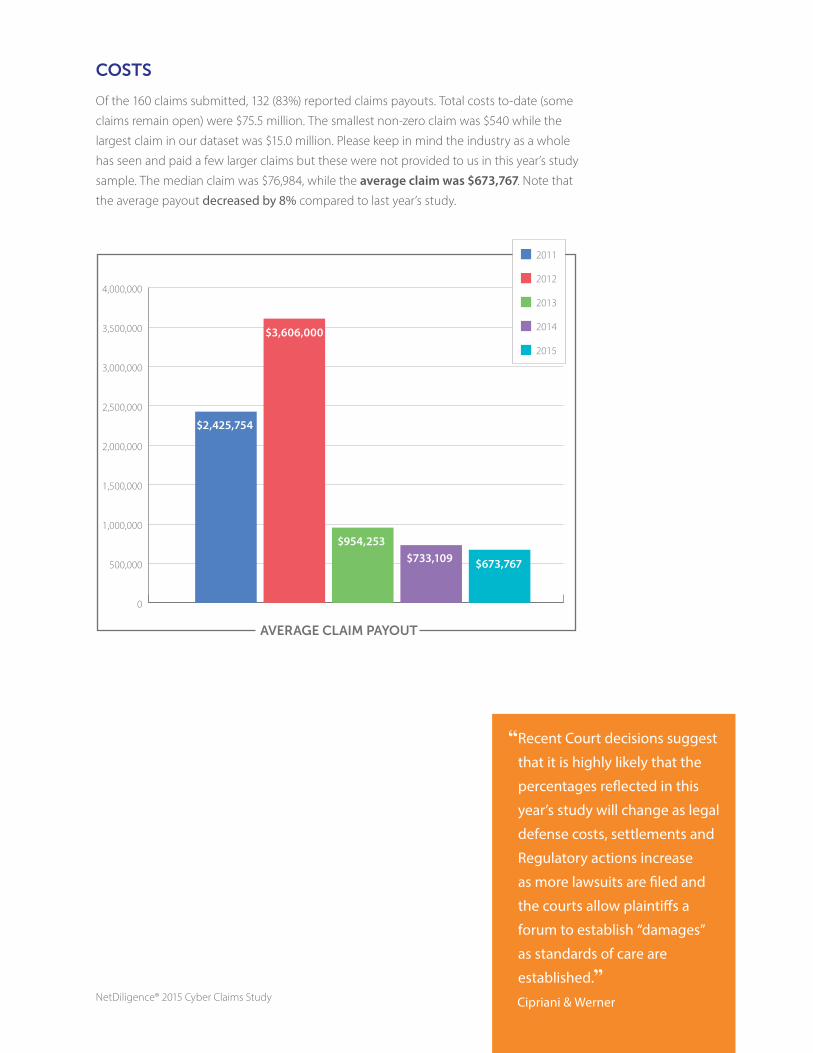
Of the 160 claims submitted, 132 (83%) reported claims payouts . Total costs to-date (some
claims remain open) were $75 .5 million . The smallest non-zero claim was $540 while the
largest claim in our dataset was $15 .0 million . Please keep in mind the industry as a whole
has seen and paid a few larger claims but these were not provided to us in this year’s study
sample . The median claim was $76,984, while the average claim was $673,767 . Note that
the average payout decreased by 8% compared to last year’s study .
0
500,000
1,000,000
1,500,000
2,000,000
2,500,000
3,000,000
3,500,000
4,000,000
AVERAGE CLAIM PAYOUT
$2,425,754
$3,606,000
$954,253$733,109 $673,767
2011
2012
2013
2014
2015
“ Recent Court decisions suggest
that it is highly likely that the
percentages reflected in this
year’s study will change as legal
defense costs, settlements and
Regulatory actions increase
as more lawsuits are filed and
the courts allow plaintiffs a
forum to establish “damages”
as standards of care are
established.”Cipriani & Werner
NetDiligence® 2015 Cyber Claims Study 7
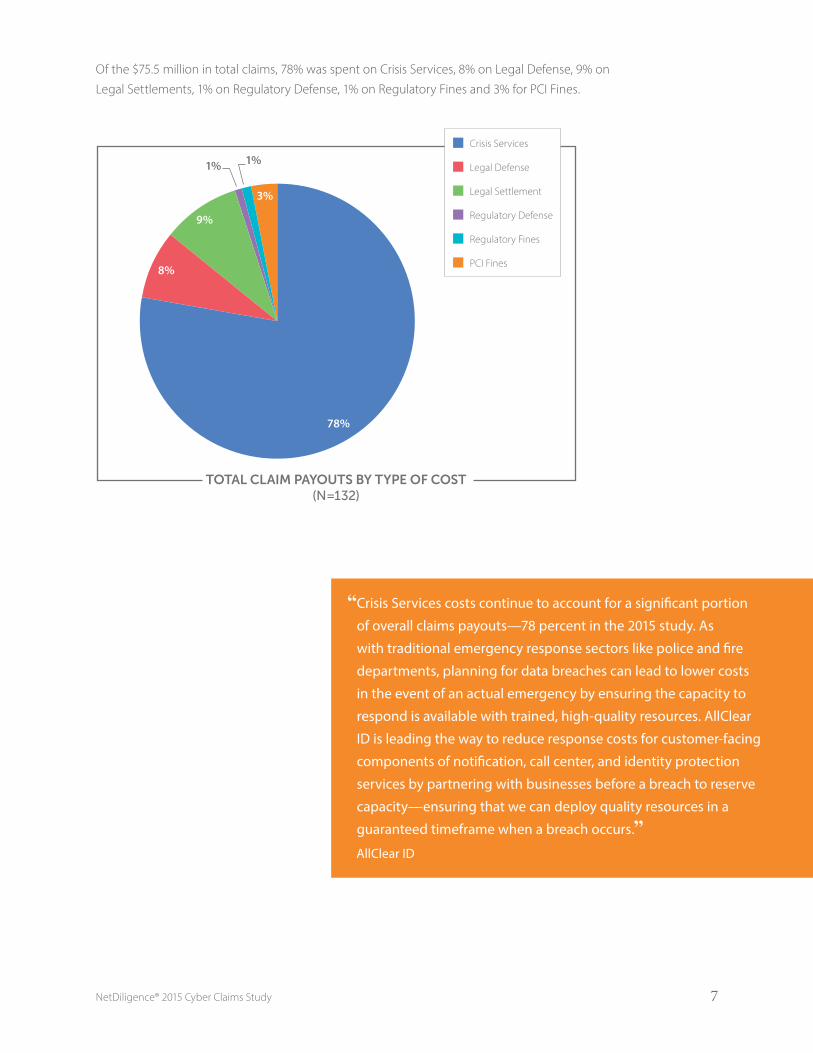
Of the $75 .5 million in total claims, 78% was spent on Crisis Services, 8% on Legal Defense, 9% on
Legal Settlements, 1% on Regulatory Defense, 1% on Regulatory Fines and 3% for PCI Fines .
TOTAL CLAIM PAYOUTS BY TYPE OF COST(N=132)
Crisis Services
Legal Defense
Legal Settlement
Regulatory Defense
Regulatory Fines
PCI Fines
78%
8%
9%
1% 1%
3%
“ Crisis Services costs continue to account for a significant portion
of overall claims payouts—78 percent in the 2015 study. As
with traditional emergency response sectors like police and fire
departments, planning for data breaches can lead to lower costs
in the event of an actual emergency by ensuring the capacity to
respond is available with trained, high-quality resources. AllClear
ID is leading the way to reduce response costs for customer-facing
components of notification, call center, and identity protection
services by partnering with businesses before a breach to reserve
capacity—ensuring that we can deploy quality resources in a
guaranteed timeframe when a breach occurs.”AllClear ID

NetDiligence® 2015 Cyber Claims Study 8
CRISIS SERVICES COSTS
Of the 160 claims submitted this year, 105 included costs for one or more components
of Crisis Services . The smallest (non-zero) claim for Crisis Services was $14, while the
largest claim was $15 million . The average for Crisis Services was $499,710. The
median was $60,563 .
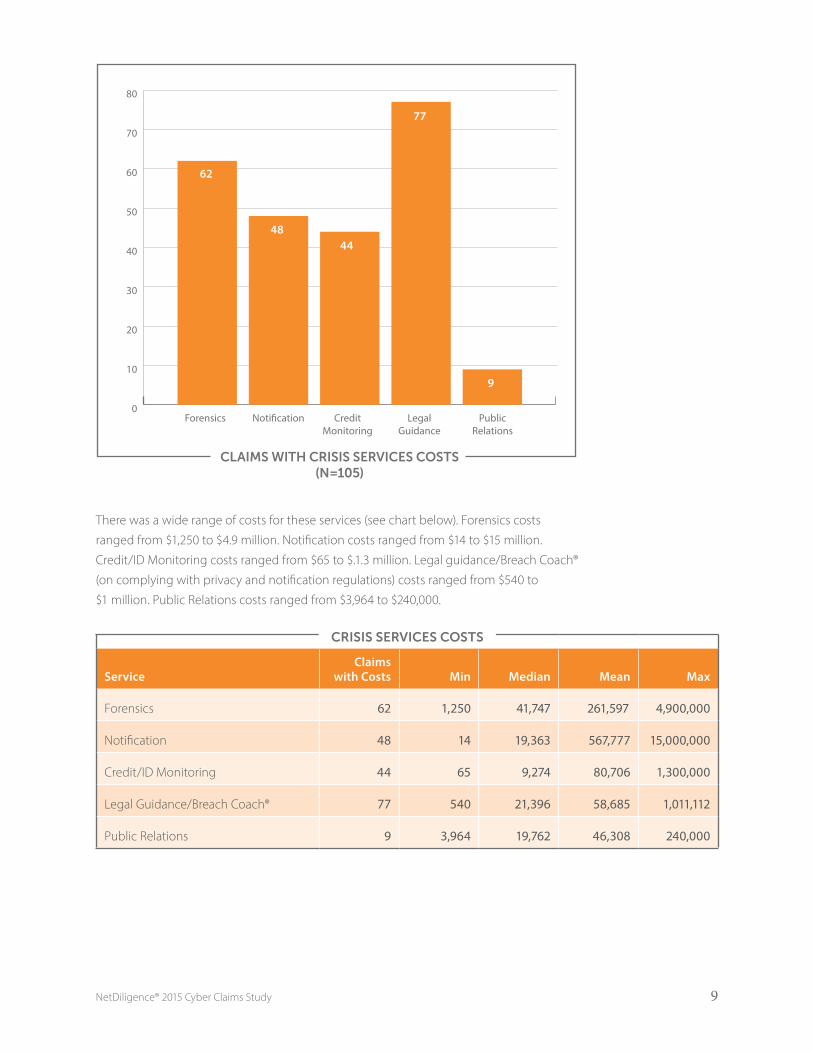
Once again, not all claims included all of the services that comprise Crisis Services . Of
the claims that reported Crisis Services, 62 (59%) included forensics, 48 (46%) included
notification*, 44 (42%) included credit/ID monitoring and 77 (73%) included legal guid-
ance/Breach Coach® . These numbers reflect all claims that reported a dollar figure for a
particular service . This year, 18 claims (17%) included other costs, including public rela-
tions, card replacement and ransom paid .
* A significant number of the claims submitted for last year’s (2014) study reported a single amount
for bundled services that included notification, call center, credit monitoring and ID restoration,
rather than individual amounts for each service . For that reason, we reported the aggregate total
for these services under a single category called “Notification .” However, in this year’s claims study,
the bundled services approach appeared to reverse itself . About half the claims in this year’s data-
set reported these costs as bundled services and the other half of claims reported individual costs
for Notification, Call Center, and Credit/ID Monitoring services .
0
200,000
400,000
600,000
800,000
1,000,000
AVERAGE CRISIS SERVICES COSTS
$881,533
$982,620
$737,473
$366,484
$499,710
2011
2012
2013
2014
2015
NetDiligence® 2015 Cyber Claims Study 9
There was a wide range of costs for these services (see chart below) . Forensics costs
ranged from $1,250 to $4 .9 million . Notification costs ranged from $14 to $15 million .
Credit/ID Monitoring costs ranged from $65 to $ .1 .3 million . Legal guidance/Breach Coach®
(on complying with privacy and notification regulations) costs ranged from $540 to
$1 million . Public Relations costs ranged from $3,964 to $240,000 .
CRISIS SERVICES COSTS
ServiceClaims
with Costs Min Median Mean Max
Forensics 62 1,250 41,747 261,597 4,900,000
Notification 48 14 19,363 567,777 15,000,000
Credit/ID Monitoring 44 65 9,274 80,706 1,300,000
Legal Guidance/Breach Coach® 77 540 21,396 58,685 1,011,112
Public Relations 9 3,964 19,762 46,308 240,000
CLAIMS WITH CRISIS SERVICES COSTS(N=105)
0
10
20
30
40
50
60
70
80
62
4844
77
9
Forensics Noti�cation CreditMonitoring
LegalGuidance
PublicRelations

NetDiligence® 2015 Cyber Claims Study 10
LEGAL DAMAGES
Of the 160 claims submitted this year, only 16 (10%) included costs for legal damages .
Like Crisis Services, the range of legal costs was extremely broad . Legal defense payouts
ranged from $6,881 to $2 .5 million . Payouts for legal settlements ranged from $1,968 to
$5 .9 million .
LEGAL DAMAGES
ExpenseClaims
with Costs Min Median Mean Max
Legal Defense 12 6,881 73,600 434,354 2,500,000
Legal Settlement 7 1,968 50,000 880,839 5,855,000
REGULATORY ACTION
Of the 160 claims submitted this year, only 4 (3%) included costs for regulatory actions .
As we’ve discovered in other cost categories, there was a wide range of regulatory costs .
Payouts for regulatory defense ranged from $67,500 to $327,000 . One claim reported a
regulatory fine of $750,000 .
REGULATORY ACTION
ExpenseClaims
with Costs Min Median Mean Max
Regulatory Defense 4 67,500 175,000 186,125 327,000
Regulatory Settlement 1 750,000 750,000 750,000 750,000
Claims that included regulatory costs in this year’s study ranged from slightly more than
41,000 records exposed to 6 .5 million records exposed . For that reason, the potential for
regulatory action and its associated costs should be considered when evaluating any orga-
nization’s risk exposure, regardless of the size of the organization or the size of the breach .
PCI FINES
Of the 160 claims submitted this year, only 6 (4%) included costs for PCI fines . Payouts for
PCI fines ranged from $21,229 to $600,000 .
PCI FINES
ExpenseClaims
with Costs Min Median Mean Max
Fines 6 21,229 199,419 268,780 600,000
NetDiligence® 2015 Cyber Claims Study 11
VIEWING THE DATA THROUGH DIFFERENT LENSES
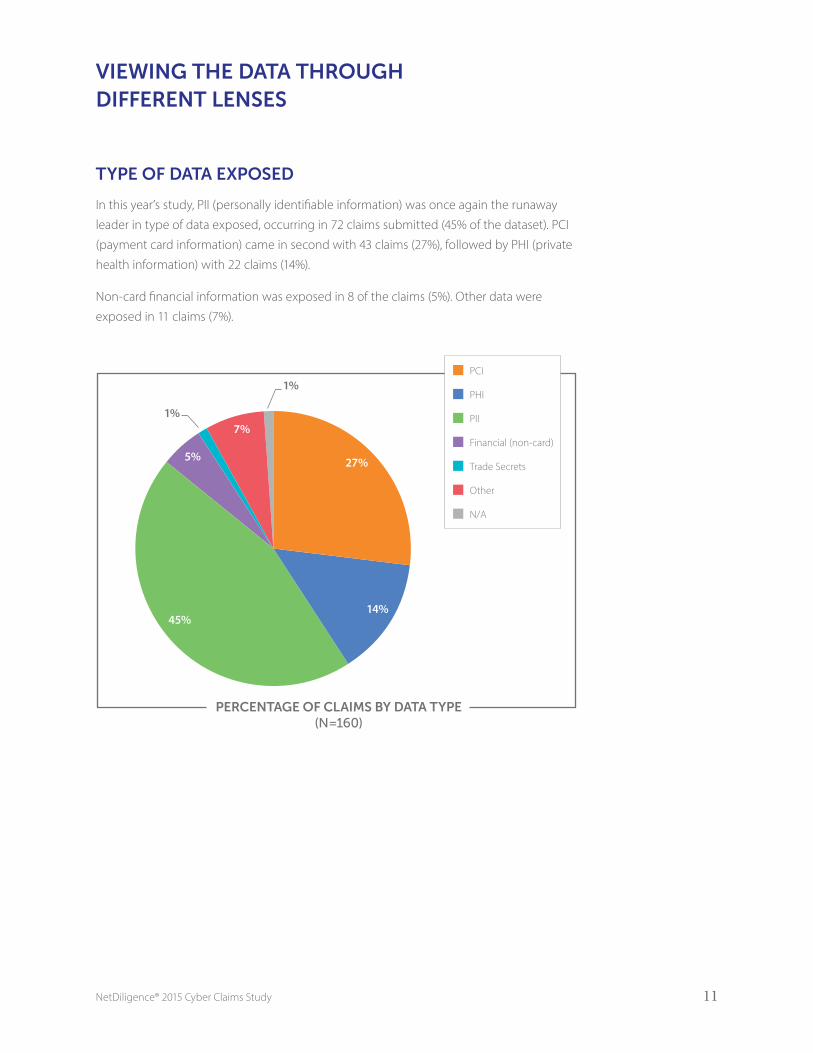
TYPE OF DATA EXPOSED
In this year’s study, PII (personally identifiable information) was once again the runaway
leader in type of data exposed, occurring in 72 claims submitted (45% of the dataset) . PCI
(payment card information) came in second with 43 claims (27%), followed by PHI (private
health information) with 22 claims (14%) .
Non-card financial information was exposed in 8 of the claims (5%) . Other data were
exposed in 11 claims (7%) .
PERCENTAGE OF CLAIMS BY DATA TYPE(N=160)
PCI
PHI
PII
Financial (non-card)
Trade Secrets
Other
N/A
14%
5%
1%7%
1%
27%
45%
NetDiligence® 2015 Cyber Claims Study 12
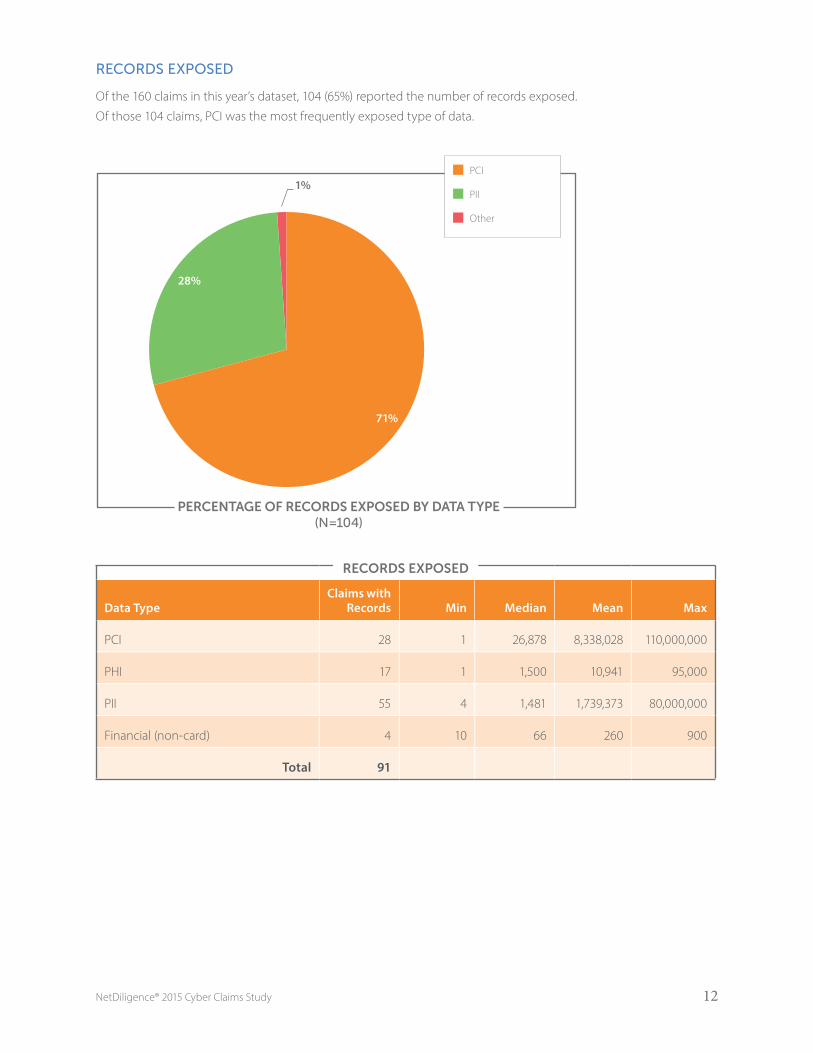
RECORDS EXPOSED
Of the 160 claims in this year’s dataset, 104 (65%) reported the number of records exposed .
Of those 104 claims, PCI was the most frequently exposed type of data .
RECORDS EXPOSED
Data TypeClaims with
Records Min Median Mean Max
PCI 28 1 26,878 8,338,028 110,000,000
PHI 17 1 1,500 10,941 95,000
PII 55 4 1,481 1,739,373 80,000,000
Financial (non-card) 4 10 66 260 900
Total 91
PERCENTAGE OF RECORDS EXPOSED BY DATA TYPE(N=104)
PCI
PII
Other
71%
28%
1%
NetDiligence® 2015 Cyber Claims Study 13
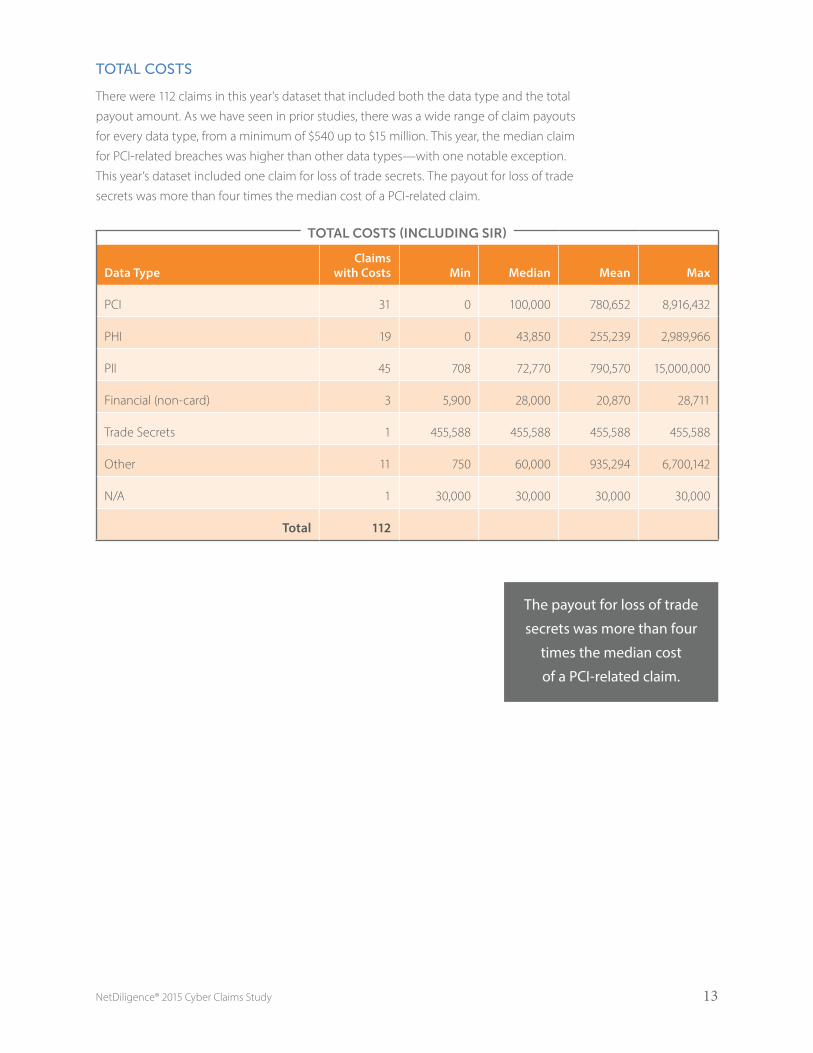
TOTAL COSTS
There were 112 claims in this year’s dataset that included both the data type and the total
payout amount . As we have seen in prior studies, there was a wide range of claim payouts
for every data type, from a minimum of $540 up to $15 million . This year, the median claim
for PCI-related breaches was higher than other data types—with one notable exception .
This year’s dataset included one claim for loss of trade secrets . The payout for loss of trade
secrets was more than four times the median cost of a PCI-related claim .
TOTAL COSTS (INCLUDING SIR)
Data TypeClaims
with Costs Min Median Mean Max
PCI 31 0 100,000 780,652 8,916,432
PHI 19 0 43,850 255,239 2,989,966
PII 45 708 72,770 790,570 15,000,000
Financial (non-card) 3 5,900 28,000 20,870 28,711
Trade Secrets 1 455,588 455,588 455,588 455,588
Other 11 750 60,000 935,294 6,700,142
N/A 1 30,000 30,000 30,000 30,000
Total 112
The payout for loss of trade
secrets was more than four
times the median cost
of a PCI-related claim.
NetDiligence® 2015 Cyber Claims Study 14
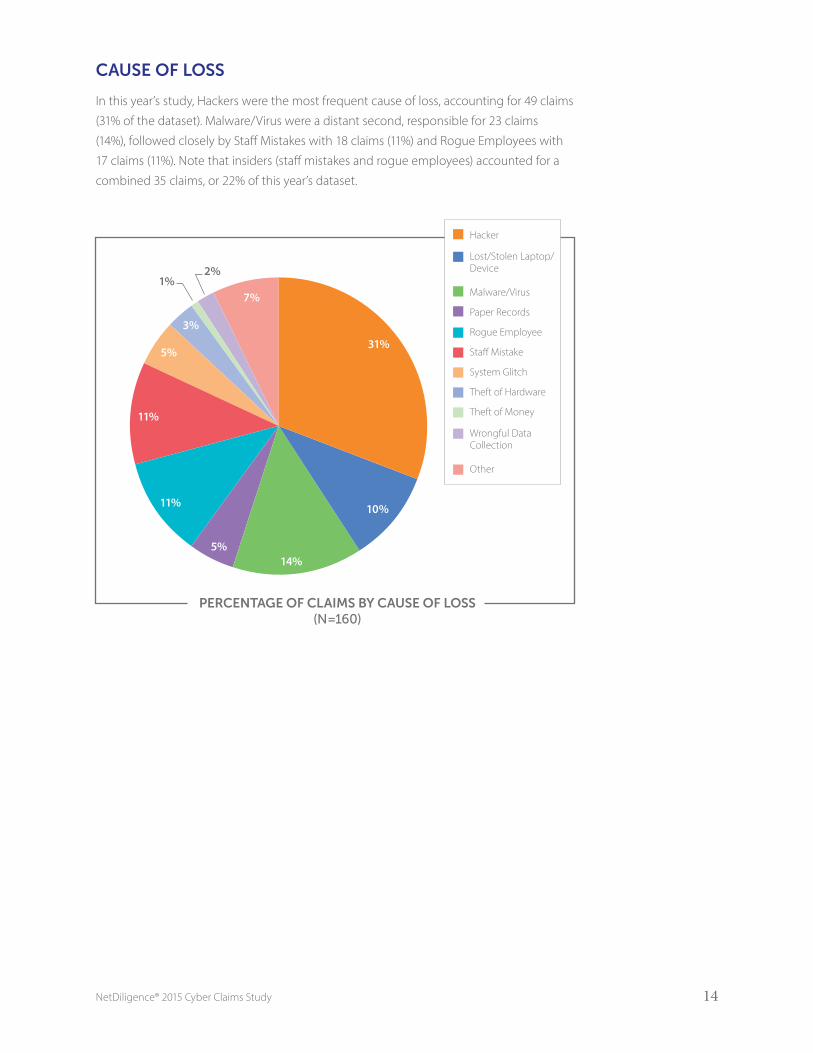
CAUSE OF LOSS
In this year’s study, Hackers were the most frequent cause of loss, accounting for 49 claims
(31% of the dataset) . Malware/Virus were a distant second, responsible for 23 claims
(14%), followed closely by Staff Mistakes with 18 claims (11%) and Rogue Employees with
17 claims (11%) . Note that insiders (staff mistakes and rogue employees) accounted for a
combined 35 claims, or 22% of this year’s dataset .
PERCENTAGE OF CLAIMS BY CAUSE OF LOSS(N=160)
1%2%
Hacker
Lost/Stolen Laptop/Device
Malware/Virus
Paper Records
Rogue Employee
Sta� Mistake
System Glitch
Theft of Hardware
Theft of Money
Wrongful DataCollection
Other
31%
11%
14%5%
11%
3%
10%
5%
7%

NetDiligence® 2015 Cyber Claims Study 15
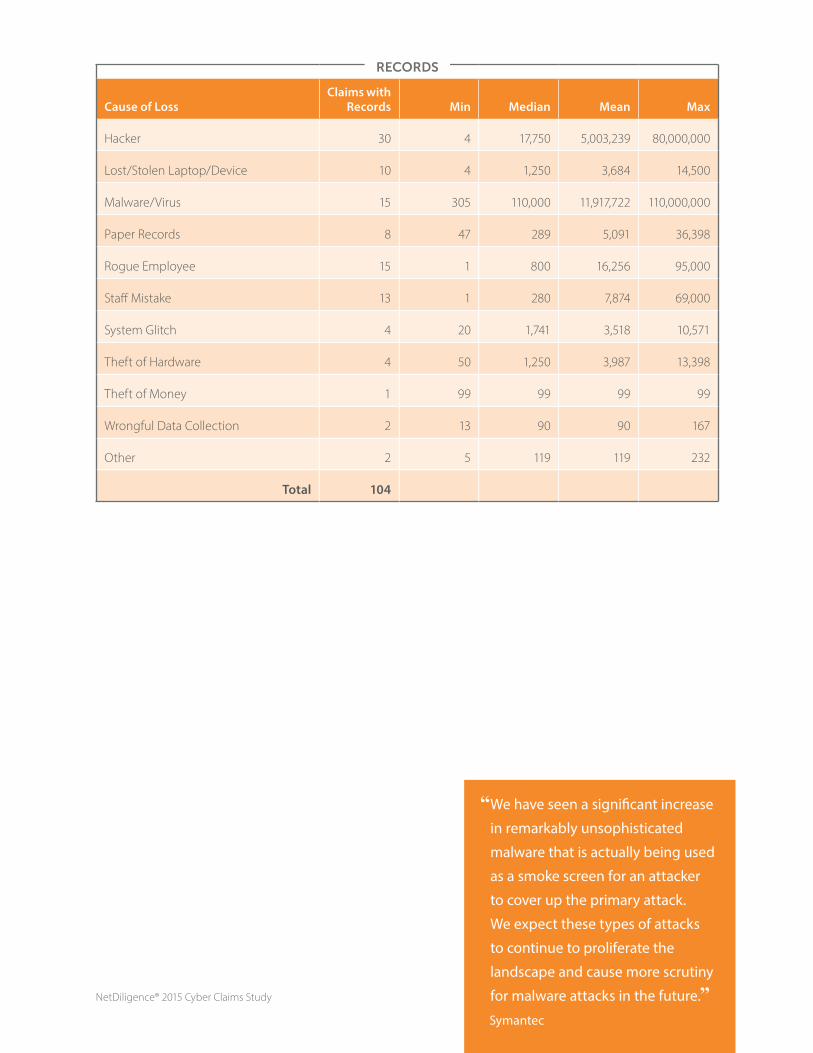
RECORDS EXPOSED
Of the 160 claims in this year’s dataset, 104 (65%) reported the number of records exposed .
For those 104 claims, Hackers and Malware/Virus accounted for 99% of exposed data .
While Malware/Virus accounted for only 14% of claim events, those incidents resulted
in 54% of records exposed . Hackers accounted for only 31% of claim events, but 45% of
records exposed . Since Hacker attacks often begin with the introduction of malware into
the organization’s network, it’s instructive to look at the combined impact of these two
causes of loss . Together, Hackers and Malware/Virus accounted for less than half (45%) of
the claims in our dataset, but 99% of the records exposed .
PERCENTAGE OF RECORDS EXPOSED BY CAUSE OF LOSS(N=104)
1%
Hacker
Malware/Virus
All Other Causes
54%
45%
NetDiligence® 2015 Cyber Claims Study 16
RECORDS
Cause of LossClaims with
Records Min Median Mean Max
Hacker 30 4 17,750 5,003,239 80,000,000
Lost/Stolen Laptop/Device 10 4 1,250 3,684 14,500
Malware/Virus 15 305 110,000 11,917,722 110,000,000
Paper Records 8 47 289 5,091 36,398
Rogue Employee 15 1 800 16,256 95,000
Staff Mistake 13 1 280 7,874 69,000
System Glitch 4 20 1,741 3,518 10,571
Theft of Hardware 4 50 1,250 3,987 13,398
Theft of Money 1 99 99 99 99
Wrongful Data Collection 2 13 90 90 167
Other 2 5 119 119 232
Total 104
“ We have seen a significant increase
in remarkably unsophisticated
malware that is actually being used
as a smoke screen for an attacker
to cover up the primary attack.
We expect these types of attacks
to continue to proliferate the
landscape and cause more scrutiny
for malware attacks in the future.”Symantec
NetDiligence® 2015 Cyber Claims Study 17
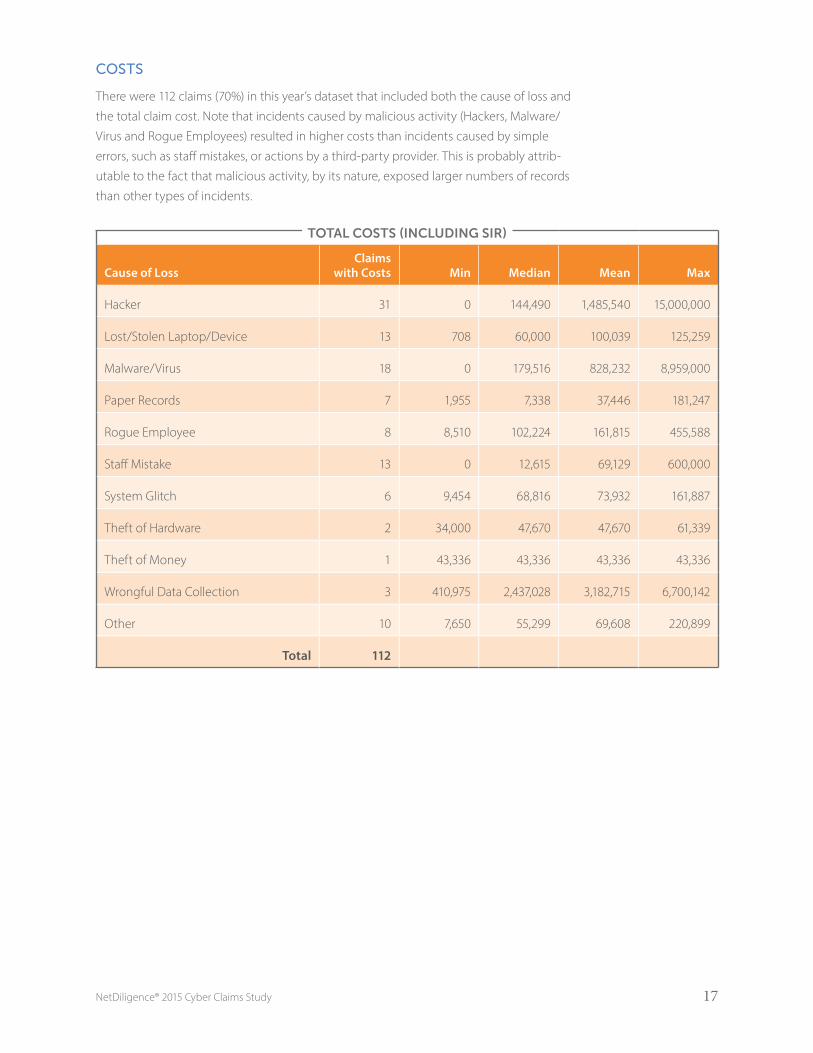
COSTS
There were 112 claims (70%) in this year’s dataset that included both the cause of loss and
the total claim cost . Note that incidents caused by malicious activity (Hackers, Malware/
Virus and Rogue Employees) resulted in higher costs than incidents caused by simple
errors, such as staff mistakes, or actions by a third-party provider . This is probably attrib-
utable to the fact that malicious activity, by its nature, exposed larger numbers of records
than other types of incidents .
TOTAL COSTS (INCLUDING SIR)
Cause of LossClaims
with Costs Min Median Mean Max
Hacker 31 0 144,490 1,485,540 15,000,000
Lost/Stolen Laptop/Device 13 708 60,000 100,039 125,259
Malware/Virus 18 0 179,516 828,232 8,959,000
Paper Records 7 1,955 7,338 37,446 181,247
Rogue Employee 8 8,510 102,224 161,815 455,588
Staff Mistake 13 0 12,615 69,129 600,000
System Glitch 6 9,454 68,816 73,932 161,887
Theft of Hardware 2 34,000 47,670 47,670 61,339
Theft of Money 1 43,336 43,336 43,336 43,336
Wrongful Data Collection 3 410,975 2,437,028 3,182,715 6,700,142
Other 10 7,650 55,299 69,608 220,899
Total 112
NetDiligence® 2015 Cyber Claims Study 18
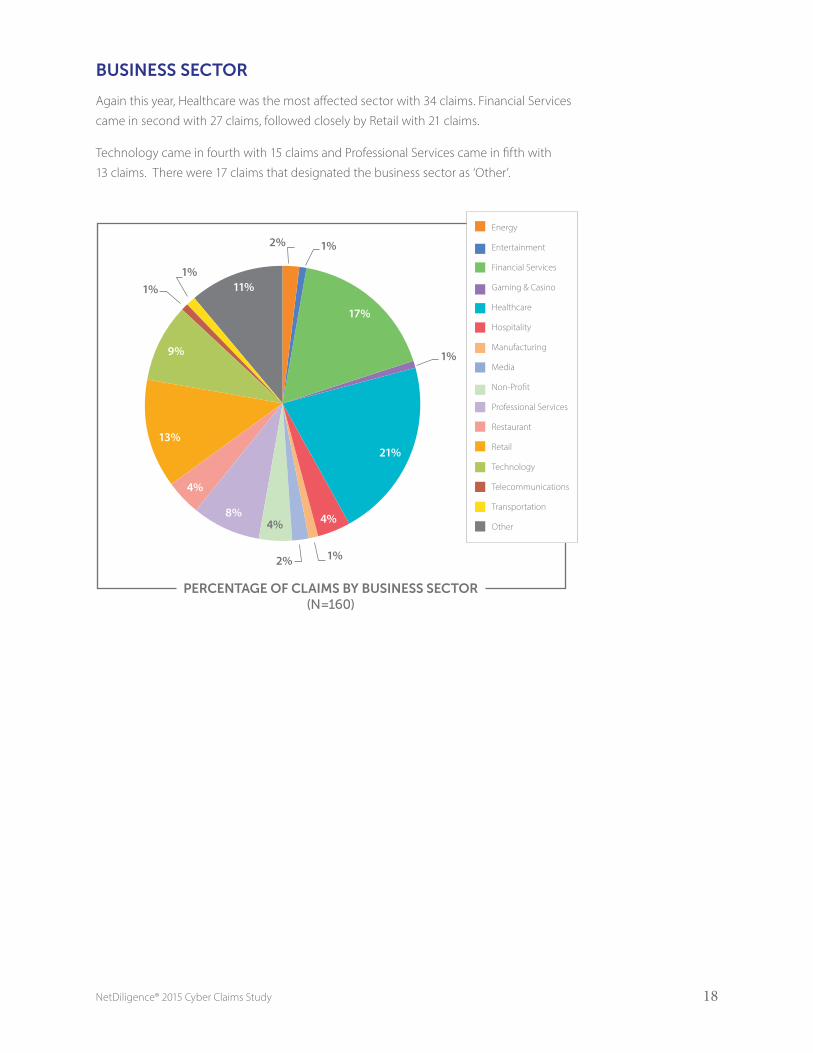
BUSINESS SECTOR
Again this year, Healthcare was the most affected sector with 34 claims . Financial Services
came in second with 27 claims, followed closely by Retail with 21 claims .
Technology came in fourth with 15 claims and Professional Services came in fifth with
13 claims . There were 17 claims that designated the business sector as ‘Other’ .
PERCENTAGE OF CLAIMS BY BUSINESS SECTOR(N=160)
Energy
Entertainment
Financial Services
Gaming & Casino
Healthcare
Hospitality
Manufacturing
Media
Non-Pro�t
Professional Services
Restaurant
Retail
Technology
Telecommunications
Transportation
Other
21%
9%
1%11%
2%
17%
4%
4%8%
13%
1%
1%
1%
1%2%
4%

NetDiligence® 2015 Cyber Claims Study 19
RECORDS EXPOSED
Of the 104 claims that reported number of records exposed, the Retail sector accounted
for the vast majority of records exposed (71%), although that sector was responsible for
only 13% of the claims in our dataset .
Healthcare came in second, accounting for 28% of records exposed . All other sectors
combined accounted for the remaining 1% of records exposed .
PERCENTAGE OF RECORDS EXPOSED BY BUSINESS SECTOR(N=104)
1%Healthcare
Retail
All OtherSectors
28%
71%
NetDiligence® 2015 Cyber Claims Study 20
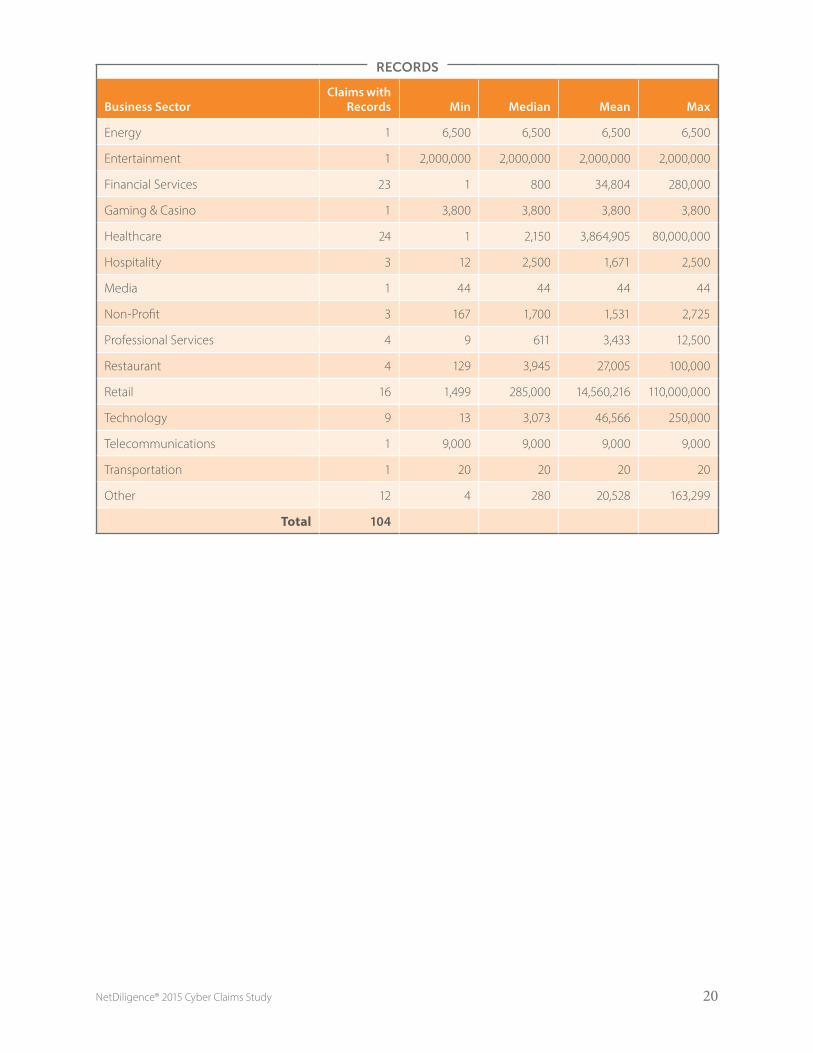
RECORDS
Business SectorClaims with
Records Min Median Mean Max
Energy 1 6,500 6,500 6,500 6,500
Entertainment 1 2,000,000 2,000,000 2,000,000 2,000,000
Financial Services 23 1 800 34,804 280,000
Gaming & Casino 1 3,800 3,800 3,800 3,800
Healthcare 24 1 2,150 3,864,905 80,000,000
Hospitality 3 12 2,500 1,671 2,500
Media 1 44 44 44 44
Non-Profit 3 167 1,700 1,531 2,725
Professional Services 4 9 611 3,433 12,500
Restaurant 4 129 3,945 27,005 100,000
Retail 16 1,499 285,000 14,560,216 110,000,000
Technology 9 13 3,073 46,566 250,000
Telecommunications 1 9,000 9,000 9,000 9,000
Transportation 1 20 20 20 20
Other 12 4 280 20,528 163,299
Total 104

NetDiligence® 2015 Cyber Claims Study 21
COSTS
There were 112 claims in this year’s dataset that included both the business sector affected
and the total payout amount .
TOTAL COSTS (INCLUDING SIR)
Business SectorClaims
with Costs Min Median Mean Max
Entertainment 1 73,968 73,968 73,968 73,968
Financial Services 15 0 72,770 141,249 809,788
Gaming & Casino 2 80,000 87,275 87,275 94,550
Healthcare 25 2,598 60,563 1,325,777 15,000,000
Hospitality 6 30,000 82,724 195,447 706,000
Manufacturing 2 750 65,967 65,967 131,184
Media 3 6,000 55,299 68,596 144,490
Non-Profit 5 5,900 35,794 50,112 101,127
Professional Services 10 6,704 29,217 329,845 2,989,966
Restaurant 5 4,000 16,212 75,744 250,000
Retail 12 91,359 455,488 1,795,266 8,916,432
Technology 11 0 90,000 206,532 641,635
Other 15 708 61,339 713,133 6,700,142
Total 112
This year, the Healthcare and Retail sectors each had higher average costs than all other
sector combined . This is primarily due to a few extremely large incidents (caused by
Hackers and Malware/Virus) within those two sectors .
Individually, the
Healthcare and Retail
sectors each had
higher average costs
than all other sectors
combined.

NetDiligence® 2015 Cyber Claims Study 22
SIZE OF AFFECTED ORGANIZATION (BASED ON REVENUE)
For the first time in this study, revenue size of the affected organization was reported for
the vast majority of claims in the dataset . Nano-Revenue organizations were the most
impacted, accounting for 46 claims (29%) . They were followed by Small-Revenue, which
accounted for 40 claims (25%), and Micro-Revenue, which accounted for 29 claims (18%) .
Mid-Revenue organizations accounted for 20 claims (13%), while Large-Revenue organiza-
tions accounted for 19 claims (12%) . There was one claim for a Mega-Revenue organization
and five claims that did not report the size of the organization .
This mirrors our previous findings: smaller organizations experience most of the incidents .
Our continuing hypothesis—which nothing in this year’s study disproves—is that this is
due to the fact that there are simply more small organizations than there are large ones .
Other contributing factors may be that smaller organizations are less aware of their expo-
sure or they have fewer resources to provide appropriate data protection and/or security
awareness training for employees .
PERCENTAGE OF CLAIMS BY REVENUE SIZE(N=160)
Nano-Revenue(< $50M)
Micro-Revenue($50M–$300M)
Small-Revenue($300M–$2B)
Mid-Revenue($2B–$10B)
Large-Revenue($10B–$100B)
Mega-Revenue(> $100B)
Unknown
18%
13%
1%
3%
28%
25%
12%
NetDiligence® 2015 Cyber Claims Study 23
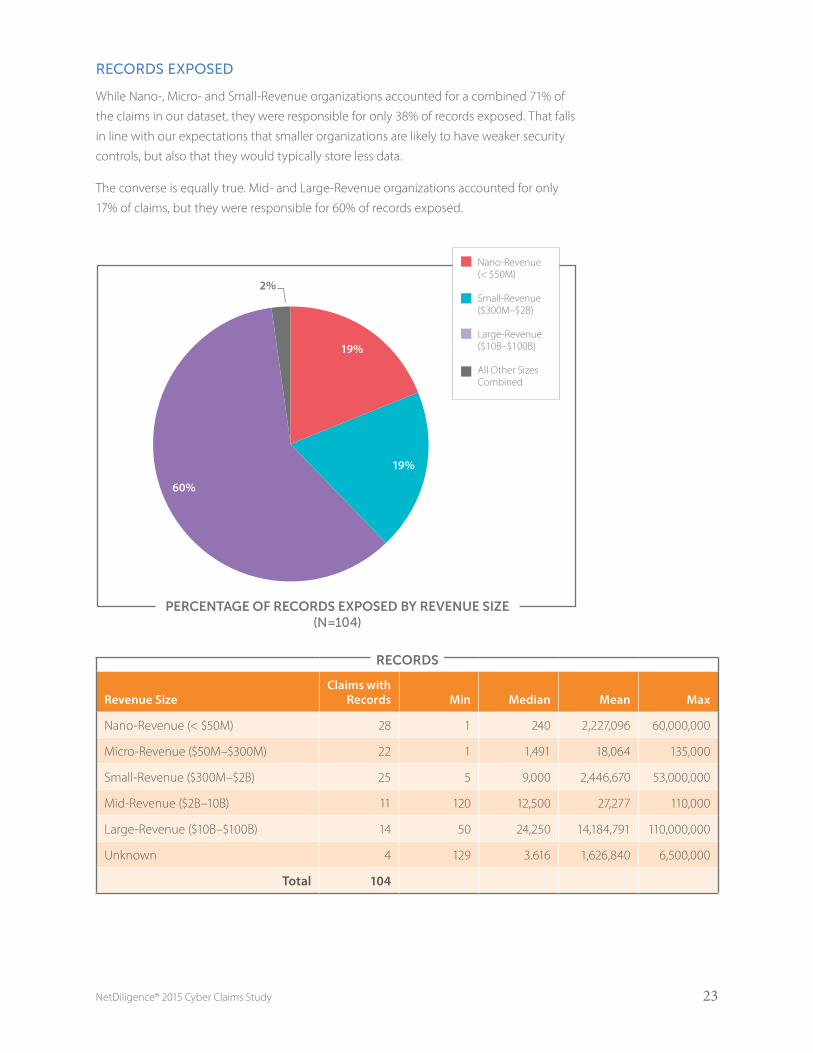
RECORDS EXPOSED
While Nano-, Micro- and Small-Revenue organizations accounted for a combined 71% of
the claims in our dataset, they were responsible for only 38% of records exposed . That falls
in line with our expectations that smaller organizations are likely to have weaker security
controls, but also that they would typically store less data .
The converse is equally true . Mid- and Large-Revenue organizations accounted for only
17% of claims, but they were responsible for 60% of records exposed .
RECORDS
Revenue SizeClaims with
Records Min Median Mean Max
Nano-Revenue (< $50M) 28 1 240 2,227,096 60,000,000
Micro-Revenue ($50M–$300M) 22 1 1,491 18,064 135,000
Small-Revenue ($300M–$2B) 25 5 9,000 2,446,670 53,000,000
Mid-Revenue ($2B–10B) 11 120 12,500 27,277 110,000
Large-Revenue ($10B–$100B) 14 50 24,250 14,184,791 110,000,000
Unknown 4 129 3 .616 1,626,840 6,500,000
Total 104
PERCENTAGE OF RECORDS EXPOSED BY REVENUE SIZE(N=104)
2%
Nano-Revenue(< $50M)
Small-Revenue($300M–$2B)
Large-Revenue($10B–$100B)
All Other SizesCombined
60%
19%
19%
NetDiligence® 2015 Cyber Claims Study 24
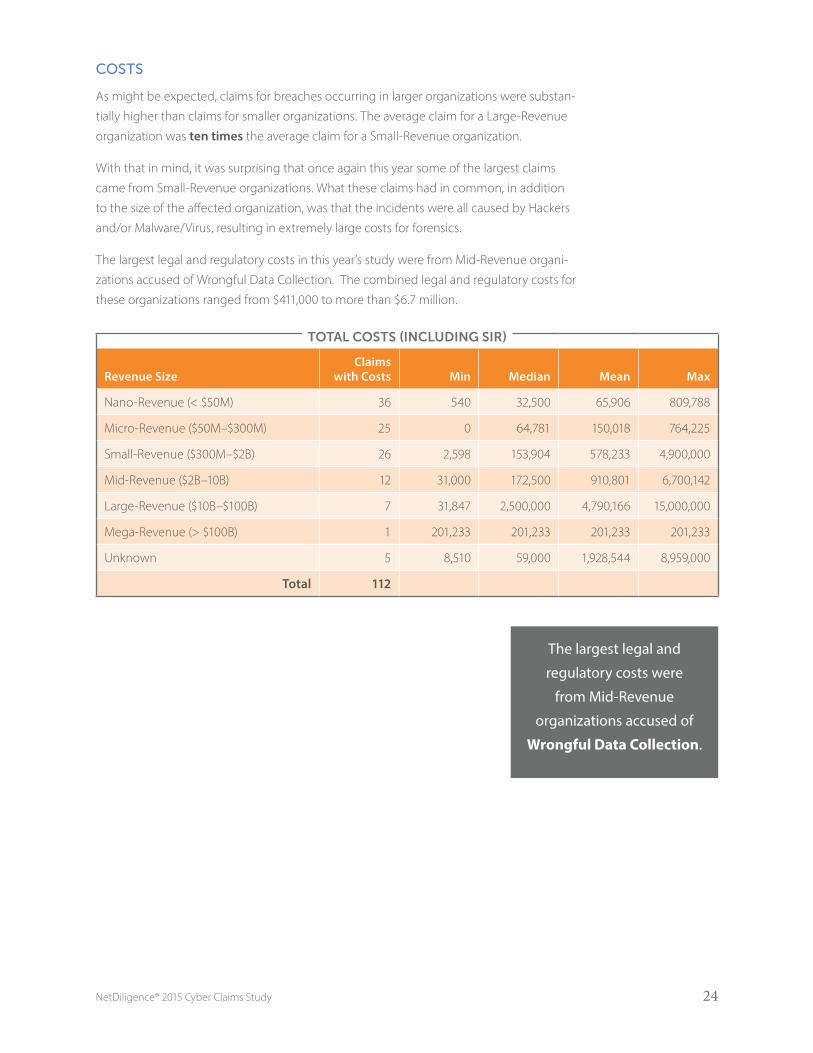
COSTS
As might be expected, claims for breaches occurring in larger organizations were substan-
tially higher than claims for smaller organizations . The average claim for a Large-Revenue
organization was ten times the average claim for a Small-Revenue organization .
With that in mind, it was surprising that once again this year some of the largest claims
came from Small-Revenue organizations . What these claims had in common, in addition
to the size of the affected organization, was that the incidents were all caused by Hackers
and/or Malware/Virus, resulting in extremely large costs for forensics .
The largest legal and regulatory costs in this year’s study were from Mid-Revenue organi-
zations accused of Wrongful Data Collection . The combined legal and regulatory costs for
these organizations ranged from $411,000 to more than $6 .7 million .
TOTAL COSTS (INCLUDING SIR)
Revenue SizeClaims
with Costs Min Median Mean Max
Nano-Revenue (< $50M) 36 540 32,500 65,906 809,788
Micro-Revenue ($50M–$300M) 25 0 64,781 150,018 764,225
Small-Revenue ($300M–$2B) 26 2,598 153,904 578,233 4,900,000
Mid-Revenue ($2B–10B) 12 31,000 172,500 910,801 6,700,142
Large-Revenue ($10B–$100B) 7 31,847 2,500,000 4,790,166 15,000,000
Mega-Revenue (> $100B) 1 201,233 201,233 201,233 201,233
Unknown 5 8,510 59,000 1,928,544 8,959,000
Total 112
The largest legal and
regulatory costs were
from Mid-Revenue
organizations accused of
Wrongful Data Collection.

NetDiligence® 2015 Cyber Claims Study 25
INSIDER INVOLVEMENT
For the second time in our study, we asked insurers to tell us whether there was insider
involvement in the claim events they submitted . Of the 160 events in our dataset, almost
one third (32%) were attributable to insiders . This mirrors, almost exactly, what we found in
last year’s study .
Of the claims attributable to insiders, more than two-thirds (67%) were unintentional,
caused primarily by staff mistakes . The rest were malicious in nature, caused or abetted by
rogue employees .
Insider-related incidents resulted in the exposure of every type of data, and occurred in
almost every business sector . Of note again this year, a disproportionate number of insider
incidents occurred in the Healthcare sector . While only 21% of the claims in our dataset
occurred in Healthcare, that sector accounted for 35% of malicious insider incidents . The
Financial Services sector also has cause to be concerned about insider threats . While only
17% of the claims in our dataset occurred in Financial Services, that sector accounted for
22% of insider incidents .
MALICIOUS(N=17)
UNINTENTIONAL(N=34)
FinancialServices
Healthcare
Technology
All Other SectorsCombined
FinancialServices
Healthcare
Hospitality
ProfessionalServices
Restaurant
All Other SectorsCombined
38%
29%
18%
15%29%
12% 29%
12%
6%
12%
While only 21% of the claims in our
dataset occurred in Healthcare,
that sector accounted for 35%
of malicious insider incidents.

NetDiligence® 2015 Cyber Claims Study 26
Of the 51 claims attributable to insider actions, 36 (71%) reported the number of records
exposed . In a complete reversal of last year’s findings, unintentional disclosure (staff
mistakes) accounted for the overwhelming majority of records exposed .
RECORDS
Insider InvolvementNumber of
Claims Min Median Mean Max
Unintentional 22 1 216 2,414,487 53,000,000
Malicious 14 12 850 17,417 95,000
Total 36
A similar reversal did not occur in terms of costs . Like last year’s study, malicious incidents
tended to result in higher costs .
TOTAL COSTS (INCLUDING SIR)
Insider InvolvementNumber of
Claims Min Median Mean Max
Unintentional 24 0 31,424 72,305 600,000
Malicious 6 8,510 102,224 133,989 447,468
Total 30
NetDiligence® 2015 Cyber Claims Study 27
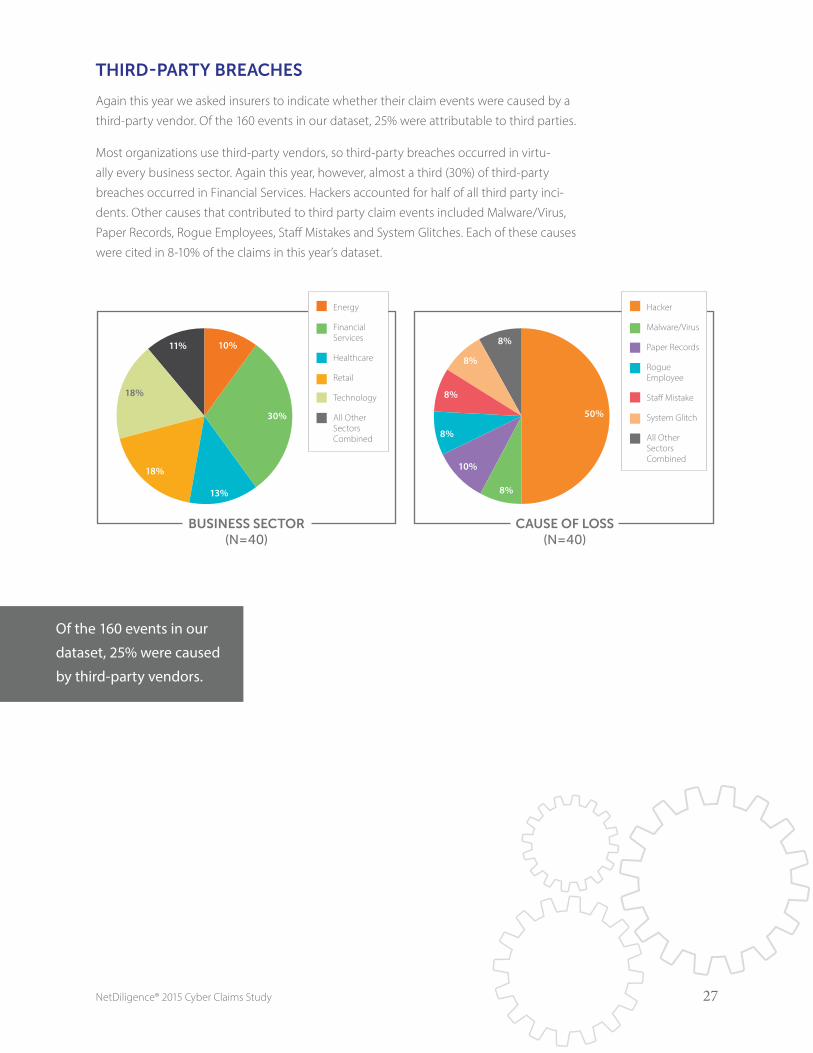
THIRD-PARTY BREACHES
Again this year we asked insurers to indicate whether their claim events were caused by a
third-party vendor . Of the 160 events in our dataset, 25% were attributable to third parties .
Most organizations use third-party vendors, so third-party breaches occurred in virtu-
ally every business sector . Again this year, however, almost a third (30%) of third-party
breaches occurred in Financial Services . Hackers accounted for half of all third party inci-
dents . Other causes that contributed to third party claim events included Malware/Virus,
Paper Records, Rogue Employees, Staff Mistakes and System Glitches . Each of these causes
were cited in 8-10% of the claims in this year’s dataset .
CAUSE OF LOSS(N=40)
BUSINESS SECTOR(N=40)
Energy
FinancialServices
Healthcare
Retail
Technology
All Other SectorsCombined
Hacker
Malware/Virus
Paper Records
Rogue Employee
Sta� Mistake
System Glitch
All Other SectorsCombined
30%
11% 10%
18%
18%
8%
8%
50%
10%
8%
8%
13%
8%
Of the 160 events in our
dataset, 25% were caused
by third-party vendors.

NetDiligence® 2015 Cyber Claims Study 28
It is interesting that the third-party breach events in our dataset exposed significantly
more records than breach events that occurred at the policyholder organization .
RECORDS
Third-Party InvolvementNumber of
Claims Min Median Mean Max
Yes 26 5 1,750 6,274,669 110,000,000
No 78 1 2,475 2,130,461 80,000,000
Total 104
Despite the fact that third-party breach events were larger, payouts for third-party events
were smaller . Overall, payouts for third-party breaches were just a fraction (17% to 26%) of
the payouts for in-house breaches .
TOTAL COSTS (INCLUDING SIR)
Third-Party InvolvementNumber of
Claims Min Median Mean Max
Yes 16 0 30,699 191,990 2,500,000
No 96 0 93,392 754,063 15,000,000
Total 112
NetDiligence® 2015 Cyber Claims Study 29
ABOUT FIRST-PARTY LOSSESMany (if not most) claim events include both first-party and third-party losses . But there
are some incidents that are exclusively first party .
This year, there were six such incidents—two involving business interruption, one theft of
trade secrets and three instances of wrongful data collection .
Both business interruption incidents were caused by Malware/Virus . One incident
occurred in the Healthcare sector and one in Retail . The Healthcare incident resulted in
a 330+ hour systems outage, but no loss of data . The Retail incident was much larger,
exposing more than 50 million records and causing a business outage that lasted
five months .
The incident that involved the theft of trade secrets occurred in the Healthcare sector and
was caused a Rogue Employee .
The three instances of Wrongful Data Collection all resulted in class action lawsuits .
For comparison purposes, below are the exclusively first-party claims payouts included in
prior years’ studies:
In our 2014 study, there were six first-party claims—three involving business
interruption and three involving theft of trade secrets . The business interruption
claims ranged from $1 .5 to $5 million for lost business income, recovery expenses and
legal defense . The claims for theft of trade secrets ranged from $150,000 to $900,000,
primarily for forensics
In our 2013 study, there were five first-party claims submitted: four distributed denial
of service (DDoS) attacks and one malware incident . The costs for these incidents were
pending at the time we conducted our study .
In our 2012 study, there were five first-party claims submitted: two business
interruption incidents, two incidents involving theft of trade secrets and one incident
involving online copyright infringement . Most of the costs for these incidents were
pending at the time we conducted our study; however, one claim had paid out almost
$500,000 for forensics .
Our 2011 study saw ten first-party claims submitted for DDoS attacks, malware
and cyber extortion . The incidents accounted for approximately $1 .22 billion in
lost business income and $23 million in expenses . One incident resulted in fines of
approximately $4 million .
NetDiligence® 2015 Cyber Claims Study 30
CONCLUSIONOur objective for this study is to help risk management professionals and insurance under-
writers understand the true impact of data insecurity by consolidating claims data from
multiple insurers so that the combined pool of claims is sizable enough that it allows us to
ascertain real costs and project future trends .
Despite increasing awareness around cyber security and the increasing frequency of
data breach events, it has been difficult to fully assess the insurance cost (severity) of
these incidents .
While many leading cyber liability insurers are participating in this study, there are many
insurers that have not yet processed enough cyber claims to be able to participate . So our
analysis is a work in progress, but still producing some interesting results .
It is our sincerest hope that each year more and more insurers and brokers will participate
in this study—that they share more claims and more information about each claim—until
it truly represents the cyber liability insurance industry overall . For the benefit of the
industry overall, we encourage all underwriters to participate in next year’s NetDiligence
study . We also hope that each participating insurer shares a larger percentage of their total
cyber claims . If we can expand participation in these two ways, our findings will become
much more meaningful to everyone involved in the cyber insurance market .
NetDiligence® 2015 Cyber Claims Study 31
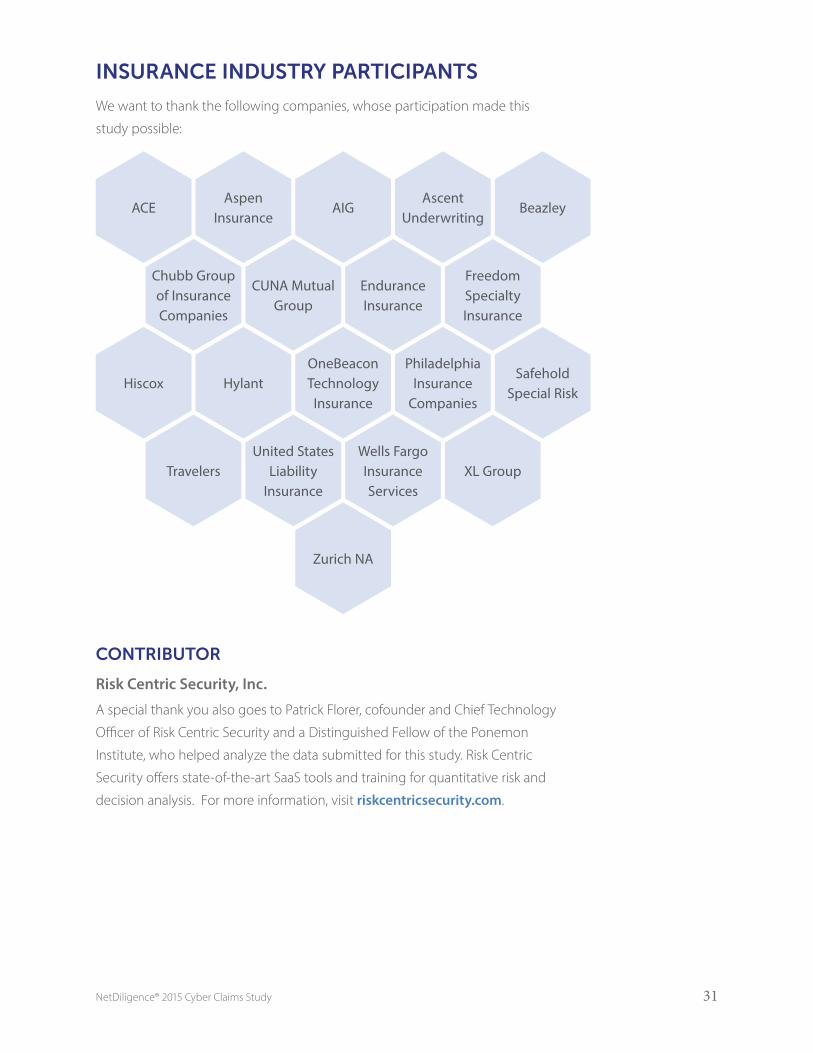
INSURANCE INDUSTRY PARTICIPANTS
We want to thank the following companies, whose participation made this
study possible:
CONTRIBUTOR
Risk Centric Security, Inc.
A special thank you also goes to Patrick Florer, cofounder and Chief Technology
Officer of Risk Centric Security and a Distinguished Fellow of the Ponemon
Institute, who helped analyze the data submitted for this study . Risk Centric
Security offers state-of-the-art SaaS tools and training for quantitative risk and
decision analysis . For more information, visit riskcentricsecurity.com .
ACE
Hiscox
Chubb Group of Insurance Companies
Travelers
Aspen Insurance
Hylant
CUNA Mutual Group
United States Liability
Insurance
AIG
OneBeacon Technology
Insurance
Zurich NA
Endurance Insurance
Wells Fargo Insurance Services
Ascent Underwriting
Philadelphia Insurance
Companies
Freedom Specialty Insurance
XL Group
Beazley
Safehold Special Risk

NetDiligence® 2015 Cyber Claims Study 32
ADDITIONAL INSIGHTS FROM OUR SPONSORS
PLATINUM SPONSOR
This study is a prime example of the power of information-sharing across our industry . This
type of collaboration between businesses and industry leaders results in a more compre-
hensive understanding of the total costs associated with data breach events—and more
effective decision-making both pre-breach and during an incident .
The findings of this year’s study shed light on the challenges businesses face with increas-
ingly destructive and costly breaches . For businesses and industry leaders, this study is
further evidence that navigating today’s cyber threat landscape takes more planning,
training, and foresight than ever .
AllClear ID is the leader in customer security . We provide data breach response services,
advisory services, and response capacity to business that need to notify, support and pro-
tect people affected by a data breach . We have helped thousands of businesses prepare
for, respond to, and recover from data breaches, and have successfully managed three of
the four largest and most complex breach responses in history .
Through this experience, we know what actions truly help save costs during a breach
response . There are 3 important areas to consider for a customer-facing breach response
that, if managed properly, can help save on cost without compromising quality: planning
of the customer-facing response, reserving quality capacity, and putting the customer at
the center of the response .
Planning Your Customer-Facing Response
After years of high-profile data breaches, both customers and the media expect busi-
nesses to be ready to respond to a breach with a well-orchestrated response in a matter
of days . The media may even alert a company about a breach when they call to request a
comment on a story that is going to press in a few hours . If companies are not prepared to
respond, the media and their customers notice . Unfortunately, we find that many busi-
nesses’ customer-facing incident response plans are undefined . This is a huge oversight
when a company’s sales and brand live and die with customers .
To mitigate these risks, choose a proven partner with experience successfully managing a
customer-facing response to design and practice plan that is impactful and cost-effective .
A few important characteristics of your partner should include:
Expertise and success in customer-facing breach preparation and response

NetDiligence® 2015 Cyber Claims Study 33
Proven record of excellent customer service for clients and affected customers
Customer support and call center staff trained in identity theft protection and easing
consumer anxiety
Ensure the partner will not sell customer data
Ensure the partner offers appropriate identity protection for varying levels of risk
AllClear ID specializes in comprehensive planning and effective execution of custom-
er-facing breach responses . We offer a leading breach preparation program to help
companies mobilize a customer response with proven plans, expert operational advice,
and guaranteed response capacity . Our program ensures that if a breach occurs, busi-
nesses are confident and ready to execute an effective response with high-quality
communications that minimize negative impacts to the business .
Reserving Quality Capacity
The scale, complexity, and destruction of breaches today are at levels never seen before,
and the demand for quality response services is exceeding supply . The real test of an inci-
dent response plan comes with a breach: an unpredictable event with an immense and
relentless demand on resources . Even the most robust incident response plan is ineffective
if quality capacity is not available . When a breach response launches, if there are long hold
times on Day 1, that will dominate the conversation with both customers and the media
despite best efforts during planning .
So the most impactful decision a business can make right now is to reserve capacity to
respond to a breach with speed and quality . AllClear ID offers the first and only program to
reserve capacity, ensuring that resources are trained and ready to respond in a guaranteed
timeframe . The focus on scale and quality translates into a great customer experience,
which is reflected in a 97 percent customer satisfaction rating for AllClear ID . In addition,
companies that prepare with AllClear ID get the added benefit of significant cost savings
in the event of a breach .
Put Customers at the Center of the Response
Data breaches cause anxiety for the affected population, so it is important that people
affected feel taken care of in a timely and genuine manner . Their expectations are high,
so clear communication about the incident and the promise to resolve harm is critical .
How you implement identity protection influences customer satisfaction . Customers often
resent being asked to provide their information to a third party to sign up for protection
right after their information has been compromised . The solution is to not require enroll-
ment . Instead, offer automatic access to identity repair with no enrollment required .
Another important consideration is to offer the appropriate protection to match the risk
of the data lost . Often the decision is made to offer credit monitoring without analyzing if
it will truly help the people affected by a breach . Credit monitoring is only helpful if Social
NetDiligence® 2015 Cyber Claims Study 34
Security numbers are lost as it helps monitor for new credit accounts . Credit morning
cannot help with data loss that includes existing credit card accounts or logins and
passwords . The risk in offering credit monitoring as a blanket solution is that customers
will have a false sense of security when it is not an effective remedy . In addition, credit
motoring is the most expensive protection to offer, so defaulting to that as the choice can
be an expensive mistake .
The solutions from AllClear ID put the customer first—no enrollment is required, identity
repair is automatically available to everyone affected, and we help analyze the type of
data lost and determine the appropriate protection to offer . Our guidance helps clients
avoid the blowback and brand tarnish of making rushed decisions that don’t truly help the
people affected .
AllClear ID: The Leader in Data Breach Preparation and Response
Our focus on customer service, combined with our unique ability to provide capacity with
speed and quality, has set the industry standard for data breach response . The AllClear
ID approach always puts your customers first . In our experience, customers can forgive a
breach if the response is handled well . Planning and reserving capacity with AllClear ID are
investments that payoff when you need them most .
About AllClear ID
AllClear ID provides comprehensive breach response services to help businesses protect
their greatest asset: their customers . With over 10 years of experience helping thousands
of businesses prepare, respond, and recover from the most destructive, complex breaches
in history, AllClear ID is recognized for our expertise, partnership, and innovative solutions .
Learn more: www.allclearid.com/business or email [email protected] .

NetDiligence® 2015 Cyber Claims Study 35
SPONSOR
Key considerations to better protect your organization against cyberattacks
RSM is a proud sponsor of the NetDiligence® 2015 Cyber Claims Study . This year’s report
presents a wealth of data that businesses can use to assess the strength of their cyberse-
curity defenses . As organizations engage in this process, we would encourage them to
consider taking the following steps:
Know your strengths and weaknesses. Despite your organization’s industry or size, it
likely possesses information that is valuable to a hacker . Inventory sensitive information
and understand who has access to it, including employees and vendors . Understand the
reputational and financial impacts to your organization if this information was exploited .
Ensure the proper controls are in place to secure sensitive data .
Build security awareness into your organizational culture. Many employees become
unwitting pawns in criminal intrusions of their IT networks when they do something as
innocent and simple as click on a link in an email message that appears to come from an
internal team or outside vendor, and thus activate a malware attack .
Cybercriminals are becoming increasingly crafty in the techniques they use to break
into networks . They may target officials in human resources, purchasing, and other
departments who may be less aware of risks they face from intrusions . Organizations
need to communicate and conduct frequent and recurring educational sessions to alert
employees to the various techniques cybercriminals use and build an awareness of these
risks into their corporate culture .
Make cybersecurity assessment a continuous process. Every time a network changes,
organizations face the possibility of introducing new risks to their systems . Adding a
router, replacing a server, and implementing new software can create vulnerabilities for
cybercriminals to exploit .
Organizations need to understand these vulnerabilities, and perform periodic risk assess-
ments to identify areas of weakness, develop incident response plans, and keep those
plans current by revisiting risk assessments whenever networks change . And when an
incident occurs, organizations should go back and reevaluate why they missed a particular
risk . It is always a continuous learning cycle .
Take control. Implementing the right security controls can help deter hackers and other
criminals, but each type of internal control requires its own focus:
Preventive controls keep incidents from occurring and deter unauthorized access .
Preventive controls seek to secure the perimeter, but with technology such as the cloud
and remote access, organizations must expand controls beyond traditional boundaries .

NetDiligence® 2015 Cyber Claims Study 36
Detective controls help to monitor and alert the organization of malicious and
unauthorized activity . Infiltration is typically the focus of detective controls; however,
these controls can be implemented at any stage in the attack life cycle to increase
data security .
Corrective controls are designed to limit the scope of an incident and mitigate unau-
thorized activity . Many organizations view corrective controls as solely technical, but
they can also be physical, procedural, legal or regulatory in nature .
Large multinational corporations are not the only organizations that cybercriminals have
in their sights . As this study shows, middle market companies and even smaller entities are
increasingly becoming victims of cyberattacks . Reputational and financial impacts can be
worse for smaller companies because many do not have the resources to address security
and privacy issues themselves . However, it is incumbent upon all organizations to make
sure that they have appropriate security controls in place to help protect their valuable
corporate and personal data, and mitigate the chance that they become the next cyberat-
tack headline .
For more information, please contact:
Andy Obuchowski, National Practice Leader—Digital Forensics and Incident Response,
RSM US LLP [email protected], 508 .922 .4770 .
RSM US LLP is the leading provider of audit, tax and consulting services focused on the middle
market, with more than 8,000 people in 80 offices nationwide . It is a licensed CPA firm and the
U .S . member of RSM International, a global network of independent audit, tax and consulting firms
with more than 37,500 people in over 110 countries . RSM uses its deep understanding of the needs
and aspirations of clients to help them succeed . For more information, visit www .rsmus .com .
NetDiligence® 2015 Cyber Claims Study 37
SPONSOR
The NetDiligence 2015 Cyber Claims Study (“Study”), although based on a relatively small
sampling from the insured claims reported, which they estimate to be 5-10% of the total
number of cyber claims handled, illuminates where breaches have occurred, the types
and volume of personal information (data) exposed and the relative expense of breaches
within the target sectors . This information suggests certain “best practices” for insureds to
follow as they consider what is needed to obtain appropriate coverage and minimize the
risk exposure in the event of a breach . These two categories, coverage preparation and
loss mitigation, are the topics companies need to emphasize as they navigate through the
cyber-related business and legal risks confronting them .
The decision to obtain cyber insurance coverage is one that all businesses either have
considered, or will soon be considering . Recently, reported legal cases from different
jurisdictions suggest that the number of cyber breach damage claims, and, more than
likely, lawsuits will increase as: 1) additional courts follow the recent 7th Circuit Court
decision and allow Plaintiffs to establish “standing” where there is an “objectively reason-
able likelihood” that injury will occur to customers who have had their PI stolen; and 2)
insurance carriers continue to scrutinize the conduct of their insured’s actions both pre-
and post-breach, while placing Cyber coverage .
Cyber insurance coverage is best obtained after the applicant has taken appropriate steps
to assess, its own cyber related risks . This assessment is not simply related to its informa-
tion technology or network security . It includes internal processes and procedures to
educate and train personnel and to evaluate third-party risks such as vendor contracts .
The Study identifies that third parties accounted for 25% of the claims submitted and
insiders were involved in 32% of the claims submitted . The assessment should also include
a review and understanding of state and federal regulations that address a company’s
responsibility to preserve and protect information as well as regulations specific to an
industry, e .g . HIPAA .
Once the assessment has been completed and thoroughly evaluated by corporate offi-
cers, recommendations should be presented to the Board of Directors . This will ensure the
involvement of management as well as directors, each of whom will have their own risk
tied to compliance standards for E&O/D&O Policies . From these recommendations should
flow decisions, reduced to an action plan for the implementation of actions to correct
deficiencies in advance of seeking coverage, and if thorough, an incident response plan
that addresses breach response that includes actions to be taken by employees as well as
outside professionals who will be needed immediately to respond to the emergency .
With cyber insurance in place, the insured must remain vigilant in order to meet the
terms and conditions of many cyber policies and to meet what appear to be the evolving
“industry standards” and government regulations for maintaining privacy and protecting

NetDiligence® 2015 Cyber Claims Study 38
against cyber breaches . This means that all businesses, not simply those in the high breach
sectors identified by the Study such as health care, financial services or retail, must deploy
appropriate and compliant data protection measures .
Such vigilance will place the insured in the best position in the event a breach results in
regulatory claims or litigation . Traditional elements of tort liability will require failure on the
part of the insured to satisfy standards, i .e . the legal breach of duty . Absent a strict liability
standard, the vigilant insured provides not only protection to the officers and directors but
also the foundation its attorneys will need to mount an aggressive defense .
An additional and related observation that supports the need for vigilance is that, as
with other potentially large legal liability occurrences, the passing of time allows the
plaintiffs’ bar to develop new and “creative” theories of liability that may find acceptance
in one or more Courts . Once these “friendly” Courts are identified, the likelihood of more
litigation increases .
Two final observations from the Study pertain to the education and professional service
markets . In contrast to the 2014 Study, where education represented 5% of the reported
claims, 2015 had no measurable sample . It will not be surprising for this sector to return
to one of the measurable sectors as breach numbers increase . University systems store
not only PI, but increasingly PHI, and both student and family PCI . An additional target
for hackers might include intellectual property from funded research projects . For this
reason, university systems can be high-value targets and need to be hyper-vigilant and
properly insured .
Similarly, law firms store multiple types of protected data including PII, PCI and
PHI of employees, and depending on the nature of the firms’ practice areas, e .g
medical-malpractice, securities, or financial services, data from clients and often adver-
saries . Increasingly at risk is intellectual property data and privileged information on M&A
and public securities transactions .
Cipriani & Werner, P .C . delivers an end-to-end, integrated approach to its clients’ privacy and data
security needs . Clients of this Mid-Atlantic litigation defense firm benefit from our team of pro-
fessionals that includes experienced litigators, leaders in crisis communications, forensic IT assess-
ment and mitigation, regulatory compliance and government relations offering services including
corporate and IT audits and risk assessments, development of breach response plans, our breach
response team and litigation defense . Our clients appreciate the simplicity and certainty of having
a single point of contact with a trusted team that has served the insurance industry for more than
three decades . For more information, visit www.c-wlaw.com .
NetDiligence® 2015 Cyber Claims Study 39
SPONSOR
When analyzing the data presented here, much of it aligns with data from Symantec’s
Internet Security Threat Report, where a majority of the attacks are leveraged against
smaller organizations .
Why smaller organizations? These organizations tend to be operating with the tightest
budget for security and staff, they have business connections to larger companies through
partnerships and products, and the data they are storing and transmitting is still very
useful to nefarious individuals . Collectively, these smaller, often times less noticeable, initial
attacks will cause multiple other incidents and claims .
It’s a domino effect . A piece of information we need to analyze and collect data on is just
how far does one attack against a nano company migrate into the industry around it?
Could 10 of the breaches mentioned in this report all be the cause of a single attacker?
Could they have been a daisy chained attack where the nano was the original incursion
meant to get to the largest corporation?
Symantec has the largest commercial security intelligence database in the world . By
working to understand not just the attacks and damage caused, but also who the attacker
is, what their motives are, and if the attack is part of a larger campaign; deeper insight is
provided into the methodology behind the chosen tactics . After being breached, the
most important questions are where the attacker might be next, and how to stop them
before they do further damage .
We use this data today to help our customers be predicative rather than reactive with the
goal of preventing a successful attack before it starts . This forward looking intelligence is
what the insurance markets need to get the appropriate level of visibility into what they
are insuring, what the risk to a customer will be both at the time a policy is designed as
well as throughout the life cycle of the policy . How much value would be recognized if
a single attack at one insured was identified as an attack that was about to hit your other
insured and as a result you could notify them, protect them and prevent the breach?
There has been a major rise in attacks against healthcare, higher education and financial
services where a simple malware or virus attack has been stage one of a much more
sophisticated attack . As a result, the study data shows that the cost for these types of
events is growing year-on-year . It’s critical that as an industry we move to find better
ways to not only protect customers, but to respond by providing key capabilities to both
insurers and their clients to provide a reduction in costs for forensics and improve capa-
bilities that reduce overall time to containment and eradication . Without focusing on this
need we expect to see the number of cyber insurance policies rise, but with significantly
higher risk to the insurer making it difficult to be competitive and profitable . This will ulti-
mately lead to an insurance practice that has fewer players, less coverage and premiums
that will make customers reconsider the purchase .
NetDiligence® 2015 Cyber Claims Study 40
To effectively move forward and drive improvement, partnerships must exist that share
intelligence, solutions, and act in the best interest of the client . Cross industry teams and
task forces that are taking data from studies such as this and developing from that models
that define industry wide changes . When automobiles are proven unsafe, insurers have
stepped in to force the companies to make them safer . Same with other consumer prod-
ucts, this should be no different in the information security world .
At Symantec, we’re working to improve the baseline of how organizations of all sizes
and verticals approach cyber security . The new normal should be a truly holistic model,
which addresses every step of the attack chain, from reconnaissance to exfiltration, to
make prevention and response more robust than ever . Stronger organizations will lead
to stronger, more mutually beneficial, relationships between the insurers, insured, and
security industry .
Symantec Corporation is an information security expert that helps people, businesses, and govern-
ments seeking the freedom to unlock the opportunities technology brings—anytime, anywhere .
Founded in April 1982, Symantec, a Fortune 500 company, operates the largest commercial global
data intelligence network, and provides leading incident response and security solutions .
Symantec™ Cyber Security Services: Global Incident Response delivers both proactive and reactive
services including Incident/Forensic Response and readiness services such as Incident Response
Plan Assessments, Tabletop Exercises, Training, and Advanced Threat Hunting to help our customers
build and refine their incident response plans and turn them into proactive programs . For more
information, visit www.symantec.com .
NetDiligence® 2015 Cyber Claims Study 41
NETDILIGENCE® FEATURED IN 2015 DATA BREACH INVESTIGATION REPORT (DBIR)
INSIGHTS FROM VERIZON RISK TEAM
For the past eight years, Verizon—with contributions from an ever-growing list of part-
ners—has put together its annual Data Breach Investigations Report . The report collects,
aggregates and analyzes data from organizations all over the world, including law
enforcement agencies, governments and private companies . This year’s report was able
to bring together data from 70 different organizations to describe the threat landscape of
data breaches and research what is happening both before and beyond data breaches .
NetDiligence was one of those 70 organizations and was able to partner with Verizon to
research the impact of data breaches .
The cybersecurity landscape is complex and there is no one take-away that the research
can suggest, however there are quite a few insights that we were able to cover this year
and a few key trends . For example, attackers target and seek out valid credentials (user-
names and passwords) in about 3 out of every 4 system-level attacks . Whether they are
brute-forcing the passwords (repetitively trying to guess a password), or if they are setting
up a fake website to trick users into divulging their password, it’s clear that credentials are
a common thread across multiple motivated breaches .
PATCH QUICK AND PATCH WIDE
With contributions from partners, we were able to look at how vulnerabilities are being
exploited by attackers . There were two key findings . First, most of the actively exploited
vulnerabilities were exploited more than a year after being published publicly . In fact,
about 95% of all of the CVEs (Common Vulnerabilities and Exposures) were published
more than a year before we observed the exploitation in 2014 . Secondly, there is a need
for speed when it comes to applying patches: about half of the vulnerabilities exploited
in the first year were exploited in the first month . This means that when it comes to
patching, organizations need to focus on the critical patches quickly, and then focus on
getting wide patch coverage into even the darkest corners of their network .
MOBILE IS NOT A PREFERRED VECTOR FOR ATTACKERS
We have been watching and waiting for mobile devices to show up in our breach data
for years . But, rather than continue to wait, this year we went out seeking to understand
just how mobile devices play into the threat landscape . We partnered with Verizon
Wireless to analyze data collected for millions of mobile devices and the security events
recorded for the last half of 2014 . First we found that Android devices dominated the
charts for frequency of events and was averaging around 20-thousand events per week
across the millions of customers . We then dug deeper and found these events were
driven by simple and annoying malware (adware, click-fraud, etc) . Once we stripped
away the simple malware, we were left with just under a hundred events per week across
the millions of devices on the network . Our conclusion is not that we can ignore mobile
NetDiligence® 2015 Cyber Claims Study 42
devices, but when we look at these results in combination with our other breach data, it’s
clear that mobile platforms are not currently a preferred vector of attack for the current
batch of threat actors . Mobile devices are certainly vulnerable, but just not actively being
exploited . This gives defenders an opportunity to prepare for if and when the threats shift .
IT’S NOT ABOUT THE COST PER RECORD
With the help of NetDiligence, we were able to evaluate the prevailing method for esti-
mating the impact from data breaches: the average cost per record . What we found is
the cost per record is not constant and is inversely related to the number of records . That
means small breaches could have costs that skyrocket into tens of thousands of dollars
per record, while very large breaches (millions of records) will have their cost per record
drop down to just pennies per record . Therefore, any simple cost per record estimate will
greatly underestimate the costs of small breaches and grossly overstate the losses from
larger breaches .
With the cost per record myth busted, we set out to find a replacement . Using the data
collected by NetDiligence, we evaluated multiple variables associated with breaches . Do
external attackers cause more damage than internal employees? Is a system compromise
worse than a lost laptop? Do large companies have different impact from smaller compa-
nies? The answers to these questions surprised us . When we also tracked the number
of records lost, there were no variables that showed a significant difference in losses . For
example, large organizations had financial losses greater than small organizations, but
they also lost more records . When we looked at the organizational by number of records,
the size did not help the model at all . That story repeated itself over all of the variables
we looked at .
We developed a new model that included the number of records as the key predictive
variable . Using this approach, we found a non-linear relationship between loss and the
number of records . The costs in small breaches increase rapidly and then losses slow
down as the number of records increase . This again shows that any cost per record (which
is a linear approach) model is going to be misleading . Even though the new model per-
formed better than a cost per record approach, we evaluated just how good the model
was . Turns out, a model that uses the number of records is just an “okay” model . Having
more non-technical details around the event may help improve the model .
FORENSIC COSTS ARE HARDER TO PREDICT
When we looked at the cost of a breach, we looked at the total cost, but with NetDiligence
data, we could break down the individual cost areas within a breach . For example, could
we create a model to look at forensic costs? If we run through the same range of variables
in our previous work, we again find that number of records is the strongest contributor—
larger breaches have higher forensics costs . Except, we get a much weaker signal from
the number of records and a wide amount of variance in the forensic costs that we cannot
explain with the breach data alone . This indicates that there are other variables contrib-
uting forensic costs that we are not currently collecting . Perhaps if we knew how many

NetDiligence® 2015 Cyber Claims Study 43
systems were involved in the forensic analysis, or perhaps if we could measure “dwell time”
(the amount of time an attacker has access), that may help create a better model . But
without collecting and analyzing the data, the best we can say about forensic costs is that
the number of records only helps explain a fraction of the costs .
NetDiligence® 2015 Cyber Claims Study 44
ABOUT NETDILIGENCE®
NetDiligence® (www.netdiligence.com) is a Cyber Risk Assessment and Data Breach
Services company .
Since 2001, NetDiligence has conducted thousands of enterprise-level QuietAudit® Cyber Risk Assessments for a broad variety of corporate and public entity clients . Our
time-tested risk management approach (eliminate, mitigate, accept and cede residual risk)
enables us to effectively help organizations of all types and sizes manage their cyber risk .
NetDiligence is also an acknowledged leader in data and privacy breach prevention and
recovery . Our eRiskHub® portal (www.eriskhub.com) is licensed by more than 50 cyber
liability insurers to provide ongoing education and breach recovery services to their cli-
ents . NetDiligence technical experts assist many of these insurers with cyber liability claims
investigations .
With cyber risks growing daily, many organizations don’t know where they’re most
vulnerable; who has access to their data; whether their network security measures meet
legal standards for prudent and reasonable safeguards . NetDiligence can help answer
these critical questions . Our QuietAudit® Cyber Risk Assessments document the organi-
zation’s Risk Profile, so they know where their exposures are and can take the appropriate
actions to mitigate them .
NetDiligence’s QuietAudit Cyber Risk Assessments give organizations a 360 degree view of
their people, processes and technology, so they can:
Reaffirm that reasonable practices are in place
Harden and improve their data security
Qualify for network liability and privacy insurance
Bolster their defense posture in the event of class action lawsuits
NetDiligence stores the assessment results online, so it’s easy for organizations to
re-evaluate their risk posture regularly and monitor changes over time .
NetDiligence® 2015 Cyber Claims Study 45
NetDiligence offers a variety of QuietAudit Cyber Risk Assessments that are tailored to
meet the unique needs of small, medium and large organizations in a variety of business
sectors, including:
Cyber Health CheckNetDiligence assesses the organization’s data security strengths and weaknesses,
including data security “scores” for each key practice area . NetDiligence’s Executive
Summary report of its findings includes actionable recommendations to improve the
organization’s overall cyber risk posture .
Cyber Health Check for Healthcare ProvidersNetDiligence conducts its Cyber Health Check assessment of the healthcare provider’s
data security strengths and weaknesses with a special focus on the data security
standards mandated by HIPAA/HITECH .
Cyber Health Check for RetailersNetDiligence conducts its Cyber Health Check assessment of the retailer’s data
security strengths and weaknesses with a special focus on PCI gaps and Point-of-Sale
(POS) security .
CFO Cyber Risk AssessmentIn addition to conducting a thorough and comprehensive Cyber Health Check
assessment, NetDiligence performs a network vulnerability scanning service to test
the effectiveness of firewalls and web servers and identify 6000+ vulnerabilities
that hackers can exploit, including unpatched, non-hardened or misconfigured
externally-facing network servers and devices .
The eRiskHub® is a licensed service that positions insurers and brokers to effectively assist
clients with loss control . The eRiskHub cyber risk management web portal provides
general information about sound security practices before a breach occurs, and facilitates
appropriate reporting and recovery efforts after a breach . It provides tools and resources
to help clients understand their exposures, establish response plans and minimize the
effects of a breach on their organizations .
More than 50 insurers in global cyber liability insurance market license the eRiskHub
portal to provide their clients with information and a suite of technical resources that
can assist them in the prevention of IT and cyber losses and support them in the timely
reporting and recovery of losses once an incident occurs .
Key Features of the eRiskHub Portal
Incident Roadmap—includes suggested steps to take following a network or data
breach incident, free consultation with a Breach Coach® and access to the insurer’s
preferred breach response team

NetDiligence® 2015 Cyber Claims Study 46
News Center—cyber risk stories, security and compliance blogs, security news, risk
management events and helpful industry links
Learning Center—best-practices articles, white papers and webinars from leading
technical and legal practitioners
Risk Manager Tools—tools to help organizations manage their cyber risk including free
online self-assessment tools (excerpted from NetDiligence’s QuietAudit system), recap
of state breach notification laws, vendor management tools, downloadable policy
templates and much more .
eRisk Resources—a directory of third-party vendors with expertise in pre- and
post-breach disciplines
When a breach event occurs, time is of the essence . With a good response plan in place
and access to highly skilled third-party resources, a victimized organization can more
efficiently and cost-effectively respond to and recover from a data breach .
The eRiskHub portal is an effective way for insurers and brokers to help their clients
combat cyber losses with minimal, controlled and predictable costs .
CONTACT US
For more information about NetDiligence or any of our service offerings, please email us at
[email protected] or call us at 610 .525 .6383 .