2015 earnings presentation
TRANSCRIPT

2015 Earnings Presentation
Ana Botín, Group Executive Chairman
José Antonio Álvarez, Group CEO
January 27th, 2016

1 1
Important information
Banco Santander, S.A. ("Santander") cautions that this presentation contains forward-looking statements. These forward-looking statements are found in various places throughout this presentation and include, without limitation, statements concerning our future business development and economic performance. While these forward-looking statements represent our judgment and future expectations concerning the development of our business, a number of risks, uncertainties and other important factors could cause actual developments and results to differ materially from our expectations. These factors include, but are not limited to: (1) general market, macro-economic, governmental and regulatory trends; (2) movements in local and international securities markets, currency exchange rates and interest rates; (3) competitive pressures; (4) technological developments; and (5) changes in the financial position or credit worthiness of our customers, obligors and counterparties. The risk factors that we have indicated in our past and future filings and reports, including those with the Securities and Exchange Commission of the United States of America (the “SEC”) could adversely affect our business and financial performance. Other unknown or unpredictable factors could cause actual results to differ materially from those in the forward-looking statements.
Forward-looking statements speak only as of the date on which they are made and are based on the knowledge, information available and views taken on the date on which they are made; such knowledge, information and views may change at any time. Santander does not undertake any obligation to update or revise any forward-looking statement, whether as a result of new information, future events or otherwise.
The information contained in this presentation is subject to, and must be read in conjunction with, all other publicly available information, including, where relevant any fuller disclosure document published by Santander. Any person at any time acquiring securities must do so only on the basis of such person's own judgment as to the merits or the suitability of the securities for its purpose and only on such information as is contained in such public information having taken all such professional or other advice as it considers necessary or appropriate in the circumstances and not in reliance on the information contained in the presentation. In making this presentation available, Santander gives no advice and makes no recommendation to buy, sell or otherwise deal in shares in Santander or in any other securities or investments whatsoever.
Neither this presentation nor any of the information contained therein constitutes an offer to sell or the solicitation of an offer to buy any securities. No offering of securities shall be made in the United States except pursuant to registration under the U.S. Securities Act of 1933, as amended, or an exemption therefrom. Nothing contained in this presentation is intended to constitute an invitation or inducement to engage in investment activity for the purposes of the prohibition on financial promotion in the U.K. Financial Services and Markets Act 2000.
Note: Statements as to historical performance or financial accretion are not intended to mean that future performance, share price or future earnings (including earnings per share) for any period will necessarily match or exceed those of any prior year. Nothing in this presentation should be construed as a profit forecast.
The businesses included in each of our geographic segments and the accounting principles under which their results are presented here may differ from the included businesses and local applicable accounting principles of our public subsidiaries in such geographies. Accordingly, the results of operations and trends shown for our geographic segments my differ materially from those of such subsidiaries.
2
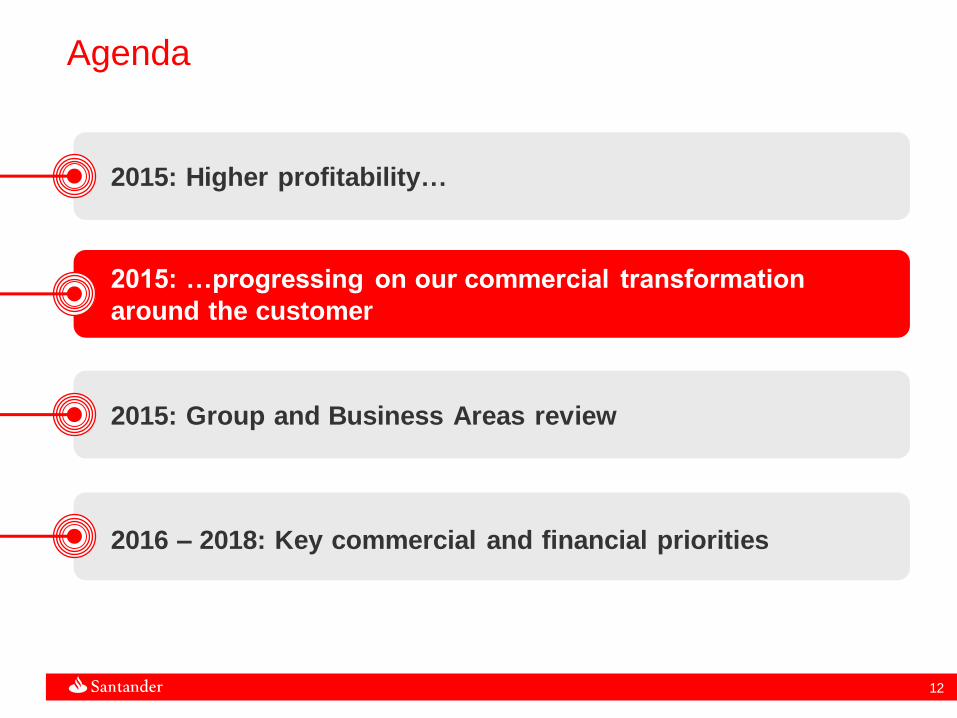
Agenda
2015: Higher profitability…
2016 – 2018: Key commercial and financial priorities
2015: …progressing on our commercial transformation
around the customer
2015: Group and Business Areas review
3
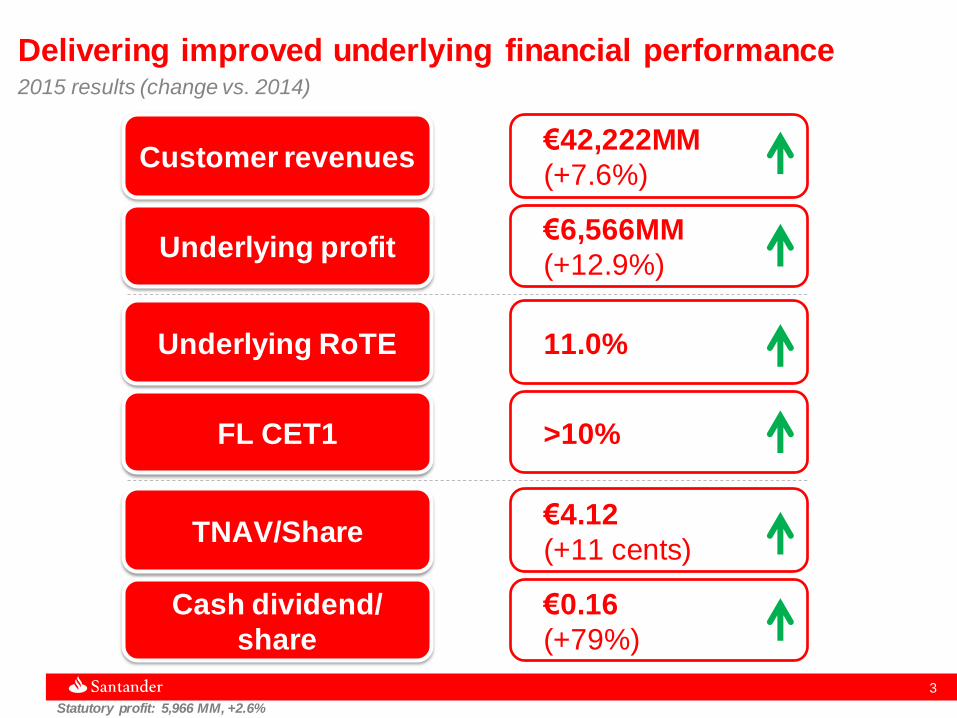
Delivering improved underlying financial performance 2015 results (change vs. 2014)
€42,222MM
(+7.6%) Customer revenues
Underlying profit €6,566MM
(+12.9%)
11.0% Underlying RoTE
FL CET1 >10%
€4.12
(+11 cents) TNAV/Share
Cash dividend/
share
€0.16
(+79%)
Statutory profit: 5,966 MM, +2.6%

4
Increasing underlying profit by c.13%
MM Euro 2014 2015 ABS. %
Net interest income 29,548 32,189 2,642 8.9
Net fees 9,696 10,033 337 3.5
Total customer revenues 39,244 42,222 2,978 7.6
ROF and other 3,369 3,051 -318 -9.5
Gross Income 42,612 45,272 2,660 6.2
Operating expenses -20,038 -21,571 -1,532 7.6
Operating Income 22,574 23,702 1,128 5.0
Net loan loss provisions -10,562 -10,108 454 -4.3
Underlying PBT 9,720 10,939 1,219 12,5
Underlying profit 5,816 6,566 750 12.9
Statutory profit: 5,966 MM, +2.6%

5
Customer business volumes, EUR Bn
Customer business growth combined with improving risk
profile
2014 2015
+6.4%
757 805
2015 2014
2014
721
2015
+7.5%
775
Loans1 Deposits + Mutual funds1
NPL Cost of Risk
1.43
-18bps
1.25 5.19 -83bps
4.36
Key ratios, %
(1) Loans and Deposits excluding repos. Constant euros
2014 2015
6
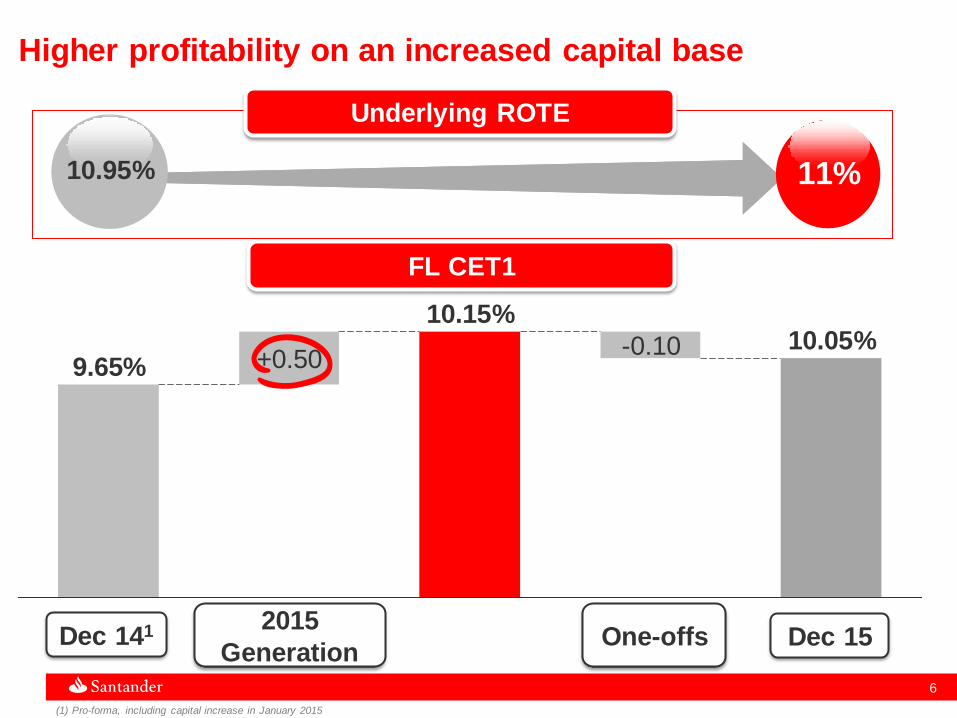
11%
Higher profitability on an increased capital base
10.95%
10.05% 9.65% +0.50
10.15%
-0.10
Dec 141 2015
Generation Dec 15 One-offs
FL CET1
Underlying ROTE
(1) Pro-forma, including capital increase in January 2015
7
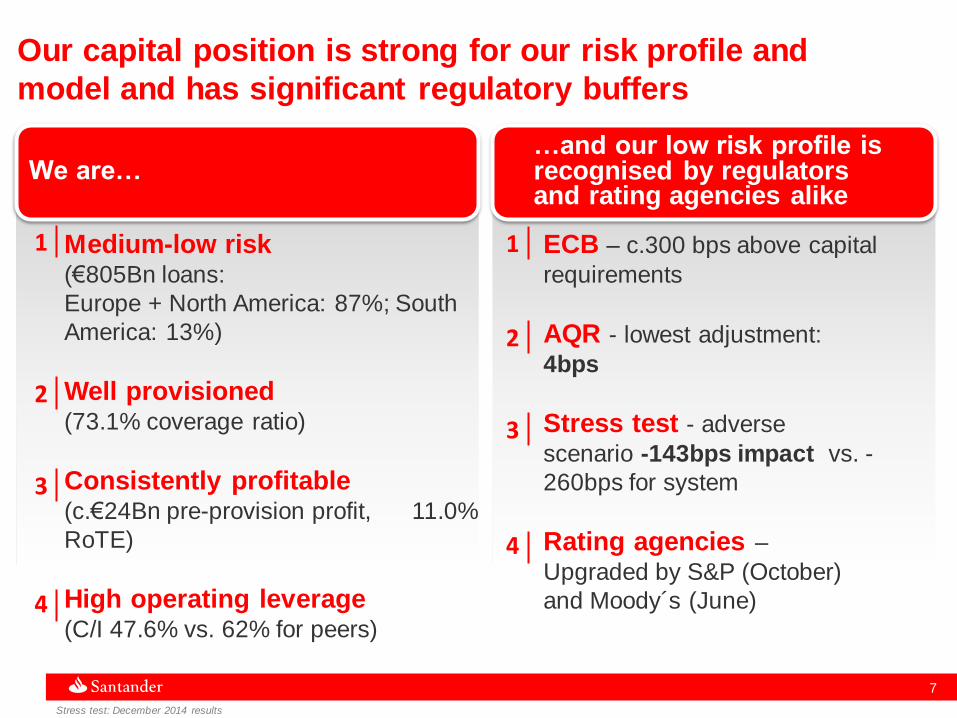
Our capital position is strong for our risk profile and
model and has significant regulatory buffers
We are… …and our low risk profile is recognised by regulators and rating agencies alike
Medium-low risk (€805Bn loans:
Europe + North America: 87%; South
America: 13%)
Well provisioned (73.1% coverage ratio)
Consistently profitable (c.€24Bn pre-provision profit, 11.0%
RoTE)
High operating leverage (C/I 47.6% vs. 62% for peers)
ECB – c.300 bps above capital
requirements
AQR - lowest adjustment:
4bps
Stress test - adverse
scenario -143bps impact vs. -
260bps for system
Rating agencies –
Upgraded by S&P (October)
and Moody´s (June)
1
2
3
4
4
3
2
1
Stress test: December 2014 results
8
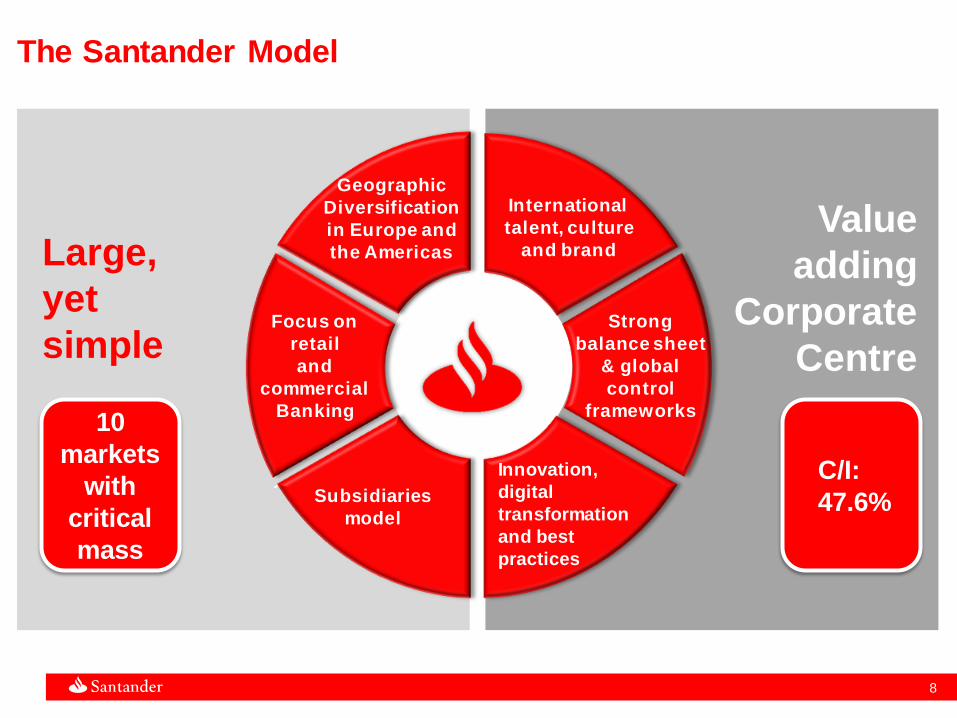
The Santander Model
Large,
yet
simple
Value
adding
Corporate
Centre
Geographic
Diversification
in Europe and
the Americas
Focus on
retail
and
commercial
Banking
Subsidiaries
model
Innovation,
digital
transformation
and best
practices
International
talent, culture
and brand
Strong
balance sheet
& global
control
frameworks 10
markets
with
critical
mass
▪ C/I:
47.6%

9
10 markets with critical mass in Europe and the Americas allow us to deliver profits and dividends through the cycle
(1) Excluding Corporate Centre and Spain Real State activities
Risk advantage
High
diversification,
advanced systems
Higher
capacity to
invest
Quality of
services, cost
advantage, digital
transformation
Consistent
profitability
and capital
generation
Funding B/S
growth, dividends
and value creation
Cost advantage
C/I advantage,
value adding
corporate centre
The value of the Group % of underlying Group attributable profit1
Rest America
2%
Rest Europe
1%
Argentina
4% Chile
5%
Brazil 19%
Mexico 7%
US
8%
Portugal
4%
Poland
4% SCF
11%
Spain 12%
UK
23%
North America
South America
Europe
Commercial
advantage
Network banking,
digital investments,
global businesses,
brand
10
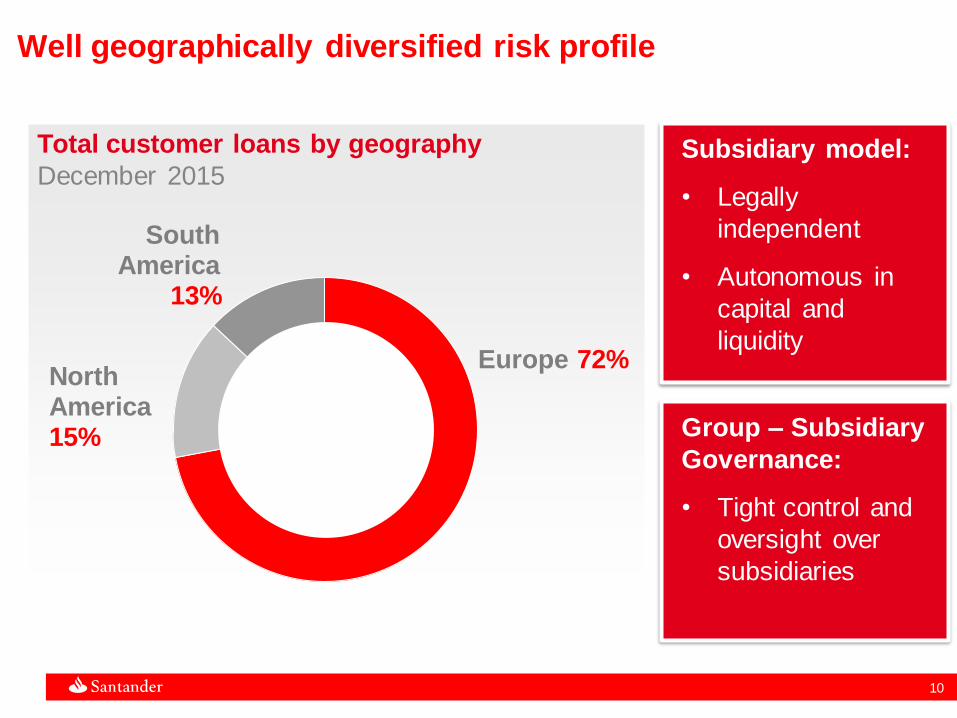
Well geographically diversified risk profile
North America 15%
South America
13%
Europe 72%
Total customer loans by geography
December 2015 Subsidiary model:
• Legally
independent
• Autonomous in
capital and
liquidity
Group – Subsidiary
Governance:
• Tight control and
oversight over
subsidiaries
11
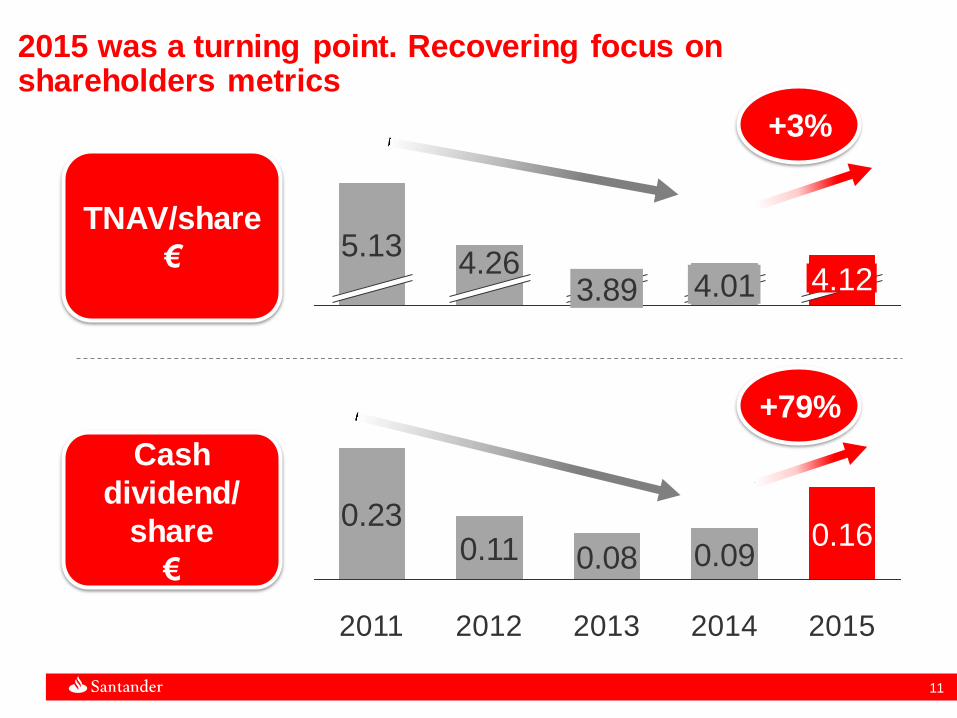
2015 was a turning point. Recovering focus on shareholders metrics
TNAV/share
€ 4.01 3.89
4.26 5.13
Cash
dividend/
share
€
2014 2013
0.09 0.16
2015
0.11
2011
0.23
0.08
2012
4.12
+3%
+79%
12
Agenda
2015: Higher profitability…
2016 – 2018: Key commercial and financial priorities
2015: …progressing on our commercial transformation
around the customer
2015: Group and Business Areas review

13
In 2015 we have made significant progress on our strategic plan and delivered on all commitments
People
Customers
Shareholders
Communities
Survey Results: c.5pp
2015 People supported: 1.2MM
Loyal customers: 10%
Digital customers: 17%
C/I: 47.6%
Reinforced Boards at Group and
subsidiaries
Corporate Centre -3pp in C/I
ROTE 11.0%
FL CET1 >10%
5 countries Top 3 in
CSAT1
(1) Customer satisfaction (CSAT)
14
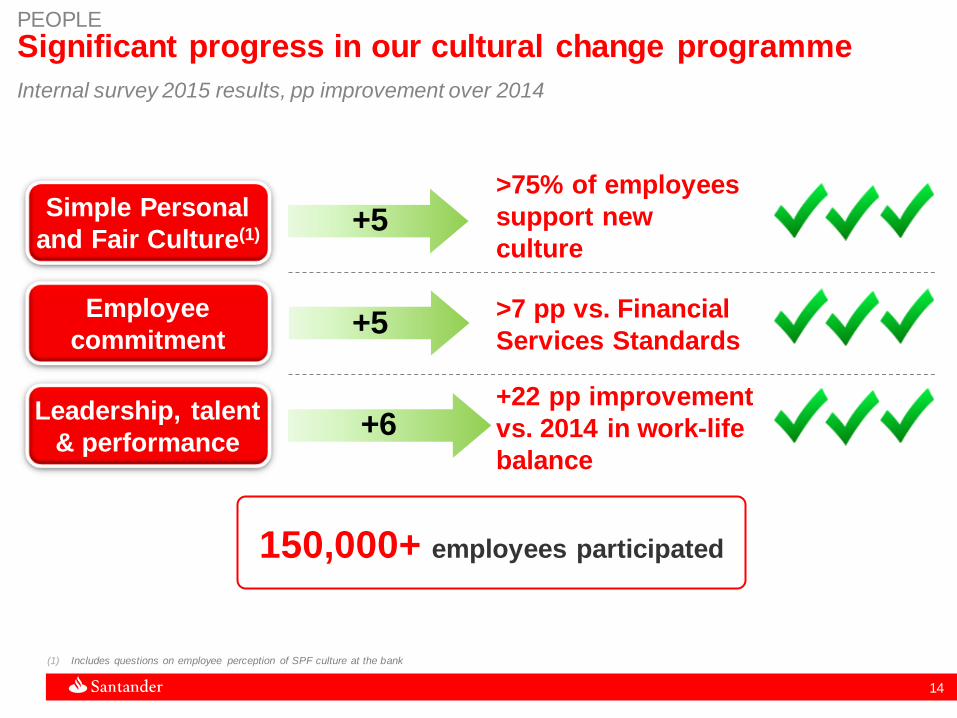
Significant progress in our cultural change programme
Internal survey 2015 results, pp improvement over 2014
(1) Includes questions on employee perception of SPF culture at the bank
PEOPLE
150,000+ employees participated
+5
>7 pp vs. Financial
Services Standards
+22 pp improvement
vs. 2014 in work-life
balance
+5
+6
>75% of employees
support new
culture
Simple Personal
and Fair Culture(1)
Employee
commitment
Leadership, talent
& performance

15
Loyal customer base increased, driving top line growth
Loyal customers, MM
2014
12.6 1.0
11.6
10%
Retail
Corporates
2015
13.8
12.7
1.1
Retail and SMEs loyal
customers are x4 more
profitable and corporates x5
(1) Bank ing NIM: Annualized net interest income /average customer loans
Loyal customer base increased…
CUSTOMERS
Example: UK
… driving top line and franchise value
growth
Retail loyal customers
(MM)
Retail current account balances
(£Bn)
Banking NIM1 (%)
3.7
2.2
15.8
53.2
2015 2012
1.83 1.36
+66%
+237%
+47bps
16
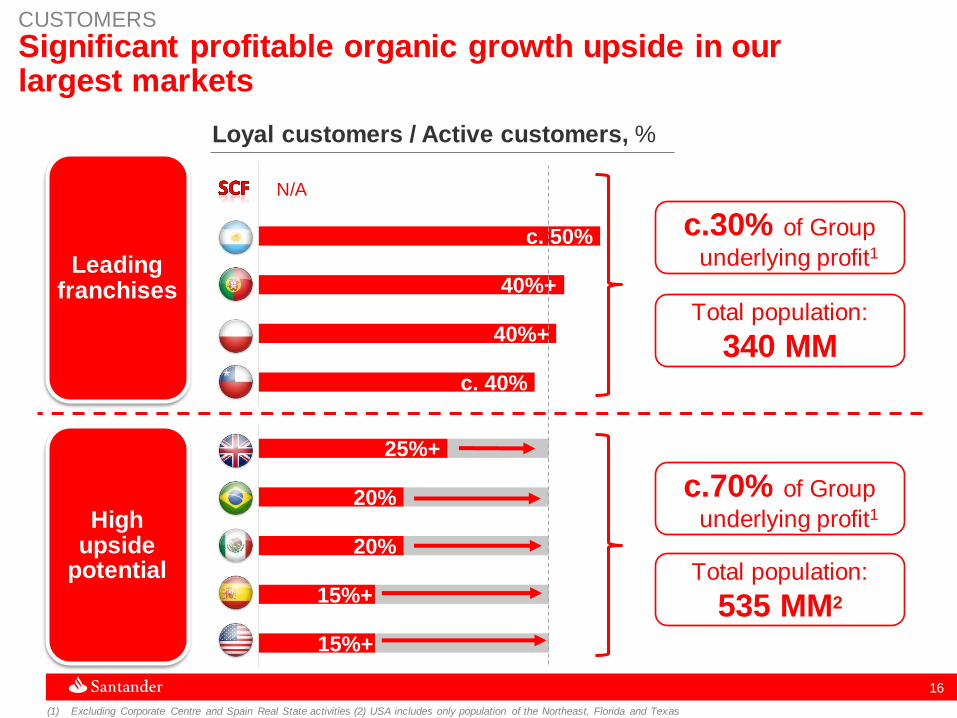
c. 40%
40%+
40%+
c. 50%
Chi
Pol
Por
ARG
SCF
15%+
15%+
20%
20%
25%+
US
SPA
MEX
BRA
UK
Significant profitable organic growth upside in our largest markets
Leading franchises
Loyal customers / Active customers, %
c.30% of Group
underlying profit1
Total population:
340 MM
c.70% of Group
underlying profit1
Total population:
535 MM2
(1) Excluding Corporate Centre and Spain Real State activities (2) USA includes only population of the Northeast, Florida and Texas
N/A
CUSTOMERS
High upside
potential

17
Implementing effective digital solutions driving improved customer experience
UK Spain Poland
(1) Person or legal entity, that being a customer of a commercial bank, has logged into his personal area of internet bank ing, mobile bank ing or both in the last 30 days
(2) Applicable to Santander existing customers, opened every weekday minute on digital channels
1 out of every 3 new
accounts are opened
via our digital channels
Mobile cash loan in
60 seconds
Cuenta 1|2|3
One 1|2|3 account
opened every minute
on digital channels2
+2.5MM
16.6 14.1
CUSTOMERS
Digital
customers1 Total Group
(MM)
2014 2015
18
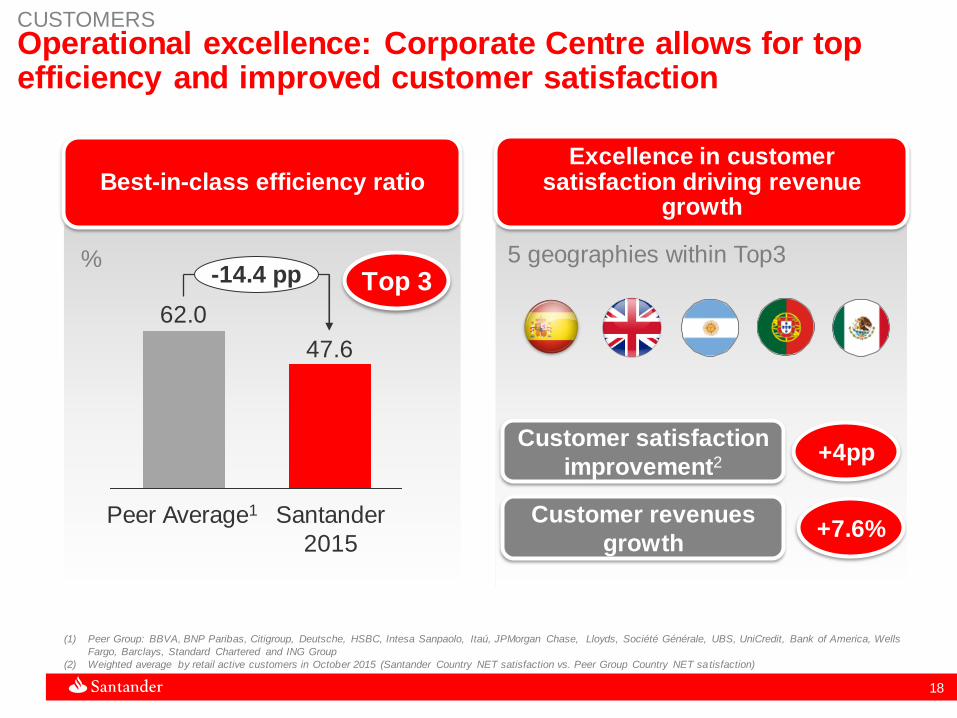
Excellence in customer satisfaction driving revenue
growth
Operational excellence: Corporate Centre allows for top efficiency and improved customer satisfaction
Best-in-class efficiency ratio
(1) Peer Group: BBVA, BNP Paribas, Citigroup, Deutsche, HSBC, Intesa Sanpaolo, Itaú, JPMorgan Chase, Lloyds, Société Générale, UBS, UniCredit, Bank of America, Wells
Fargo, Barclays, Standard Chartered and ING Group
(2) Weighted average by retail active customers in October 2015 (Santander Country NET satisfaction vs. Peer Group Country NET satisfaction)
5 geographies within Top3
CUSTOMERS
+7.6%
Customer satisfaction
improvement2 +4pp
Santander
2015
62.0
47.6
Peer Average1
-14.4 pp
Customer revenues
growth
Top 3 %

19
Simplified, value adding Corporate Centre
… while continuing to add value to the subsidiaries through synergies
✔ IT development &
infrastructure
✔Global procurement
✔Global operations
✔Global digital projects
✔Collaboration
revenues
✔International business
-3 pp in C/I for the Group
Increased transparency on divisional costs…
39
29 25
23
Corporate Centre attributable loss /
Underlying attributable profit (%)
Under new criteria
Before
(1H 2015) 1H 2015
2015
Target
(1) Societe Generale, BBVA, BNP, Intesa, Unicredit, Credit Agricole
Peer1
average
35
SHAREHOLDERS
Revenue
Synergies
Cost
Synergies
2015
Real
Top 3 C/I: 47.6%

20
• 33% women
• >50% Independent Directors
• 335 yearly hours per director (x3 vs. peers)1
Corporate Governance and team strengthened SHAREHOLDERS
(1) 2014 data, Benchmark: Bank of America, Goldman Sachs, JP Morgan, Citigroup, Morgan Stanley, Wells Fargo, Societe Generale, BNP Paribas, BBVA, Credit Suisse, Deutsche Bank,
UBS, Unicredit, Intesa San Paolo, Nordea, Lloyds, Barclays, Standard Chartered, HSBC
Board of Directors
Subsidiary Governance
New Risk Governance
• New Country Heads in Top 5 countries
• 50+ new appointments to Subsidiaries’ Boards
• New Group-Subsidiary Governance Model
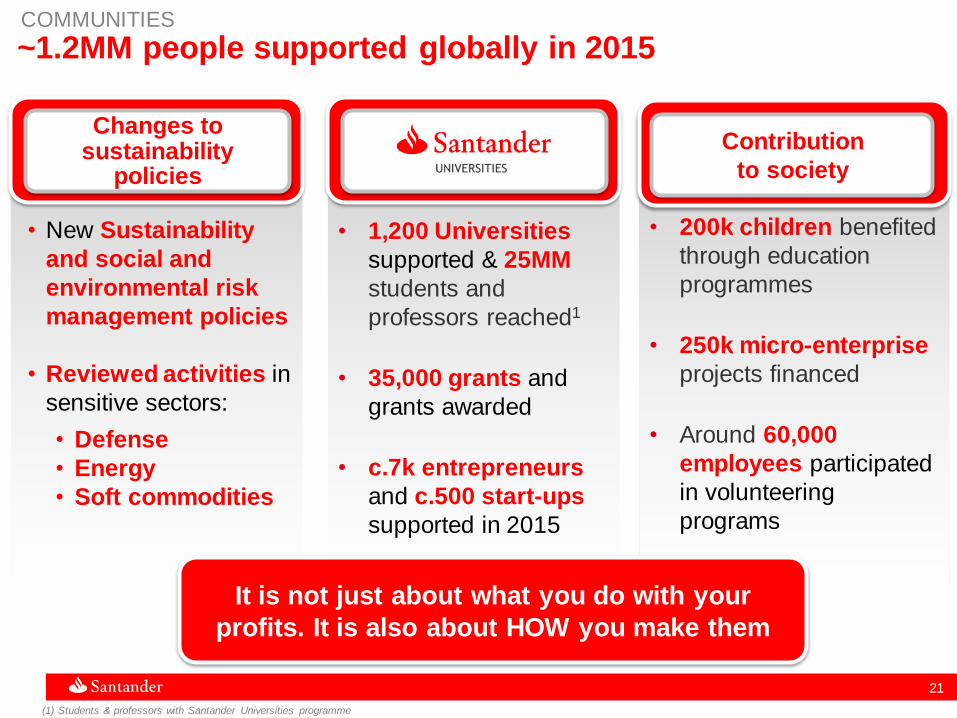
21
Changes to sustainability
policies
• 1,200 Universities
supported & 25MM
students and
professors reached1
• 35,000 grants and
grants awarded
• c.7k entrepreneurs
and c.500 start-ups
supported in 2015
~1.2MM people supported globally in 2015 COMMUNITIES
• New Sustainability
and social and
environmental risk
management policies
• Reviewed activities in
sensitive sectors:
• Defense
• Energy
• Soft commodities
(1) Students & professors with Santander Universities programme
• 200k children benefited
through education
programmes
• 250k micro-enterprise
projects financed
• Around 60,000
employees participated
in volunteering
programs
Contribution
to society
It is not just about what you do with your
profits. It is also about HOW you make them
22
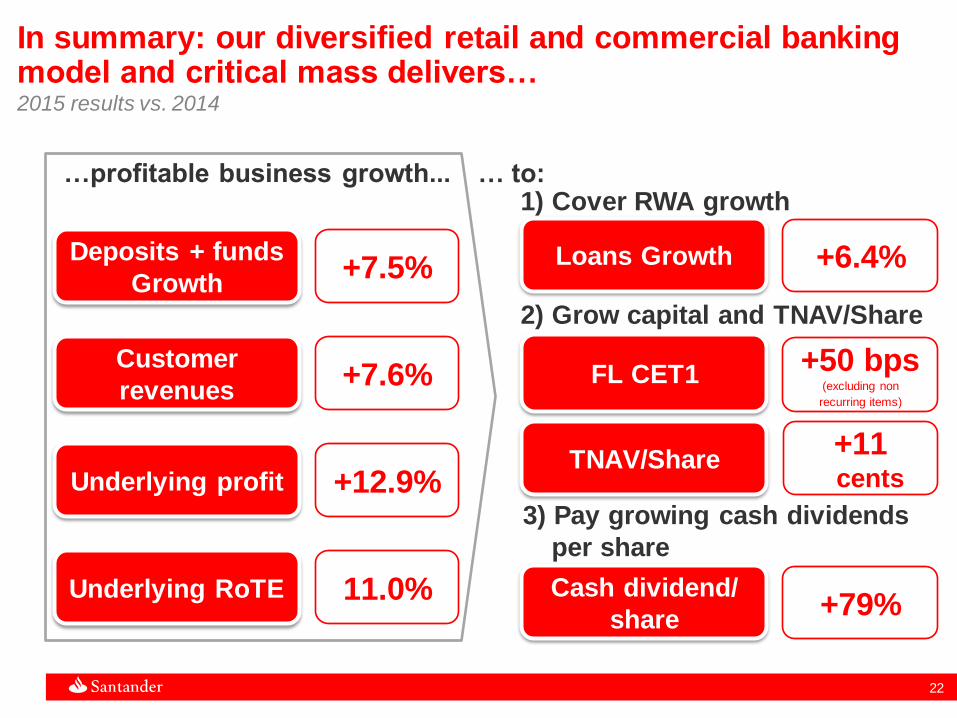
+7.6% Customer
revenues
+12.9% Underlying profit
+7.5% Deposits + funds
Growth
11.0% Underlying RoTE
In summary: our diversified retail and commercial banking model and critical mass delivers… 2015 results vs. 2014
…profitable business growth... … to:
2) Grow capital and TNAV/Share
3) Pay growing cash dividends
per share
FL CET1
+11 cents
TNAV/Share
+6.4% Loans Growth
+79% Cash dividend/
share
1) Cover RWA growth
+50 bps (excluding non
recurring items)

23
Agenda
2015: Higher profitability…
2016 – 2018: Key commercial and financial priorities
2015: …progressing on our commercial transformation
around the customer
2015: Group and Business Areas review

24 24
Good financial performance in 2015 Change 2015 / 2014
+7.6% Customer revenues
+12.9% Underlying profit
+6.4% Loan growth1
11.0% Underlying RoTE
Fully-loaded CET1
+11 €cents TNAV per share
+7.5% Funds growth1
+79% Cash dividend
per share
+50 b.p. (excl. non-recurring
items)
(1) % change in constant euros

Group Activity
26 26
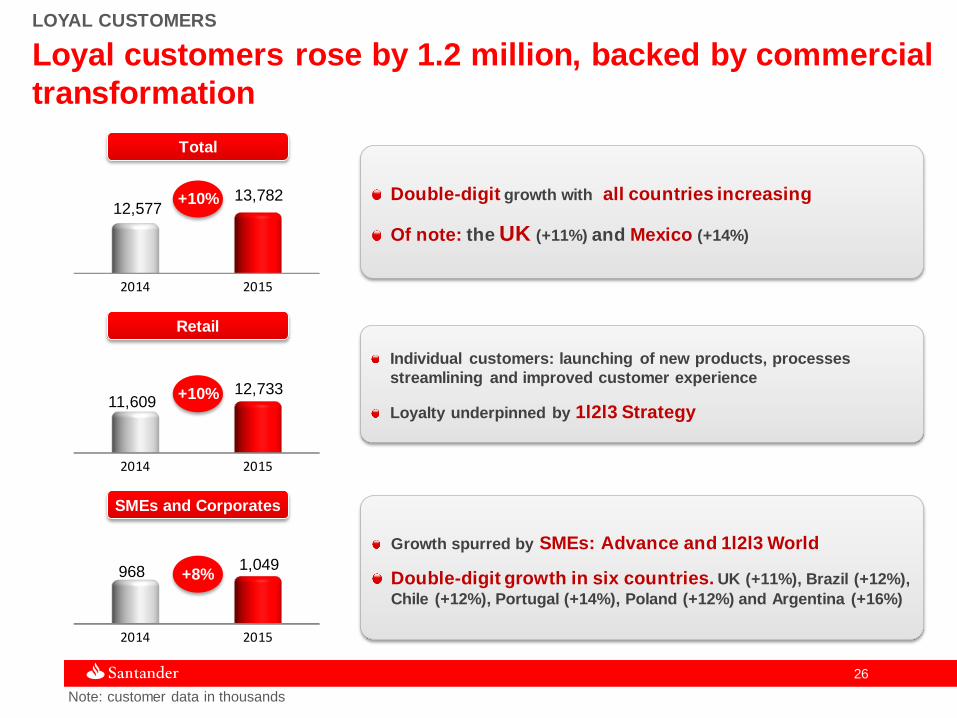
LOYAL CUSTOMERS
2014 2015
12,577 13,782
Retail
SMEs and Corporates
2014 2015
11,609 12,733
2014 2015
968 1,049
Individual customers: launching of new products, processes
streamlining and improved customer experience
Loyalty underpinned by 1l2l3 Strategy
Growth spurred by SMEs: Advance and 1l2l3 World
Double-digit growth in six countries. UK (+11%), Brazil (+12%),
Chile (+12%), Portugal (+14%), Poland (+12%) and Argentina (+16%)
+10%
+10%
+8%
Loyal customers rose by 1.2 million, backed by commercial
transformation
Total
Double-digit growth with all countries increasing
Of note: the UK (+11%) and Mexico (+14%)
Note: customer data in thousands
27 27
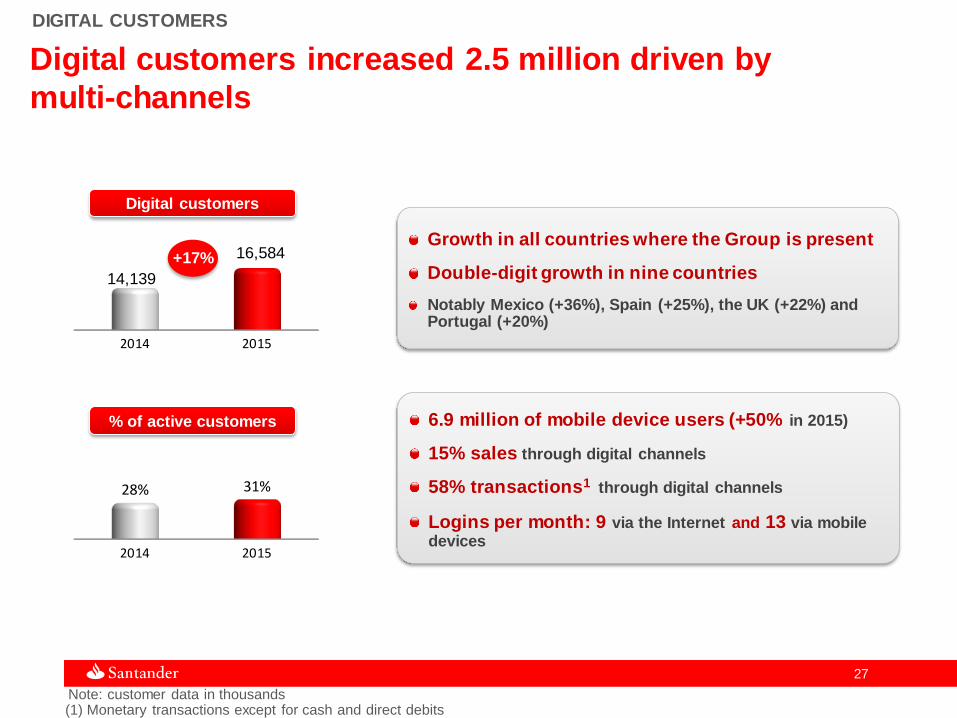
DIGITAL CUSTOMERS
Digital customers
% of active customers
2014 2015
14,139
16,584 Growth in all countries where the Group is present
Double-digit growth in nine countries
Notably Mexico (+36%), Spain (+25%), the UK (+22%) and Portugal (+20%)
+17%
Digital customers increased 2.5 million driven by
multi-channels
2014 2015
28% 31%
6.9 million of mobile device users (+50% in 2015)
15% sales through digital channels
58% transactions1 through digital channels
Logins per month: 9 via the Internet and 13 via mobile devices
(1) Monetary transactions except for cash and direct debits Note: customer data in thousands
28 28
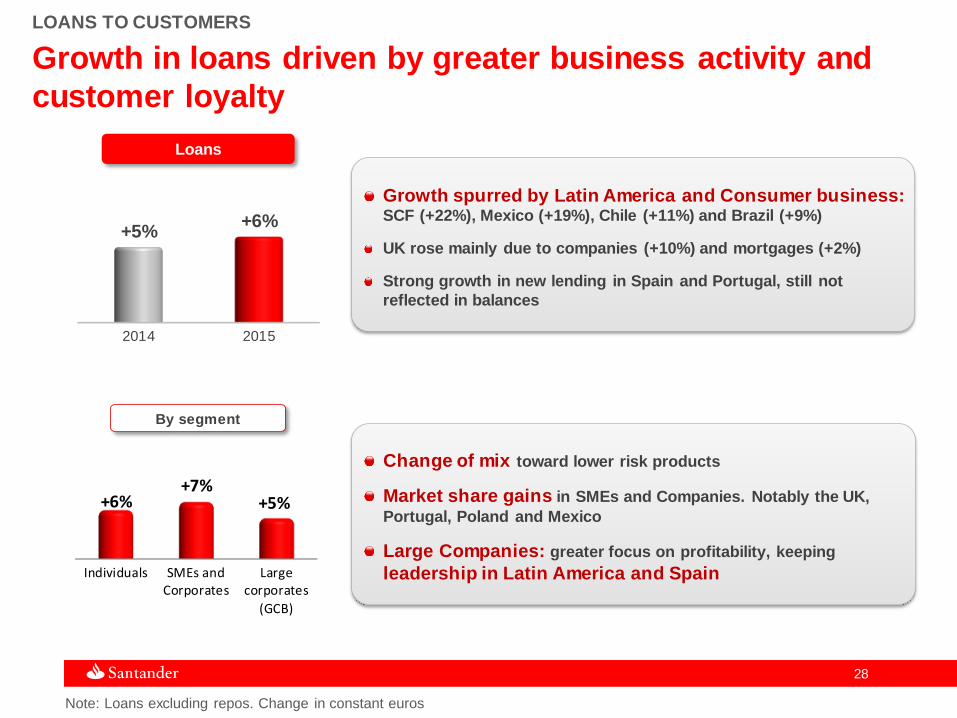
LOANS TO CUSTOMERS
By segment
Growth spurred by Latin America and Consumer business: SCF (+22%), Mexico (+19%), Chile (+11%) and Brazil (+9%)
UK rose mainly due to companies (+10%) and mortgages (+2%)
Strong growth in new lending in Spain and Portugal, still not
reflected in balances
Individuals SMEs andCorporates
Largecorporates
(GCB)
+6% +7%
+5%
Change of mix toward lower risk products
Market share gains in SMEs and Companies. Notably the UK,
Portugal, Poland and Mexico
Large Companies: greater focus on profitability, keeping
leadership in Latin America and Spain
Loans
2014 2015
+5% +6%
Growth in loans driven by greater business activity and
customer loyalty
Note: Loans excluding repos. Change in constant euros
29 29
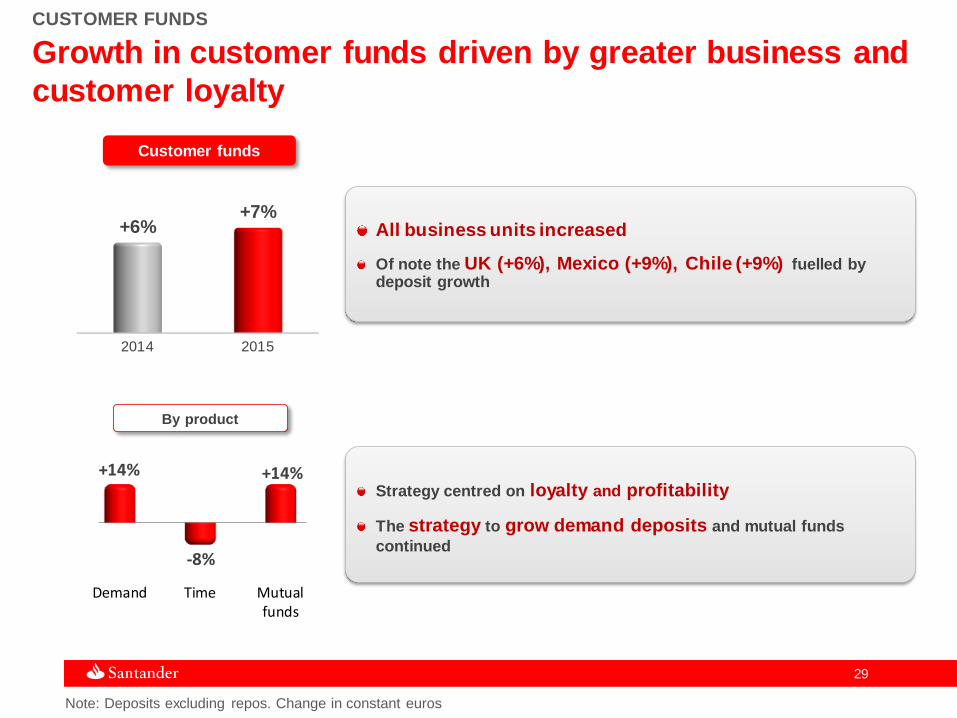
CUSTOMER FUNDS
By product
Strategy centred on loyalty and profitability
The strategy to grow demand deposits and mutual funds
continued
Customer funds
2014 2015
+6% +7%
Growth in customer funds driven by greater business and
customer loyalty
Note: Deposits excluding repos. Change in constant euros
All business units increased
Of note the UK (+6%), Mexico (+9%), Chile (+9%) fuelled by deposit growth
Demand Time Mutualfunds
+14%
-8%
+14%

Group Profit & Loss
31 31
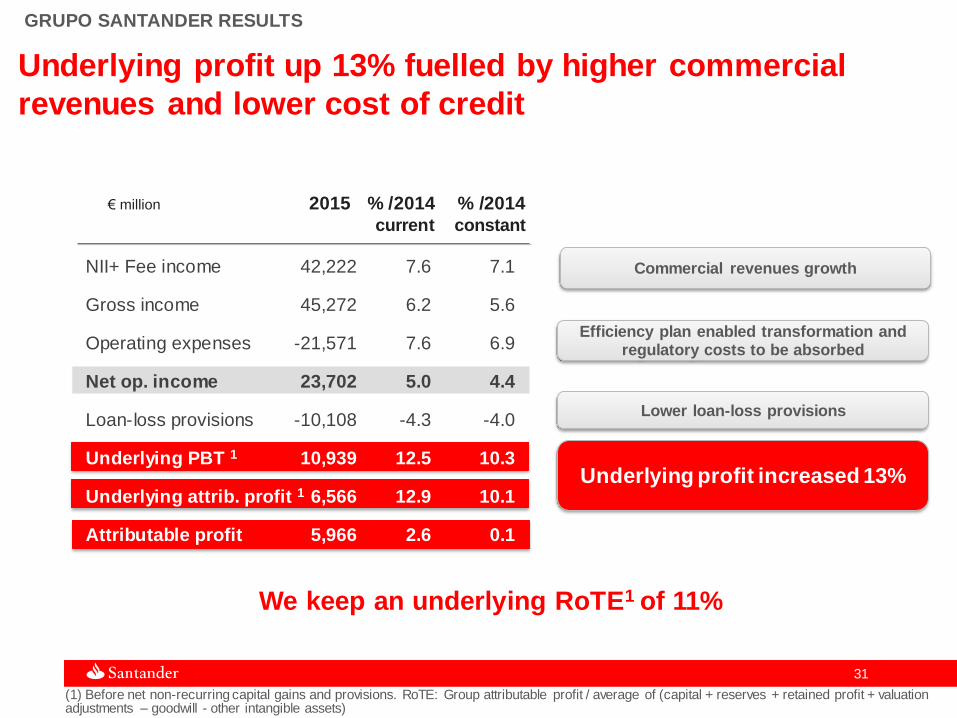
GRUPO SANTANDER RESULTS
€ million 2015 % /2014 % /2014 current constant
Commercial revenues growth
Lower loan-loss provisions
Underlying profit increased 13%
Efficiency plan enabled transformation and regulatory costs to be absorbed
Underlying profit up 13% fuelled by higher commercial
revenues and lower cost of credit
(1) Before net non-recurring capital gains and provisions. RoTE: Group attributable profit / average of (capital + reserves + retained profit + valuation adjustments – goodwill - other intangible assets)
We keep an underlying RoTE1 of 11%
NII+ Fee income 42,222 7.6 7.1
Gross income 45,272 6.2 5.6
Operating expenses -21,571 7.6 6.9
Net op. income 23,702 5.0 4.4
Loan-loss provisions -10,108 -4.3 -4.0
Underlying PBT 1 10,939 12.5 10.3
Underlying attrib. profit 1 6,566 12.9 10.1
Attributable profit 5,966 2.6 0.1
32 32
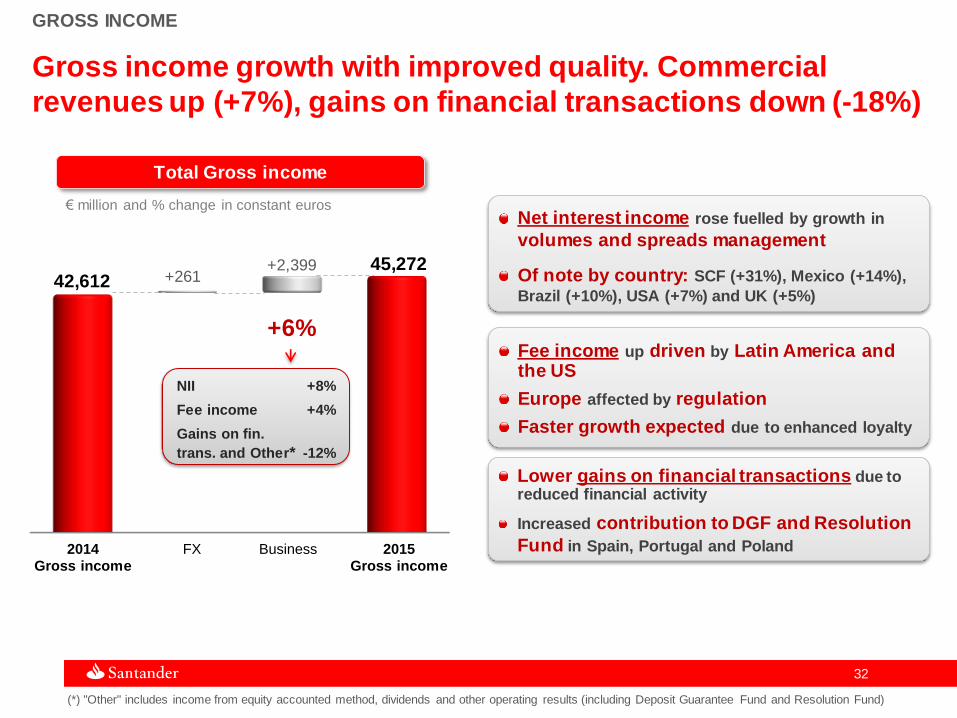
GROSS INCOME
Net interest income rose fuelled by growth in
volumes and spreads management
Of note by country: SCF (+31%), Mexico (+14%),
Brazil (+10%), USA (+7%) and UK (+5%)
Fee income up driven by Latin America and the US
Europe affected by regulation
Faster growth expected due to enhanced loyalty
Lower gains on financial transactions due to reduced financial activity
Increased contribution to DGF and Resolution
Fund in Spain, Portugal and Poland
Gross income growth with improved quality. Commercial
revenues up (+7%), gains on financial transactions down (-18%)
42,612 45,272
+261 +2,399
+6%
NII +8%
Fee income +4%
Gains on fin.
trans. and Other* -12%
Total Gross income
€ million and % change in constant euros
Business 2015 Gross income
2014 Gross income
FX
(*) "Other" includes income from equity accounted method, dividends and other operating results (including Deposit Guarantee Fund and Resolution Fund)
33 33
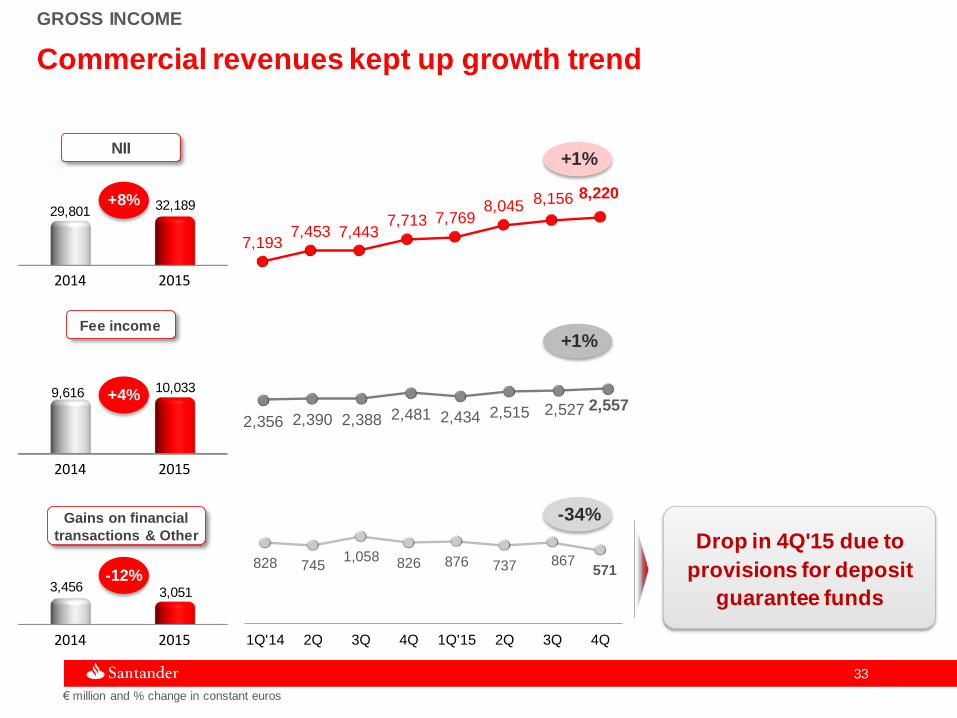
GROSS INCOME
€ million and % change in constant euros
Commercial revenues kept up growth trend
Drop in 4Q'15 due to
provisions for deposit
guarantee funds
2014 2015
29,801 32,189
2014 2015
9,616 10,033
2014 2015
3,456 3,051
NII
Fee income
Gains on financial
transactions & Other
+8%
+4%
-12% 828 745
1,058 826 876 737 867 571
1Q'14 2Q 3Q 4Q 1Q'15 2Q 3Q 4Q
7,193 7,453 7,443
7,713 7,769 8,045 8,156 8,220
2,356 2,390 2,388 2,481 2,434 2,515 2,527 2,557
+1%
+1%
-34%
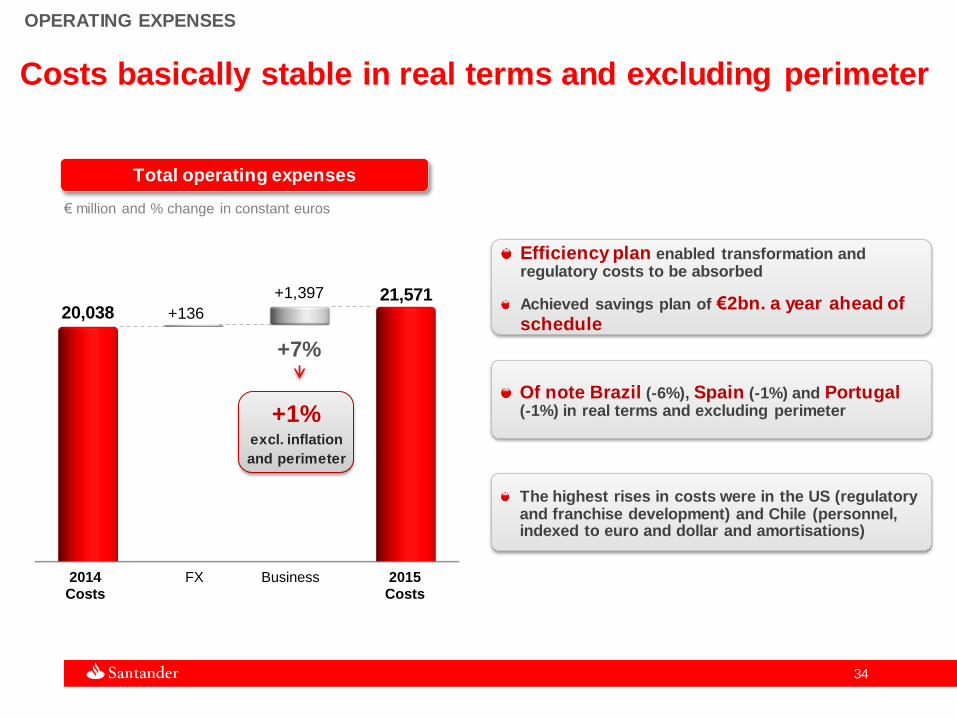
34 34
OPERATING EXPENSES
Costs basically stable in real terms and excluding perimeter
Total operating expenses
Efficiency plan enabled transformation and regulatory costs to be absorbed
Achieved savings plan of €2bn. a year ahead of schedule
Of note Brazil (-6%), Spain (-1%) and Portugal (-1%) in real terms and excluding perimeter
The highest rises in costs were in the US (regulatory and franchise development) and Chile (personnel, indexed to euro and dollar and amortisations)
€ million and % change in constant euros
2015 Costs
2014 Costs
+1% excl. inflation
and perimeter
+7%
Business FX
20,038 21,571
+136
+1,397

35 35
Higher provisions in units with strong growth in volumes (Mexico and Argentina) and higher on balance sheet loan retentions (USA)
Brazil's rose (5%), although performing better than competitors in terms of credit quality
The increase was mainly due to companies, as individuals performed very well
LOAN-LOSS PROVISIONS
Of note were the declines in the UK, Spain, Portugal, Poland and Real Estate Activity in Spain
Lower loan-loss provisions compatible with the growth
in volumes
€ million and % change in constant euros
Total loan-loss provisions
2014 LLPs
FX 2015 LLPs
-4%
Business
10,562 10,108 -30
-424
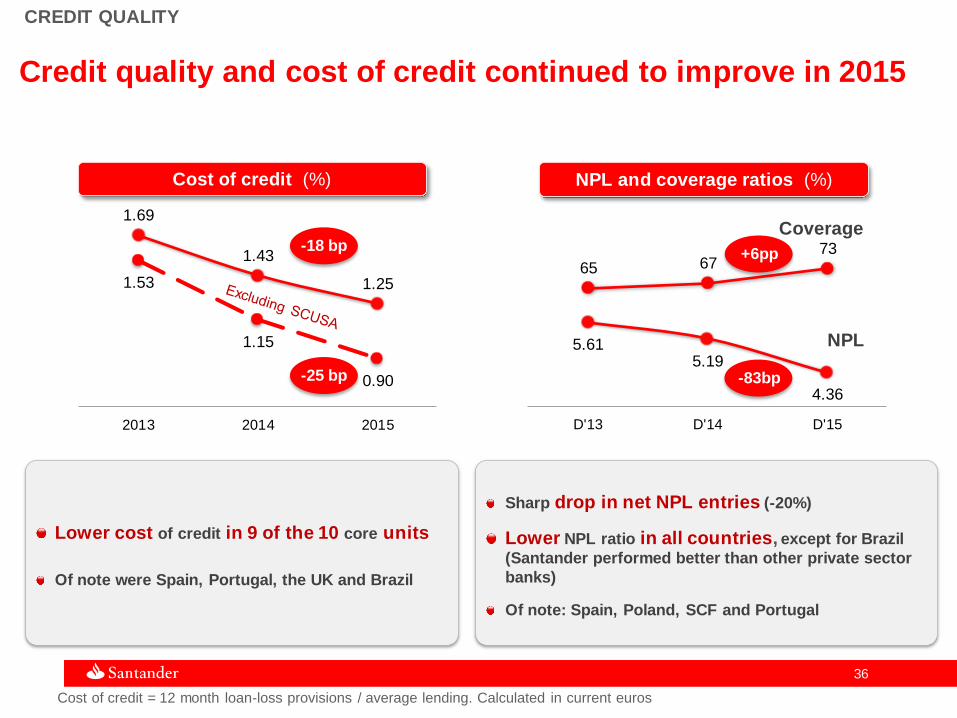
36 36
CREDIT QUALITY
Cost of credit (%)
Cost of credit = 12 month loan-loss provisions / average lending. Calculated in current euros
Lower cost of credit in 9 of the 10 core units
Of note were Spain, Portugal, the UK and Brazil
Sharp drop in net NPL entries (-20%)
Lower NPL ratio in all countries, except for Brazil
(Santander performed better than other private sector
banks)
Of note: Spain, Poland, SCF and Portugal
Credit quality and cost of credit continued to improve in 2015
1.69
1.43
1.25 1.53
1.15
0.90
2013 2014 2015
65 67 73
5.61 5.19
4.36
D'13 D'14 D'15
-18 bp
-25 bp
NPL and coverage ratios (%)
Coverage
NPL
-83bp
+6pp
Capital

38 38
REGULATORY CAPITAL
Regulatory ratiosDec'15
12.55%
14.40% Capital ratio
CET1
Regulatory requirement2016 CET1
4.50%
5.00%
9.75%
Capital position: Surplus of 280 b.p. over the minimum
required by 2016
(1) Minimum prudential requirements established by the ECB, based on the supervisory review and evaluation process (SREP)
Systemic buffer
Pilar II requirement (including capital conservation
buffer)
Minimum Pilar I
0,25%
CET1
1

39 39
FULLY-LOADED CAPITAL
Absorbed impacts of DPV portfolio valuations and corporate transactions
Higher rise in the total ratio (+130 b.p.) to
13.05% due to AT1 and T2 issues
Capital generation of +50 b.p. before non-recurring items
Fully-loaded CET1 (%)
Achieved the fully-loaded CET1 of 10% at year-end ...
Fully-loaded leverage ratio: 4.7% CET1 D’14*
CET1 D’15
9.65%
10.15% 10.05% +0.50
-0.10
2015 Generation
* Pro-forma, including capital increase in January 2015
Net of positive and negative
non-recurring items
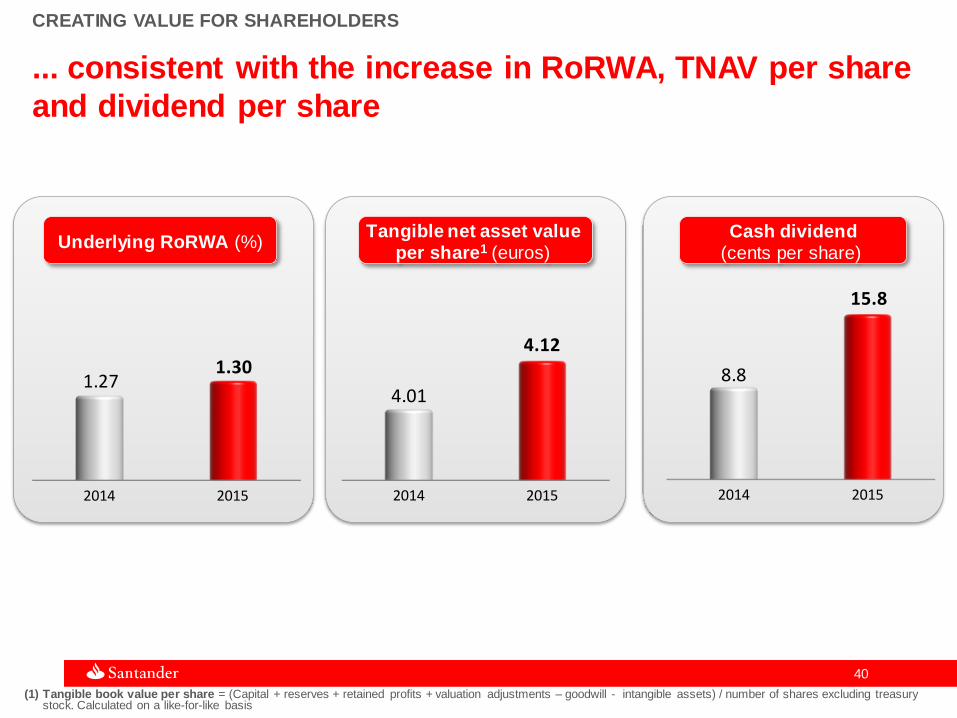
40 40
CREATING VALUE FOR SHAREHOLDERS
(1) Tangible book value per share = (Capital + reserves + retained profits + valuation adjustments – goodwill - intangible assets) / number of shares excluding treasury stock. Calculated on a like-for-like basis
... consistent with the increase in RoRWA, TNAV per share
and dividend per share
Tangible net asset value per share1 (euros)
Cash dividend
(cents per share) Underlying RoRWA (%)
2014 2015
1.27 1.30
2014 2015
4.01
4.12
2014 2015
8.8
15.8

Business Areas
42 42
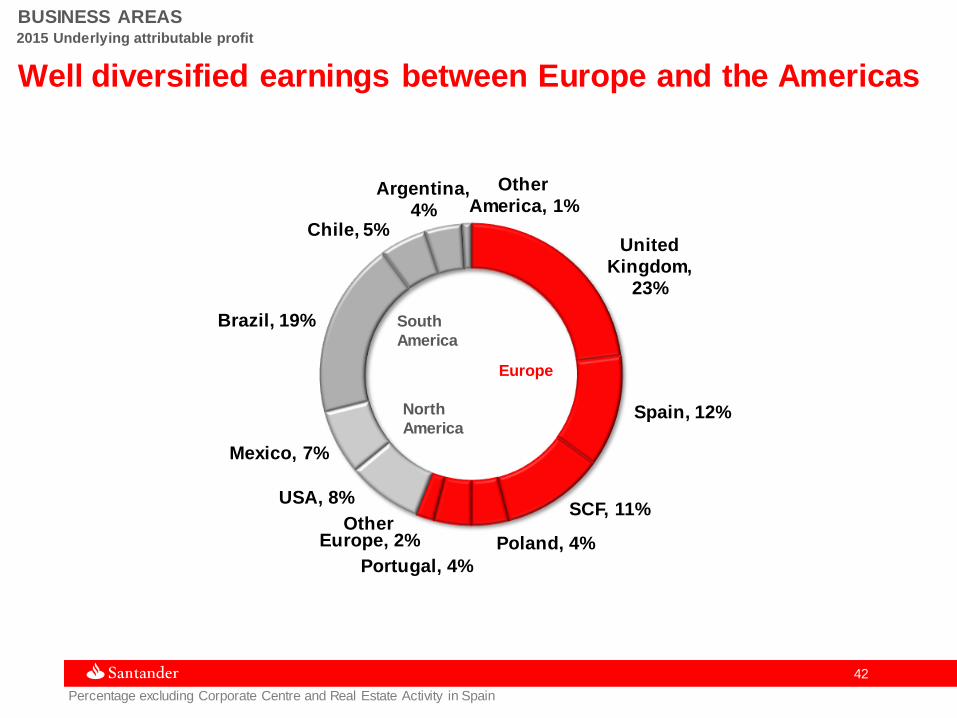
United
Kingdom,
23%
Spain, 12%
SCF, 11%
Poland, 4%
Portugal, 4%
Other Europe, 2%
USA, 8%
Mexico, 7%
Brazil, 19%
Chile, 5%
Argentina,
4%
Other
America, 1%
BUSINESS AREAS
Well diversified earnings between Europe and the Americas
2015 Underlying attributable profit
Percentage excluding Corporate Centre and Real Estate Activity in Spain
Europe
North
America
South
America

43 43
€ million
P&L
2014 2015
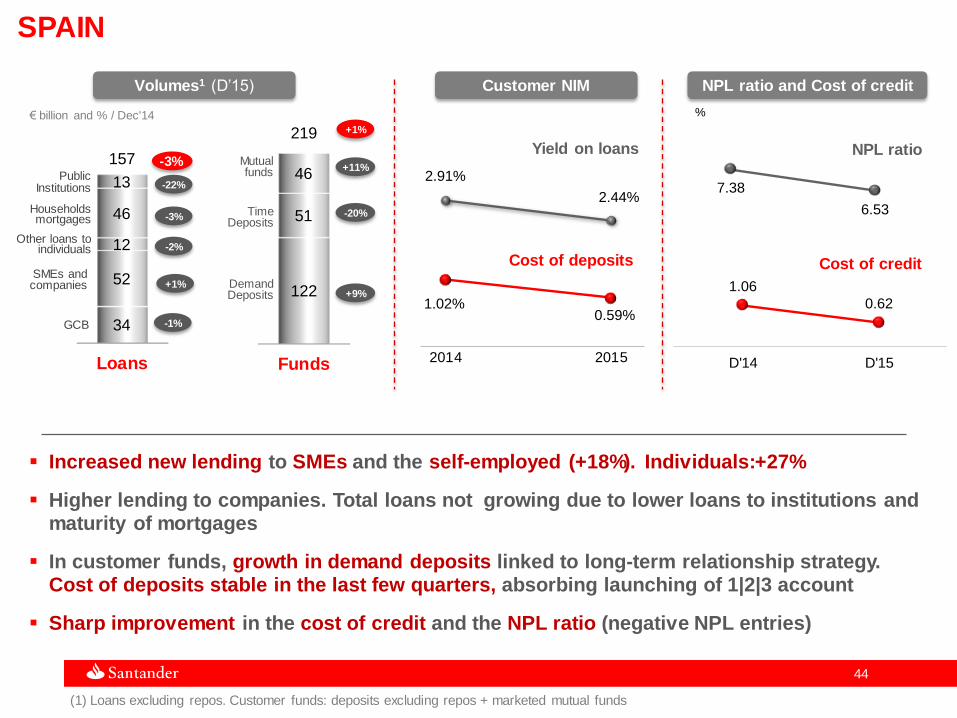
SPAIN
2015 % /2014
NII + Fee income 5,118 -5.6
Gross income 6,080 -8.4
Operating expenses -3,434 -1.8
Net op. income 2,646 -15.7
Loan-loss provisions -992 -43.2
PBT 1,392 17.7
Attributable profit 977 18.2
Long term loyalty underpinned by the 1l2l3 strategy (860,000 accounts in 7 months)
Greater customer satisfaction backed by the effort made in quality customer service
Higher profit underpinned by lower provisions and operating expenses (efficiency plan)
In gross income, NII under pressure (low interest rates and tough competition in loans), lower gains on financial transactions and greater contribution to the DGF and Resolution Fund. Fee income stabilising
Strategic metrics performance
1|2|3 Accounts (thousand) - 860
Customer satisfaction (position) 5º 1º
Cost of credit 1.06% 0.62%
SMEs market share1 20% 20%
RoTE 7.4% 8.1%
(1) Santander as the bank of first choice
44 44
2.91%
2.44%
1.02% 0.59%
2014 2015
Increased new lending to SMEs and the self-employed (+18%). Individuals:+27%
Higher lending to companies. Total loans not growing due to lower loans to institutions and maturity of mortgages
In customer funds, growth in demand deposits linked to long-term relationship strategy. Cost of deposits stable in the last few quarters, absorbing launching of 1|2|3 account
Sharp improvement in the cost of credit and the NPL ratio (negative NPL entries)
Cost of deposits
Yield on loans
Customer NIM
Loans
34
52
12
46
13
157
Volumes1 (D’15)
-22%
-3%
-2%
-1%
Funds
122
51
46
219
+11%
-20%
+9%
SPAIN
€ billion and % / Dec'14 +1%
Public Institutions
GCB
Other loans to individuals
Households mortgages
Demand Deposits
Time Deposits
Mutual funds
1.06
0.62
D'14 D'15
7.38
6.53
NPL ratio and Cost of credit
-3%
%
(1) Loans excluding repos. Customer funds: deposits excluding repos + marketed mutual funds
Cost of credit
NPL ratio
SMEs and companies +1%
45 45
2014 2015
Million £
P&L
2015 % /2014
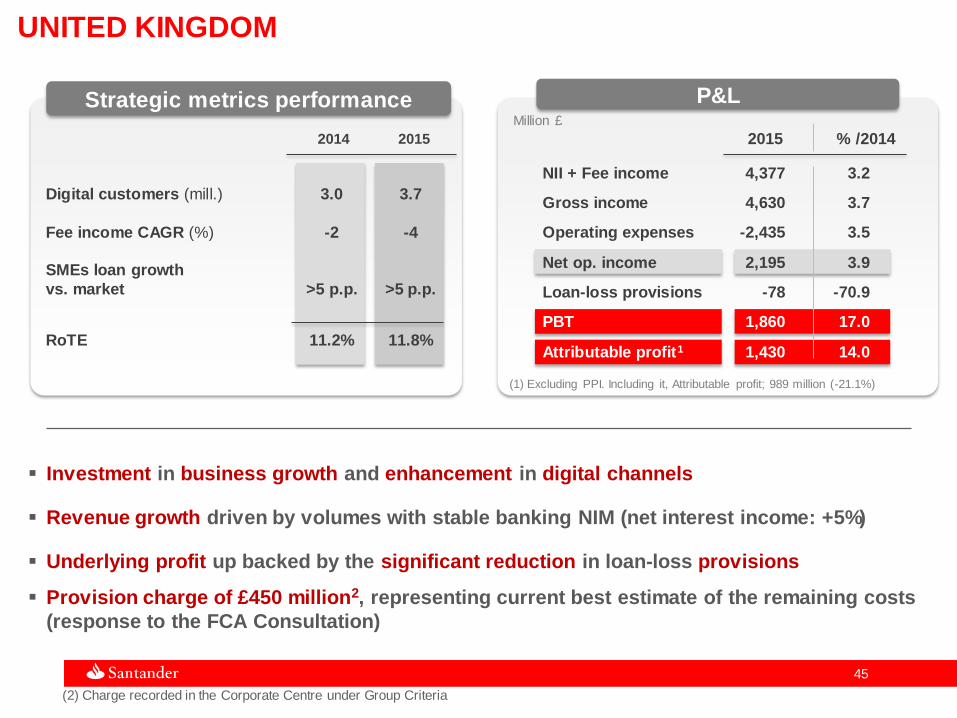
NII + Fee income 4,377 3.2
Gross income 4,630 3.7
Operating expenses -2,435 3.5
Net op. income 2,195 3.9
Loan-loss provisions -78 -70.9
PBT 1,860 17.0
Attributable profit1 1,430 14.0
UNITED KINGDOM
(1) Excluding PPI. Including it, Attributable profit; 989 million (-21.1%)
Investment in business growth and enhancement in digital channels
Revenue growth driven by volumes with stable banking NIM (net interest income: +5%)
Underlying profit up backed by the significant reduction in loan-loss provisions
Provision charge of £450 million2, representing current best estimate of the remaining costs
(response to the FCA Consultation)
Strategic metrics performance
Digital customers (mill.) 3.0 3.7
Fee income CAGR (%) -2 -4
SMEs loan growth
vs. market >5 p.p. >5 p.p.
RoTE 11.2% 11.8%
(2) Charge recorded in the Corporate Centre under Group Criteria
46 46
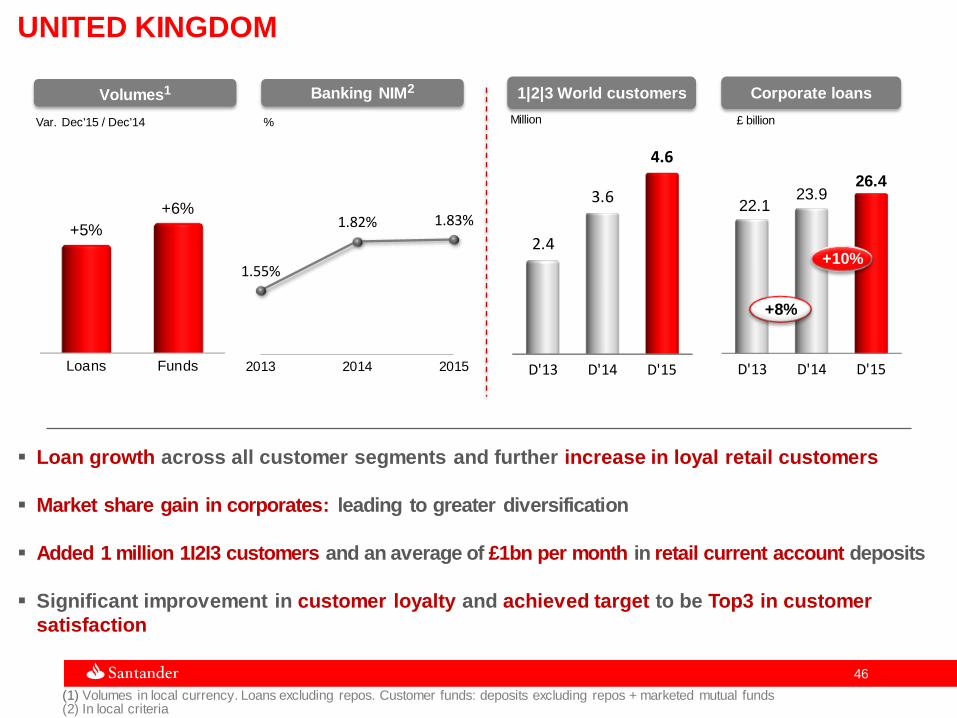
Loan growth across all customer segments and further increase in loyal retail customers
Market share gain in corporates: leading to greater diversification
Added 1 million 1I2I3 customers and an average of £1bn per month in retail current account deposits
Significant improvement in customer loyalty and achieved target to be Top3 in customer
satisfaction
1|2|3 World customers Corporate loans Volumes1
UNITED KINGDOM
Loans Funds
+5%
+6%
Var. Dec'15 / Dec'14 Million £ billion
D'13 D'14 D'15
2.4
3.6
4.6
D'13 D'14 D'15
22.1 23.9
26.4
+10%
+8%
1.55%
1.82% 1.83%
2013 2014 2015
Banking NIM2
%
(1) Volumes in local currency. Loans excluding repos. Customer funds: deposits excluding repos + marketed mutual funds (2) In local criteria
47 47
2014 2015
€ million
P&L
2015 % /2014*
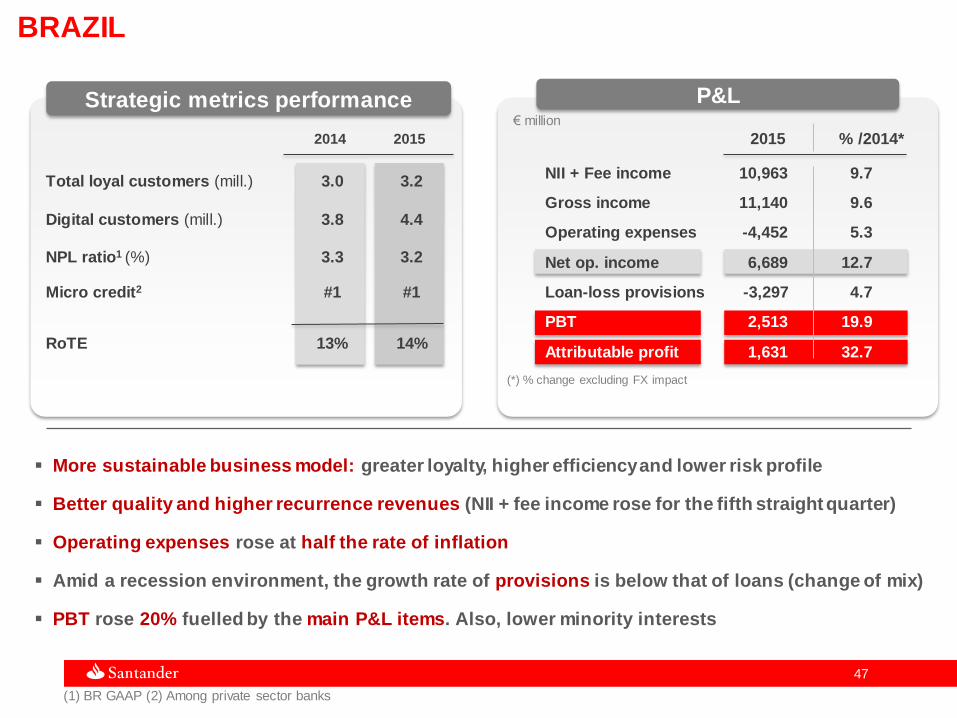
NII + Fee income 10,963 9.7
Gross income 11,140 9.6
Operating expenses -4,452 5.3
Net op. income 6,689 12.7
Loan-loss provisions -3,297 4.7
PBT 2,513 19.9
Attributable profit 1,631 32.7
BRAZIL
(1) BR GAAP (2) Among private sector banks
(*) % change excluding FX impact
More sustainable business model: greater loyalty, higher efficiency and lower risk profile
Better quality and higher recurrence revenues (NII + fee income rose for the fifth straight quarter)
Operating expenses rose at half the rate of inflation
Amid a recession environment, the growth rate of provisions is below that of loans (change of mix)
PBT rose 20% fuelled by the main P&L items. Also, lower minority interests
Strategic metrics performance
Total loyal customers (mill.) 3.0 3.2
Digital customers (mill.) 3.8 4.4
NPL ratio1 (%) 3.3 3.2
Micro credit2 #1 #1
RoTE 13% 14%
48 48
4.0% 3.7%
4.5%
3.7%
3.3% 3.2%
D'13 D'14 D'15
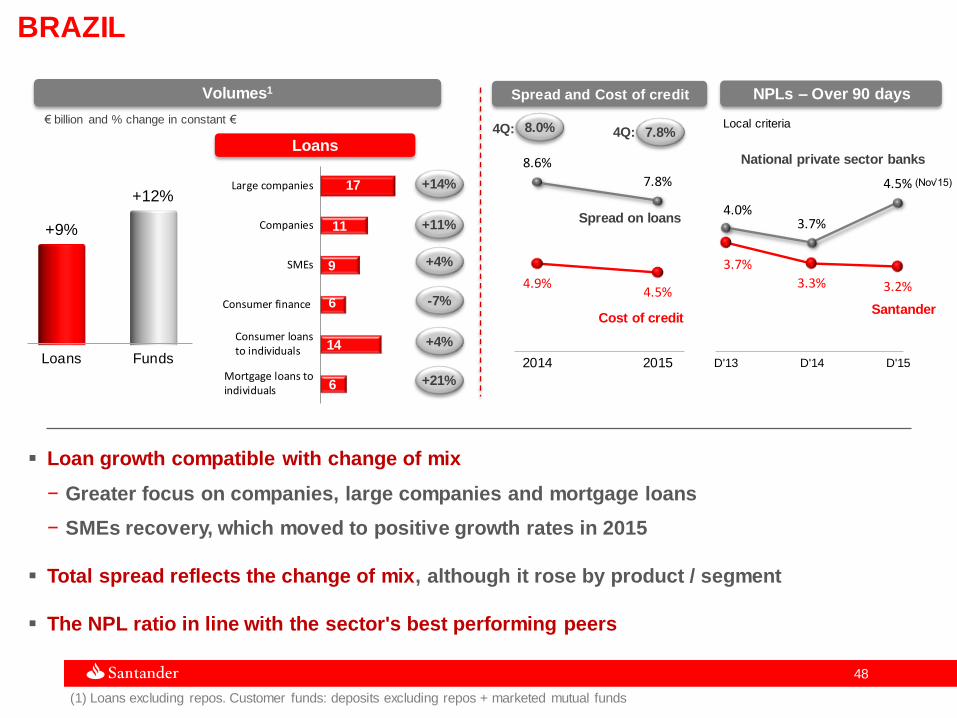
Loan growth compatible with change of mix
− Greater focus on companies, large companies and mortgage loans
− SMEs recovery, which moved to positive growth rates in 2015
Total spread reflects the change of mix, although it rose by product / segment
The NPL ratio in line with the sector's best performing peers
NPLs – Over 90 days
BRAZIL
National private sector banks
Loans Funds
+9%
+12%
6
14
6
9
11
17
Mortgage loans toindividuals
Consumer loansto individuals
Consumer finance
SMEs
Companies
Large companies +14%
+11%
Local criteria
(Nov’15)
Loans
(1) Loans excluding repos. Customer funds: deposits excluding repos + marketed mutual funds
Volumes1
€ billion and % change in constant €
8.6%
7.8%
4.9% 4.5%
2014 2015
4Q:
Spread and Cost of credit
Spread on loans
7.8% 8.0% 4Q:
Cost of credit Santander
+4%
+4%
-7%
+21%
49 49
2014 2015
Loans New lending
+11% +10%
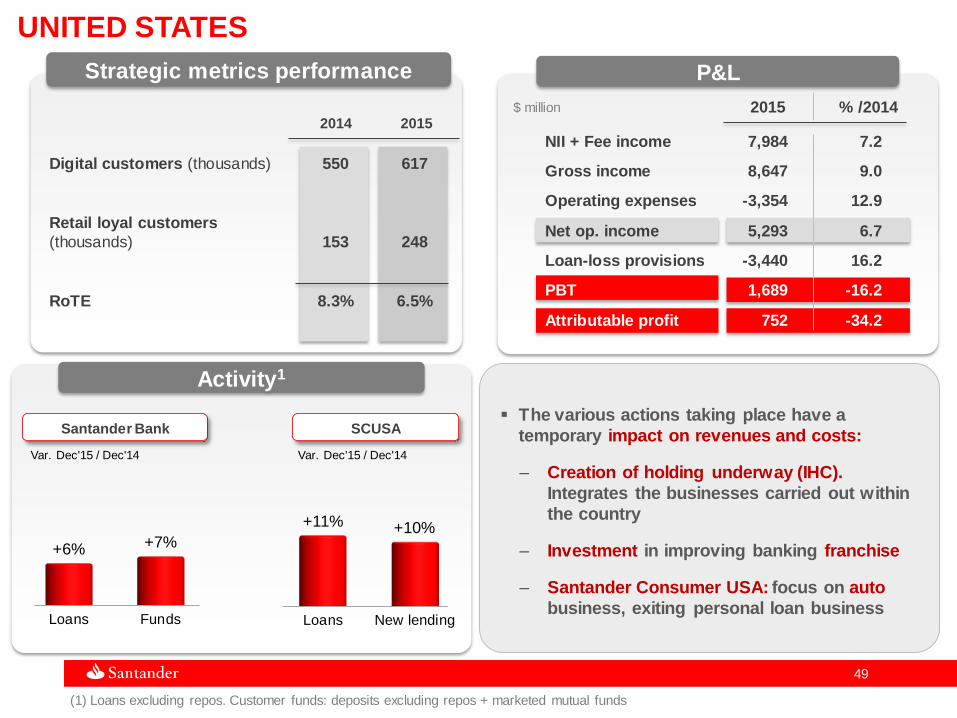
UNITED STATES
Activity1
Loans Funds
+6% +7%
Santander Bank SCUSA
$ million
P&L
2015 % /2014
NII + Fee income 7,984 7.2
Gross income 8,647 9.0
Operating expenses -3,354 12.9
Net op. income 5,293 6.7
Loan-loss provisions -3,440 16.2
PBT 1,689 -16.2
Attributable profit 752 -34.2
Var. Dec'15 / Dec'14 Var. Dec'15 / Dec'14
(1) Loans excluding repos. Customer funds: deposits excluding repos + marketed mutual funds
Strategic metrics performance
Digital customers (thousands) 550 617
Retail loyal customers
(thousands) 153 248
RoTE 8.3% 6.5%
The various actions taking place have a
temporary impact on revenues and costs:
‒ Creation of holding underway (IHC).
Integrates the businesses carried out within
the country
‒ Investment in improving banking franchise
‒ Santander Consumer USA: focus on auto
business, exiting personal loan business
50 50
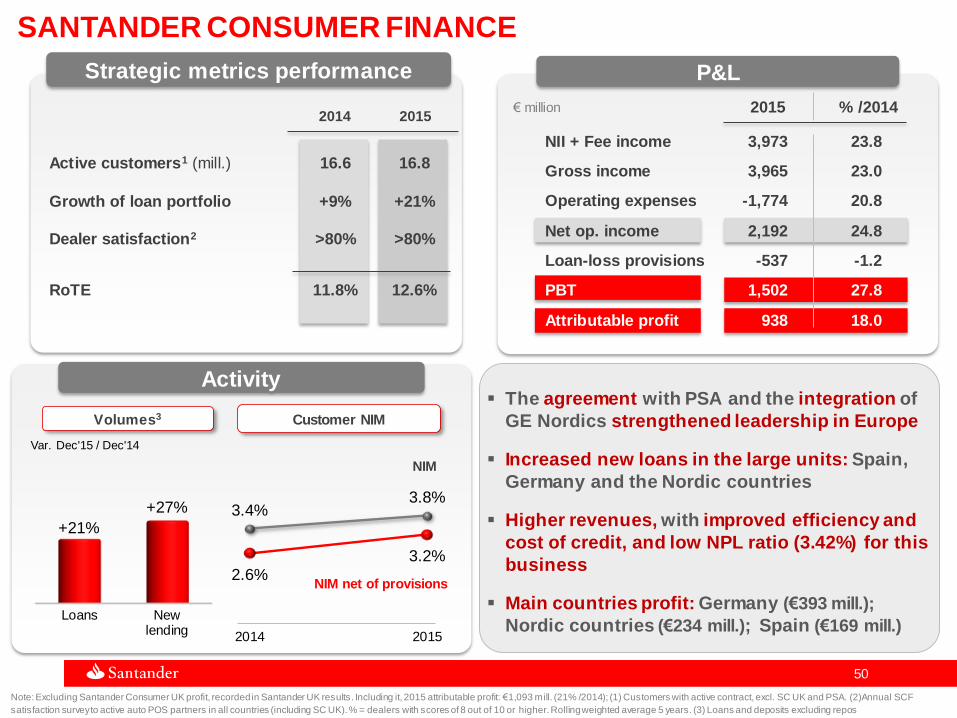
2014 2015
Loans Newlending
+21%
+27%
SANTANDER CONSUMER FINANCE
Activity
Volumes3
The agreement with PSA and the integration of
GE Nordics strengthened leadership in Europe
Increased new loans in the large units: Spain,
Germany and the Nordic countries
Higher revenues, with improved efficiency and
cost of credit, and low NPL ratio (3.42%) for this
business
Main countries profit: Germany (€393 mill.);
Nordic countries (€234 mill.); Spain (€169 mill.)
Customer NIM
3.4% 3.8%
2.6% 3.2%
2014 2015
€ million
P&L
2015 % /2014
NII + Fee income 3,973 23.8
Gross income 3,965 23.0
Operating expenses -1,774 20.8
Net op. income 2,192 24.8
Loan-loss provisions -537 -1.2
PBT 1,502 27.8
Attributable profit 938 18.0
Var. Dec'15 / Dec'14
Note: Excluding Santander Consumer UK profit, recorded in Santander UK results. Including it, 2015 attributable profit: €1,093 mill. (21% /2014); (1) Customers with active contract, excl. SC UK and PSA. (2)Annual SCF
satisfaction survey to active auto POS partners in all countries (including SC UK). % = dealers with scores of 8 out of 10 or higher. Rolling weighted average 5 years. (3) Loans and deposits excluding repos
Strategic metrics performance
Active customers1 (mill.) 16.6 16.8
Growth of loan portfolio +9% +21%
Dealer satisfaction2 >80% >80%
RoTE 11.8% 12.6%
NIM net of provisions
NIM
51 51
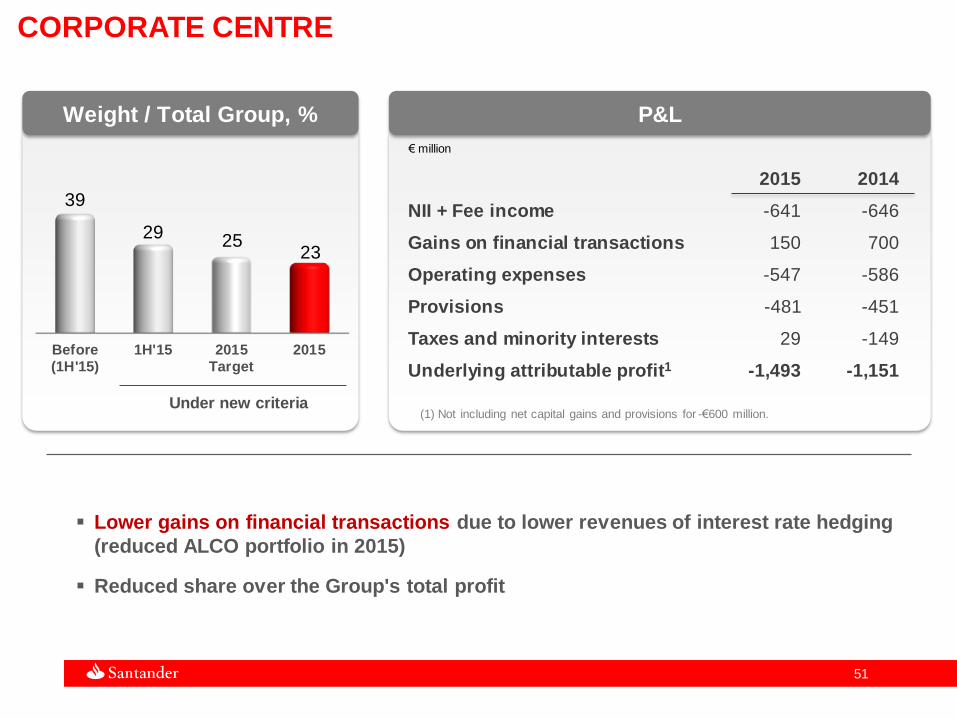
P&L
2015 2014
NII + Fee income -641 -646
Gains on financial transactions 150 700
Operating expenses -547 -586
Provisions -481 -451
Taxes and minority interests 29 -149
Underlying attributable profit1 -1,493 -1,151
Lower gains on financial transactions due to lower revenues of interest rate hedging
(reduced ALCO portfolio in 2015)
Reduced share over the Group's total profit
CORPORATE CENTRE
€ million
Weight / Total Group, %
Under new criteria
Before(1H'15)
1H'15 2015Target
2015
39
29 25 23
(1) Not including net capital gains and provisions for -€600 million.

52 52
Summary of other units performance in 2015
UNDERLYING ATTRIBUTABLE PROFIT
Mexico Market share gain and 8% rise in PBT
Revenues growth and improved cost of credit
Chile
Poland Loans growth. Leadership in digital channels
Profit impacted by interest rates drop. Costs under control and lower cost of credit
Portugal Increased customers and market share gain
Moving towards profit normalisation
Argentina Greater activity backed by expansion plan
Profit up fuelled by higher revenues and lower cost of credit
Sharp increase in customers and volumes
Profit impacted by lower UF inflation and higher taxes
Attributable profit: €629 mill.; +3%
Attributable profit: €455 mill.; -13%
Attributable profit: €300 mill.; -15%
Attributable profit: €300 mill.; +63%
Attributable profit: €378 mill.; +22%
Note: % changes in constant euros
(Units breakdown in appendix)

53
Agenda
2015: Higher profitability…
2016 – 2018: Key commercial and financial priorities
2015: …progressing on our commercial transformation
around the customer
2015: Group and Business Areas review

54
Our strategy
To help people
and businesses
prosper
To be the best retail and commercial
bank, earning the lasting loyalty of our
people, customers, shareholders and
communities
Our purpose Our aim
A bank that is…
SIMPLE | PERSONAL | FAIR
55
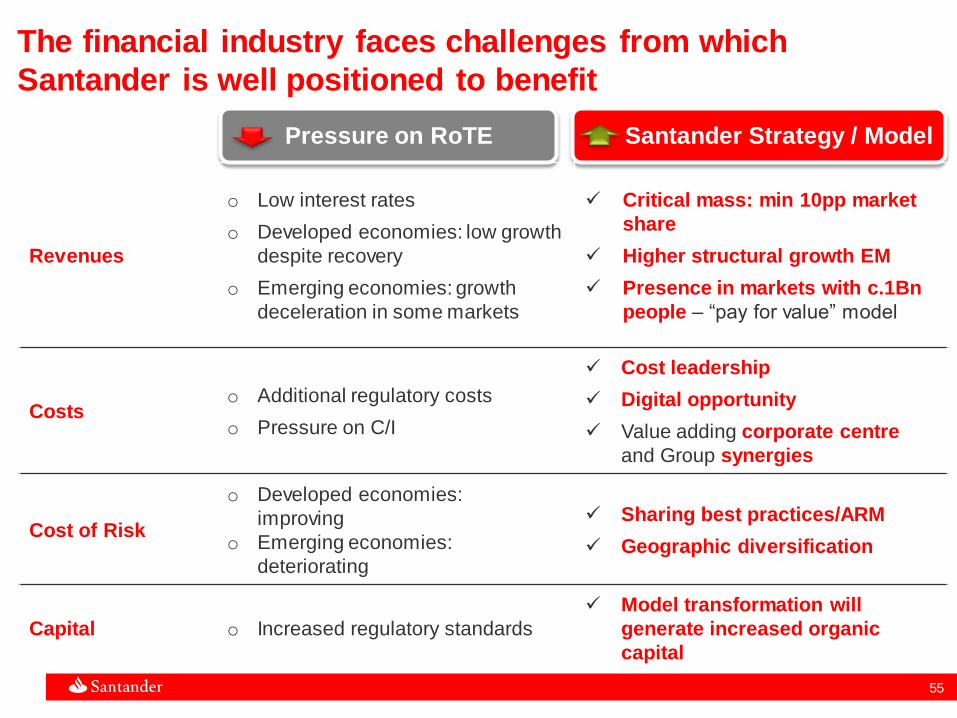
The financial industry faces challenges from which
Santander is well positioned to benefit
Pressure on RoTE Santander Strategy / Model
Revenues
o Low interest rates
o Developed economies: low growth
despite recovery
o Emerging economies: growth
deceleration in some markets
Critical mass: min 10pp market
share
Higher structural growth EM
Presence in markets with c.1Bn
people – “pay for value” model
Costs o Additional regulatory costs
o Pressure on C/I
Cost leadership
Digital opportunity
Value adding corporate centre
and Group synergies
Cost of Risk
o Developed economies:
improving
o Emerging economies:
deteriorating
Sharing best practices/ARM
Geographic diversification
Capital o Increased regulatory standards
Model transformation will
generate increased organic
capital
56
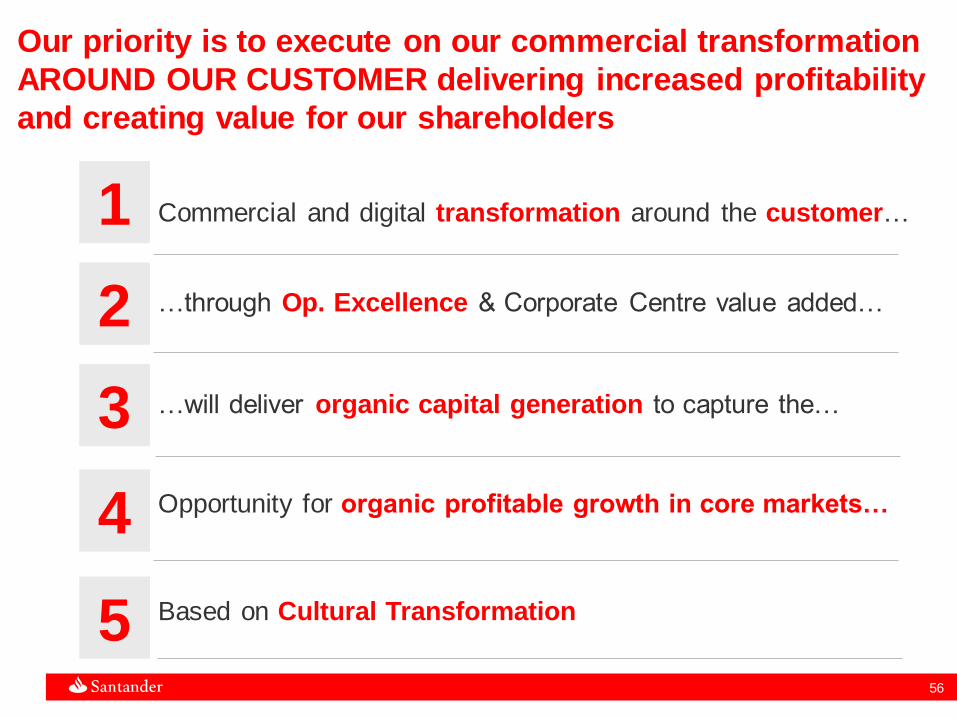
Our priority is to execute on our commercial transformation
AROUND OUR CUSTOMER delivering increased profitability
and creating value for our shareholders
1
2
3
4
5
Commercial and digital transformation around the customer…
…through Op. Excellence & Corporate Centre value added…
…will deliver organic capital generation to capture the…
Opportunity for organic profitable growth in core markets…
Based on Cultural Transformation

57
Instant customer
onboarding
Personalized
Customer Service
Convenient
automated
processes
1
More loyal
customers
More
satisfaction
Lower Cost to
Serve
“Pay for value”
services
Other services
beyond traditional
banking
+
More fee
businesses
We will continue to optimize our commercial model…
58
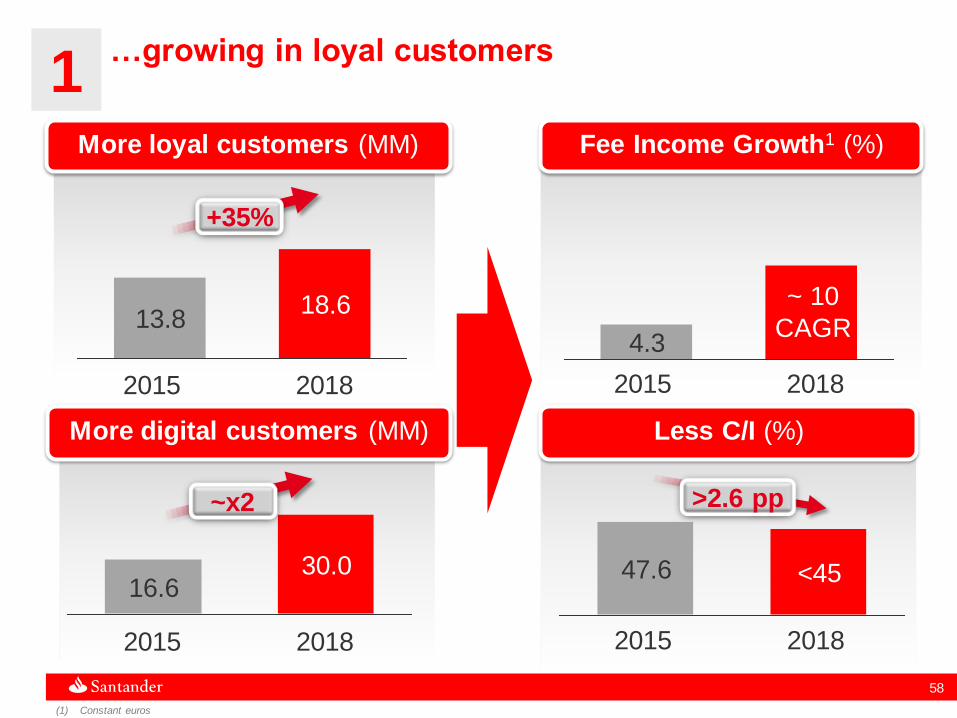
More digital customers (MM) Less C/I (%)
>2.6 pp
30.0
2018 2015
16.6 <45 47.6
~x2
More loyal customers (MM) Fee Income Growth1 (%)
+35%
18.6 13.8
4.3
1 …growing in loyal customers
~ 10
CAGR
(1) Constant euros
2018 2015
2018 2015 2018 2015
59
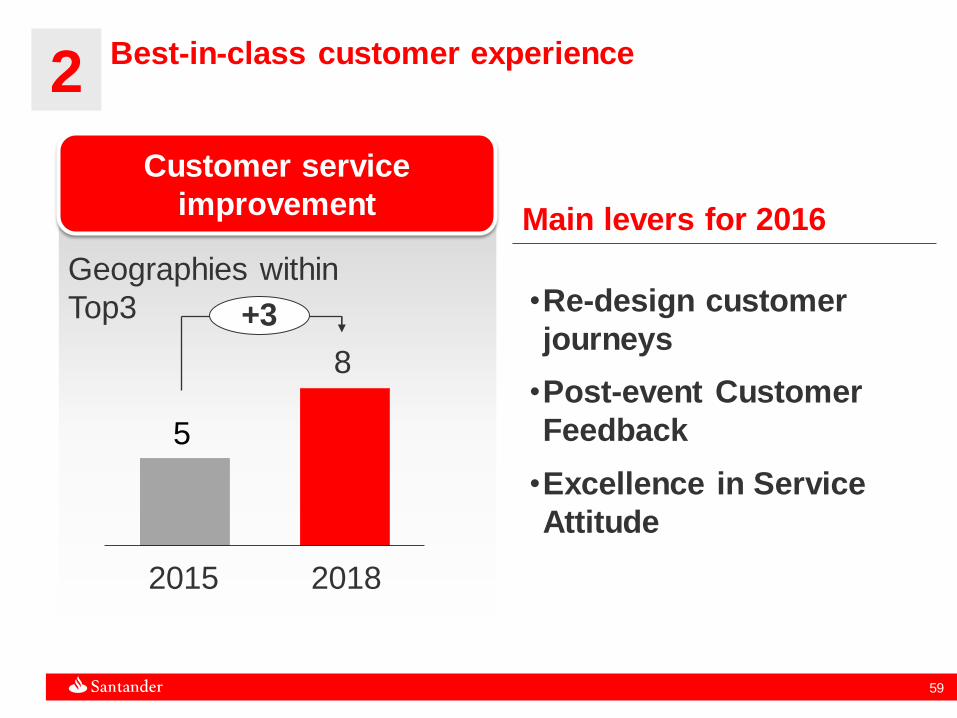
2 Best-in-class customer experience
Customer service
improvement
•Re-design customer
journeys
•Post-event Customer
Feedback
•Excellence in Service
Attitude
Geographies within
Top3
5
+3
8
2018 2015
Main levers for 2016
60
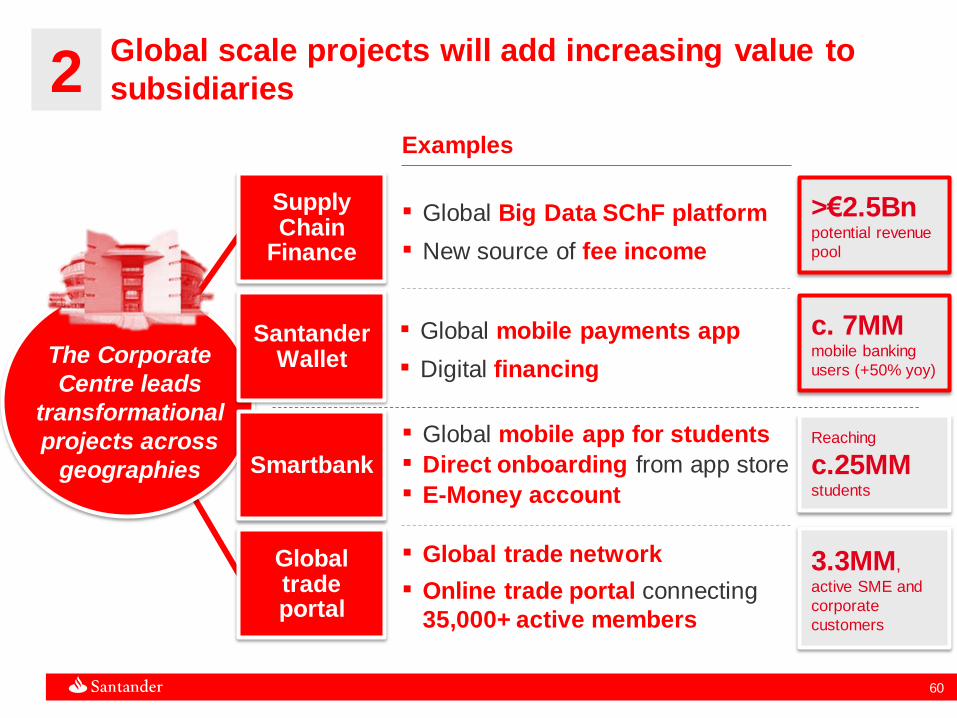
Examples
The Corporate
Centre leads
transformational
projects across
geographies
▪ Global Big Data SChF platform
▪ New source of fee income
Supply Chain
Finance
Smartbank
▪ Global mobile app for students
▪ Direct onboarding from app store
▪ E-Money account
Santander Wallet
Global trade portal
▪ Global trade network
▪ Online trade portal connecting
35,000+ active members
▪ Global mobile payments app
▪ Digital financing
c. 7MM mobile banking
users (+50% yoy)
>€2.5Bn potential revenue
pool
Reaching
c.25MM students
3.3MM,
active SME and
corporate
customers
2 Global scale projects will add increasing value to
subsidiaries

61
>11%
10.05%
Fully Loaded CET1
RORWA, %
ROTE, %
DPS, €
1.30
11.0
0.2
▲
100
bps
Investor Day
commitment
~1.50
~13
2015 2018
Target
Yearly growth
3 Our commitment: to focus on increasing TNAV/S
whilst supporting business growth and growing
dividends
January 2015
commitment
>10%
62
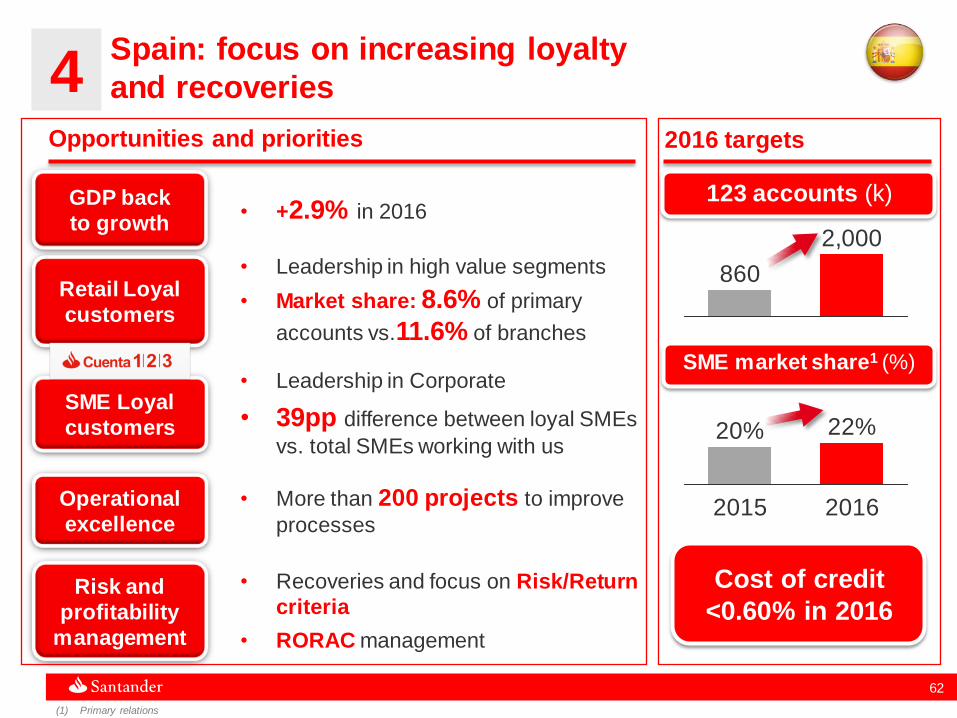
• Recoveries and focus on Risk/Return
criteria
• RORAC management
• Leadership in high value segments
• Market share: 8.6% of primary
accounts vs.11.6% of branches
2,000
860
123 accounts (k)
2016 targets
2016
22%
2015
20%
4 Spain: focus on increasing loyalty
and recoveries
Opportunities and priorities
GDP back
to growth • +2.9% in 2016
Retail Loyal
customers
SME Loyal
customers
Operational
excellence
Risk and
profitability
management
SME market share1 (%)
Cost of credit
<0.60% in 2016
(1) Primary relations
• Leadership in Corporate
• 39pp difference between loyal SMEs
vs. total SMEs working with us
• More than 200 projects to improve
processes
63
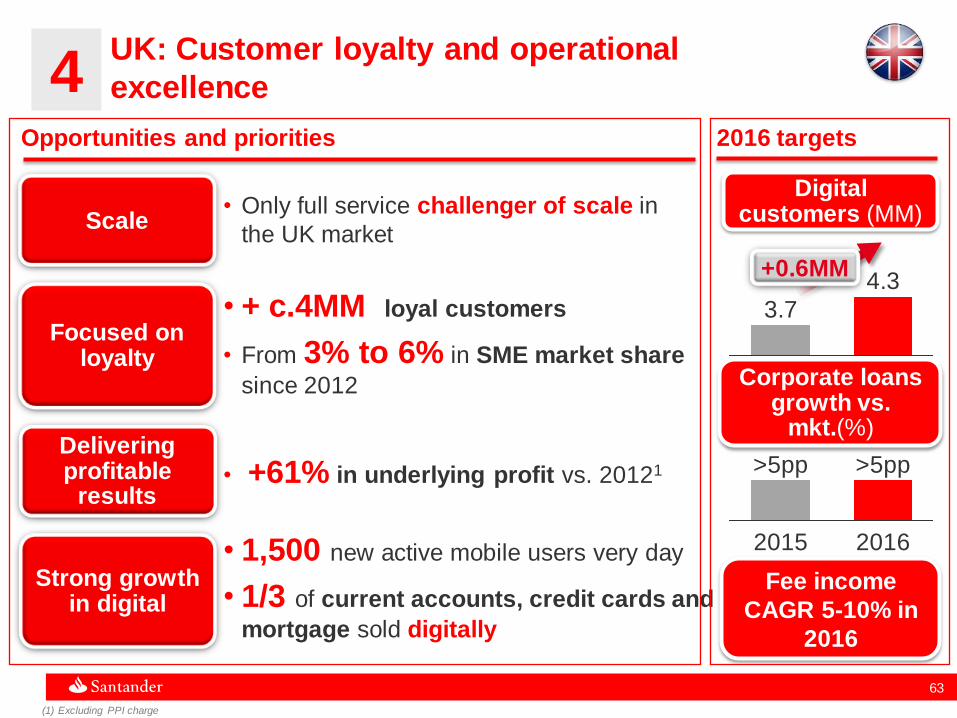
Opportunities and priorities 2016 targets
UK: Customer loyalty and operational
excellence
• Only full service challenger of scale in
the UK market
• l+61% in underlying profit vs. 20121
• + c.4MM loyal customers
• From 3% to 6% in SME market share
since 2012
• 1,500 new active mobile users very day
• 1/3 of current accounts, credit cards and
mortgage sold digitally
Scale
Focused on loyalty
Delivering profitable
results
Strong growth in digital
Digital customers (MM)
4.3
3.7
>5pp
2015 2016
>5pp
Corporate loans growth vs.
mkt.(%)
+0.6MM
(1) Excluding PPI charge
.
Fee income
CAGR 5-10% in
2016
4
64
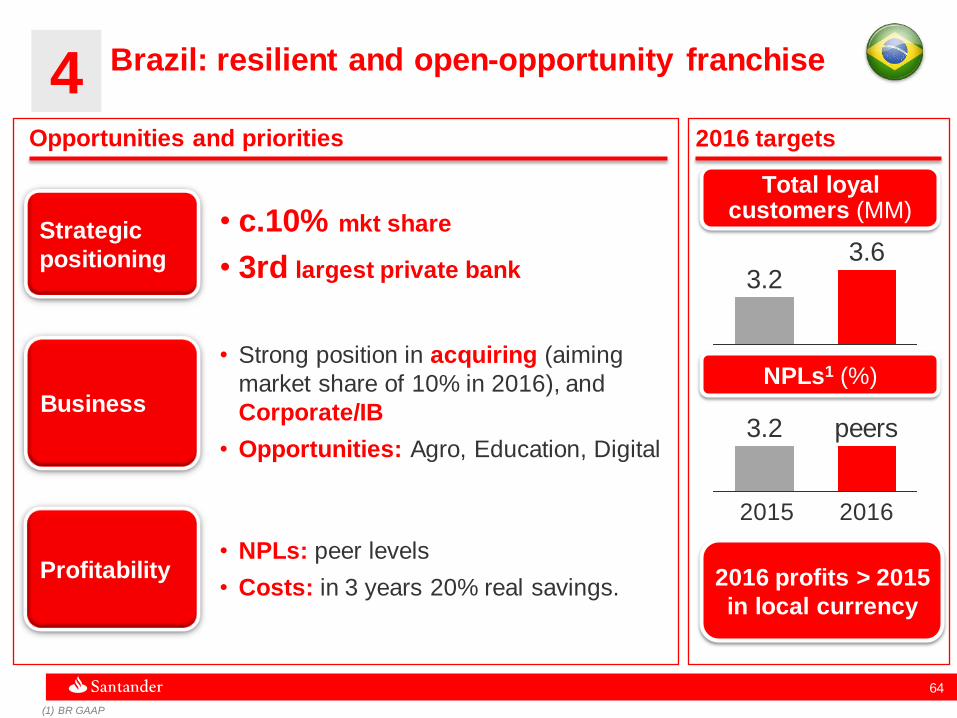
Total loyal customers (MM)
3.6 3.2
2016 targets Opportunities and priorities
NPLs1 (%)
4 Brazil: resilient and open-opportunity franchise
Strategic
positioning
2016 2015
• c.10% mkt share
• 3rd largest private bank
Business
• Strong position in acquiring (aiming
market share of 10% in 2016), and
Corporate/IB
• Opportunities: Agro, Education, Digital
Profitability • NPLs: peer levels
• Costs: in 3 years 20% real savings.
2016 profits > 2015
in local currency
(1) BR GAAP
.
3.2 peers
65
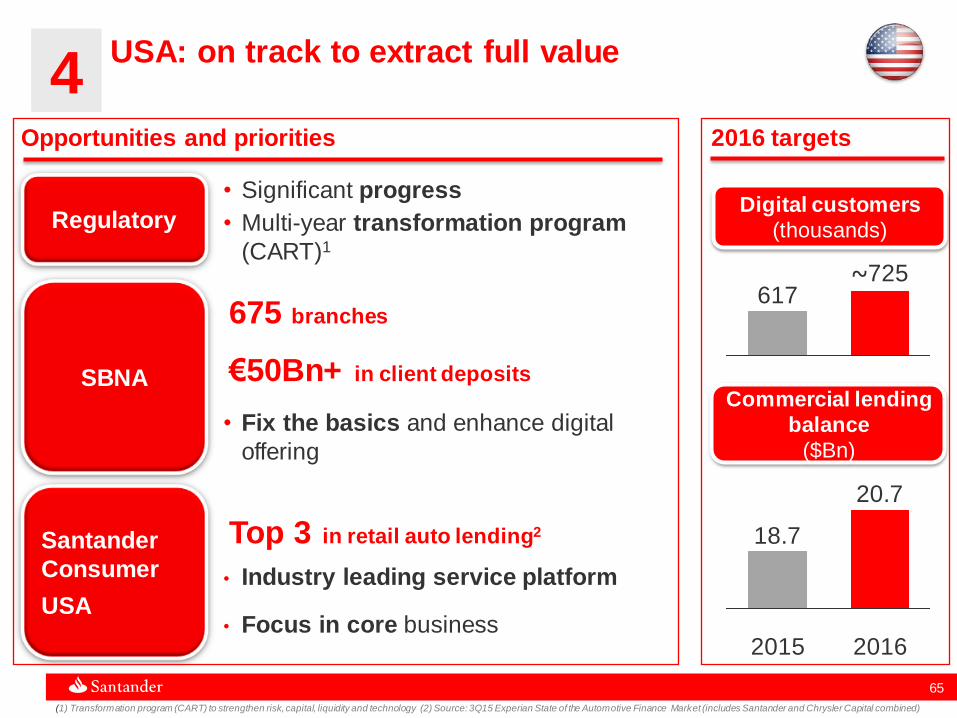
Opportunities and priorities 2016 targets
4 4 USA: on track to extract full value
Regulatory
Santander
Consumer
USA
SBNA
• Significant progress
• Multi-year transformation program
(CART)1
(1) Transformation program (CART) to strengthen risk, capital, liquidity and technology (2) Source: 3Q15 Experian State of the Automotive Finance Market (includes Santander and Chrysler Capital combined)
• Fix the basics and enhance digital
offering
675 branches
€50Bn+ in client deposits
Top 3 in retail auto lending2
• Industry leading service platform
• Focus in core business
Digital customers
(thousands)
~725 617
Commercial lending
balance
($Bn)
20.7
18.7
2015 2016

66
Active customers1
(MM)
Loan portfolio2 (Bn)
2016 targets
SCF: Maintain consumer finance
leadership at European level, achieving
profitable growth
4
17.0 16.8
2016 2015
87 77
Opportunities and priorities
Extend & maximise
captive car finance
Banque PSA
Finance
Boost consumer
finance business
• Increase active customers
• Extend pan-European top
retailers agreements
• Maximise value of the joint
ventures
(1) Customers with a current contract. Without SCUK and without PSA (including PSA: 17.4 MM. Investor Day reference) (2) Without SCUK
45%
C/I maintained in
2016 despite PSA
integration2

67
Loyal retail and commercial customers (MM)
Digital customers (MM)
Average SME and Corp. market share growth
Cost of risk (%)
+0.5 p.p. +9%
+21% improving
1513.8
1.25 20 16.6
Delivering on our 2016 targets will lead us to growing
EPS and DPS
2015 2016 2015 2016
2015 2016 2015 2016
68
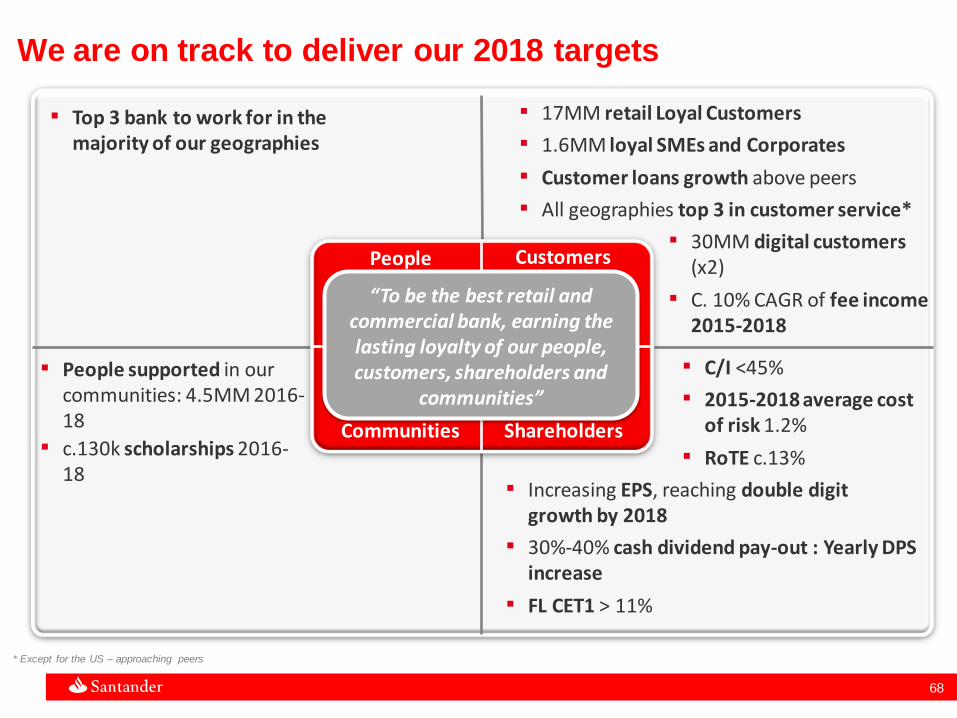
Customers
Shareholders Communities
People
▪ 17MM retail Loyal Customers
▪ 1.6MM loyal SMEs and Corporates
▪ Customer loans growth above peers
▪ All geographies top 3 in customer service*
▪ 30MM digital customers (x2)
▪ C. 10% CAGR of fee income 2015-2018
“To be the best retail and commercial bank, earning the lasting loyalty of our people, customers, shareholders and
communities”
▪ Top 3 bank to work for in the majority of our geographies
▪ People supported in our communities: 4.5MM 2016-18
▪ c.130k scholarships 2016-18
▪ C/I <45%
▪ 2015-2018 average cost of risk 1.2%
▪ RoTE c.13%
▪ Increasing EPS, reaching double digit growth by 2018
▪ 30%-40% cash dividend pay-out : Yearly DPS increase
▪ FL CET1 > 11%
* Except for the US – approaching peers
We are on track to deliver our 2018 targets

69
0.48€
47.0%
1.43%
9.65%
10.95%
20%
0,45€
47,6%
1,27%
10,15%
11,00%
38%
2015 results
2015 results show progress towards our targets
Underlying PBT & RoTE: in Constant Euros, excluding one-off charges (i.e. PPI and restructuring costs)
EPS: Underlying profit (including AT1s)/ av erage number of shares
FL CET1: 2014 including capital increase of January 2015
EPS
C/I
Average cost of
risk
FL CET1
Underlying RoTE
Cash dividend
pay-out
0.45€
47.6%
1.25%
10.05%
11.0%
38%
Shareholder targets 2014 results

70
In 2015 we began a transformation of our model centred around
our customers. We did this while achieving profitable growth and
delivering our commitments on ROTE, TNAV and capital
We are on track to achieve our targets for 2016 which will be
a year of ongoing optimization of our model and delivering
profitable growth to our shareholders
1
Key takeaways of the 2015 Earnings presentation
By 2018, as a result of our transformation, we will produce
higher quality and more predictable earnings than our peers.
We will increase TNAV/Share, DPS from 2016 and
reaching double digit EPS growth by 2018
2
3

Appendix
72 72
Global segments results
Appendix
Group balance sheet and results
Liquidity and funding
NPL and coverage ratios, and cost of credit
Quarterly income statements
Other geographic units results

Other geographic units results
74 74
2014 2015
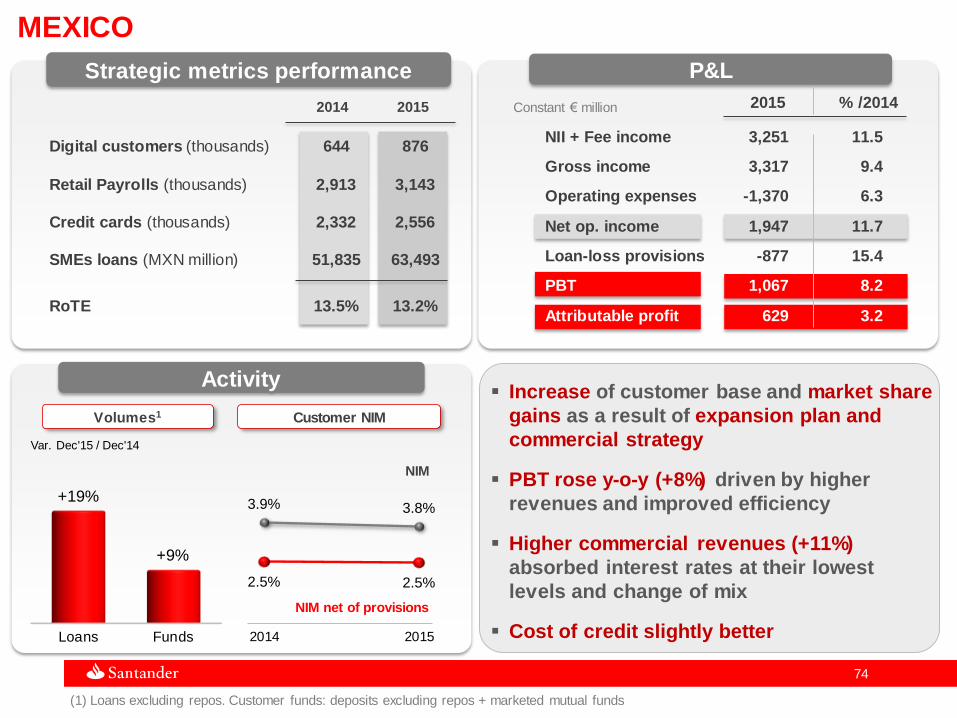
MEXICO
(1) Loans excluding repos. Customer funds: deposits excluding repos + marketed mutual funds
Activity
Volumes1 Customer NIM
3.9% 3.8%
2.5% 2.5%
2014 2015
NIM net of provisions
NIM
P&L
Constant € million 2015 % /2014
NII + Fee income 3,251 11.5
Gross income 3,317 9.4
Operating expenses -1,370 6.3
Net op. income 1,947 11.7
Loan-loss provisions -877 15.4
PBT 1,067 8.2
Attributable profit 629 3.2
Var. Dec'15 / Dec'14
Increase of customer base and market share
gains as a result of expansion plan and
commercial strategy
PBT rose y-o-y (+8%) driven by higher
revenues and improved efficiency
Higher commercial revenues (+11%)
absorbed interest rates at their lowest
levels and change of mix
Cost of credit slightly better Loans Funds
+19%
+9%
Digital customers (thousands) 644 876
Retail Payrolls (thousands) 2,913 3,143
Credit cards (thousands) 2,332 2,556
SMEs loans (MXN million) 51,835 63,493
RoTE 13.5% 13.2%
Strategic metrics performance

75 75
2014 2015
4.4%
3.8%
3.1% 2.6%
2014 2015
CHILE
(1) Loans excluding repos. Customer funds: deposits excluding repos + marketed mutual funds
(2) Unidad de Fomento
Activity
Volumes1 Customer NIM
5.7% 4.1%
UF inflation2
P&L
P&L
2015 % /2014
NII + Fee income 2,151 -0.2
Gross income 2,336 1.9
Operating expenses -1,004 10.8
Net op. income 1,332 -4.0
Loan-loss provisions -567 4.2
PBT 768 -6.1
Attributable profit 455 -12.5
Var. Dec'15 / Dec'14
NIM net of provisions
NIM
Improve rates of satisfaction, customer loyalty
and target segments
Profit affected by lower UF inflation and higher
taxes
Higher costs due to those indexed to forex,
salary rises and amortisations
The rise in provisions well below the growth in
loans
Loans Funds
+11% +9%
Retail loyal customers (thousands) 496 520
Loyal companies (thousands) 35 39
Digital customers (thousands) 836 918
Customer satisfaction (position) 4 4
RoTE 20.0% 15.5%
Strategic metrics performance
Constant € million

76 76
POLAND
(1) Loans excluding repos. Customer funds: deposits excluding repos + marketed mutual funds
Activity
Volumes1
Loans Funds
+11%
+4%
P&L
2015 % /2014
NII + Fee income 1,204 -5.2
Gross income 1,276 -7.3
Operating expenses -594 1.5
Net op. income 683 -13.7
Loan-loss provisions -167 -9.8
PBT 511 -17.1
Attributable profit 300 -15.4
Var. Dec'15 / Dec'14
5.1% 4.2%
1.7% 1.1%
2014 2015
Cost of deposits
Yield on loans
Customer NIM
A reference bank in innovation and digital
channels
Growth strategy in loans and deposits
profitability
Profit and revenues affected by lower interest
rates (Lombard rate limit), tougher regulation on
fees and extraordinary contribution to the DGF
Cost control and lower provisions with reduced
NPL ratio
2014 2015
Retail loyal customers(thousands) 1,157 1,242
Loyal companies (thousands) 53 60
Digital customers (thousands) 1,772 1,885
NPL ratio 7.4% 6.3%
RoTE 16.6% 12.9%
Strategic metrics performance
Constant € million
77 77
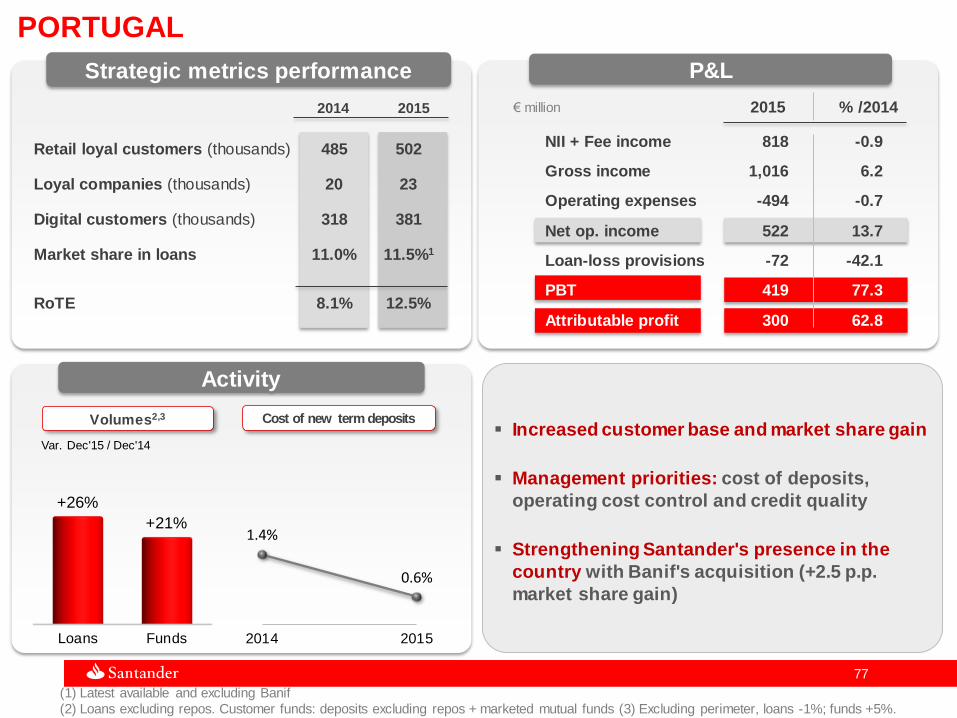
PORTUGAL
Activity
Volumes2,3
Increased customer base and market share gain
Management priorities: cost of deposits,
operating cost control and credit quality
Strengthening Santander's presence in the
country with Banif's acquisition (+2.5 p.p.
market share gain)
Cost of new term deposits
Loans Funds
+26%
+21%
P&L
€ million 2015 % /2014
NII + Fee income 818 -0.9
Gross income 1,016 6.2
Operating expenses -494 -0.7
Net op. income 522 13.7
Loan-loss provisions -72 -42.1
PBT 419 77.3
Attributable profit 300 62.8
Var. Dec'15 / Dec'14
2014 2015
Retail loyal customers (thousands) 485 502
Loyal companies (thousands) 20 23
Digital customers (thousands) 318 381
Market share in loans 11.0% 11.5%1
RoTE 8.1% 12.5%
Strategic metrics performance
(1) Latest available and excluding Banif
(2) Loans excluding repos. Customer funds: deposits excluding repos + marketed mutual funds (3) Excluding perimeter, loans -1%; funds +5%.
1.4%
0.6%
2014 2015

78 78
Focus on loyalty, transactions and target segments
Double-digit growth in volumes
Gross income driven by revenues growth
Argentina
Constant € million
Attributable profit
Uruguay Peru
2014 2015
310 378
2014 2015
51
70
2014 2015
24
32
+22% +38% +37%
OTHER LATIN AMERICAN COUNTRIES

79 79
€ billion
Total Balance Coverage ratio
D'15 and Dec'15 / Dec'14 change
€ million
P&L
2015 2014 % /2014
Gross income 137 -31 —
Operating expenses -235 -230 2.2
Provisions -511 -633 -19.3
Tax recovery 180 248 -27.6
Attributable profit -420 -652 -35.6
Reduction of loan exposures continued at a pace around 30%
Higher coverage ratio
Lower losses due to reduced provision needs
Activity
REAL ESTATE ACTIVITY SPAIN
+0.4 p.p.
Loans Foreclosures
56% 55%
+2.8 p.p.
Net foreclosures
Net loans
Other
D'14 D'15
2.6
3.7
14.0 15.8
3,9 3,9
3,7

Global Segments Results

81 81
The retail banking model continued to be transformed into an increasingly Simple, Personal
and Fair model
Customer-centred, developing specialised models, range of simple products and global offers
Further development of the multi-channel model, centred on digital channels
Progress in achieving our targets: 13.8 million loyal customers (+10% in 2015) and 16.6 million
digital customers (+17% in 2015)
€ billion
2014 2015
639
694 +9%*
2014 2015
673 714
+6%*
Net loans Deposits (excl. repos)
+ mutual funds
(*) +7% excluding fx impact (*) +8% excluding fx impact
P&L Activity
RETAIL BANKING
€ million
2015 %2014*
NII + Fee income 38,649 6.5
Gross income 40,359 6.2
Operating expenses -18,730 7.1
Net op. income 21,629 5.5
Loan-loss provisions -9,249 -4.9
PBT 10,629 12.2
Attributable profit 6,854 10.5
(*) % change excluding fx impact
82 82
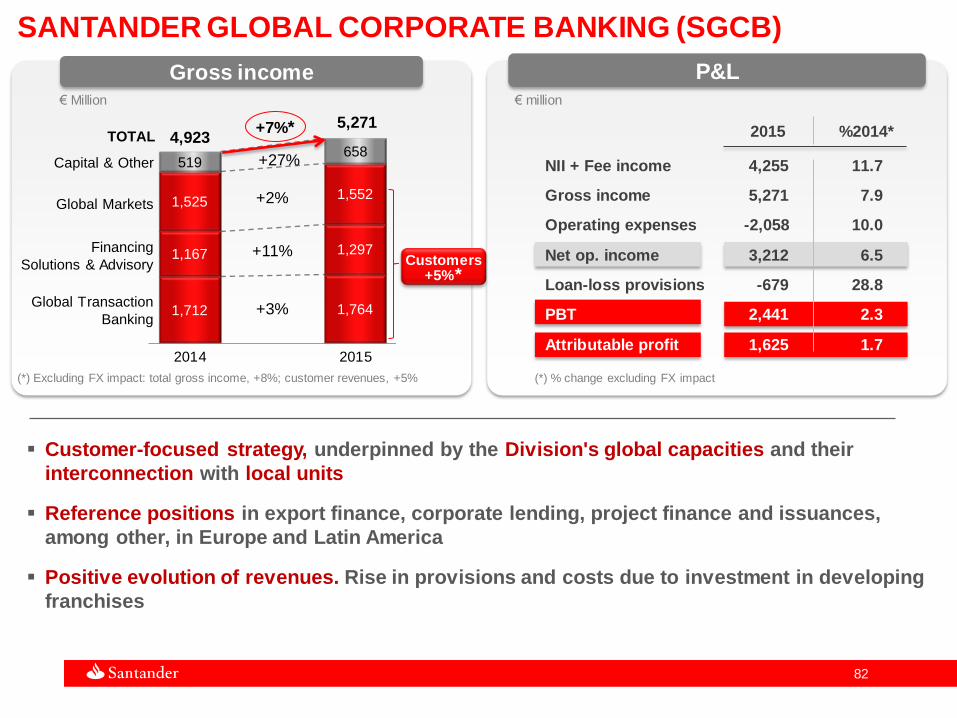
Customer-focused strategy, underpinned by the Division's global capacities and their
interconnection with local units
Reference positions in export finance, corporate lending, project finance and issuances,
among other, in Europe and Latin America
Positive evolution of revenues. Rise in provisions and costs due to investment in developing
franchises
P&L Gross income
SANTANDER GLOBAL CORPORATE BANKING (SGCB)
2015 %2014*
NII + Fee income 4,255 11.7
Gross income 5,271 7.9
Operating expenses -2,058 10.0
Net op. income 3,212 6.5
Loan-loss provisions -679 28.8
PBT 2,441 2.3
Attributable profit 1,625 1.7
(*) % change excluding FX impact
1,712 1,764
1,167 1,297
1,525 1,552
519 658
4,923 5,271
2014 2015
+7%*
+3%
+2%
+27%
TOTAL
Global Transaction
Banking
Global Markets
Capital & Other
+11%
(*) Excluding FX impact: total gross income, +8%; customer revenues, +5%
Financing
Solutions & Advisory
€ Million € million
Customers +5%*

Group Balance Sheet
and Results
84 84
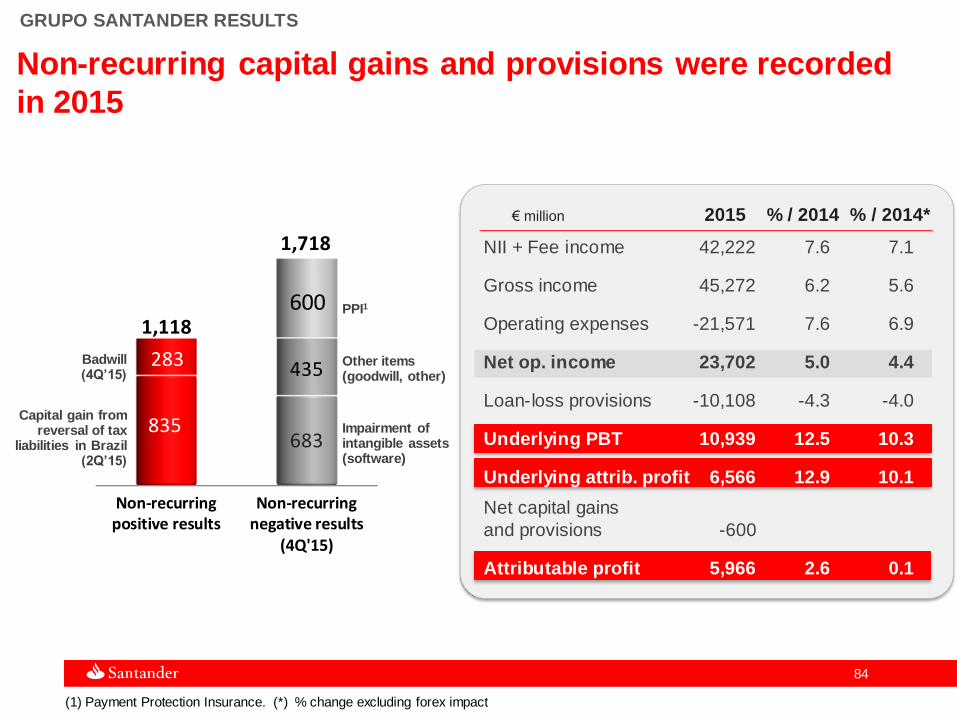
GRUPO SANTANDER RESULTS
(1) Payment Protection Insurance. (*) % change excluding forex impact
€ million 2015 % / 2014 % / 2014*
Non-recurring capital gains and provisions were recorded
in 2015
Non-recurringpositive results
Non-recurringnegative results
(4Q'15)
835 683
283 435
600 1,118
1,718
Impairment of intangible assets (software)
PPI1
Capital gain from reversal of tax
liabilities in Brazil (2Q’15)
Badwill (4Q’15)
Other items (goodwill, other)
NII + Fee income 42,222 7.6 7.1
Gross income 45,272 6.2 5.6
Operating expenses -21,571 7.6 6.9
Net op. income 23,702 5.0 4.4
Loan-loss provisions -10,108 -4.3 -4.0
Underlying PBT 10,939 12.5 10.3
Underlying attrib. profit 6,566 12.9 10.1
Net capital gains
and provisions -600
Attributable profit 5,966 2.6 0.1
85 85
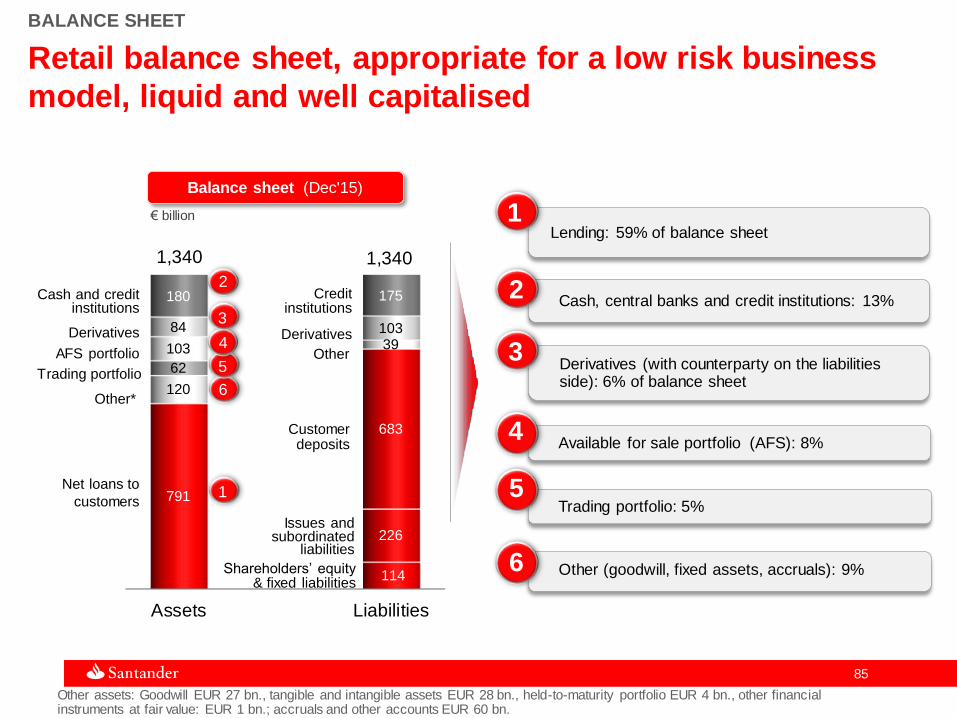
BALANCE SHEET
Balance sheet (Dec'15)
Retail balance sheet, appropriate for a low risk business
model, liquid and well capitalised
Other assets: Goodwill EUR 27 bn., tangible and intangible assets EUR 28 bn., held-to-maturity portfolio EUR 4 bn., other financial instruments at fair value: EUR 1 bn.; accruals and other accounts EUR 60 bn.
Lending: 59% of balance sheet
Derivatives (with counterparty on the liabilities side): 6% of balance sheet
Cash, central banks and credit institutions: 13%
Other (goodwill, fixed assets, accruals): 9%
Available for sale portfolio (AFS): 8%
Trading portfolio: 5%
1 € billion
Assets Liabilities
791
114
120
226
62
683
103 39
84 103
180 175
1,340 1,340
3
2
4
5
6
1
6
5
4
3
2
Trading portfolio
Other*
Net loans to
customers
Derivatives
Cash and credit institutions
AFS portfolio Other
Customer deposits
Credit institutions
Derivatives
Issues and subordinated
liabilities
Shareholders’ equity & fixed liabilities

Liquidity and funding
87 87
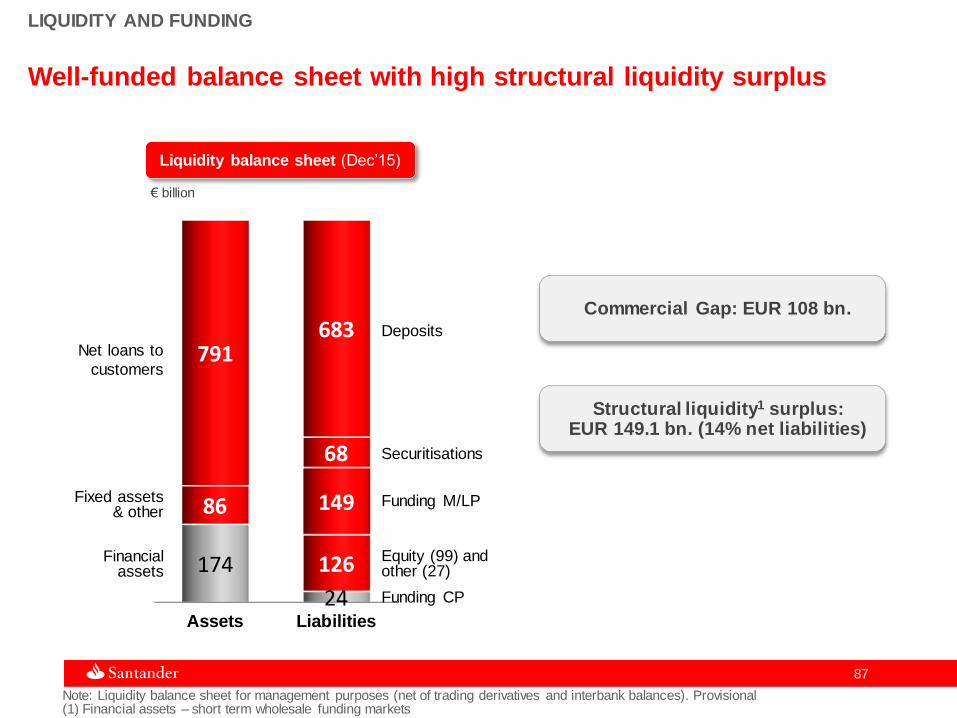
LIQUIDITY AND FUNDING
Liquidity balance sheet (Dec’15)
Well-funded balance sheet with high structural liquidity surplus
Note: Liquidity balance sheet for management purposes (net of trading derivatives and interbank balances). Provisional (1) Financial assets – short term wholesale funding markets
€ billion
Assets Liabilities
174
24
86
126
791
149
68
683 Deposits
Funding M/LP
Funding CP
Structural liquidity1 surplus: EUR 149.1 bn. (14% net liabilities)
Commercial Gap: EUR 108 bn.
Net loans to
customers
Financial assets
Fixed assets & other
Securitisations
Equity (99) and other (27)

88 88
LIQUIDITY AND FUNDING
Higher recourse to wholesale funding in 2015, backed by improved
market conditions: issuances outpaced maturities
(1) Placed in the market and including structured finance
Total
Issuances
€ billion
Diversified issuances – 2015
M/L term issuance
Securitisations1
Sterling area, 28%
Euro area, 33%
US$ area, 39%
2014 2015
13.4 14.4
38.3 45.8
51.7
60.2
NPL, coverage ratios
and cost of credit
90 90
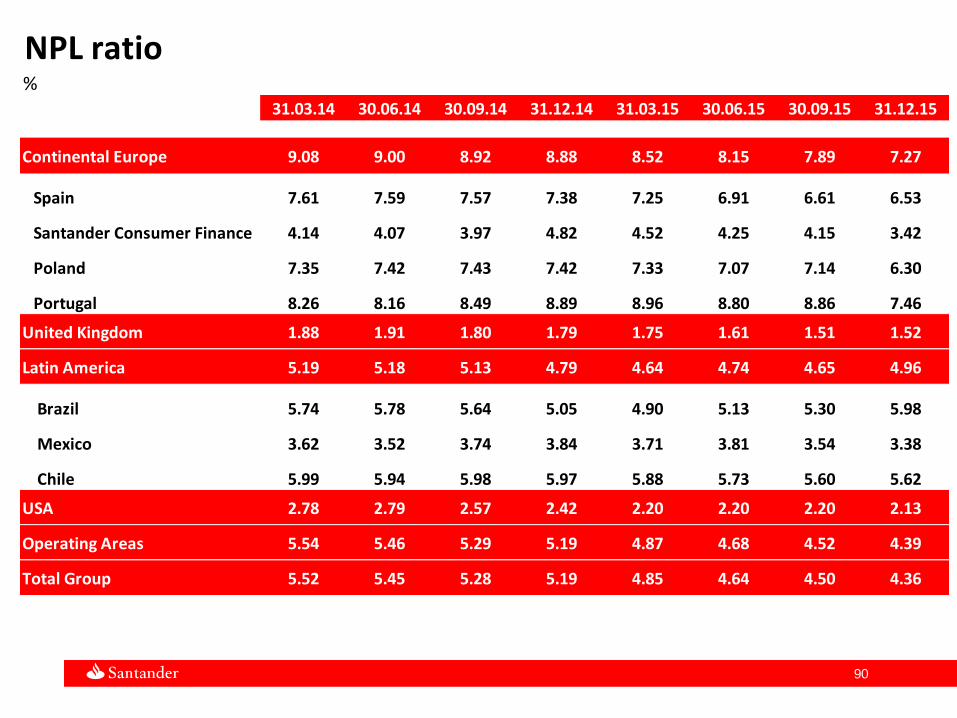
NPL ratio%
31.03.14 30.06.14 30.09.14 31.12.14 31.03.15 30.06.15 30.09.15 31.12.15
Continental Europe 9.08 9.00 8.92 8.88 8.52 8.15 7.89 7.27
Spain 7.61 7.59 7.57 7.38 7.25 6.91 6.61 6.53
Santander Consumer Finance 4.14 4.07 3.97 4.82 4.52 4.25 4.15 3.42
Poland 7.35 7.42 7.43 7.42 7.33 7.07 7.14 6.30
Portugal 8.26 8.16 8.49 8.89 8.96 8.80 8.86 7.46
United Kingdom 1.88 1.91 1.80 1.79 1.75 1.61 1.51 1.52
Latin America 5.19 5.18 5.13 4.79 4.64 4.74 4.65 4.96
Brazil 5.74 5.78 5.64 5.05 4.90 5.13 5.30 5.98
Mexico 3.62 3.52 3.74 3.84 3.71 3.81 3.54 3.38
Chile 5.99 5.94 5.98 5.97 5.88 5.73 5.60 5.62
USA 2.78 2.79 2.57 2.42 2.20 2.20 2.20 2.13
Operating Areas 5.54 5.46 5.29 5.19 4.87 4.68 4.52 4.39
Total Group 5.52 5.45 5.28 5.19 4.85 4.64 4.50 4.36
91 91
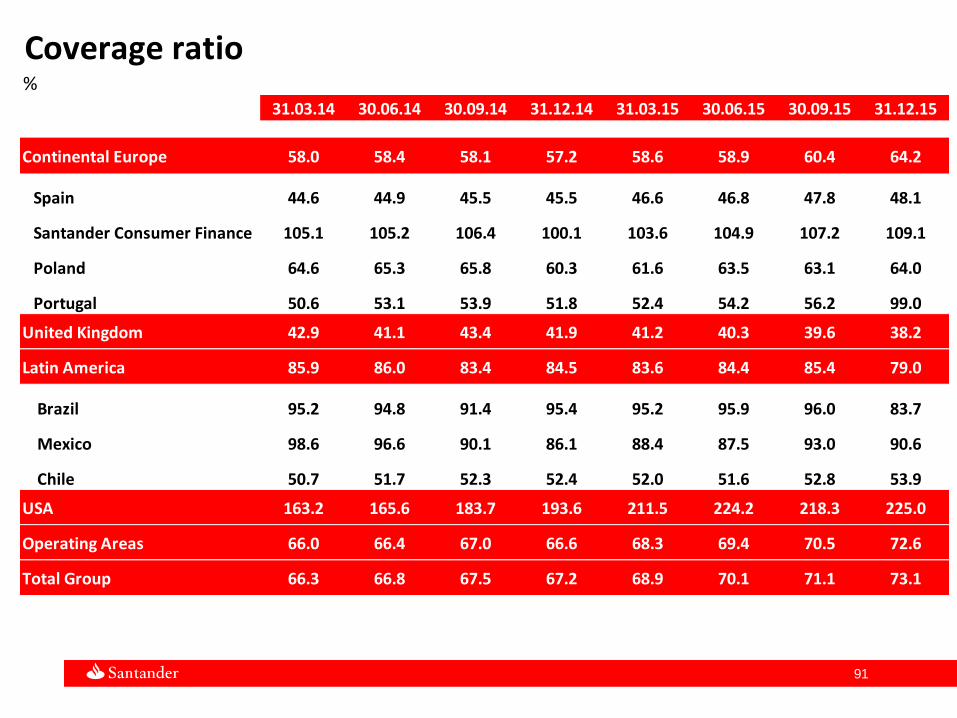
Coverage ratio%
31.03.14 30.06.14 30.09.14 31.12.14 31.03.15 30.06.15 30.09.15 31.12.15
Continental Europe 58.0 58.4 58.1 57.2 58.6 58.9 60.4 64.2
Spain 44.6 44.9 45.5 45.5 46.6 46.8 47.8 48.1
Santander Consumer Finance 105.1 105.2 106.4 100.1 103.6 104.9 107.2 109.1
Poland 64.6 65.3 65.8 60.3 61.6 63.5 63.1 64.0
Portugal 50.6 53.1 53.9 51.8 52.4 54.2 56.2 99.0
United Kingdom 42.9 41.1 43.4 41.9 41.2 40.3 39.6 38.2
Latin America 85.9 86.0 83.4 84.5 83.6 84.4 85.4 79.0
Brazil 95.2 94.8 91.4 95.4 95.2 95.9 96.0 83.7
Mexico 98.6 96.6 90.1 86.1 88.4 87.5 93.0 90.6
Chile 50.7 51.7 52.3 52.4 52.0 51.6 52.8 53.9
USA 163.2 165.6 183.7 193.6 211.5 224.2 218.3 225.0
Operating Areas 66.0 66.4 67.0 66.6 68.3 69.4 70.5 72.6
Total Group 66.3 66.8 67.5 67.2 68.9 70.1 71.1 73.1
92 92
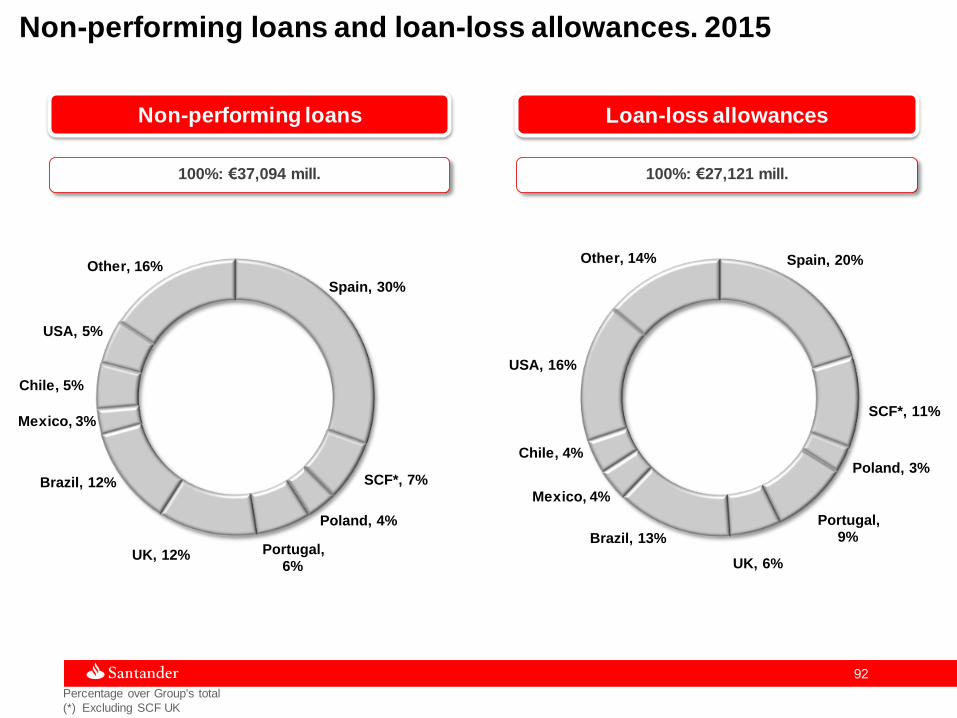
Percentage over Group's total
(*) Excluding SCF UK
Non-performing loans and loan-loss allowances. 2015
Non-performing loans Loan-loss allowances
Spain, 20%
SCF*, 11%
Poland, 3%
Portugal, 9%
UK, 6%
Brazil, 13%
Mexico, 4%
Chile, 4%
USA, 16%
Other, 14%
Spain, 30%
SCF*, 7%
Poland, 4%
Portugal, 6%
UK, 12%
Brazil, 12%
Mexico, 3%
Chile, 5%
USA, 5%
Other, 16%
100%: €37,094 mill. 100%: €27,121 mill.

93 93
Cost of credit = 12 month loan-loss provisions / average lending
Cost of credit%
31.03.14 30.06.14 30.09.14 31.12.14 31.03.15 30.06.15 30.09.15 31.12.15
Continental Europe 1.20 1.14 1.07 1.01 0.95 0.86 0.77 0.68
Spain 1.37 1.31 1.21 1.06 0.97 0.84 0.71 0.62
Santander Consumer Finance 0.89 0.87 0.85 0.90 0.93 0.91 0.87 0.77
Poland 0.98 0.92 0.95 1.04 1.00 1.00 0.96 0.87
Portugal 0.63 0.55 0.47 0.50 0.45 0.38 0.35 0.29
United Kingdom 0.23 0.22 0.19 0.14 0.11 0.08 0.04 0.03
Latin America 4.36 4.06 3.88 3.70 3.53 3.39 3.33 3.36
Brazil 5.82 5.38 5.14 4.91 4.63 4.45 4.40 4.50
Mexico 3.59 3.58 3.26 2.98 2.92 2.89 2.87 2.91
Chile 1.82 1.76 1.71 1.75 1.74 1.68 1.68 1.65
USA 2.82 3.03 3.27 3.31 3.25 3.39 3.36 3.66
Operating Areas 1.61 1.55 1.50 1.44 1.38 1.33 1.27 1.26
Total Group 1.65 1.56 1.52 1.43 1.38 1.32 1.26 1.25
94 94
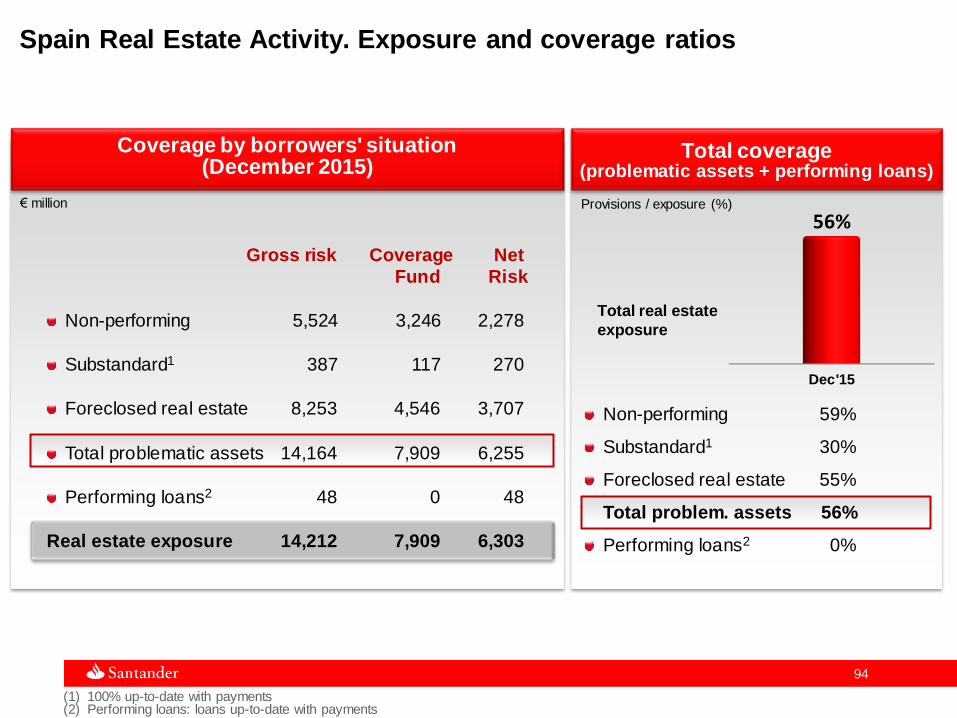
Dec'15
56%
Gross risk Coverage Net
Fund Risk
Non-performing 5,524 3,246 2,278
Substandard1 387 117 270
Foreclosed real estate 8,253 4,546 3,707
Total problematic assets 14,164 7,909 6,255
Performing loans2 48 0 48
Real estate exposure 14,212 7,909 6,303
Spain Real Estate Activity. Exposure and coverage ratios
(1) 100% up-to-date with payments (2) Performing loans: loans up-to-date with payments
Total real estate
exposure
Non-performing 59%
Substandard1 30%
Foreclosed real estate 55%
Total problem. assets 56%
Performing loans2 0%
Coverage by borrowers' situation (December 2015)
Total coverage
(problematic assets + performing loans)
€ million Provisions / exposure (%)
95 95
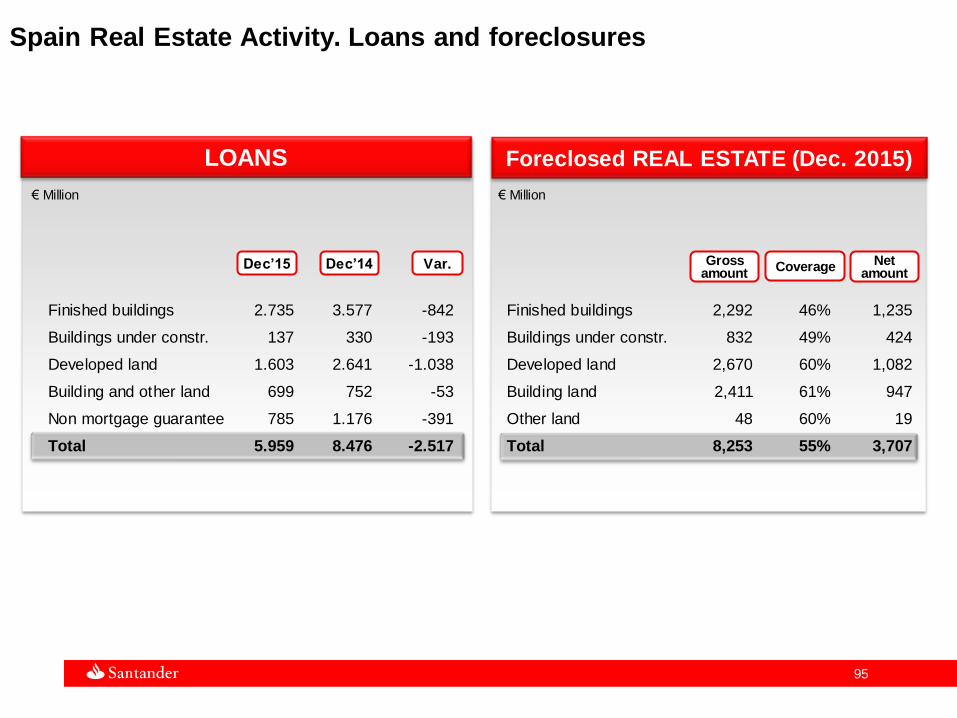
€ Million € Million
Dec’15 Dec’14 Var.
Spain Real Estate Activity. Loans and foreclosures
Finished buildings 2.735 3.577 -842
Buildings under constr. 137 330 -193
Developed land 1.603 2.641 -1.038
Building and other land 699 752 -53
Non mortgage guarantee 785 1.176 -391
Total 5.959 8.476 -2.517
Finished buildings 2,292 46% 1,235
Buildings under constr. 832 49% 424
Developed land 2,670 60% 1,082
Building land 2,411 61% 947
Other land 48 60% 19
Total 8,253 55% 3,707
LOANS Foreclosed REAL ESTATE (Dec. 2015)
Gross amount
Coverage Net amount
Quarterly P&L
97 97
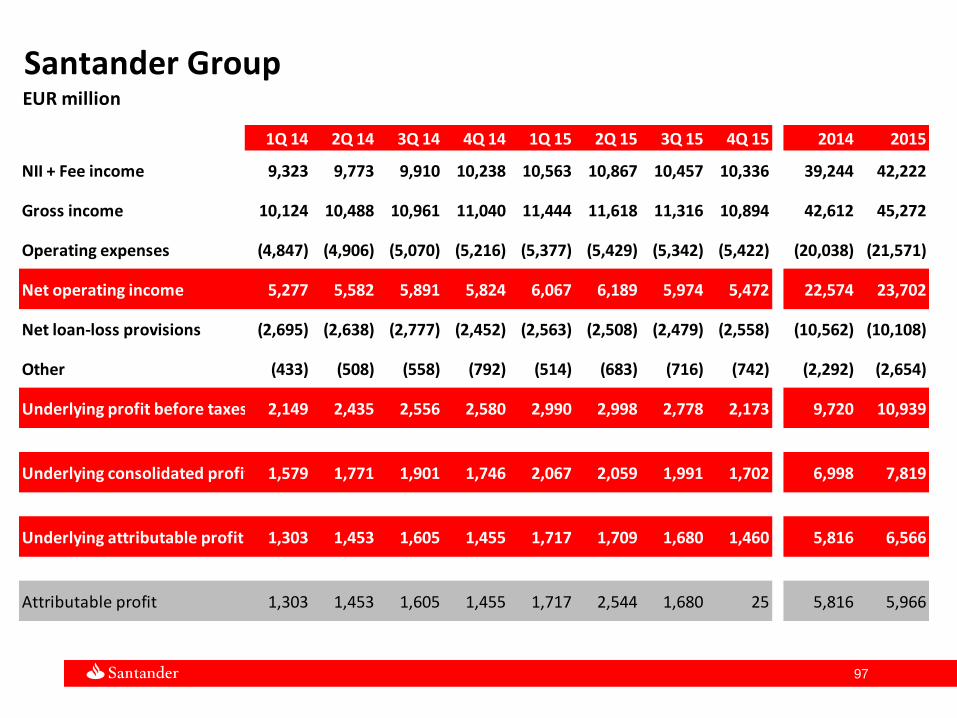
Santander GroupEUR million
1Q 14 2Q 14 3Q 14 4Q 14 1Q 15 2Q 15 3Q 15 4Q 15 2014 2015
NII + Fee income 9,323 9,773 9,910 10,238 10,563 10,867 10,457 10,336 39,244 42,222
Gross income 10,124 10,488 10,961 11,040 11,444 11,618 11,316 10,894 42,612 45,272
Operating expenses (4,847) (4,906) (5,070) (5,216) (5,377) (5,429) (5,342) (5,422) (20,038) (21,571)
Net operating income 5,277 5,582 5,891 5,824 6,067 6,189 5,974 5,472 22,574 23,702
Net loan-loss provisions (2,695) (2,638) (2,777) (2,452) (2,563) (2,508) (2,479) (2,558) (10,562) (10,108)
Other (433) (508) (558) (792) (514) (683) (716) (742) (2,292) (2,654)
Underlying profit before taxes 2,149 2,435 2,556 2,580 2,990 2,998 2,778 2,173 9,720 10,939
Underlying consolidated profit 1,579 1,771 1,901 1,746 2,067 2,059 1,991 1,702 6,998 7,819
Underlying attributable profit 1,303 1,453 1,605 1,455 1,717 1,709 1,680 1,460 5,816 6,566
Attributable profit 1,303 1,453 1,605 1,455 1,717 2,544 1,680 25 5,816 5,966
98 98
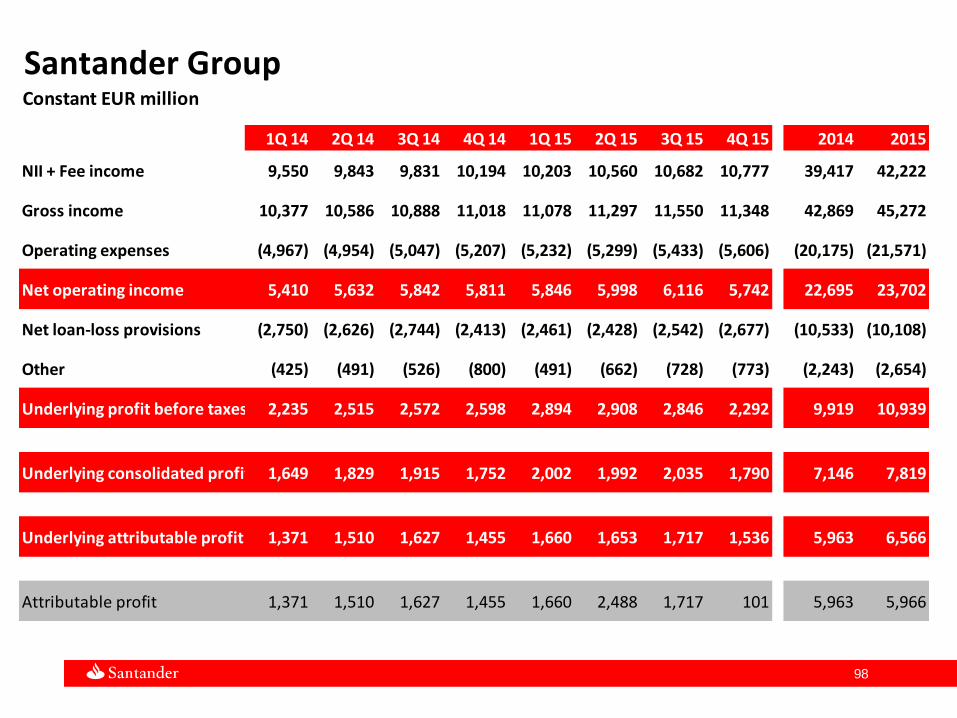
Santander GroupConstant EUR million
1Q 14 2Q 14 3Q 14 4Q 14 1Q 15 2Q 15 3Q 15 4Q 15 2014 2015
NII + Fee income 9,550 9,843 9,831 10,194 10,203 10,560 10,682 10,777 39,417 42,222
Gross income 10,377 10,586 10,888 11,018 11,078 11,297 11,550 11,348 42,869 45,272
Operating expenses (4,967) (4,954) (5,047) (5,207) (5,232) (5,299) (5,433) (5,606) (20,175) (21,571)
Net operating income 5,410 5,632 5,842 5,811 5,846 5,998 6,116 5,742 22,695 23,702
Net loan-loss provisions (2,750) (2,626) (2,744) (2,413) (2,461) (2,428) (2,542) (2,677) (10,533) (10,108)
Other (425) (491) (526) (800) (491) (662) (728) (773) (2,243) (2,654)
Underlying profit before taxes 2,235 2,515 2,572 2,598 2,894 2,908 2,846 2,292 9,919 10,939
Underlying consolidated profit 1,649 1,829 1,915 1,752 2,002 1,992 2,035 1,790 7,146 7,819
Underlying attributable profit 1,371 1,510 1,627 1,455 1,660 1,653 1,717 1,536 5,963 6,566
Attributable profit 1,371 1,510 1,627 1,455 1,660 2,488 1,717 101 5,963 5,966

99 99
Continental EuropeEUR million
1Q 14 2Q 14 3Q 14 4Q 14 1Q 15 2Q 15 3Q 15 4Q 15 2014 2015
NII + Fee income 2,699 2,779 2,707 2,831 2,899 2,884 2,842 2,798 11,017 11,423
Gross income 3,029 3,146 3,080 3,249 3,409 3,218 3,253 2,950 12,504 12,830
Operating expenses (1,634) (1,611) (1,584) (1,614) (1,670) (1,679) (1,689) (1,699) (6,444) (6,736)
Net operating income 1,394 1,534 1,496 1,635 1,739 1,539 1,564 1,251 6,059 6,093
Net loan-loss provisions (791) (770) (737) (583) (637) (512) (495) (331) (2,880) (1,975)
Other (197) (215) (188) (93) (139) (186) (137) (291) (693) (753)
Profit before taxes 407 550 571 959 963 842 932 629 2,486 3,366
Consolidated profit 318 415 425 663 712 625 690 452 1,821 2,479
Attributable profit 284 378 381 604 640 560 625 393 1,648 2,218

100 100
SpainEUR million
1Q 14 2Q 14 3Q 14 4Q 14 1Q 15 2Q 15 3Q 15 4Q 15 2014 2015
NII + Fee income 1,339 1,375 1,334 1,373 1,371 1,296 1,251 1,199 5,420 5,118
Gross income 1,620 1,665 1,661 1,690 1,749 1,522 1,571 1,238 6,636 6,080
Operating expenses (897) (877) (859) (863) (855) (856) (863) (860) (3,496) (3,434)
Net operating income 722 788 802 827 894 666 708 379 3,140 2,646
Net loan-loss provisions (507) (488) (429) (320) (366) (264) (205) (156) (1,745) (992)
Other (41) (63) (18) (89) (44) (71) (58) (89) (212) (263)
Profit before taxes 174 237 354 417 483 331 444 134 1,183 1,392
Consolidated profit 122 166 252 293 345 238 317 99 833 999
Attributable profit 120 166 252 289 340 232 311 94 827 977

101 101
Santander Consumer FinanceEUR million
1Q 14 2Q 14 3Q 14 4Q 14 1Q 15 2Q 15 3Q 15 4Q 15 2014 2015
NII + Fee income 776 801 801 832 949 990 1,011 1,022 3,209 3,973
Gross income 776 805 800 843 959 991 1,018 998 3,224 3,965
Operating expenses (370) (361) (358) (379) (422) (442) (443) (467) (1,468) (1,774)
Net operating income 406 444 442 465 537 549 575 530 1,756 2,192
Net loan-loss provisions (130) (123) (149) (143) (168) (131) (142) (97) (544) (537)
Other (14) (17) (71) 65 (22) (36) (44) (50) (37) (152)
Profit before taxes 263 304 222 387 348 382 389 383 1,175 1,502
Consolidated profit 198 220 160 256 251 272 281 271 834 1,076
Attributable profit 192 213 146 245 220 241 242 236 795 938

102 102
PolandEUR million
1Q 14 2Q 14 3Q 14 4Q 14 1Q 15 2Q 15 3Q 15 4Q 15 2014 2015
NII + Fee income 317 328 322 302 291 301 300 311 1,269 1,204
Gross income 334 353 335 353 340 336 309 292 1,376 1,276
Operating expenses (148) (149) (144) (144) (151) (153) (146) (143) (585) (594)
Net operating income 187 204 191 209 190 182 162 149 791 683
Net loan-loss provisions (43) (42) (44) (57) (39) (46) (39) (44) (186) (167)
Other (3) (16) 8 22 (1) (2) 3 (4) 11 (4)
Profit before taxes 141 146 155 174 150 135 125 101 616 511
Consolidated profit 115 119 122 126 122 112 99 77 482 410
Attributable profit 84 87 91 93 89 82 73 57 355 300

103 103
PolandPLN million
1Q 14 2Q 14 3Q 14 4Q 14 1Q 15 2Q 15 3Q 15 4Q 15 2014 2015
NII + Fee income 1,327 1,367 1,344 1,271 1,220 1,232 1,255 1,327 5,309 5,034
Gross income 1,399 1,471 1,400 1,487 1,427 1,371 1,293 1,247 5,756 5,338
Operating expenses (618) (621) (603) (606) (632) (626) (614) (611) (2,448) (2,484)
Net operating income 781 850 797 880 794 745 679 636 3,308 2,855
Net loan-loss provisions (180) (174) (184) (238) (164) (187) (164) (186) (776) (700)
Other (12) (66) 33 90 (3) (9) 11 (16) 45 (17)
Profit before taxes 589 609 646 732 627 549 526 435 2,577 2,137
Consolidated profit 479 496 508 533 512 456 416 331 2,016 1,715
Attributable profit 352 362 379 393 372 333 306 245 1,485 1,256
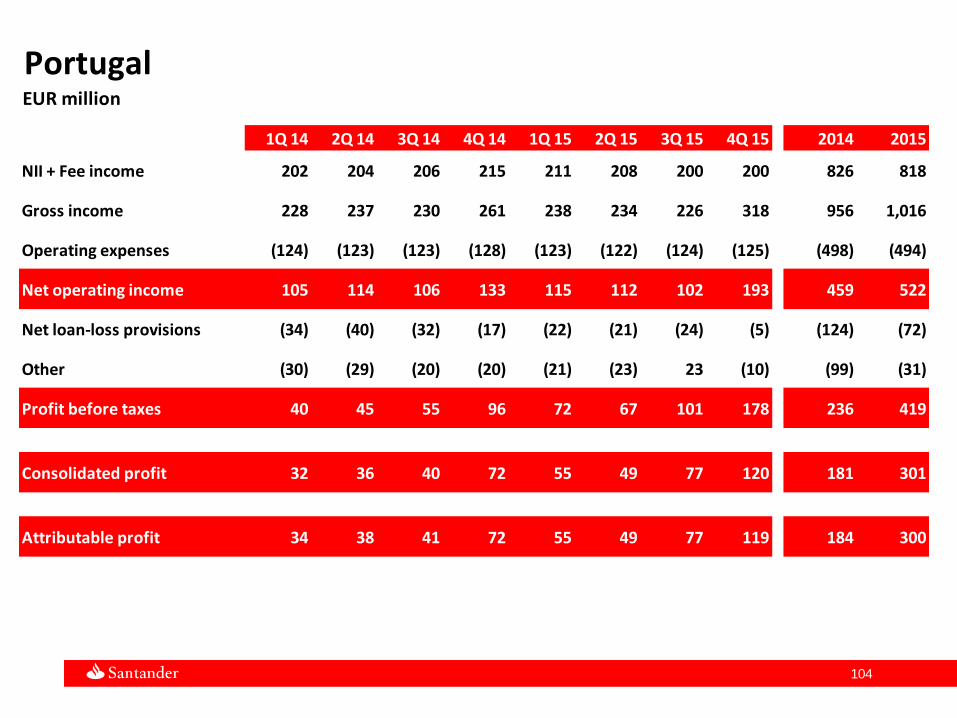
104 104
PortugalEUR million
1Q 14 2Q 14 3Q 14 4Q 14 1Q 15 2Q 15 3Q 15 4Q 15 2014 2015
NII + Fee income 202 204 206 215 211 208 200 200 826 818
Gross income 228 237 230 261 238 234 226 318 956 1,016
Operating expenses (124) (123) (123) (128) (123) (122) (124) (125) (498) (494)
Net operating income 105 114 106 133 115 112 102 193 459 522
Net loan-loss provisions (34) (40) (32) (17) (22) (21) (24) (5) (124) (72)
Other (30) (29) (20) (20) (21) (23) 23 (10) (99) (31)
Profit before taxes 40 45 55 96 72 67 101 178 236 419
Consolidated profit 32 36 40 72 55 49 77 120 181 301
Attributable profit 34 38 41 72 55 49 77 119 184 300

105 105
United KingdomGBP million
1Q 14 2Q 14 3Q 14 4Q 14 1Q 15 2Q 15 3Q 15 4Q 15 2014 2015
NII + Fee income 1,023 1,045 1,070 1,101 1,100 1,110 1,092 1,076 4,240 4,377
Gross income 1,100 1,105 1,124 1,136 1,152 1,173 1,150 1,155 4,464 4,630
Operating expenses (580) (578) (585) (609) (612) (608) (605) (610) (2,351) (2,435)
Net operating income 520 527 539 527 540 565 545 545 2,113 2,195
Net loan-loss provisions (99) (71) (70) (27) (56) (12) 6 (15) (268) (78)
Other (38) (51) (58) (108) (41) (36) (94) (85) (256) (257)
Profit before taxes 382 405 411 392 443 516 457 444 1,589 1,860
Consolidated profit 307 321 322 305 356 401 350 350 1,254 1,457
Attributable profit 307 321 322 305 350 394 343 343 1,254 1,430
106 106
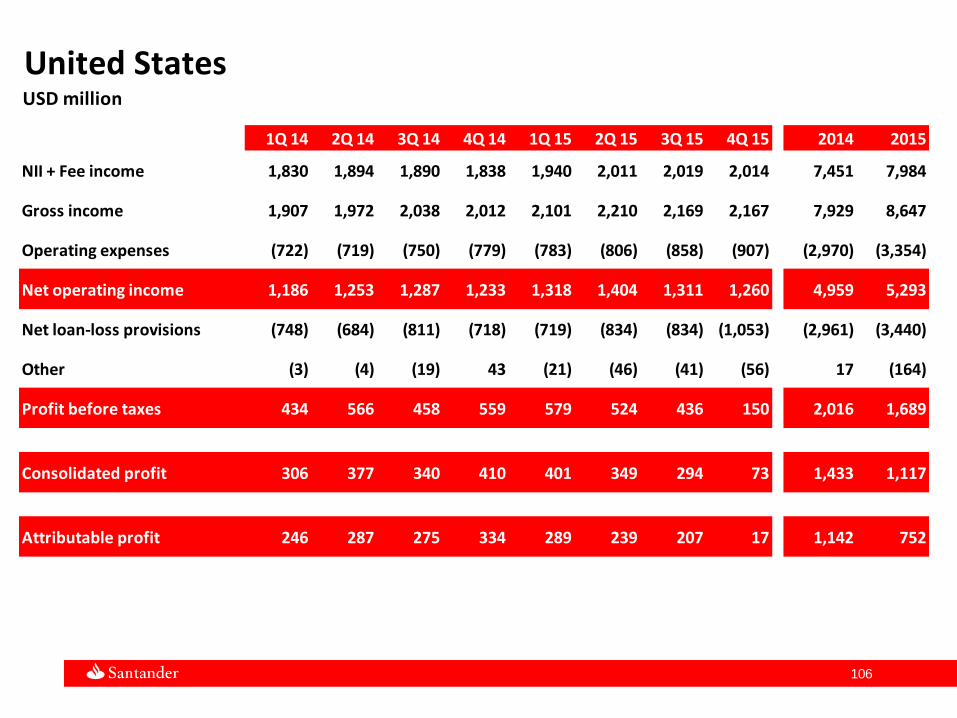
United StatesUSD million
1Q 14 2Q 14 3Q 14 4Q 14 1Q 15 2Q 15 3Q 15 4Q 15 2014 2015
NII + Fee income 1,830 1,894 1,890 1,838 1,940 2,011 2,019 2,014 7,451 7,984
Gross income 1,907 1,972 2,038 2,012 2,101 2,210 2,169 2,167 7,929 8,647
Operating expenses (722) (719) (750) (779) (783) (806) (858) (907) (2,970) (3,354)
Net operating income 1,186 1,253 1,287 1,233 1,318 1,404 1,311 1,260 4,959 5,293
Net loan-loss provisions (748) (684) (811) (718) (719) (834) (834) (1,053) (2,961) (3,440)
Other (3) (4) (19) 43 (21) (46) (41) (56) 17 (164)
Profit before taxes 434 566 458 559 579 524 436 150 2,016 1,689
Consolidated profit 306 377 340 410 401 349 294 73 1,433 1,117
Attributable profit 246 287 275 334 289 239 207 17 1,142 752
107 107
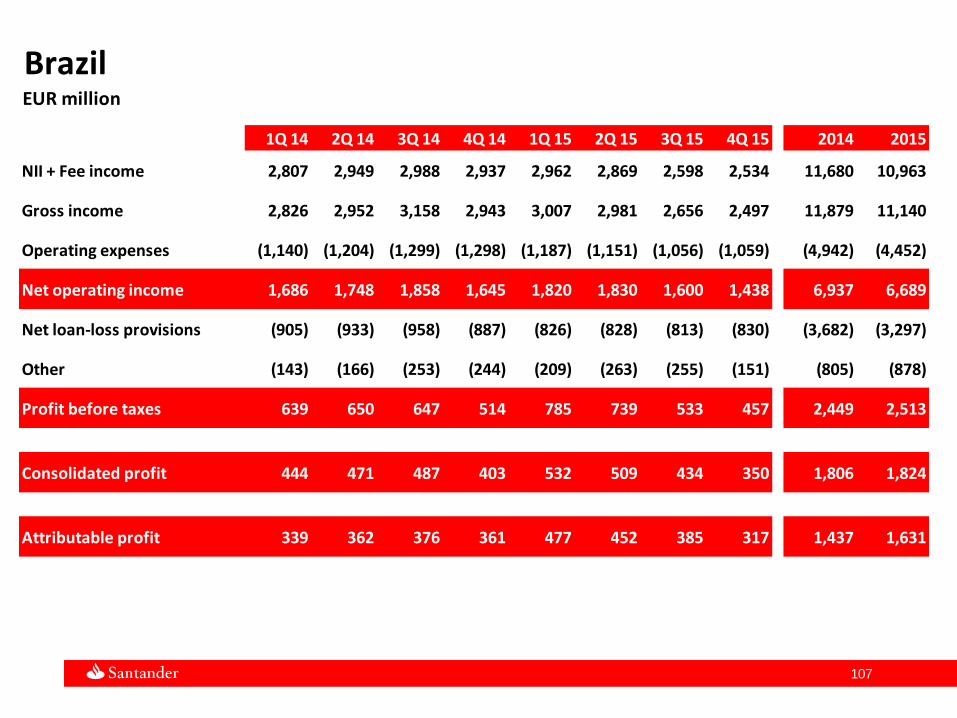
BrazilEUR million
1Q 14 2Q 14 3Q 14 4Q 14 1Q 15 2Q 15 3Q 15 4Q 15 2014 2015
NII + Fee income 2,807 2,949 2,988 2,937 2,962 2,869 2,598 2,534 11,680 10,963
Gross income 2,826 2,952 3,158 2,943 3,007 2,981 2,656 2,497 11,879 11,140
Operating expenses (1,140) (1,204) (1,299) (1,298) (1,187) (1,151) (1,056) (1,059) (4,942) (4,452)
Net operating income 1,686 1,748 1,858 1,645 1,820 1,830 1,600 1,438 6,937 6,689
Net loan-loss provisions (905) (933) (958) (887) (826) (828) (813) (830) (3,682) (3,297)
Other (143) (166) (253) (244) (209) (263) (255) (151) (805) (878)
Profit before taxes 639 650 647 514 785 739 533 457 2,449 2,513
Consolidated profit 444 471 487 403 532 509 434 350 1,806 1,824
Attributable profit 339 362 376 361 477 452 385 317 1,437 1,631

108 108
BrazilR$ million
1Q 14 2Q 14 3Q 14 4Q 14 1Q 15 2Q 15 3Q 15 4Q 15 2014 2015
NII + Fee income 9,092 9,017 8,988 9,324 9,522 9,736 10,129 10,570 36,420 39,958
Gross income 9,156 9,026 9,514 9,344 9,666 10,109 10,362 10,468 37,040 40,605
Operating expenses (3,694) (3,684) (3,917) (4,116) (3,815) (3,904) (4,110) (4,396) (15,410) (16,225)
Net operating income 5,462 5,343 5,597 5,228 5,851 6,205 6,251 6,072 21,630 24,379
Net loan-loss provisions (2,930) (2,850) (2,882) (2,818) (2,657) (2,808) (3,138) (3,415) (11,481) (12,017)
Other (462) (508) (770) (772) (672) (888) (975) (667) (2,511) (3,201)
Profit before taxes 2,070 1,985 1,945 1,638 2,523 2,509 2,139 1,990 7,638 9,161
Consolidated profit 1,440 1,442 1,466 1,283 1,711 1,726 1,704 1,509 5,630 6,650
Attributable profit 1,098 1,106 1,132 1,146 1,534 1,536 1,514 1,362 4,482 5,946

109 109
MexicoEUR million
1Q 14 2Q 14 3Q 14 4Q 14 1Q 15 2Q 15 3Q 15 4Q 15 2014 2015
NII + Fee income 688 706 741 768 791 834 794 832 2,903 3,251
Gross income 701 760 778 780 819 854 794 850 3,019 3,317
Operating expenses (312) (317) (325) (328) (355) (353) (327) (334) (1,282) (1,370)
Net operating income 389 442 453 452 463 501 467 516 1,736 1,947
Net loan-loss provisions (179) (191) (210) (177) (211) (224) (227) (215) (756) (877)
Other (2) (2) 6 (1) 8 (2) 1 (10) 2 (4)
Profit before taxes 209 250 249 274 260 274 241 291 982 1,067
Consolidated profit 166 200 204 228 201 213 193 224 797 831
Attributable profit 126 154 154 172 153 160 143 173 606 629
110 110
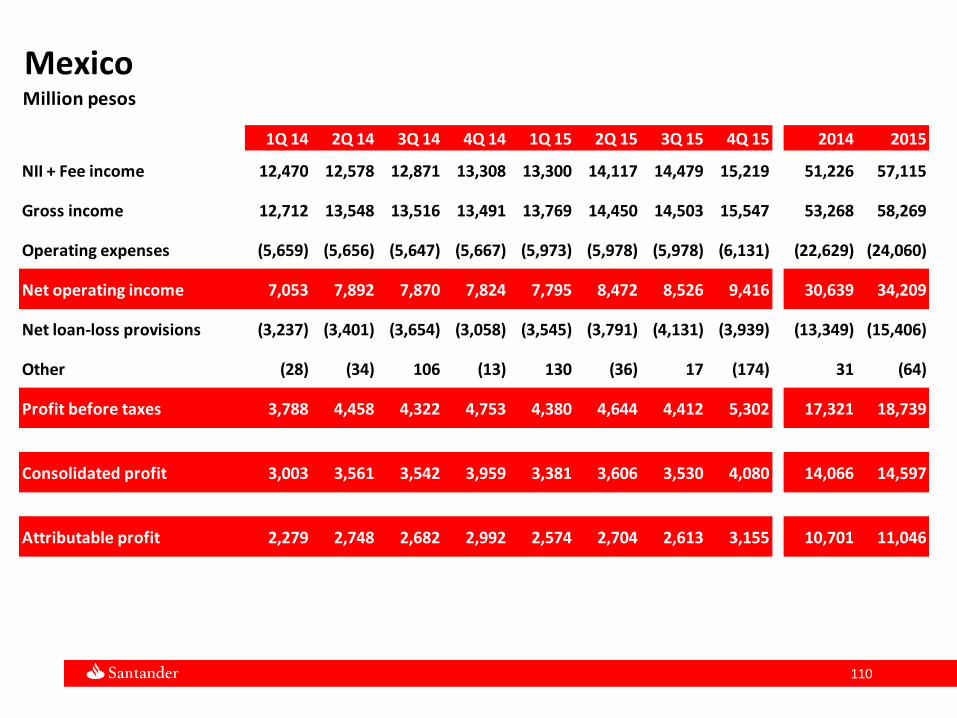
MexicoMillion pesos
1Q 14 2Q 14 3Q 14 4Q 14 1Q 15 2Q 15 3Q 15 4Q 15 2014 2015
NII + Fee income 12,470 12,578 12,871 13,308 13,300 14,117 14,479 15,219 51,226 57,115
Gross income 12,712 13,548 13,516 13,491 13,769 14,450 14,503 15,547 53,268 58,269
Operating expenses (5,659) (5,656) (5,647) (5,667) (5,973) (5,978) (5,978) (6,131) (22,629) (24,060)
Net operating income 7,053 7,892 7,870 7,824 7,795 8,472 8,526 9,416 30,639 34,209
Net loan-loss provisions (3,237) (3,401) (3,654) (3,058) (3,545) (3,791) (4,131) (3,939) (13,349) (15,406)
Other (28) (34) 106 (13) 130 (36) 17 (174) 31 (64)
Profit before taxes 3,788 4,458 4,322 4,753 4,380 4,644 4,412 5,302 17,321 18,739
Consolidated profit 3,003 3,561 3,542 3,959 3,381 3,606 3,530 4,080 14,066 14,597
Attributable profit 2,279 2,748 2,682 2,992 2,574 2,704 2,613 3,155 10,701 11,046

111 111
ChileEUR million
1Q 14 2Q 14 3Q 14 4Q 14 1Q 15 2Q 15 3Q 15 4Q 15 2014 2015
NII + Fee income 489 525 470 577 485 593 554 519 2,062 2,151
Gross income 532 550 504 608 553 633 606 543 2,194 2,336
Operating expenses (204) (213) (220) (229) (238) (263) (243) (260) (866) (1,004)
Net operating income 328 336 284 379 316 370 364 283 1,327 1,332
Net loan-loss provisions (116) (118) (131) (156) (132) (126) (153) (157) (521) (567)
Other (7) (3) 3 (18) 6 (3) (4) 4 (24) 3
Profit before taxes 206 216 156 205 190 241 207 130 783 768
Consolidated profit 173 189 132 234 147 212 182 113 728 655
Attributable profit 120 129 89 160 106 147 125 78 498 455

112 112
ChileCh$ billion
1Q 14 2Q 14 3Q 14 4Q 14 1Q 15 2Q 15 3Q 15 4Q 15 2014 2015
NII + Fee income 369.5 399.2 359.3 432.0 340.6 405.7 414.4 396.5 1,560.0 1,557.2
Gross income 402.0 417.9 385.6 454.5 388.8 432.5 453.8 415.9 1,660.0 1,691.0
Operating expenses (154.0) (162.2) (168.3) (171.1) (167.0) (179.8) (182.1) (197.7) (655.5) (726.6)
Net operating income 248.0 255.7 217.3 283.5 221.9 252.7 271.7 218.2 1,004.5 964.5
Net loan-loss provisions (87.7) (89.6) (100.0) (116.6) (92.5) (86.0) (113.4) (118.6) (393.9) (410.5)
Other (5.1) (2.0) 2.1 (13.4) 4.3 (2.0) (2.9) 2.8 (18.4) 2.2
Profit before taxes 155.3 164.1 119.4 153.4 133.8 164.7 155.3 102.5 592.2 556.2
Consolidated profit 131.0 143.3 101.5 175.3 103.5 145.5 136.1 88.9 551.1 474.0
Attributable profit 90.9 98.1 68.3 119.7 74.5 100.7 93.5 61.0 377.1 329.8

113 113
Corporate CentreEUR million
1Q 14 2Q 14 3Q 14 4Q 14 1Q 15 2Q 15 3Q 15 4Q 15 2014 2015
NII + Fee income (240) (158) (116) (132) (222) (138) (139) (142) (646) (641)
Gross income (25) (83) 117 23 (230) (177) (56) (32) 32 (495)
Operating expenses (144) (146) (146) (149) (142) (150) (142) (112) (586) (547)
Net operating income (170) (229) (29) (126) (372) (327) (199) (144) (554) (1,042)
Net loan-loss provisions 2 (2) 0 2 (1) 2 (1) 26 2 27
Other (27) (48) (53) (325) (98) (132) (148) (130) (453) (507)
Underlying profit before taxes (195) (278) (82) (449) (470) (457) (348) (247) (1,004) (1,523)
Underlying consolidated profit (187) (265) (111) (588) (465) (489) (392) (117) (1,152) (1,464)
Underlying attributable profit (187) (265) (111) (588) (491) (489) (395) (119) (1,151) (1,493)
Attributable profit (187) (265) (111) (588) (491) 346 (395) (1,554) (1,151) (2,093)
Our purpose is to help people and
businesses prosper.
Our culture is based on the belief that
everything we do should be
Thank you