2015 employee satisfaction survey results · pdf filejob satisfaction is a priority of the...
TRANSCRIPT
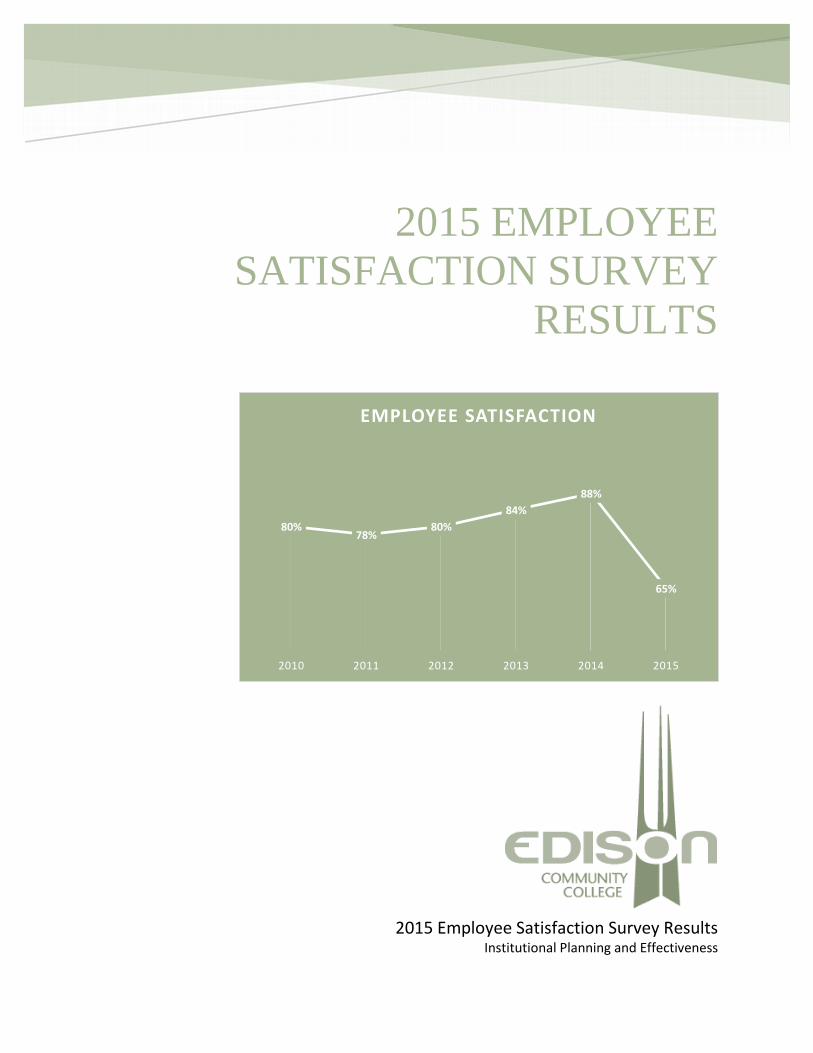
2015 EMPLOYEE
SATISFACTION SURVEY
RESULTS
2015 Employee Satisfaction Survey Results Institutional Planning and Effectiveness
80%78%
80%
84%
88%
65%
2010 2011 2012 2013 2014 2015
EMPLOYEE SATISFACTION

2015 Employee Satisfaction Survey Results 1 | P a g e
2015 Employee Satisfaction Survey Results
Edison Community College annually seeks the responses of its employees through an online survey
measuring employee satisfaction level based on 72 statements. All permanent, full- and part-time
employees, and adjunct faculty who are currently teaching are solicited for the survey, managed through
the Office of Institutional Planning and Effectiveness.
Results The results for the 2015 Employee Satisfaction Survey are presented here.
Survey Instrument The current survey, based on the Malcom Baldrige “Are We Making Progress,” has been in place since
2010. Prior to then, a similarly-stated survey was delivered however the rating scale was significantly
different. The request to participate in the online survey is delivered to employees, by employment
classification, through their Edison email account, with the link to the survey included in the message.
The online survey is anonymous with results reported by employment classification as well as in
aggregate. Employees are asked to indicate their agreement with 72 statements using a five-point scale.
Strongly Agree Agree Neither Agree
nor Disagree Disagree
Strongly
Disagree
The 72 statements are divided into sections under the Baldrige captions of:
Leadership: Leadership examines how Edison's senior leaders’ actions guide and sustain our
organization
Measurement, Analysis, and Knowledge Management: Measurement, Analysis, and
Knowledge Management examines how Edison selects, gathers, analyzes, manages, and improves
its data, information, and knowledge assets and reviews findings to improve performance, and
how we manage our information technology.
Process Management: Process Management examines how we design, manage, and improve
our work systems and work processes to deliver student and stakeholder value and achieve
organizational success and sustainability.
Results: Results examines our performance and improvement in all key areas—student learning
and process outcomes, customer-focused outcomes, workforce-focused outcomes, leadership and
governance outcomes, and budgetary, financial, and market outcomes.
Strategic Planning: Strategic Planning refers to how Edison develops strategic objectives and
action plans; how our chosen strategic objectives and action plans are implemented and changed
if circumstances require, and how progress is measured.
Workforce Focus: Workforce Focus examines our ability to assess workforce capability and
capacity needs and build a workforce environment conducive to high performance.
Using the same list of statements, employees are asked to select those statements they consider to be of
importance. Employees are also asked to comment on any areas of satisfaction and/or importance that
were not adequately addressed throughout the survey.
Response Rate The Satisfaction response rate is determined by calculating the positive response rate. This is done by
adding the count of the ‘agree’ and dividing by the total of the ‘agree’ and ‘disagree.’ In this example, the
2015 Employee Satisfaction Survey Results 2 | P a g e
Satisfaction Rate is 89.7%; (11+24) / (11+24+4). The ‘Neither Agree nor Disagree’ responses are
discarded.
Strongly Agree Agree Neither Agree nor Disagree Disagree Strongly Disagree
11 24 3 4 0
The Importance response rate is determined by the number of respondents who selected and identified the
statement as important divided by the total number of respondents in the respective group. In this
example, the Importance Rate is 34%; (14/41).
Statement Importance Count Number of Respondents Importance Rating
Edison is innovative. 14 41 34%
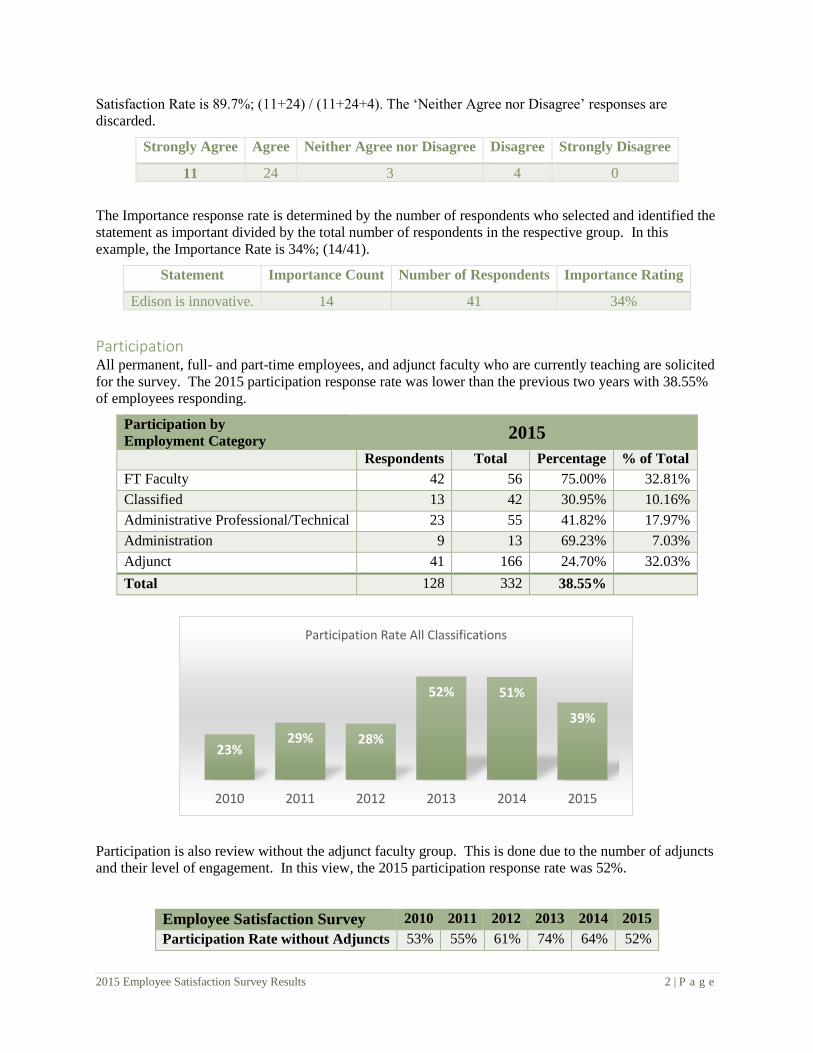
Participation All permanent, full- and part-time employees, and adjunct faculty who are currently teaching are solicited
for the survey. The 2015 participation response rate was lower than the previous two years with 38.55%
of employees responding.
Participation by
Employment Category 2015
Respondents Total Percentage % of Total
FT Faculty 42 56 75.00% 32.81%
Classified 13 42 30.95% 10.16%
Administrative Professional/Technical 23 55 41.82% 17.97%
Administration 9 13 69.23% 7.03%
Adjunct 41 166 24.70% 32.03%
Total 128 332 38.55%
Participation is also review without the adjunct faculty group. This is done due to the number of adjuncts
and their level of engagement. In this view, the 2015 participation response rate was 52%.
Employee Satisfaction Survey 2010 2011 2012 2013 2014 2015
Participation Rate without Adjuncts 53% 55% 61% 74% 64% 52%
23%29% 28%
52% 51%
39%
2010 2011 2012 2013 2014 2015
Participation Rate All Classifications
2015 Employee Satisfaction Survey Results 3 | P a g e
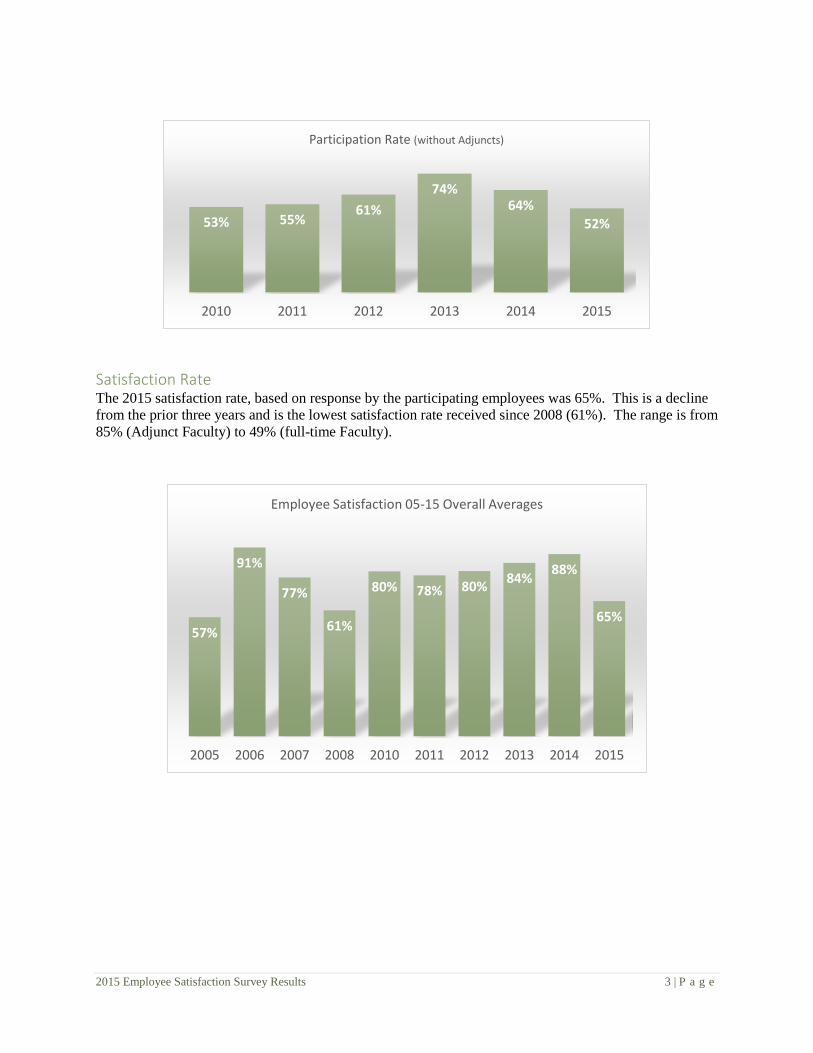
Satisfaction Rate The 2015 satisfaction rate, based on response by the participating employees was 65%. This is a decline
from the prior three years and is the lowest satisfaction rate received since 2008 (61%). The range is from
85% (Adjunct Faculty) to 49% (full-time Faculty).
53% 55%61%
74%64%
52%
2010 2011 2012 2013 2014 2015
Participation Rate (without Adjuncts)
57%
91%
77%
61%
80% 78% 80%84%
88%
65%
2005 2006 2007 2008 2010 2011 2012 2013 2014 2015
Employee Satisfaction 05-15 Overall Averages
2015 Employee Satisfaction Survey Results 4 | P a g e
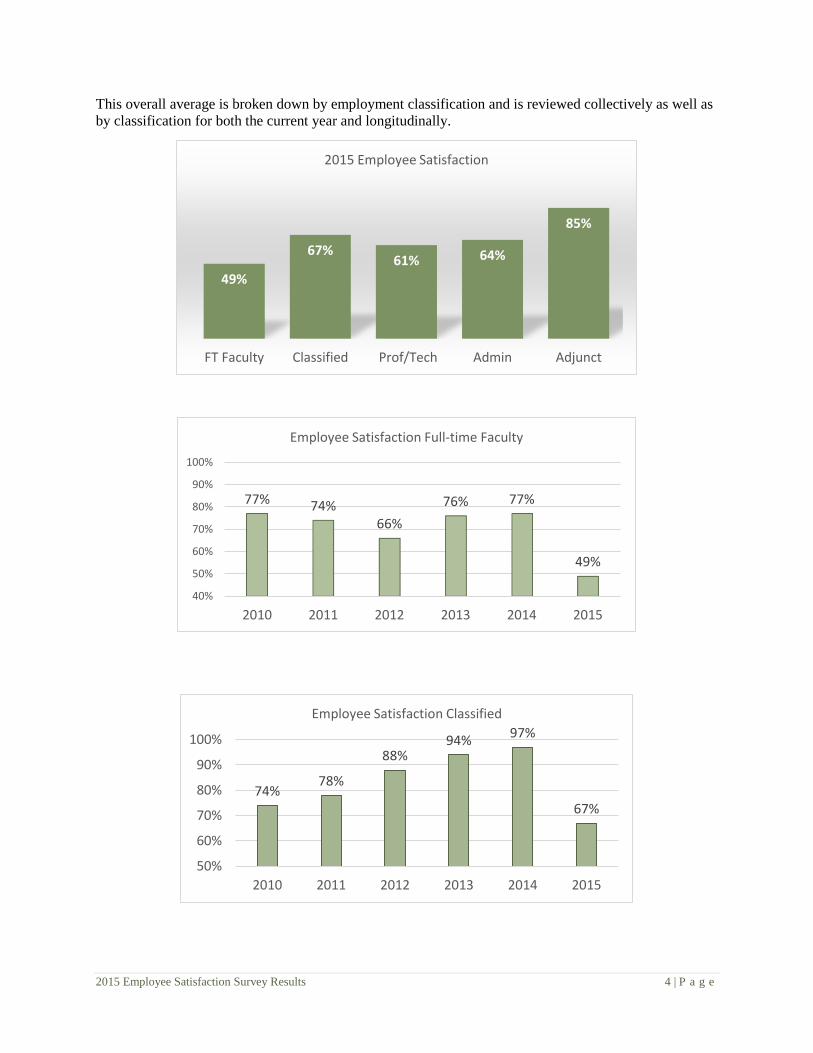
This overall average is broken down by employment classification and is reviewed collectively as well as
by classification for both the current year and longitudinally.
49%
67%61% 64%
85%
FT Faculty Classified Prof/Tech Admin Adjunct
2015 Employee Satisfaction
77% 74%66%
76% 77%
49%
40%
50%
60%
70%
80%
90%
100%
2010 2011 2012 2013 2014 2015
Employee Satisfaction Full-time Faculty
74%78%
88%94%
97%
67%
50%
60%
70%
80%
90%
100%
2010 2011 2012 2013 2014 2015
Employee Satisfaction Classified
2015 Employee Satisfaction Survey Results 5 | P a g e
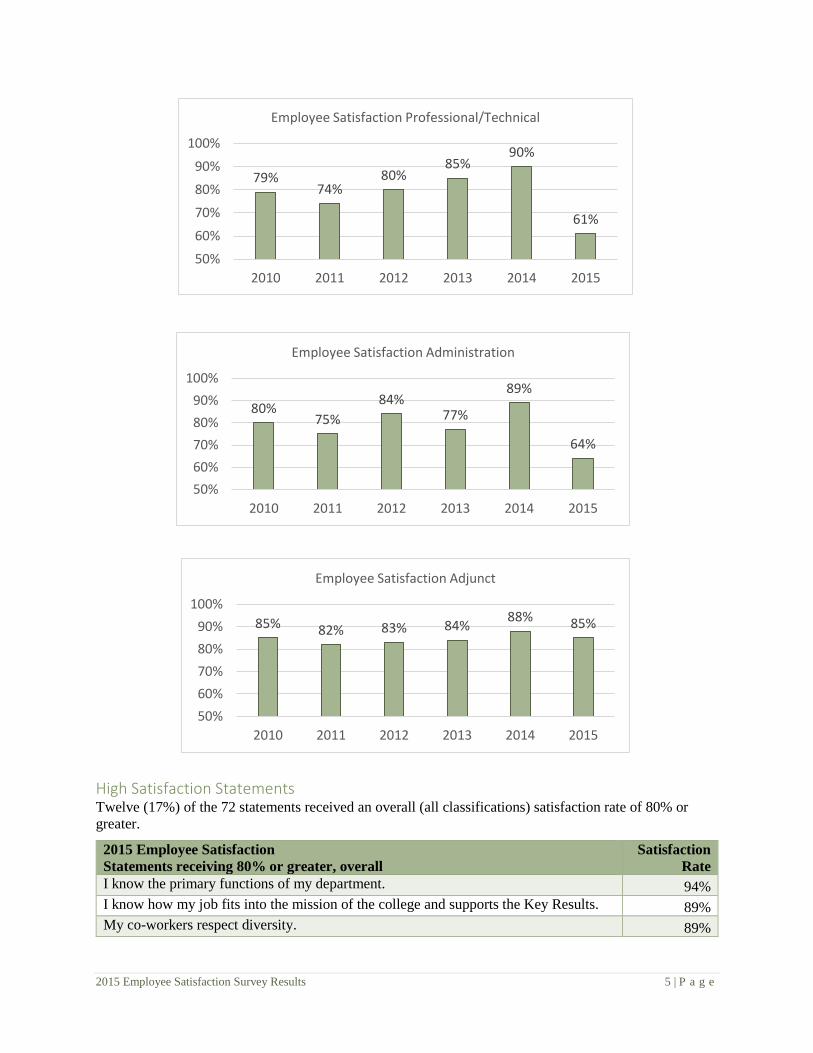
High Satisfaction Statements Twelve (17%) of the 72 statements received an overall (all classifications) satisfaction rate of 80% or
greater.
2015 Employee Satisfaction
Statements receiving 80% or greater, overall
Satisfaction
Rate
I know the primary functions of my department. 94%
I know how my job fits into the mission of the college and supports the Key Results. 89%
My co-workers respect diversity. 89%
79%74%
80%85%
90%
61%
50%
60%
70%
80%
90%
100%
2010 2011 2012 2013 2014 2015
Employee Satisfaction Professional/Technical
80%75%
84%77%
89%
64%
50%
60%
70%
80%
90%
100%
2010 2011 2012 2013 2014 2015
Employee Satisfaction Administration
85% 82% 83% 84%88% 85%
50%
60%
70%
80%
90%
100%
2010 2011 2012 2013 2014 2015
Employee Satisfaction Adjunct
2015 Employee Satisfaction Survey Results 6 | P a g e
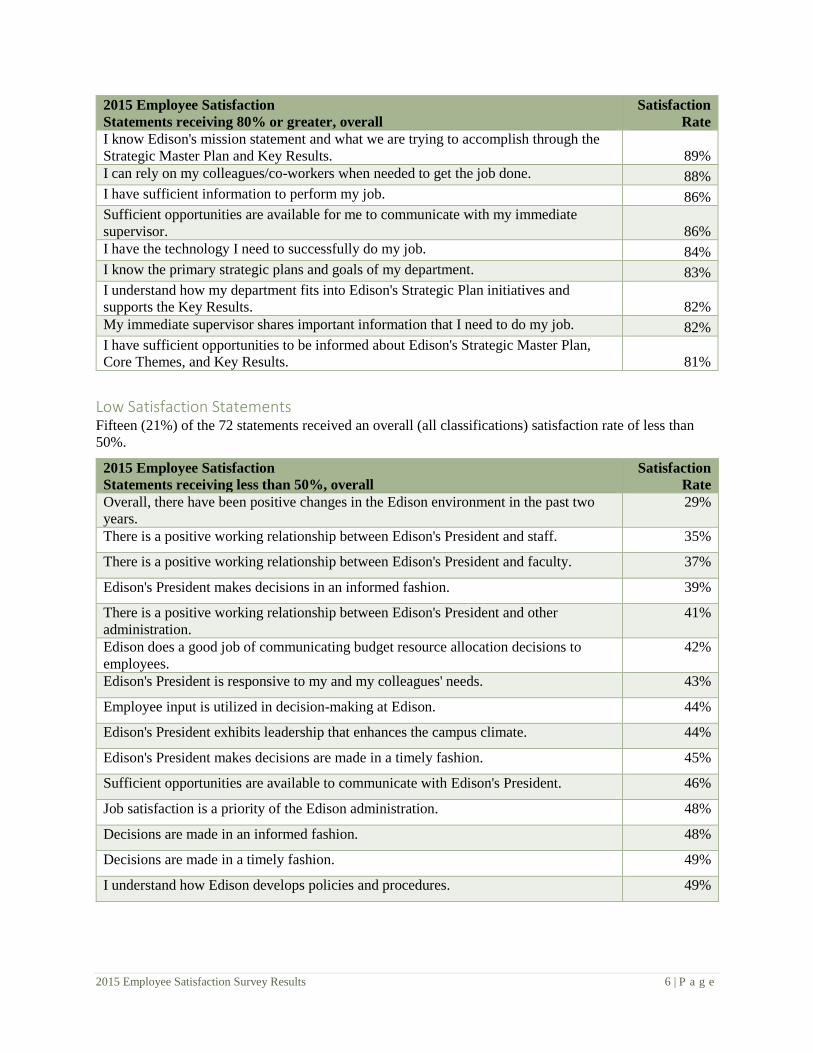
2015 Employee Satisfaction
Statements receiving 80% or greater, overall
Satisfaction
Rate
I know Edison's mission statement and what we are trying to accomplish through the
Strategic Master Plan and Key Results. 89%
I can rely on my colleagues/co-workers when needed to get the job done. 88%
I have sufficient information to perform my job. 86%
Sufficient opportunities are available for me to communicate with my immediate
supervisor. 86%
I have the technology I need to successfully do my job. 84%
I know the primary strategic plans and goals of my department. 83%
I understand how my department fits into Edison's Strategic Plan initiatives and
supports the Key Results. 82%
My immediate supervisor shares important information that I need to do my job. 82%
I have sufficient opportunities to be informed about Edison's Strategic Master Plan,
Core Themes, and Key Results. 81%
Low Satisfaction Statements Fifteen (21%) of the 72 statements received an overall (all classifications) satisfaction rate of less than
50%.
2015 Employee Satisfaction
Statements receiving less than 50%, overall
Satisfaction
Rate
Overall, there have been positive changes in the Edison environment in the past two
years.
29%
There is a positive working relationship between Edison's President and staff. 35%
There is a positive working relationship between Edison's President and faculty. 37%
Edison's President makes decisions in an informed fashion. 39%
There is a positive working relationship between Edison's President and other
administration.
41%
Edison does a good job of communicating budget resource allocation decisions to
employees.
42%
Edison's President is responsive to my and my colleagues' needs. 43%
Employee input is utilized in decision-making at Edison. 44%
Edison's President exhibits leadership that enhances the campus climate. 44%
Edison's President makes decisions are made in a timely fashion. 45%
Sufficient opportunities are available to communicate with Edison's President. 46%
Job satisfaction is a priority of the Edison administration. 48%
Decisions are made in an informed fashion. 48%
Decisions are made in a timely fashion. 49%
I understand how Edison develops policies and procedures. 49%
2015 Employee Satisfaction Survey Results 7 | P a g e
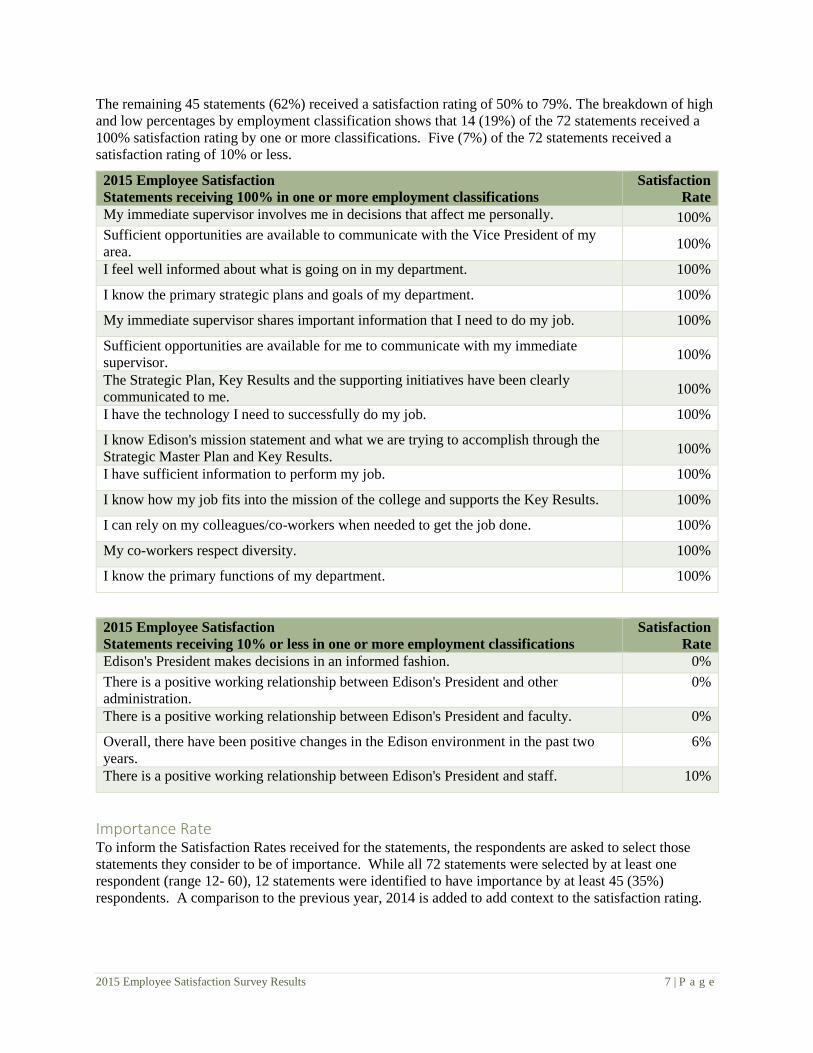
The remaining 45 statements (62%) received a satisfaction rating of 50% to 79%. The breakdown of high
and low percentages by employment classification shows that 14 (19%) of the 72 statements received a
100% satisfaction rating by one or more classifications. Five (7%) of the 72 statements received a
satisfaction rating of 10% or less.
2015 Employee Satisfaction
Statements receiving 100% in one or more employment classifications
Satisfaction
Rate
My immediate supervisor involves me in decisions that affect me personally. 100%
Sufficient opportunities are available to communicate with the Vice President of my
area. 100%
I feel well informed about what is going on in my department. 100%
I know the primary strategic plans and goals of my department. 100%
My immediate supervisor shares important information that I need to do my job. 100%
Sufficient opportunities are available for me to communicate with my immediate
supervisor. 100%
The Strategic Plan, Key Results and the supporting initiatives have been clearly
communicated to me. 100%
I have the technology I need to successfully do my job. 100%
I know Edison's mission statement and what we are trying to accomplish through the
Strategic Master Plan and Key Results. 100%
I have sufficient information to perform my job. 100%
I know how my job fits into the mission of the college and supports the Key Results. 100%
I can rely on my colleagues/co-workers when needed to get the job done. 100%
My co-workers respect diversity. 100%
I know the primary functions of my department. 100%
2015 Employee Satisfaction
Statements receiving 10% or less in one or more employment classifications
Satisfaction
Rate
Edison's President makes decisions in an informed fashion. 0%
There is a positive working relationship between Edison's President and other
administration.
0%
There is a positive working relationship between Edison's President and faculty. 0%
Overall, there have been positive changes in the Edison environment in the past two
years.
6%
There is a positive working relationship between Edison's President and staff. 10%
Importance Rate To inform the Satisfaction Rates received for the statements, the respondents are asked to select those
statements they consider to be of importance. While all 72 statements were selected by at least one
respondent (range 12- 60), 12 statements were identified to have importance by at least 45 (35%)
respondents. A comparison to the previous year, 2014 is added to add context to the satisfaction rating.
2015 Employee Satisfaction Survey Results 8 | P a g e
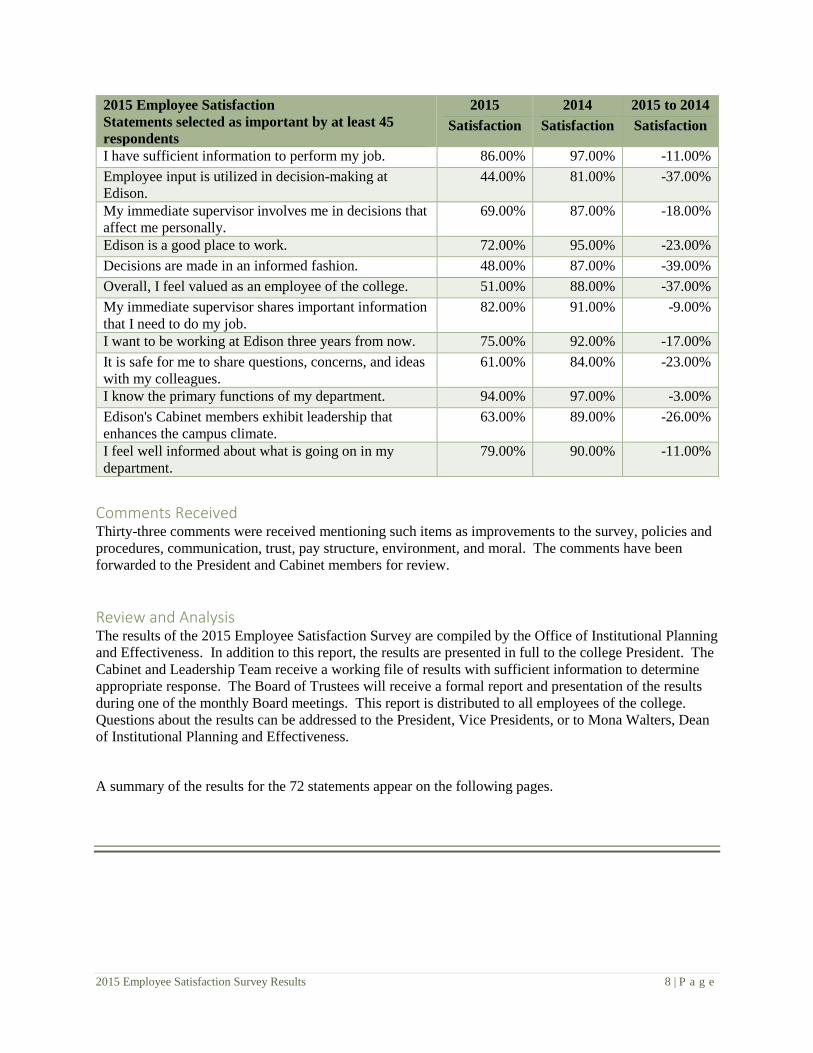
2015 Employee Satisfaction
Statements selected as important by at least 45
respondents
2015 2014 2015 to 2014
Satisfaction Satisfaction Satisfaction
I have sufficient information to perform my job. 86.00% 97.00% -11.00%
Employee input is utilized in decision-making at
Edison.
44.00% 81.00% -37.00%
My immediate supervisor involves me in decisions that
affect me personally.
69.00% 87.00% -18.00%
Edison is a good place to work. 72.00% 95.00% -23.00%
Decisions are made in an informed fashion. 48.00% 87.00% -39.00%
Overall, I feel valued as an employee of the college. 51.00% 88.00% -37.00%
My immediate supervisor shares important information
that I need to do my job.
82.00% 91.00% -9.00%
I want to be working at Edison three years from now. 75.00% 92.00% -17.00%
It is safe for me to share questions, concerns, and ideas
with my colleagues.
61.00% 84.00% -23.00%
I know the primary functions of my department. 94.00% 97.00% -3.00%
Edison's Cabinet members exhibit leadership that
enhances the campus climate.
63.00% 89.00% -26.00%
I feel well informed about what is going on in my
department.
79.00% 90.00% -11.00%
Comments Received Thirty-three comments were received mentioning such items as improvements to the survey, policies and
procedures, communication, trust, pay structure, environment, and moral. The comments have been
forwarded to the President and Cabinet members for review.
Review and Analysis The results of the 2015 Employee Satisfaction Survey are compiled by the Office of Institutional Planning
and Effectiveness. In addition to this report, the results are presented in full to the college President. The
Cabinet and Leadership Team receive a working file of results with sufficient information to determine
appropriate response. The Board of Trustees will receive a formal report and presentation of the results
during one of the monthly Board meetings. This report is distributed to all employees of the college.
Questions about the results can be addressed to the President, Vice Presidents, or to Mona Walters, Dean
of Institutional Planning and Effectiveness.
A summary of the results for the 72 statements appear on the following pages.
2015 Employee Satisfaction Survey Results 9 | P a g e
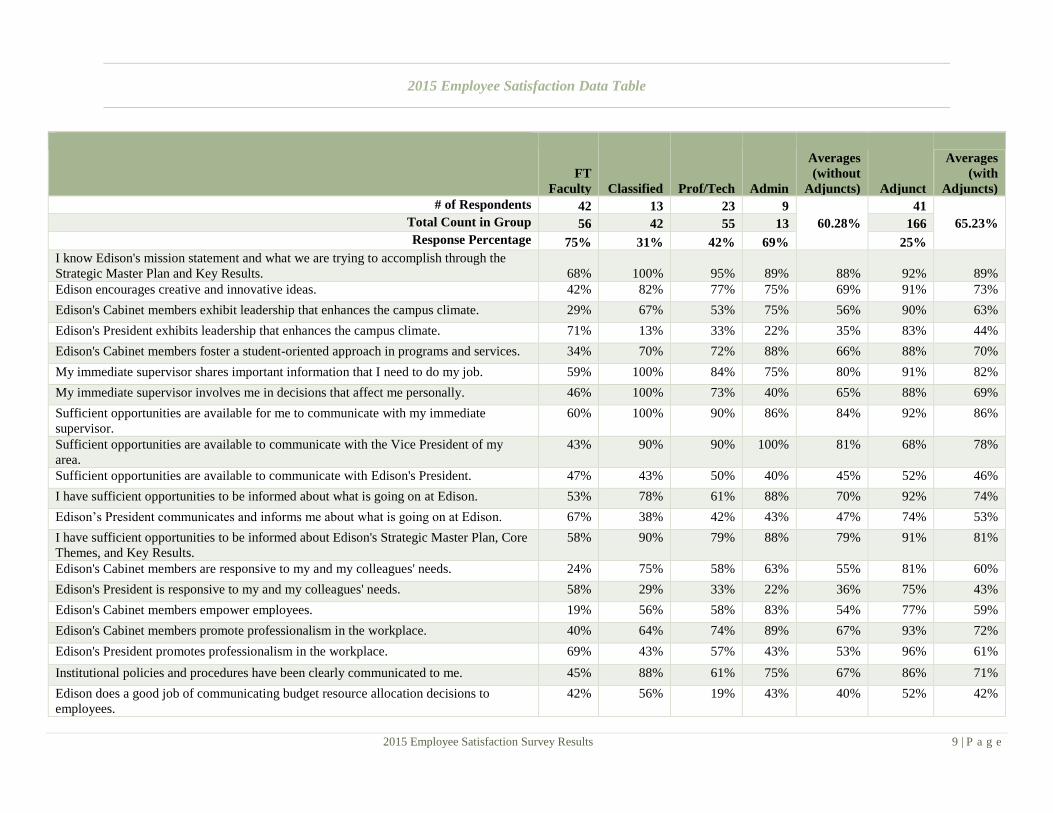
2015 Employee Satisfaction Data Table
FT
Faculty Classified Prof/Tech Admin
Averages
(without
Adjuncts) Adjunct
Averages
(with
Adjuncts)
# of Respondents 42 13 23 9
60.28%
41
65.23% Total Count in Group 56 42 55 13 166
Response Percentage 75% 31% 42% 69% 25%
I know Edison's mission statement and what we are trying to accomplish through the
Strategic Master Plan and Key Results. 68% 100% 95% 89% 88% 92% 89%
Edison encourages creative and innovative ideas. 42% 82% 77% 75% 69% 91% 73%
Edison's Cabinet members exhibit leadership that enhances the campus climate. 29% 67% 53% 75% 56% 90% 63%
Edison's President exhibits leadership that enhances the campus climate. 71% 13% 33% 22% 35% 83% 44%
Edison's Cabinet members foster a student-oriented approach in programs and services. 34% 70% 72% 88% 66% 88% 70%
My immediate supervisor shares important information that I need to do my job. 59% 100% 84% 75% 80% 91% 82%
My immediate supervisor involves me in decisions that affect me personally. 46% 100% 73% 40% 65% 88% 69%
Sufficient opportunities are available for me to communicate with my immediate
supervisor.
60% 100% 90% 86% 84% 92% 86%
Sufficient opportunities are available to communicate with the Vice President of my
area.
43% 90% 90% 100% 81% 68% 78%
Sufficient opportunities are available to communicate with Edison's President. 47% 43% 50% 40% 45% 52% 46%
I have sufficient opportunities to be informed about what is going on at Edison. 53% 78% 61% 88% 70% 92% 74%
Edison’s President communicates and informs me about what is going on at Edison. 67% 38% 42% 43% 47% 74% 53%
I have sufficient opportunities to be informed about Edison's Strategic Master Plan, Core
Themes, and Key Results.
58% 90% 79% 88% 79% 91% 81%
Edison's Cabinet members are responsive to my and my colleagues' needs. 24% 75% 58% 63% 55% 81% 60%
Edison's President is responsive to my and my colleagues' needs. 58% 29% 33% 22% 36% 75% 43%
Edison's Cabinet members empower employees. 19% 56% 58% 83% 54% 77% 59%
Edison's Cabinet members promote professionalism in the workplace. 40% 64% 74% 89% 67% 93% 72%
Edison's President promotes professionalism in the workplace. 69% 43% 57% 43% 53% 96% 61%
Institutional policies and procedures have been clearly communicated to me. 45% 88% 61% 75% 67% 86% 71%
Edison does a good job of communicating budget resource allocation decisions to
employees.
42% 56% 19% 43% 40% 52% 42%

2015 Employee Satisfaction Survey Results 10 | P a g e
FT
Faculty Classified Prof/Tech Admin
Averages
(without
Adjuncts) Adjunct
Averages
(with
Adjuncts)
I feel well informed about what is going on in my department. 49% 90% 71% 100% 78% 85% 79%
I have sufficient information to perform my job. 68% 92% 86% 83% 82% 100% 86%
Decisions are made in a timely fashion. 41% 27% 50% 33% 38% 92% 49%
Edison's President makes decisions are made in a timely fashion. 67% 14% 42% 20% 36% 82% 45%
Decisions are made in an informed fashion. 32% 17% 56% 50% 39% 86% 48%
Edison's President makes decisions in an informed fashion. 58% 0% 27% 25% 27% 86% 39%
I understand how Edison develops policies and procedures. 39% 50% 41% 57% 47% 58% 49%
Employee input is utilized in decision-making at Edison. 26% 50% 19% 50% 36% 72% 44%
I am encouraged to participate in departmental decision-making. 54% 90% 65% 63% 68% 75% 69%
We use continuous quality improvement tools when processes need to be improved. 50% 70% 86% 75% 70% 92% 75%
Overall, there have been positive changes in the Edison environment in the past two
years.
25% 20% 6% 29% 20% 67% 29%
Edison is open to change. 39% 64% 44% 57% 51% 88% 58%
Communication and collaboration among departments and managers maximize program
effectiveness.
34% 50% 53% 67% 51% 82% 57%
The decisions that are made reflect Edison's mission. 34% 50% 44% 40% 42% 92% 52%
Edison has high standards and ethics. 51% 73% 59% 43% 56% 85% 62%
I want to be working at Edison three years from now. 61% 78% 76% 67% 71% 94% 75%
Edison is innovative. 35% 64% 50% 67% 54% 81% 59%
The Strategic Plan, Key Results and the supporting initiatives have been clearly
communicated to me.
60% 80% 72% 100% 78% 82% 79%
I know the primary functions of my department. 78% 100% 95% 100% 93% 95% 94%
I know the primary strategic plans and goals of my department. 51% 91% 89% 100% 83% 86% 83%
I understand how my department fits into Edison's Strategic Plan initiatives and supports
the Key Results.
49% 89% 90% 89% 79% 96% 82%
I am given the opportunity to promote innovative ideas or initiatives. 50% 73% 63% 50% 59% 84% 64%
Edison's Key Results and strategic initiatives have clear criteria. 50% 63% 82% 60% 64% 94% 70%
Edison's Key Results and strategic initiatives have measureable outcomes. 47% 71% 93% 50% 65% 85% 69%
I have opportunity to express my thoughts, and am asked for my opinion. 45% 83% 65% 67% 65% 74% 67%
I am satisfied with the freedom I have to openly express my viewpoint. 35% 70% 57% 57% 55% 89% 62%
Job performance expectations have been clearly communicated to me. 53% 91% 64% 63% 67% 84% 71%
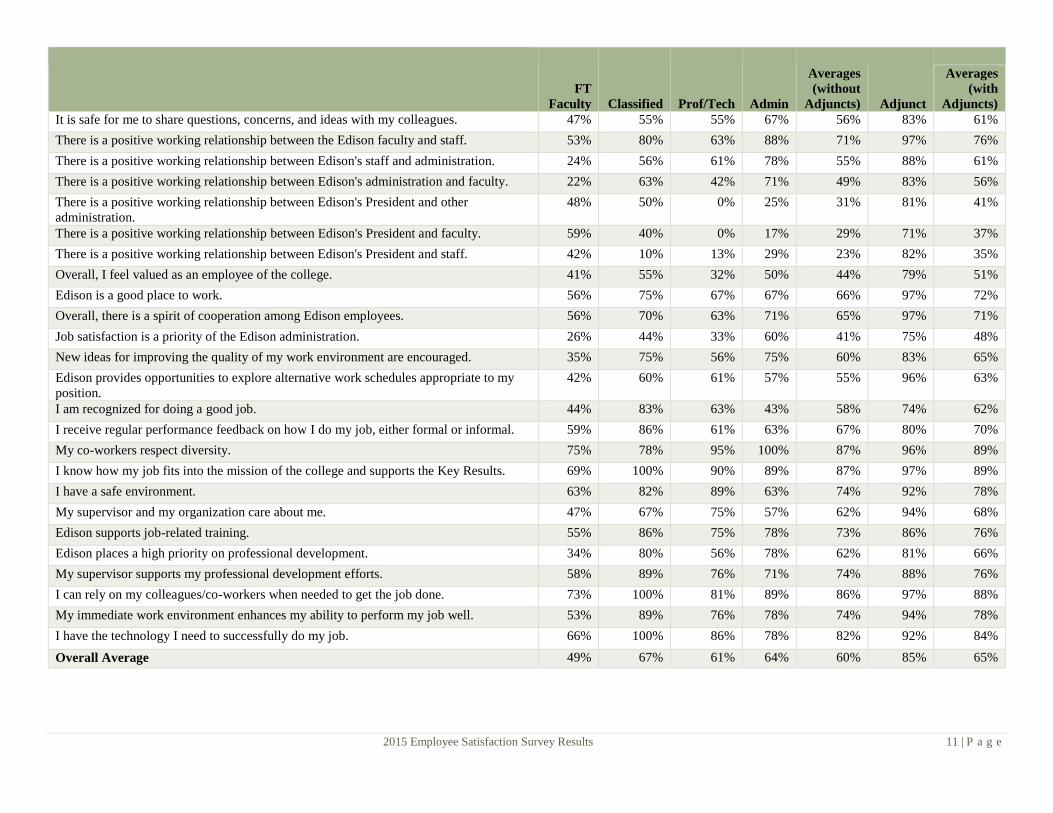
2015 Employee Satisfaction Survey Results 11 | P a g e
FT
Faculty Classified Prof/Tech Admin
Averages
(without
Adjuncts) Adjunct
Averages
(with
Adjuncts)
It is safe for me to share questions, concerns, and ideas with my colleagues. 47% 55% 55% 67% 56% 83% 61%
There is a positive working relationship between the Edison faculty and staff. 53% 80% 63% 88% 71% 97% 76%
There is a positive working relationship between Edison's staff and administration. 24% 56% 61% 78% 55% 88% 61%
There is a positive working relationship between Edison's administration and faculty. 22% 63% 42% 71% 49% 83% 56%
There is a positive working relationship between Edison's President and other
administration.
48% 50% 0% 25% 31% 81% 41%
There is a positive working relationship between Edison's President and faculty. 59% 40% 0% 17% 29% 71% 37%
There is a positive working relationship between Edison's President and staff. 42% 10% 13% 29% 23% 82% 35%
Overall, I feel valued as an employee of the college. 41% 55% 32% 50% 44% 79% 51%
Edison is a good place to work. 56% 75% 67% 67% 66% 97% 72%
Overall, there is a spirit of cooperation among Edison employees. 56% 70% 63% 71% 65% 97% 71%
Job satisfaction is a priority of the Edison administration. 26% 44% 33% 60% 41% 75% 48%
New ideas for improving the quality of my work environment are encouraged. 35% 75% 56% 75% 60% 83% 65%
Edison provides opportunities to explore alternative work schedules appropriate to my
position.
42% 60% 61% 57% 55% 96% 63%
I am recognized for doing a good job. 44% 83% 63% 43% 58% 74% 62%
I receive regular performance feedback on how I do my job, either formal or informal. 59% 86% 61% 63% 67% 80% 70%
My co-workers respect diversity. 75% 78% 95% 100% 87% 96% 89%
I know how my job fits into the mission of the college and supports the Key Results. 69% 100% 90% 89% 87% 97% 89%
I have a safe environment. 63% 82% 89% 63% 74% 92% 78%
My supervisor and my organization care about me. 47% 67% 75% 57% 62% 94% 68%
Edison supports job-related training. 55% 86% 75% 78% 73% 86% 76%
Edison places a high priority on professional development. 34% 80% 56% 78% 62% 81% 66%
My supervisor supports my professional development efforts. 58% 89% 76% 71% 74% 88% 76%
I can rely on my colleagues/co-workers when needed to get the job done. 73% 100% 81% 89% 86% 97% 88%
My immediate work environment enhances my ability to perform my job well. 53% 89% 76% 78% 74% 94% 78%
I have the technology I need to successfully do my job. 66% 100% 86% 78% 82% 92% 84%
Overall Average 49% 67% 61% 64% 60% 85% 65%