2015 ford university -- consolidated (03-12-15) · changes in accrual related to pre-existing 625...
TRANSCRIPT

FORD UNIVERSITYStuart Rowley
Vice President and Controller
March 13, 2015

SLIDE 1
Agenda for today’s discussion:
• Warranty Reserves
• China JV Equity Earnings
• Venezuela Accounting Change
• Cash Drivers -- Working Capital and Timing Differences
• Taxes
Appendix
• Reference materials
• Reconciliations to GAAP
Also posted on the Investor Relations website are the 2015 Ford Credit University and the 2014 Ford University materials
FORD UNIVERSITY
SLIDE 2
AGENDA
• Warranty Reserves
• China JV Equity Earnings
• Venezuela Accounting Change
• Cash Drivers -- Working Capital and Timing Differences
• Taxes
SLIDE 3
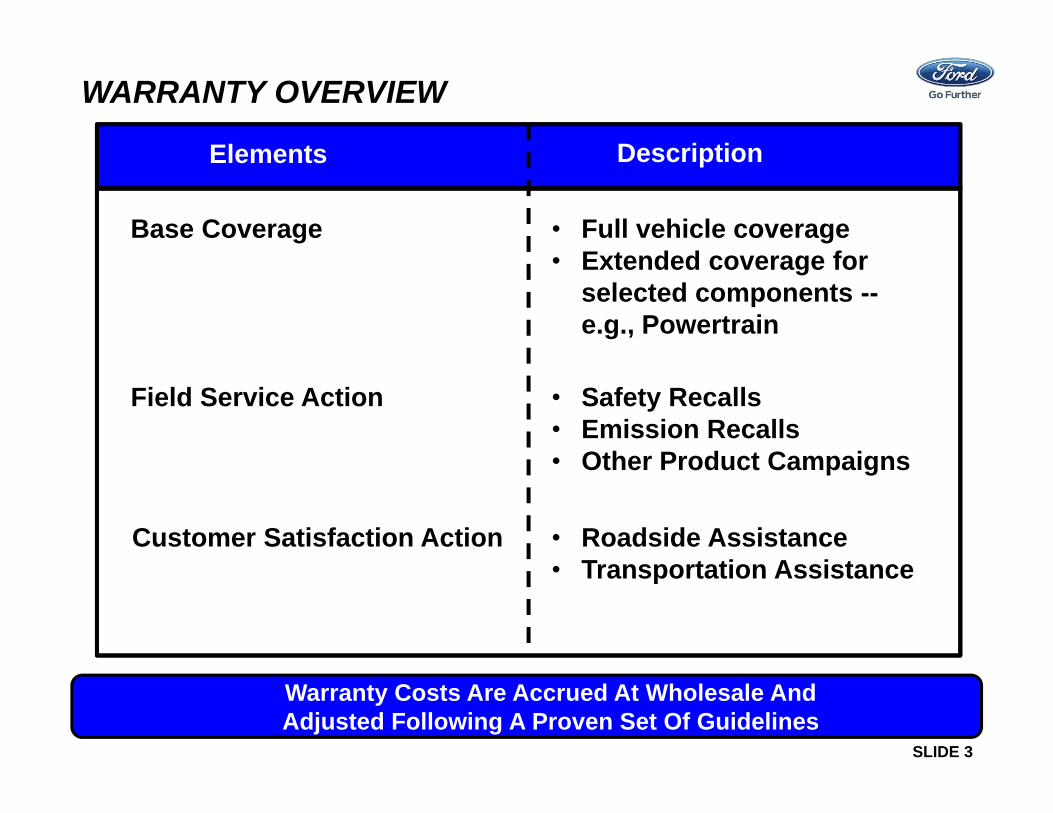
WARRANTY OVERVIEW
Elements
Base Coverage
Field Service Action
Customer Satisfaction Action
• Full vehicle coverage• Extended coverage for
selected components --e.g., Powertrain
• Safety Recalls• Emission Recalls• Other Product Campaigns
• Roadside Assistance• Transportation Assistance
Warranty Costs Are Accrued At Wholesale AndAdjusted Following A Proven Set Of Guidelines
Description
SLIDE 4
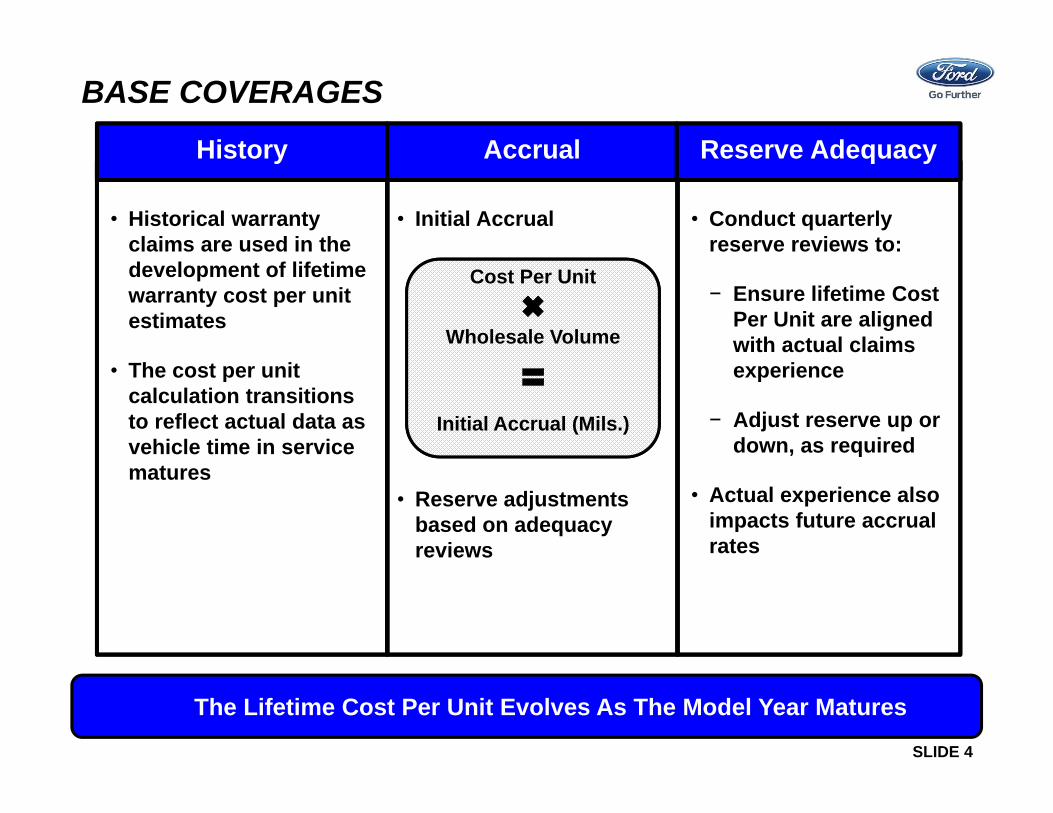
BASE COVERAGES
History Accrual Reserve Adequacy
Cost Per Unit
Wholesale Volume
Initial Accrual (Mils.)
• Conduct quarterly reserve reviews to:
− Ensure lifetime Cost Per Unit are aligned with actual claims experience
− Adjust reserve up or down, as required
• Actual experience also impacts future accrual rates
• Historical warranty claims are used in the development of lifetime warranty cost per unit estimates
• The cost per unit calculation transitions to reflect actual data as vehicle time in service matures
• Initial Accrual
• Reserve adjustments based on adequacy reviews
The Lifetime Cost Per Unit Evolves As The Model Year Matures

SLIDE 5
FIELD SERVICE ACTIONS
History Accrual Reserve Adequacy
• Conduct review of approved Field Service Action programs
• Evaluate reserve levels relative to historical performance
• Adjust reserve up or down, as required
• Actual experience can also impact future accrual rates
• Average seven model years of history to develop Cost Per Unit
• 2015 Model Year Cost Per Unit is an average of 2005 MY -- 2011 MY
• Initial Accrual
• Approved actions charged to accrual, exceptions:− Large actions above a
pre-defined threshold− Older model years
• Reserve adjustments based on adequacy reviews
The Field Service Action Initial Accrual Creates A Reserve For Future Recall Decisions
Cost Per Unit
Wholesale Volume
Initial Accrual (Mils.)

SLIDE 6
GLOBAL WARRANTY -- 2014 10-K
We Have A Proven Set Of Guidelines AndDo Not Anticipate Any Changes To Our Processes
2013 2014(Mils.) (Mils.)
Beginning Balance 3,657$ 3,927$
Payments made during the period (2,302) (2,850) (548)$
Changes in accrual related to warranties 2,025 2,108 issued during the period
Changes in accrual related to pre-existing 625 1,746 warranties and other adjustments
Foreign currency translation and other (78) (145)
Ending Balance 3,927$ 4,785$
1,121$
Global Full Year
*
-----*excludes customer satisfaction actions

SLIDE 7
AGENDA
• Warranty Reserves
• China JV Equity Earnings
• Venezuela Accounting Change
• Cash Drivers -- Working Capital and Timing Differences
• Taxes

SLIDE 8
FORD IN CHINA
Ford Business In China Consists Of Five Primary Elements
Non-PremiumPassenger
Import
100% Ford
Trucks andCommercial
LocalManufacture
Equity Investment
(32%)
PremiumPassenger
Import
100% Ford
Non-PremiumPassenger
LocalManufacture
Equity Investment
(50%)
CAF JMC CFME Ford Lincoln
EngineProduction
LocalManufacture
Equity Investment
(25%)
Ford “Joint Ventures” in China
Ford’s other activities in China include its Asia Pacific Regional Headquarters,Ford Auto Financing China, and a growing engineering center
SLIDE 9
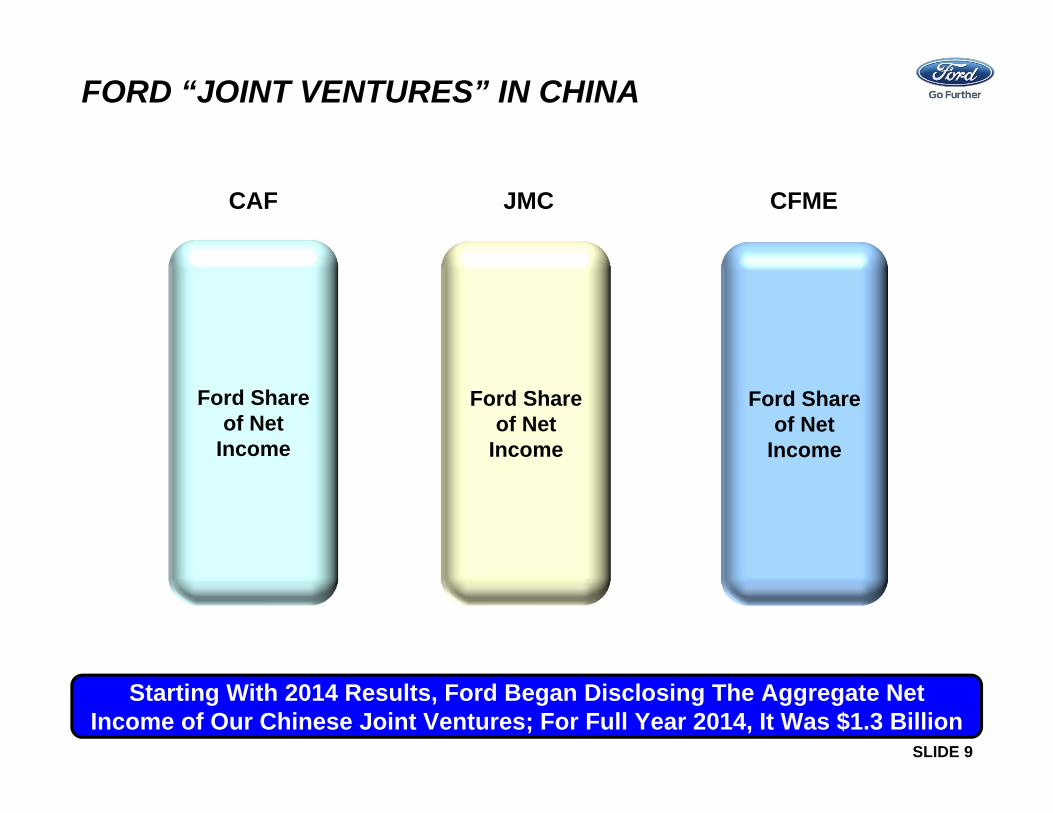
FORD “JOINT VENTURES” IN CHINA
Starting With 2014 Results, Ford Began Disclosing The Aggregate Net Income of Our Chinese Joint Ventures; For Full Year 2014, It Was $1.3 Billion
Ford Share of Net
Income
Ford Share of Net
Income
CAF JMC CFME
Ford Share of Net
Income

SLIDE 10
FORD ASIA PACIFIC FINANCIAL RESULTS
Ford Asia Pacific Profit Includes China Joint Venture Entities, Ford Costs Related To JVs, Ford And Lincoln Imports, And Non-China Markets
Ford Costs and
Income Relatedto JVs
FordAsia
Pacific
China JV
Entities -- Ford
Share of Net
Income
Ford and
Lincoln Imports
for China
Disclosed
Non-China Asia
Pacific Markets
Disclosed

SLIDE 11
AGENDA
• Warranty Reserves
• China JV Equity Earnings
• Venezuela Accounting Change
• Cash Drivers -- Working Capital and Timing Differences
• Taxes
SLIDE 12
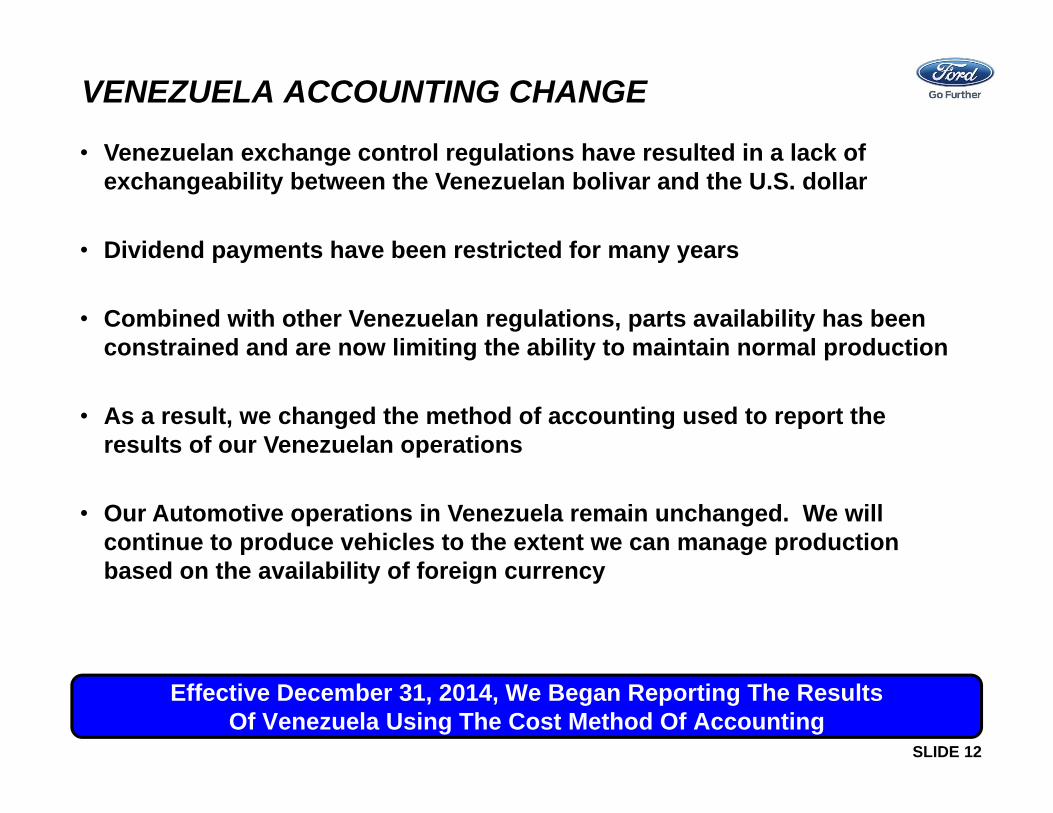
VENEZUELA ACCOUNTING CHANGE
• Venezuelan exchange control regulations have resulted in a lack of exchangeability between the Venezuelan bolivar and the U.S. dollar
• Dividend payments have been restricted for many years
• Combined with other Venezuelan regulations, parts availability has been constrained and are now limiting the ability to maintain normal production
• As a result, we changed the method of accounting used to report the results of our Venezuelan operations
• Our Automotive operations in Venezuela remain unchanged. We will continue to produce vehicles to the extent we can manage production based on the availability of foreign currency
Effective December 31, 2014, We Began Reporting The Results Of Venezuela Using The Cost Method Of Accounting

SLIDE 13
Prior Accounting One-Time Change Present Accounting
Consolidation Method of Accounting
• Used until year-end 2014
• All Venezuelan revenues, expenses, gains, and losses included in Ford’s operating results
• All Venezuelan assets and liabilities appear on Ford’s consolidated balance sheet
Cost Method of Accounting
• Used in 2015 and beyond
• Ford’s financial results will not include the operating results of Venezuela
• Cash and income will be recorded to the extent we are paid for parts we sell to Venezuela or we receive dividends
Change in Method of Accounting
• Effective Dec. 31, 2014
• $800 million pre-tax special item charge included in Ford’s results and
• Cash balance of $477 million no longer reported in Automotive gross cash
Further Devaluations Of The Venezuelan Bolivar Will Not Have An Impact On Our Financial Results
VENEZUELA ACCOUNTING CHANGE
SLIDE 14
AGENDA
• Warranty Reserves
• China JV Equity Earnings
• Venezuela Accounting Change
• Cash Drivers -- Working Capital and Timing Differences
• Taxes

SLIDE 15
FullYear(Bils.)
Gross cash at end of period 21.7$ Gross cash at beginning of period 24.8
Change in gross cash (3.1)$
Automotive pre-tax profits** 4.5$ Capital spending (7.4) Depreciation and tooling amortization 4.3 Changes in working capital (0.3) Other / Timing differences 2.5
Automotive operating-related cash flow 3.6$
Separation payments (0.2) Net receipts from Financial Services sector 0.6 Other (mainly Venezuela accounting change) (0.8)
Cash flow before other actions 3.2$
Changes in debt (0.9) Funded pension contributions (1.5) Dividends / Other items (3.9)
Change in gross cash (3.1)$
* See Appendix for reconciliation to GAAP ** Excludes special items; see Appendix for detail and reconciliation to GAAP
2014 AUTOMOTIVE CASH FLOW*

SLIDE 16
Includes differences due to warranty, marketing,
and compensation
Comprised of changes in receivables,
inventory, and trade payables
* See Appendix for reconciliation to GAAP** Excludes special items; see Appendix for detail and reconciliation to GAAP
FullFirst Second Third Fourth* Year*
(Bils.) (Bils.) (Bils.) (Bils.) (Bils.)
Automotive pre-tax profits** 0.9$ 2.2$ 0.7$ 0.7$ 4.5$
Capital spending (1.5)$ (1.9)$ (1.8)$ (2.2)$ (7.4)$ Depreciation and amortization 1.0 1.0 1.1 1.2 4.3
Net spending (0.5)$ (0.9)$ (0.7)$ (1.0)$ (3.1)$
Changes in working capital 1.7 (0.7) (1.5) 0.2 (0.3) Other / Timing differences (0.9) 2.0 0.8 0.6 2.5
Operating-related cash flow 1.2$ 2.6$ (0.7)$ 0.5$ 3.6$
Quarter
2014 AUTOMOTIVE OPERATING-RELATEDCASH FLOW

SLIDE 17
FirstQuarter
ThirdQuarter
SecondQuarter
* Based on average data from the past five years** Scale adjusted to highlight quarterly seasonality
Generally, Operating-Related Cash Flow SeasonalityIs Aligned With Production Volumes
Global Production Volume**Operating-Related Cash Flow
FourthQuarter
CALENDARIZATION FACTORS -- PRODUCTION ANDCASH FLOW SEASONALITY*

SLIDE 18
Receivables
Inventory
Payables
Elements ofWorking Capital
• Production Volumes:– Customer demand– Seasonality for plant shutdowns– Launch schedules
• Vehicle production mix
• In-transit vehicles (exported between countries)
• Variability in government-related tax receivables
• Supplier payment terms changes
Key Drivers
KEY DRIVERS OF CHANGES TO WORKING CAPITAL
SLIDE 19
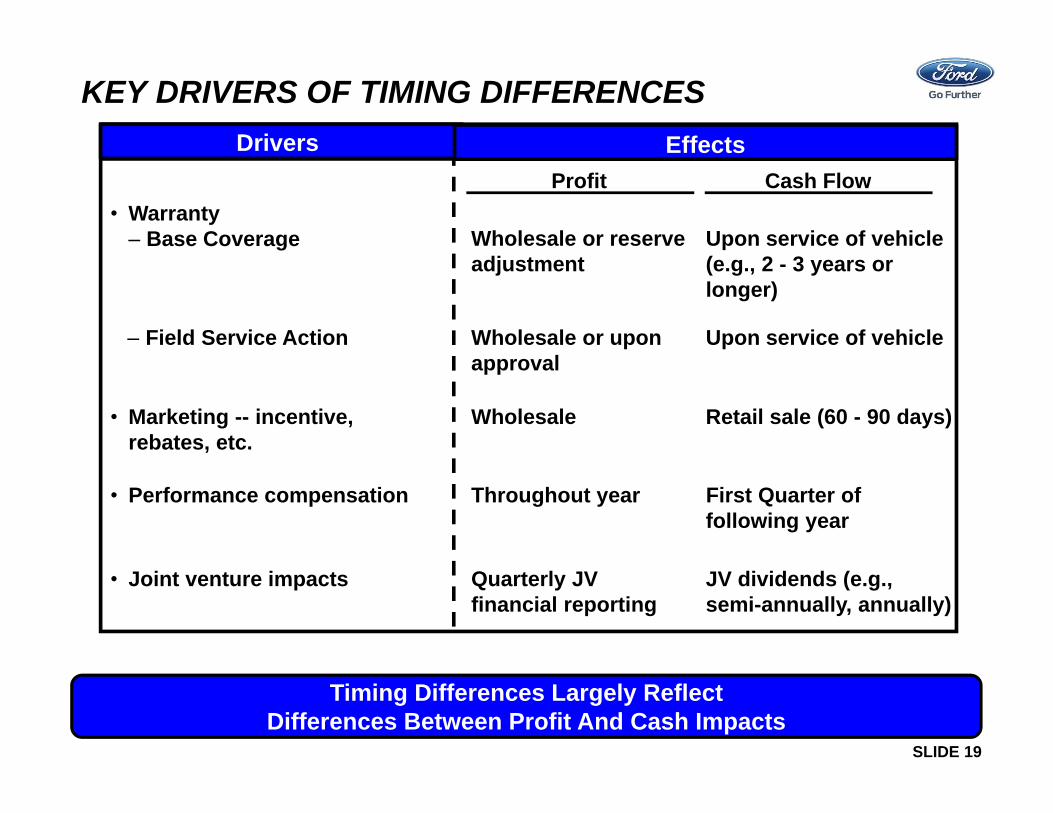
Timing Differences Largely ReflectDifferences Between Profit And Cash Impacts
• Marketing -- incentive, rebates, etc.
• Warranty– Base Coverage
• Joint venture impacts
• Performance compensation
Profit Cash Flow
Wholesale Retail sale (60 - 90 days)
Wholesale or reserveadjustment
Upon service of vehicle (e.g., 2 - 3 years or longer)
Wholesale or upon approval
Quarterly JV financial reporting
JV dividends (e.g., semi-annually, annually)
Throughout year First Quarter of following year
Drivers Effects
Upon service of vehicle– Field Service Action
KEY DRIVERS OF TIMING DIFFERENCES

SLIDE 20
AGENDA
• Warranty Reserves
• China JV Equity Earnings
• Venezuela Accounting Change
• Cash Drivers -- Working Capital and Timing Differences
• Taxes

SLIDE 21
1Q 2Q 3Q 4Q FY(Mils.) (Mils.) (Mils.) (Mils.) (Mils.)
Operating results*Pre-tax results 1,381$ 2,599$ 1,181$ 1,121$ 6,282$ A
419 396 388 401 1,604 BAdjusted pre-tax results 962$ 2,203$ 793$ 720$ 4,678$ C
(362)$ (965)$ (247)$ (76)$ (1,650)$ D
Effective tax rate*Excluding Equity Earnings 37.7% 43.8% 31.1% 10.6% 35.3%Including Equity Earnings 26.2% 37.1% 20.9% 6.8% 26.3%
* Excludes special itemsA/ See page 37 - 2014 Form 10-KB/ See Appendix 5 for reconciliation to GAAPD/ See Appendix 2 in the 2014 Fourth Quarter and Full Year Earnings Review
and 2015 Outlook presentation
2014Reference
Less: Equity in net income of affiliated companies
(Provision for) / Benefit from income taxes
E
(Provision for) / Benefit from income taxes
Pre-tax operating results=Effective tax rate
OPERATING EFFECTIVE TAX RATE
Equity In Net Income Of Affiliated Companies Will Be Included In The Denominator In Future Calculations Of Effective Tax Rates
E =CD
E =DA
2015Calculation
2014 Calculation

SLIDE 22
2015 CALENDARIZATIONOperating Effective Tax Rate*
FirstQuarter
ThirdQuarter
SecondQuarter
FourthQuarter
* Illustrative only, excludes special items
Our Operating Effective Tax Rate Is Expected To Vary During The Year
Full Year Rate

APPENDIX
SLIDE 24
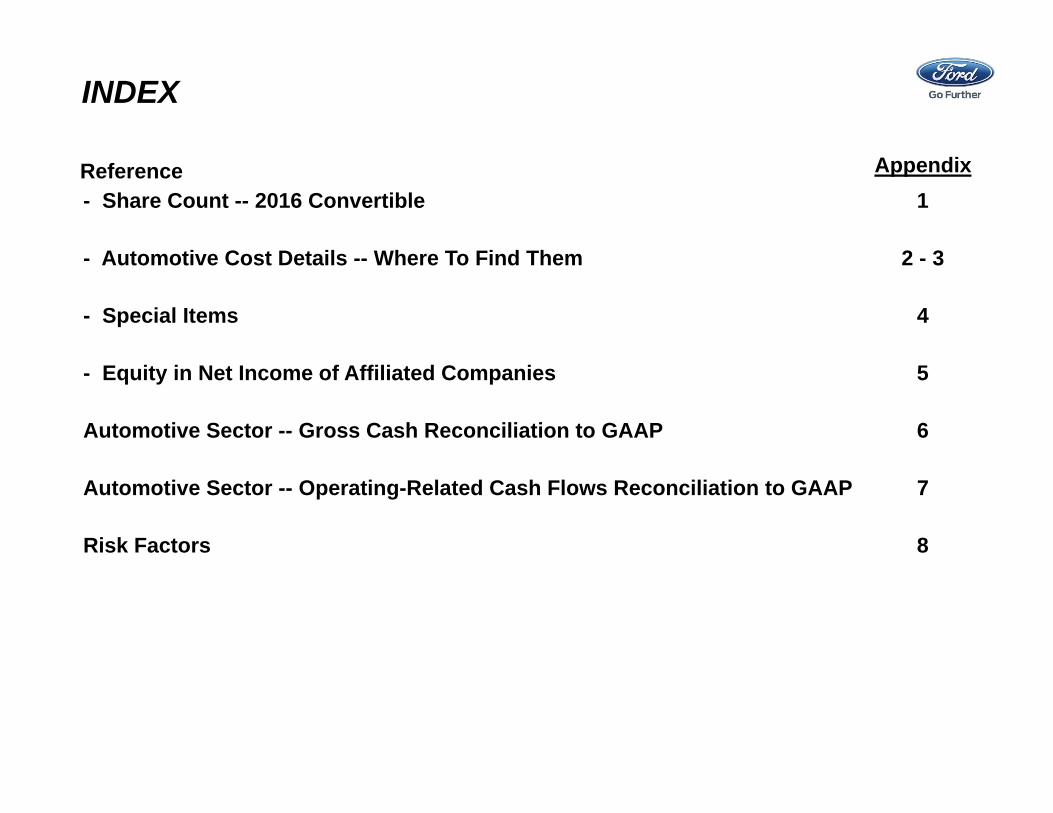
INDEX
- Share Count -- 2016 Convertible 1
- Automotive Cost Details -- Where To Find Them 2 - 3
- Special Items 4
- Equity in Net Income of Affiliated Companies 5
Automotive Sector -- Gross Cash Reconciliation to GAAP 6
Automotive Sector -- Operating-Related Cash Flows Reconciliation to GAAP 7
Risk Factors 8
AppendixReference

SLIDE 25
SHARE COUNT -- 2016 CONVERTIBLEBasic and Diluted Shares Related to 2016 Convertible (Mils.)
Full First Second Third Fourth FirstYear Quarter Quarter Quarter Quarter Quarter2013 2014 2014 2014 2014 2015
Average net dilutive shares from 2016 Convertible 98 100 101 101 47 - Average basic shares issued for 2016 Convertible - - - - 54 103 Average basic shares repurchased to offset dilution - - (14) (89) (103) (103)
Average diluted shares 98 100 87 12 (2) -
Shares Issued To Settle Conversions Of 2016 Convertible Were Offset By 2014 Share Repurchases
• The convertible debt has been included in our dilutive share count since issuance in 2009. In anticipation of settlement, we repurchased shares in 2014, which offset this dilution
• $882 million in 2016 convertibles were converted on a share settlement basis. This resulted in the issuance of 103 million shares which will be included in our average basic shares outstanding
APPENDIX 1

SLIDE 26
REFERENCEAUTOMOTIVE COST DETAILS -- WHERE TO FIND THEM
Income Statement Published Statement
Contribution Costs
Material (including commodity costs)
Cost of Sales 2014 10-K P.29 Commodity / Material are about 2/3 of Total Automotive
Freight Cost of Sales Not disclosed separately
Warranty (costs for basic warranty coverages and field service actions)
Cost of Sales 2014 10-K P. FS-71 2014 cost $3.85 Bils.
Customer service actions Cost of Sales Not disclosed separately
Structural
Depreciation / Amortization Cost of Sales 2014 10-K P. 68 2014 cost $4.3 Bils.
Labor Cost of Sales / S&A 2014 10-K P.13 Total number of employees was approximately 187,000; cost not disclosed separately
Engineering / R&D Cost of Sales 2014 10-K P.13 and P. FS-15 2014 cost $6.9 Bils.
Advertising S&A 2014 10-K P. FS-15 2014 cost $4.3 Bils.
Other Cost of Sales / S&A Not disclosed separately
Legal Cost of Sales Not disclosed separately
APPENDIX 2
SLIDE 27
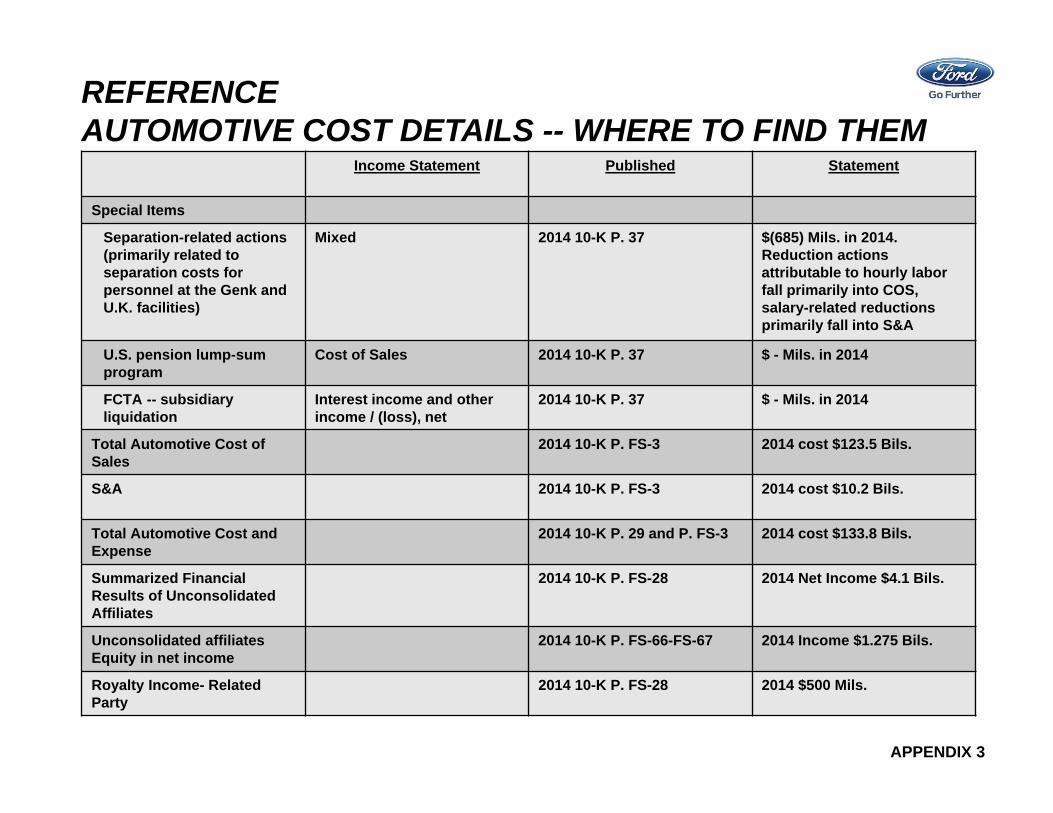
REFERENCEAUTOMOTIVE COST DETAILS -- WHERE TO FIND THEM
Income Statement Published Statement
Special Items
Separation-related actions (primarily related to separation costs for personnel at the Genk and U.K. facilities)
Mixed 2014 10-K P. 37 $(685) Mils. in 2014. Reduction actions attributable to hourly labor fall primarily into COS, salary-related reductions primarily fall into S&A
U.S. pension lump-sum program
Cost of Sales 2014 10-K P. 37 $ - Mils. in 2014
FCTA -- subsidiary liquidation
Interest income and other income / (loss), net
2014 10-K P. 37 $ - Mils. in 2014
Total Automotive Cost of Sales
2014 10-K P. FS-3 2014 cost $123.5 Bils.
S&A 2014 10-K P. FS-3 2014 cost $10.2 Bils.
Total Automotive Cost and Expense
2014 10-K P. 29 and P. FS-3 2014 cost $133.8 Bils.
Summarized Financial Results of Unconsolidated Affiliates
2014 10-K P. FS-28 2014 Net Income $4.1 Bils.
Unconsolidated affiliatesEquity in net income
2014 10-K P. FS-66-FS-67 2014 Income $1.275 Bils.
Royalty Income- Related Party
2014 10-K P. FS-28 2014 $500 Mils.
APPENDIX 3

SLIDE 28
SPECIAL ITEMS
2013 2014 2013 2014(Mils.) (Mils.) (Mils.) (Mils.)
Personnel-Related ItemsSeparation-related actions* (156)$ (251)$ (856)$ (685)$
Other ItemsVenezuela accounting change -$ (800)$ -$ (800)$ Ford Sollers equity impairment - - - (329) 2016 Convertible Notes settlement - (126) - (126) U.S. pension lump sum program (155) - (594) - FCTA -- subsidiary liquidation - - (103) - Ford Romania consolidation loss - - (15) -
Total other items (155)$ (926)$ (712)$ (1,255)$ Total special items (311)$ (1,177)$ (1,568)$ (1,940)$
Tax special items 2,080$ 181$ 2,157$ 494$
Memo:Special items impact on earnings per share** 0.43$ (0.25)$ 0.14$ (0.36)$
* Primarily related to separation costs for personnel at the Genk and U.K. facilities** Includes related tax effect on special items and tax special items
Fourth Quarter Full Year
APPENDIX 4

SLIDE 29
EQUITY IN NET INCOME OF AFFILIATED COMPANIES
APPENDIX 5
1Q 2Q 3Q 4Q FY(Mils.) (Mils.) (Mils.) (Mils.) (Mils.)
419$ 67$ 388$ 401$ 1,275$
Less: Special items
- (329) - - (329)
419$ 396$ 388$ 401$ 1,604$
* See page FS-2 in 2014 Form 10-K
** See page 37 in 2014 Form 10-K
2014
Ford Sollers equity impairment **
Equity in net income of affiliated companies *
Equity in net income of affiliated companies (excl. special items)
SLIDE 30
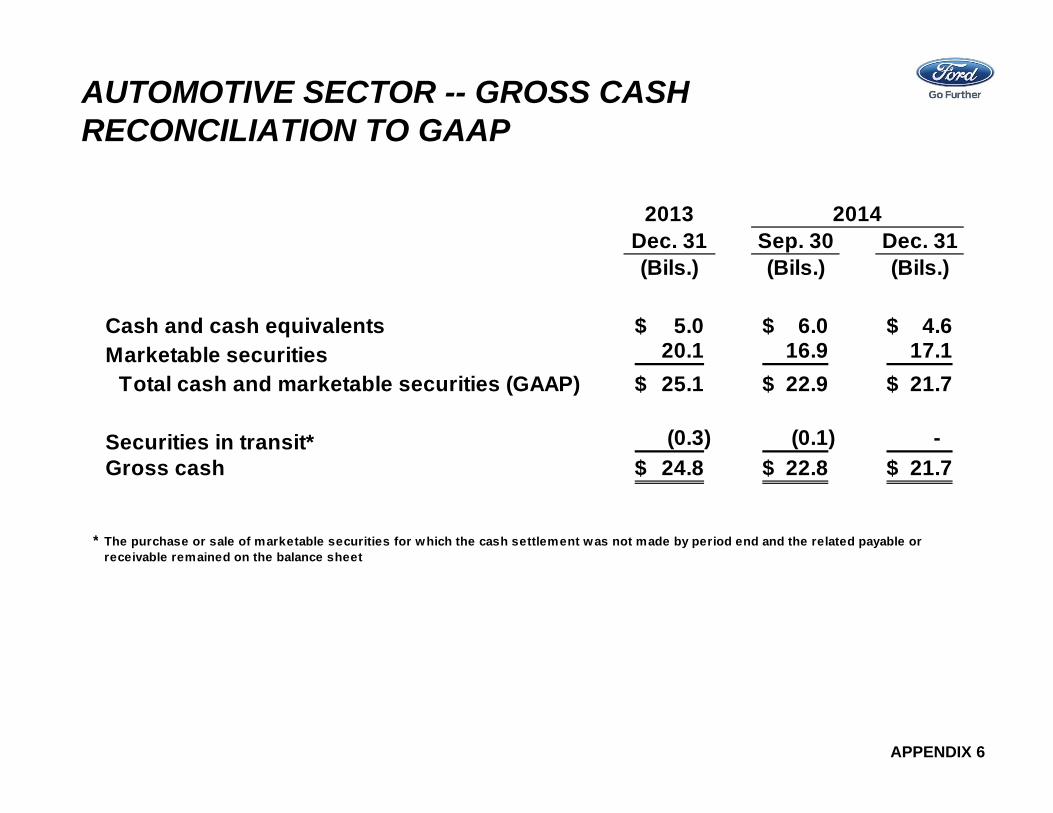
AUTOMOTIVE SECTOR -- GROSS CASH RECONCILIATION TO GAAP
Dec. 31 Sep. 30 Dec. 31(Bils.) (Bils.) (Bils.)
Cash and cash equivalents 5.0$ 6.0$ 4.6$ Marketable securities 20.1 16.9 17.1
Total cash and marketable securities (GAAP) 25.1$ 22.9$ 21.7$
Securities in transit* (0.3) (0.1) - Gross cash 24.8$ 22.8$ 21.7$
* The purchase or sale of marketable securities for which the cash settlement was not made by period end and the related payable orreceivable remained on the balance sheet
2013 2014
APPENDIX 6

SLIDE 31
AUTOMOTIVE SECTOR -- OPERATING-RELATED CASH FLOWS RECONCILIATION TO GAAP
APPENDIX 7
SLIDE 32
Statements included or incorporated by reference herein may constitute "forward-looking statements" within the meaning of the Private Securities Litigation Reform Act of 1995. Forward-looking statements are based on expectations, forecasts, and assumptions by our management and involve a number of risks, uncertainties, and other factors that could cause actual results to differ materially from those stated, including, without limitation:
Decline in industry sales volume, particularly in the United States or Europe, due to financial crisis, recession, geopolitical events, or other factors; Decline in Ford's market share or failure to achieve growth; Lower-than-anticipated market acceptance of Ford's new or existing products; Market shift away from sales of larger, more profitable vehicles beyond Ford's current planning assumption, particularly in the United States; An increase in or continued volatility of fuel prices, or reduced availability of fuel; Continued or increased price competition resulting from industry excess capacity, currency fluctuations, or other factors; Fluctuations in foreign currency exchange rates, commodity prices, and interest rates; Adverse effects resulting from economic, geopolitical, or other events; Economic distress of suppliers that may require Ford to provide substantial financial support or take other measures to ensure supplies of components or materials and could increase costs,
affect liquidity, or cause production constraints or disruptions; Work stoppages at Ford or supplier facilities or other limitations on production (whether as a result of labor disputes, natural or man-made disasters, tight credit markets or other financial
distress, production constraints or difficulties, or other factors); Single-source supply of components or materials; Labor or other constraints on Ford's ability to maintain competitive cost structure; Substantial pension and postretirement health care and life insurance liabilities impairing our liquidity or financial condition; Worse-than-assumed economic and demographic experience for postretirement benefit plans (e.g., discount rates or investment returns); Restriction on use of tax attributes from tax law "ownership change“; The discovery of defects in vehicles resulting in delays in new model launches, recall campaigns, or increased warranty costs; Increased safety, emissions, fuel economy, or other regulations resulting in higher costs, cash expenditures, and / or sales restrictions; Unusual or significant litigation, governmental investigations, or adverse publicity arising out of alleged defects in products, perceived environmental impacts, or otherwise; A change in requirements under long-term supply arrangements committing Ford to purchase minimum or fixed quantities of certain parts, or to pay a minimum amount to the seller ("take-or-
pay" contracts); Adverse effects on results from a decrease in or cessation or clawback of government incentives related to investments; Inherent limitations of internal controls impacting financial statements and safeguarding of assets; Cybersecurity risks to operational systems, security systems, or infrastructure owned by Ford, Ford Credit, or a third-party vendor or supplier; Failure of financial institutions to fulfill commitments under committed credit and liquidity facilities; Inability of Ford Credit to access debt, securitization, or derivative markets around the world at competitive rates or in sufficient amounts, due to credit rating downgrades,
market volatility, market disruption, regulatory requirements, or other factors; Higher-than-expected credit losses, lower-than-anticipated residual values, or higher-than-expected return volumes for leased vehicles; Increased competition from banks, financial institutions, or other third parties seeking to increase their share of financing Ford vehicles; and New or increased credit, consumer, or data protection or other regulations resulting in higher costs and / or additional financing restrictions.
We cannot be certain that any expectation, forecast, or assumption made in preparing forward-looking statements will prove accurate, or that any projection will be realized. It is to be expected that there may be differences between projected and actual results. Our forward-looking statements speak only as of the date of their initial issuance, and we do not undertake any obligation to update or revise publicly any forward-looking statement, whether as a result of new information, future events, or otherwise. For additional discussion, see "Item 1A. Risk Factors" in our Annual Report on Form 10-K for the year ended December 31, 2014, as updated by our subsequent Quarterly Reports on Form 10-Q and Current Reports on Form 8-K.
RISK FACTORS
APPENDIX 8