2015 investor briefing - strategy day - woodside … copy of woodside’s 2016 investor briefing day...
TRANSCRIPT

ASX Announcement Friday, 20 May 2016 ASX: WPL OTC: WOPEY
Woodside Petroleum Ltd.
ACN 004 898 962
Woodside Plaza
240 St Georges Terrace
Perth WA 6000
Australia
www.woodside.com.au
2016 INVESTOR BRIEFING DAY
Woodside’s Investor Briefing Day is scheduled to take place on Friday 20 May 2016, commencing at 8.00am AEST/6.00am AWST, and concluding at 12.00pm AEST/10.00am AWST. To access the live webcast of the Investor Briefing Day, follow the link from our website: www.woodside.com.au. A copy of Woodside’s 2016 Investor Briefing Day slide pack is attached. Contacts:
MEDIA Michelle Grady W: +61 8 9348 5995 M: +61 418 938 660 E: [email protected]
INVESTORS Craig Ashton W: +61 8 9348 6214 M: +61 417 180 640 E: [email protected]
Driving Value Growth
2016 Investor Briefing Day | 20 May 2016 | Sydney, Australia
This presentation contains forward looking statements that are subject to risk factors associated with oil and gas businesses. It is believed that the expectations reflected in these statements are reasonable as at the date of this presentation but they may be affected by a variety of variables and changes in underlying assumptions which could cause actual results or trends to differ materially, including but not limited to: price fluctuations, actual demand, currency fluctuations, drilling and production results, reserve estimates, loss of market, industry competition, environmental risks, physical risks, legislative, fiscal and regulatory developments, economic and financial market conditions in various countries and regions, political risks, project delay or advancement, approvals and cost estimates. Readers are cautioned not to place undue reliance on these forward looking statements. No representation is made or will be made that any forward looking statements will be achieved or will prove to be correct. We do not undertake to update or revise any forward looking statement, whether as a result of new information, future events or otherwise.
All references to dollars, cents or $ in this presentation are to US currency, unless otherwise stated.
References to “Woodside” may be references to Woodside Petroleum Ltd. or its applicable subsidiaries.
Peer group refers to Anadarko, Apache, ConocoPhillips, ENI, Hess, Inpex, Marathon Oil, Murphy Oil, Oil Search, Origin Energy, Pioneer, Repsol, Santos, Statoil, Tullow Oil.
Disclaimer and important notice
2016 Investor Briefing Day 2

Sheraton on the Park floor plan
Evacuate:
Alert: Beep Beep
Evacuate: Whoop Whoop
Muster point:
Exit hotel and turn right along
ELIZABETH Street
Muster point is on the corner
of ELIZABETH and PARK
Street in HYDE PARK
Grand Ballroom 1 Grand Ballroom 2
Exits to Grand Staircase
Pre-function area
2016 Investor Briefing Day 3

Agenda
Start Topic Presenter
Session 1
8:00 Introduction Fiona Hick
8:05 CEO Overview Peter Coleman
8:20 Financial Management Lawrie Tremaine, Anthea McKinnell
8:35 Marketing, Trading and Shipping Reinhardt Matisons
9:00 Capability and Technology Shaun Gregory
9:20 Question & Answer (Session 1) Peter Coleman
9:45 Morning Tea
Session 2
10:15 North West Australia Mike Utsler, Niall Myles
10:45 Canada Darren Flynn
11:00 Myanmar Phil Loader
11:10 Atlantic Margins and sub-Saharan Africa Phil Loader
11.20 Exploration Strategy Phil Loader
11:30 Question & Answer (Session 2) and Wrap-up Peter Coleman
12:00 Lunch
2016 Investor Briefing Day 4

CEO Overview
Creating value across the business cycle
Peter Coleman | Chief Executive Officer and Managing Director

Elements for success
Our competitive position
strong balance sheet and robust free cash flow
world-class, low-cost assets
track record of operational excellence and proven development expertise
disciplined decision-making, prioritised capital allocation and a clear business model
driving down development and operating costs through technology and capabilities
Committed to earliest commercialisation of our world-class growth opportunities
leveraging our existing infrastructure for low-risk opportunities
investment-ready in multiple projects
A strong foundation for growth
2016 Investor Briefing Day 6
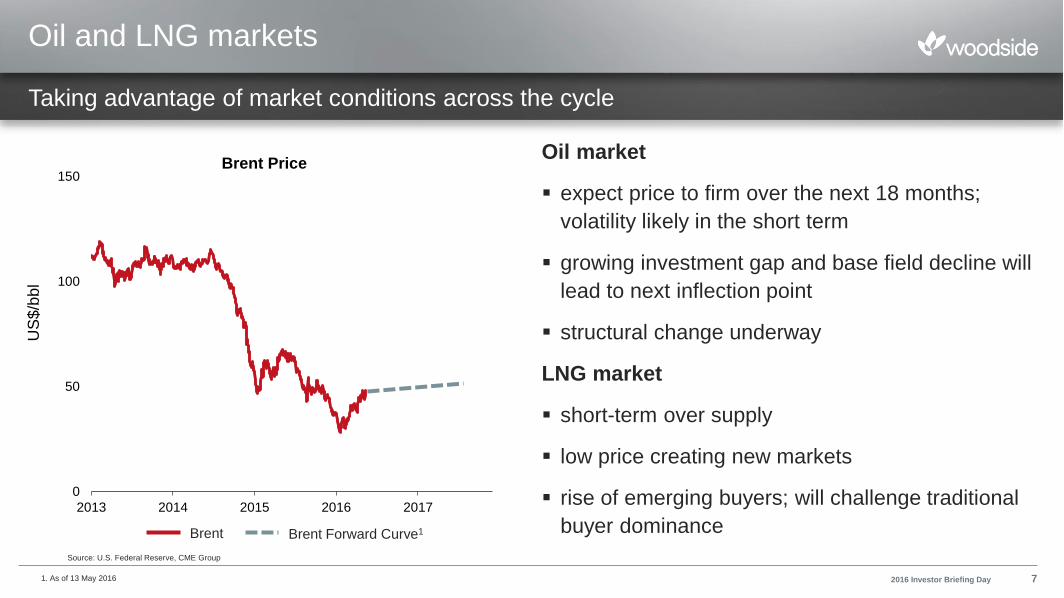
0
50
100
150
2013 2014 2015 2016 2017
US
$/b
bl
Brent PriceOil market
expect price to firm over the next 18 months;
volatility likely in the short term
growing investment gap and base field decline will
lead to next inflection point
structural change underway
LNG market
short-term over supply
low price creating new markets
rise of emerging buyers; will challenge traditional
buyer dominance
Oil and LNG markets
Brent Brent Forward Curve1
Source: U.S. Federal Reserve, CME Group
Taking advantage of market conditions across the cycle
2016 Investor Briefing Day 71. As of 13 May 2016
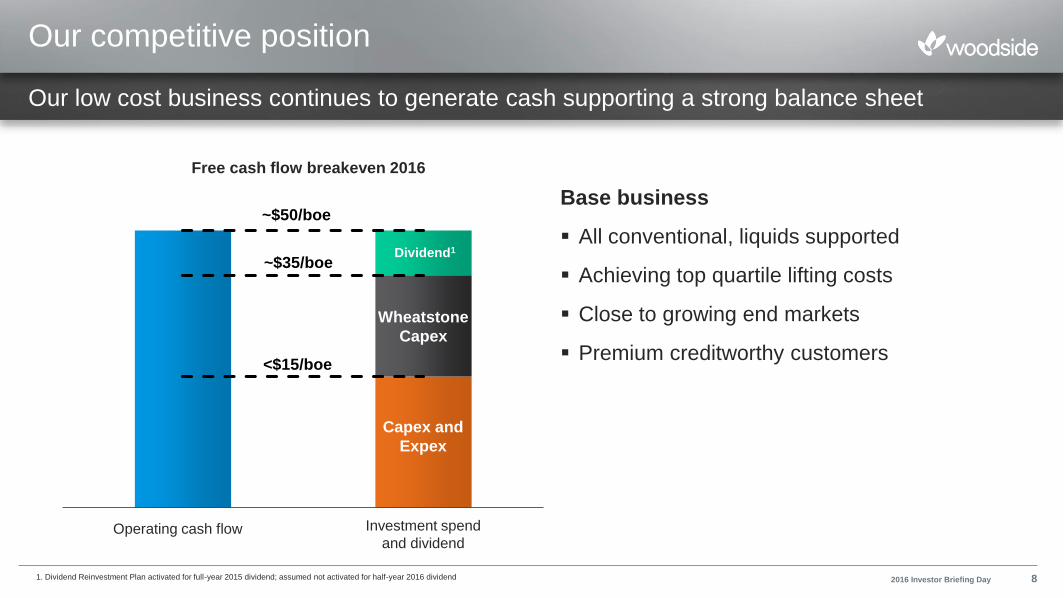
-
500
1,000
1,500
2,000
2,500
Operating cash flow Investing cash flow
<$15/boe
~$35/boe
~$50/boe
Capex and
Expex
Wheatstone
Capex
Our low cost business continues to generate
cash supporting a strong balance sheet
Our competitive position
Base business
All conventional, liquids supported
Achieving top quartile lifting costs
Close to growing end markets
Premium creditworthy customers
1. Dividend Reinvestment Plan activated for full-year 2015 dividend; assumed not activated for half-year 2016 dividend
Free cash flow breakeven 2016
Dividend1
Investment spend
and dividendOperating cash flow
2016 Investor Briefing Day 8
Our low cost business continues to generate cash supporting a strong balance sheet

Value creation in a changing market
Wheatstone: safe and earliest start up
Browse: phased, highest value development first
Myanmar: early development of both discoveries
and further exploration
Kitimat: further confirmation of the world class
Liard basin resource
NWS: plateau extension via exploration and
aggregation of undeveloped resources
Greater Enfield: expect FID mid 2016
Drive our operating and capital cost base to best
in class
Decisive action over the next two years
Canada Atlantic
rim
North West
Australia
Myanmar
sub-
Saharan
Africa
Focus areas
2016 Investor Briefing Day 9

How we will create value
Productivity gains, project development and exploration
Projects and opportunities
Significant value creation from:
Discovered resources
Leveraging infrastructure
First mover advantage
Productivity enhancements
Technology and capability
1. Includes risk covered (positive expected monetary value) prospects only. Excludes portfolio leads and concepts
2. Other Resource Owners (ORO): Third-party owned gas produced via existing Woodside owned facilities 2016 Investor Briefing Day 10
LNG plateau extension
Wheatstone
Greater Enfield
Browse
KitimatMyanmar
Corpus Christi
Exploration1
LNG ORO2
Cost & reliability
Capital & technology
Ris
k
Time
ExplorationFuture Projects
Base Business Sales ContractsPlateau Extension
Under Development

Well developed project pipeline increasing resource base
Our growth trajectory
2016 Investor Briefing Day 11
Committed
1. NWS Other Resource Owner (ORO) assumes tolling and is not beneficially owned. Refer to slide 49
2. Browse final volumes dependent on phasing
3. Assumes 50% of Kitimat 2C
2016-2020
Resource
(MMboe)
Greater Western Flank 1 and 2 ~100 (2P)
Wheatstone ~250 (2P)
Persephone ~20 (2P)
Greater Enfield ~40 (2C)
Replace production with developed reserves
2021-2025Significant growth and gas market recovery
2025+Sustained gas and liquids growth
Resource
(MMboe)
NWS ORO 30+ Tcf to capture1
NWS Exploration Prospective
Myanmar A-6, AD-7 ~80 (2C)
Browse Phase 1 ~380-5002 (2C)
Kitimat ~13003 (2C)
Resource
(MMboe)
Browse Phase 2 ~500-6202 (2C)
Sunrise ~370 (2C)
Myanmar, Atlantic rim and
Sub Sahara African growthProspective

Capital allocation
Maintain robust balance sheet and service debt
Value accretive growth
Earliest phased development of captured resources
High graded exploration
Potentially acquire exploration acreage or discovered resource to build on existing regional positions
Earliest practical distributions to shareholders
Service debt, grow our business and return funds to shareholders
2016 Investor Briefing Day 12

Differentiated position through our operational excellence, track record and disciplined decision-making
Demonstrated competitive advantage through our capabilities across the oil and gas value chain
Committed to earliest commercialisation of our growth opportunities
Strong financial position with operating cash flow and balance sheet supporting dividends and growth
Key messages
Strategy is delivering on commitments
2016 Investor Briefing Day 13

Financial Management
Differentiated business performance and balance sheet to fund growth
Lawrie Tremaine | Chief Financial Officer
Anthea McKinnell | Vice President Treasury and Taxation
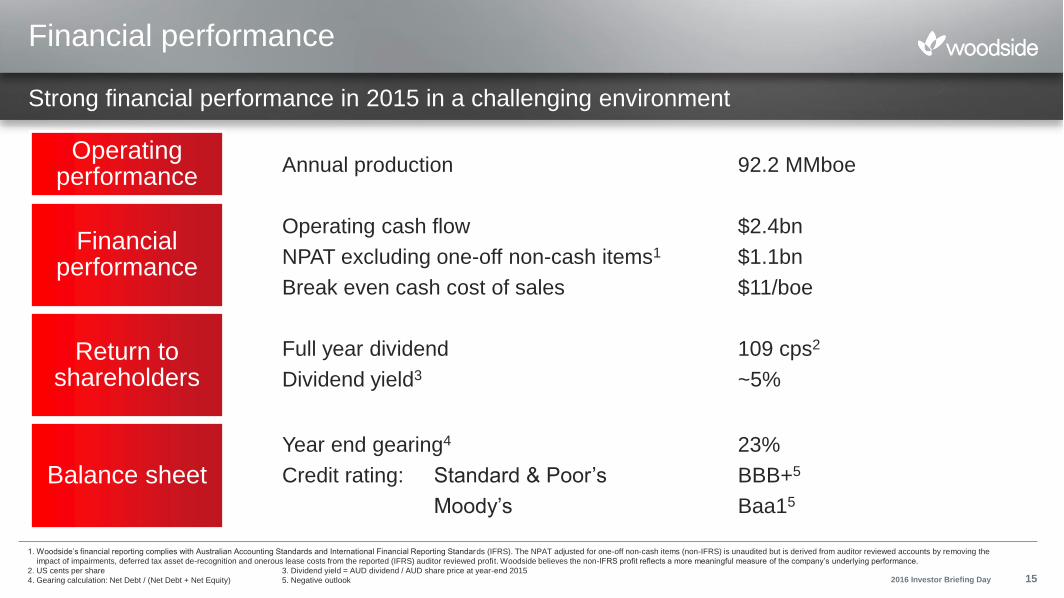
Annual production 92.2 MMboe
Operating cash flow $2.4bn
NPAT excluding one-off non-cash items1 $1.1bn
Break even cash cost of sales $11/boe
Full year dividend 109 cps2
Dividend yield3 ~5%
Year end gearing4 23%
Credit rating: Standard & Poor’s BBB+5
Moody’s Baa15
Financial performance
Strong financial performance in 2015 in a challenging environment
Operating performance
Financial performance
Return to shareholders
Balance sheet
1. Woodside’s financial reporting complies with Australian Accounting Standards and International Financial Reporting Standards (IFRS). The NPAT adjusted for one-off non-cash items (non-IFRS) is unaudited but is derived from auditor reviewed accounts by removing the
impact of impairments, deferred tax asset de-recognition and onerous lease costs from the reported (IFRS) auditor reviewed profit. Woodside believes the non-IFRS profit reflects a more meaningful measure of the company’s underlying performance.
2. US cents per share 3. Dividend yield = AUD dividend / AUD share price at year-end 2015
4. Gearing calculation: Net Debt / (Net Debt + Net Equity) 5. Negative outlook 2016 Investor Briefing Day 15

Source: IHS
-20%
-10%
0%
10%
20%
2012 2013 2014 2015
Return on capital employed2
Peer group range Woodside Peer group average
-20%
0%
20%
40%
2012 2013 2014 2015
Reported profit margin1
Peer group range Woodside Peer group average
Profitability
Peer leading performance
Source: Bloomberg
1. 2015 data not available for one peer
2. Return on capital employed calculation: Net income + Non-controlling interest + [Finance costs x (100 – Effective tax rate)] / [(Current capital employed + Prior capital employed) / 2]
3. Current capital employed = Total debt + Equity2016 Investor Briefing Day 16

Differentiated LNG revenue
Contract portfolio provides support in a low oil price environment
1. A portfolio mix of DES and FOB
2. Japanese Crude Cocktail is the average price of customs-cleared crude oil imports into Japan, JCC is lagged by 3 months
LNG realised pricing1 vs JCC2
Q1 2016 realised price of ~$8/mmbtu
70
80
90
100
110
Q2 2015 Q3 2015 Q4 2015 Q1 2016
Index (
Q2
-15 =
100)
Woodside JCC (Lagged)
2016 Investor Briefing Day 17

Cost of sales
Well established cost reduction trend
1. ‘Other’ costs includes royalty and excise, shipping and direct sales costs, carbon costs and insurance, excludes onerous lease E&E, G&A, DD&A, PRRT and income tax. Assumed 2016 AUD/USD rate 0.74 and Brent oil price $40
2. Data not available for one peer
Source: IHS
0
2
4
6
8
10
12
14
16
18
2013 2014 2015 2016E
Weighted average unit cash cost of sales
Production costs Other
Targeting
~10%
further
reduction
Unit production costs2
-35%
(US
$/b
oe
)
1
2016 Investor Briefing Day 18
0
2
4
6
8
10
12
14
16
18
2013 2014 2015 2016E
US
$/b
oe
Woodside Peer Average

0
500
1000
1500
2000
2500
2016E 2017-2018 Average
US$
mill
ion
Investment expenditure
Base Business Wheatstone Other Growth Exploration & Myanmar appraisal
2017-2018 Average
Plateau Extension
Sustaining
Planned investment spend
Investing in identified growth opportunities
Base business1 spend trending down
Continuing to invest in growth
Browse and Kitimat investment through
front-end phases
1. Base Business includes Pluto, NWS, Australian Oil and Corporate
2. Wheatstone includes Julimar
1 2 3
2016 Investor Briefing Day 19
4 4
3. Other Growth includes Greater Enfield, Kitimat and Browse
4. Not committed, subject to business priorities and market conditions

Upstream cash flow break even
1. Data not available from one peer
2. “Woodside ex-Wheatstone” is a Woodside calculation based on Wood Mackenzie Corporate Service data minus a Woodside estimate of its share of Wheatstone capex in 2016.
Low cash flow break even
Level of exploration investment
consistent with peers
Low cash flow break even reflects
asset quality
Low production cost
Low sustaining capex
2016 Investor Briefing Day 20
0
20
40
60
80
100
120
140
160
1802016 Cash flow breakeven analysis1
Base business Exploration
US
$/b
bl(B
rent)
WoodsideWoodside
ex-Wheatstone2
Source: Wood Mackenzie Corporate Service, Q1 2016

0%
10%
20%
30%
40%
50%
60%
70%
80%
-10% 0% 10% 20% 30% 40% 50% 60%
Gearing (
year-
end 2
015)
Funds from Operations to Total Debt (2015)
Operating cash flow and balance sheet supports dividends and growth
Gearing
Source: Bloomberg
Gearing 23% at 31 December 2015
Well positioned to fund growth within
target gearing range of 10%-30%
80% payout ratio for foreseeable future2
1. 2015 data not available for two peers
2. Subject to the demands of significant new capital investments or if business performance or external circumstances change materially.
Woodside vs peer group1
2016 Investor Briefing Day 21
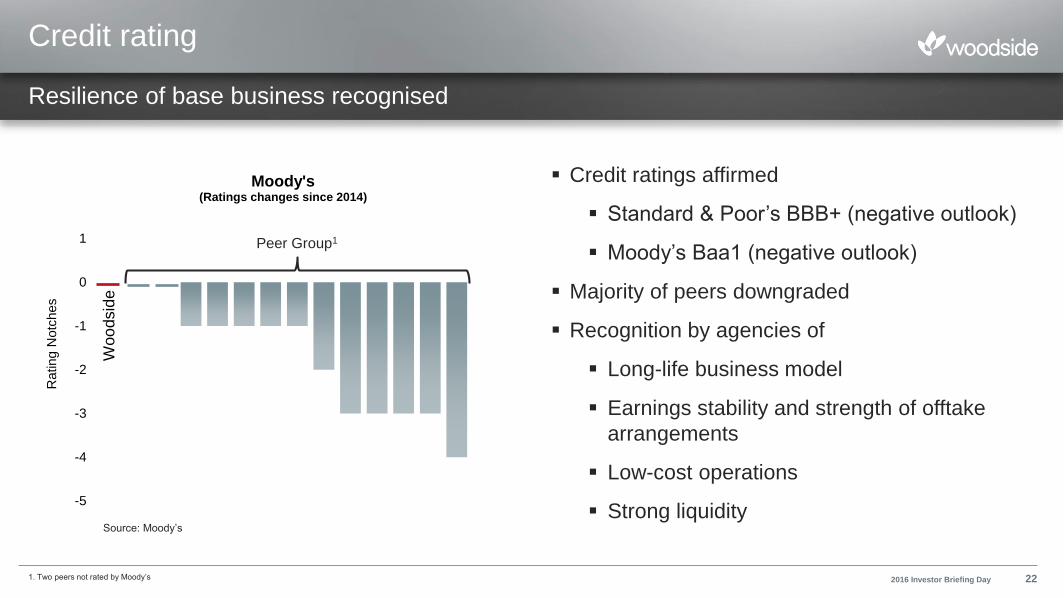
Woo
dsid
e
-5
-4
-3
-2
-1
0
1
Rating N
otc
hes
Moody's (Ratings changes since 2014)
Credit rating
Resilience of base business recognised
Source: Moody’s
Peer Group1
1. Two peers not rated by Moody’s
Credit ratings affirmed
Standard & Poor’s BBB+ (negative outlook)
Moody’s Baa1 (negative outlook)
Majority of peers downgraded
Recognition by agencies of
Long-life business model
Earnings stability and strength of offtake
arrangements
Low-cost operations
Strong liquidity
2016 Investor Briefing Day 22

Liquidity
$1.8bn1 in liquidity, targeting $2bn by end
2016
Negligible near term maturities
Access to funding is maintained
Raised $4.1bn in 2015, strong debt
market support
Pre-tax portfolio cost of debt 2.9% p.a.1
Plan to further extend maturities by end
2017
Flexibility and capacity to fund growth
1. As at 30 April 2016
0
500
1000
1500
2000
2016 2017 2018 2019 2020 2021 2022 2023 2024 2025 2026+
US
$ m
illio
ns
Current maturity profile1
Drawn Undrawn
0
500
1000
1500
2000
2016 2017 2018 2019 2020 2021 2022 2023 2024 2025 2026+
US
$ m
illio
ns
Planned maturity profile
2016 Investor Briefing Day 23

Structured program since late 2013
Cumulative benefits $1.9 billion expected by
end 2016
Annual benefits $0.85 billion expected from
end 2016
60% of operating cost reductions are
sustainable
Productivity
Benefits1
($m)
Annual run rate end 2016
Target Expected
Volume 300 ~4002
Operating cost 250 ~250
Capital cost 250 ~200
Total 800 ~$850
1. Benefits: Volume benefits relative to 2010-2013 average capacity & reliability, Opex savings relative to 2013 actual, Capex relative to 2013 look forward plan
2. Volumes valued at $65/bbl oil price
Program is delivering on promise
2016 Investor Briefing Day 24

Volume benefits
Reliability and capacity improvements exceeding expectations
Drivers of result:
Reliability
Capacity
Maintenance performance
Constraints management0
1
2
3
4
5
6
7
8
2014 2015 2016
MM
boe
Volume benefits
Target Actual
Targeted 3-5% increase on 2010-2013
reliability & capacity
Now expect 8% sustainable increase
2016 Investor Briefing Day 25

Spend reduction
Sustainable cost reductions achieved
Investment spend1
Target 10-20% expected 17%
Capital Exploration
Original plan 20162 ~2,300 ~650
Current 2016E ~1,700 ~350
Gross Savings ~600 ~300
1. Investment spend includes exploration2. 2013 forward plan for 2016
40% Price (reduction in rates / contract prices)
40% reduction in rig rate contract
Renegotiation of 100+ long term supply contracts
40% Demand (reduce demand for products or services)
Reduced marine service fleet from 3 to 2 vessels
New coating system to eliminate annual corrosion paint
protection
Engineering standards updated (3-5% future capex
reduction)
Capital project scope reductions, eg Pluto Xena project
20% Process (simplify our business)
Risk based inspection instead of annual inspection regimes
Operating costs
Target 10-20% expected 27%
2013 Actual 920
2016E 670
Savings ~250
262016 Investor Briefing Day
Claimed savings
Continuing scope ~200
Similar portfolio outcomes ~300
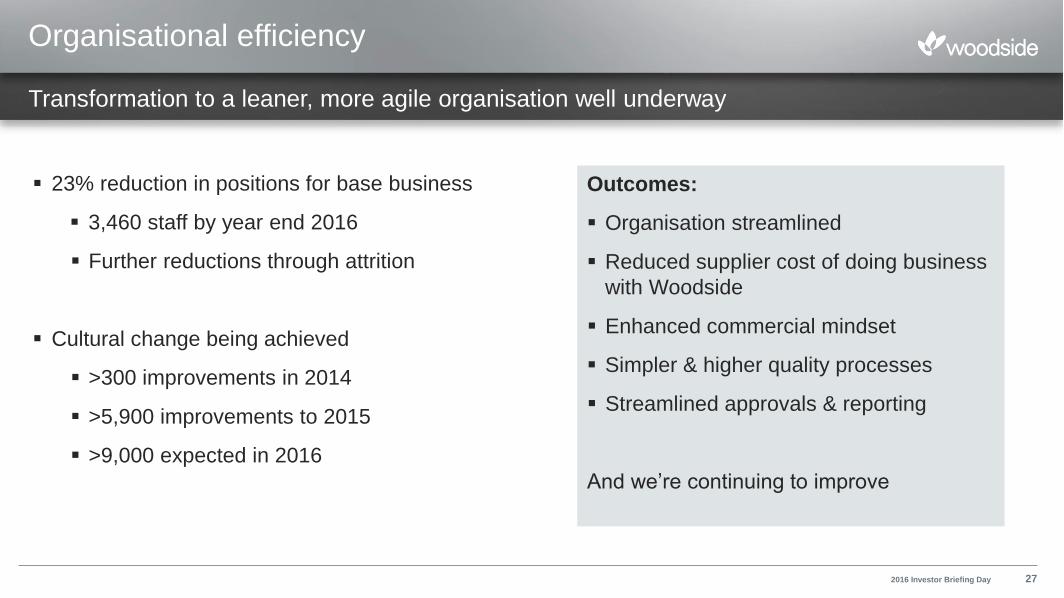
23% reduction in positions for base business
3,460 staff by year end 2016
Further reductions through attrition
Cultural change being achieved
>300 improvements in 2014
>5,900 improvements to 2015
>9,000 expected in 2016
Organisational efficiency
Outcomes:
Organisation streamlined
Reduced supplier cost of doing business
with Woodside
Enhanced commercial mindset
Simpler & higher quality processes
Streamlined approvals & reporting
And we’re continuing to improve
Transformation to a leaner, more agile organisation well underway
2016 Investor Briefing Day 27
Key messages
Well positioned to fund growth
Financial performance reflects high quality assets & disciplined management
Low oil price serves to highlight our strong competitive position
Preserved ability to fund growth
Delivered sustainable cost and productivity improvements with more to come
2016 Investor Briefing Day 28

Marketing, Trading and Shipping
Preferred supplier of premium product
Reinhardt Matisons | Executive Vice President Marketing, Trading and Shipping

-10
0
10
20
30
40
50
1990 1995 2000 2005 2010 2015 2020
Mtp
a
LNG historical FIDs vs. Global demand
FID Volumes Y-Y change in Global Demand
~20 Mtpa1
1990
FID volumes Y-Y change in global demand
LNG outlook
New supply sanction required from 2018 to meet forecast demand
Source: Wood Mackenzie
Short to medium-term oversupply, but
cycle continues
Supply shortfall developing from
2022+, driven by growth in emerging
markets
New supply sanction required from
2018 to meet demand
On average, sanction of additional
~20 Mtpa capacity required annually
0
100
200
300
400
500
600
2016 2021 2026 2031
Mtp
a
Global Supply (Operational) Global Supply (Under Construction) Total Demand
FID Window 2018+Demand Window 2022+
Global supply (operational)
1. Average annual FID capacity required to meet 2022-2027 demand, assumes a 5-year construction time for new capacity
Source: Wood Mackenzie
Global supply (under construction) Total demand
2016 Investor Briefing Day 30
LNG supply and demand

LNG pricing
Prices have converged
Physical liquidity remains strong
Regionalisation reflects lack of Atlantic/Asia
arbitrage
Limited long-term deals
Weakening mid-term prices, recent
agreements show ~20% reduction in
indexation versus 2013
Premiums remain for rich/reliable supplies
Low prices will stimulate demand, making the
market more diversified and resilient
Price recovery expected from 2018 with
requirement for sanction of new supply
Improving price outlook from 2018
1. Market proxy; illustrative only
2. JKM: Japan Korea Marker (Source: Platts)
0
2
4
6
8
10
12
14
16
18
20
Jan-13 Jul-13 Jan-14 Jul-14 Jan-15 Jul-15 Jan-16
US
$/M
MB
tu
Historical spot vs term pricing
Proxy* Mid Term Price (notional 2013 formula) JKM Proxy* Long Term Japan Contracts121
2016 Investor Briefing Day 31

LNG customers
Established customers seeking flexibility to manage
uncertainty
Shorter contracts for incremental quantities, FOB1
delivery, destination flexibility
Increasing use of tenders
Continued preference for oil-linked prices east of Suez
Emerging customer base unlocked by floating storage
and re-gasification units
Different risk profile
Integrated solutions often preferred
Reducing dominance of traditional buyers
Increasing involvement of suppliers to build market
Customer base increasing
Woodside Rogers berthing at Ain Sokhna FSRU2 in Egypt (2015)
1. Free on board
2. Floating storage and regasification unit 2016 Investor Briefing Day 32

LNG strategy
Underpin revenue with long-term take-or-pay contracts
Proven reserves
Market-based price reviews and downside price mitigation
Transition to portfolio sales for balance of LNG production
Maintain buffer for spot sales to manage uncertainty and ensure reliable delivery of term sales
Sell DES1 and enhance margins through delivery optimisation and access to low-cost shipping
Build supply, customer and price indexation diversity to enhance portfolio flexibility
Create demand including gas-to-power and transport fuels
Disciplined evolution from Asia Pacific point-to-point seller to a global portfolio supplier
1. Delivered ex-ship to destination port2016 Investor Briefing Day 33
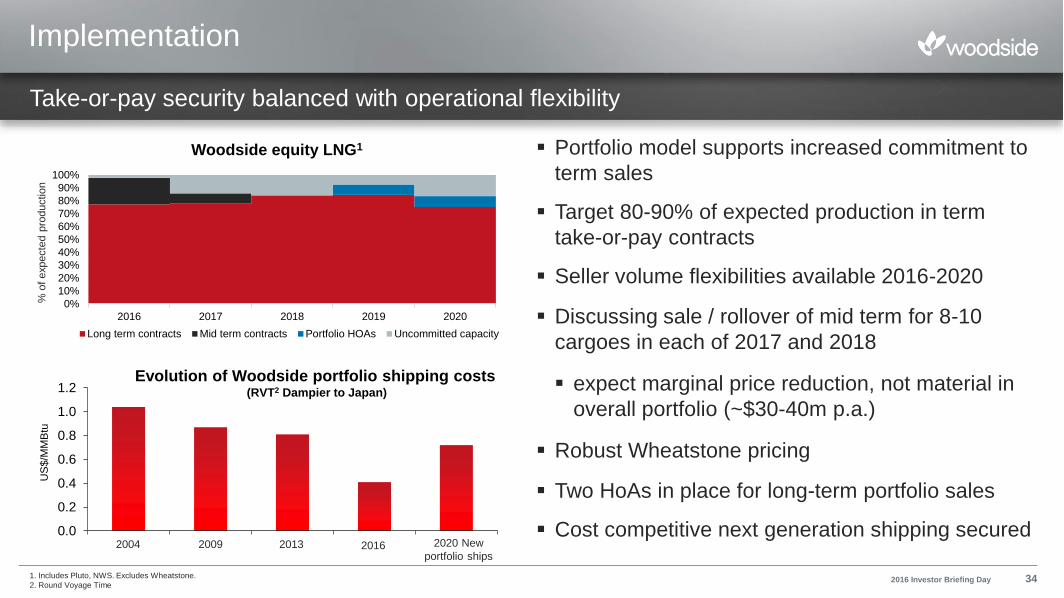
Implementation
Portfolio model supports increased commitment to
term sales
Target 80-90% of expected production in term
take-or-pay contracts
Seller volume flexibilities available 2016-2020
Discussing sale / rollover of mid term for 8-10
cargoes in each of 2017 and 2018
expect marginal price reduction, not material in
overall portfolio (~$30-40m p.a.)
Robust Wheatstone pricing
Two HoAs in place for long-term portfolio sales
Cost competitive next generation shipping secured0.0
0.2
0.4
0.6
0.8
1.0
1.2
US
$/M
MB
tu
2004 2009 2013 2016 2020 New
portfolio ships
Take-or-pay security balanced with operational flexibility
% o
f expecte
d p
roductio
n
1. Includes Pluto, NWS. Excludes Wheatstone.
2. Round Voyage Time
Evolution of Woodside portfolio shipping costs(RVT2 Dampier to Japan)
0%
10%
20%
30%
40%
50%
60%
70%
80%
90%
100%
2016 2017 2018 2019 2020
Woodside equity LNG1
Long term contracts Mid term contracts Portfolio HOAs Uncommitted capacity
2016 Investor Briefing Day 34

Outcomes
2015/16 long term price review outcomes
11 reviews completed in principle
Strong oil linkage, 85%+ oil parity
~US$65 million to Woodside in reconciliation
payments to be received 2016
Prices realised for spot cargoes have exceeded
spot benchmarks by an average of 6.5%
Resilient price outcomes
Source Historical Brent: Platts
-10
0
10
20
30
40
50
60
70
-1
0
1
2
3
4
5
6
7
Jan-2015 Jul-2015 Jan-2016
Date
d B
rent
(US
$/b
bl)
Pre
miu
m to
JK
M (
FO
B E
qu
iva
len
t, U
S$/M
MB
tu)
Realised Long Term, Mid Term and Spot Premium to JKM (FOB Equivalent)
Long Term Contracts Mid Term Contracts Spot Brent (RHS)
2016 Investor Briefing Day 35

Corpus Christi
Ramping up from July 2020 to one cargo a month
Improves supply diversity of Woodside’s portfolio
Supports pursuit of new Atlantic basin
opportunities
Engaging with Central and South American
buyers
Alternatives available
Delivery to Asia opens at oil prices above
US$30-35/bbl, fully profitable above US$55-
60/bbl
Discussing European options to mitigate
potential impact of low prices
Provides supply diversity and supports new market opportunities
Corpus Christi, courtesy of Cheniere
2016 Investor Briefing Day 36

Well positioned to manage uncertainty as LNG market evolves
Strong realised LNG prices
Portfolio continues to be underpinned by long term take-or-pay contracts
11 price reviews completed in principle in 2015/16 with robust oil linkage
Uncommitted supply within target range
Progressing long term HoAs to SPAs to provide platform for growth
Secured cost competitive next generation shipping
Pursuing new markets and opportunities for demand creation
New supply needs to be sanctioned from 2018 to meet forecast global demand
Development projects aligned to market timing, low cost development key to success
Key messages
Continued disciplined evolution from Asia Pacific point-to-point seller to global portfolio supplier
2016 Investor Briefing Day 37

Capability and Technology
Combining capability and technology to drive down costs across our value chain
Shaun Gregory | Senior Vice President and Chief Technology Officer

http://youtu.be/MSCPoe9JAvI
Video - Harnessing Disruption
2016 Investor Briefing Day 39

Innovating to improve concepts and reduce costs
Culture, capability and innovation
Innovation culture: “Think Big, Prototype Small, Scale Fast”
Full value chain capability built on 30 years experience
Business impact: Improve concepts and reduce costs to create growth
Reduced exploration cycle time
and improved success rate
Insights from data to reduce lifting
cost and protect high reliabilityPotential to reduce operating cost
through spares on demand
Saving time, driving efficiency and
reducing cost
Full-Waveform inversion Data analytics 3D printing Cognitive computing
2016 Investor Briefing Day 40

0
800
1600
2400
2010 2012 2014 2016 2018
Innovating to achieve top-decile LNG liquefaction cost
Full value chain capability: LNG liquefaction costs
Liquefaction costs account for ~50% of the
total cost of an LNG project
All developments to target <$800/tpa unit
cost
NextGen III vs Pluto Modular Construction:
Reduction in modules from 80 to <10
>60% reduction in site man-hours and
LNG train footprint
>30% reduction in structural steel weight
1. Woodside analysis. LNG liquefaction cost includes liquefaction, storage and offloading. Basis is [Engineering procurement construction cost] / [Stream day capacity] (ie, does not consider owners cost or availability)
$/tpa
Target
2016 Investor Briefing Day 41
LNG liquefaction costs1

Reductions >20% observed in many upstream cost categories in 2015
1. Global cost reductions from Q4 2014 to Q4 2015. All cost reductions in USD terms
Reducing upstream costs by:
eliminating and optimising scope
through technology and innovation
taking advantage of current market
conditions
0%
5%
10%
15%
20%
25%
30%
35%
40%
45%
Steel products Drilling
Offshoreinstallation
vesselsSubsea
equipmentConstruction
labour
Engineeringand project
management
2015 Global cost reductions1
Full value chain capability: Upstream costs
Woodside outcomes
2016 Investor Briefing Day 42
Source: IHS Upstream Capital Costs Service

Acquisition Current View Future Concept
Bre
akeven L
NG
Price
2
Kitimat
Driving down costs, with line-of-sight to top-decile breakeven prices
1. Top-decile breakeven prices for global pre-FID LNG developments (Wood Mackenzie)
2. Breakeven LNG price (DES North Asia) is the unit price in today’s dollars which, if realised on all LNG volumes, will result in the project generating a net present value of zero on a full-life-cycle basis for a given rate of return
Achieved ~40% reduction in cost of supply since
the onshore Kimberley concept
Achieved ~20% reduction in cost of supply since
acquisition through innovation and technology
Top-decile1
Full value chain capability: Improved concepts
Top-decile1
Onshore Kimberley Current View Future Concept
Bre
akeven L
NG
Price
2
Browse
2016 Investor Briefing Day 43

Key messages
Leveraging our culture: our people are
driving change across our business
Innovation across the full value chain
To deliver 2.4 Bboe of growth projects
over the next decade2
Greater Enfield FID mid-2016
Myanmar appraisal drilling 1H 2017
Browse complete concept selection
2H 2017
Kitimat targeting LNG demand window
in mid-2020’s
Innovating to improve concepts and reduce costs
1.5Bboe
2.4Bboe
2.0Bboe
• Greater Enfield• Myanmar1
• Browse• Kitimat2
2PRemaining 2C
2C matured to 2P by 2025
1.5 Bboe
2.4 Bboe
2.0 Bboe
• Greater Enfield• Myanmar• Browse• Kitimat1
1. 50% of Kitimat 2C assumed to mature to 2P2. Woodside targets 2016 Investor Briefing Day 44

Question and Answer
Peter Coleman | Chief Executive Officer and Managing Director

Return at 10:15am AEST
Morning Tea

Schedule
Start Topic Presenter
Session 2
10:15 North West Australia Mike Utsler, Niall Myles
10:45 Canada Darren Flynn
11:00 Myanmar Phil Loader
11.10 Atlantic Margins and Sub-Saharan Africa Phil Loader
11.20 Exploration Strategy Phil Loader
11:30 Question & Answer (Session 2) and Wrap-up Peter Coleman
12:00 Lunch
2016 Investor Briefing Day 47

North West Australia
Underpinning base and enabling growth
Mike Utsler | Executive Vice President and Chief Operations Officer
Niall Myles | Senior Vice President North West Shelf

North West Australia Overview
Underpinning base and enabling growth
Strategy
Operations excellence enables aggregator options
Low-cost phased developments
Summary
30 year operations experience, top-quartile performance
Interests in three of the LNG facilities
Earliest and lowest cost available capacity in region
Forward plan
NWS – plateau extension options
Pluto – reliable operations, low cost expansion option
Wheatstone – support start-up mid 2017
Browse – develop highest value initial phase
Scarborough ~8 Tcf
Greater Gorgon ~7-8 Tcf
Geryon / Orthrus-Maenad /
Othrus Deep / Urania
~4 Tcf
Clio/Acme ~3.5 Tcf
Exmouth Plateau ~3-4 Tcf
Equus ~2 Tcf
Thebe ~1.0 Tcf
LNG facility with Woodside interest
Pluto LNG
NWS LNG
Gorgon LNG
Wheatstone LNG
1. Source: Wood Mackenzie Upstream Data Tool 2016 3. Source: Inpex
2. Gross contingent resource (2C), less non-hydrocarbons and fuel and flare, Woodside interest 30.6% 4. Source: Shell Australia
Greater North West Shelf unallocated volume1
Ichthys3
~12 Tcf Prelude4
~3 Tcf
Torosa2 ~8 Tcf
Brecknock2 ~2 Tcf
Calliance2 ~6 Tcf
Other LNG facility
2016 Investor Briefing Day 49

World-class process safety performance
Personal safety performance on track for top-
quartile by 2017
Energy efficiency improves bottom line
increased reliability
reduced flared gas is more sales gas
target 5% in 5 years
First LNG-fuelled support vessel in region
lowering emissions
creating market
Sustainability
Delivering world class HSE performance
1. TRIR = Total recordable injury rate
8.0 7.5
14.2
10.09.2
0.0
4.0
8.0
12.0
16.0
2011 2012 2013 2014 2015
t/kt hydro
carb
on p
roduction
Flared gas intensity
Base following
Pluto start
0.0
1.0
2.0
3.0
4.0
5.0
2011 2012 2013 2014 2015
TR
IR p
er
mill
ion h
ours
w
ork
ed
Safety
Woodside TRIR
Tier 1 Process Safety Events
1
2016 Investor Briefing Day 50

LNG 1-3 LNG 4-5NWS
TotalPluto
Original design
capacity (Mtpa)26.4 8.5 14.9 4.3
Current export
capacity (Mtpa)7.7 9.23 16.94 4.75
Uprate (%) 120% 108% 113% 109%+
LNG capacity
Optimising value from our infrastructure
1. Excluding one-off substation 20 incident in 2015
2. LNG capacity defined as loadable LNG capacity over average train turnaround cycle (6-8 years)
3. Train 4 includes forecast benefits post May 2016 Frame 7 upgrade
Reliability delivered +1.7MMboe in 2015
maintenance excellence
defect elimination
No major turnarounds in 2017
Higher LNG capacity due to:
capacity through technology
increased uptime (turnaround
excellence)
Pluto & KGP reliability
80%
100%
2013 2014 2015 2016 (target)
Top quartile
NWS1
Pluto
4. KGP 18.6 mtpa 100% utilisation and reliability
5. Pluto 5.1 mtpa 100% utilisation and reliability
98%
Relia
bili
ty
2016 Investor Briefing Day 51

http://youtu.be/GlUYPQd0M9I
Video - Turnaround performance
2016 Investor Briefing Day 52

2015 2020 2025 2030
Extending NWS production
Accessing options to keep KGP full
Development projects on track
Plant performance has brought capacity forward
World-class lowest cost plant capacity available in
early 2020s provides options
nearfield development options
other resource owners gas
Seismic to provide 3 drill ready prospects 2017/18
Entered FEED for Hess Equus Feb 2016
Engaging other third parties; material opportunity
indicative NPV of ~US$500 - 800 million2
1. LNG capacity varies 5-10% subject to domestic gas rates
2. Woodside share, dependent on volume and tariff. Based on analogue tariffs (Gulf of Mexico processing fees)
3. Includes Persephone, GWF-2
Currently producing fields Sanctioned projects3
Undeveloped resources4
LNG capacity range1
Near-field yet to find potential5
Production rates
4. Includes Lambert Deep, Gaea, Wilcox, Dixon, Lambert West, South Goodwyn, Montague
5. Includes South Goodwyn appraisal target and risked exploration targets
2016 Investor Briefing Day 53
5
10
15
20
2013 2014 2015
US
$/b
oe
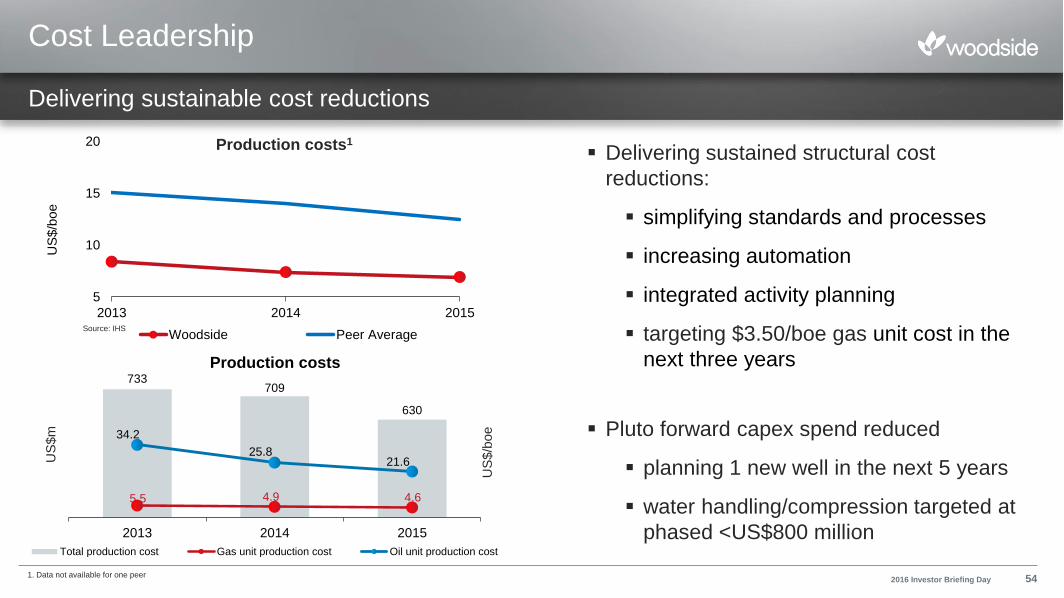
Woodside Peer Average
Delivering sustained structural cost
reductions:
simplifying standards and processes
increasing automation
integrated activity planning
targeting $3.50/boe gas unit cost in the
next three years
Pluto forward capex spend reduced
planning 1 new well in the next 5 years
water handling/compression targeted at
phased <US$800 million
Cost Leadership
Delivering sustainable cost reductions
733709
630
5.5 4.9 4.6
34.2
25.821.6
0
10
20
30
40
50
60
70
300
350
400
450
500
550
600
650
700
750
800
2013 2014 2015
US
$/b
oe
US
$m
Production costs
Total production cost Gas unit production cost Oil unit production cost
Production costs1
1. Data not available for one peer
Source: IHS
2016 Investor Briefing Day 54

Exceptional drilling performance
Top quartile non-productive time reducing well
costs
Drilling times better than peers
Capability in complex wells supports global
portfolio
Logistics account for ~7% of Opex1
Planning delivers predictable demand
Helicopter and vessel operations optimised
Industry collaboration to further drive down cost
Capabilities
27%
25%
28%
24%
20%
18%
2011 2012 2013 2014 2015 2016 (Q1)
Drilling non-productive time (excl weather)
Core capabilities enabling low-cost developments
74% 77% 81% 83% 83% 85%
40% 40%
60% 62% 65%
80%
2011 2012 2013 2014 2015 2016 (Q1)
Helicopter and vessel utilisation
Helo Seat VesselHelo seat Vessel
2016 Investor Briefing Day 551. Average of Woodside assets
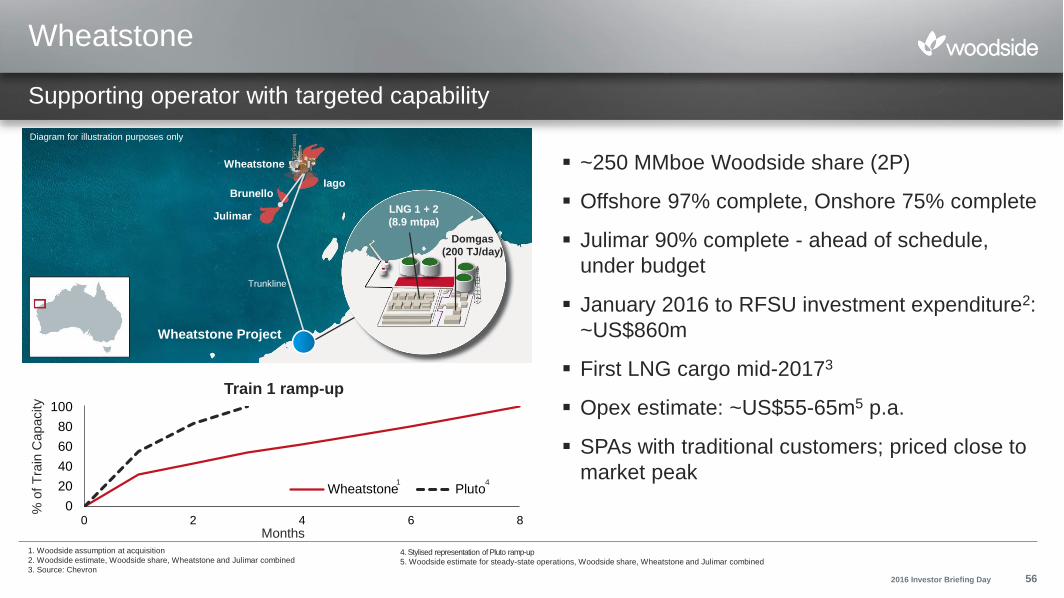
Wheatstone
~250 MMboe Woodside share (2P)
Offshore 97% complete, Onshore 75% complete
Julimar 90% complete - ahead of schedule,
under budget
January 2016 to RFSU investment expenditure2:
~US$860m
First LNG cargo mid-20173
Opex estimate: ~US$55-65m5 p.a.
SPAs with traditional customers; priced close to
market peak
Supporting operator with targeted capability
1. Woodside assumption at acquisition
2. Woodside estimate, Woodside share, Wheatstone and Julimar combined
3. Source: Chevron
Image courtesy of Shell
0
20
40
60
80
100
0 2 4 6 8
Wheatstone Pluto
Train 1 ramp-up
Months
% o
f T
rain
Capacity
41
Wheatstone Project
LNG 1 + 2
(8.9 mtpa)
Domgas
(200 TJ/day)
Wheatstone
IagoBrunello
Julimar
Diagram for illustration purposes only
Trunkline
4. Stylised representation of Pluto ramp-up
5. Woodside estimate for steady-state operations, Woodside share, Wheatstone and Julimar combined
2016 Investor Briefing Day 56

Developing 41 MMboe Woodside share (2C)1
Revamped development concept:
phased tie-back of oil to existing infrastructure; improvement
from standalone gas and oil development considered in 2013
aggregating stranded resources, developing three oil fields
~50% capex reduction and improved project value
Development Plan:
single 30km pipeline to Vincent FPSO
capex: $1.0-1.3 billion (Woodside share)
FID mid-20162; first oil mid-20192
>40,000 bbl/d (gross) post ramp-up
Greater Enfield
Revamped oil development delivering significant cost reductions
1. Refer to Notes on Petroleum Resource Estimates2. Woodside target 2016 Investor Briefing Day 57

Browse
Phased development targets highest value and reduces development risk
1.0 Bboe Woodside share (2C)
Strong foundation for commercialisation
Phased development reduces risk
Target highest value initial phase
Avoiding mega project execution
risks
Market digestible gas quantities
Minimise negative cumulative cash-
flow
Complete concept select 2H 20171
<$800/tpa liquefaction cost6
1. Woodside target2. Gross contingent resource (2C), less non-hydrocarbons and fuel and flare, Woodside interest 30.6%3. Source: Inpex4. Source: Shell Australia
Dry gas
(2C, Tcf)
Condensate
(2C, MMbbl)
Gross Gross
Calliance 5.9 223
Torosa 8.1 196
Brecknock 2.0 47
Total5 16.0 466
5. Woodside interest 30.6% and net contingent resource (2C) is 4.9 Tcf and 142 mmbbl for dry gas and
condensate, respectively6. LNG liquefaction cost includes liquefaction, storage and offloading. Basis is [Engineering procurement
construction cost] / [Stream day capacity] (ie, does not consider owners cost or availability)
LNG facility with Woodside interest
2016 Investor Briefing Day 58
Ichthys3
~12 Tcf Prelude4
~3 Tcf
Torosa2 ~8 Tcf
Brecknock2 ~2 Tcf
Calliance2 ~6 Tcf
Pluto LNG
NWS LNG
Wheatstone LNG

Canada
Cost competitive projects, world-class resource
Darren Flynn, Vice President Canada and USA

Kitimat
LiardHorn River
Alber ta
Proposed Pacific Trail Pipeline
Existing
Pipeline
Strategy
Drive down costs across the value chain through new
technology and best-in-class execution
Summary
2.6 Bboe Woodside share (2C) in Horn River and Liard Basins
Liquefaction is key to monetizing reserves, Woodside is an
industry-leader in LNG
Next Steps
Continue Liard appraisal and drive down well costs
Pursue additional cost breakthroughs through LNG technology
and collaboration opportunities
Targeting1 LNG demand in mid 2020’s
Canada overview
Cost competitive projects, world-class resource
1. Woodside target 2016 Investor Briefing Day 60

Kitimat Upstream
Initial production results from Liard Basin are world-class
1. Gas rate is calculated well potential based on early well performance and assuming pipeline pressure of 6MPA.
2. B-B03-K horizontal length 2,076m and was completed with 19 hydraulic fracture stages; well test duration 6 months to date
Higher Liard EUR4
Driving down well
costs
Reduced upstream
cost of supply
Exceptional results from two Liard proof of
concept horizontal wells
Improving drilling performance and entering
‘manufacture-mode’ has the potential to reduce
well costs by 50%
Horn River analogues have shown >60%
reduction in well costs per stage
Higher recovery per well means fewer wells and
pads for full development
0 12 24 36 48 60
Gas R
ate
Month
B-B03-K type
curve range 1, 2
Typical type curve from
a Montney well3
2016 Investor Briefing Day 61
Source: Wood Mackenzie and Woodside
3. Source: Wood Mackenzie and Woodside
4. Economic ultimate recovery

Optimised Concept
25% reduction in
LNG unit cost
Smaller pipelines,
scalability options
Liard sub plays
~40% EUR increase
Clear line-of-sight to top decile cost of supply
25% reduction in LNG unit costs targeted
through best-in-class execution and
technology advances
Initial Liard appraisal results demonstrate
significant upside from the current case
Opportunities for pipeline unit cost
reductions through collaboration and sizing
optimisation
Kitimat integrated development
Focus on driving down cost structures across the value chainB
rea
ke
ve
nL
NG
Price
Pipeline
Shipping
Current view Target
Upstream
LNG Plant
2016 Investor Briefing Day 62

Myanmar
Basin opening success in a key industry focus area
Phil Loader | Executive Vice President Global Exploration

Video - Pathways to progress
2016 Investor Briefing Day 64
http://youtu.be/v5gHjPyG_VI

Myanmar overview
Exploration strategy:
Discover material gas volumes within emerging deep water Rakhine Basin
Under explored basin proximal to markets
First mover position delivers commanding strategic advantage
Summary:
Exploration success in first two wells, Shwe Yee Htun-1 and Thalin-1A
2017 drilling program accelerating options for commercialisation
Completed seismic facilitates inventory build and rapid execution
Forward plan:
Four firm appraisal and exploration wells commencing Q1 2017
Additional well options for early exploration across the wider acreage position
Strategy and execution deliver promising growth
2016 Investor Briefing Day 65

Myanmar basin potential
Gas discoveries in A-6 and AD-7
2.4 Tcf, 2C gross (100%)1, at Shwe Yee Htun-1 and Thalin-1A
Growth potential through multi-Tcf prospects
Four firm appraisal and exploration wells planned for 20172
Inventory expanded through follow up seismic
Other exploration ─ AD-2, A-4, AD-5 and A-7
Targeting discrete, multi-Tcf prospects
Rakhine Basin petroleum system proven
Inventory build during 2016 with flexibility to drill in 2017
Active drilling programs also planned for 2018
Competitively positioned with substantial resource potential
Thalin-1A
Shwe Yee Htun-1
Shwe Field
Yadana Field
AD-2
A-6
AD-5 A-7
A-4
AD-7
1. Refer to ASX Announcement dated 20 May 2016. Woodside’s estimated net economic interest in the contingent resource is approximately 209 Bcf dry gas (Shwe
Yee Htun) in the Block A-6 and 260 Bcf dry gas (Thalin) in Block AD-7. These estimates are highly dependent on realised gas prices, Government participation
rights, Government share of profit and royalties under Woodside’s 40% interest in the respective PSCs and the outcome of future commercial arrangements.
2. Subject to government and joint venture approval 2016 Investor Briefing Day 66

Myanmar commercialisation
AD-7, Thalin-1A 1.5 Tcf, 2C gross1
Subsea tieback option via Shwe Platform2
Shwe has design capacity for an additional 320
mmscf/d train
Planned full appraisal before end Q2 2017
Targeting Discovery to Concept Select in 15 months
Pipeline gas Myanmar and China
A-6, Shwe Yee Htun 0.9 Tcf, 2C gross1
Tieback via Yadana or standalone2
Focused appraisal to continue volume build
Pipeline gas Myanmar and Thailand
Partnered with established infrastructure operators
Early success delivers commerciality options
Indicative schematic – not to scale
AD7(Thalin)
Shwe Platform Onshore Gas Terminal
A6 (Shwe Yee Htun)
Indicative schematic – not to scale
Yadana
Yangon
Thalin
Shwe Yee Htun
1. Refer to footnote (1) on previous slide.
2. Subject to joint venture and government approval2016 Investor Briefing Day 67
Atlantic Margins and
sub-Saharan Africa
Establishing core area portfolio in high impact plays
Phil Loader | Executive Vice President Global Exploration

Country with
Woodside
exploration
Oil prone basin
Gas prone basin
Oil or Gas prone
basin
Relative unrisked net
Yet-to-Find (Bboe)
Ireland
Nova Scotia
Morocco
AGC
Gabon
Atlantic Margins and sub-Saharan Africa
Proven plays in underexplored basins
Exploration Strategy:
Targeting underexplored basins with significant potential to deliver the next core area
Summary:
Building portfolio to deliver repeatable, material success
Prospective acreage acquired in 2016 - Ireland and AGC1 (Senegal/Guinea-Bissau); close to securing additional acreage in Gabon
Prioritising spend based upon value proposition
Proven petroleum systems with world-class analogues
Forward Plan:
Maturing prospects for high impact wells in 2017 and 2018
Continue to build business through aggregated growth
1. Subject to conditions precedent 2016 Investor Briefing Day 69

Atlantic Margins ─ AGC Profond block (Senegal/Guinea-Bissau)
Key emerging and underdeveloping hydrocarbon province
Targeting significant resource potential
with play diversity
Planning for first exploration well in 20171
65% equity and operatorship2
1. Subject to joint venture and government approval
2. Subject to conditions precedent
Oil discovery by other operator
Gas discovery by other operator
Joint Development Zone
Marsouin
Ahmeyim
Fan
SNE
Sinapa
Dome Flore
AGC Profond
Teranga
2016 Investor Briefing Day 70
Exploration Strategy
Positioning for long term growth
Phil Loader | Executive Vice President Global Exploration

Exploration strategy:
Building a balanced global portfolio to deliver future growth options
Focused upon emerging basins, play diversity and proven petroleum systems with world class
analogues
Summary:
Exploration success in Myanmar, accelerating options for commercialisation
Executing exploration programmes and high grading portfolio for optionality
Forward plan:
Maturing prospects for high impact wells in 2017 and 2018
Continue to build business through aggregated growth
Portfolio on track to deliver strategic goals
Exploration overview
Generating value and long term growth through exploration
2016 Investor Briefing Day 72

Exploration portfolio
Enhanced portfolio balance:
oil/gas, emerging/frontier
Prospective acreage acquired in
2016 - Ireland and AGC1
(Senegal/Guinea-Bissau)
Close to securing additional
exploration acreage in Gabon
Leveraging core competencies
Expanded portfolio resource
inventory by 150% in last three
years2
On track to meet strategic targets
Focus areas unchanged: Australia & Asia Pacific; Sub-Saharan Africa and Atlantic Margins
Ireland
Nova Scotia
Morocco
AGC
GabonMyanmar
Australia
1. Farm-in subject to conditions precedent
2. Net unrisked Yet-to-Find
Country with
Woodside
exploration
Oil prone basin
Gas prone basin
Oil or Gas prone
basin
Relative unrisked net
Yet-to-Find (Bboe)
2016 Investor Briefing Day 73

Exploration strategy
Delivering resource volumes
to meet target of >120%
annual production
Targeting emerging basins
and high value growth
Drilling 11 to 17 high impact
wells in 2017/20181
Drilling high impact exploration wells (2017 – 2018)
1. Subject to joint venture and government approval
zMyanmar
Drilling 4-7 exploration and appraisal wells
in 20171
Australia
Drilling 3-5 exploration wells 2017/20181
Atlantic Margin
Drilling 4-5 wells in 2017 – 20181
Sub-Sahara Africa
Drilling 1 well 2017/20181
3D
3D
3D
3D
3D seismic
Firm well
Contingent well
3D
2 3
3 2
4 3
1
2016 Investor Briefing Day 74

Portfolio on track to meet long term plan
resource inventory, commercial success rates (>25%), discovered resources (>120% production
pa), finding cost ($3/boe)
Early mover Myanmar success – path to growth and commercialisation
Prioritising spend in 2017/2018 to high impact exploration and delivery of the next core area
Organisational culture focused on technology implementation, excellence and value creation
Exploration strategy
Key messages
2016 Investor Briefing Day 75

Peter Coleman | Chief Executive Officer and Managing Director
Question and Answer

Differentiated position through our operational excellence, track record and disciplined decision-making
Demonstrated competitive advantage through our capabilities across the oil and gas value chain
Committed to earliest commercialisation of our growth opportunities
Strong financial position with operating cash flow and balance sheet supporting dividends and growth
Key messages
Strategy is delivering on commitments
2016 Investor Briefing Day 77

Appendix
2016 Investor Briefing - Strategy Day | 20 May 2016 | Sydney, Australia

NWS domestic gas production
Woodside’s share of domestic gas and its associated condensate will revert to 16.67% circa Q2 2017
Woodside equity share of domestic gas/associated condensate:
50% in DGJV1 up to 414 TJ/day
16.67% in IPGJV2
The DGJV production entitlement forecast to be fulfilled Q2 20173
Thereafter, Woodside share of domestic gas and associated condensate from domestic gas is 16.67%
LNG is not impacted
1. Domestic Gas Joint Venture
2. Incremental Pipeline Gas Joint Venture
3. Fullfilled once total DGJV production reaches 5,064 PJ, expected Q2 20172016 Investor Briefing Day 79

2016 Investor Briefing - Strategy Day | 20 May 2016 | Sydney, Australia
Biographies

Peter Coleman
BEng, MBA, FATSE
Chief Executive Officer and
Managing Director
Peter was appointed as Chief
Executive Officer and Managing
Director in May 2011, and has over
30 years’ experience in the global oil
and gas industry.
Peter is the Chairman of the
Australian-Korea Foundation, a
Fellow of the Australian Academy of
Technological Sciences and
Engineering, Chairman of the
Advisory Group on Africa Australia
Relations and, in 2012, was
awarded the honorary title of
Adjunct Professor in Corporate
Strategy from the University of
Western Australia. In 2013, he
received the Distinguished Alumni
Lifetime Achievement Award from
Monash University. Following
graduation from Monash University,
he began his career at Esso
Australia (which became part of the
ExxonMobil group) and stayed with
ExxonMobil until joining Woodside.
Lawrie Tremaine
BBus, FCPA
Executive Vice President and Chief
Financial Officer
Lawrie was appointed as Chief Financial
Officer in 2010.
He joined Woodside in 2006 and has
over 30 years of finance leadership
experience, predominantly in the
resource and minerals processing
industry.
Lawrie is responsible for a range of
functions including finance, investor
relations, business development and
growth, commercial, contracting and
procurement, strategy and planning and
performance excellence.
Prior to joining Woodside, he
worked for Alcoa for 17 years.
He is a National Executive
Member of the Group of 100.
2016 Investor Briefing Day 81

Michael Utsler
BSc (Petroleum Engineering)
Chief Operations Officer
Michael was appointed
as Chief Operations Officer
in 2013, following an extensive
international career in upstream oil
and gas spanning 37 years.
He is responsible for Woodside’s
global operations, drilling, subsea,
reservoir management, logistics
and overall stewardship of
programs in health, safety,
environment and quality.
Prior to joining Woodside,
Michael held the position
of President for the BP-Gulf
Coast restoration organisation,
leading the Deepwater
Horizon response effort.
Dr Robert Edwardes
BSc (Eng), PhD
Executive Vice President
Development
Robert was appointed as
Executive Vice President
Development in 2012. He has over 35
years of resources industry experience,
spanning the full breadth of operations
and projects.
In his current role, he is accountable for
design, execution planning and delivery
of onshore and offshore capital projects,
the engineering function, Browse,
Canada and USA.
Prior to joining Woodside, Robert’s roles
included Managing Director of Worley
Parsons (US and Latin America) and
Project Director of the Kizomba
deepwater oil development in Angola
with ExxonMobil.
2016 Investor Briefing Day 82

Phil Loader
BSc (Geology), MBA, MSc, DIC
Executive Vice President
Global Exploration
Phil was appointed as
Executive Vice President
Global Exploration in 2013,
following an extensive career
in the upstream sector
spanning over 30 years.
Phil is responsible for the
company’s global exploration
activities.
Prior to joining Woodside,
Phil’s roles included Senior
Vice President Exploration at
Mubadala Petroleum in the
United Arab Emirates and
Vice President Exploration at
Anadarko Petroleum.
Reinhardt Matisons
BEng, MBA, MIE Aust, CPEng, CPA
Executive Vice President
Marketing, Trading and
Shipping
Reinhardt was appointed
as Executive Vice President
Marketing, Trading and Shipping in 2014.
He has over 33 years’ experience in the
energy industry.
In his current position, he is
accountable for marketing, trading and
Shipping, and the newly created power and
new markets function. Reinhardt
joined Woodside in 1996 and
has held various marketing
and commercial roles.
Prior to this, he held senior
leadership roles with Poten &
Partners, Alinta Gas, Western
Power and the State Energy
Commission of Western
Australia.
2016 Investor Briefing Day 83

David McLoughlin
B.A (Psychology), FAHR
Senior Vice President People
and Capability
David was appointed as Vice
President, People and Capability
in 2014. He has over 20 years
experience in mining, minerals
and engineering services
throughout Australia, SE Asia
and the Americas.
David is responsible for the
People and Capability/Human
Resources function within
Woodside.
Prior to Woodside David has held
a variety of roles including
Manager Integration Minera Las
Bambas, Vice President Human
Resources Glencore Xstrata
Copper, General Manager
Xstrata Copper Australia, various
roles with Thiess Pty Ltd and Rio
Tinto.
Shaun Gregory
BSc (Hons), MBT
Senior Vice President and Chief
Technology Officer
Shaun was appointed as Senior Vice
President and Chief Technology Officer
in January 2016, and has worked in the
oil and gas industry for over 25 years.
Shaun leads the company’s efforts in
advancing science, technology and
developing concepts for commercialising
resources. He joined Woodside in 1996
and has held a variety of roles in areas
including geophysics, mergers and
acquisitions, corporate strategy,
exploration, and new ventures.
2016 Investor Briefing Day 84

Darren Flynn
BEng (Chem)
Vice President Canada and USA
Darren was recently appointed Vice
President Canada and USA. He has
over 25 years’ project experience in the
oil and gas business. Darren is
responsible for the Canada and USA
Business Unit within Woodside, and has
been based in Woodside's office in
Calgary, Alberta since early 2015. He
has been with Woodside since 2005
and has held various roles in the
development of Woodside’s North West
Shelf Train 5 and Pluto LNG projects.
Prior to Woodside Darren worked for
engineering contractors on various
projects in Australia and overseas.
Michael Abbott
LLB, BA, MBA
Senior Vice President Corporate and
Legal
Michael is Joint Company Secretary of
Woodside Petroleum and a director of
Woodside Energy Limited, and various
group subsidiaries
Michael has worked for Woodside since
2005, holding a variety of roles including
Mergers and Acquisitions lawyer, head
of the Procurement Legal Team and
Vice President Legal and General
Counsel. He is currently Senior Vice
President, Corporate & Legal, with
responsibility for Legal, Corporate and
Government Affairs, Company
Secretariat, Risk, Compliance and
Security and Emergency Management.
Michael commenced his career in
private practice, and has worked for law
firms initially in Perth and then for Baker
and McKenzie Hong Kong, where he
was a partner. His practice areas
focussed on corporate law, mergers and
acquisitions and private equity work.
2016 Investor Briefing Day 85

Anthea McKinnell
CA, CTA
BComm (Accounting & Taxation), Master of
International Tax
Vice President Treasury and Taxation
Anthea McKinnell is currently the Vice
President, Treasury and Taxation with
Woodside Energy Ltd, located in Perth,
Western Australia.
Reporting to the Chief Financial Officer,
Anthea is responsible for managing the
Treasury, Taxation and Insurance divisions
of the Woodside group of companies.
Before joining Woodside in January 2005,
Anthea held a number of taxation advisory
roles at organisations including Ernst &
Young and Arthur Andersen.
Anthea is a Chartered Accountant, member
of the Finance & Treasury Association, and
Taxation Institute in Australia.
Niall Myles
BEng(Hons) Chemical
Senior Vice President North West Shelf
Niall was appointed SVP, North West
Shelf in June 2012 and has
responsibility for the Safe Reliable and
Efficient operation of the North West
Shelf project. Niall has a BEng (hons)
in Chemical Engineering and 28 years
experience in the oil and gas industry.
He joined Woodside in 1997 as a
Process Engineer and has broadened
his experience in production planning,
commercial, projects and Business
Development. Niall spent 6 years in
Operations at the Karratha Gas Plant,
leaving as Plant Manager in
2009. Prior to his current role, he
oversaw the successful start-up of the
Pluto LNG Project.
2016 Investor Briefing Day 86

Fiona Hick
BEng (Hons), BAppSci
Vice President Health, Safety,
Environment and Quality
Fiona was recently appointed VP
Health, Safety, Environment and
Quality.
She has over 20 years experience in the
oil and gas and mining industries.
Fiona is responsible for Health, Safety,
Environment and Quality standards and
performance across the value chain.
Fiona is a Fellow of the Institute of
Engineers and a member of the
Australian Institute of Company
Directors.
Fiona joined Woodside in 2001 and has
held various roles across Corporate,
Exploration, Development and
Operations. Prior to joint Woodside,
Fiona worked for a number of years with
Rio Tinto.
2016 Investor Briefing Day 87
Craig Ashton
BSc (MechEng), BLaw, MAppFin
Vice President Investor Relations
Craig was appointed as Vice
President, Investor Relations in
2013. He has over twenty years’
commercial experience in the
resources industry in Australia
and South Africa.
Craig is responsible for the
Investor Relations function within
Woodside. He joined Woodside
in 2000 and has held various
Commercial and Business
Manager roles.
Prior to Woodside Craig worked
at Iscor Limited, a South African
mining and steel company where
he held roles in corporate
business development, corporate
strategy, marketing and shipping.

1. Unless otherwise stated, all petroleum resource estimates are quoted as at the balance date (i.e. 31 December) of the Reserves Statement in Woodside’s most recent Annual Report
released to ASX and available at http://www.woodside.com.au/Investors-Media/Announcements, net Woodside share at standard oilfield conditions of 14.696 psi (101.325 kPa) and 60
degrees Fahrenheit (15.56 deg Celsius). Except as outlined herein, Woodside is not aware of any new information or data that materially affects the information included in the Reserves
Statement. All the material assumptions and technical parameters underpinning the estimates in the Reserves Statement continue to apply and have not materially changed.
2. Myanmar (Shwe Yee Htun and Thalin): All petroleum resource estimates relating to the Shwe Yee Htun and Thalin fields refer to those estimates and accompanying notes set out in the
20 May 2016 ASX Announcement titled ‘Woodside Books Contingent Resources in Myanmar’.
3. Greater Enfield (Laverda and Cimatti): Subsequent to the Reserves Statement dated 31 December 2015, Woodside has revised its estimate of contingent resource (2C) relating to the
Laverda and Cimatti fields from 42 MMboe (gross (110%) 70 MMboe) to 41 MMboe (gross (100%) 67 MMboe).
4. Woodside reports reserves net of the fuel and flare required for production, processing and transportation up to a reference point. For offshore oil projects, the reference point is defined
as the outlet of the floating production storage and offloading (FPSO) vessel, while for the onshore gas projects the reference point is defined as the inlet to the downstream (onshore)
processing facility.
5. Woodside uses both deterministic and probabilistic methods for estimation of petroleum resources at the field and project levels. Unless otherwise stated, all petroleum estimates
reported at the company or region level are aggregated by arithmetic summation by category. Note that the aggregated Proved level may be a very conservative estimate due to the
portfolio effects of arithmetic summation.
6. ‘MMboe’ means millions (106) of barrels of oil equivalent. Dry gas volumes, defined as ‘C4 minus’ hydrocarbon components and non-hydrocarbon volumes that are present in sales
product, are converted to oil equivalent volumes via a constant conversion factor, which for Woodside is 5.7 Bcf of dry gas per 1 MMboe. Volumes of oil and condensate, defined as ‘C5
plus’ petroleum components, are converted from MMbbl to MMboe on a 1:1 ratio.
7. The estimates of petroleum resources are based on and fairly represent information and supporting documentation prepared by qualified petroleum reserves and resources evaluators.
The estimates have been approved by Mr Ian F. Sylvester, Woodside’s Vice President Reservoir Management, who is a full-time employee of the company and a member of the Society
of Petroleum Engineers. Mr Sylvester’s qualifications include a Master of Engineering (Petroleum Engineering) from Imperial College, University of London, England, and more than 20
years of relevant experience.
Notes on Petroleum Resource Estimates
2016 Investor Briefing Day 88