2015 maintenance culvert cost data analysis drainage... · 2015 maintenance culvert cost data...
TRANSCRIPT

1/12/2015
2015 Maintenance Culvert Cost Data Analysis MnDOT Maintenance personnel repaired and cleaned culverts then recorded information in the Culvert Cost Application, including the types and amounts of labor, equipment and material resources used from 2014 through 2015. The estimated cost of the repair was then calculated from this data. This was the project recommended by the Drainage Asset Management group for MnDOT’s WIG to support prediction of life cycle asset costs.
This document summarizes the analysis of the estimated costs of different types of culvert repairs and looks at some of the details of the labor, equipment and materials used to start the development of a resource demand model that can be used to predict system-wide repair needs and develop best practices.
Recommended average costs for each repair category are provided. In some categories there was sufficient data to break down costs into more specific culvert categories. These average repair costs are adequate for a system wide analysis. The average cost values should not be used for site specific estimating because they do not sufficiently account for variability of specific projects and site conditions.
Average Estimated Maintenance Cost of Culvert Repair
Repair Category
Culvert
Categories Number of
Repairs Average Repair
Cost Trench New Pipe All 314 $ 8,430
Highway 1 $32,170 Side 2 $ 9,610 Entrance 3 $ 5,160
Slipline 47 $12,570 Reset Apron and Pipe 66 $ 3,000 Replace Apron and Pipe 52 $ 3,000 Joint Repair 33 $ 2,710 Pipe Extension 15 $ 4,060 Hole Repair 4 $ 2,000 Fill Void 6 $ 1,020 Other 13 $11,270 All Culvert Repairs 550 1 Highway culverts include: centerline, mainline, median, CD and ramp-loop 2 Side culverts include: city, county, township, frontage, cross-over 3 Entrances culverts include: entrance, farm entrance and field entrance
Culvert condition changed from 80% of culverts in poor or very poor condition prior to repair to 5% of culverts remaining in poor or very poor condition after being repaired. Situations where the condition does not improve occur when the type of repair fixed only part of the problem and further action is still needed such as filling voids or resetting aprons. Cleaning activities are reported separately from repairs since cleaning does not improve the condition of the pipe. However, it should be noted that cleaning is an important part of keeping a pipe operating as designed.
1

Data Set Assumptions and Evaluation Data used in this report was downloaded on December 11, 2015 from the Culvert Cost application and included data from both 2014 and 2015. This cost data was adjusted to 2015 total cost during the validation process. Data that was not complete and marked as final was filtered out. Averages shown in each chart are arithmetic means. Figure 2 provides information on the amount spent and number of repairs and cleaning recorded in the Maintenance Culvert Cost App over the last two year period. Figure 2 includes data entered on culverts, storm drain and other types of drainage features. Not all Maintenance drainage activities were entered by all Districts so these numbers only represent a portion of the overall expenditures on drainage assets. Drainage replacements and repairs done in construction projects are not included in the effort which is focusing on operations activities not capital projects.
Figure 2 Summary of total dollars recorded per District adjusted to 2015 costs
1%
71% 23%
4% 1%
Culvert Condition After Repair
0 - Unknown
1 - Like New
2 - Fair
3 - Poor
4 - Very Poor
371
447
155
32
88
75
45
44
$0
$200,000
$400,000
$600,000
$800,000
$1,000,000
D-1 D-2 D-3 D-4 D-6 D-7 D-8 Metro
Dollars Spent and Number of Repairs and Cleaning of All Drainage Assets Finalized in 2014 and 2015
Figure 1 Changes in condition cost for all maintenance culvert repair activities (not including cleanings)
2
3% 3% 14%
13% 67%
Culvert Condition Before Repair
0 - Unknown
1 - Like New
2 - Fair
3 - Poor
4 - Very Poor

The primary objective of this report is estimating costs for culvert repairs, and unless otherwise indicated, the data analyzed and presented is the culvert repair data. A section that focuses on maintenance of storm drain and other drainage features is located on page 19. A section on cleaning that includes culvert cleaning, ditch cleaning, beaver removal and ice removal is located on page 20. Collection of data for culverts under entrance and other roadway types was optional in 2014; therefore the number of repairs collected is only a portion of repairs actually done by MnDOT Maintenance in that time period. Entrance culvert repairs make up the majority of culvert work done by Maintenance (Figure 3). For some types of repair including slipline pipe, reset aprons, joint repair and fill void, the majority of repairs were done for highway pipes. Trench new pipe represents the largest number of repairs done by Maintenance forces, and is least likely to be done for highway pipe because of the need to replace pavement, the use of concrete pipe and need to accommodate traffic. Replacement of highway culverts is much more likely to be done by construction projects.
When comparing values from the 2014 report to 2015, the definition of which culverts were included in Highway, Side and Entrance Culverts categories has changed. Highway culverts include: centerline, mainline, median, collector-distributor and ramp-loop – all culverts under highway traffic lanes. Side culverts include other public roadways: city, county, township, frontage, and cross-over. Entrance culverts include: entrance, farm entrance and field entrance.
The repair types and numbers varied from District to District. Each District prioritizes their budget differently and has different repair needs. Some Districts have repaired and replaced a greater proportion of culverts in capital construction projects while others may have maintenance perform certain types of repairs. Figure 4 shows the number of culvert repairs by District Maintenance. It also shows how different Districts may be focusing on different categories of repairs. For instance District 7 has been doing more slipliners and resetting aprons than the other Districts while District 3 has been replacing a larger number of aprons and pipe segments than other Districts.
185 Highway
34%
81 Side 15%
277 Entrance
50%
7 Other 1%
Culvert Repairs by Roadway Classification
Figure 3 Culvert repair by roadway classification
3

Figure 4 Number of culvert repairs by District in 2014 and 2015
Figure 5 shows how the number of repairs does not necessarily directly correspond to overall spending. For example District 6 may not have repaired as many culverts as other Districts but they spent the second highest amount because they focused on a project that replaced 10 centerline highway culverts with case treatments. This project was not only an effort to replace culverts in poor condition but used a variety of pipe materials to providing an opportunity to compare installation and cost differences between pipe materials. Future monitoring of these culverts will provide valuable information to consider when updating pipe material recommendations.
0
20
40
60
80
100
120
140
160
D1 D2 D3 D4 D6 D7 D8 Metro
Number of Culvert Repairs by District Maintenance
Other Repair
Fill Void
Fix Pipe Hole
Pipe Extension
Joint Repair
Replace Apron and Pipe
Reset Apron and Pipe
Slipline Pipe
Trench New Pipe
116
87
147
14
56 69
35
26
$0$100,000$200,000$300,000$400,000$500,000$600,000$700,000$800,000
D-1 D-2 D-3 D-4 D-6 D-7 D-8 Metro
Dollars Spent and Number of Culvert Repairs (recorded during 2014-2015)
Figure 5 Comparison of dollars spent to number of culvert repairs
4
Comparison of 2014 Data to 2015 Data More data was collected in 2015 than 2014. In 2014 mandatory data collection focused on highway culverts, and the collection of maintenance data on side culverts and other assets was optional. In 2015, data collection was required for all culvert repairs. Collection of other data on ditch cleaning, ice removal and storm drain repairs was optional in both years.
Type of Repair Completed 2014
Completed 2015
Total Both Years
% of Total Repairs
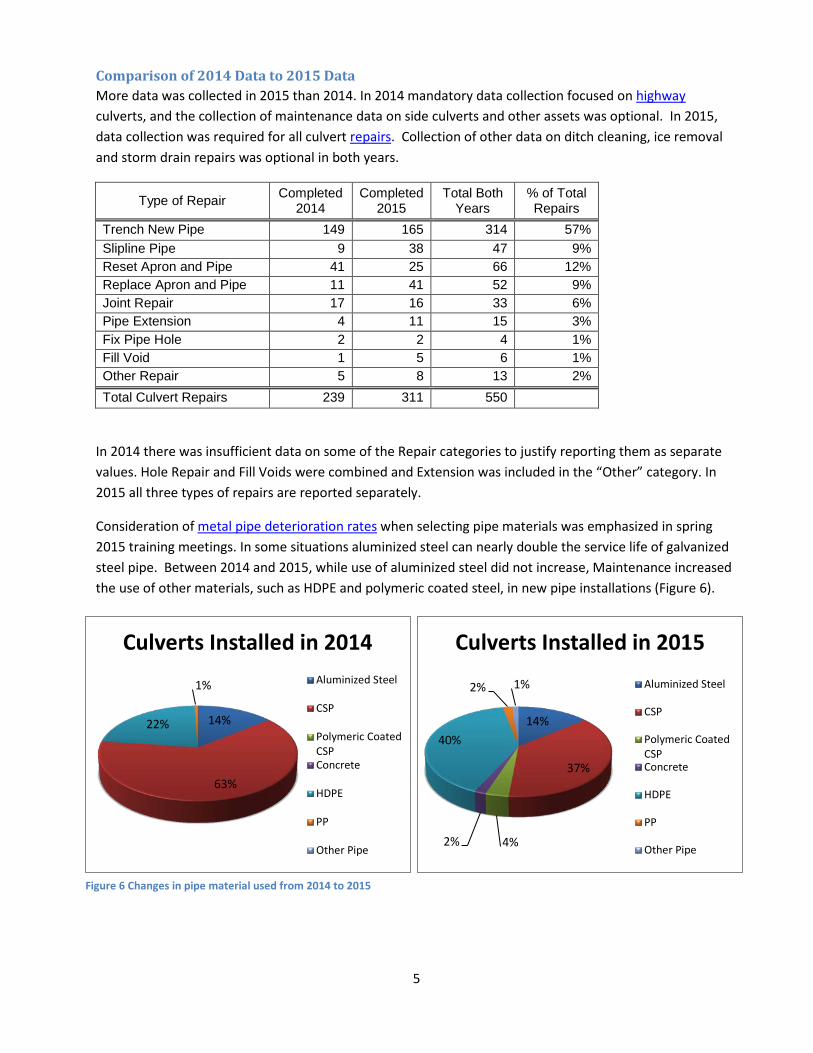
Trench New Pipe 149 165 314 57% Slipline Pipe 9 38 47 9% Reset Apron and Pipe 41 25 66 12% Replace Apron and Pipe 11 41 52 9% Joint Repair 17 16 33 6% Pipe Extension 4 11 15 3% Fix Pipe Hole 2 2 4 1% Fill Void 1 5 6 1% Other Repair 5 8 13 2% Total Culvert Repairs 239 311 550
In 2014 there was insufficient data on some of the Repair categories to justify reporting them as separate values. Hole Repair and Fill Voids were combined and Extension was included in the “Other” category. In 2015 all three types of repairs are reported separately.
Consideration of metal pipe deterioration rates when selecting pipe materials was emphasized in spring 2015 training meetings. In some situations aluminized steel can nearly double the service life of galvanized steel pipe. Between 2014 and 2015, while use of aluminized steel did not increase, Maintenance increased the use of other materials, such as HDPE and polymeric coated steel, in new pipe installations (Figure 6).
Figure 6 Changes in pipe material used from 2014 to 2015
5
14%
37%
4% 2%
40%
2% 1%
Culverts Installed in 2015
Aluminized Steel
CSP
Polymeric CoatedCSPConcrete
HDPE
PP
Other Pipe
14%
63%
22%
1%
Culverts Installed in 2014 Aluminized Steel
CSP
Polymeric CoatedCSPConcrete
HDPE
PP
Other Pipe

Cost Summary Between years 2014 and 2015 there were changes in the overhead rate. For this report, costs were adjusted to 2015 total cost including overhead and those costs are used in this report. In the future when comparing data from multiple years it will be important to index costs to account for inflation and differences in overhead rates.
Figure 7 Proportion of material, equipment and labor costs by repair type
Figure 7 compares average material, equipment and labor costs for each repair type. Repairs completed in both 2014 and 2015 are included, the 2014 data was adjusted to 2015 costs. Materials make up the largest share of the cost for sliplined pipe, but materials are not a controlling factor in the cost of resets, replacements or void filling. Labor makes up much of the cost for resets, replace aprons and pipe extensions.
It might be tempting to look at this chart and assume that sliplining a pipe is more expensive than trenching new pipe, but that is incorrect. Trench new pipe repairs done by maintenance consist mostly of entrance pipes, which are typically shorter, smaller diameter and aren’t paved. Sliplining is mostly done for highway culverts. When you compare the cost of an average highway slipline pipe $12,650 to a trench new highway pipe $32,170 it becomes clear why sliplining a highway pipe is cost effective, as long as the lined pipe will be hydraulically adequate. On the other hand trenching an entrance pipe tends to cost less than sliplining an entrance pipe.
$-
$2,000
$4,000
$6,000
$8,000
$10,000
$12,000
$14,000
TrenchNew Pipe
SliplinePipe
ResetApron
and Pipe
ReplaceApron
and Pipe
JointRepair
PipeExtension
Fix PipeHole
Fill Void OtherRepair
AllRepairs
Average Culvert Repair Costs
Material Cost
Equipment Cost
Labor Cost
6

Trench New Pipe Trench New Pipe means installing a new culvert by trenching through the road. An old pipe is usually removed. Paved roads require re-paving.
Data Review and Observations The numbers of new culverts installed by Maintenance varied by District. In 2014, some Districts may not have recorded side pipe replacements because only highway pipes were required to be recorded then. In 2015 all culvert pipe replacements and repairs were collected. Districts 1 and 3 Maintenance forces installed the majority of new culvert pipes. This does not mean that other Districts were not replacing culverts, but that it may have been done during construction projects instead.
There are 314 trench new pipe records available. 9% are highway culverts, 18% are side culverts and 73% are entrance culverts. For this type of repair, differentiating by culvert is reasonable. For example Highway culverts have different typical sizes, lengths, traffic control, pavement, and installation requirements than side pipes or entrance pipes.
Highway culverts are much more likely to be installed during construction projects instead of by Maintenance, but in 2014, 11 highway pipes were installed by Maintenance and in 2015, 17 highway pipes were installed. The 2015 pipes included a D-6 demonstration project using different culvert materials at 10 sites. Centerline culverts in that project were installed with case treatments which significantly increased the cost of the new culverts. The trend line for highway culverts shown in Figure 9 is misleading. The 11 highway pipes with case treatments create a cluster of higher cost installations for shorter length pipe which skews the results. The highest cost highway installations had high costs for hauling materials, including usage of 350 57M LB Chassis Cab Tandem Axel Trucks or other dump trucks, 300 or greater labor hours and high usage of aggregate and bituminous. The other factors that influence costs appear to be pipe material type and size. Pipes 48” and larger have substantial increases in material costs, not only from the pipe but in apron costs. The two most expensive pipes were a 48” Duromaxx (Steel Reinforced Polyethylene pipe) and a 30” Polypropylene pipe. But overall, the most important factor in total cost for highway culverts involves the amount of grading and pavement work, not the pipe material. Compared to installation of side and entrance culverts highway culvert costs were slightly weighted with higher labor costs at 48% of average total cost. For highway culverts equipment was 31% and Materials were 21% of average total costs.
Side Culverts have varying characteristics, some are on major city or county roadways and are similar in scope and effort to highway culverts, but many are similar to entrance culverts. There were 55 side culverts installed during the reporting period. Labor was 38% of the cost, Equipment was 27% of the cost and Materials made up 34% of the average total cost.
020406080
100120
Number of Trench New Pipe by Districts
Figure 8 Number of new culverts trenched by District
7

The majority of culverts installed were Entrance Culverts with 230 records entered. Minimum cost of entrance culverts was $1,180 with a median cost of $4,500. Labor was 34% of the cost, Equipment was 28% of the cost and Materials made up 38% of the average total cost.
Key factors that appear to drive up costs for both side and entrance culverts are larger pipe size (30” and greater), longer culverts (over 75 feet), concrete pipe and safety aprons. The entrance and side culverts listed use of backhoe or other rentals 32 times. The costs of rentals did not appear to correlate with higher cost installations.
Cost Summary While there are general trends related to culvert length and culvert size, culvert type was one of the most influential drivers of cost is related to the amount of grading and pavement work required for the installation. For now the average cost based on roadway type provides the best general number for system wide estimates. Significant variation occurs on a site specific level; so much more detailed scoping is needed for project estimates. Costs for all roadway classifications computed from both years of data are within 8% of the numbers determined in 2014. The difference in the highway culvert average cost is increased after 2015 by the 10 culverts that were installed with more expensive case treatments. The average cost differences on the side culverts changed from 2014 in part because culverts under highway crossovers were moved into the side pipe category in 2015.
Repair Category Number of Repairs Used Highway
Side and Other Entrances
All Roadway Classification
All Trench New Pipe 314 $32,170 $ 9,610 $ 5,160 $ 8,430 Hwy without Case Treatment 19 $26,026 Hwy with Case Treatment 10 $43,832
Italics numbers are informational only and do not have sufficient data for confidence in accuracy needed for use in estimating costs.
$0
$10,000
$20,000
$30,000
$40,000
$50,000
$60,000
0 50 100 150
Tota
l 201
5 Ad
just
ed C
ost
Culvert Length
Trench New Pipe
Entrances
Side Culverts
Highway
Linear(Entrances)Linear (SideCulverts)Linear(Highway)
Figure 9 Comparison of new culvert pipe cost by length.
8

Labor, Equipment, Material • The average labor cost is $3,370 or 40% of total cost. • The number of labor hours ranged from 4 to 586 with an average of 68 hours. • The average equipment cost is $2,410 or 29% of total cost. • The average materials cost is $2,650 or 31% of total cost
Change in Condition Trenching new pipe nearly always results in a change to a “like new” condition. Seven pipes were recorded as having a condition of “like new” before they were replaced. These were either incorrectly coded or were pipes replaced due to flooding, insufficient capacity, or because of a change in ditch grade rather than because of pipe condition, as indicated by comments.
Slipline Slipline is sliding a pipe-like liner inside a culvert, then grouting the void between the host pipe and the liner. Sliplining is frequently used on pipes that show deterioration along the whole length of the pipe. Metal culverts with holes along the inverts or concrete pipes with multiple joint separations are the most common candidates for sliplining. Slipline repairs may be a cost effective alternative to trenching in a new pipe but the use of sliplining is limited to culverts that will have adequate hydraulic capacity after the size reduction.
Data Review and Observations 47 culverts were sliplined during the two year period, 41 were highway culverts, 3 were side culverts and 3 were entrance culverts. In the case of sliplined pipe the road classification is not a helpful breakdown of cost data. In most cases culverts which are being sliplined are under highways. For many side and entrance sites trenching a new pipe is less expensive than sliplining and there typically is less traffic impact that needs to be avoided. Slipliner is available for purchase on Department of Administration contract. Prices from that contract were used in the culvert cost data collection application.
99.7%
0.3%
Culvert Condition After Trench New Pipe
0 - Unknown
1 - Like New
2 - Fair
3 - Poor
4 - Very Poor
Figure 10 Changes in condition code for trench new pipe
9
3% 2% 2% 6%
87%
Culvert Condition Before Trench New Pipe
0 - Unknown
1 - Like New
2 - Fair
3 - Poor
4 - Very Poor
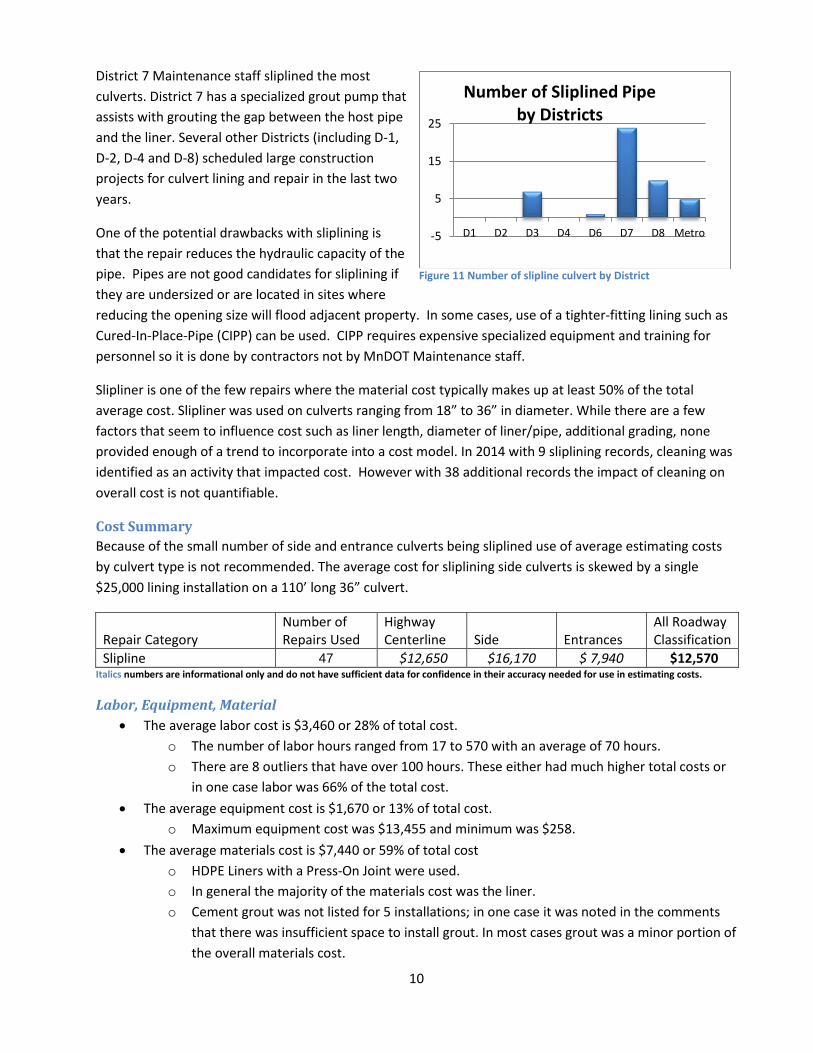
District 7 Maintenance staff sliplined the most culverts. District 7 has a specialized grout pump that assists with grouting the gap between the host pipe and the liner. Several other Districts (including D-1, D-2, D-4 and D-8) scheduled large construction projects for culvert lining and repair in the last two years.
One of the potential drawbacks with sliplining is that the repair reduces the hydraulic capacity of the pipe. Pipes are not good candidates for sliplining if they are undersized or are located in sites where reducing the opening size will flood adjacent property. In some cases, use of a tighter-fitting lining such as Cured-In-Place-Pipe (CIPP) can be used. CIPP requires expensive specialized equipment and training for personnel so it is done by contractors not by MnDOT Maintenance staff.
Slipliner is one of the few repairs where the material cost typically makes up at least 50% of the total average cost. Slipliner was used on culverts ranging from 18” to 36” in diameter. While there are a few factors that seem to influence cost such as liner length, diameter of liner/pipe, additional grading, none provided enough of a trend to incorporate into a cost model. In 2014 with 9 sliplining records, cleaning was identified as an activity that impacted cost. However with 38 additional records the impact of cleaning on overall cost is not quantifiable.
Cost Summary Because of the small number of side and entrance culverts being sliplined use of average estimating costs by culvert type is not recommended. The average cost for sliplining side culverts is skewed by a single $25,000 lining installation on a 110’ long 36” culvert.
Repair Category Number of Repairs Used
Highway Centerline Side Entrances
All Roadway Classification
Slipline 47 $12,650 $16,170 $ 7,940 $12,570 Italics numbers are informational only and do not have sufficient data for confidence in their accuracy needed for use in estimating costs.
Labor, Equipment, Material • The average labor cost is $3,460 or 28% of total cost.
o The number of labor hours ranged from 17 to 570 with an average of 70 hours. o There are 8 outliers that have over 100 hours. These either had much higher total costs or
in one case labor was 66% of the total cost. • The average equipment cost is $1,670 or 13% of total cost.
o Maximum equipment cost was $13,455 and minimum was $258. • The average materials cost is $7,440 or 59% of total cost
o HDPE Liners with a Press-On Joint were used. o In general the majority of the materials cost was the liner. o Cement grout was not listed for 5 installations; in one case it was noted in the comments
that there was insufficient space to install grout. In most cases grout was a minor portion of the overall materials cost.
-5
5
15
25
D1 D2 D3 D4 D6 D7 D8 Metro
Number of Sliplined Pipe by Districts
Figure 11 Number of slipline culvert by District
10

Figure 13 Comparison of impacts of cleaning and grading
Change in Condition Nearly all of the culverts were in poor or very poor condition before lining and were in like new or fair condition following the slipline repair. The exceptions were 3 culverts (6%) identified as being in fair condition were situations where the initial liner was installed in 2012 and completed in 2014. Sliplining is often a two-step process first installing the liner followed by grouting at a later date. Grouting takes different types of equipment and it is more efficient to grout multiple liners at the same time. There was one culvert that went from very poor to poor condition, in that case only 14 feet of an 88’ culvert was lined and comments indicated that the pipe should be scheduled for replacement.
Figure 12 Changes in condition code for slipline
Reset Apron or Pipe Reset aprons include moving aprons and pipe segments back into place to fix joint separations. It does not include purchasing and installing new aprons. New pipe segments may be installed.
Data Review and Observations 66 culverts had aprons or pipe sections reset during the last two year period -- 55 were highway culverts, 3 were side culverts, 7 were entrance culverts and 1 was other. The overall cost of the project is dependent on the size or extent of the repair, which varies widely. Repair length varied from zero (reset apron only) to 35 feet, and some culverts needed both aprons reset while others only one.
Two other factors typically associated with a high total cost are the need to repair a washout and major cleaning. Large washout repairs are reflected in higher material costs with the purchase of select granular, aggregate and riprap.
6%
19%
75%
Culvert Condition Before Slipline
0 - Unknown
1 - Like New
2 - Fair
3 - Poor
4 - Very Poor
68%
30%
2%
Culvert Condition After Slipline
0 - Unknown
1 - Like New
2 - Fair
3 - Poor
4 - Very Poor
11
$0
$5,000
$10,000
$15,000
$20,000
0 20
2015
Adj
uste
d To
tal C
ost
Repaired Length (FT)
Reset Aprons and Pipe (zero length is apron reset only)
All resets
Major cleaning
Minor cleaning
washout repair
Linear (All resets)
Minor cleaning does not seem to impact total cost much. Major cleaning appears to be associated with slightly higher total cost but with only 3 records identified as having major cleaning there is insufficient data to quantify the impact.
Roadway classification does not appear to be a significant factor in cost, probably because the repair is not under the road surface but in the embankment. The reason side culverts have a higher average is there are only 3 repairs and 2 of the three culverts had major cleaning that drove the cost, not the roadway classification.
Cost Summary Because of the small number of side and entrance culverts being reset those numbers are not significant enough to use for estimating costs. In addition, the difference between the numbers is well within the range of accuracy, therefore the average reset cost for all roadway classifications is the recommended value. The recommended reset cost is within 20% of the estimate of $3,600 computed from 2014 data.
Repair Category Number of Repairs Used
Highway Centerline
Side and Other Entrances
All Roadway Classification
Reset Apron and Pipe 66 $ 3,070 $ 3,300 $ 2,380 $ 3,000 Italics numbers are informational only and do not have sufficient data for confidence in their accuracy needed for use in estimating costs.
Labor, Equipment, Material • The average labor cost is $1,730 or 58% of total cost. • The number of labor hours ranged from 8 to 253 with an average of 35 hours. • The average equipment cost is $1,010 or 34% of total cost. • The average materials cost is $260 or 9% of total cost
o Commonly used materials are pipe ties and soil stabilization items such as fiber blanket, seed mix and geotextile. However none of these items are costly.
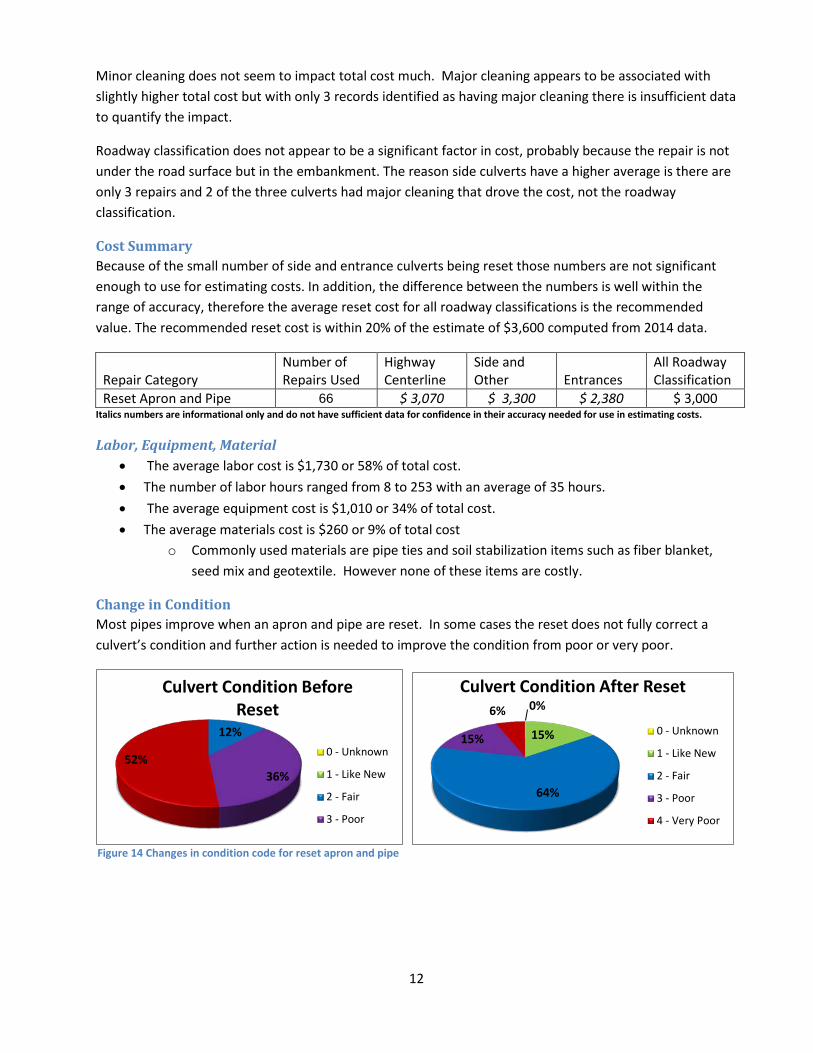
Change in Condition Most pipes improve when an apron and pipe are reset. In some cases the reset does not fully correct a culvert’s condition and further action is needed to improve the condition from poor or very poor.
Figure 14 Changes in condition code for reset apron and pipe
12
12%
36% 52%
Culvert Condition Before Reset
0 - Unknown
1 - Like New
2 - Fair
3 - Poor
0%
15%
64%
15%
6%
Culvert Condition After Reset
0 - Unknown
1 - Like New
2 - Fair
3 - Poor
4 - Very Poor

Replace Apron or Pipe
Data Review and Observations 52 apron and pipe replacements were completed. 11 were replaced in 2014 and 41 were completed in 2015, mostly due to District 3’s work. Many of the 2015 replacements were for aprons only which had the effect of reducing the average cost. Factors associated with higher cost repairs are highway culverts, major cleaning, repaired length of 30 feet or greater and fixing areas that have washed out. The lowest cost repairs were replacing a single metal apron.
Cost Summary Average Replace Apron costs of side and entrance pipes are similar. Highway replacements have more scatter and tend to be more costly.
Repair Category Number of Repairs Highway Side Entrances
All Roadway Classification
Replace Apron and Pipe 52 $ 4,430 $ 2,570 $ 2,450 $ 3,000
Labor, Equipment and Materials • The average labor cost is $1,540 or 51% of total cost. • The number of labor hours ranged from 5 to 100 with an average of 31 hours. • The average equipment cost is $890 or 30% of total cost. • The average materials cost is $570 or 19% of total cost
Change in Condition 5 pipes were recorded as being in new condition and 22 were in fair condition prior to apron replacement. The majority of these were locations where the pipes were in fair condition but did not have aprons. District 3 installed a significant number of new aprons and reshaped ditches along highway 25 in the last year. In some cases aprons were replaced but the remaining pipe was still in poor condition. It is also possible that some of the codes were incorrect.
Figure 16 Changes in condition code for apron replacement
6%
10%
42% 27%
15%
Culvert Condition Before Apron and Pipe Replacememt
0 - Unknown
1 - Like New
2 - Fair
3 - Poor
4 - Very Poor
4%
29%
56%
11%
Culvert Condition After Apron and Pipe Repalacement
0 - Unknown
1 - Like New
2 - Fair
3 - Poor
4 - Very Poor
0
10
20
30
D1 D2 D3 D4 D6 D7 D8 Metro
Number of Replace Apron and Pipe by District
Figure 15 Number of pipe replacements by District
13

Joint Repair Joint repairs fix a broken or separated joint by installing internal bands or sleeve, filling a gap in the joint, or covering joint from the outside of the pipe. Joint repairs do not include moving the pipe such as resetting and tying apron or pipe segments as these are done under the reset repair category.
Data Review and Observations 82% of the joint repairs were done on highway culverts. Most were concrete pipes with only 3 of the 33 joint repairs on metal pipe. Internal joint repair can only be done on pipe large enough for access, 36” is the smallest sized internal band purchased. Smaller sized pipes are more likely to be fixed by covering the joint from the outside with a material that will prevent soil infiltration. The most expensive joint repair included cleaning.
Over 50% of joint repairs were done by District 2 with 11 occurring on US 59. Many appear to have been done at the same time and have had labor or materials split between multiple culverts. Some of the repairs might have been more appropriately identified as resets.
For this type of repair, correctly coding the repair length and providing comments is particularly important. Because joint repair activities can vary greatly from project to project comments provide one of the best ways to understand what work was done.
Improvements are needed in the training and validation of this repair category. Comments should be required to explain the type and extent of the repair. Number of joints repaired should be included in the comments. An explanation should be provided when the condition prior to repair is listed as good or fair. Training for the next season should provide additional guidance on how to record a joint repair and validation should be used to assure data quality.
Cost Summary Data was looked at from type of repair, number of joints repaired and size of pipe. While there are some trends indicating that larger pipe, more joints and internal bands are more costly there is insufficient data to quantify those trends at this time.
Repair Category Number of Repairs Average Repair Cost Joint Repair 33 $ 2,710
Labor, Equipment and Materials • The average labor cost is $1,160 or 43% of total cost. • The number of labor hours ranged from 3 to 100 with an average of 23 hours. • The average equipment cost is $540 or 29% of total cost. • Equipment costs make up a smaller percentage (10%) of total cost for larger pipe 36” and greater
percentage (35%) for smaller pipe where the repair is more likely to involve excavation and grading. • The average material cost is $1,010 or 37% of total cost. • Material costs of some repairs are low because recycled materials they had on hand i.e. old signs.
14

Change in Condition An unusual number of culverts in fair condition had joint repair. There were insufficient comments to determine why and what follow up is needed to determine the reason why these culverts were repaired, and whether the condition codes should be adjusted. The two culverts that are in poor condition after the joint repair was completed improved from an initial condition of very poor.
Figure 17 Changes in condition code for joint repair
Extend Pipe Pipe extension is adding additional sections of pipe to make the culvert longer. Pipes are extended because of the need to change road embankment or ditch geometry, typically to stabilize a slope, widen the road or shoulder or install a safety apron, not necessarily to repair a culvert.
Data Review and Observations Pipe extension costs appear to be influenced by extension length, pipe diameter and cleaning. Theoretically pipe extension costs should be influenced by pipe material. However nearly all pipes were metal with only one concrete and one plastic pipe. Since so much of the cost is associated with labor costs the total labor hours correlate with total cost on a project basis.
Cost Summary Data was analyzed by roadway classification, extension length and pipe diameter. While there appeared to be some trends associated with all of those categories there was insufficient data to develop a definitive relationship. While entrances and 15” pipe appeared to have lower average costs the trend was not significant enough to use without additional data on this repair category.
3%
67%
12%
18%
Culvert Condition Before Joint Repair
0 - Unknown
1 - Like New
2 - Fair
3 - Poor
4 - Very Poor
15%
79%
6%
Culvert Condition After Joint Repair
0 - Unknown
1 - Like New
2 - Fair
3 - Poor
4 - Very Poor
$0$2,000$4,000$6,000$8,000
$10,000
0 20 40 60 80 100Labor Hours
Total Average Cost of Extention
Figure 18 Correlation of cost to labor hours
15

Repair Category Number of Repairs Average Repair Cost Pipe Extension 15 $ 4,060
Labor, Equipment and Materials • The average labor cost is $2,020 or 50% of total cost. • The number of labor hours ranged from 12 to 100 with an average of 40 hours. • The average equipment cost is $1,260 or 31% of total cost • The average material cost is $780 or 19% of total cost.
Change in Condition Extending pipe is not done because a pipe was in poor condition rather they are extended because changes in the road or ditch geometry or the desire to install a safety apron require that the pipe be longer. Of the 3 culverts that were in poor or very poor condition prior to the extension all resulted in improvement to like new or fair condition. So while extension is not done specifically to fix a damaged pipe in some cases repairs such as cleaning and resets are done in conjunction with the work.
Hole Repair Hole Repair is patching isolated holes in pipe wall and may also require filling voids in road bed.
Data Review and Observations Hole repair varies in extent and cost. Hole repairs ranged from $670 to cover holes with fabric to $4,660 to repair a hole made by a guardrail post. In most cases the hole repairs fixed a single hole or damage to the pipe that was not extensive. More than 4 records are needed to produce statistically significant results.
The value of tracking hole repairs is, in part, identifying the cause of the holes such as puncturing during guardrail installation. Identifying the cause and costs of repairing pipe may assist developing practices that prevent future damage or in determining a reimbursement rate.
Cost Summary Repair Category Number of Repairs Average Repair Cost Hole Repair 4 $ 2,000
47% 53%
Culvert Condition Before Extension
0 - Unknown
1 - Like New
2 - Fair
3 - Poor
4 - Very Poor
7%
20%
53%
7% 13%
Culvert Condition Before Extension
0 - Unknown
1 - Like New
2 - Fair
3 - Poor
4 - Very Poor
Figure 19 Changes in condition code for extensions
16
Labor, Equipment and Materials • Average labor cost $1,500 or 75% of total cost. • In 3 of the four repairs labor costs were a significant portion of the overall repair cost. • The number of labor hours ranged from 6 to 72 with an average of 31 hours. • Average equipment cost $480 or 24% of total cost. • Average material cost was $20 or 1% of total cost. • Hole repair uses little or no materials. Material costs ranged from $0 to $33.
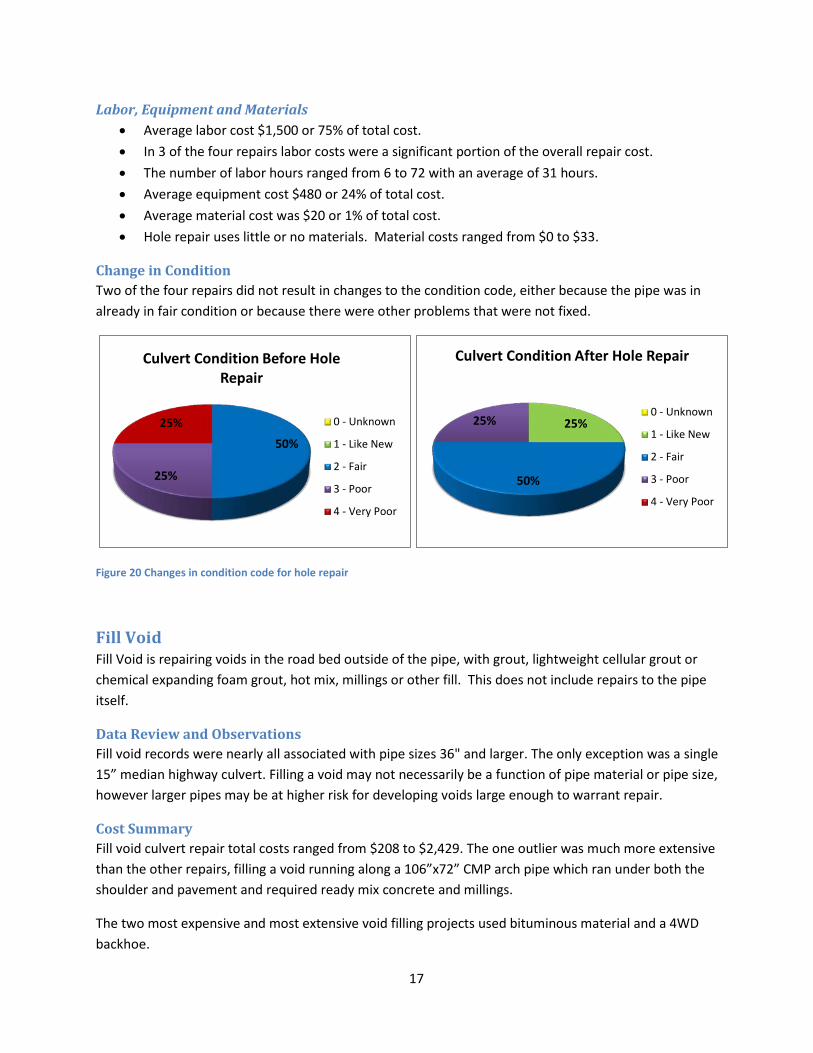
Change in Condition Two of the four repairs did not result in changes to the condition code, either because the pipe was in already in fair condition or because there were other problems that were not fixed.
Figure 20 Changes in condition code for hole repair
Fill Void Fill Void is repairing voids in the road bed outside of the pipe, with grout, lightweight cellular grout or chemical expanding foam grout, hot mix, millings or other fill. This does not include repairs to the pipe itself.
Data Review and Observations Fill void records were nearly all associated with pipe sizes 36" and larger. The only exception was a single 15” median highway culvert. Filling a void may not necessarily be a function of pipe material or pipe size, however larger pipes may be at higher risk for developing voids large enough to warrant repair.
Cost Summary Fill void culvert repair total costs ranged from $208 to $2,429. The one outlier was much more extensive than the other repairs, filling a void running along a 106”x72” CMP arch pipe which ran under both the shoulder and pavement and required ready mix concrete and millings.
The two most expensive and most extensive void filling projects used bituminous material and a 4WD backhoe.
50%
25%
25%
Culvert Condition Before Hole Repair
0 - Unknown
1 - Like New
2 - Fair
3 - Poor
4 - Very Poor
25%
50%
25%
Culvert Condition After Hole Repair
0 - Unknown
1 - Like New
2 - Fair
3 - Poor
4 - Very Poor
17
Repair Category Number of Repairs Average Repair Cost Fill Void 6 $ 1,020
Labor, Equipment and Materials • Average labor cost $490 or 48 % of total cost. • The number of labor hours ranged from 2 to 25 with an average of 9 hours. • Average equipment cost $390 or 38% of total cost. • Average material cost was $140 or 14% of total cost. • All Void repairs used either Class 5 Aggregate or Bituminous materials.
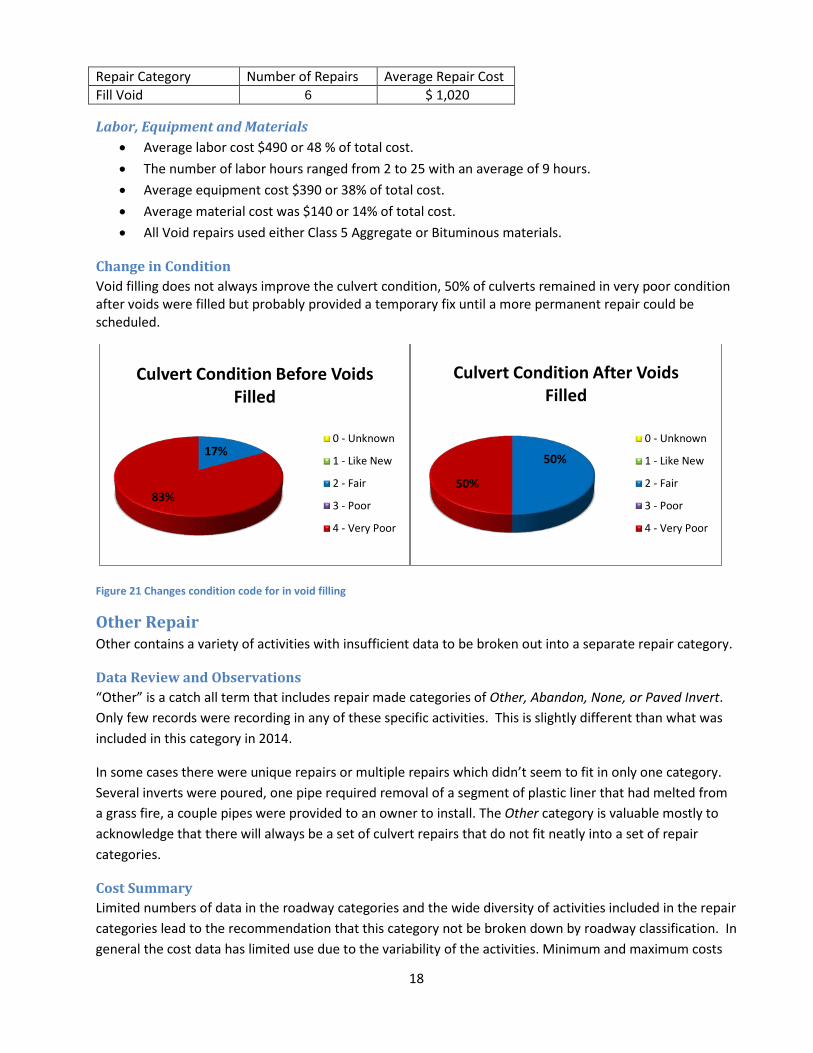
Change in Condition Void filling does not always improve the culvert condition, 50% of culverts remained in very poor condition after voids were filled but probably provided a temporary fix until a more permanent repair could be scheduled.
Figure 21 Changes condition code for in void filling
Other Repair Other contains a variety of activities with insufficient data to be broken out into a separate repair category.
Data Review and Observations “Other” is a catch all term that includes repair made categories of Other, Abandon, None, or Paved Invert. Only few records were recording in any of these specific activities. This is slightly different than what was included in this category in 2014.
In some cases there were unique repairs or multiple repairs which didn’t seem to fit in only one category. Several inverts were poured, one pipe required removal of a segment of plastic liner that had melted from a grass fire, a couple pipes were provided to an owner to install. The Other category is valuable mostly to acknowledge that there will always be a set of culvert repairs that do not fit neatly into a set of repair categories.
Cost Summary Limited numbers of data in the roadway categories and the wide diversity of activities included in the repair categories lead to the recommendation that this category not be broken down by roadway classification. In general the cost data has limited use due to the variability of the activities. Minimum and maximum costs
17%
83%
Culvert Condition Before Voids Filled
0 - Unknown
1 - Like New
2 - Fair
3 - Poor
4 - Very Poor
50%
50%
Culvert Condition After Voids Filled
0 - Unknown
1 - Like New
2 - Fair
3 - Poor
4 - Very Poor
18
varied from $4,480 to $87,746. The most expensive repair pouring a floor in a 6’x6’ box culvert was an outlier and not representative of the typical repairs performed by maintenance.
Repair Category Number of Repairs Average Repair Cost Other 13 $11,270
Labor, Equipment and Material • The average labor cost is $5,530 or 49% of total cost. • The number of labor hours ranged from 4 to 969 with an average of 109 hours. • The average equipment cost is $3,120 or 28% of total cost. • The average materials cost is $2,620 or 23% of total cost.
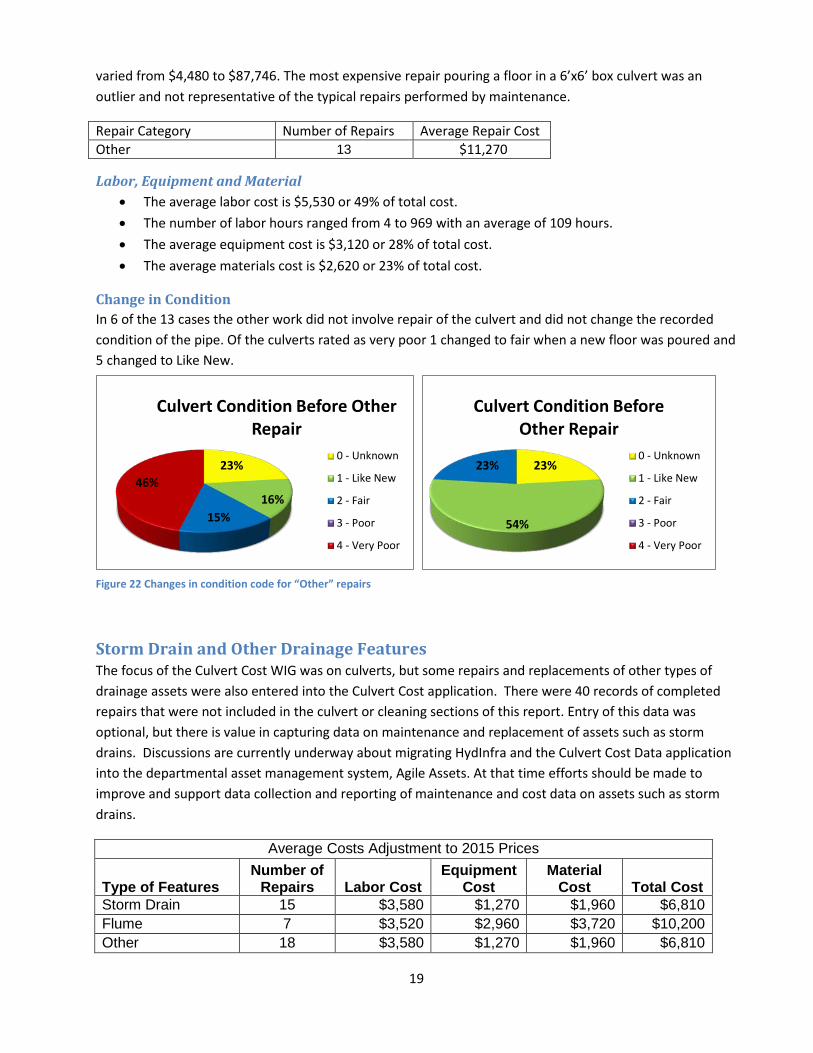
Change in Condition In 6 of the 13 cases the other work did not involve repair of the culvert and did not change the recorded condition of the pipe. Of the culverts rated as very poor 1 changed to fair when a new floor was poured and 5 changed to Like New.
Figure 22 Changes in condition code for “Other” repairs
Storm Drain and Other Drainage Features The focus of the Culvert Cost WIG was on culverts, but some repairs and replacements of other types of drainage assets were also entered into the Culvert Cost application. There were 40 records of completed repairs that were not included in the culvert or cleaning sections of this report. Entry of this data was optional, but there is value in capturing data on maintenance and replacement of assets such as storm drains. Discussions are currently underway about migrating HydInfra and the Culvert Cost Data application into the departmental asset management system, Agile Assets. At that time efforts should be made to improve and support data collection and reporting of maintenance and cost data on assets such as storm drains.
Average Costs Adjustment to 2015 Prices
Type of Features Number of
Repairs Labor Cost Equipment
Cost Material
Cost Total Cost Storm Drain 15 $3,580 $1,270 $1,960 $6,810 Flume 7 $3,520 $2,960 $3,720 $10,200 Other 18 $3,580 $1,270 $1,960 $6,810
23%
16% 15%
46%
Culvert Condition Before Other Repair
0 - Unknown
1 - Like New
2 - Fair
3 - Poor
4 - Very Poor
19
23%
54%
23%
Culvert Condition Before Other Repair
0 - Unknown
1 - Like New
2 - Fair
3 - Poor
4 - Very Poor

11 of the 15 storm drain records were in the Metro District. The majority of the repairs were trench new pipe. On average 53% of cost was labor, 19% of cost was equipment and 29% of cost was materials.
Metro collects pipe work with the culvert cost application but collects other maintenance activities associated with storm drain with GPS data collectors. This total cost data is loaded into HydInfra without detailed information on equipment and most material use.
The 7 flumes were all trench new pipe activities. On average 35% of cost was labor, 29% of cost was equipment and 36% of cost was materials.
Cleaning Culvert cleaning is not the focus of the culvert cost WIG. Collecting culvert cleaning data does provide context for the types of work and expenditures done by Maintenance associated with maintaining culverts and keeping them operational.
Data Review and Observations The cleaning category includes removal of sediment, vegetation, beaver dams and ice. Records have a repair made listed as Beaver, Cleaning, Ditch Cleaning or Ice Removal. Recording cleaning activities is optional so the lack of data is more likely to mean that the data was not recorded rather than that cleaning was not performed in all Districts. The costs recorded in the application are likely to be a small portion of the total expenditures on cleaning activities.
660 cleaning events were recorded in the last two years. The majority of ice removal and beaver removal activities were reported by District 1. District 1 requested the addition of those repair categories for the 2015 collection season to support their decision better quantify and manage those activities. Districts 1 and 2 entered most data for ditch and culvert cleaning activities while Districts 4 and 6 entered some data. No or limited reporting was done by Districts 3, 7, 8 and Metro.
While cleaning does not change the culvert condition code it is critical to keeping drainage features functioning. Poorly maintained drainage leads to flooding and accelerated deterioration of culverts and roads.
Total 2015 Adjusted Cost over Two Year Period
Beaver Removal $150,510 Clean Culvert $213,792 Ditch Cleaning $84,136 Ice Removal $46,165 Total $494,603
108 Beaver 16%
426 Culvert cleaning
65%
59 Ditch
cleaning 9%
67 Ice removal
10%
660 Cleaning Events Recorded
Figure 23 Types of cleaning done
20

Cost Summary There is a wide range of cleaning costs for all cleaning categories. These average costs cannot be used to predict costs at a specific site. Factors that influence cleaning cost are the extent, volume or size of the area being cleaned (major or minor); whether cleaning sites can be grouped and performed at the same time or if expensive equipment is required.
Average Costs Adjustment to 2015 Prices
Cleaning Category Number of
Repairs Labor Cost Equipment
Cost Material
Cost Total Cost Culvert Cleaning 426 $250 $240 $10 $500 Ditch Cleaning 59 $820 $580 $20 $1,430 Beavers 108 $940 $400 $50 $1,390 Ice Removal 67 $340 $350 $0 $690 All Cleaning 660 $430 $310 $20 $750
Labor, Equipment and Materials • The average labor cost for all types of cleaning is 49-68% of total cost. • The average equipment cost for all types of cleaning is 29-51% of total cost. • The average materials cost for all types of cleaning is 0-4% of total cost.
o There are little or no materials costs with most cleaning. The one exception included riprap installation which is not typically included in cleaning.
Lessons Learned and Future Directions The Culvert Cost project has provided more accurate estimates of average costs for different types of drainage system repairs and maintenance. These costs have been used to update the LCC (Life Cycle Cost) model and to estimate system wide needs to manage culvert assets. This data can be used to update TAMP (Transportation Asset Management Plan) and MnSHIP (Minnesota State Highway Investment Plan).
Culvert Cost WIG Results: • Determined typical labor, equipment and materials used in several types of culvert repairs, along
with the costs, to help understand total costs of drainage work. • Provided data and a starting point for Maintenance to look for efficiencies in:
o choosing the types of repairs that best fit our operations, versus the repairs that should go into construction projects
o estimating the people and equipment needed to accomplish different types of repairs o Determining Best Practices, training needed and external partners (DNR or beaver trapping
clubs) for repairs. • Developed a process for recording Maintenance’ repair costs with a mobile application that we
could test out and improve before it is hard-coded in Asset Management software and devices. • Provided real repair cost data to apply to state-wide or District estimates of culvert repair needs. • Identify improvements to the HydInfra Suggested Repair (flowchart) sorting process that selects
culverts for specific repair methods by comparing the flowchart suggested repair to the repair that was done by Maintenance.
21

Feedback among participants was a key component in developing a process that worked for everyone. Monthly meetings were held with District Key Experts and the Drainage WIG team that included people from asset management, Maintenance and Hydraulics-Water Resources Engineering groups. Feedback from these meetings was used to improve the application, training and data validation criteria.
In the second year, the data was more consistent and the validation process was smoother. Training had improved, and the App users became more familiar with the requirements. A web-based report of “Individual Repair Details” was available to app users in the field that showed immediately all the data they had entered on a repair. Because users have learned the procedures, less need for validation is expected in the future. Automated validation reports will be developed to improve the process for maintaining data quality these reports that will find essential data pieces such as a missing pipe material on a Trench New Pipe. Key Experts from several Districts have requested in-person training for maintenance personnel in 2016 to promote data quality.
This project has resulted in a better understanding of maintenance repair costs and methods that will be used in future migration of HydInfra to the enterprise asset management system, Agile Assets. Further work is required to complete the circle of lifecycle cost and asset management:
• Merge HydInfra (MnDOT’s Hydraulic Infrastructure inventory and inspection database) with Culvert Cost data into Agile Assets asset management software.
o Include cost data for storm drain in new asset management system. o Capture as-builts for drainage features from Construction projects, in the database.
• Quantify the costs of drainage work in Construction Contracts. • Compare Construction and Maintenance costs to identify cost efficiencies in programing work. • Use data to improve practices and decision-making.
22