2015 market demand study guide - novogradac & · pdf file · 2016-01-272015...
TRANSCRIPT
2015 Market Demand Study Guide
2015 Market Demand Study Guide
When committing Low Income Housing Tax Credits or other funding to a Project, the Arizona Department of Housing (“ADOH”) must examine neighborhood market conditions to ensure adequate need for a Project. ADOH is able to make this certification based in part on a Project’s Market Demand Study. The Market Demand Study Guide outlines the requirements and format of a Market Demand Study.
Title II of the Americans with Disabilities Act prohibits discrimination on the basis of disability in the programs of a public agency. Individuals with disabilities or with limited English proficiency who need the information contained in this publication in an alternate format may contact Housing (602) 771-1000 or our TTY number, (602) 771-1001 to make their needs known. Requests should be made as soon as possible to allow sufficient time to arrange for the accommodation.
Arizona Department of Housing i

2015 Market Demand Study Guide
1. erview .................... Ov ........................................................................................................ 41.1 General Requirements ......................................................................................................................................................... 4 Market Studies will be required to use the most current data that is available at the time of
publication.......................................... ....................................................................................................................................... 51.2 Market Demand Study Outline ...................................................................................................................................... 5
2. troduction ........................................ In .............................................................................. 7 Objectives of the Market Dem 2.1 and Study .................................................................................................................. 7 Qualifications 2.2 of the Analyst ........................................................................................................................................... 72.3 Certifications ............................................................................................................................................................................ 7
3. Executive Summary ........................................................................................................ 8
4. Proposed Project Summary .......................................................................................... 9 Project Description ....................................... 4.1 ......................................................................................................................... 94.2 Proposed Unit and Project Amenities ......................................................................................................................... 9
5. Proposed Site Analysis ............................................................................................... 10 Site Description ................... 5.1 ................................................................................................................................................. 10 Site Access and Visibility ................... 5.2 ............................................................................................................................. 10 Proximity to Com 5.3 munity Services ............................................................................................................................. 10 Site Photogr 5.4 aphs ................................................................................................................................................................. 115.5 Crime Maps ............................................................................................................................................................................ 11
6. arket Area Analysis ................................................................................................. M 12 Market Area Desc 6.1 ription ................................................................................................................................................ 126.2 Market Area Map ................................................................................................................................................................ 12
7. mographic and Econo De mic Analysis .................................................................. 13 Population and Ho 7.1 useholds.......................................................................................................................................... 13 Household In 7.2 come ............................................................................................................................................................. 137.3 Employment .......................................................................................................................................................................... 14
8. pply Analysis ........... Su ................................................................................................. 15 Housing Stock Overview .. 8.1 .............................................................................................................................................. 15 Rental Housing Overvi 8.2 ew .............................................................................................................................................. 158.3 Comparable Properties .................................................................................................................................................... 16
9. Capture Rate Analysis ................................................................................................ 19
10. Conclusions .................................................................................................................... 21
11. pendices .......................... Ap ........................................................................................... 22 APPENDIX 1 – Certifications .................... 11.1 ................................................................................................................... 22 APPENDIX 2 – Project Summary Ta 11.2 ble .................................................................................................................. 2411.3 APPENDIX 3 – Proposed Amenities ........................................................................................................................ 25
Arizona Department of Housing ii

2015 Market Demand Study Guide
Arizona Department of Housing iii
11.4 nd Site Area Detractions .............................................................. 2611.5 APPENDIX 5 – Capture Rate Analysis .................................................................................................................... 27 APPENDIX 4 – Community Services a
2015 Market Demand Study Guide
1. OVERVIEW
1.1 General Requirements
An independent third-party Market Demand Study is required for all projects with 12 or more rental units. The Market Demand Study included in the application must be an accurate and true assessment of the housing market in the primary area of the proposed development, and must have been completed not more than 6 months prior to application submission to ADOH. A professional market analyst experienced in multi-family rental housing must prepare the study and have no affiliation with the Applicant, Developer, Lender, and/or Syndicator.
ADOH may reject an application if it determines, in its sole discretion, that (1) the Applicant’s Market Demand Study has not been prepared in accordance with the Market Demand Study Guide; (2) is not satisfactory in form, content, or organization; or (3) the market demand and conditions do not justify the development as proposed based on information submitted in the Applicant’s Market Demand Study or information obtained by ADOH from other sources. ADOH will consider all facts and circumstances in making this determination, including the possible disruption caused by unneeded units entering the market at low rents.
ADOH receives a large number of market studies from applicants for Low-Income Housing Tax Credits and other funding sources. By requiring the same type of information in all market studies, ADOH will be able to assess housing needs in competing communities through a comparison of similar characteristics. The objective of the Market Demand Study is to demonstrate the existence of sufficient demand for the proposed development in the market area. ADOH also wants to ensure the proposed development will not cause undue economic harm on the existing rental stock in the market area.
In its review of supply and demand, the Market Demand Study must focus on the type of low-income housing development being proposed (i.e., elderly*, large family, populations with special housing needs) as well as the income and rent levels proposed for the project. The Market Demand Study must demonstrate strong demand for the type of low-income housing project proposed, as evidenced by growth of income-qualified renter households in the market area, relatively low vacancy rates, comparable rent levels, and strong absorption rates at comparable properties in the market area. The market analyst is required to solicit the opinion of those knowledgeable of the housing market in the community where the proposed development is located. These experts include, but are not limited to appropriate government officials (housing, planning, or economic development), local experts (i.e. brokers, developers, chambers of commerce), and colleges or universities. The opinions of these experts are to be recorded in the Market Demand Study. The Applicant must provide local government officials a copy of the Market Demand Study as soon as it is available.
*The term “elderly” throughout the Market Demand Study Guide is used to reference all allowable target populations for Housing For Older Persons, as defined in the 2015 Qualified Allocation Plan. If the Project is targeting a specific Older Persons population, the Analyst should indicate which Older Persons population is being targeted and incorporate appropriate data in the Market Demand Study for the Project.
Arizona Department of Housing 4

2015 Market Demand Study Guide
ADOH will issue a letter to the appropriate government entity requesting their response to the Market Demand Study. The local government entity must submit a letter to ADOH commenting on the conclusions of the Market Demand Study and issue any disagreements it may have with the Market Demand Study. The Applicant will be made aware of any such disagreement so that the market analyst can issue a response.
All assumptions and sources of data used within the Market Demand Study must be clearly documented. All demographic tables are to include both absolute numbers and corresponding percentages (% growth or % of total),
The following Market Study Outline establishes ADOH’s minimum requirements. Market Analysts are expected to include any additional information that may be relevant and necessary to the analysis. Following its review of the Market Demand Study, ADOH, in its sole discretion, may request additional market information from the Applicant, the Applicant’s market analyst, or another market analyst.
1.2 Market Studies will be required to use the most current data that is available at the time of publication. Market Demand Study Outline
The Market Demand Study must be prepared based on the following outline. The order and names of each section detailed in this outline are to be used.
1. Introduction A. Objectives of the Market Demand Study B. Qualifications of the Analyst C. Certification Letter
2. Executive Summary
3. Proposed Project Summary A. Project Description B. Proposed Unit and Project Amenities
4. Proposed Site Analysis A. Site Description B. Site Access and Visibility C. Proximity to Community Services D. Site Photographs
5. Market Area Analysis A. Market Area Description B. Market Area Map
6. Demographic and Economic Analysis A. Population and Households B. Household Income C. Employment
Arizona Department of Housing 5

2015 Market Demand Study Guide
D. Housing
7. Supply Analysis A. Rental Housing Overview B. Comparable Properties
8. Capture Rate Analysis
9. Conclusions
Addendums
Arizona Department of Housing 6

2015 Market Demand Study Guide
Arizona Department of Housing 7
2. INTRODUCTION
2.1 Objectives of the Market Demand Study
Provide in this section a brief overview of the project including, but not limited to, the following items: 1. Project Name 2. Location (address/intersection and city/town) 3. Type of project (new construction or rehab) 4. Market segment served (family, elderly, special needs) 5. Income targeting (60%, 50%, 40%, 30% AMI; public housing; market rate) 6. Number of units
Provide in this section details any assumptions and limiting conditions used in the Market Demand Study.
The entity that commissioned the Market Demand Study must be identified including entity name, contact name, address, and phone number.
2.2 Qualifications of the Analyst
This section of the study should include a one to two page summary of the analyst’s qualifications and experience in conducting market studies for income-restricted rental housing properties.
2.3 Certifications
The market analyst must include the Certifications provided in APPENDIX 1.

2015 Market Demand Study Guide
3. EXECUTIVE SUMMARY
The Executive Summary must outline the most pertinent findings of each section of the Market Demand Study. The Executive Summary should not exceed five pages. It should provide brief summaries of the proposed development, site evaluation, market area, demographic and economic trends, rental housing market, comparable market rents, capture rate analysis, and conclusions. A table detailing the characteristics of the proposed development and conclusions of the market study must be provided. The following table includes the minimum information and format required. Other information may be added.
Location DescriptionProject Name: Project Type: New Construction or RehabCity/Town: Total Units:County: Low Income Units:Address/Intersection: Market Rate Units:Census Tract: Unit Types:
Income Set Asides:Target Population: Family, elderly, or special needs
Demand, Absorption, and Occupancy
Target Vacancy Rate:Projected Absorption Rate:Projected Lease-Up Period:New Households Capture Rate (Project Total):
Quick Project Details
Arizona Department of Housing 8
2015 Market Demand Study Guide
4. PROPOSED PROJECT SUMMARY
4.1 Project Description
The market analyst must incorporate the following information in the Project Summary Table provided in APPENDIX 2: proposed unit mix, unit size, gross rents, utility allowances, collected rents and utility responsibility. The market analyst should also provide a narrative which describes the anticipated date of opening, a description of the architectural finishes (e.g., 40% brick/60% stucco with tiled roof), number of stories, and construction type (i.e., walk-up, townhouse, high-rise with elevator).
For rehabilitation projects the following additional information is required: current rents, current and historical vacancy rates, wait lists, a current rent roll, and an analysis of the number of existing units occupied by residents who are expected to be income-eligible for the proposed development is required.
For mixed-use properties which include retail, office or other commercial uses, describe the expected synergies and potential conflicts between and among each use.
4.2 Proposed Unit and Project Amenities
The market analyst must incorporate the Amenities Table provided in APPENDIX 3 to note the following information: unit and project amenities, the number and type of parking spaces, net (heated) square footage of the community building (if proposed) and the fees for any optional amenities. For rehabilitation projects, a detailed list of the proposed improvements is to be included as well. (This can be provided by the developer and included as an Addendum to the study.)
Arizona Department of Housing 9

2015 Market Demand Study Guide
5. PROPOSED SITE ANALYSIS
5.1 Site Description
The market Analyst must personally visit the proposed site. The site location is to be described using the nearest roadways (streets and/or highways) (and address, if applicable). The physical features of the proposed site are to be noted (i.e. flat, undeveloped, agricultural, rocky, etc). Other information to be documented includes the size of the proposed site (in acres) and the census tract in which the site is located. The census tract of the proposed site is available from the Census Bureau at the following link: http://factfinder2.census.gov/faces/nav/jsf/pages/index.xhtml
Describe the project location in terms of neighborhood characteristics, such as schools, transportation, employment centers, shopping, community services, public facilities, and the type and condition of adjacent land uses. Discuss the positive and negative attributes of the proposed site and surrounding neighborhood as well as the impact of the site and neighborhood on project marketability. Include a scaled map showing the site and important neighborhood facilities and amenities.
5.2 Site Access and Visibility
Provide a discussion of traffic patterns and an evaluation of its impact on the proposed site. Describe the roadway(s) providing access to the proposed development including the most current traffic counts available. To the extent that the most current traffic count is outdated, a traffic count survey is either unavailable or does not cover the roadways adjacent to the proposed site, a statement to that effect must be made. Note the proposed site’s roadway frontage (in feet) and evaluate the proposed site in terms of its visibility from the adjacent roadways. If the site is located along a secondary roadway, note its proximity to the nearest major roadway and discuss any difficulties with visibility and access including (but not limited to) highways, power lines, railroad tracks, or landfills. The impact of these difficulties and any other location consideration relevant to the market and marketability of the proposed site should be evaluated.
5.3 Proximity to Community Services
The market analyst must incorporate the Proximity to Community Services Table provided in APPENDIX 4. Note the travel distance in miles calculated as a straight line from the edge of the property line closest to the facility to the center of the facility. Include a map detailing the locations of the community services in relation to the proposed site. Be sure to include a distance scale on the map (i.e. 1” = 2 miles). The map should also include a 1-mile ring if the Project is located in Maricopa or Pima Counties, and a 2-mile ring in all other areas of the state. Note also the direct distance to site detractions (i.e., excessive noise generators and health hazards, etc.) where appropriate in APPENDIX 4. ADOH reserves the authority to determine the actual distance for scoring purposes in the QAP. ADOH uses Google Earth’s calculation of the distance in feet for scoring purposes.
Arizona Department of Housing 10

2015 Market Demand Study Guide
Arizona Department of Housing 11
5.4 Site Photographs
Provide color photographs of the subject site and adjacent properties including streetscapes. All photographs are to be described (e.g., view of the site, looking northeast from Main Street / view from the site, looking west toward the adjacent single family home).
5.5 Crime Maps
The Market Analyst is expected to provide ADOH with a commentary and analysis on neighborhood crime trends, implications and perceptions integrating all pertinent information. Include a map of the PMA showing property and violent crime for the most recent period, as well as a map showing crime data for the prior 12 months. Note if there are any special enforcement zones or concentration efforts on behalf of law enforcement.
2015 Market Demand Study Guide
6. MARKET AREA ANALYSIS
6.1 Market Area Description
The Market Area is the geographic area in which the subject development will compete with similar properties for residents. It is the area in which properties of the same use are affected by the same economic, demographic, and supply and demand factors. It is also the smallest geographic area from which the subject development will draw most of its residents. Primary Market Area (“PMA”) must be a contiguous functional region with similar uses and demographic trends.
The market area must be justified. The market analyst must provide a narrative describing the methodology and rationale used to determine the market area. The narrative is to include the names and telephone numbers of the local sources interviewed (as well as summaries of those interviews) that assisted in the determination of the market area. Local sources include (but are not limited to) area apartment managers, city administrators, postmaster, senior center operators, hospital administrators, and school administrators. If the market analyst chooses to define a Secondary Market Area (“SMA”), a description and justification must be provided.
The square mileage of the market area is to be noted. Market areas are separated by natural (e.g., rivers and mountains) and man-made (e.g., political and socio-economic) boundaries. Market areas are not radial and the ADOH prohibits use of the concentric circle, or other approaches that are not NCHMA accepted practices, such as county-wide or gerrymandered market areas. Market areas may follow Census-defined boundaries including census tracts, block groups or blocks (where appropriate). Market area polygon(s) forming boundary can be shaped by any justifiable form chosen by the analyst, except the radi-concentric circle approach.
Census tract maps are available from the U.S. Census Bureau at the following link. http://factfinder2.census.gov/faces/nav/jsf/pages/index.xhtml
6.2 Market Area Map
Provide a map clearly illustrating the site location and market area.
Arizona Department of Housing 12
2015 Market Demand Study Guide
7. DEMOGRAPHIC AND ECONOMIC ANALYSIS
7.1 Population and Households
Population and household trends within the market area are to be noted in table format. The table must include population and household data from the 2000 Census, 2010 Census, current year, year of project opening, and five-year projection (5 years from the current year). Population and household growth must be noted in absolute and percentage terms. Percentage growth should be listed as compound annual rates. Nationally recognized demographic providers (Claritas, ESRI, AGS, for example) are suggested sources for estimates and projections. Other commercial or government sources of population and household projections will be considered. If the market analyst determines that the growth rates projected by Claritas, ESRI, or other sources are not realistic, the market analyst may adjust the projected growth rates only with proper justification included in the narrative analysis. In this case, the Market Analyst is required to show the projected growth rates from Claritas, ESRI, or other sources as well as the adjusted growth rates.
Data from the Census is provided by the U.S. Census Bureau at the following link: http://factfinder2.census.gov/faces/nav/jsf/pages/index.xhtml
Additional demographic data based on the 2010 Census is required. The type of demographic data, table number from the 2010 Census, and year of the required data are detailed below. This data must be reported for the market area defined in the Market Demand Study. This data must be reported in table format including percentage distributions.
1. Population by Race – 2010 Census Population by Age – 2010 Census, Current Year, 5-year projection Households by Tenure (i.e. renters vs. owners) – 2010 Census Households by Age of Householder – 2010 Census, Current Year, 5-year projection
2. Renter Households by Age of Householder – 2010 Census Renter Households by Household Size – 2010 Census
Market studies addressing a proposed development serving persons with special needs are to include data that is applicable to the targeted population. For example, proposed developments serving persons with disabilities are to include the 2010 distribution of Non-Institutionalized Population with Disabilities by Type of Disability. In addition to reporting the requested data in table format, provide a narrative analysis of the data and its potential impact on demand for the proposed development.
7.2 Household Income
Distribution of Household Income within the Market Area is to be provided in table format for 2010, the current year, and 5-year projection. Provide the median household income for all households, owner households, and renter households.
Distributions of Income among Renter Households are to be provided in table format for 2010, the current year and the anticipated year of project opening. The market analyst will need to project the Distribution of Income among Renter Households to the anticipated year of project opening.
Market Demand Studies addressing a proposed development serving an age-restricted population are to include Distributions of Income among Owner Households by Age, as well as Renter Households by Age. Age cohorts of 10 years are to be used, when applicable and where available.
Arizona Department of Housing 13

2015 Market Demand Study Guide
The distributions can be limited to those age cohorts applicable to the proposed development (i.e., age 55+ or age 62+).
For all tables, income cohorts of no more than $5,000 are to be used, when applicable and where available. Households with income over $50,000 can be condensed into a single cohort.
All tables are to include both the numbers and correlating percentages.
7.3 Employment
The potential demand for the proposed development is a function of the local and regional economy. The market analyst is required to provide an analysis of current and forecasted economic conditions and how they relate to demand for additional new rental housing.
The economy of the market area and the region surrounding the market area should be addressed with a minimum of the following information: 1. Employment by industry – Current Year and Five Years Prior 2. Average annual wages by industry – Most Current 3. Total employment growth – Annually for a ten year period ending five years from the date of
application 4. Unemployment rate –Annually for a ten year period ending five years from the date of
application 5. Proposed transportation improvements and detrimental changes 6. Major current employers and estimated employment within a 20 minute drive time (urban
projects) and 45 minute drive time (rural projects). 7. Anticipated expansions, closures, and any new employment planned within drive times
described above for the next five years.
Provide the above information for the market area if available, otherwise, metro area or countywide figures are suggested. All employment data tables are to include both the numbers and correlating percentages. Employment and wage data can be found from a number of sources including the Arizona Department of Economic Security and the U.S. Bureau of Labor Statistics. Use the following links for further information:
http://www.workforce.az.gov/ or http://www.bls.gov/
Arizona Department of Housing 14

2015 Market Demand Study Guide
8. SUPPLY ANALYSIS
8.1 Housing Stock Overview
In order to characterize the existing housing stock in the market area, a number of data tables from the 2010 Census are required. At a minimum, the following data should be reported in table format using both absolute numbers and percent of total. 1. Units in Structure 2. Vacancy Status 3. Tenure by Year Structure Built 4. Tenure by Units in Structure 5. Tenure by Plumbing Facilities by Occupants per Room 6. Gross Rent 7. Gross Rent as a Percentage of Household Income 8. Value of Owner-Occupied Housing Units
Discuss the affordability of home ownership alternatives available to the target population within the market area, and its impact on the proposed rental housing development.
Discuss current year estimates and projections using available permit data from the local jurisdiction.
8.2 Rental Housing Overview
The market analyst must conduct a large enough survey of the existing rental stock within the market area to provide an accurate overview of the entire rental housing market. In addition to market rate properties, this survey must include all Tax Credit (9%) and Bond (4%) developments and any projects financed through other affordable housing programs that restrict rents (Tax Credit/Bond/Affordable). For subject projects providing Permanent Supportive Housing (PSH), analysts are required to survey and analyze all comparable PSH projects within the subject market.
The following information must be provided at a minimum. If certain information is not available, provide as much information as possible. In addition to tables, provide a narrative summarizing the overall condition of the rental housing market within the market area. Historical data should include the prior four quarters, whenever available.
Following is a breakdown of data and information required (to the extent it is available).
A. Historical and Current Rental Inventory 1. Current rental inventory in the market area for market rate, Tax Credit/Bond/Affordable units
(separately), and any other PSH projects detailing number of units by unit type, average gross rents by unit type (adjusted for utilities), average unit sizes by unit type, and vacancy rates.
2. Historical & current vacancy rates and new units constructed for the entire Rental Market. 3. Historical & current vacancy rates and new units constructed for Tax Credit/Bond
developments, and any other PSH projects. 4. Historical & current vacancy rates for Government Subsidized developments (if applicable). 5. Seasonality of market. 6. List of LIHTC and Bond developments, and any other PSH projects including number of units,
income set asides, current vacancy rates, and year built.
Arizona Department of Housing 15

2015 Market Demand Study Guide
7. Provide a map showing the locations of the Tax Credit/Bond/Affordable developments and any other PSH projects, if applicable, in the market area.
B. Current Rents & Concessions 1. Current gross rents for comparable and competitive projects in the market area. This must
include all Tax Credit/Bond/Affordable projects and any other PSH projects, any market rate properties, as well as any other projects offering rents effectively equal to those proposed rents at the subject property.
2. Discuss trends in rent increases and decreases during the most recent years. 3. Evaluate how and to what extent (if any) rents are overstated due to concessions or other
factors. 4. Provide information on historical, current, and projected monthly rent concessions, if offered.
C. Absorption and Wait Lists 1. Absorption experience of recently-completed market rate projects. 2. Absorption experience of recently-completed Tax Credit/Bond/Affordable developments and
any other PSH projects. 3. Wait list of existing developments considered most comparable to the proposed development.
This can include income-appropriate wait lists from local housing authorities if updated within the past three months. Wait lists should have sufficient demographic information to be relied upon in the decision making process (i.e. date of visits, income levels, family size, desired unit type/size, etc.)
D. Properties Under Construction or Planned 1. Identify all Tax Credit/Bond/Affordable developments and any other PSH projects in the
market area that are either under construction or planned. If there are no developments in the planning stages or under construction, a statement to that effect must be provided.
2. Identify any market rate developments either under construction or planned that will have rents similar to those offered by the subject property.
3. Provide a map showing the locations of all Tax Credit/Bond/Affordable properties and any other PSH projects, if applicable, either under construction or planned.
4. For each project under construction or planned, provide information such as unit types offered, unit sizes, average rents, estimated completion date, and the extent of any lease-up activity (if available).
Lists of Tax Credit properties, Bond properties, and SHF properties already completed or currently under development can be found at the following links: http://www.azhousing.gov/ShowPage.aspx?ID=529&CID=16 http://www.azhousing.gov/ShowPage.aspx?ID=457&CID=16
8.3 Comparable Properties
The market analyst is required to identify those properties that are considered comparable to and will be in direct competition with the proposed development. Comparable properties are those developments with similar financing, developments serving the same target population, developments offering similar amenity packages, and/or developments offering similar rents. These include Tax Credit/Bond/Affordable properties and any other PSH projects, if applicable, as well as market rate complexes (if applicable). Unless accompanied by a waiver request, it is
Arizona Department of Housing 16
2015 Market Demand Study Guide
Arizona Department of Housing 17
expected that all comparable properties identified are within the primary market area. Properties with 80% or more project-based rent-subsidized units (i.e. RD, HUD Section 8) are NOT to be used as comparables to Tax Credit/Bond/Affordable projects unless a waiver is submitted documenting why their inclusion is warranted. If properties that are anticipated to be in direct competition with the proposed development do not offer similar rents, provide an analysis that explains the rent differential (i.e. much older, superior amenities, etc.)
If the proposed project includes any 3 bedroom or larger units the Market Analyst must survey the PMA and identify and provide a count of all comparable (i.e. 4BD house = 4BD unit offered in proposed project) single family (SF) rental units available for rent during the survey period. A subset containing at least 10 of the most comparable SF rental properties must be used for the following analysis: describe the asking rents, psf rents, and amenity levels of these properties. If average asking rents for the subset of single family properties are within $100 of any concession adjusted rent used as a rent comparable, the single family units must be included in the competitive supply analysis section of the market study.
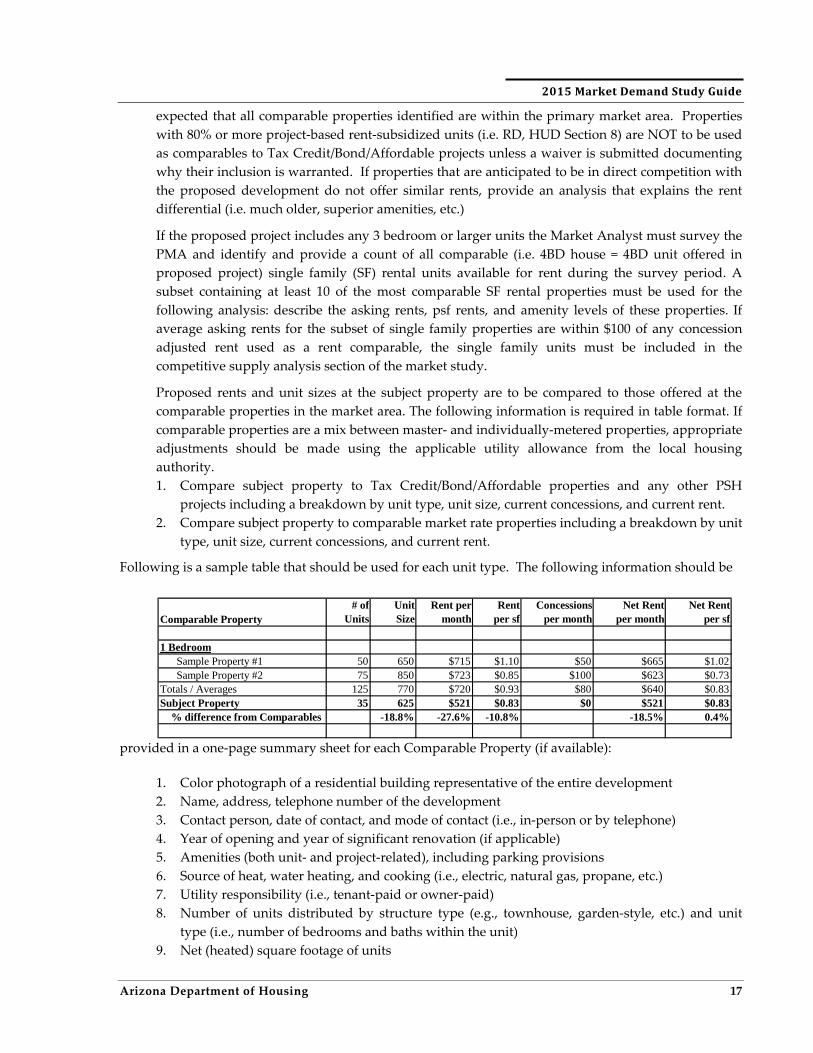
Proposed rents and unit sizes at the subject property are to be compared to those offered at the comparable properties in the market area. The following information is required in table format. If comparable properties are a mix between master- and individually-metered properties, appropriate adjustments should be made using the applicable utility allowance from the local housing authority. 1. Compare subject property to Tax Credit/Bond/Affordable properties and any other PSH
projects including a breakdown by unit type, unit size, current concessions, and current rent. 2. Compare subject property to comparable market rate properties including a breakdown by unit
type, unit size, current concessions, and current rent.
Following is a sample table that should be used for each unit type. The following information should be
provided in a one-page summary sheet for each Comparable Property (if available):
1. Color photograph of a residential building representative of the entire development 2. Name, address, telephone number of the development 3. Contact person, date of contact, and mode of contact (i.e., in-person or by telephone) 4. Year of opening and year of significant renovation (if applicable) 5. Amenities (both unit- and project-related), including parking provisions 6. Source of heat, water heating, and cooking (i.e., electric, natural gas, propane, etc.) 7. Utility responsibility (i.e., tenant-paid or owner-paid) 8. Number of units distributed by structure type (e.g., townhouse, garden-style, etc.) and unit
type (i.e., number of bedrooms and baths within the unit) 9. Net (heated) square footage of units
Comparable Property# of
UnitsUnit Size
Rent per month
Rent per sf
Concessions per month
Net Rent per month
Net Rent per sf
1 BedroomSample Property #1 50 650 $715 $1.10 $50 $665 $1.02Sample Property #2 75 850 $723 $0.85 $100 $623 $0.73
Totals / Averages 125 770 $720 $0.93 $80 $640 $0.83Subject Property 35 625 $521 $0.83 $0 $521 $0.83 % difference from Comparables -18.8% -27.6% -10.8% -18.5% 0.4%

2015 Market Demand Study Guide
Arizona Department of Housing 18
10. Collected rents and estimated gross rents (Gross rent is derived by adding the estimated cost of tenant-paid utilities to the collected rent. The applicable Utility Allowance Worksheet is to be the source of the utility cost estimates.)
11. Vacancy rates by unit type 12. Program participation (e.g., HUD Section 8, RD Section 515, Tax Credit, etc.), if applicable 13. Tenant profile (e.g., family, elderly, persons with special needs, etc.) 14. Wait lists 15. Turnover rate 16. Absorption rate (if the property is less than 3 years of age) 17. Distance from the subject property
Distance from the subject property (in miles) is to be noted as a direct distance from the edge of the property line closest to the comparable property to the property line of the comparable property.
For comparable developments in the planning or construction stages, provide as much of the required information (noted on the preceding page) as is available, and include the development’s estimated date of market entry.

2015 Market Demand Study Guide
9. CAPTURE RATE ANALYSIS
The market analyst is to note the appropriate income range for each percent of Area Median Income (“AMI”) election at the proposed development.
For income-restricted Family Units, the minimum income is to be based on the assumption that the household will apply up to 40% of their gross income towards their total housing expense. The maximum income is to be based on the assumption that population per household will equal the number of bedrooms plus one (1). For example, the population of an efficiency unit is assumed to be 1 (i.e., zero bedrooms plus 1 equals 1), and the population of a three-bedroom unit is assumed to be 4 (i.e., 3 bedrooms plus 1 equals 4).
For income-restricted Housing for Older Persons Units, the minimum income is to be based on the assumption that the household will apply up to 45% of their gross income towards their total housing expense. The maximum income is to be based on the assumption that just one person will occupy all Housing for Older Persons units, regardless of the number of bedrooms within the unit. The Housing for Older Persons Capture Rate Analysis must focus on the targeted age group (i.e., age 55+, or in the case of federally subsidized units - age 62+). Up to 10% of the age- and income-appropriate homeowners within the market area may be included in the Housing for Older Persons Capture Rate analysis. (Homeowners are not to be included in the Family Capture Rate Analysis.)
For market-rate units, the market analyst must make some reasonable determination of a maximum income level beyond which a household will not likely be a participant in the rental market. Clearly note the assumptions used in determining the appropriate income range for the proposed market rate units. For units with project-based rental assistance, the appropriate income range can extend down to $0.
In summarizing the Capture Rate Analysis, use the appropriate table provided in APPENDIX 5. There is one table for family projects and one table for Housing for Older Persons projects. Each of these tables includes two sections: Gross Households Capture Rate and New Households Capture Rate. Completion of these two sections is required.
In addition to the components of demand identified on the capture rate tables, the market analyst is required to account for two other factors. The number of comparable low income and market rate units (if applicable) in the market area that must be absorbed to reduce the vacancy rate to normalized conditions must be determined. Assume that normalized vacancy is no more than the rate identified in the QAP or applicable NOFA. The second factor that must be considered is comparable low income and market rate units either under construction or planned in the market area. For all rehabilitation projects, the estimated number of existing residents that will be income-eligible and will likely remain at the property must be subtracted from the analysis. For projects involving demolition of an occupied residential structure, the Market Analyst must assume that none of the current residents will be expected to remain, unless a waiver is requested which includes a comprehensive relocation plan.
Other sources of demand not included in the Capture Rate tables can be considered if the reason can be justified. Any additional sources of demand should be calculated separately and added or subtracted from the Capture Rate tables. If the proposed project’s PMA includes 3 or more existing or approved and/or under construction Tax Credit/Bond/Affordable or PSH projects, if applicable,
Arizona Department of Housing 19

2015 Market Demand Study Guide
Arizona Department of Housing 20
and more than 50% of the project’s demand is arising from substandard, overcrowded or units lacking complete plumbing, ADOH may consider the PMA to be at an elevated risk of saturation and for cannibalism. Accordingly, ADOH may reject the capture rate outright or significantly adjust these figures. ADOH recognizes that housing demand for certain market segments (i.e. homeless, disabled, Native American, etc.) may not be quantifiable under traditional methodologies. Therefore, in these circumstances the analyst has an additional burden of proof and must include relevant documentation showing additional evidence of demand and alternative demand calculation as well as provide recent cases in comparable market(s) where this demand actually materialized at or near the amounts forecasted without adversely affecting existing stock.
Provide a narrative of what the capture rate means for the proposed development and market area. If the number of proposed units exceeds growth, provide additional documentation of demand that does not include cannibalization of existing affordable projects.
2015 Market Demand Study Guide
10. CONCLUSIONS
The market analyst must summarize project characteristics in terms of its compatibility with the market area and target population. The market analyst must state his/her professional opinion regarding feasibility of the proposed development from a market perspective and the effect the proposed development would have on the existing market. Indicate any other information believed to be important to overall rental demand in the market area including comments on the appropriateness of the unit mix and proposed rents.
Project an absorption rate (units per month), lease-up period (in months), and stabilized vacancy rate for the proposed development. Justify the projected absorption rate, lease-up period, and stabilized vacancy rate for the proposed development. If the anticipated absorption rate causes the proposed development’s initial absorption period to extend beyond one year, “replacement absorption” (i.e., the need to re-rent vacated units due to tenant turnover) needs to be factored into the projection. (The subject property’s absorption period is considered to start as soon as its first unit is certified for occupancy.)
For rehabilitation projects, note the anticipated number of existing (program-eligible) residents who will elect to remain at the property through its renovation. With respect to the anticipated absorption period of renovation projects, note the projection in two ways: 1) using the anticipated retention level and 2) using the assumption that no residents will elect to remain at the property.
If an unusually slow absorption rate and/or unusually low stabilized occupancy rate is anticipated, indicate whether it’s due to market-related issues or product-related issues. Make recommendations as necessary with respect to the appropriateness of the product in the current market.
Discuss the highest and best use of existing residential structures, including a comparison of an acquisition/rehab strategy with an acquisition/rehab/new construction strategy where appropriate.
Evaluate the impact the proposed development on the occupancy rates of all income-restricted properties within the market area and note in table format the income-restricted rental housing property, current vacancy rate, and the anticipated vacancy rate at the subject property’s projected date of stabilized occupancy.
A list of all ADOH’s Tax Credit and SHF funded rental housing projects (existing and under development), are available for review at the following links:
http://www.azhousing.gov/ShowPage.aspx?ID=451&CID=16
http://www.azhousing.gov/ShowPage.aspx?ID=453&CID=16
Arizona Department of Housing 21

2015 Market Demand Study Guide
11. APPENDICES
11.1 APPENDIX 1 – Certifications
Arizona Department of Housing 22

2015 Market Demand Study Guide 2015 Market Demand Study Guide
Arizona Department of Housing 23
Arizona Department of Housing 23
2015 Market Demand Study Guide
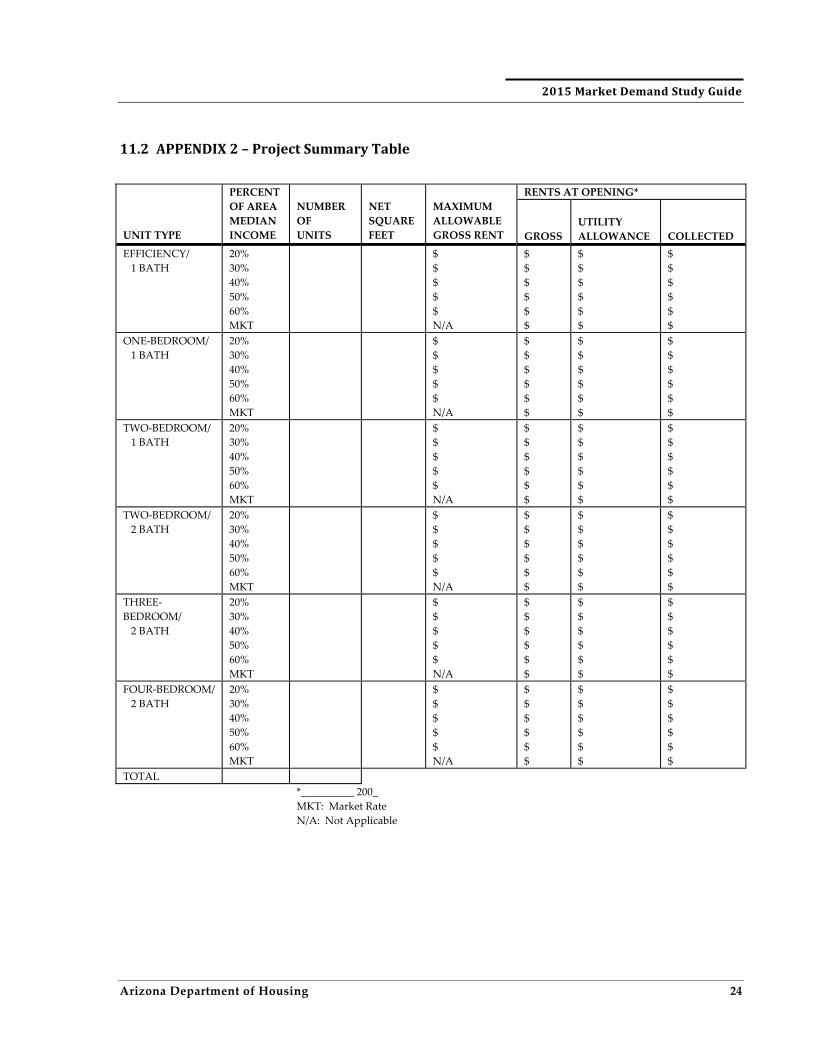
11.2 APPENDIX 2 – Project Summary Table
UNIT TYPE
PERCENT OF AREA MEDIAN INCOME
NUMBER OF UNITS
NET SQUARE FEET
MAXIMUM ALLOWABLE GROSS RENT
RENTS AT OPENING*
GROSS
UTILITY ALLOWANCE
COLLECTED
EFFICIENCY/ 1 BATH
20% 30% 40% 50% 60% MKT
$ $ $ $ $ N/A
$ $ $ $ $ $
$ $ $ $ $ $
$ $ $ $ $ $
ONE-BEDROOM/ 1 BATH
20% 30% 40% 50% 60% MKT
$ $ $ $ $ N/A
$ $ $ $ $ $
$ $ $ $ $ $
$ $ $ $ $ $
TWO-BEDROOM/ 1 BATH
20% 30% 40% 50% 60% MKT
$ $ $ $ $ N/A
$ $ $ $ $ $
$ $ $ $ $ $
$ $ $ $ $ $
TWO-BEDROOM/ 2 BATH
20% 30% 40% 50% 60% MKT
$ $ $ $ $ N/A
$ $ $ $ $ $
$ $ $ $ $ $
$ $ $ $ $ $
THREE-BEDROOM/ 2 BATH
20% 30% 40% 50% 60% MKT
$ $ $ $ $ N/A
$ $ $ $ $ $
$ $ $ $ $ $
$ $ $ $ $ $
FOUR-BEDROOM/ 2 BATH
20% 30% 40% 50% 60% MKT
$ $ $ $ $ N/A
$ $ $ $ $ $
$ $ $ $ $ $
$ $ $ $ $ $
TOTAL *__________ 200_ MKT: Market Rate N/A: Not Applicable
Arizona Department of Housing 24
2015 Market Demand Study Guide
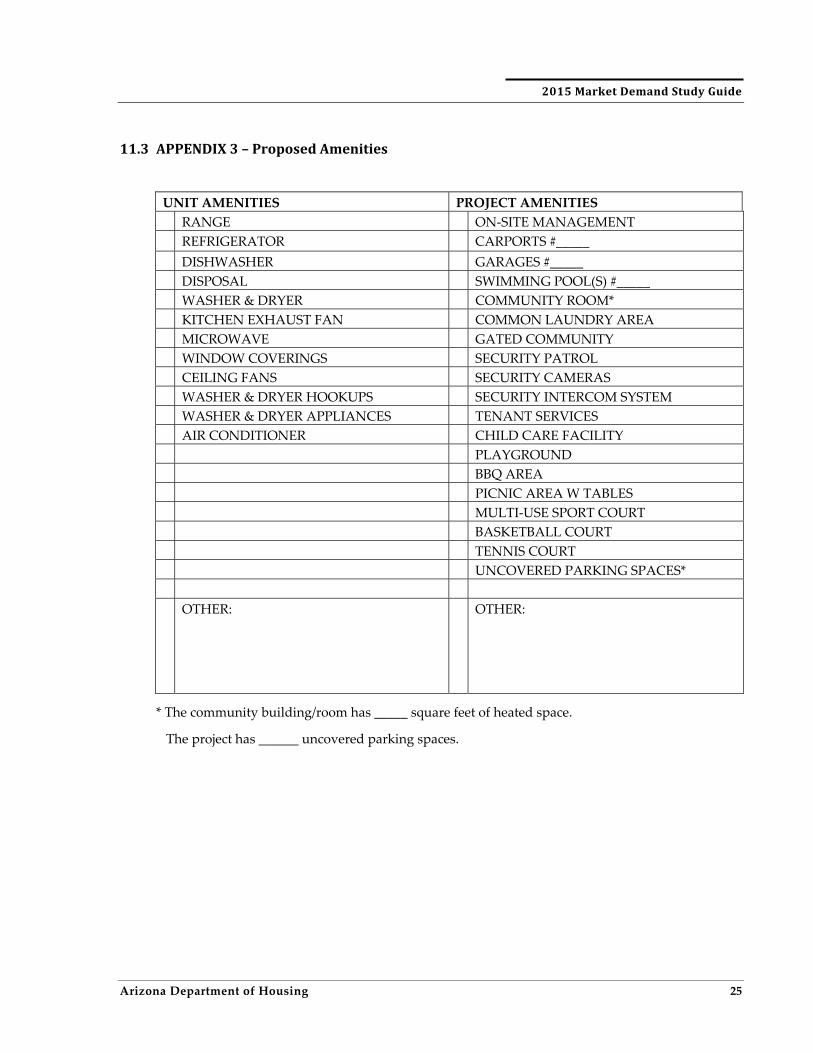
11.3 APPENDIX 3 – Proposed Amenities
UNIT AMENITIES PROJECT AMENITIES RANGE ON-SITE MANAGEMENT REFRIGERATOR CARPORTS #_____ DISHWASHER GARAGES #_____ DISPOSAL SWIMMING POOL(S) #_____ WASHER & DRYER COMMUNITY ROOM* KITCHEN EXHAUST FAN COMMON LAUNDRY AREAMICROWAVE GATED COMMUNITY WINDOW COVERINGS SECURITY PATROL CEILING FANS SECURITY CAMERAS WASHER & DRYER HOOKUPS SECURITY INTERCOM SYSTEMWASHER & DRYER APPLIANCES TENANT SERVICES AIR CONDITIONER CHILD CARE FACILITY PLAYGROUND BBQ AREA PICNIC AREA W TABLES MULTI-USE SPORT COURT BASKETBALL COURT TENNIS COURT UNCOVERED PARKING SPACES* OTHER: OTHER:
* The community building/room has _____ square feet of heated space.
The project has ______ uncovered parking spaces.
Arizona Department of Housing 25

2015 Market Demand Study Guide
Arizona Department of Housing 26
11.4 APPENDIX 4 – Community Services and Site Area Detractions
The QAP scoring is based upon the distance in feet, but it is not required in the Market Demand Study.
COMMUNITY SERVICES
NAME
DIRECT DISTANCE* FROM SITE (IN MILES)
MAJOR HIGHWAY(S) PUBLIC BUS STOP LIGHT RAIL/ STREETCAR STOP
SCHOOLS: ELEMENTARY MIDDLE / JUNIOR HIGH HIGH
SENIOR CENTER HOSPITAL URGENT CARE CENTER, FEDERALLY QUALIFIED HEALTH CENTER
RECREATION CENTER PUBLIC PARK PUBLIC LIBRARY CHILD CARE CENTER FULL SERVICE GROCERY MAJOR EMPLOYERS / EMPLOYMENT CENTERS
SHOPPING CENTER / MALL POLICE/FIRE STATION
OTHER
SITE AREA DETRACTIONSDIRECT DISTANCE* FROM SITE (IN MILES)
ACTIVE RAILROADS FREEWAYS NATURAL WASH AREAS HIGH TENSION POWER LINESLANDFILL / GARBAGE DUMPOIL / CHEMICAL REFINERYPOWER PLANT OTHER

2015 Market Demand Study Guide
Arizona Department of Housing 27
FAMILY CAPTURE RATE ANALYSIS30% AMI
40% AMI
50% AMI
60% AMI
Market Rate
Total Project
Appropriate Income Range$___ to
$____$___ to
$____$___ to
$____$___ to
$____$___ to
$____$___ to
$____
Gross Households Capture Rate
Number of Renter Households in Current Year ( 200_ )Add : Number of renter households expected to be added to the market area by project opening ( 200_ )
Equals: Number of renter households at project opening
Multiply: Percentage of renter households who are income eligibleEquals: Number of income-eligible renter households at project opening
Divide: Number of units being proposed at each income range
Equals: Gross Households Capture Rate
Net Households Capture RateNumber of renter households expected to be added to the market area between the current year and project opening
Multiply: Percentage of renter households who are income eligibleEquals: Number of income-eligible renter households expected to be added to the market area between the current year and project openingSubtract : Number of currently excess vacant units at comparable properties in the market areaSubtract : Number of competitive units that are either under construction or planned in the market areaSubtract: Number of existing residents that are income-eligible and will likely remain at the property (REHAB only)Equals : Net new renter households expected to be added to the market area between the current year and project opening
Divide : Number of units being proposed
Equals : New Households Capture Rate
*Direct distance is “as the crow flies”
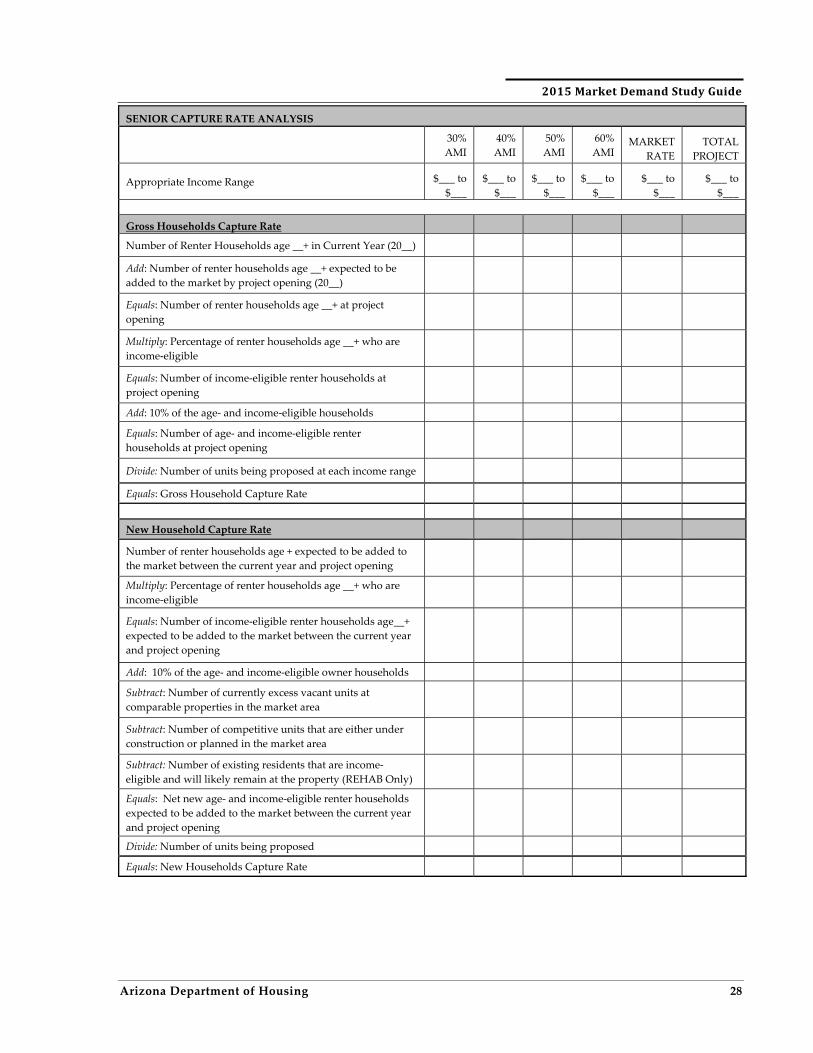
11.5 APPENDIX 5 – Capture Rate Analysis
Note: In the case of rehab projects, “Number of units being proposed” shall only consider the number of subject units that will not continue to be occupied by income-qualified households.
2015 Market Demand Study Guide
Arizona Department of Housing 28
SENIOR CAPTURE RATE ANALYSIS
30% AMI
40% AMI
50% AMI
60% AMI
MARKET RATE
TOTAL PROJECT
Appropriate Income Range $___ to $___
$___ to $___
$___ to $___
$___ to $___
$___ to $___
$___ to $___
Gross Households Capture Rate
Number of Renter Households age __+ in Current Year (20__)
Add: Number of renter households age __+ expected to be added to the market by project opening (20__)
Equals: Number of renter households age __+ at project opening
Multiply: Percentage of renter households age __+ who are income-eligible
Equals: Number of income-eligible renter households at project opening Add: 10% of the age- and income-eligible households
Equals: Number of age- and income-eligible renter households at project opening
Divide: Number of units being proposed at each income range
Equals: Gross Household Capture Rate
New Household Capture Rate
Number of renter households age + expected to be added to the market between the current year and project opening Multiply: Percentage of renter households age __+ who are income-eligible
Equals: Number of income-eligible renter households age__+ expected to be added to the market between the current year and project opening Add: 10% of the age- and income-eligible owner households
Subtract: Number of currently excess vacant units at comparable properties in the market area
Subtract: Number of competitive units that are either under construction or planned in the market area Subtract: Number of existing residents that are income-eligible and will likely remain at the property (REHAB Only) Equals: Net new age- and income-eligible renter households expected to be added to the market between the current year and project opening Divide: Number of units being proposed
Equals: New Households Capture Rate