2015 ohsu-metagenome
TRANSCRIPT
C . T I T U S B R O W N
C T B R O W N @ U C D A V I S . E D U
A S S O C I A T E P R O F E S S O R
P O P U L A T I O N H E A L T H A N D R E P R O D U C T I O N
S C H O O L O F V E T E R I N A R Y M E D I C I N E
U N I V E R S I T Y O F C A L I F O R N I A , D A V I S
Concepts and tools for exploring very large sequencing data sets.
Some background & motivation:
We primarily build tools to look at large sequencing data sets.
Our interest is in enabling scientists to move quickly to hypotheses from data.
My goals
Enable hypothesis-driven biology through better hypothesis generation & refinement.
Devalue “interest level” of sequence analysis and put myself out of a job.
Be a good mutualist!
Narrative arc
1. Shotgun metagenomics: can we reconstruct community genomes?
2. Underlying technology-enabled approach – tools and platforms are good.
3. My larger plan for world domination through technology and training – a kinder, gentler world (?).
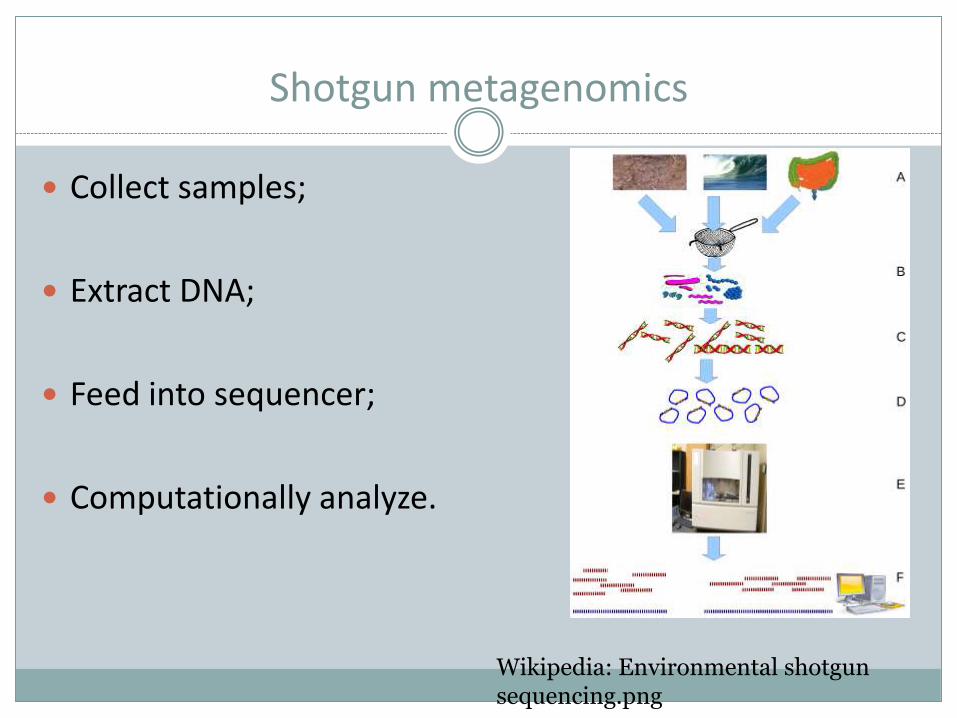
Shotgun metagenomics
Collect samples;
Extract DNA;
Feed into sequencer;
Computationally analyze.
Wikipedia: Environmental shotgun sequencing.png
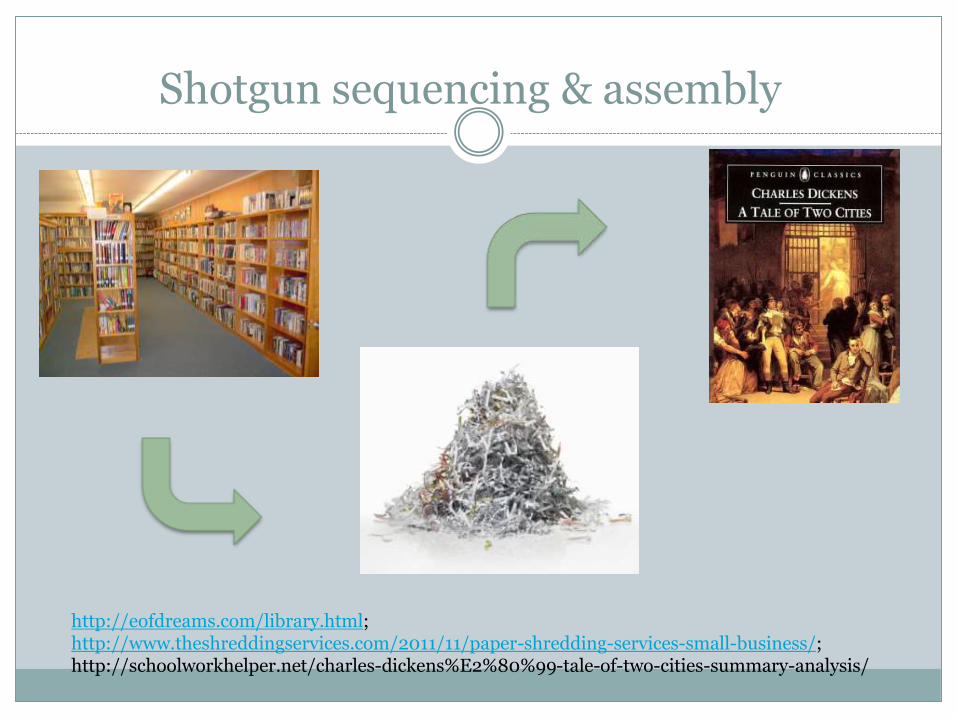
Shotgun sequencing & assembly
http://eofdreams.com/library.html;http://www.theshreddingservices.com/2011/11/paper-shredding-services-small-business/;http://schoolworkhelper.net/charles-dickens%E2%80%99-tale-of-two-cities-summary-analysis/
To assemble, or not to assemble?
Goals: reconstruct phylogenetic content and predict functional potential of ensemble.
Should we analyze short reads directly?
OR
Do we assemble short reads into longer contigs first, and then analyze the contigs?
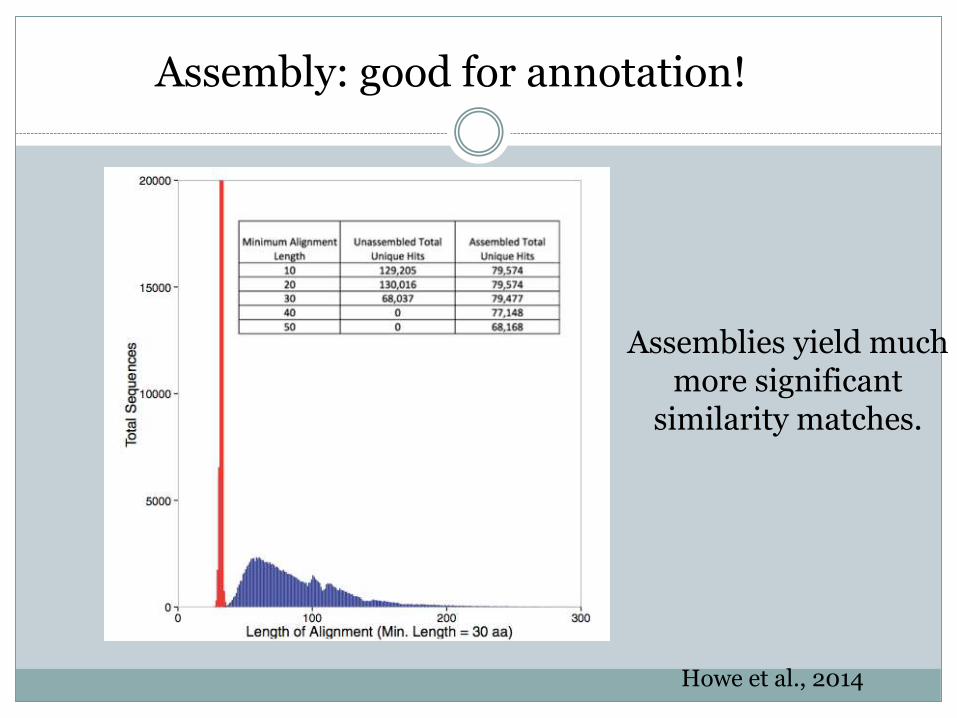
Howe et al., 2014
Assemblies yield much more significant
similarity matches.
Assembly: good for annotation!
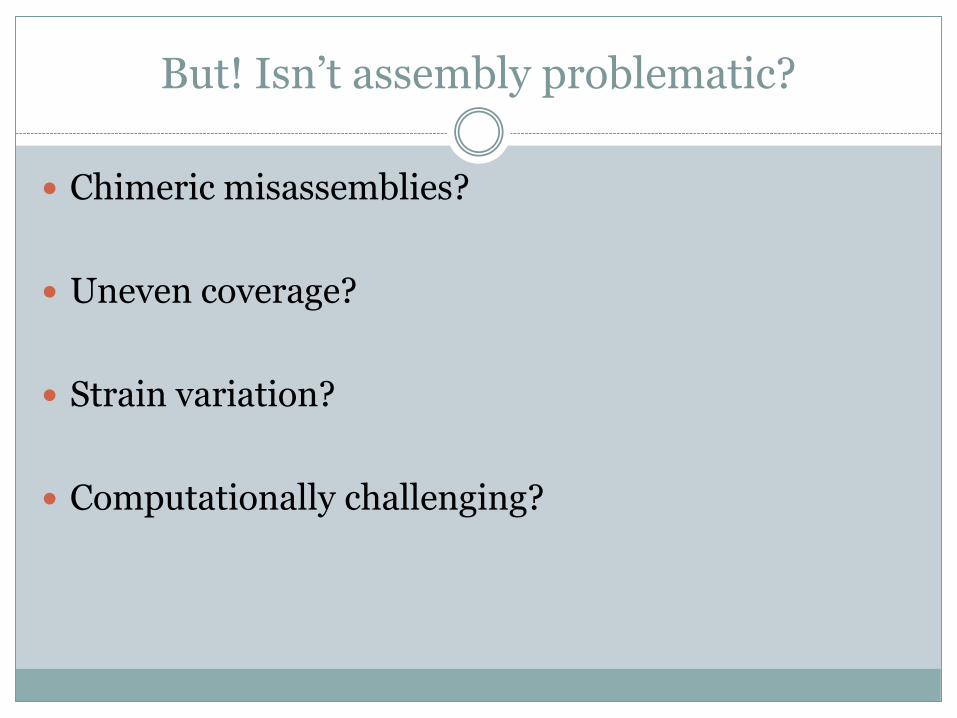
But! Isn’t assembly problematic?
Chimeric misassemblies?
Uneven coverage?
Strain variation?
Computationally challenging?
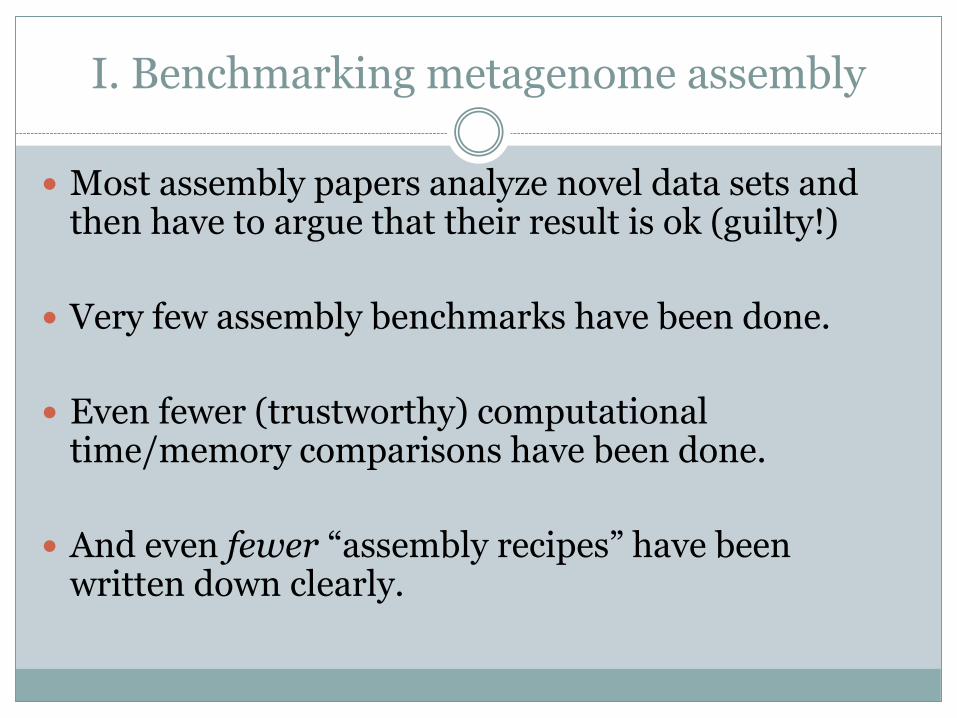
I. Benchmarking metagenome assembly
Most assembly papers analyze novel data sets and then have to argue that their result is ok (guilty!)
Very few assembly benchmarks have been done.
Even fewer (trustworthy) computational time/memory comparisons have been done.
And even fewer “assembly recipes” have been written down clearly.
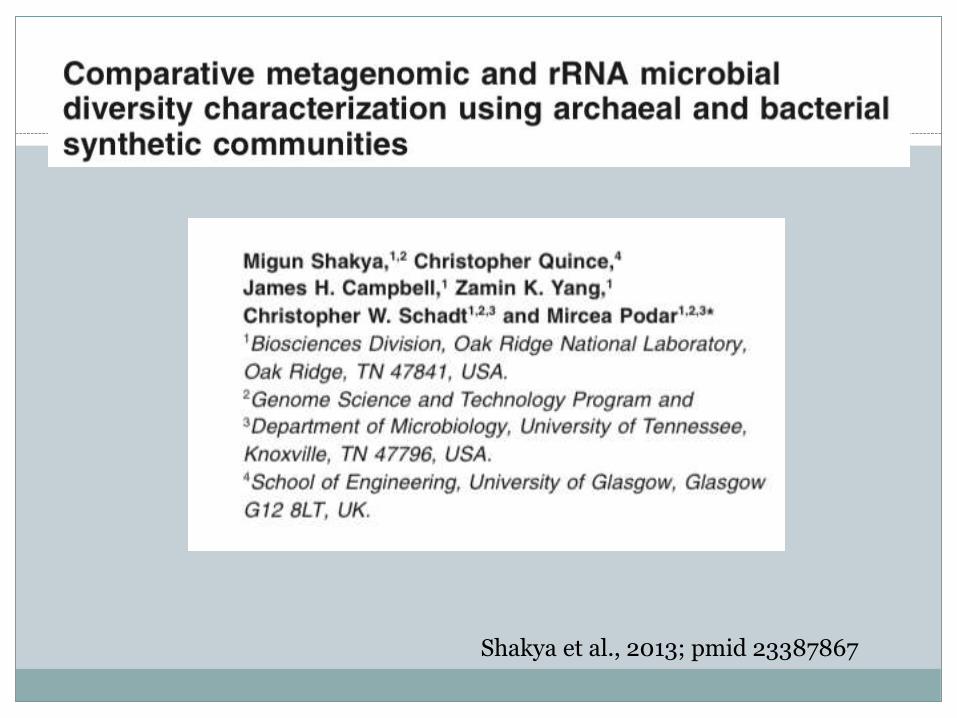
Shakya et al., 2013; pmid 23387867
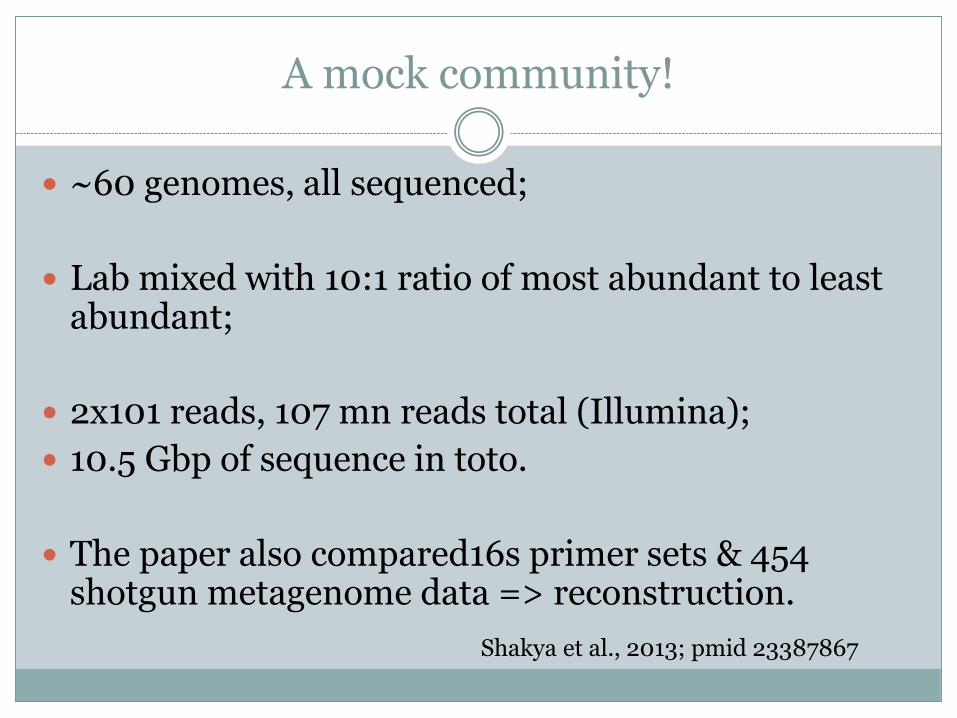
A mock community!
~60 genomes, all sequenced;
Lab mixed with 10:1 ratio of most abundant to least abundant;
2x101 reads, 107 mn reads total (Illumina);
10.5 Gbp of sequence in toto.
The paper also compared16s primer sets & 454 shotgun metagenome data => reconstruction.
Shakya et al., 2013; pmid 23387867
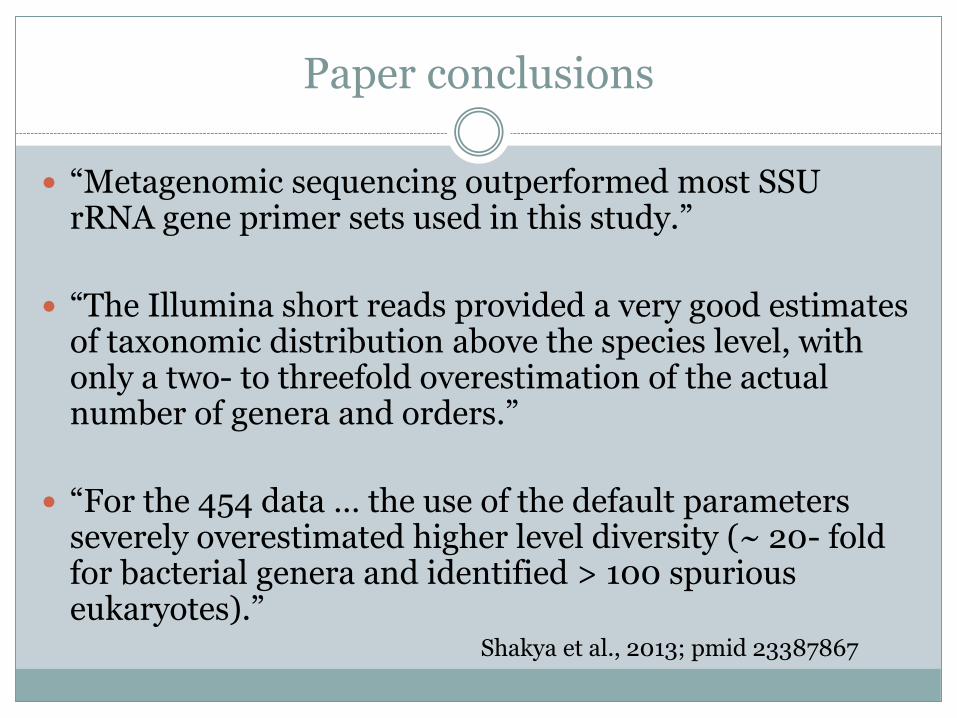
Paper conclusions
“Metagenomic sequencing outperformed most SSU rRNA gene primer sets used in this study.”
“The Illumina short reads provided a very good estimates of taxonomic distribution above the species level, with only a two- to threefold overestimation of the actual number of genera and orders.”
“For the 454 data … the use of the default parameters severely overestimated higher level diversity (~ 20- fold for bacterial genera and identified > 100 spurious eukaryotes).”
Shakya et al., 2013; pmid 23387867
How about assembly??
Shakya et al. did not do assembly; no standard for analysis at the time, not experts.
But we work on assembly!
And we’ve been working on a tutorial/process for doing it!

Adapter trim & quality filter
Diginorm to C=10
Trim high-coverage reads at
low-abundancek-mers
Diginorm to C=5
Partitiongraph
Split into "groups"
Reinflate groups (optional
Assemble!!!
Map reads to assembly
Too big toassemble?
Small enough to assemble?
Annotate contigs with abundances
MG-RAST, etc.
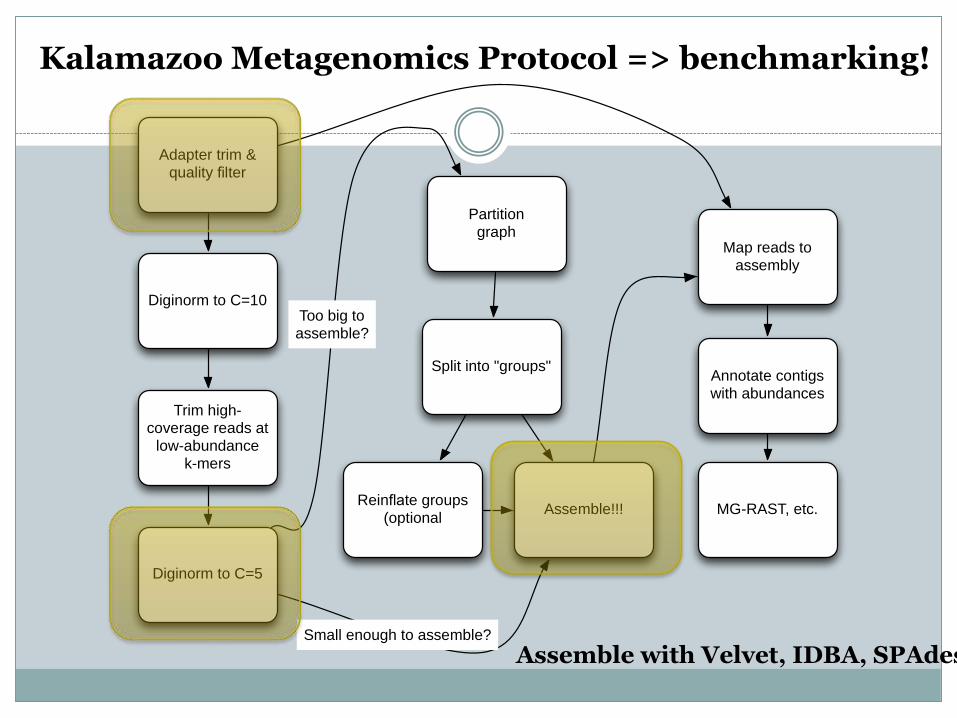
The Kalamazoo Metagenomics Protocol
Derived from approach used in Howe et al., 2014
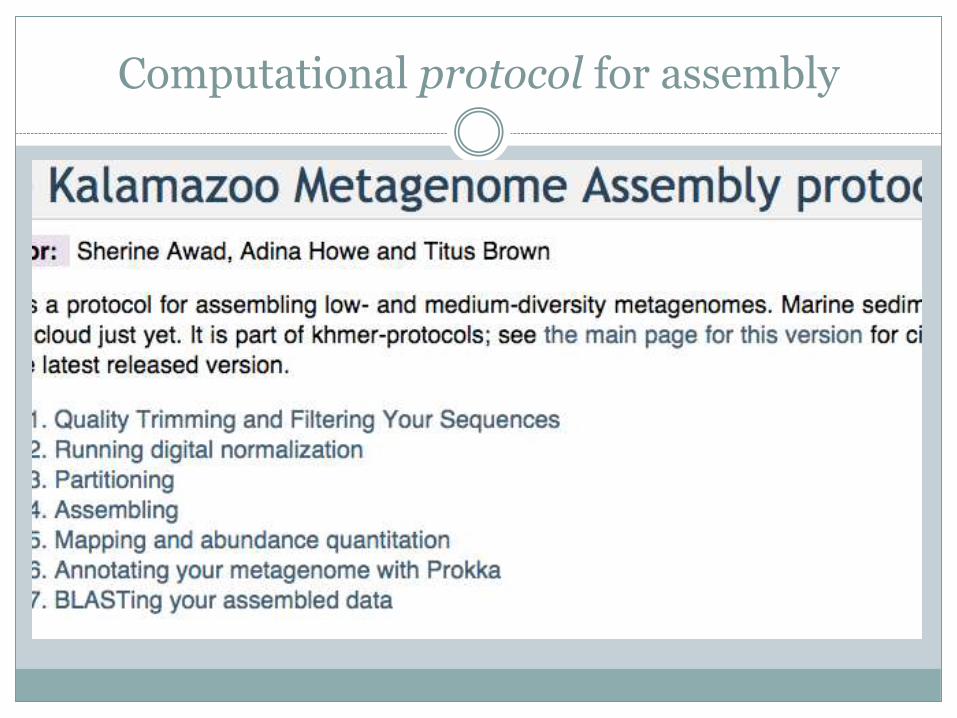
Computational protocol for assembly
Adapter trim & quality filter
Diginorm to C=10
Trim high-coverage reads at
low-abundancek-mers
Diginorm to C=5
Partitiongraph
Split into "groups"
Reinflate groups (optional
Assemble!!!
Map reads to assembly
Too big toassemble?
Small enough to assemble?
Annotate contigs with abundances
MG-RAST, etc.
Kalamazoo Metagenomics Protocol => benchmarking!
Assemble with Velvet, IDBA, SPAdes
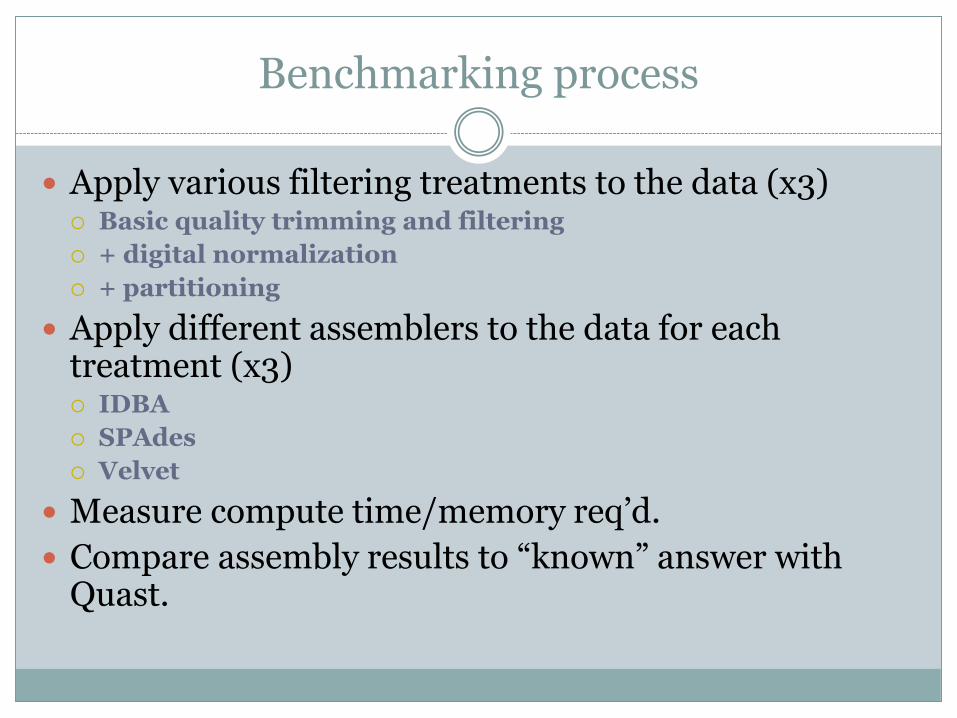
Benchmarking process
Apply various filtering treatments to the data (x3) Basic quality trimming and filtering
+ digital normalization
+ partitioning
Apply different assemblers to the data for each treatment (x3) IDBA
SPAdes
Velvet
Measure compute time/memory req’d.
Compare assembly results to “known” answer with Quast.
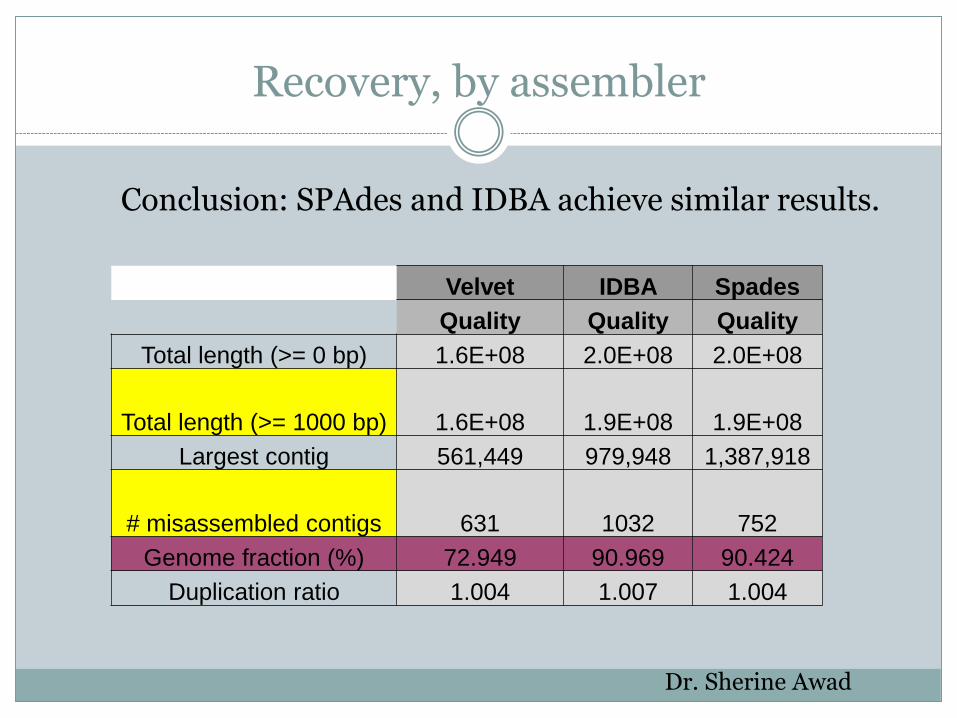
Recovery, by assembler
Velvet IDBA Spades
Quality Quality Quality
Total length (>= 0 bp) 1.6E+08 2.0E+08 2.0E+08
Total length (>= 1000 bp) 1.6E+08 1.9E+08 1.9E+08
Largest contig 561,449 979,948 1,387,918
# misassembled contigs 631 1032 752
Genome fraction (%) 72.949 90.969 90.424
Duplication ratio 1.004 1.007 1.004
Conclusion: SPAdes and IDBA achieve similar results.
Dr. Sherine Awad
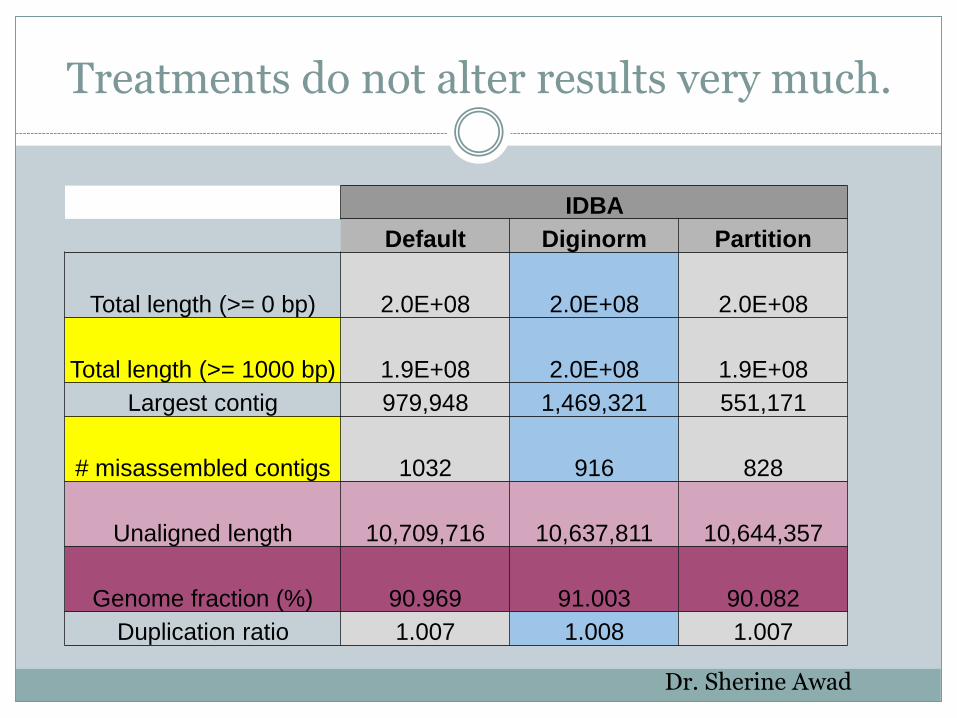
Treatments do not alter results very much.
IDBA
Default Diginorm Partition
Total length (>= 0 bp) 2.0E+08 2.0E+08 2.0E+08
Total length (>= 1000 bp) 1.9E+08 2.0E+08 1.9E+08
Largest contig 979,948 1,469,321 551,171
# misassembled contigs 1032 916 828
Unaligned length 10,709,716 10,637,811 10,644,357
Genome fraction (%) 90.969 91.003 90.082
Duplication ratio 1.007 1.008 1.007
Dr. Sherine Awad
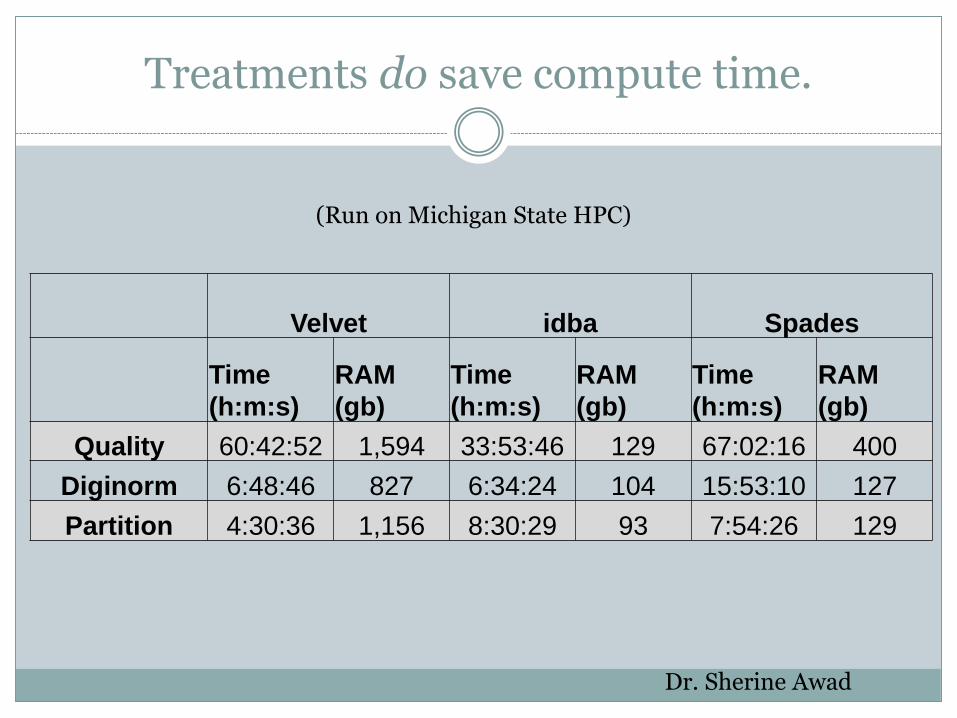
Treatments do save compute time.
Velvet idba Spades
Time
(h:m:s)
RAM
(gb)
Time
(h:m:s)
RAM
(gb)
Time
(h:m:s)
RAM
(gb)
Quality 60:42:52 1,594 33:53:46 129 67:02:16 400
Diginorm 6:48:46 827 6:34:24 104 15:53:10 127
Partition 4:30:36 1,156 8:30:29 93 7:54:26 129
(Run on Michigan State HPC)
Dr. Sherine Awad
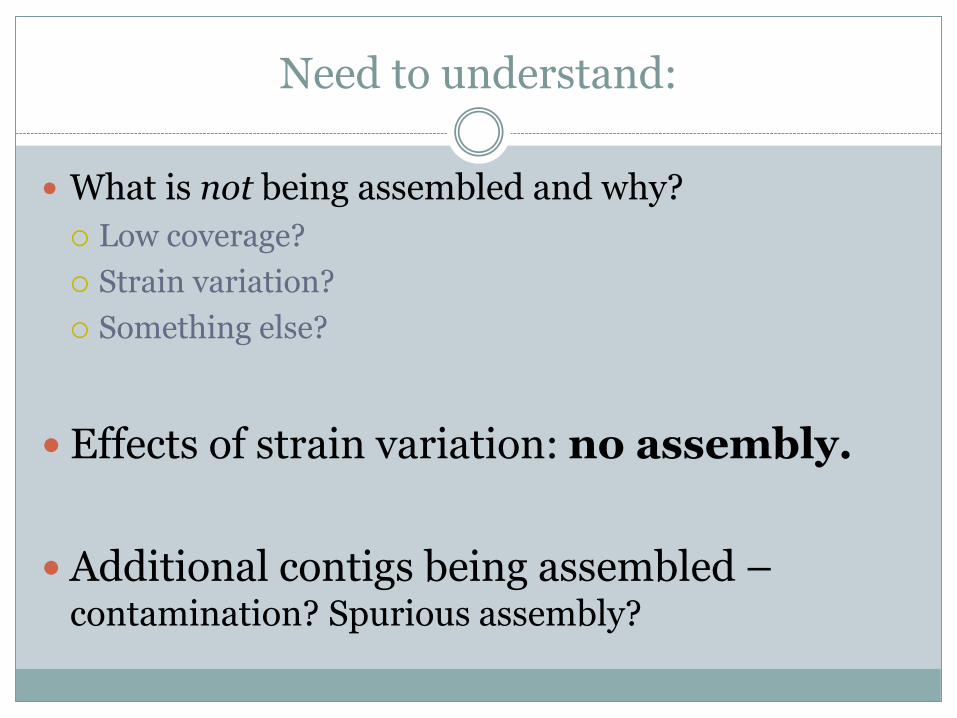
Need to understand:
What is not being assembled and why?
Low coverage?
Strain variation?
Something else?
Effects of strain variation: no assembly.
Additional contigs being assembled –contamination? Spurious assembly?
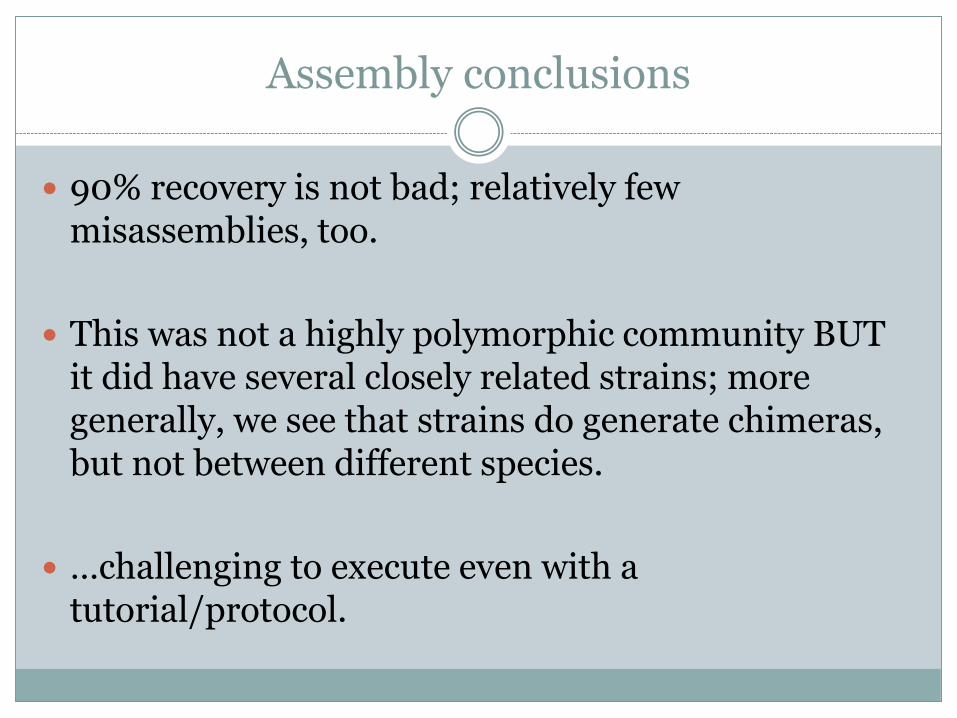
Assembly conclusions
90% recovery is not bad; relatively few misassemblies, too.
This was not a highly polymorphic community BUT it did have several closely related strains; more generally, we see that strains do generate chimeras, but not between different species.
…challenging to execute even with a tutorial/protocol.

We need much deeper sampling!
Sharon et al., 2015 (Genome Res)
Overlap between synthetic long reads and short reads.
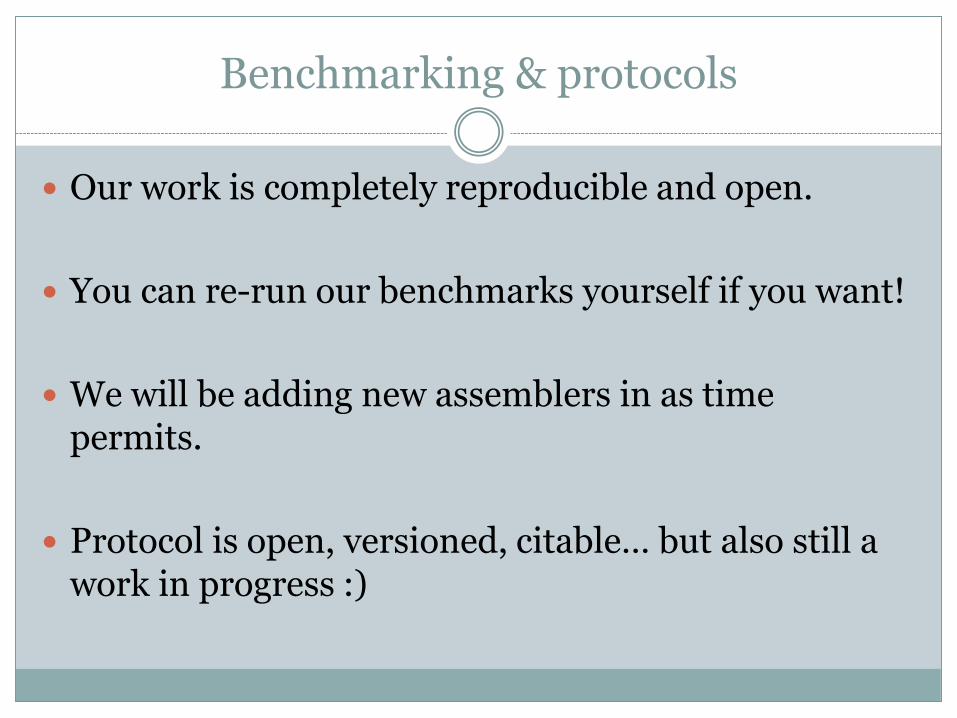
Benchmarking & protocols
Our work is completely reproducible and open.
You can re-run our benchmarks yourself if you want!
We will be adding new assemblers in as time permits.
Protocol is open, versioned, citable… but also still a work in progress :)
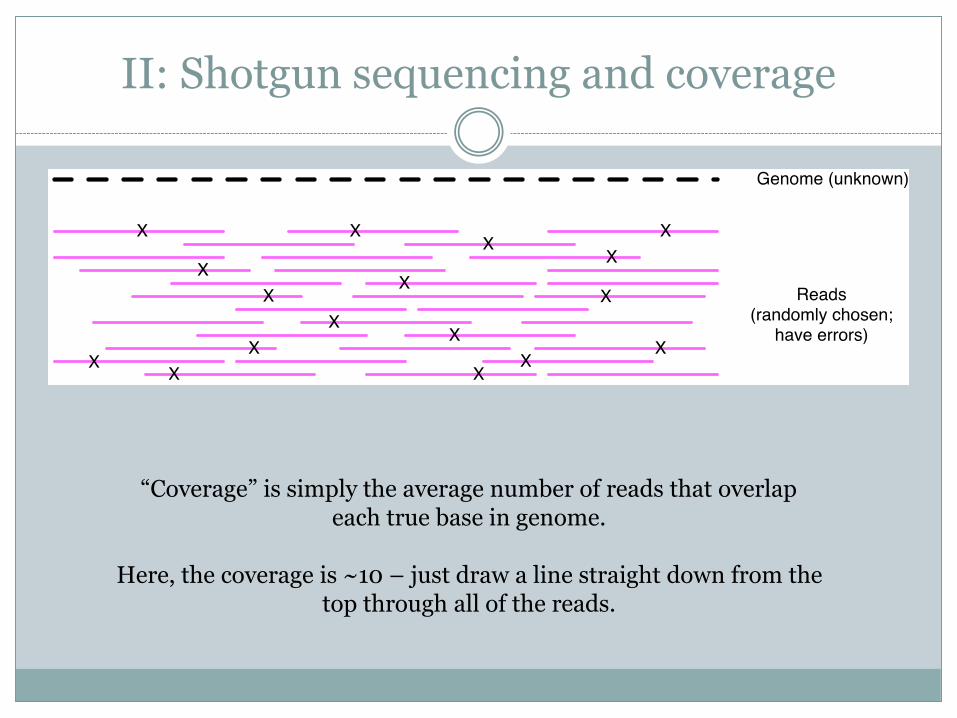
II: Shotgun sequencing and coverage
“Coverage” is simply the average number of reads that overlapeach true base in genome.
Here, the coverage is ~10 – just draw a line straight down from the top through all of the reads.
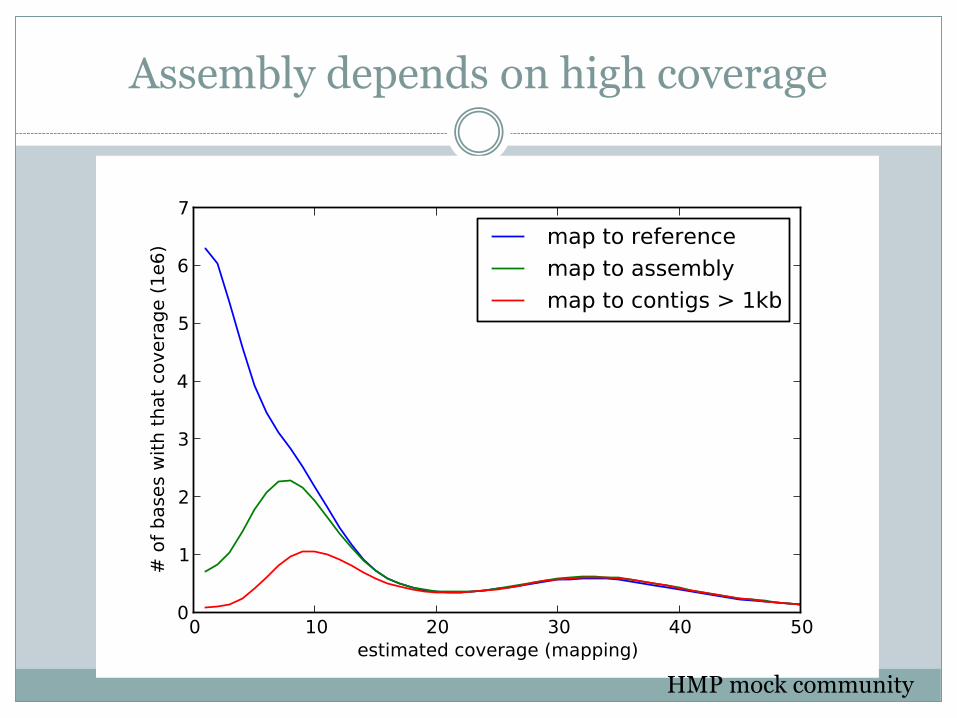
Assembly depends on high coverage
HMP mock community
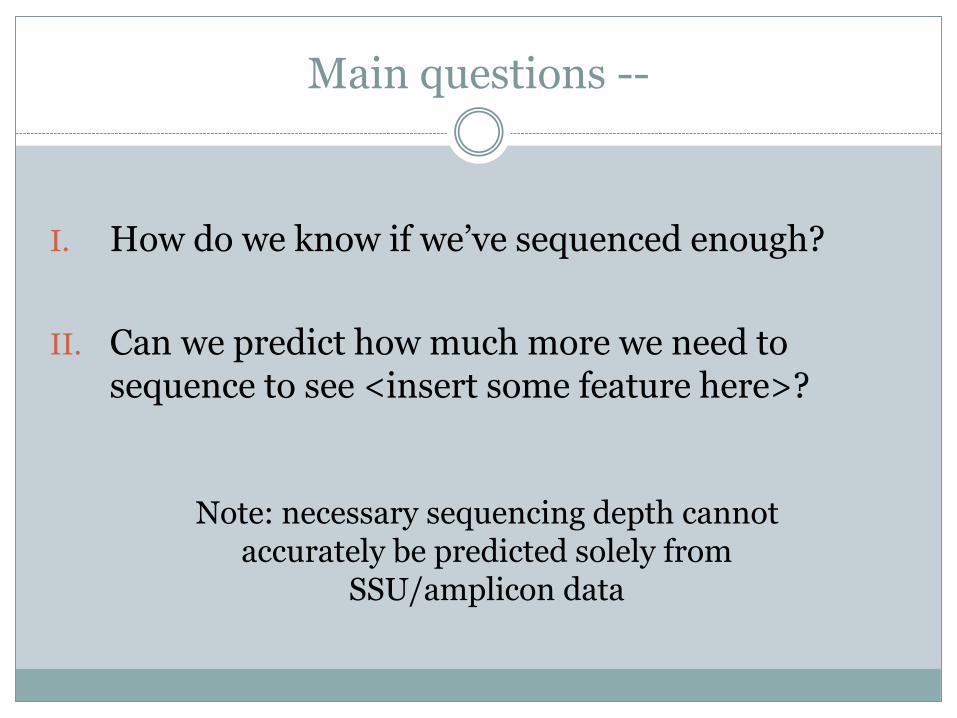
Main questions --
I. How do we know if we’ve sequenced enough?
II. Can we predict how much more we need to sequence to see <insert some feature here>?
Note: necessary sequencing depth cannot accurately be predicted solely from
SSU/amplicon data
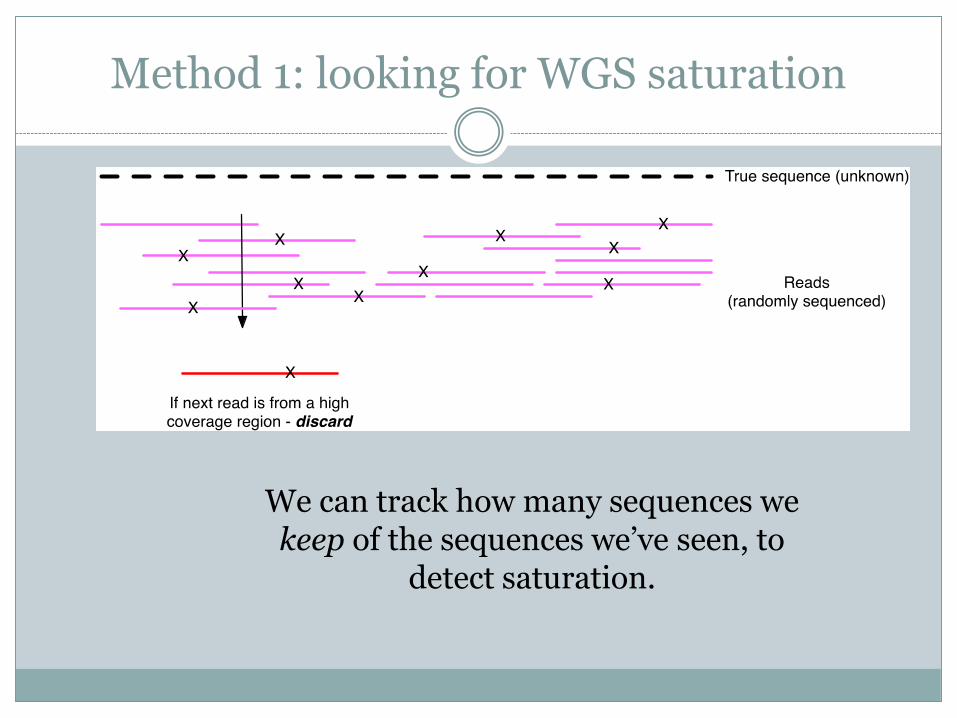
Method 1: looking for WGS saturation
We can track how many sequences we keep of the sequences we’ve seen, to
detect saturation.
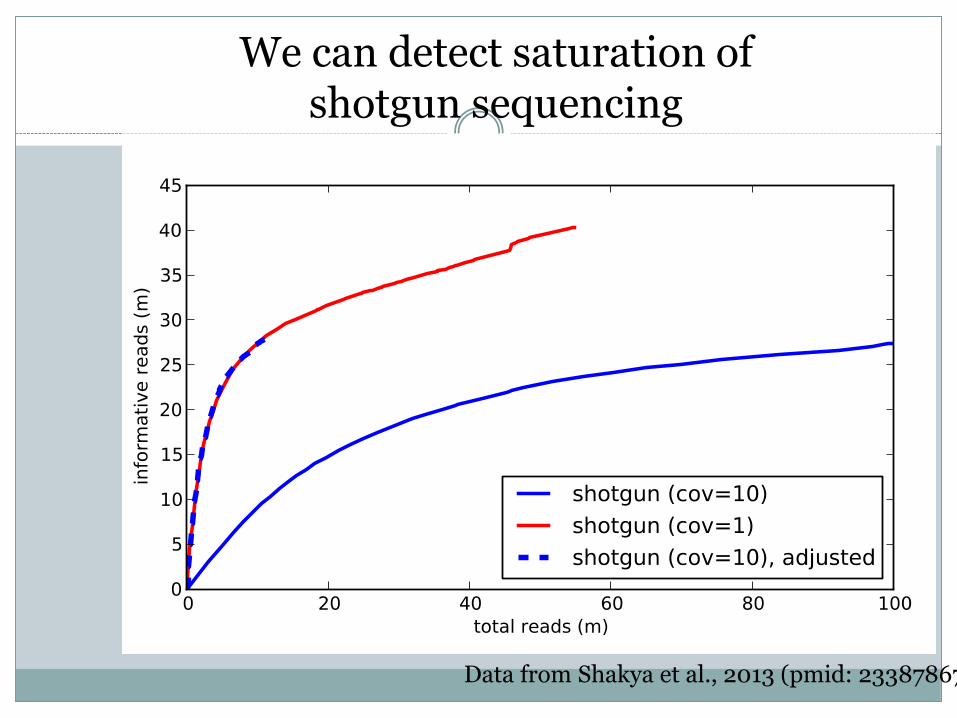
Data from Shakya et al., 2013 (pmid: 23387867)
We can detect saturation of shotgun sequencing
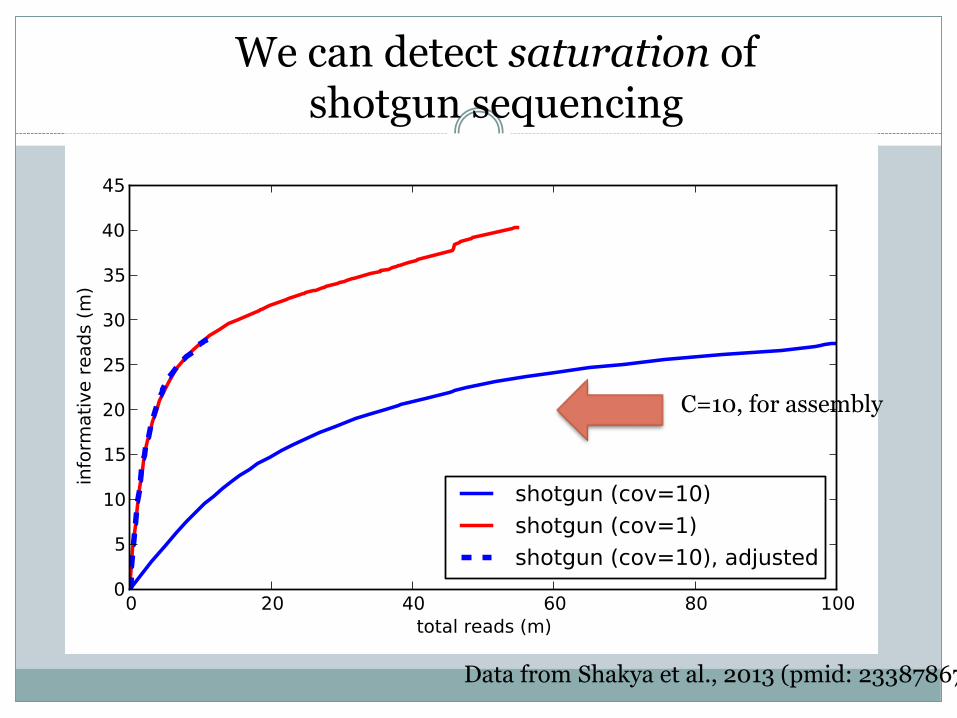
Data from Shakya et al., 2013 (pmid: 23387867)
We can detect saturation of shotgun sequencing
C=10, for assembly
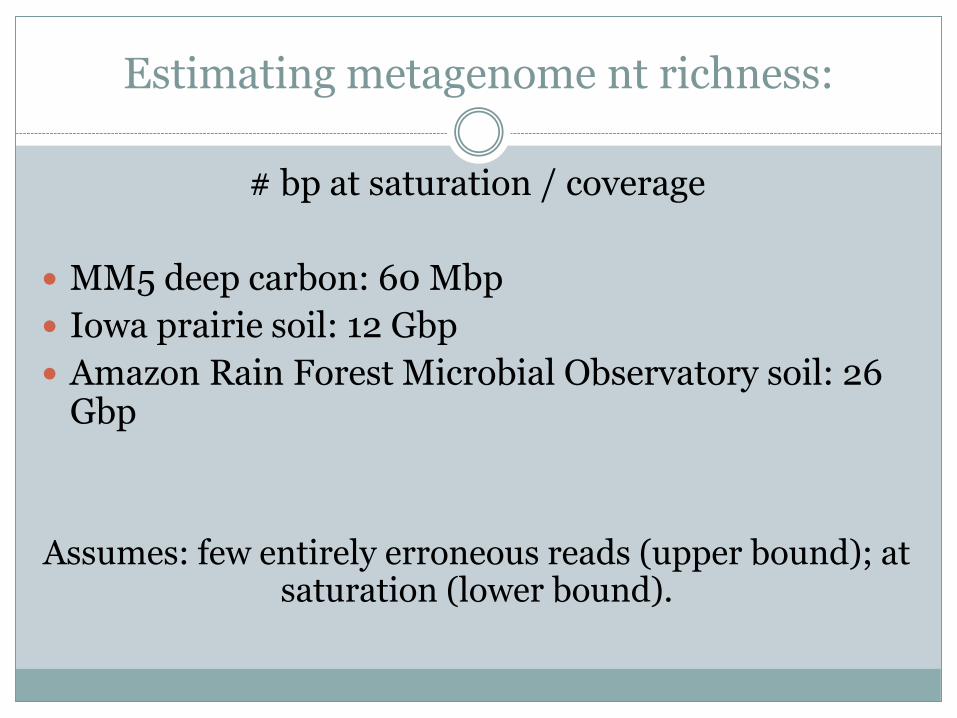
Estimating metagenome nt richness:
# bp at saturation / coverage
MM5 deep carbon: 60 Mbp
Iowa prairie soil: 12 Gbp
Amazon Rain Forest Microbial Observatory soil: 26 Gbp
Assumes: few entirely erroneous reads (upper bound); at saturation (lower bound).
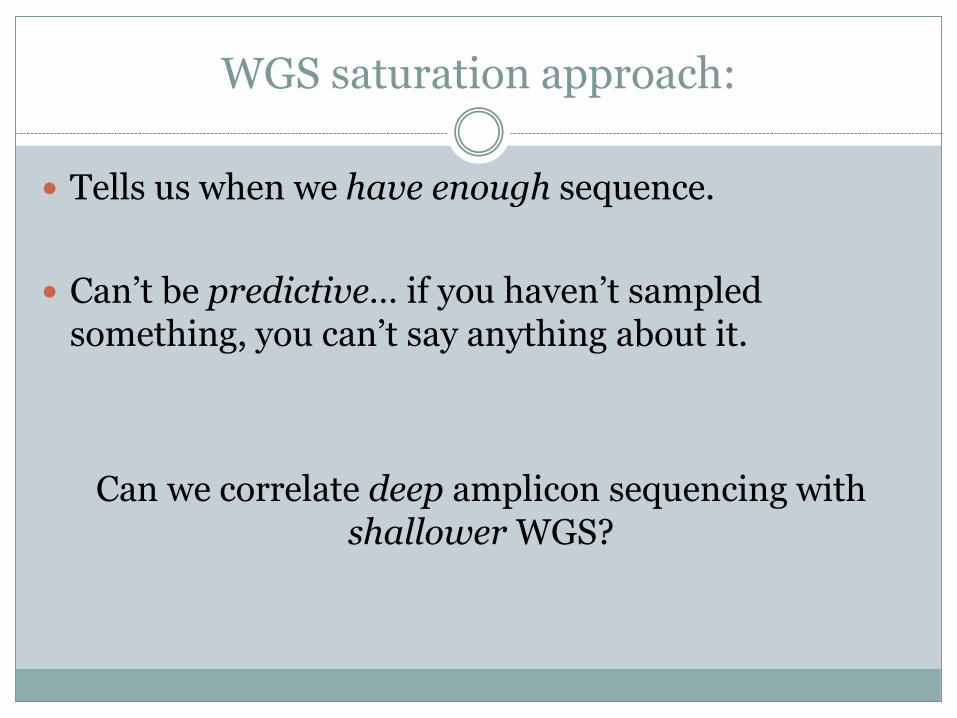
WGS saturation approach:
Tells us when we have enough sequence.
Can’t be predictive… if you haven’t sampled something, you can’t say anything about it.
Can we correlate deep amplicon sequencing with shallower WGS?
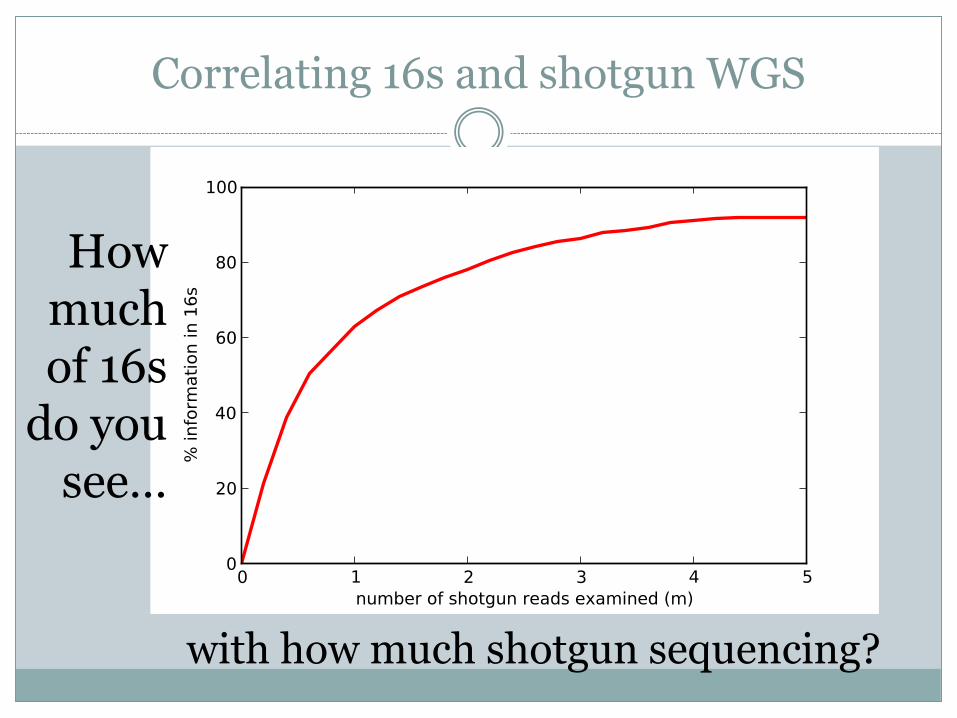
Correlating 16s and shotgun WGS
How much of 16s
do you see…
with how much shotgun sequencing?
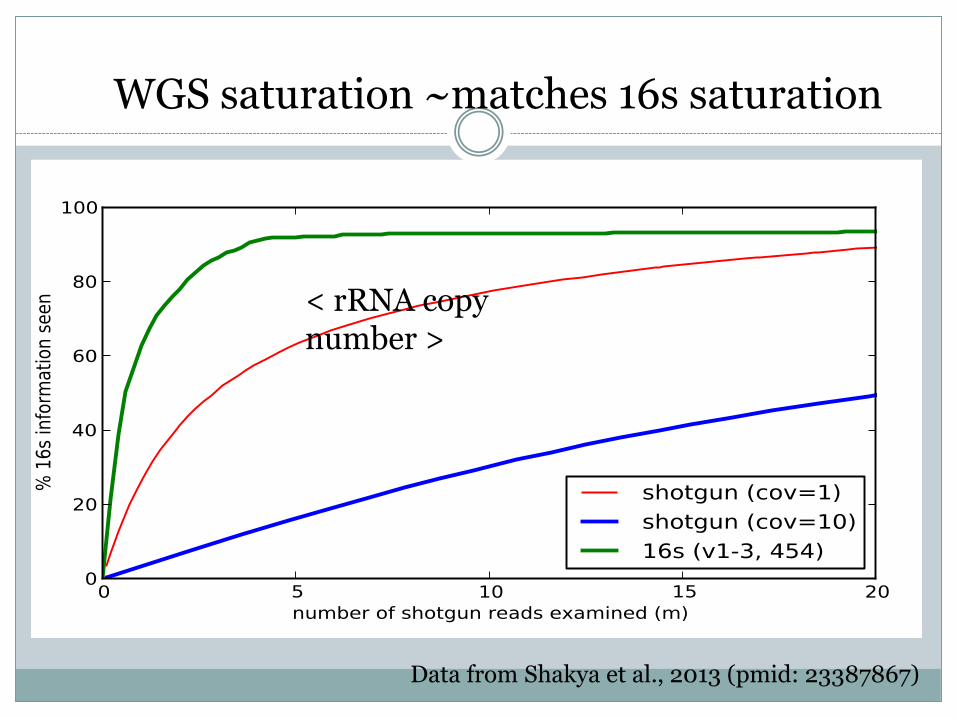
Data from Shakya et al., 2013 (pmid: 23387867)
WGS saturation ~matches 16s saturation
< rRNA copynumber >

Method is robust to organisms unsampled by amplicon sequencing.
Insensitive to amplicon primer bias.
Robust to genome size differences, eukaryotes, phage.
Data from Shakya et al., 2013 (pmid: 23387867)
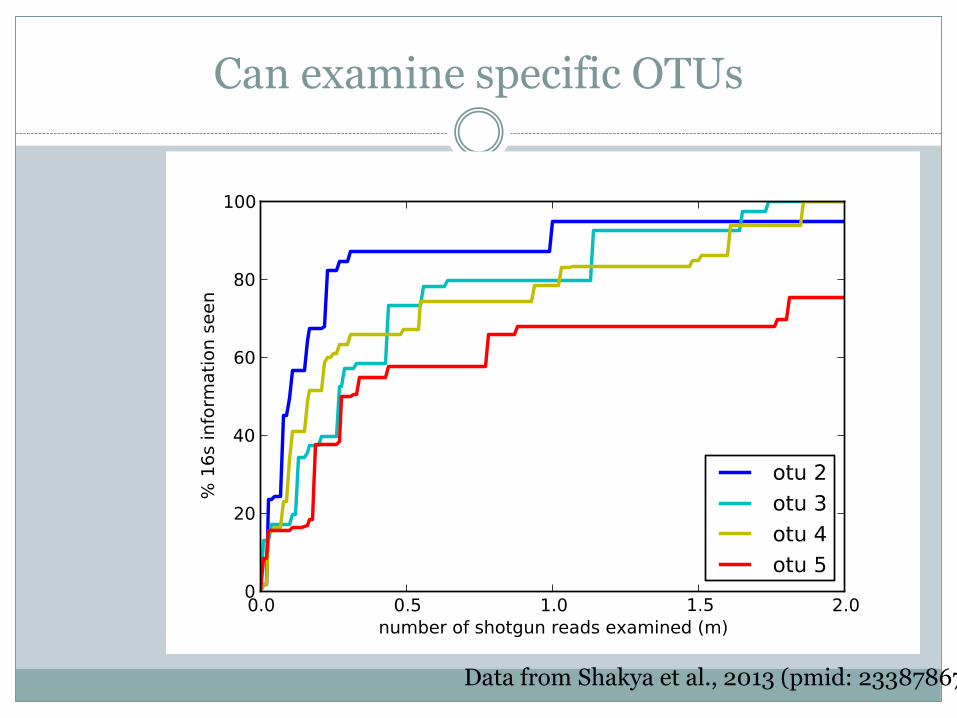
Can examine specific OTUs
Data from Shakya et al., 2013 (pmid: 23387867)
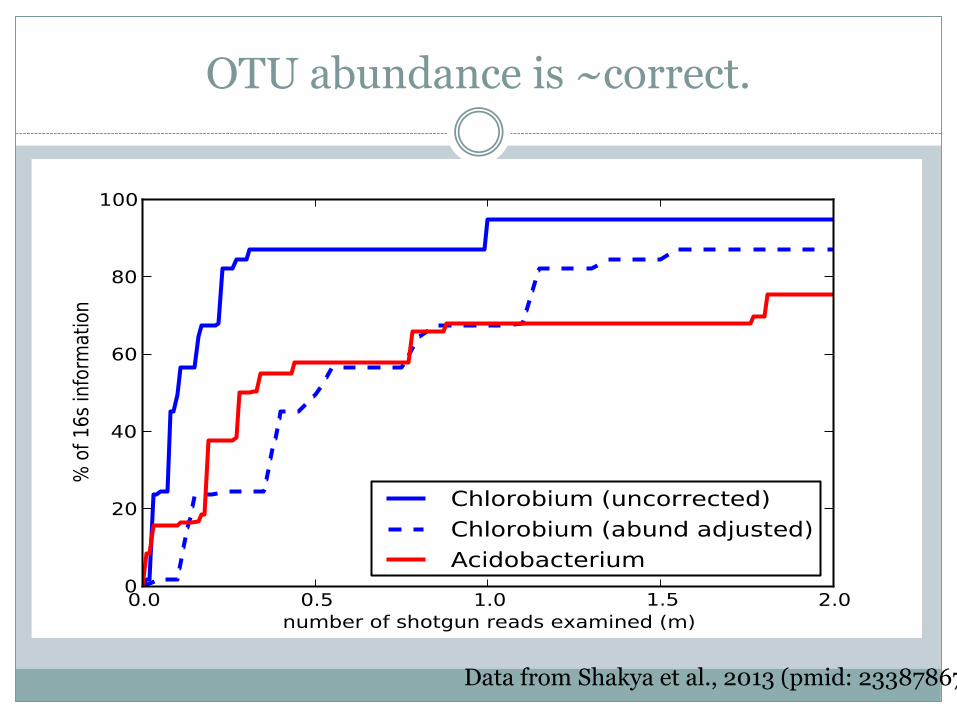
OTU abundance is ~correct.
Data from Shakya et al., 2013 (pmid: 23387867)

Running on real communities --
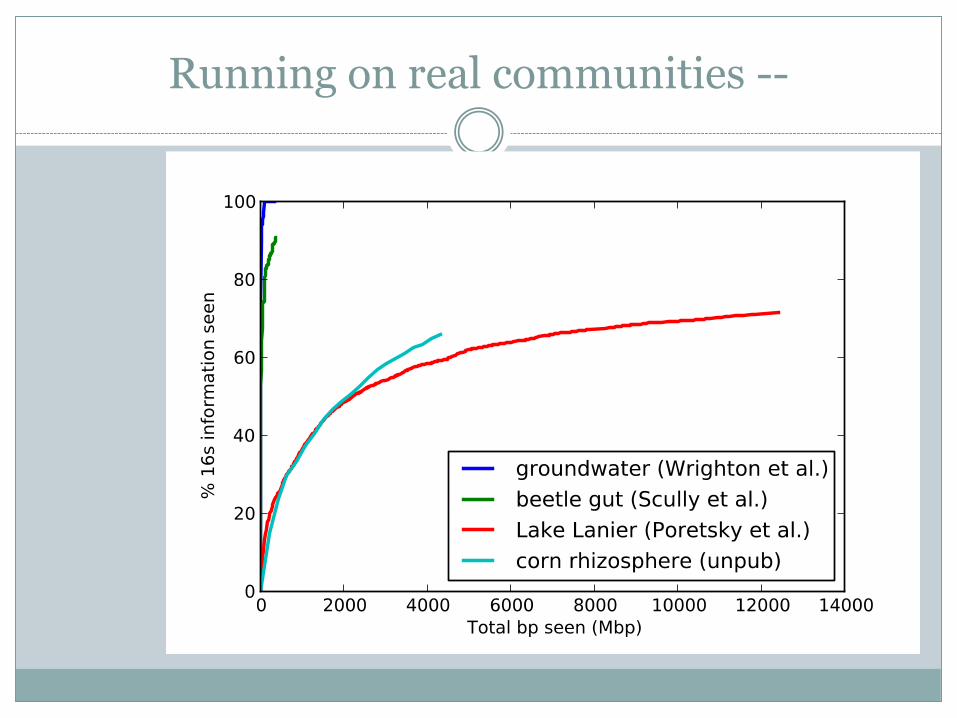
Running on real communities --
Concluding thoughts on metagenomes -
The main obstacle to recovering genomic details of communities is shallow sampling.
Considerably deeper sampling is needed – 1000x (petabasepair sampling)
This will inevitably happen!
…I would like to make sure the compute technology is there, when it does.
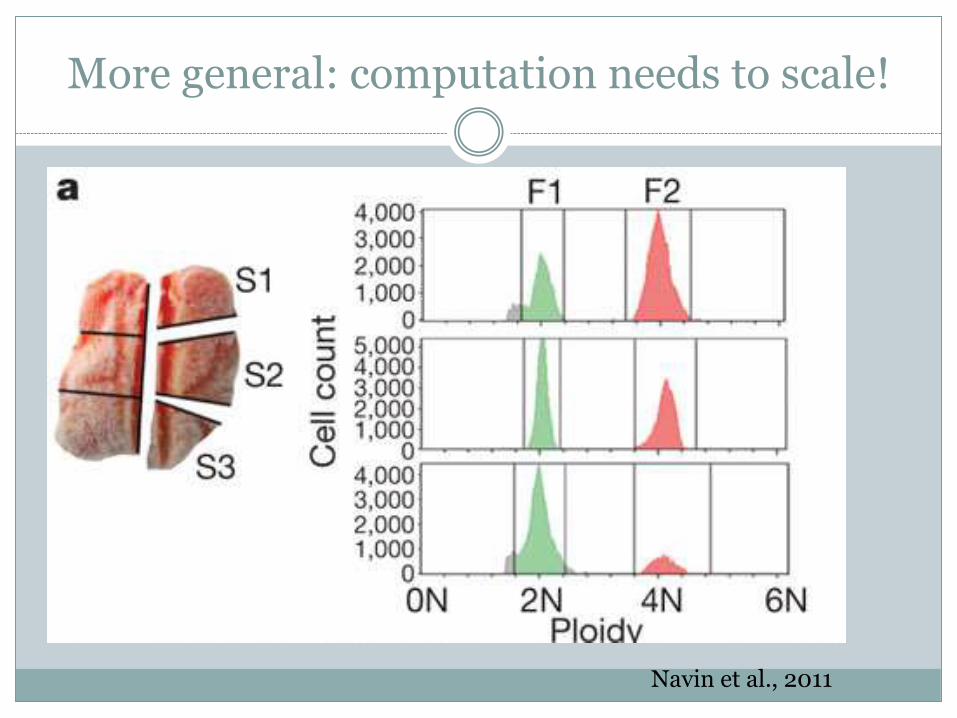
More general: computation needs to scale!
Navin et al., 2011
Cancer investigation ~ metagenome investigation
Some basic math: 1000 single cells from a tumor… …sequenced to 40x haploid coverage with Illumina… …yields 120 Gbp each cell… …or 120 Tbp of data.
HiSeq X10 can do the sequencing in ~3 weeks.
The variant calling will require 2,000 CPU weeks…
…so, given ~2,000 computers, can do this all in one month.
…but this will soon be done ~100s-1000s of times a month.
Similar math applies:
Pathogen detection in blood;
Environmental sequencing;
Sequencing rare DNA from circulating blood.
Two issues:
Volume of data & compute infrastructure;
Latency in turnaround.
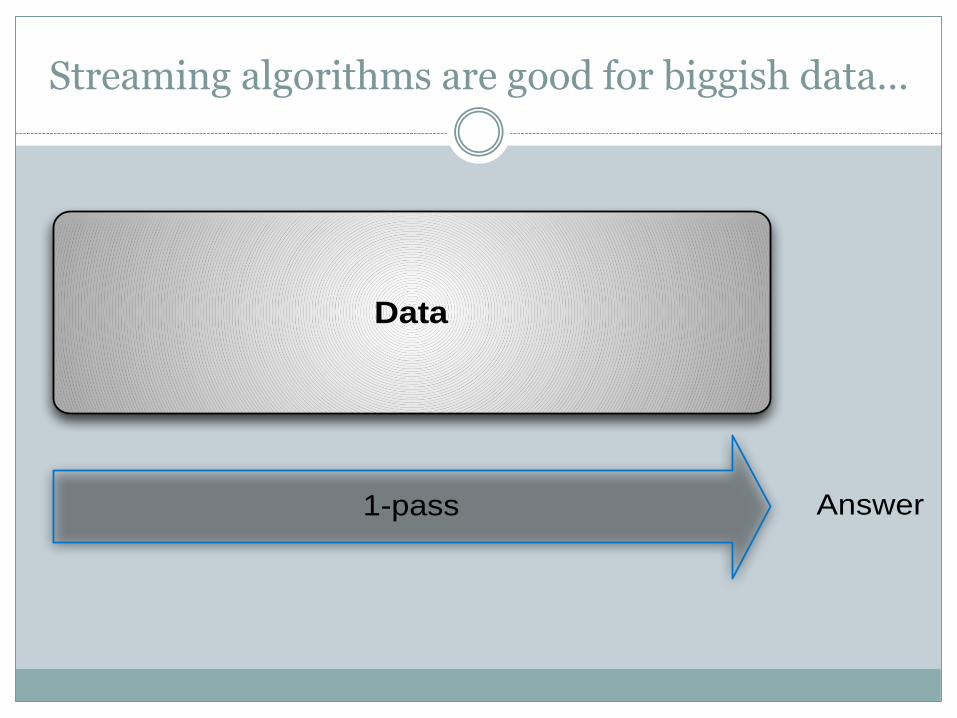
Streaming algorithms are good for biggish data…
1-pass
Data
Answer
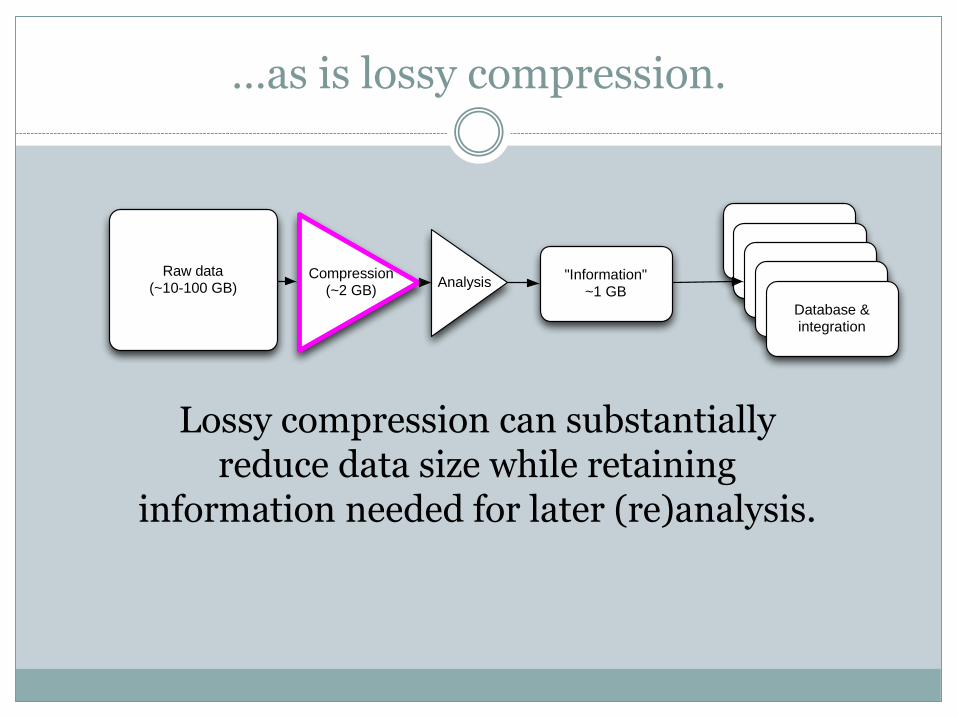
Raw data(~10-100 GB) Analysis
"Information"~1 GB
"Information"
"Information"
"Information"
"Information"Database & integration
Compression (~2 GB)
Lossy compression can substantially reduce data size while retaining
information needed for later (re)analysis.
…as is lossy compression.
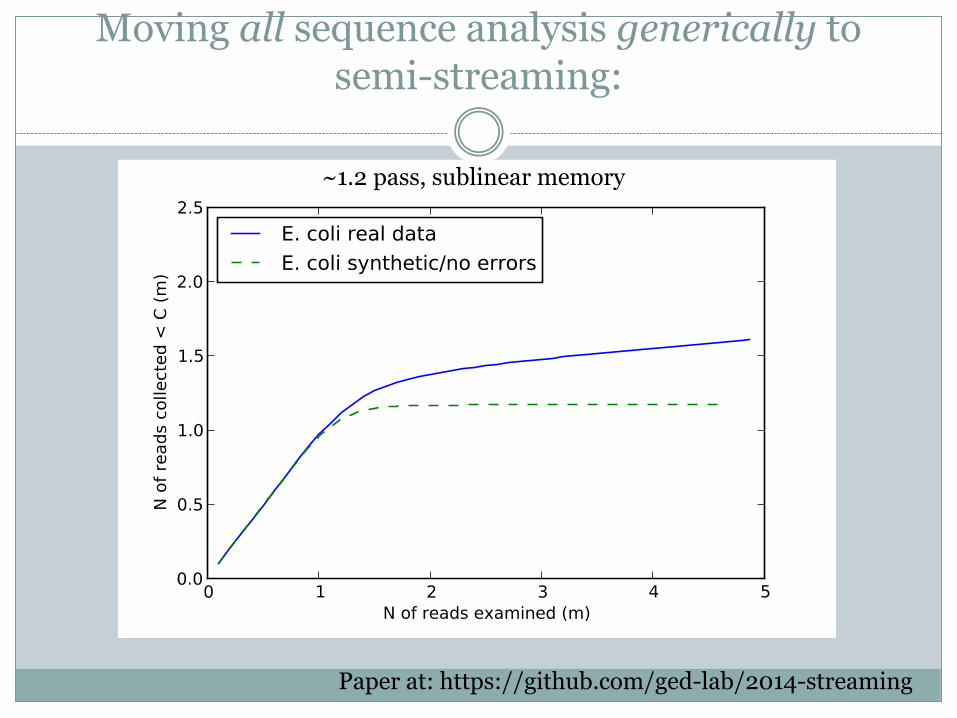
Moving all sequence analysis generically tosemi-streaming:
~1.2 pass, sublinear memory
Paper at: https://github.com/ged-lab/2014-streaming
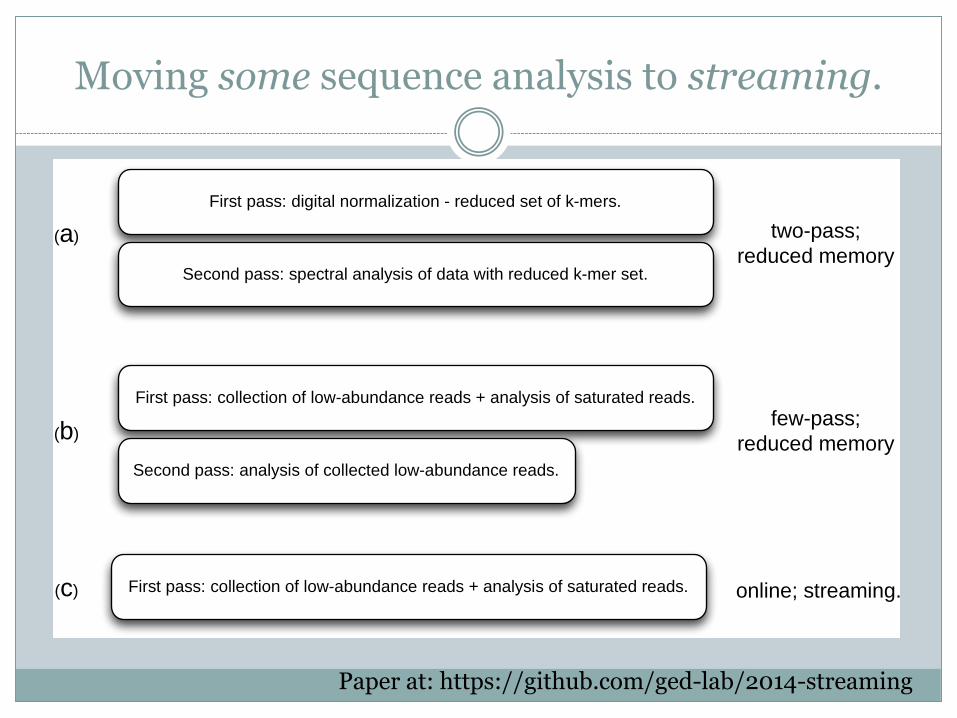
Moving some sequence analysis to streaming.
~1.2 pass, sublinear memory
Paper at: https://github.com/ged-lab/2014-streaming
First pass: digital normalization - reduced set of k-mers.
Second pass: spectral analysis of data with reduced k-mer set.
First pass: collection of low-abundance reads + analysis of saturated reads.
Second pass: analysis of collected low-abundance reads.
First pass: collection of low-abundance reads + analysis of saturated reads.
(a)
(b)
(c)
two-pass;
reduced memory
few-pass;
reduced memory
online; streaming.
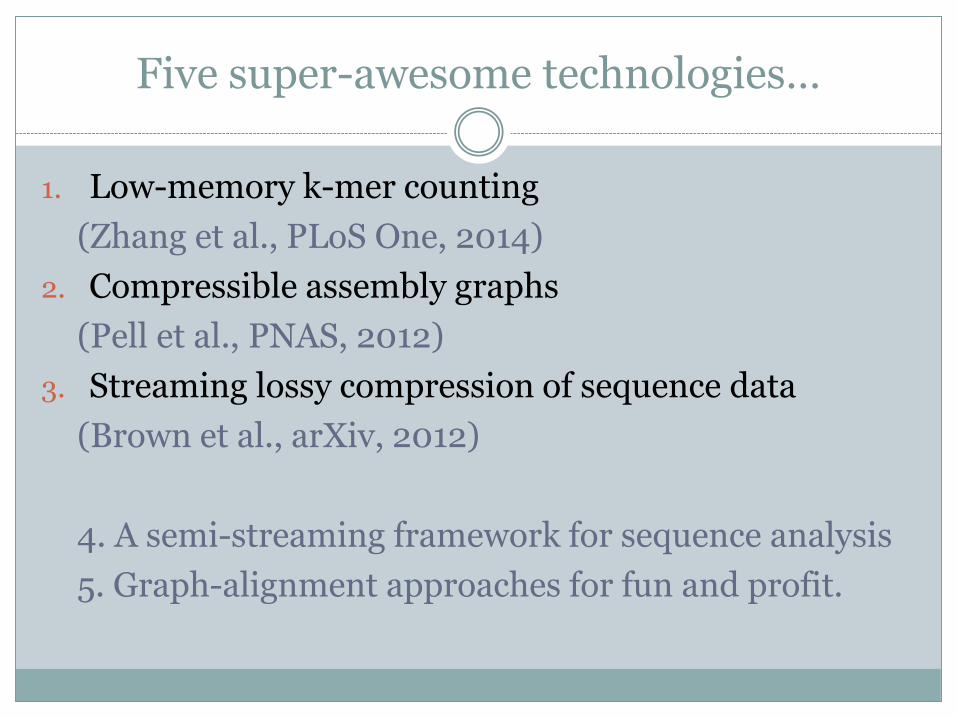
Five super-awesome technologies…
1. Low-memory k-mer counting
(Zhang et al., PLoS One, 2014)
2. Compressible assembly graphs
(Pell et al., PNAS, 2012)
3. Streaming lossy compression of sequence data
(Brown et al., arXiv, 2012)
4. A semi-streaming framework for sequence analysis
5. Graph-alignment approaches for fun and profit.
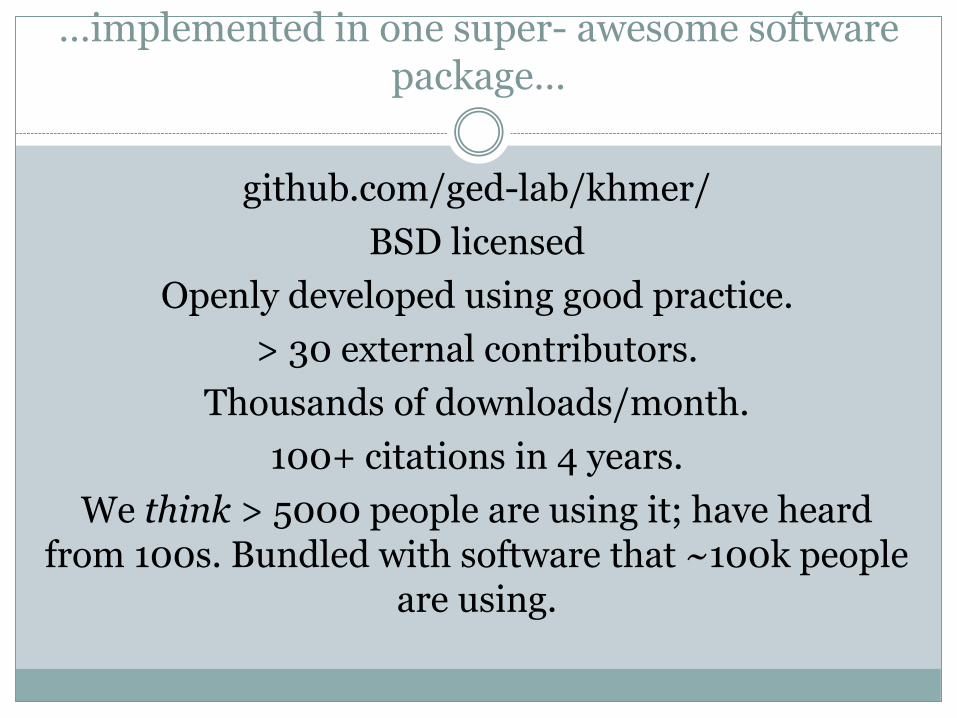
…implemented in one super- awesome software package…
github.com/ged-lab/khmer/
BSD licensed
Openly developed using good practice.
> 30 external contributors.
Thousands of downloads/month.
100+ citations in 4 years.
We think > 5000 people are using it; have heard from 100s. Bundled with software that ~100k people
are using.
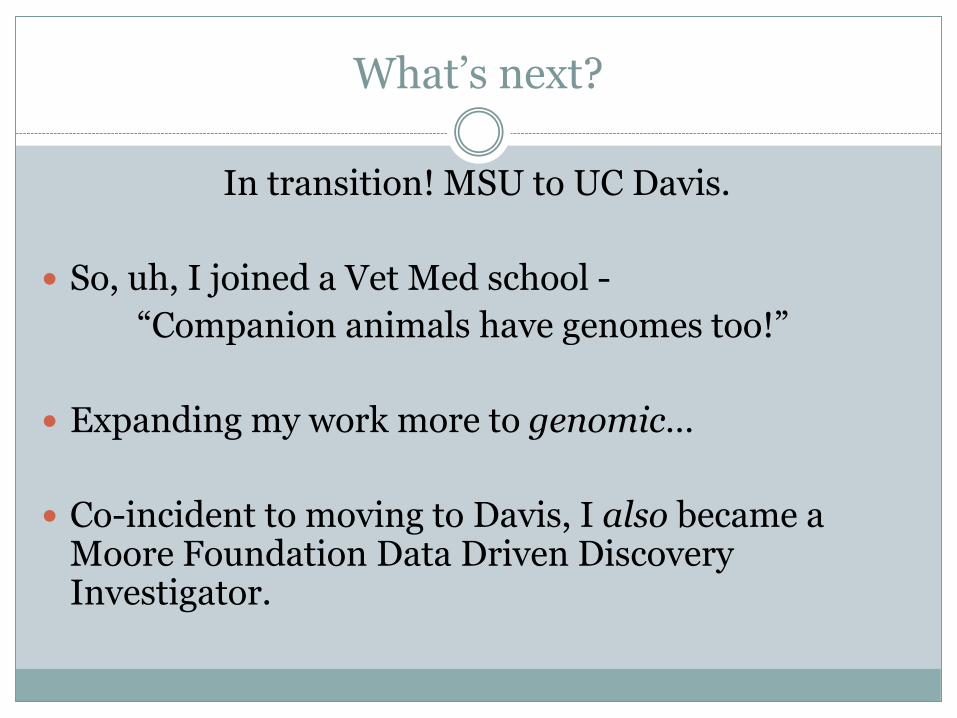
What’s next?
In transition! MSU to UC Davis.
So, uh, I joined a Vet Med school -
“Companion animals have genomes too!”
Expanding my work more to genomic…
Co-incident to moving to Davis, I also became a Moore Foundation Data Driven Discovery Investigator.
Tackling data availability…
In 5-10 years, we will have nigh-infinite data. (Genomic, transcriptomic, proteomic, metabolomic,
…?)
We currently have no good way of querying, exploring, investigating, or mining these data sets,
especially across multiple locations..
Moreover, most data is unavailable until after publication…
…which, in practice, means it will be lost.
…and data integration.
Once you have all the data, what do you do?
"Business as usual simply cannot work."
Looking at millions to billions of genomes.
(David Haussler, 2014)
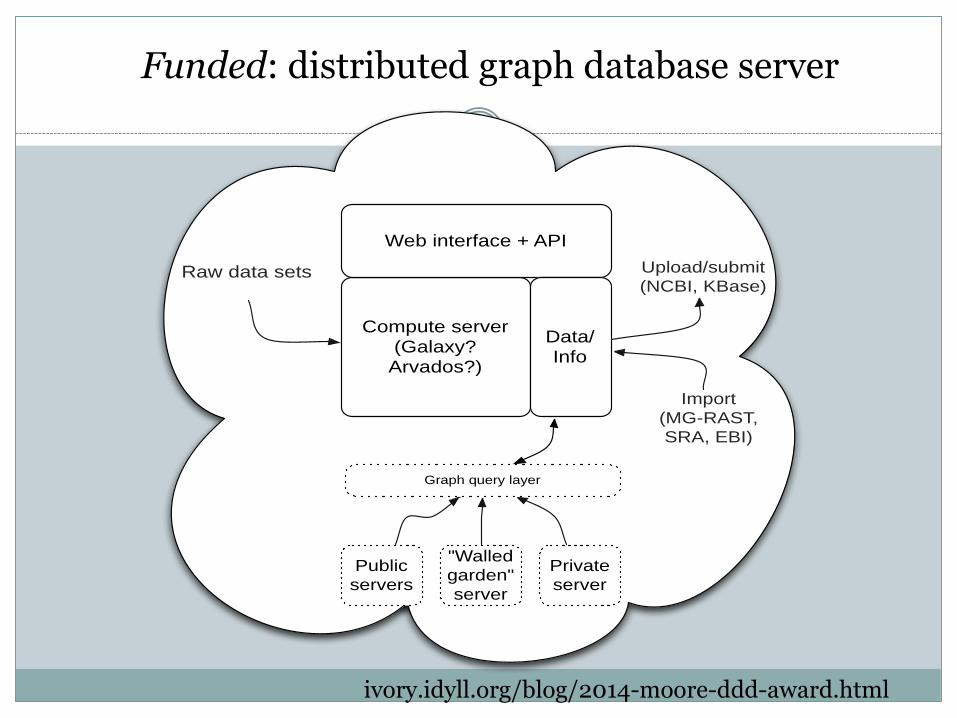
Funded: distributed graph database server
Compute server
(Galaxy?
Arvados?)
Web interface + API
Data/
Info
Raw data sets
Public
servers
"Walled
garden"
server
Private
server
Graph query layer
Upload/submit
(NCBI, KBase)
Import
(MG-RAST,
SRA, EBI)
ivory.idyll.org/blog/2014-moore-ddd-award.html
The larger research vision:100% buzzword compliantTM
Enable and incentivize sharing by providing immediate utility; frictionless sharing.
Permissionless innovation for e.g. new data mining approaches.
Plan for poverty with federated infrastructure built on open & cloud.
Solve people’s current problems, while remaining agile for the future.
ivory.idyll.org/blog/2014-moore-ddd-award.html
Education and training
Biology is underprepared for data-intensive investigation.
We must teach and train the next generations.
~10-20 workshops / year, novice -> masterclass; open materials.
Deeply self-interested:
What problems does everyone have, now? (Assembly)
What problems do leading-edge researchers have? (Data integration)
dib-training.rtfd.org/