2015 report v9 - usa based 3d metal printing and … · survey are used in the preparation of the...
TRANSCRIPT

Wohlers Report 2015
Service Provider Survey Results
July 2015
Copyright © 2015 by Wohlers Associates, Inc. All rights reserved.
Service Provider Survey Results July 2015
COPYRIGHT © 2015 2 WOHLERS ASSOCIATES, INC.
Table of Contents Introduction ..............................................................................................................................................3 Question 1. Primary Business.............................................................................................................4 Question 2. Secondary Business ........................................................................................................6 Question 3. Additive Manufacturing Services ...............................................................................8 Question 4. Direct Part Production................................................................................................ 10 Question 5. Other Services ................................................................................................................ 11 Question 6. Industries Served.......................................................................................................... 12 Question 7. Equipment Used ............................................................................................................ 13 Question 8. AM System Performance ............................................................................................ 16 Selected Comments.............................................................................................................................. 17 Summary.................................................................................................................................................. 22 Acknowledgement ............................................................................................................................... 22

Service Provider Survey Results July 2015
COPYRIGHT © 2015 3 WOHLERS ASSOCIATES, INC.
Introduction Wohlers Associates sends a survey to service providers each year to help identify trends in the additive manufacturing (AM) service industry. The results of the survey are used in the preparation of the annual Wohlers Report. The service provider (SP) survey is relatively short and does not require a large commitment of time. Participation in the survey is voluntary, and participants are not required to answer any questions that they do not feel comfortable answering. Only composite (summary) information is published. Individual companies’ responses are not made available in the report or in any other Wohlers Associates’ publications. If any comments from the surveys are used, they are published anonymously. In exchange for their support, each of the participants receives this report, which summarizes the responses to the survey. None of the companies that respond are identified in this report, and no one outside of Wohlers Associates sees the responses from any individual company. This report is distributed only to those who participate in the survey. The 2015 survey asked for information about the respondents’ experiences in the calendar year 2014. (The 2014 survey was for 2013 calendar year.) The number of respondents continues to increase almost every year. This year, 87 service providers in 23 countries participated, with 38 from the U.S., eight from Germany, five from Canada, four from Australia, three each from China, France, India, and Italy, two each from Belgium, England, Netherlands, Spain, and Turkey, and one each from Austria, Brazil, Denmark, Ireland, Japan, Portugal, South Africa, Sweden, Switzerland, and Thailand.
Source: Wohlers Associates, Inc.

Service Provider Survey Results July 2015
COPYRIGHT © 2015 4 WOHLERS ASSOCIATES, INC.
The survey included eight questions. The following pages summarize the responses to each of the questions. Question 1. Primary Business In 2014, what was the percentage growth (or decline) in revenues at your company from producing parts and patterns on your additive manufacturing (AM) systems? For 2014, 89% of service providers indicated growth in revenues in their primary AM business. (The “primary business” consists of revenues from producing parts on AM systems.) This follows primary revenue growth of 86% in 2013, 93% in 2012, 91% in 2011, and 83% in 2010. As shown in the following chart, more than 80% of respondents have reported growth in each of the past five years. This data indicates stability and vitality of the AM service industry.
Source: Wohlers Associates, Inc. As shown in the following chart, the mean (average) growth rate in primary AM revenues rose to 33% in 2014. This increase follows two years of slight declines of 20% in 2013 and 22% in 2012. The median growth rate in the primary AM business has been identical for the past three years at 15%. In the years 2010 and 2011, the service industry experienced strong growth in mean and median rates. The 33% average growth rate in the past year is impressive, and correlates closely with the 35.2% growth rate of the entire AM industry in 2014. The extremely consistent median value over the past three years is an indicator of stability in the service provider segment.

Service Provider Survey Results July 2015
COPYRIGHT © 2015 5 WOHLERS ASSOCIATES, INC.
Source: Wohlers Associates, Inc. The next chart details the growth rate distribution of the primary business revenue among survey respondents. Interestingly, 12% of service providers experienced growth rates greater than 100%. Conversely, the percentage of service providers that experienced growth rates in the three ranges between 0% and 60% declined slightly from 81% to 73%. Only 10% of respondents experienced a decline in primary revenue growth in 2014.
Source: Wohlers Associates, Inc.

Service Provider Survey Results July 2015
COPYRIGHT © 2015 6 WOHLERS ASSOCIATES, INC.
Overall, the responses to this question indicate stability for primary revenues in the service provider sector. The industry is enjoying ongoing, steady growth. Question 2. Secondary Business In 2014, what was the percentage growth (or decline) in revenues at your company from secondary work? “Secondary” includes tooling produced from AM patterns, tooling components produced directly using AM, and molded parts and castings from this tooling. The percentage of service provider companies with revenue growth in the secondary business tends to mirror the percentage of service provider companies with revenue growth in the primary business. The following chart demonstrates this correlation. For the fifth consecutive year, more than 90% of respondents reported growth in secondary business revenues.
Source: Wohlers Associates, Inc. The mean growth rate in revenues for secondary services rose to 21% in 2014, following a rise of 14% in 2013. The average growth rate was 10% in 2012, 25% in 2011, and 27% in 2010, as shown in the following chart. The median growth rate for 2014 dropped to 7% in 2014, after rising to 10% in 2013 and dropping to 5% in 2012. The median growth rate was 12% in 2011 and 11% in 2010.

Service Provider Survey Results July 2015
COPYRIGHT © 2015 7 WOHLERS ASSOCIATES, INC.
Source: Wohlers Associates, Inc. These fluctuations in mean and median growth in secondary revenues reflect more volatility in the secondary market compared to the primary market. The drops in 2007–2009 correlate closely to the global recession and the overall decline in the AM industry. The declines in 2012 and the divergence of average and median growth in 2014, however, are more difficult to interpret. The steep declines from the 2012 survey may be a slight statistical anomaly. The 2014 decline in median growth may also be insignificant, since 94% of survey respondents reported growth. Overall, the data continues to indicate that the secondary business in the service provider industry is strong. The following detailed chart shows the distribution of growth rates from secondary services. In 2014, growth in secondary services again paralleled the growth in primary services. For the second straight year, 69% of survey respondents reported growth between 0% and 20%. The number of respondents reporting declines remained very low. Only 6% of respondents reported negative growth in 2014, following 5% in 2013, 6% in 2012, and 7% in 2011. Overall, the responses to this question indicate stability for secondary revenues in the service provider sector. However, they also indicate that the secondary market segment is slightly more volatile and unsettled than the primary market. The wide variety of secondary services may be the reason for this volatility.

Service Provider Survey Results July 2015
COPYRIGHT © 2015 8 WOHLERS ASSOCIATES, INC.
Source: Wohlers Associates, Inc. Question 3. Additive Manufacturing Services How do your customers use the AM parts that you provide? Please provide a percentage for each of the nine categories listed below. If you do not have hard data, estimate these percentages. Please do not create new categories. The way that customers use the parts they purchase from service providers, and if that use changes over time, is relevant to the AM industry. The following chart shows the average responses for eight application categories. The format for this question was changed in the 2013 survey (based on results from the 2012 calendar year). Previously, functional models and direct part production were treated separately. Starting with the 2013 survey, the two were combined into a single category named “functional parts.” This change in the collected data necessitated the creation of a new chart.

Service Provider Survey Results July 2015
COPYRIGHT © 2015 9 WOHLERS ASSOCIATES, INC.
Source: Wohlers Associates, Inc. As indicated in the chart, fit and assembly prototypes and functional parts (which includes functional prototypes) continue to be the primary applications for AM parts. The percentages for all categories have remained fairly consistent over the past several years. The following chart was taken from the 2012 survey and is provided for reference and continuity. The category “Education/research” was added in 2010, so no data is available for previous years. Since other categories have changed over the history of the report, results are shown for the years 2007–2011 of the survey only.
Source: Wohlers Associates, Inc.

Service Provider Survey Results July 2015
COPYRIGHT © 2015 10 WOHLERS ASSOCIATES, INC.
Question 4. Direct Part Production Companies are using AM increasingly for the production of parts that go into final products. What percentage did this segment of your business grow in 2014? The following chart indicates that service providers have continued to experience growth in direct part production. For 2014, average growth in direct part production was 20.9%, following growth of 19.9% in 2013 and 16.9% in 2012.
Source: Wohlers Associates, Inc. In previous surveys, we also asked survey respondents to estimate growth in direct part production in five and 10 years, respectively. We concluded that the results for this part of the question were statistically inconclusive, in part due to the difficulty in estimating growth with the effect of compounding rates. We eliminated this portion of Question 4 in the 2014 survey, which surveyed the performance of the service provider segment for the 2013 calendar year. Direct part production requires an elevated level of process control, repeatability, and quality assurance. In the 2013 service provider survey report (based on results from the 2012 calendar year), we stated our belief that a select number of service providers would develop this application as opportunities arise. We anticipated that a relatively small number of service providers would move aggressively into direct part production and work as contract manufacturers to develop reliable production processes. We believe this scenario is occurring in the service provider segment, although consolidation continues to skew the survey data somewhat. We anticipate this application category will continue to grow, if only from the simple fact that the ratio of production parts to prototypes is typically 1,000:1 or greater. In

Service Provider Survey Results July 2015
COPYRIGHT © 2015 11 WOHLERS ASSOCIATES, INC.
other words, for every 1,000 end-use parts manufactured, only one prototype is produced, although this ratio varies widely amongst products, companies, and industries. We continue to assert that the opportunity for more commercial production activity from AM over the coming years is immense. Question 5. Other Services Do you provide other services in-house? If so, please indicate which of the following services you provide (in-house) by answering Yes or No. Service providers offer many services in addition to parts built on additive manufacturing systems. This mix of “other” services changes from year to year, and this information is important to the SP segment. The following chart tracks the categories of these other services over the past 11 years. This year’s survey results were fairly consistent with trends from prior years, although most categories declined slightly from 2013 levels—particularly urethane castings. This data point is at odds with comments from some SPs who reported that demand for urethane castings had actually increased in 2014. Note that the “CNC Machining” category was added for 2011, so no data is available for previous years for this category.
Source: Wohlers Associates, Inc.

Service Provider Survey Results July 2015
COPYRIGHT © 2015 12 WOHLERS ASSOCIATES, INC.
Somewhat surprisingly, 3D scanning and reverse engineering dropped from 61% in 2013 to 53% in 2014. Only 27% of survey respondents offered injection molding in 2014, the fourth consecutive year this percentage has dropped. Service providers offering injection mold tooling remained at 35% in 2014. Service providers offering metal casting dropped slightly, from 16% in 2013 to 15% in 2014. These year-to-year changes may be partly due to the changing population of service providers responding to the survey, rather than service providers actually dropping these services from one year to the next. Question 6. Industries Served Please indicate which industries you serve and the approximate percentage of your revenue from each. Please use the provided categories and do not create new ones. The following chart shows the industries served over the past 11 years. In the 2014 survey, the aerospace category jumped to 14.6% after averaging about 10% over the previous four years. Motor vehicles and consumer products/electronics are the two most served industries. These two industries each represent 19.8% of the total for 2014. The medical and dental industry declined for the second consecutive year. A category for the oil and gas industry was added in 2011, but dropped from the 2012 survey and folded back into the “Other” category.

Service Provider Survey Results July 2015
COPYRIGHT © 2015 13 WOHLERS ASSOCIATES, INC.
Source: Wohlers Associates, Inc. Question 7. Equipment Used Please indicate the AM equipment you have in-house, grouped by the manufacturer and technology, so that we can estimate the growth in capacity. Indicate the machines that were added last year and the total number of machines you had in-house at the end of the year. AM equipment manufactured by 3D Systems was the most commonly installed equipment at the service providers that responded to the survey. Of the 1,067 cumulative systems installed, 383 (36%) were from 3D Systems. This percentage is down from 45% in 2013 and 2012. This total includes 245 vat photopolymerization (stereolithography), 53 plastic powder bed fusion (laser sintering), 41 binder jetting systems, and 35 material jetting (multi-jet modeling) systems. Respondents indicated that 309 system installations (29%) were from Stratasys, down from 33% in 2013. In that group, 249 are FDM material extrusion systems and 60 are PolyJet material jetting systems. EOS GmbH manufactured 228 (21%) of the systems, up from 18% in 2013. This total is comprised of 148 EOS P polymer machines and 80 EOS M metal machines.

Service Provider Survey Results July 2015
COPYRIGHT © 2015 14 WOHLERS ASSOCIATES, INC.
The “Other” category includes in-house/proprietary machines, as well as a small number of machines from Arcam, Aspect, Concept Laser, DM3D, Envisiontec, ExOne, Mcor, SLM Solutions, Solidscape, Voxeljet, and Xi’an Bright Laser Technologies.
Source: Wohlers Associates, Inc. The following chart shows the equipment added to survey respondents’ operations in 2014. The systems most frequently added were from EOS, 3D Systems, and Stratasys. Of the 206 systems added, 69 were from EOS, 54 were from 3D Systems, and 46 were from Stratasys. In 2013, respondents added 36 EOS, 60 3D Systems, and 55 Stratasys machines. A total of 36 EOS P polymer systems were added, compared to only two 3D Systems polymer powder bed fusion systems. The “Other” category includes systems from Concept Laser, Solidscape, 3D Systems’ powder bed fusion and material jetting systems, Xi’an Bright Laser Technologies, in-house/proprietary systems, and a small quantity of other equipment.

Service Provider Survey Results July 2015
COPYRIGHT © 2015 15 WOHLERS ASSOCIATES, INC.
Source: Wohlers Associates, Inc. The following chart tracks the percentage of respondents that added equipment over the past 10 years. In 2014, 60 of the 87 survey respondents (69%) added equipment. In 2013, 56 of the 82 survey respondents (68%) added equipment, purchasing a total of 194 systems. In 2009, only 22% of survey respondents added equipment. This percentage has risen steadily over the past five years. This trend reflects the confidence and optimism of service providers in the growth and stability of their businesses.
Source: Wohlers Associates, Inc.

Service Provider Survey Results July 2015
COPYRIGHT © 2015 16 WOHLERS ASSOCIATES, INC.
Question 8. AM System Performance 8a. Which AM technology is making your company the most money? Question 8 was modified for the survey that was sent in 2014. Previously, this question had three parts. The first part asked which system is making the most money, and the second part asked which technology was making the most money. We felt this was redundant, so we simplified the question. For the past two surveys, we have only asked which technology is making the most money. As has been the case for many years, 3D Systems’ stereolithography (SL) systems continue to make the most money for survey respondents. Nearly one-third (31.0%) reported SL made the most money in 2014. Polymer powder bed fusion from EOS ranked second at 19.0%. (We did not separate EOS P systems from EOS M systems in previous surveys.) Material extrusion (FDM) from Stratasys was third at 15.5%, followed by the metal powder bed fusion technology from EOS (9.5%). 3D Systems’ laser sintering technology made the most money for only 2.4% of respondents in 2014, down from 7.7% in 2013. The “Other” category is comprised of in-house/proprietary systems, binder jetting systems from ExOne and Voxeljet, and metal powder bed fusion technologies.
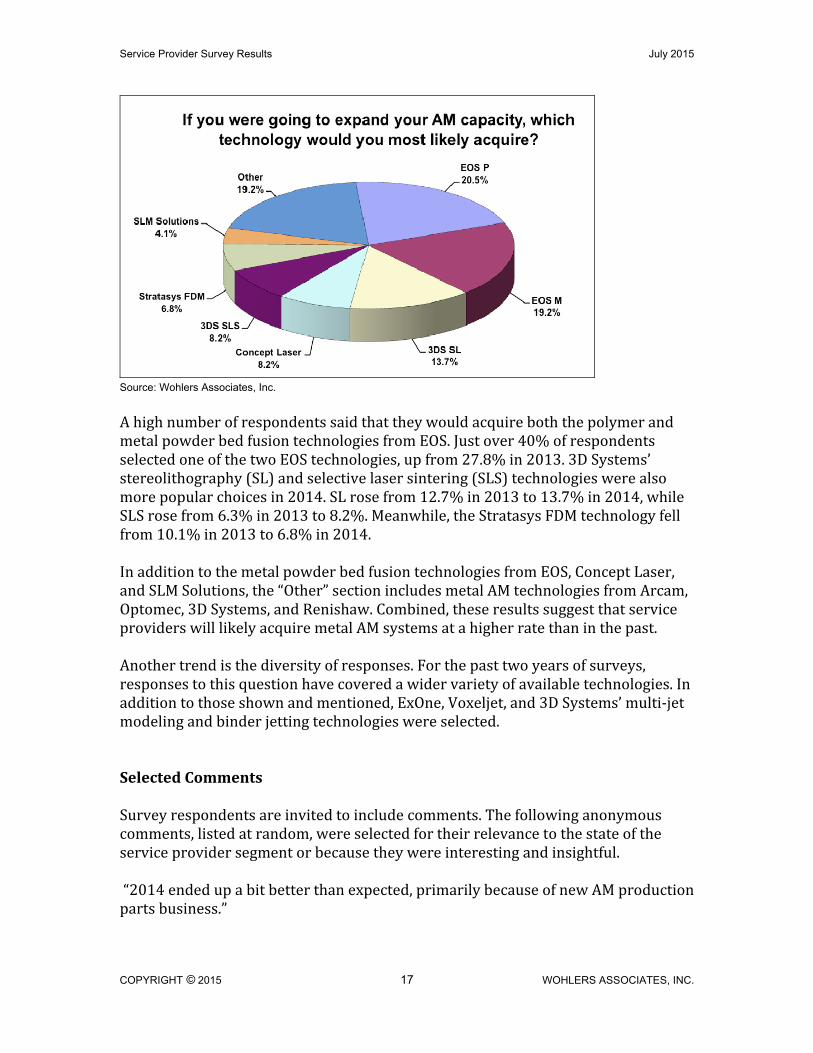
Source: Wohlers Associates, Inc. 8b. If you were going to expand your AM capacity, which technology would you most likely acquire? This question reveals which technologies the respondents see as most promising for the future of their businesses. The following chart shows the results.
Service Provider Survey Results July 2015
COPYRIGHT © 2015 17 WOHLERS ASSOCIATES, INC.
Source: Wohlers Associates, Inc. A high number of respondents said that they would acquire both the polymer and metal powder bed fusion technologies from EOS. Just over 40% of respondents selected one of the two EOS technologies, up from 27.8% in 2013. 3D Systems’ stereolithography (SL) and selective laser sintering (SLS) technologies were also more popular choices in 2014. SL rose from 12.7% in 2013 to 13.7% in 2014, while SLS rose from 6.3% in 2013 to 8.2%. Meanwhile, the Stratasys FDM technology fell from 10.1% in 2013 to 6.8% in 2014. In addition to the metal powder bed fusion technologies from EOS, Concept Laser, and SLM Solutions, the “Other” section includes metal AM technologies from Arcam, Optomec, 3D Systems, and Renishaw. Combined, these results suggest that service providers will likely acquire metal AM systems at a higher rate than in the past. Another trend is the diversity of responses. For the past two years of surveys, responses to this question have covered a wider variety of available technologies. In addition to those shown and mentioned, ExOne, Voxeljet, and 3D Systems’ multi-jet modeling and binder jetting technologies were selected. Selected Comments Survey respondents are invited to include comments. The following anonymous comments, listed at random, were selected for their relevance to the state of the service provider segment or because they were interesting and insightful. “2014 ended up a bit better than expected, primarily because of new AM production parts business.”

Service Provider Survey Results July 2015
COPYRIGHT © 2015 18 WOHLERS ASSOCIATES, INC.
“Production opportunities are becoming very common and were the reason for adding two machines in 2014. We have multiple opportunities right now that would require us to purchase multiple machines. I believe this trend is going to continue and is ultimately our business plan—more production and less prototyping.” “While coming from a low basis, the number of AM parts we produced for direct manufacture applications increased exponentially, as did the number of clients requesting budgetary pricing for future projects.” “The continued acquisitions of service bureaus by system manufacturers has continued to put pressure on AM pricing at a rate disproportionate to the still high cost of new equipment. This has done two things: 1) made the investment into new AM equipment unattractive from a business perspective, and 2) continues to fuel the innovation of the open-source community. 3D Systems and Stratasys seem to be in a race to near-zero profits. We continue to offer AM focused on quick-turn, local service primarily for prototyping where profit margins are more resilient. The bulk of our revenue has moved to design engineering services.” “The AM market is growing at a faster pace. Indian manufacturing companies are evolving in manufacturing of 3D printing systems in plastic material. There is a huge demand for low-cost metal AM systems.” “Metal AM seems to be taking off and is a likely investment for us in the near future.” “In the past we have done a lot of Formula 1 work but 60% of the teams are struggling … We see demand from this sector decreasing. In the last year we have seen more companies looking to AM to create tooling and direct parts and I believe their interest in this has been ignited by all the media coverage of the cheap 3D printers. A lot of the big manufacturing companies are saying to their Tier One suppliers, ‘You must have an AM strategy and demonstrate how you are utilizing it.’ The biggest interest is in metal sintering but people are afraid to jump in and buy a machine. Unlike SLA, SLS, and FDM, the metal sintering companies are setting much more realistic expectations and it is making large companies wary of buying machines.” “2014 was about 5% down from 2013, but business is skyrocketing. I would not be surprised to see 20% increase in sales in 2015. We just completed a 16,000-ft2 expansion, doubling our production space. And we plan to add more CNC machines, injection-molding machines, and possibly more SLA. We are also adding personnel. Most our new business is in aerospace.” “2014 was not a steady year, with a lot of ups and downs.” “2014 was Phase 1 of a five-year plan for additive. In 2015, we will see 2–3 more EOS M 290 machines plus one EOS P 760. Over five years we expect to have 15–20

Service Provider Survey Results July 2015
COPYRIGHT © 2015 19 WOHLERS ASSOCIATES, INC.
DMLS systems and 5+ SLS, 2 FDM, and 1 SLA system. In addition, we will have over 20 high-end CNC systems.” “Looks like the trend I noted in 2011 is continuing after a blip in 2012: we continue to see a decline in AM sales as our customers embrace the consumer-grade printers and lower-priced industrial printers. We see much more demand for short-run production parts (urethanes) than we do for traditional AM prototypes. We do see customers come back to us after a year or so of buying their own equipment but their purchasing patterns are different. They use us much less for iterative prototyping and more for show models and multiples used in marketing-type applications.” “We believe our rapid prototyping business declined because customers added capabilities in-house and reduced outsource business.” “We added a [3D Systems] ProX 300 in May 2014. We are still having issues and 3D Systems is attempting to make upgrades. 3D Systems is actually going to replace our machine in February or March [2015]. The machine is OK but for parts no taller than 4 inches. I hope the upgrades allow us to produce parts 9 inches tall, which is what 3D Systems sold us on and why we bought the machine.” “I’m excited to finally see a new player like Prodways entering the market.” “2014 was another growth year, with 2015 starting off with a lot of buzz for us. We had a record fourth quarter, record December, and record January 2015. We are looking forward to another double-digit growth year.” “Another outstanding year; overall top line growth was 41%. Tremendous demand for large SLS parts drove us to buy an EOS P 760. We were forced to outsource significant volumes of oversized SLS in 2014 and it was unpredictable in both quality and delivery. Sintering in general is a significant growth area for us. SLA continues to do well also, both for prototype parts and patterns for our urethane-casting department.” “AM seems to be a mature industry with many competitors, several of them public institutions who use public funds to purchase AM machines and compete with private companies.” “We grew dramatically in 2014, and learned a lot about the AM business. We are partnering now with urethane molding and prototyping companies that can provide a more complete package of services. There are many clients in the pipeline that are just slow to adopt AM. We believe that will be the growth opportunity in 2015. It should be a good year.” “We would like to see upgrades for current machines to 1) accelerate production time, 2) reduce cost of material, 3) reduce cost of maintenance plan with a more

Service Provider Survey Results July 2015
COPYRIGHT © 2015 20 WOHLERS ASSOCIATES, INC.
flexible plan, 4) reduce cost of upgrades, 5) more independent controllers, slicing software, such as CNC machining independent controllers from Fanuc, Siemens, and machine programming like NX CAM, Delcam, and MasterCam, and 6) the possibility for a premium price to better control machine input to use special material and blends.” “Architectural modeling rebounded, driven by public attention as well as a strong rebound in construction.” “We are primarily focused on materials development and process advancement with and emphasis on high-temperature thermoplastics and composites, refractory metals, and ceramics. Our RP business was very strong and we completed the single largest prototype we’ve ever made. We also received our AS9001c certification, which allows us direct commercialization into aerospace applications.” “I build parts as a service bureau. I am getting more calls from the general public over the past year. Their interest is increasing, which in turn is generating new business.” “We started a sand printing service for castings in 2014. Sand printing is currently the only viable 3D printing technology for large industrial parts. We print molds every day for hundreds of kilograms of metal and concrete parts that are used in industrial applications such as pumps and engines. It is remarkable that the most ready technology for industrial applications gets the least attention.” “We completed an upgrade of all our plastic systems to the latest technology level in 2014.” “We are still noticing a huge gap in design in order to get parts printed. Most individuals that come to us wanting 3D printing have no clue what is necessary to get to a final printed part. We see most of our revenue from other businesses that haven’t invested in their own printers.” “Service bureau revenues were actually on par or on slight increase in 2014 compared to 2013. In-house equipment and materials development was also active during 2014, which had some limiting effect on commercial capacity. “ “Our revenue was down for the year, but our profits went up.” “In China, besides a few direct manufacturing cases, the most common use of AM is as a service or tool for further production needs. In 2014, we used AM to make prototypes and used the prototypes as molds to cast patterns. We are also equipped with injection molding and vacuum casting tools. This is our business model. I believe a lot of similar Chinese prototyping companies use this same model.” “We are seeing more and more small 3D printers in customer hands.”

Service Provider Survey Results July 2015
COPYRIGHT © 2015 21 WOHLERS ASSOCIATES, INC.
“The continued consolidation [in the service provider segment] has had less of an effect on downward market pricing than initially expected at merger announcement, with the new “Stratasys Direct Manufacturing” being a major potential disrupter. In fact, it seems to be helping us earn business in many ways as one of the largest independent service bureaus in the industry.” “The Indian market is being flooded with the locally manufactured low-cost FDM printers, which will impact the business of service bureaus and visual aids segment.” “2014 was a transition year for us with lots of personnel movement influencing sales. The initiation of work in metal AM demonstrates the technology is still in need of maturity, but significant potential seems to exist. We will be adding a Prodways machine in 2015.” “Note to Stratasys: Stop charging so much to upgrade materials. You are missing out on material sales.” “The new machines from Prodways are interesting.” “2014 started nicely, but the fourth quarter slowed. There appears to be a saturation occurring, with mid-frame machine sales penetrating the OEMs and a large number of sub-$10,000 printers penetrating design studios for verification models. Part pricing seems to be driving sales, but on a positive note, new vertical markets are taking advantage of 3D printing. Companies that have never used the technology are starting to dabble in it to determine cost benefits. I believe that 2015 overall will be a big year, and the use of paid parts services will grow as a result of new vertical markets and end uses.” “90% of our business comes from CNC machining.” “In the first week of 2015, we added an EOS P 396—25% faster than the P 395—unbelievable.” “Market demand increased sharply in 2014. More and more end users began to try to use AM technology to solve their machining problem. Some end users began to design parts for manufacturing using AM technology. The [Chinese] government is prepared to support and popularize AM technology. We certainly believe 2015 will much better than 2014.” “The level of awareness and acceptance is increasing rapidly. Now it is important to make no exaggerated promises, and the machine manufacturers must accelerate their development.” “Excellent growth in 2014—we almost doubled our sales. Thanks to all who work and contribute to our industry.”

Service Provider Survey Results July 2015
COPYRIGHT © 2015 22 WOHLERS ASSOCIATES, INC.
Summary In this survey for Wohlers Report 2015, 87 service providers in 23 countries participated. The industry as seen through the eyes of these companies is important because they represent a wealth of knowledge, experience, and insight. They are also among the early adopters and innovators of new technology, and often are the first to experience growth or downturns in business that serve as harbingers of emerging trends in the additive manufacturing industry. Most of the service providers that responded to the survey had a positive year in 2014, in both the primary and secondary revenue streams. Based on this data and their comments, we believe the majority is in relatively good financial health when the survey was conducted in early 2015. As a whole, they are growing, and growth in 2014 continued a positive trend that began in 2010 after two years of decline. * * * Acknowledgement We are grateful for your participation in our annual survey, and we hope that this report helps to make your contribution worthwhile. The data we collect in our annual survey of service providers aids us in trend analysis, recent historical changes, and market forecasts. The AM industry has experienced an unprecedented level of attention from the media, government agencies, and organizations of all types in the recent past. We are experiencing some of the best years for the technology and industry, and believe even more exciting times are ahead. We believe in the adage, “A rising tide lifts all boats,” so we sincerely wish you continued success in your business. Thank you again. Tim Caffrey Senior Consultant [email protected] Terry Wohlers Principal Consultant and President [email protected]