2015 sba water quality - california department of … sba...• lyda s. hakes, pe...
TRANSCRIPT

2014-2015 SBA Water Quality
Lyda S. Hakes, ACWD
Brian Keil, Zone 7
Laura Young, SCVWD
1

South Bay Aqueduct
2
• State Water Project
fed by two sources o Delta
o Lake Del Valle
• 10.8 miles of canal
• 32.1 miles of pipeline
• 1.8 miles of tunnel
• Max annual
allocation o Zone 7: 80,619 AFA
o ACWD: 42,000 AFA
o SCVWD: 100,000 AFA
• Lifeline to the Bay
Area
ACWD
Zone 7
SCVWD
SF Bay

SBA Treatment Plant Processes
3
Zone 7 Water
Agency
Alameda
County
Water
District
Santa Clara Valley
Water District
Process DVWTP PPWTP WTP2 PWTP RWTP
Coagulant Ferric Ferric Ferric Alum Alum
Filtration Conv UF, Conv Conv Conv Conv
Preozone ✓
Intermediate
Ozone ✓
Chlorine ✓ ✓ ✓ ✓ ✓
Chloramine ✓ ✓ ✓ ✓ ✓
PAC
Adsorption ✓ ✓ ✓ ✓

Bromide, ug/L
4
BrO3, TTHMs
2014 2015

TOC, mg/L
5
TTHMs
2014 2015

Electrical Conductivity, μS/cm
6
Upper SMCL
Rec. SMCL
Short-term SMCL
2,200
2014 2015

T&O
7
2014 2015

Algae
8
Filter Cloggers
DWR’s SBA Algae Report
2014 2015

Cyanotoxins
9
DWR’s Delta Cyanotoxins Report

Challenging Water!
10
Bromide
TOC
EC
Algae

SBA-wide Tools
• Request Copper
Sulfate Treatment
+ Controls algal biomass in canals
- Can result in treatment impacts
(short-term)
- Requires GW recharge off-line
• Request Blend from
Lake Del Valle
+ Improves quality & treatability
- Requires balancing of interests
11
Water Quality
Water Supply
Recreation Emergency/ Operational
Storage
Lake Del Valle, Typical operating range: 25,000 to 40,000 AF

ACWD’s WTP2 Process Control Options
Ozone Ferric pH Pre-chlor Flow rate
TOC -- -- --
Bromide -- --
Algae -- --
T&O -- -- --
Turbidity -- --
DRAWBACKS & IMPACTS
BrO3, $$$ $$$, Solids, Color,
Caustic, Coagulation
$$$, Caustic,
Coagulation
$ $$$, Production,
supply optimization
12

ACWD’s Treated Water Quality
…with effort! • Increased chemical
dosages o Ferric, ozone, chlorine, caustic &
CO2
• Cautious bromate control
• Elevated T&O complaints
in July 2014
• Highest-ever ozone
demand in April 2015
• Major filtration challenges
with ozone outage
13
We are managing…
• Bromate o RAA = 2.12 ug/L
• TTHMs o Leaving WTP2 avg = 29 ug/L,
max = 43 ug/L
• T&O o Minimal complaints
• Filtration rates o Consistent with ozone on-line

0
2000
4000
6000
8000
10000
12000
14000
16000
UF
RV
(g
al/s
f)
F1-Poor
F3-Best
F8-Avg
6-yr (2006-2011) average UFRV = 7004 gal/sf
2-yr (2012-2013) average UFRV = 3742 gal/sf
• UFRVs before and during drought conditions
• 6 year bench mark from 2006-2011 for “normal
years”
• 2 year benchmark from 2012-13 for “drought years”

0
10
20
30
40
50
60
70
80
Ru
n T
ime
(hrs
)
F1-
Poor
F3-Best
F8-Avg
Extremely short filter runs (< 10 hours) in some months.
Significant performance limiting factor requiring constant backwashing of filters.

TOC
0
10
20
30
40
50
60
70
80
0
2
4
6
8
May
-11
Au
g-1
1
No
v-1
1
Feb
-12
May
-12
Au
g-1
2
No
v-1
2
Feb
-13
May
-13
Au
g-1
3
No
v-1
3
Feb
-14
May
-14
Au
g-1
4
No
v-1
4
Feb
-15
May
-15
Au
g-1
5
FeC
l3 (
mg
/L)
TO
C/D
OC
(m
g/L
)
DV Inlet TOC Treated Water TOC FeCl3-Con Time period of UFRV < 6-yr average
Elevated levels of TOC have negative impact on filter performance.
Increased coagulant dose (ferric chloride) greatly improved filter UFRVs ◦ Increased sludge production
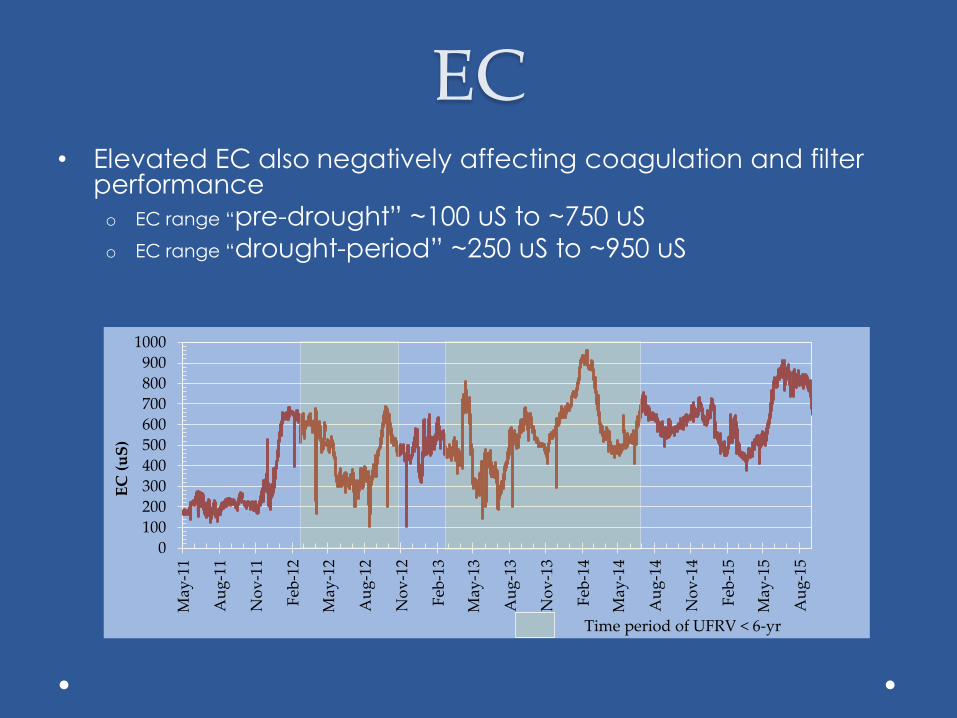
• Elevated EC also negatively affecting coagulation and filter performance
o EC range “pre-drought” ~100 uS to ~750 uS
o EC range “drought-period” ~250 uS to ~950 uS
EC
0
100
200
300
400
500
600
700
800
900
1000
May
-11
Au
g-1
1
No
v-1
1
Feb
-12
May
-12
Au
g-1
2
No
v-1
2
Feb
-13
May
-13
Au
g-1
3
No
v-1
3
Feb
-14
May
-14
Au
g-1
4
No
v-1
4
Feb
-15
May
-15
Au
g-1
5
EC
(u
S)
Time period of UFRV < 6-yr average

0
20
40
60
80
100
120
140
160
180
200
May
-11
Au
g-1
1
No
v-1
1
Feb
-12
May
-12
Au
g-1
2
No
v-1
2
Feb
-13
May
-13
Au
g-1
3
No
v-1
3
Feb
-14
May
-14
Au
g-1
4
No
v-1
4
Feb
-15
May
-15
Au
g-1
5
Ch
lori
de
(pp
m)
Cl Time period of UFRV < 6-yr average
Elevated Chloride levels ◦ Cl range “pre-drought” 15 ppm to 120 ppm ◦ Cl range “drought-period” 25 ppm to 160 ppm
Chloride

Algal Growth
0
5000
10000
15000
20000
25000
30000
0
200
400
600
800
May
-11
Au
g-1
1
No
v-1
1
Feb
-12
May
-12
Au
g-1
2
No
v-1
2
Feb
-13
May
-13
Au
g-1
3
No
v-1
3
Feb
-14
May
-14
Au
g-1
4
No
v-1
4
Feb
-15
May
-15
Au
g-1
5
Alg
al B
iom
ass
(m
g/m
3),
Tem
per
atu
re x
100
0 (d
eg C
)
Flu
ore
scen
ce
DV-Fluor DV7 BiomassTime period of UFRV < 6-yr average
Increased Algal Growth in SBA during the drought

SCVWD
20

SCVWD
21

SCVWD
22

SCVWD
23

SCVWD

SCVWD

SCVWD

SCVWD

Questions? • Lyda S. Hakes, PE
510-668-6515
• Brian Keil
925-454-5769
• Laura Young
408-630-2461
28