2015 shareholder review nib holdings limited announcement_2015... · nib holdings limited ... nib...
TRANSCRIPT

nib holdings limited Head Office 22 Honeysuckle Drive Newcastle NSW 2300 abn 51 125 633 856
t 13 14 63 f 02 4925 1999 e [email protected]
w nib.com.au
2 October 2015
The Manager Company Announcements ASX Limited Level 4, Bridge Street Sydney NSW 2000
2015 Shareholder Review – nib holdings limited
Please find attached nib’s 2015 Shareholder Review which was distributed to nib shareholders today.
The Shareholder Review can also be viewed online at nib.com.au/shareholders.
Yours sincerely,
Michelle McPherson Chief Financial Officer & Company Secretary
2015 Shareholder Review i
SHARE HOLDER REVIEW 2015

OUR VISIONnib IS A LEADING FINANCIER AND FACILITATOR OF HEALTHCARE WITH A REPUTATION FOR INNOVATIVE PRODUCTS, VALUE FOR MONEY, OUTSTANDING CUSTOMER SERVICE, BEING A GOOD CORPORATE CITIZEN AND STRONG SHAREHOLDER RETURNS.
OUR MISSIONTO HELP PEOPLE ACCESS AND AFFORD HEALTHCARE WHEN AND WHERE NEEDED.
GROUP PERFORMANCE HIGHLIGHTS P/02
CHAIRMAN’S REPORT P/04
MANAGING DIRECTOR’S REPORT P/06
YEAR IN REVIEW P/08
Australian Residents Health Insurance P/08
nib New Zealand P/10
International and New Business P/12
Profitability and Shareholder Returns P/14
Community P/16
BOARD OF DIRECTORS P/18
BOARD AND EXECUTIVE REMUNERATION P/20
FINANCIAL SUMMARY P/22
Consolidated Income Statement P/22
Consolidated Balance Sheet P/22
Consolidated Statement of Cash Flows P/23
Five-Year Performance Summary P/24
INFORMATION FOR SHAREHOLDERS P/25
2 nib holdings limited
FY15FY14FY13FY12FY11
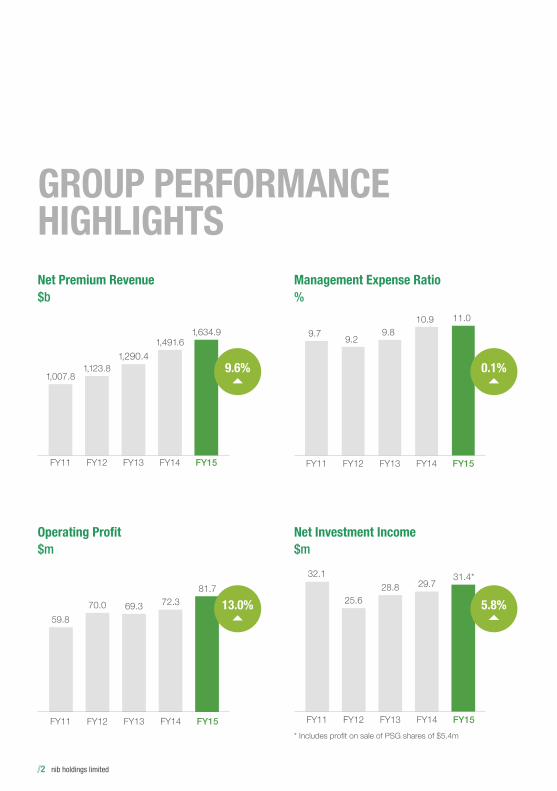
1,007.81,123.8
1,290.41,491.6
1,634.9
GROUP PERFORMANCE HIGHLIGHTSNet Premium Revenue $b
FY15FY14FY13FY12FY11
81.7
59.870.0 69.3 72.3
Operating Profit$m
FY15FY14FY13FY12FY11
31.4*32.1
25.628.8 29.7
* Includes profit on sale of PSG shares of $5.4m
Net Investment Income$m
FY15FY14FY13FY12FY11
9.7 9.29.8
10.9 11.0
Management Expense Ratio%
9.6%~
13.0%~
0.1%~
5.8%~

2015 Shareholder Review 3
FY15FY14FY13FY12FY11
23.1
16.5
21.7 21.6 20.8
Return On Equity%
FY15FY14FY13FY12FY11
75.3
65.5 67.6 67.2 69.8
FY15FY14FY13FY12FY11
17.3
13.714.8 15.3 15.9
Earnings Per Sharecps
FY15FY14FY13FY12FY11
8.0
5.0
16.0
9.0
9.25 10.0 11.0 11.5
Capital ReturnSpecialOrdinary
Dividends and Capital Managementcps
Net Profit After Tax$m
8.8%~
7.9%~
2.3%~

4 nib holdings limited
I’m pleased to report another strong fiscal year for the nib Group. Group premium revenue grew to $1.6 billion, an increase of 9.6% on the previous year and operating profit to $81.7 million, an increase of 13.0%. Net profit after tax was up by 7.9% to $75.3 million or 17.3 cents per share. The Board has declared ordinary dividends totalling 11.5 cents per share (fully franked) for the year. This represents a payout ratio of 67% of after tax earnings. The final fully franked dividend of 6.0 cents per share will be paid to shareholders on 9 October 2015.
Against a backdrop of cautious consumer spending, nib continued to build its customer base across the business. Our core Australian Residents Health Insurance business (arhi) added over 23,100 policyholders with a growth rate of 4.7% and accounted for almost 15% of total industry growth. And during the year we surpassed a million people covered. It was a significant milestone for a business which began in Newcastle some 63 years ago deep inside BHP Steel Works and is a tribute to everyone involved in the business today and those who have gone before us.
We continue to push hard as a business to grow and leverage our fabulous brand, technologies and capabilities we have across the Group and exploit additional complementary business prospects. There’s no better example of this than our post-balance date acquisition of World Nomads Group (completed on 31 July 2015). World Nomads Group meets our strict return on investment criteria and is expected to be earnings per share and return on equity accretive immediately*.
CHAIRMAN’SREPORT
2015 Shareholder Review 5
FY15 pre-tax earnings from businesses other than arhi accounted for 12.1% of our total operating profit. The result was down on last year’s contribution of 21.1% because of an improved contribution from arhi and some softness in parts of the complementary business portfolio. However, we remain very keen to grow our complementary businesses and their contribution to Group earnings. Well known themes around ‘globalisation’, ‘disruption’ and the ‘internet of things’ are sparking opportunities we are following closely. Importantly, we have a well-developed lens for examining complementary prospects which demands we see economies of scope and synergies.
I hasten to add that our determination to invest in and pursue non-arhi earnings doesn’t mean we’ll be any less focused upon our primary economic engine arhi. nib has been and continues to be a genuine pace-setter in the domestic health insurance market and we’re very confident arhi still has strong growth potential. Importantly, we saw good net margin improvement in FY15 which brought us back within our stated target range of 5.0% to 5.5%.
The digital age is creating new opportunities for established businesses such as arhi, not just new business. Perhaps the best example of this during the year was the continued development and growth of our digital platform Whitecoat, which Mark writes about further on in his Managing Director’s report.
As you’d expect, good governance, a focus upon return on invested capital and managing the risks implicit in our portfolio of businesses are priorities at nib. We continue to apply risk-based ‘hurdle rates’ in the allocation of capital and our risk framework is well developed. Hand-in-hand with strategic planning is clear Board visibility of key enterprise risks and how they are being managed. Your Board is engaged at an early stage in management’s thought process allowing healthy discussion and debate ahead of any final investment decision.
Another priority of the Board is succession planning both for Executives and Non-Executive Directors. We have a strong leadership team and the Board is very comfortable with our Executive planning and development. The Board has continued to turn its mind to ensuring we continue to meet our own tests of Non-Executive Director ‘independence’ and appropriate skills mix as set out in our Corporate Governance Statement.
I also want to take this opportunity to briefly highlight the efforts we continue to make as a corporate citizen. Since its inception in 2008, our flagship ‘nib foundation’ has donated $14.9 million in grant funding to more than 80 charities. The focus of this funding has been upon health challenges faced by young people and carers and we’re very proud of what has been achieved by our foundation and Board of Trustees.
Shareholders as well as our many other stakeholders can expect nib will continue to expertly, creatively and responsibly pursue our mission of helping people access and afford healthcare when and where needed. Since 1952, this has been imperative to the strength of our company and remains the key to ongoing growth and prosperity.
I would like to thank and acknowledge the contribution of my fellow Directors, as well as congratulate Mark and his management team on an excellent FY15.
STEVE CRANEChairman
* Excluding one-off transaction costs and amortisation of acquisition related identifiable intangibles.
6 nib holdings limited
The FY15 results were mostly strong and saw us deliver a 13.0% lift in operating profit to $81.7 million and a 7.9% lift in net profit after tax to $75.3 million. Gross Written Premium (GWP) across the Group increased by 9.6% to $1.6 billion.
Throughout this Shareholder Review you’ll find much detail and insight in relation to the FY15 performance. I won’t attempt here to pre-empt all of that, only make five high level observations.
Our arhi business grew powerfully and we expect the market to continue to grow and to increase our market share.
Our growth of more than 23,100 policyholders at a rate of 4.7% was well above system’s 2.5%. GWP of $1.4 billion was up 8.8% and our operating profit of $71.8 million was up an impressive 26.0% on FY14. A net margin of 5.0% was a good improvement on last year’s 4.2% and beat industry’s 4.4% (FY15).
A lapse rate of 13.6% for the year clearly indicated growth is not without headwinds. But we’re taking meaningful action on redressing lapse and we’re confident with an expanding arhi system we will still gain market share. We’re equally confident that net organic growth remains highly value accretive.
There have been a few comments in the market that our diversification efforts may signal a company view that future arhi prospects are limited. Nothing could be further from the truth.
Managing underlying claims inflation is becoming more and more a top priority.
There is a determination evident amongst health insurers to rein in over-servicing, avoidable care and cost variation. In FY15 we actually saw some encouraging progress with industry benefits paid per person increasing by just 4.7% compared to 6.2% the previous year. Our own inflation was higher at 8.2% mainly because of the success we had in the over 55s market segment where claiming is implicitly higher. Very importantly,
MANAGINGDIRECTOR’SREPORT
2015 Shareholder Review 7
this is offset by the industry risk equalisation scheme and our expense for FY15 dropped by 2.7% to $185.5 million.
Both payers and providers will do well from inevitable growth in healthcare spending and the private sector’s role. However, neither can or should be tolerating market inefficiency and simply ‘pricing in’ the costs with its obvious consequence for premiums.
‘Complementary’ business earnings continued to make a good contribution to pre-tax operating earnings and further opportunities are very real. But they are never risk free, nor is return on investment instant.
Earnings from businesses other than arhi accounted for 12.1% of Group operating profit. It would have been better except for the higher claims experience encountered in our International inbound business.
Our nascent New Zealand business performed well delivering policyholder growth of 4,631 policies (5.9% net growth) and saw GWP increase by 8.1% to $150.4 million. We saw strong sales of 18.5%, of which approximately 50% was attributable to our new direct-to-consumer channel. While the operating profit of $5.4 million was on the surface slightly disappointing, it was hampered by a legacy product arrangement which we explain further on in this report. It’s clear we’ve some way to go yet to prove the New Zealand investment case, but we will.
We also incurred further losses in our fledgling medical travel business nib Options of $3.8 million. Nevertheless, we’ve learnt much from our experience to date and the second half of FY15 saw some significant changes to the operating model.
While it occurred just after 30 June 2015, I should mention here our acquisition of World Nomads Group (WNG), a leading travel insurance company. We believe WNG is a great fit. It’s a market that’s growing, 60% of claims are medical and we’ve actually been selling travel insurance since 1990. Furthermore, WNG has a culture very similar to our own and is a terrific business.
We made significant investment in our IT and digital strategy, especially recognising the potential of the ‘digital era’ to disrupt the healthcare market and create opportunities.
During FY15 we continued development of Whitecoat. Several years in the making, Whitecoat is our Wikipedia, Amazon and TripAdvisor
style solution for the healthcare market. And a potential ‘game changer’. We are trying to provide consumers with as much information as we can to overcome information asymmetry and help them make better decisions regarding their healthcare.
The digital era, ‘internet of things’ and leaps in technology generally, are also allowing us to explore other disruptive possibilities. We even created a new entity (Digital Health Ventures Pty Limited) with a specialist digital company to help drive our efforts and investment.
Although there was no significant mergers & acquisition (M&A) activity during FY15, some form of consolidation in the private health insurance market is inevitable.
As we have previously indicated to investors, we view ‘opportunistically’ M&A prospects within the Australian private health insurance market. That is, while we are not deliberately chasing opportunities we will always be open to participating in any sale process.
It’s worth observing there have been seven health insurer acquisitions during the past 10 years. That we now have two ASX listed health insurance companies (Medibank Private and us) and an ambitious large international player (BUPA) can only add momentum. The rapid M&A we are currently seeing in the United States is also a possible harbinger for consolidation at a global level.
As a business we have a philosophy that the future is unpredictable and that disruptive technologies are making the status-quo for any company more and more a business risk. For us it means we must be experimenting widely throughout the business. So expect to see even more.
I should mention before concluding the important shift in our active capital structure that a combination of capital management and acquisitions has brought about. Post the WNG purchase we expect to have a ratio of debt-to-debt plus equity of 32%. We’ve created a capital structure which has lowered our weighted average cost of capital without posing any additional risk to equity.
I’d like to thank Chairman Steve, our Board of Directors, my Executive leadership team and everyone at nib for their support during 2015 and I look forward to an even brighter future.
MARK FITZGIBBONManaging Director

8 nib holdings limited
Our Australian Residents Health Insurance (arhi) business performed strongly during the year, with an operating profit of $71.8 million, an increase of 26.0% on the previous year. Strong policyholder growth was a highlight of FY15, with the business growing by more than 23,100 net new policyholders at a growth rate of 4.7%. This helped us achieve the major milestone of over one million arhi customers covered.
Growth in policies, combined with premium increases, resulted in an 8.8% increase in premium revenue for the year to $1.4 billion.
Above-industry policyholder growth has underpinned the performance of our arhi business for many years. Historically, this has been largely due to the considerable success we have achieved in growing our customer base of those aged under 40 years. While we continue to focus on targeting the better risk component of this demographic, we have also identified and leveraged the opportunity to acquire customers aged 55 years and over. Through distribution partnerships with organisations like Apia, who have a very strong appeal with this market segment, we are having considerable success among this group. During FY15, 31.3% of arhi sales were to policyholders over 55 years of age, compared to 21.9% the previous year. Claims expenses, including risk equalisation, grew by 7.5% during the reporting period, reflecting our growing customer numbers, the frequency of customers seeking medical treatment and the increase in costs associated with medical
treatment and healthcare. For FY15, claims costs totalled $1.2 billion, which represents 87 cents in each dollar being paid on behalf of our customers.
Controlling claims inflation, while also keeping our premiums as affordable as possible for our customers, remains our ultimate goal. Our efforts and focus will continue to ensure utilisation and cost of healthcare services remains appropriate.
Within the private health insurance industry there is a growing trend of customers looking to switch providers or cancel their cover altogether. Accordingly, reducing the rate of lapse and retaining customers remains a priority. While it is unlikely we will significantly arrest our overall lapse rate, which for FY15 was 13.6% (FY14: 12.0%), it is important that we continue to provide outstanding service and ensure our customers get value from their nib health cover.
This explains our effort in a number of customer retention initiatives, including a new rewards program. ‘nib Rewards’ is a pilot program that provides customers with discounts, benefits and special offers at more than 2,000 providers across Australia, including travel, accommodation, dining and leisure. Based on the success of the pilot we are planning a full roll out of the program in the coming 12 months.
The frequency of customers downgrading their level of health cover also appears to be a watch point for many industry observers during FY15. Ensuring customers are on the most appropriate level of nib cover for their life stage and budget
AUSTRALIAN RESIDENTS HEALTH INSURANCE
YEAR IN REVIEW
2015 Shareholder Review 9
is our ultimate objective, which can result in customers either upgrading or downgrading their level of cover.
Despite our strong investment in policyholder growth for the year, our management expense ratio of 8.3% is comparable to the FY14 result of 8.1%. Our management expense ratio excluding customer acquisition costs fell from 5.1% in FY14 to 4.9% this year. We will continue to focus on improving operational efficiencies with the view to provide our customers with affordable private health insurance and the customer service they have come to expect from us.
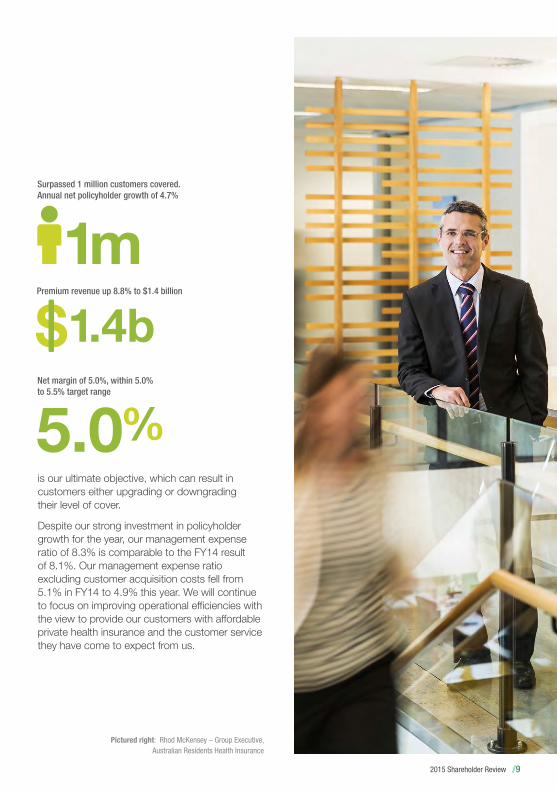
Surpassed 1 million customers covered. Annual net policyholder growth of 4.7%
1mPremium revenue up 8.8% to $1.4 billion
1.4bNet margin of 5.0%, within 5.0% to 5.5% target range
5.0
Pictured right: Rhod McKensey – Group Executive, Australian Residents Health Insurance
10 nib holdings limited
Since acquiring our New Zealand operations in late 2012, significant effort and investment has been made to grow the business, drive efficiency through automation initiatives and develop new business opportunities.
The business contributed $7.3 million (before movements in PPB* liability) or 8.7% to our Group operating profit in FY15. Including PPB, operating profit was $5.4 million (FY14: $7.4 million). Our continued effort and investment will see this contribution become more material in the years ahead.
Despite being New Zealand’s second largest health insurer providing cover to more than 162,000 people across the country, nib has just over 12% of the market, with nearly 30% of New Zealanders having private health insurance (compared to approximately 50% in Australia). This provides considerable scope to grow the business.
Our direct-to-consumer channel, that we launched in late 2013, remains a significant focus of our investment. Our net policyholder growth for the period was 5.9%, with approximately half of all policies sold being through this key sales channel.
A number of important initiatives were undertaken in New Zealand throughout FY15 to develop and grow both current and alternative sales channels:• Improvements to our operating model
for wealth advisor sales distribution have generated some successes for the business. We will continue to work with our advisor network over the coming year to further recalibrate the distribution model to drive greater growth from this channel.
• The group or employer-sponsored area of the market remains a significant growth opportunity for nib in New Zealand. Accordingly, we will launch an innovative new corporate product offering in FY16 to actively target this large segment of the market.
• Following the success of white-labelling partnerships in Australia, we are currently exploring similar opportunities in New Zealand. Productive discussions have been held with a number of potential partners.
The profitability of our New Zealand operations will continue to be impacted for the short-to-medium term by the investment we continue to make in business development, as well as further automation and efficiency initiatives. The thesis behind this level of investment is we will grow our share of the New Zealand health insurance market, as well as our overall profitability.
* Premium Payback (PPB) portfolio is related to a legacy product that is a calculated liability based upon reimbursing policyholders at some future time, the difference between premiums paid and claims made.
nib NEW ZEALAND
YEAR IN REVIEW

2015 Shareholder Review 11
150.4mPremium revenue up 8.1% to $150.4 million
Direct-to-consumer accounted for approximately 50% of all sales
Policyholder growth of 5.9%
5.9
Pictured left: Rob Hennin – CEO, nib New Zealand
12 nib holdings limited
Our International (Inbound) Health Insurance business includes international students and workers. For FY15 premium revenue grew 44.6% to $54.9 million, primarily due to strong policyholder growth of 58.5%. nib now provides health insurance to almost 88,000 international students and workers while they are in Australia.
A large portion of this growth can be attributed to our upstream distribution strategy of leveraging educational brokers, as well as winning a major contract with the Saudi Arabian Cultural Attaché Office in Canberra. Under this arrangement nib became the sole provider of Australian health insurance, and as at 30 June 2015 provided health insurance to almost 11,000 Saudi customers living in the country.
Rapid policyholder growth skewed towards the second half of this financial year, particularly in students, combined with what appears to be pent-up demand from those new customers, has seen a higher rate of growth in claims when compared to growth in premium revenue. For this financial year claims costs increased 73.8% to $29.4 million, while premium revenue grew 44.6% to $54.9 million. Various levers are at work to bring claims experience back in to line with expectations. Pleasingly, management expenses only increased $3.8 million to $13.9 million, while the management expense ratio decreased 1.3% to 25.3% reflecting scale within the business.
During the year we have seen a softening in Australia’s skilled migrant intake (457 visa class), causing a shift in focus upon other visa classes. We have also seen increased competition in the market, however, we have a number of strategies that are expected to offset this through market and premium growth.
FY15 operating profit was $11.8 million compared to $11.3 million the previous year. Our International (Inbound) Health Insurance business contributed 14.4% of total Group FY15 operating profit. This business is expected to continue to grow future earnings and level of contribution to our overall Group result in future years.
ADJACENT INSURANCE LINES AND NEW BUSINESSOn 31 July 2015, nib completed the acquisition of World Nomads Group, Australia’s third largest travel insurance provider. nib agreed to acquire World Nomads Group for total consideration of $95.0 million, with the final payment expected to be approximately $106 million, including $15.5 million in cash, and is subject to final completion accounts confirming the value of assets and liabilities acquired.
World Nomads Group is an excellent business with significant expertise, experience and capabilities in the fast growing and fast moving travel insurance market. It has a portfolio of high quality brands, including World Nomads, Travel Insurance Direct and SureSave.
INTERNATIONAL AND NEW BUSINESS
YEAR IN REVIEW
2015 Shareholder Review 13
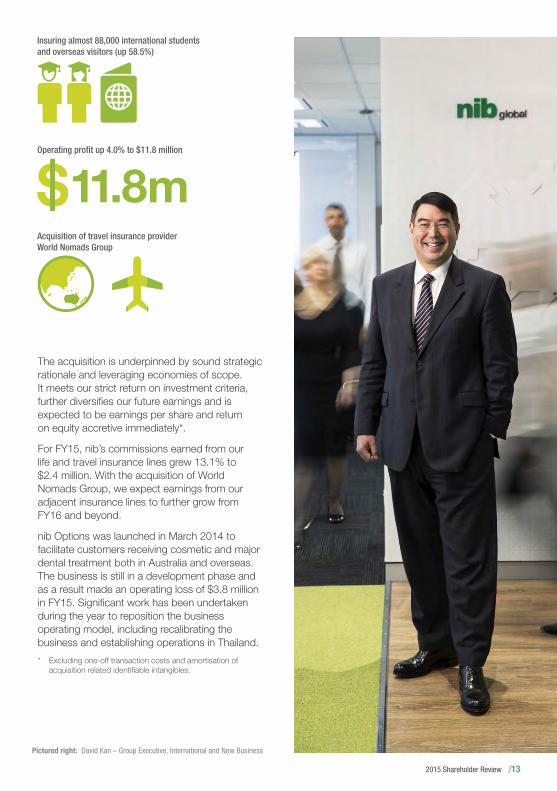
The acquisition is underpinned by sound strategic rationale and leveraging economies of scope. It meets our strict return on investment criteria, further diversifies our future earnings and is expected to be earnings per share and return on equity accretive immediately*.
For FY15, nib’s commissions earned from our life and travel insurance lines grew 13.1% to $2.4 million. With the acquisition of World Nomads Group, we expect earnings from our adjacent insurance lines to further grow from FY16 and beyond.
nib Options was launched in March 2014 to facilitate customers receiving cosmetic and major dental treatment both in Australia and overseas. The business is still in a development phase and as a result made an operating loss of $3.8 million in FY15. Significant work has been undertaken during the year to reposition the business operating model, including recalibrating the business and establishing operations in Thailand.
* Excluding one-off transaction costs and amortisation of acquisition related identifiable intangibles.
Insuring almost 88,000 international students and overseas visitors (up 58.5%)
11.8mAcquisition of travel insurance provider World Nomads Group
Operating pro�t up 4.0% to $11.8 million
Pictured right: David Kan – Group Executive, International and New Business
14 nib holdings limited
Financial year 2015 yielded a good overall result for the nib Group, featuring strong top line growth of 9.6% to $1.6 billion and improved performance of our arhi business.
Our Group operating profit of $81.7 million was up 13.0% on the previous year and within our FY15 guidance range of $75 million to $82 million.
Our investment portfolio successfully delivered against internal benchmarks for the year, resulting in a net investment return of $31.4 million or 5.8%. This out-performance was due to a strong equity market, as well as the sale of a shareholding in Pacific Smiles Group in November 2014, which returned $5.4 million. Excluding the benefit from the sale of our shareholding in Pacific Smiles Group, investment return would have been $26.0 million or 4.8%. As at 30 June 2015, our investment assets totalled $600.8 million.
Group net profit after tax (NPAT) for FY15 was $75.3 million, compared to $69.8 million last year. Our earnings per share result was 17.3 cents and return on equity 23.1%.
Our strong financial performance and position has allowed the Board to declare full year ordinary dividends for FY15 of 11.5 cents per share, fully franked (FY14: 11.0 cents per share), totalling $50.5 million. This full year ordinary dividend comprises an interim ordinary dividend of 5.5 cents per share fully franked (paid 2 April 2015) and a final ordinary dividend of 6.0 cents per share fully franked. The final ordinary dividend will be paid to shareholders on 9 October 2015. The full year dividend of 11.5 cents per share represents a payout ratio of 67% of full year NPAT
and is consistent with our policy to pay ordinary, fully franked dividends between 60% to 70% of full year NPAT.
Following the acquisition of World Nomads Group* announced on 8 July 2015 and completed on 31 July 2015, our gearing ratio was 32% (debt-to-debt plus equity). This is consistent with our long-term target gearing ratio of 30%, noting that the target gearing policy allows for gearing to go above 30% for a short time, if necessary, as part of funding a significant transaction.
After allowing for the payment of the final dividend totalling $26.3 million and acquisition of World Nomads Group* (completed 31 July 2015), our available capital position was $10.2 million.
Since listing on ASX in 2007 our financial performance has been consistently strong. Our total shareholder return (TSR)# for this period to the end of FY15 is 519% compared to 15.0% for the S&P/ASX200. For FY15, our TSR was 7.6% compared to 5.7% for the S&P/ASX200. Our focus on disciplined capital management has also benefited our shareholders with returns to shareholders totalling approximately $162.7 million since listing, through a combination of special dividends and a capital return.
Our strong share price performance also resulted in nib being admitted into the S&P/ASX300 during March this year.
* The acquisition of World Nomads Group was funded with $85 million in debt, with the balance funded from available capital.
# TSR rebased to 100 (assumes capital returns and dividends re-invested at the payment date). Source: IRESS.
PROFITABILITY AND SHAREHOLDER RETURNS
YEAR IN REVIEW

2015 Shareholder Review 15
Pictured left: Michelle McPherson – Deputy CEO / Chief Financial Officer
Earnings per share of 17.3 cents per share, up 8.8%
Net pro�t after tax of $75.3 million up 7.9%
Full year dividend of 11.5 cents per share (fully franked)
17.3c
75.3m

16 nib holdings limited
Each year nib foundation strives to facilitate real change by improving the health and wellbeing of individuals and communities across Australia. This is achieved through the support of programs that deliver unique and practical approaches to challenging health issues, particularly for our focal areas of youth and carers.
During FY15, the foundation’s seventh year of giving, 28 grants were made, bringing our total funding commitment to date to more than $14.9 million*.
Of greatest significance during this period was the establishment of four new multi-year partnerships.• The Australian Drug Foundation’s Good
Sports Junior will provide a unique approach to assisting sporting clubs with junior teams to establish strong alcohol management, healthy food supply and tobacco management policies and practices.
• National Stroke Foundation’s Strengthening Support Programs will focus on helping stroke survivors and carers receive the information, resources and support they need at key points during their recovery.
• Hello Sunday Morning is developing smartphone apps that will improve access to their popular online program and community for young Australians, helping them to develop and maintain a positive relationship with alcohol and re-establish personal choice about how and why they drink.
• Disability Sport and Recreation’s Score! program will develop an online platform that will connect young Victorians with a disability and their carers to sport and recreation activities.
Funding extensions were also offered to three of our current multi-year partners, which are helping these programs to reach scale and sustainability.
The 2014 Community Grants program saw the establishment of 14 new partnerships. These include:
• Healthy Mothers, Healthy Families, presented by Australian Catholic University, that will provide health education for mothers of children with a disability in Victoria and New South Wales.
• Good Cycles, a bike education and work experience program presented by Good Cycles Limited, aimed at disadvantaged youth in Melbourne.
• Newcastle’s Cooks Hill Surf Club has developed the Refugee Water Safety Program to teach basic water and beach awareness skills and swimming lessons to families from culturally and linguistically diverse backgrounds.
A special assistance grant of $50,000 was also provided to the Dungog Shire Community Centre in the wake of the catastrophic floods that hit the Upper Hunter in April 2015. The grant will assist the local community’s recovery through the employment of a part-time Community Renewal
COMMUNITY
YEAR IN REVIEW

2015 Shareholder Review 17
Project Officer over the next 12 months to deliver a range of community events and activities, and also create pathways to information and services.
Through our support of programs from a grassroots to national level, the foundation will continue to play an important role in helping charitable groups meet growing health and wellbeing needs across Australia.
MAD COMMITTEEOur workplace fundraising program, the Make A Difference (MAD) Committee, provides a collaborative approach for our employees and the business to support charity groups and events to create a positive social impact.
Since 2008, just under $55,000 has been raised in support of 40 community-based and national charities groups.
In FY15, the MAD Committee conducted a number of events to support charities such as OzHarvest, CanTeen’s Bandanna Day, the Hunter’s Westpac Rescue Helicopter Service and Hunter Animal Rescue.
* nib foundation figures pending audit of FY15 nib foundation financial statements.
51% Youth
29% Community
45,000 participated in programs
$1.7 million paid in nib foundation grants in FY15*
Projects by focal areas
20% Carers
Pictured right: Mitchell Bond – Score! program participant
18 nib holdings limited
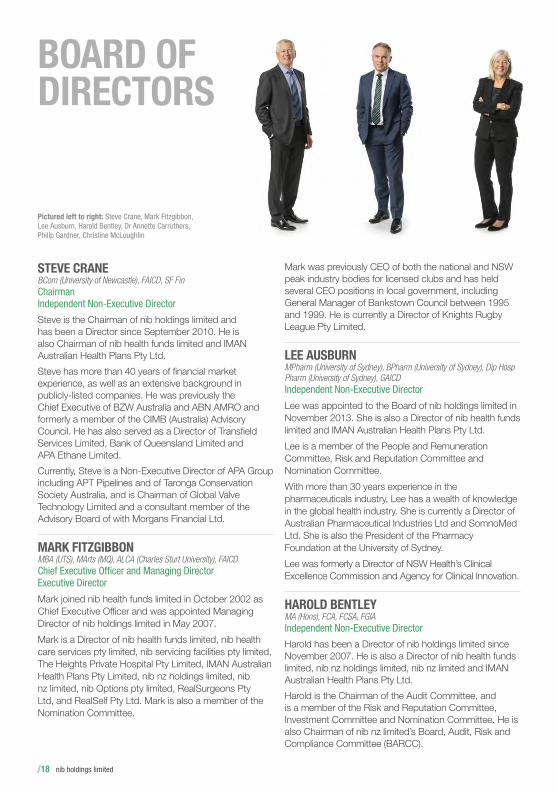
STEVE CRANE BCom (University of Newcastle), FAICD, SF FinChairman Independent Non-Executive Director
Steve is the Chairman of nib holdings limited and has been a Director since September 2010. He is also Chairman of nib health funds limited and IMAN Australian Health Plans Pty Ltd.
Steve has more than 40 years of financial market experience, as well as an extensive background in publicly-listed companies. He was previously the Chief Executive of BZW Australia and ABN AMRO and formerly a member of the CIMB (Australia) Advisory Council. He has also served as a Director of Transfield Services Limited, Bank of Queensland Limited and APA Ethane Limited.
Currently, Steve is a Non-Executive Director of APA Group including APT Pipelines and of Taronga Conservation Society Australia, and is Chairman of Global Valve Technology Limited and a consultant member of the Advisory Board of with Morgans Financial Ltd.
MARK FITZGIBBON MBA (UTS), MArts (MQ), ALCA (Charles Sturt University), FAICDChief Executive Officer and Managing Director Executive Director
Mark joined nib health funds limited in October 2002 as Chief Executive Officer and was appointed Managing Director of nib holdings limited in May 2007.
Mark is a Director of nib health funds limited, nib health care services pty limited, nib servicing facilities pty limited, The Heights Private Hospital Pty Limited, IMAN Australian Health Plans Pty Limited, nib nz holdings limited, nib nz limited, nib Options pty limited, RealSurgeons Pty Ltd, and RealSelf Pty Ltd. Mark is also a member of the Nomination Committee.
Mark was previously CEO of both the national and NSW peak industry bodies for licensed clubs and has held several CEO positions in local government, including General Manager of Bankstown Council between 1995 and 1999. He is currently a Director of Knights Rugby League Pty Limited.
LEE AUSBURN MPharm (University of Sydney), BPharm (University of Sydney), Dip Hosp Pharm (University of Sydney), GAICDIndependent Non-Executive Director
Lee was appointed to the Board of nib holdings limited in November 2013. She is also a Director of nib health funds limited and IMAN Australian Health Plans Pty Ltd.
Lee is a member of the People and Remuneration Committee, Risk and Reputation Committee and Nomination Committee.
With more than 30 years experience in the pharmaceuticals industry, Lee has a wealth of knowledge in the global health industry. She is currently a Director of Australian Pharmaceutical Industries Ltd and SomnoMed Ltd. She is also the President of the Pharmacy Foundation at the University of Sydney.
Lee was formerly a Director of NSW Health’s Clinical Excellence Commission and Agency for Clinical Innovation.
HAROLD BENTLEY MA (Hons), FCA, FCSA, FGIAIndependent Non-Executive Director
Harold has been a Director of nib holdings limited since November 2007. He is also a Director of nib health funds limited, nib nz holdings limited, nib nz limited and IMAN Australian Health Plans Pty Ltd.
Harold is the Chairman of the Audit Committee, and is a member of the Risk and Reputation Committee, Investment Committee and Nomination Committee. He is also Chairman of nib nz limited’s Board, Audit, Risk and Compliance Committee (BARCC).
BOARD OF DIRECTORS
Pictured left to right: Steve Crane, Mark Fitzgibbon, Lee Ausburn, Harold Bentley, Dr Annette Carruthers, Philip Gardner, Christine McLoughlin

2015 Shareholder Review 19
Harold has more than 20 years experience in the insurance and financial services industry, with particular expertise in the transition of private companies to a listed environment.
He was formerly the Chief Financial Officer of Promina Group and an Audit Manager of PricewaterhouseCoopers, specialising in finance and insurance companies.
DR ANNETTE CARRUTHERS MBBS (Hons) (University of Sydney), FRACGP, FAICD, Grad Dip App Finn TAASFAIndependent Non-Executive Director
Annette was appointed as a Director of nib holdings limited in September 2007. She is also a Director of nib health funds limited, nib health care services pty ltd, IMAN Australian Health Plans Pty Ltd, The Heights Private Hospital Pty Limited, nib nz holdings limited and nib nz limited.
Annette is the Chairman of the Risk and Reputation Committee, a member of the Audit Committee and Nomination Committee, and a member of nib nz limited’s Board, Audit, Risk and Compliance Committee (BARCC).
Medically trained as a specialist general practitioner, Annette has extensive experience in the health industry. She is currently a Director of Hunter Infrastructure and Investment Advisory Board, Cater Care Holdings Pty Ltd and Multiple Sclerosis Australia.
She is a former Director of the AMP Capital Managed Aged Care Investment Trusts, Heart Foundation (National and NSW Division), NSW Board of the Medical Board of Australia, Hunter Primary Care Ltd, and member of NSW Medical Experts Committee of Avant Insurance Pty Ltd.
PHILIP GARDNER BCom (University of Newcastle), CPA, CCM, FAICD, JPIndependent Non-Executive Director
Philip was appointed as a Director of nib holdings limited in May 2007. He is also a Director of nib health funds limited and IMAN Australian Health Plans Pty Ltd.
Philip is the Chairman of the Investment Committee, and a member of the Audit Committee, People and Remuneration Committee and Nomination Committee.
Philip is the current CEO of The Wests Group Australia, one of Australia’s largest Leagues clubs. He has held this position for more than a decade in which time he has overseen the Group’s significant growth and expansion.
He is currently a Director of Knights Rugby League Pty Limited, and formerly he served as a Director of Hunter Funds Management Limited and Newcastle Airport Limited.
Philip is a Certified Practicing Accountant and also a fellow of the Australian Institute of Company Directors.
CHRISTINE MCLOUGHLIN BA, LLB (Hons) (Australian National University), FAICDIndependent Non-Executive Director
Christine was appointed to the Board of nib holdings limited in March 2011. She is also a Director of nib health funds limited and IMAN Australian Health Plans Pty Ltd.
She has more than 25 years experience as a financial services and legal executive with iconic brands in financial services (AMP and IAG), telecommunications (Optus) and professional services industries in Australia, the UK and Asia.
Christine is Chairman of the People and Remuneration Committee, and a member of the Risk and Reputation and Nomination Committees.
She is currently a Director of Suncorp Group Limited, Spark Infrastructure Group and Whitehaven Coal Limited, as well as a Member of the Minter Ellison Advisory Board and Deputy Chairman of The Smith Family.
Formerly, Christine was a Director of Westpac’s Insurance Businesses, TAC and The Australian Nuclear Science and Technology Organisation, and Chairman of Australian Payments Council.

20 nib holdings limited
Short-term employee benefits Post-employment benefitsLong-term benefits
Termination benefits Share-based payments
Non-Executive Directors
Cash salary and fees
$Cash bonus
$
Non-monetary benefits
$Superannuation
$
Retirement benefits
$
Long service leave
$
Termination benefits
$ Bonus
$
Performance rights
$Total
$2015
Steve Crane 215,617 – – 18,783 – – – – – 234,400
Lee Ausburn 117,808 – – 11,192 – – – – – 129,000
Harold Bentley 163,400 – – 35,000 – – – – – 198,400
Annette Carruthers 162,283 – – 15,417 7,256 – – – – 184,956
Philip Gardner 130,320 – – 12,380 – – – – – 142,700
Christine McLoughlin 126,119 – – 11,981 – – – – – 138,100
915,547 – – 104,753 7,256 – – – – 1,027,556
2014
Steve Crane 206,225 – – 17,775 – – – – – 224,000
Lee Ausburn (from 13/11/2013) 70,030 – – 6,478 – – – – – 76,508
Harold Bentley 150,211 – – 33,789 – – – – – 184,000
Annette Carruthers 157,208 – – 14,542 9,688 – – – – 181,438
Philip Gardner 124,943 – – 11,557 – – – – – 136,500
Christine McLoughlin 144,165 – – 13,335 – – – – – 157,500
852,782 – – 97,476 9,688 – – – – 959,946
Short-term employee benefits Post-employment benefitsLong-term benefits
Termination benefits Share-based payments
Executives
Cash salaryand fees1
$Cash bonus
$
Non-monetary benefits5
$Superannuation
$
Retirementbenefits
$
Long service leave
$
Termination benefits
$Bonus6
$
Performance rights7
$Total
$2015
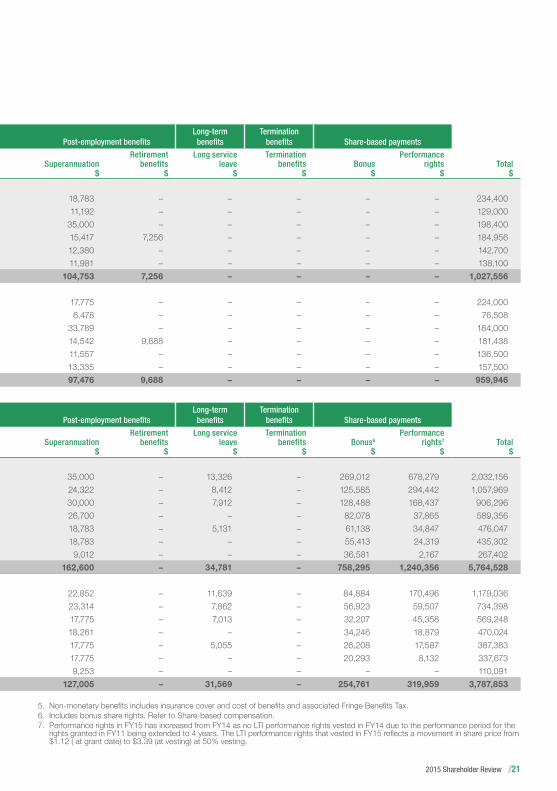
Mark Fitzgibbon 752,692 272,495 11,352 35,000 – 13,326 – 269,012 678,279 2,032,156
Michelle McPherson 474,818 126,717 3,673 24,322 – 8,412 – 125,585 294,442 1,057,969
Rhod McKensey 439,516 128,488 3,455 30,000 – 7,912 – 128,488 168,437 906,296
Rob Hennin 349,186 85,661 7,866 26,700 – – – 82,078 37,865 589,356
Brendan Mills 292,770 61,138 2,240 18,783 – 5,131 – 61,138 34,847 476,047
Justin Vaughan 279,598 55,003 2,186 18,783 – – – 55,413 24,319 435,302
David Kan (from 12/1/2015)2 181,676 36,581 1,385 9,012 – – – 36,581 2,167 267,402
2,770,256 766,083 32,157 162,600 – 34,781 – 758,295 1,240,356 5,764,528
2014
Mark Fitzgibbon 680,325 198,061 10,779 22,852 – 11,639 – 84,884 170,496 1,179,036
Michelle McPherson 450,502 132,821 3,469 23,314 – 7,862 – 56,923 59,507 734,398
Rhod McKensey 388,652 75,149 3,094 17,775 – 7,013 – 32,207 45,358 569,248
Rob Hennin 318,730 79,908 – 18,261 – – – 34,246 18,879 470,024
Brendan Mills 257,548 61,152 2,058 17,775 – 5,055 – 26,208 17,587 387,383
Justin Vaughan (from 1/8/2013)3 235,500 47,349 8,624 17,775 – – – 20,293 8,132 337,673
Marc Nourse (from 6/1/2014 to 11/4/2014)4 100,035 – 803 9,253 – – – – – 110,091
2,431,292 594,440 28,827 127,005 – 31,569 – 254,761 319,959 3,787,853
1. Includes cash salary and fees and short-term compensated absences, such as annual leave entitlements accrued but not taken during the year.2. David Kan was appointed Group Executive International and New Business on 12 January 2015.3. Justin Vaughan was appointed Group Executive Benefits Provider Relations on 1 August 2013.4. Marc Nourse was Group Manager – International and New Business from 6 January 2014 to 11 April 2014 and the amounts reflect all
remuneration arrangements for that period.
BOARD AND EXECUTIVE REMUNERATION
2015 Shareholder Review 21
Short-term employee benefits Post-employment benefitsLong-term benefits
Termination benefits Share-based payments
Non-Executive Directors
Cash salary and fees
$Cash bonus
$
Non-monetary benefits
$Superannuation
$
Retirement benefits
$
Long service leave
$
Termination benefits
$ Bonus
$
Performance rights
$Total
$2015
Steve Crane 215,617 – – 18,783 – – – – – 234,400
Lee Ausburn 117,808 – – 11,192 – – – – – 129,000
Harold Bentley 163,400 – – 35,000 – – – – – 198,400
Annette Carruthers 162,283 – – 15,417 7,256 – – – – 184,956
Philip Gardner 130,320 – – 12,380 – – – – – 142,700
Christine McLoughlin 126,119 – – 11,981 – – – – – 138,100
915,547 – – 104,753 7,256 – – – – 1,027,556
2014
Steve Crane 206,225 – – 17,775 – – – – – 224,000
Lee Ausburn (from 13/11/2013) 70,030 – – 6,478 – – – – – 76,508
Harold Bentley 150,211 – – 33,789 – – – – – 184,000
Annette Carruthers 157,208 – – 14,542 9,688 – – – – 181,438
Philip Gardner 124,943 – – 11,557 – – – – – 136,500
Christine McLoughlin 144,165 – – 13,335 – – – – – 157,500
852,782 – – 97,476 9,688 – – – – 959,946
Short-term employee benefits Post-employment benefitsLong-term benefits
Termination benefits Share-based payments
Executives
Cash salaryand fees1
$Cash bonus
$
Non-monetary benefits5
$Superannuation
$
Retirementbenefits
$
Long service leave
$
Termination benefits
$Bonus6
$
Performance rights7
$Total
$2015
Mark Fitzgibbon 752,692 272,495 11,352 35,000 – 13,326 – 269,012 678,279 2,032,156
Michelle McPherson 474,818 126,717 3,673 24,322 – 8,412 – 125,585 294,442 1,057,969
Rhod McKensey 439,516 128,488 3,455 30,000 – 7,912 – 128,488 168,437 906,296
Rob Hennin 349,186 85,661 7,866 26,700 – – – 82,078 37,865 589,356
Brendan Mills 292,770 61,138 2,240 18,783 – 5,131 – 61,138 34,847 476,047
Justin Vaughan 279,598 55,003 2,186 18,783 – – – 55,413 24,319 435,302
David Kan (from 12/1/2015)2 181,676 36,581 1,385 9,012 – – – 36,581 2,167 267,402
2,770,256 766,083 32,157 162,600 – 34,781 – 758,295 1,240,356 5,764,528
2014
Mark Fitzgibbon 680,325 198,061 10,779 22,852 – 11,639 – 84,884 170,496 1,179,036
Michelle McPherson 450,502 132,821 3,469 23,314 – 7,862 – 56,923 59,507 734,398
Rhod McKensey 388,652 75,149 3,094 17,775 – 7,013 – 32,207 45,358 569,248
Rob Hennin 318,730 79,908 – 18,261 – – – 34,246 18,879 470,024
Brendan Mills 257,548 61,152 2,058 17,775 – 5,055 – 26,208 17,587 387,383
Justin Vaughan (from 1/8/2013)3 235,500 47,349 8,624 17,775 – – – 20,293 8,132 337,673
Marc Nourse (from 6/1/2014 to 11/4/2014)4 100,035 – 803 9,253 – – – – – 110,091
2,431,292 594,440 28,827 127,005 – 31,569 – 254,761 319,959 3,787,853
5. Non-monetary benefits includes insurance cover and cost of benefits and associated Fringe Benefits Tax.6. Includes bonus share rights. Refer to Share-based compensation.7. Performance rights in FY15 has increased from FY14 as no LTI performance rights vested in FY14 due to the performance period for the
rights granted in FY11 being extended to 4 years. The LTI performance rights that vested in FY15 reflects a movement in share price from $1.12 ( at grant date) to $3.39 (at vesting) at 50% vesting.

22 nib holdings limited
CONSOLIDATED STATEMENT OF INCOME($000) 2015 2014
Net premium revenue# 1,634,879 1,491,648 Net claims expense# (1,151,429) (1,039,969)Risk equalisation levy (185,498) (190,604)State levies (28,237) (28,161)(Increase)/Decrease in premium payback liability (1,902) 3,291 Net claims incurred (excluding claims handling expenses) (1,367,066) (1,255,443)Gross underwriting result 267,813 236,205
16.4% 15.8%Acquisition costs (79,261) (67,878)Claims handling and other underwriting expenses (99,904) (94,206)Underwriting result 88,648 74,121
5.4% 5.0%Other income 5,054 5,664 Other expenses (12,047) (7,523)Operating profit 81,655 72,262 Finance costs (3,423) (2,744)Net investment income 31,359 29,651 Profit before income tax 109,591 99,169 Income tax expense (34,330) (29,393)Profit for the year 75,261 69,776 Profit for the year is attributable to:
Owners of nib holdings limited 75,798 69,911 Non-controlling interests (537) (135)
75,261 69,776
# Net of reinsurance
CONSOLIDATED BALANCE SHEET($000) 2015 2014
AssetsCash and cash equivalents 123,655 148,722Receivables 45,130 44,903Financial assets at fair value through P&L 457,155 410,779Deferred acquisition costs 64,128 40,028Property, plant and equipment1 53,184 47,967Intangibles 90,179 95,178Other assets 3,677 10,527Total assets 837,108 798,104LiabilitiesPayables 124,902 111,392Borrowings 63,891 66,849Outstanding claims liability 97,147 93,652Unearned premium liability 143,228 114,202Premium payback liability 40,888 40,750Other liabilities 22,789 14,891Total liabilities 492,845 441,736Net assets 344,263 356,368EquityContributed equity 28,001 27,189Retained profits 307,038 320,132Reserves 9,815 9,101Equity 344,854 356,422Non-controlling interests (591) (54)Total Equity 344,263 356,368
1. Includes Assets classified as held for sale.

2015 Shareholder Review 23
CONSOLIDATED STATEMENT OF CASH FLOWS($000) 2015 2014
Cash flows from operating activities
Receipts from policyholders and customers (inclusive of goods and services tax) 1,696,350 1,541,868
Payments to policyholders and customers (1,351,374) (1,238,389)
Payments to suppliers and employees (inclusive of goods and services tax) (224,172) (195,886)
120,804 107,593
Dividends received 217 556
Interest received 8,938 9,366
Distributions received 12,148 9,314
Transaction costs relating to acquisition of subsidiary – (104)
Interest paid (3,227) (2,688)
Income taxes paid (24,671) (30,341)
Net cash inflow from operating activities 114,209 93,696
Cash flows from investing activities
Proceeds from disposal of other financial assets at fair value through profit and loss 154,234 180,500
Payments for other financial assets at fair value through profit and loss (199,028) (221,180)
Proceeds from sale of investment properties – 10,000
Proceeds from sale of available-for-sale financial assets 6,882 –
Proceeds from sale of property, plant and equipment and intangibles 36 5
Payments for property, plant and equipment and intangibles (10,982) (11,241)
Payment for acquisition of subsidiary, net of cash acquired – (84)
Net cash inflow (outflow) from investing activities (48,858) (42,000)
Cash flows from financing activities
Repayment of borrowings – (550)
Shares acquired by the nib Holdings Ltd Share Ownership Plan Trust (137) (837)
Transactions with non-controlling interests – 81
Dividends paid to the company's shareholders (88,892) (44,991)
Net cash inflow (outflow) from financing activities (89,029) (46,297)
Net increase (decrease) in cash and cash equivalents (23,678) 5,399
Cash and cash equivalents at beginning of the year 146,954 139,756
Effects of exchange rate changes on cash and cash equivalents (1,011) 1,799
Cash and cash equivalents at the end of the year 122,265 146,954
Reconciliation to Consolidated Balance Sheet
Cash and cash equivalents 123,655 148,722
Borrowings – overdraft (1,390) (1,768)
122,265 146,954
DISCLAIMER: These financial summaries are an edited extract from the nib 2015 Annual Report and are provided for illustrative purposes only. Complete audited financial statements, including all explanatory notes, are contained in the nib 2015 Annual Report, available at nib.com.au/shareholders.

24 nib holdings limited
FIVE-YEAR PERFORMANCE SUMMARY($m) 2015 2014 2013 2012 2011
Consolidated Income Statement
Net premium revenue# 1,634.9 1,491.6 1,290.4 1,123.8 1,007.8
Net claims incurred# (1,367.1) (1,255.4) (1,089.6) (949.2) (848.7)
Gross margin 267.8 236.2 200.8 174.6 159.1
Management expenses (179.2) (162.1) (127.0) (103.8) (97.6)
Underwriting result 88.6 74.1 73.8 70.7 61.5
Other income 5.1 5.7 3.1 3.6 5.8
Other expenses (12.0) (7.5) (7.6) (4.3) (7.5)
Operating profit 81.7 72.3 69.3 70.0 59.8
Net investment income 31.4 29.7 28.8 25.6 32.1
Finance costs (3.4) (2.7) (1.4) 0.0 0.0
Profit before tax 109.6 99.2 96.7 95.7 91.9
Tax (34.3) (29.4) (29.5) (28.0) (26.5)
NPAT 75.3 69.8 67.2 67.6 65.5
Consolidated balance sheet
Total assets 837.1 798.1 712.3 617.8 639.3
Equity 344.3 356.4 326.2 301.6 411.8
Debt 63.9 66.8 62.4 0.0 0.0
Share performance
Number of shares m 439.0 439.0 439.0 439.0 466.7
Weighted average number of shares – basic m 439.0 439.0 439.0 458.3 478.5
Weighted average number of shares – diluted m 439.0 439.0 439.0 458.3 478.5
Basic earnings per share cps 17.3 15.9 15.3 14.8 13.7
Diluted earnings per share cps 17.3 15.9 15.3 14.8 13.7
Share price at year end $ 3.36 3.26 2.13 1.50 1.45
Dividend per share – ordinary cps 11.50 11.00 10.00 9.25 8.00
Dividend per share – special cps 0.00 9.00 0.00 0.00 5.00
Dividend payout ratio – ordinary % 66.6% 69.2% 65.0% 60.0% 57.0%
Dividend payout ratio – combined ordinary and special % 66.6% 125.8% 65.0% 60.0% 92.7%
Other financial data
ROE % 23.1% 20.8% 21.6% 21.7% 16.5%
Operating cash flow 114.2 93.7 20.0 134.6 88.3
# Net of reinsurance
DISCLAIMER: These financial summaries are an edited extract from the nib 2015 Annual Report and are provided for illustrative purposes only. Complete audited financial statements, including all explanatory notes, are contained in the nib 2015 Annual Report, available at nib.com.au/shareholders.
2015 Shareholder Review 25
2015 ANNUAL GENERAL MEETINGThe Annual General Meeting (AGM) of nib holdings limited will be held on Wednesday 4 November 2015 at 11am (Australian Eastern Daylight Time) at the Fort Scratchley Multipurpose Centre, 1 Nobbys Road, Newcastle NSW 2300.
A webcast of this meeting will be streamed live at nib.com.au/shareholders.
Proxy forms can be lodged by post or online.
Full details of the AGM, including the Notice of Meeting, are available at nib.com.au/shareholders.
FINANCIAL CALENDAR*9 September 2015 Ex-dividend date for final
dividend
11 September 2015 Record date for final dividend
9 October 2015 Payment date for final dividend
4 November 2015 2015 Annual General Meeting
February 2016** FY16 Half Year Results Announcement
* Dates are subject to change** Date to be confirmed
CORPORATE GOVERNANCEThe nib Board and management are committed to achieving and demonstrating the highest standards of corporate governance and ensuring compliance with the ASX Corporate Governance Council’s Corporate Governance Principles and Recommendations.
As part of this process, the Group’s policies and practices are regularly reviewed to ensure that nib continues to comply with legal requirements, meet the expectations of our shareholders and other stakeholders, and best address the needs of the business. In the past 12 months, the Board has reviewed and updated the Board Charter, Risk & Reputation Committee Charter, Nomination Committee Charter, People & Remuneration Committee Charter, Code of Conduct, Corporate Social Responsibility Principles, Disclosure and Communication Policy, Disclosure and Materiality Guidelines, Trading Policy, Risk Policy, Whistleblower Policy and Diversity Policy.
Further information about nib’s Governance, copies of these Policies, Board and Committee Charters and practices are available from the Corporate Governance section of the nib shareholder website at nib.com.au/shareholders.
SHAREHOLDER COMMUNICATIONSe-Commsnib shareholders can receive the following shareholder communications electronically.
• Dividend statements• Shareholder Review• Annual Financial Report• Notice of Meeting• Proxy Forms
Switching to electronic communications is easy. Register at nib.com.au/shareholders via Manage Your Shareholding or contact our share registry on the details below.
Shareholder Website – nib.com.au/shareholders
A range of information about nib’s financial performance and shares is available on our shareholder website including:
• Dividend payments• Our share price• ASX announcements• Investor presentations• Webcasts of our results presentations• Event calendar
nib shareholders can also use the site to manage their shareholding, including updating dividend payment instructions or address details, and viewing holding statements.
Investor Relationsnib holdings limited22 Honeysuckle Drive, Newcastle NSW 2300
Locked Bag 2010Newcastle NSW 2300
Telephone – (02) 4914 1777Email – [email protected] – nib.com.au/shareholders
SHARE REGISTERComputershare Investor Services Pty LimitedLevel 3, 60 Carrington Street, Sydney NSW 2000
Telephone – 1300 664 316Fax – (02) 8235 8150Email – [email protected]
INFORMATION FOR SHAREHOLDERS
RM-15048

nib.com.au