2015 summary of m&a and investment activity in the...
TRANSCRIPT
Petsky Prunier’s Summary of 2015 M&A and Investment Activity Marketing, Media, and Technology Industries
Page | 1
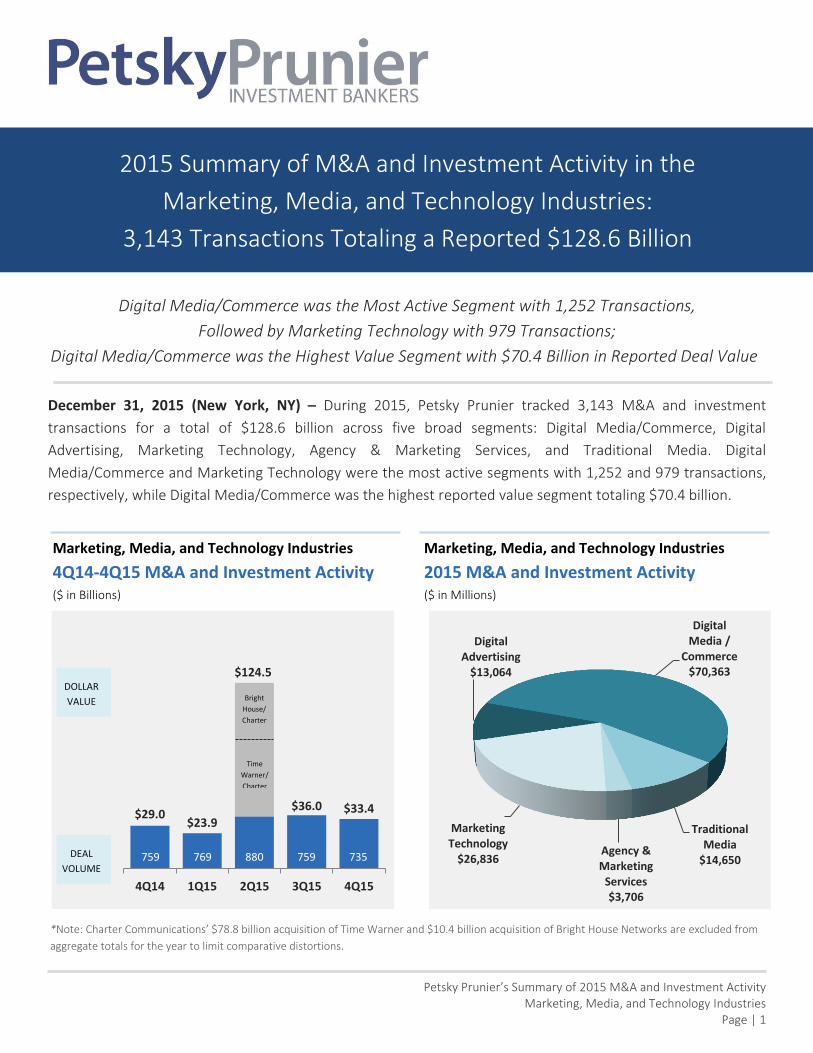
Digital Media/Commerce was the Most Active Segment with 1,252 Transactions,
Followed by Marketing Technology with 979 Transactions;
Digital Media/Commerce was the Highest Value Segment with $70.4 Billion in Reported Deal Value
December 31, 2015 (New York, NY) – During 2015, Petsky Prunier tracked 3,143 M&A and investment
transactions for a total of $128.6 billion across five broad segments: Digital Media/Commerce, Digital
Advertising, Marketing Technology, Agency & Marketing Services, and Traditional Media. Digital
Media/Commerce and Marketing Technology were the most active segments with 1,252 and 979 transactions,
respectively, while Digital Media/Commerce was the highest reported value segment totaling $70.4 billion.
2015 Summary of M&A and Investment Activity in the
Marketing, Media, and Technology Industries:
3,143 Transactions Totaling a Reported $128.6 Billion
Marketing, Media, and Technology Industries
4Q14-4Q15 M&A and Investment Activity ($ in Billions)
Marketing, Media, and Technology Industries
2015 M&A and Investment Activity ($ in Millions)
*Note: Charter Communications’ $78.8 billion acquisition of Time Warner and $10.4 billion acquisition of Bright House Networks are excluded from
aggregate totals for the year to limit comparative distortions.
$29.0 $23.9
$124.5
$36.0 $33.4
4Q14 1Q15 2Q15 3Q15 4Q15
DOLLAR
VALUE
DEAL
VOLUME
Bright
House/
Charter
Time
Warner/
Charter
759 769 880 759 735
Digital Media /
Commerce $70,363
Traditional Media
$14,650 Agency & Marketing
Services $3,706
Marketing Technology
$26,836
Digital Advertising
$13,064

Petsky Prunier’s Summary of 2015 M&A and Investment Activity Marketing, Media, and Technology Industries
Page | 2
M&A Activity
There were 1,335 majority transactions worth $73.9 billion in reported value during 2015, accounting for
42 percent of total transaction activity and 57 percent of reported value. Marketing Technology was the most
active M&A segment with 379 transactions, of which 88 were reported for $17.3 billion in value. The most
active subsegment was Analytics & Targeting with 55 acquisitions, of which 12 were worth $1.6 billion in
reported value. M&A transactions in the Marketing Technology segment announced during 2H15 included:
• Endurance International’s $1.1 billion purchase of small business marketing tools provider Constant Contact
• The $850 million acquisition of media measurement and consumer targeting company Rentrak by comScore
• Neustar’s $380 million purchase of marketing analytics tech provider MarketShare from Elevation Partners
and FTV Partners
• The acquisition of digital marketing company Fluent by IDI for approximately $225 million (a Petsky Prunier-
led transaction)
Digital Media/Commerce was the second most active M&A segment with 348 transactions, of which 86 were
reported for $31.3 billion in value. Compared with the first half of 2015, reported value in the segment was up
46 percent. The Gaming subsegment was active throughout the second half of the year with 31 acquisitions, an
82 percent increase from 1H15. Digital Media/Commerce transactions announced during 2H15 included:
• Activision Blizzard’s $5.7 billion acquisition of mobile gaming company King Digital Entertainment
• The purchase of vacation rental marketplace Homeaway by Expedia at a valuation of $3.4 billion
• The $450 million acquisition of live events ticketing company Ticketfly by music streaming company Pandora
• Axel Springer’s $343 million transaction for Business Insider, upping its ownership to 97 percent at a
reported valuation of $390 million
The Traditional Media segment reported 162 acquisitions throughout the year. Value was up 62 percent from
the first half of the year with 74 transactions, of which 26 were reported for $8.8 billion in aggregate value.
Activity in 2015 was driven by the B-to-B Media and Entertainment Media subsegments with 35 and
32 acquisitions reported, respectively. Transactions in the segment announced during 2H15 included:
• The $2.4 billion pending acquisition of Meredith by Media General
• Pearson’s $1.3 billion sale of Financial Times to Japan-based publisher Nikkei
• Gray Television’s $443 million acquisition of Schurz Communications’ radio and television station assets
• The acquisition of print and digital publisher Journal Media Group by Gannett for a reported $300 million
M&A value during 2015 in the Digital Advertising segment was bolstered by $5.8 billion in reported transactions
announced during the second half of the year, a nearly 200 percent increase compared to 1H15. The Online
Lead Generation, Mobile Marketing, and Digital Video subsegments, together, accounted for half of the
segment’s total M&A activity with 34, 29, and 27 transactions, respectively. Transactions in the segment
announced during 2H15 included:
880

Petsky Prunier’s Summary of 2015 M&A and Investment Activity Marketing, Media, and Technology Industries
Page | 3
• The $4.5 billion acquisition of YouTube-like services provider Youku Tudou by Alibaba
• AOL’s $253 million acquisition of mobile ad network Millennial Media
• Perion’s $180 million purchase of Undertone, a provider of cross-screen digital advertising solutions
Investment Activity
Minority investments in 2015 accounted for 58 percent of overall transaction volume and 43 percent of total
reported value, with 1,808 transactions worth $54.7 billion. Reported value for venture and growth capital
investments during the second half of the year was up seven percent compared with 1H15, while volume was
down six percent. Eighty-three percent of investments were made in the Digital Media/Commerce and
Marketing Technology segments, with 904 and 600 deals announced, respectively. Digital Media/Commerce
was the highest value segment during 2H15 with 438 transactions, of which 418 reported $21.5 billion in value.
Investments in the segment during 2H15 included:
• The $2.1 billion Tiger Global Management-led round of funding raised by Uber at reported pre-money
valuation exceeding $62 billion
• eCommerce start-up Jet.com’s $500 million investment led by FMR
• The $400 million raised by digital media and entertainment company Vice Media from Disney in two
separate $200 million investments
• Airbnb’s $100 million round of funding at a reported valuation of $25.5 billion, the same valuation received
after its previous $1.5 billion investment
Marketing Technology was the second most active investment segment in 2H15 with 289 transactions, of which
275 reported $4.5 billion in value. Analytics & Targeting was the most active subsegment with 67 investments,
of which 65 reported $1.1 billion in value. Compared to the first half of 2015, volume in the segment was down
seven percent while value decreased 12 percent. Investments in the Marketing Technology segment during
2H15 included:
• J.P. Morgan Asset Management’s $110 million investment in AppDirect, operator of a commerce platform
for selling cloud-based software subscriptions
• The $85 million round of funding raised by workflow and analytics platform Alteryx led by Iconiq Capital and
Insight Venture Partners
• Sales data provider Rain King Solutions’ $67 million investment from Spectrum Equity
• Lightspeed Venture Partners and Sequoia Capital’s $65 million investment in B-to-B predictive sales and
marketing platform Everstring
• The $58 million raised by website optimization platform Optimizely from Index Ventures
Investments in the Digital Advertising segment accounted for 15 percent of all minority activity during 2015. Of
the 271 investments announced, 257 were reported for $5.3 billion in value. The most active subsegments were
Vertical Search and Digital Video with 52 and 51 investments, respectively. Comparison Shopping was the
highest value subsegment with $840 million in reported investment value. Investments from the segment
during 2H15 included:

Petsky Prunier’s Summary of 2015 M&A and Investment Activity Marketing, Media, and Technology Industries
Page | 4
• Local review site Thumbtack’s $125 million round of funding led by Baillie Gifford with participation from
Tiger Global Management, Google Capital, and Sequoia Capital
• Real estate search platform Compass’ $50 million round of funding from Institutional Venture Partners,
Thrive Capital, and Advance Publications
Buyers & Investors
Strategic buyers accounted for 94 percent of all control transactions in 2015. Of the 1,260 strategic deals
announced, 288 were reported for $68.4 billion in value. Compared to 1H15, value increased 26 percent, while
strategic buyer volume was down 15 percent. Nearly 30 percent of strategic transactions in 2H15 were in the
Marketing Technology segment, while Digital Media/Commerce accounted for 25 percent of activity.
2015 Most Active Strategic Buyers by Number of Transactions
Buyer Number of Transactions
Representative Targets
16
15
12
11
9
7
6
6

Petsky Prunier’s Summary of 2015 M&A and Investment Activity Marketing, Media, and Technology Industries
Page | 5
Private equity buyout firms completed 75 acquisitions in 2015, of which 19 were reported for $5.6 billion in
value. More than half of all 2H15 PE transactions were in the Marketing Technology and Agency & Marketing
Services segments with 14 and seven deals, respectively. Buyout transactions announced in 2H15 included:
• The $615 million buyout of online digital photo services company Photobox Group by Electra Partners and
Exponent Private Equity
• Apax Partners’ acquisition of online retailing services provider RFS Holland Holdings for $500 million
2015 Most Active Investors by Number of Transactions
Investor Number of Transactions
Representative Investments
Venture and growth capital investors accounted for 1,808 transactions in 2015, of which 1,704 were reported
for $54.7 billion in value. Compared to 1H15, value was up seven percent, while investment volume was down
six percent. Sequoia Capital and New Enterprise Associates were the most active investors during 2015,
completing 57 and 44 investments, respectively.
57
44
41
27
25
22
22
18

Petsky Prunier’s Summary of 2015 M&A and Investment Activity Marketing, Media, and Technology Industries
Page | 6
IPO Activity
Match Group, Square, and Yirendai completed IPOs in the Media, Marketing, and Technology segments in the
second half of the year, with Match pricing at the low end of its range and Square pricing at a significant
discount. Apptio submitted its IPO filing in 2H15, but has yet to price.
4Q15 M&A and Investment Activity
In 4Q15, Petsky Prunier tracked 735 M&A and
investment transactions, of which 469 were
reported for a total $33.4 billion in aggregate value.
Digital Media/Commerce was the most active and
highest value segment in 4Q15, accounting for nearly
60 percent of aggregate reported deal value. The
largest M&A transaction of the quarter was
Activision Blizzard’s $5.7 billion acquisition of King
Digital. The largest fundraising in 4Q15 was Uber’s
$2.1 billion Tiger Global Management-led round at a
reported pre-money valuation of more than
$62 billion.
*All values as of 12pm ET on 12/30/15. Transaction values include only reported up-front cash payments and do
not account for any potential future performance-based compensation.
Digital Media /
Commerce $20,001
Traditional Media $2,099 Agency &
Marketing Services
$473
Marketing Technology
$4,989
Digital Advertising
$5,845
Marketing, Media, and Technology Industries 4Q15 M&A and Investment Activity ($ in Millions)

Petsky Prunier’s Summary of 2015 M&A and Investment Activity Marketing, Media, and Technology Industries
Page | 7
Quarterly M&A and Investment Activity by Segment
Most Active Digital Media/Commerce Subsegments
3Q15 4Q15 LTM 4Q15 vs 3Q15
(% Change)
Subsegment
Number of
Transactions
Reported
Value ($MM)
Number of
Transactions
Reported
Value ($MM)
Number of
Transactions
Reported
Value ($MM)
Number of
Transactions
Reported
Value
eCommerce 137 13,635 110 5,738 475 32,449 (20%) (58%)
Mobile Content/Apps 38 402 49 2,471 257 7,292 29% 514%
Classifieds/Auctions/P-to-P 43 1,337 33 5,382 160 10,728 (23%) 302%
Niche Content 24 1,133 31 458 111 2,031 29% (60%)
Gaming 30 1,650 30 4,932 112 8,035 0% 199%
Social Media/Apps 33 1,519 26 600 116 4,270 (21%) (61%)
Web Search/Portals 2 334 1 420 13 5,420 (50%) 26%
Domain Portfolio/Marketplace 1 87 0 0 7 111 (100%) (100%)
Total 308 20,098 280 20,001 1,252 70,363 (9%) 0%
Most Active Digital Advertising Subsegments
3Q15 4Q15 LTM 4Q15 vs 3Q15
(% Change)
Subsegment
Number of
Transactions
Reported
Value ($MM)
Number of
Transactions
Reported
Value ($MM)
Number of
Transactions
Reported
Value ($MM)
Number of
Transactions
Reported
Value ($MM)
Vertical Search 14 282 25 211 77 869 79% (25%)
Digital Video 18 404 20 4,600 78 6,041 11% 1,038%
Local Search 9 193 12 94 39 636 33% (51%)
Mobile Marketing 12 399 11 24 59 1,071 (8%) (94%)
Ad Networks/Exchanges 10 179 10 345 48 933 0% 92%
Digital Promotion/Coupon 9 94 10 64 34 639 11% (32%)
Online Lead Generation 14 129 9 202 63 984 (36%) 56%
Comparison Shopping 9 124 4 204 30 1,287 (56%) 64%
Email Services 2 7 4 70 12 306 100% 977%
Affiliate/CPA Network 2 0 1 28 3 28 (50%) NM
Game Advertising 0 0 1 4 3 10 NM NM
Search Marketing 4 229 0 0 6 260 (100%) (100%)
Total 103 2,040 107 5,845 452 13,064 4% 187%
Most Active Marketing Technology Subsegments
3Q15 4Q15 LTM 4Q15 vs 3Q15
(% Change)
Subsegment
Number of
Transactions
Reported
Value ($MM)
Number of
Transactions
Reported
Value ($MM)
Number of
Transactions
Reported
Value ($MM)
Number of
Transactions
Reported
Value ($MM)
Analytics & Targeting 43 451 46 1,253 207 3,922 7% 178%
Social Technology 16 128 23 122 58 439 44% (5%)
Commerce Management 18 1,011 18 181 70 2,584 0% (82%)
Content Management 37 876 18 176 129 2,480 (51%) (80%)
CRM 25 572 18 189 74 5,346 (28%) (67%)
Mobile Technology 19 297 14 140 85 1,837 (26%) (53%)
SFA/Lead Management 10 97 13 545 46 919 30% 461%
BI Tools 8 922 11 249 50 2,842 38% (73%)
MRM/Workflow Management 9 147 11 51 43 1,205 22% (66%)
Subtotal 185 4,500 172 2,906 762 21,576 (7%) (35%)
Other 50 1,378 60 2,083 217 5,261 20% 51%
Total 235 5,878 232 4,989 979 26,836 (1%) (15%)

Petsky Prunier’s Summary of 2015 M&A and Investment Activity Marketing, Media, and Technology Industries
Page | 8
About Petsky Prunier LLC
Petsky Prunier (www.petskyprunier.com) is one of the leading investment banks in the technology, media, marketing, eCommerce,
and healthcare industries. Our firm's merger and acquisition and private placement advisory services reflect a unique blend of product
specialization and industry expertise. Together with strategic consulting firm Winterberry Group, a Petsky Prunier company, our
organization represents one of the largest industry-specific advisors providing strategic and transactional services. We offer
international reach through our partnerships with investment bank Altium in Europe, as well as China-based The Mountain Capital
Group. In India, Petsky Prunier works with Allegro Advisors and o3 Capital. Securities transactions are processed through Petsky
Prunier Securities LLC, a member of FINRA and an affiliated entity.
For press inquiries, please contact Danielle Lindsay at 212.842.6029 or [email protected].
3Q15 4Q15 LTM 4Q15 vs 3Q15
(% Change)
Subsegment
Number of
Transactions
Reported
Value ($MM)
Number of
Transactions
Reported
Value ($MM)
Number of
Transactions
Reported
Value ($MM)
Number of
Transactions
Reported
Value ($MM)
Digital Agency 34 87 30 70 128 315 (12%) (20%)
Public Relations 13 16 8 0 36 43 (38%) (100%)
Experiential Marketing 2 0 6 0 12 0 200% NM
Healthcare Agency 5 21 5 0 21 206 0% (100%)
Media Planning/Buying 0 0 5 0 5 0 NM NM
Marketing Consulting 4 64 4 37 11 107 0% (42%)
B-to-B Agency 2 0 2 0 4 0 0% NM
Design Agency 3 385 2 0 5 385 (33%) (100%)
General Agency 3 654 2 313 11 966 (33%) (52%)
Loyalty/Retention 3 28 2 17 11 203 (33%) (38%)
Subtotal 69 1,254 66 437 244 2,225 (4%) (65%)
Other 8 10 6 37 45 1,481 (25%) 274%
Total 77 1,264 72 473 289 3,706 (6%) (63%)
3Q15 4Q15 LTM 4Q15 vs 3Q15
(% Change)
Subsegment
Number of
Transactions
Reported
Value ($MM)
Number of
Transactions
Reported
Value ($MM)
Number of
Transactions
Reported
Value ($MM)
Number of
Transactions
Reported
Value ($MM)
Entertainment Media 6 741 13 221 37 1,985 117% (70%)
B-to-B Media 7 23 9 50 36 441 29% 118%
Consumer Magazine Publishing 4 725 5 54 22 788 25% (93%)
Newspaper Publishing 3 4,387 5 930 15 5,645 67% (79%)
Broadcast Television 2 443 4 785 18 3,757 100% 77%
Traditional Outdoor 3 4 4 33 12 37 33% 656%
Consumer Book Publishing 3 0 2 27 16 880 (33%) NM
Radio 4 436 2 0 6 436 (50%) (100%)
Subtotal 32 6,759 44 2,099 162 13,968 38% (69%)
Other 4 0 0 0 9 682 (100%) NM
Total 36 6,759 44 2,099 171 14,650 22% (69%)
Most Active Agency & Marketing Services Subsegments
Most Active Traditional Media Subsegments