2015 western australia air monitoring report
TRANSCRIPT

PAPER
1
2015 Western Australia Air Monitoring Report Written to comply with the National Environment Protection (Ambient Air Quality) Measure
Version: Final
August 2016
REPORT

Department of Environment Regulation
i 2015 Western Australia Air Monitoring Report (August 2016)
Document control
Document version history
Date Author Version Approved by
19/8/16 Arthur Grieco Manager, Air Quality
Final Jason Banks, Director General
17/05/16 As above Draft Kerry Laszig Director, Environmental Sciences
Corporate file information
File number and/or name File owner or custodian File location
DER2014/001782 Arthur Grieco Manager, Air Quality
Booragoon

Department of Environment Regulation
ii 2015 Western Australia Air Monitoring Report (August 2016)
Produced and published by
Department of Environment Regulation 168 St Georges Terrace, Perth, Western Australia
August 2016
Copyright © State of Western Australia 2014
All material is the copyright of the State of Western Australia. Permission is not given for any commercial use or sale of this material. No part of the contents of the publication may be reproduced by any process, electronic or otherwise, distributed, adapted, broadcast, performed in public or communicated to the public without the written consent of Department of Environment Regulation, except as permitted under the Copyright Act 1968.
Disclaimer The information contained in this document is provided by Department of Environment Regulation in good faith. However, there is no guarantee of the accuracy of the information contained in this document and it is the responsibility of users to make their own enquiries as to its accuracy, currency, relevance and correctness.
The State of Western Australia and Department of Environment Regulation and their servants and agents expressly disclaim liability, in negligence or otherwise, for any act or omission occurring in reliance on the information contained in this document, or for any incident or consequential loss or damage of such act or omission.
The State of Western Australian is committed to providing quality information and has made every attempt to ensure the accuracy, currency, reliability and correctness of the information contained in this document. However, changes in circumstances and legislation after the time of publication may impact on the correctness or quality of this information.
In addition the accuracy, currency, reliability and correctness of links or references to information sources referred to or provided by third parties is outside the control of State of Western Australia and it is therefore the responsibility of the user to make their own decisions on information found on those external sites. Confirmation of any of the information provided in this document may be sought from the relevant originating bodies or the department providing the information; however, users of this material should verify all relevant representations, statements and information with their own professional advisers.
The State of Western Australia and Department of Environment Regulation reserve the right to amend the content of this document at any time without notice.
The information contained in this document is general. It does not constitute, and should be not relied on as, legal advice. The State of Western Australia recommends that users of this information seek advice from a qualified lawyer on the legal issues affecting them before relying on this information or acting on any legal matter.
Questions regarding this report should be directed to: Department of Environment Regulation Locked Bag 33 Cloisters Square PERTH WA 6850 Phone: +61 8 6467 5000 Fax: +61 8 6467 5562 Email: [email protected] Web: www.der.wa.gov.au Accessibility: This document is available in alternative formats and languages upon request.

Department of Environment Regulation
iii 2015 Western Australia Air Monitoring Report (August 2016)
Contents
Executive Summary .................................................................................................... 1
Section A – Monitoring summary .............................................................................. 2
Current monitoring stations ............................................................................................... 2
Carbon monoxide ............................................................................................................ 11
Photochemical oxidants as ozone ................................................................................... 11
Nitrogen dioxide .............................................................................................................. 12
Sulfur dioxide .................................................................................................................. 13
Lead ................................................................................................................................ 14
Particles as PM10 ............................................................................................................. 14
Particles as PM2.5 ............................................................................................................ 15
Variations to the NEPM ................................................................................................... 16
Exceedence Summary .................................................................................................... 17
Section B – Assessment of compliance with standards and goals ...................... 19
Section C – Analysis of air quality monitoring ....................................................... 22
Carbon monoxide ............................................................................................................ 22
Nitrogen dioxide .............................................................................................................. 23
Photochemical smog as ozone ........................................................................................ 24
Sulfur dioxide .................................................................................................................. 26
Particles as PM10 ............................................................................................................. 28
Particles as PM2.5 ............................................................................................................ 30
Section D – Data analysis ......................................................................................... 32
Maxima and percentiles by pollutant in 2015 ................................................................... 32
Maxima and percentiles by site 2006–2015 ..................................................................... 36
Maxima by pollutant 2006–2015 ...................................................................................... 50
Attachment 1 – Graphical trends ............................................................................. 55
Carbon monoxide ............................................................................................................ 56
Nitrogen dioxide .............................................................................................................. 57
Ozone ............................................................................................................................. 61
Sulfur dioxide .................................................................................................................. 67
Particles as PM10 ............................................................................................................. 70
Particles as PM2.5 ............................................................................................................ 74

Department of Environment Regulation
iv 2015 Western Australia Air Monitoring Report (August 2016)
Attachment 2 – Exceedence summary .................................................................... 77
9 January 2015 ............................................................................................................... 78
3 February 2015 .............................................................................................................. 79
6 February 2015 .............................................................................................................. 80
7 February 2015 .............................................................................................................. 81
8 February 2015 .............................................................................................................. 82
9 February 2015 .............................................................................................................. 83
10 February 2015 ............................................................................................................ 84
23 February 2015 ............................................................................................................ 85
24 February 2015 ............................................................................................................ 86
22 April 2015 ................................................................................................................... 87
10 May 2015 ................................................................................................................... 88
11 May 2015 ................................................................................................................... 89
14 May 2015 ................................................................................................................... 90
26 September 2015 ......................................................................................................... 91
8 October 2015 ............................................................................................................... 92
9 October 2015 ............................................................................................................... 93
10 October 2015 ............................................................................................................. 94
11 October 2015 ............................................................................................................. 95
13 October 2015 ............................................................................................................. 96
28 October 2015 ............................................................................................................. 97
4–5 November 2015 ........................................................................................................ 98
12 November 2015 .......................................................................................................... 99
13–14 November 2015 .................................................................................................. 100
22 November 2015 ........................................................................................................ 101
23 November 2015 ........................................................................................................ 102
27–28 November 2015 .................................................................................................. 103
3 December 2015 .......................................................................................................... 104

1
Department of Environment Regulation
2015 Western Australia Air Monitoring Report (August 2016)
Executive Summary
As signatory to the National Environment Protection (Ambient Air Quality) Measure (AAQ NEPM), Western Australia is required to report annually on results of air monitoring.
The Department of Environment Regulation (DER) is responsible for the operation and maintenance of 13 air quality monitoring sites in Western Australia with a total capital cost of $1.5M. Eight of these sites — Caversham (Ca), Duncraig (Du), Quinns Rocks (QR), Rolling Green (RG), Rockingham (Ro), South Lake (SL), Swanbourne (Sw) and Wattleup (Wt) — are within the Perth Metropolitan Region and the remaining five are located in Albany (Al), Bunbury (Bn), Busselton (Bs), Collie (Co) and Geraldton (Ge).
During 2015 the AAQ NEPM goal was not met for PM10 particles at Duncraig, due to one exceedence caused by local heavy machinery operations, and at Geraldton on two occasions due to unknown causes.
Across all monitoring sites there was a total of 55 exceedences in 2015, comprising four of ozone, 23 of PM10 (including 20 exceptional events) and 28 of PM2.5, (all due to exceptional events).
Of the 48 particle exceedences that were classed as exceptional events and therefore not included in the NEPM goal assessment, 24 were due to bushfires and 24 were due to prescribed burning activities.
The PM2.5 goal of no exceedences other than those caused by exceptional events was met.
The ozone, nitrogen dioxide and sulfur dioxide goal of no more than one exceedence was met.

2
Department of Environment Regulation
2015 Western Australia Air Monitoring Report (August 2016)
Section A – Monitoring summary
Current monitoring stations
The Department of Environment Regulation (DER) monitoring network shown in Figure A1 was the subject of careful design for the purposes of the Perth Photochemical Smog Study, the Perth Haze Study and the management of sulfur dioxide in the Kwinana area.
The network’s design was based on the knowledge of emissions sources, pollutant chemistry and important features of the meteorology.
Commonwealth Scientific and Industrial Research Organisation (CSIRO) Atmospheric Research provided advice on monitoring site locations for the Perth Photochemical Smog Study and Perth Haze Study.
The Bunbury station shown in Figure A2 was established in the south-west of the state to monitor fuel reduction burns, and stations in Busselton and Collie were also in operation for that purpose.
The Geraldton station shown in Figure A3 was established in the mid-west of the state to monitor windblown crustal material and smoke from bushfires, hazard reduction or stubble burning and possibly wood-fired home heaters. A particle monitoring station was also established in Albany (Figure A4). Table A1 indicates the pollutants monitored at each site.
Figure A1: DER air quality monitoring stations operating in the Perth Metropolitan Region.

3
Department of Environment Regulation
2015 Western Australia Air Monitoring Report (August 2016)
Figure A2: DER air quality monitoring stations operating in Bunbury, Busselton and Collie.
Figure A3: DER air quality monitoring station operating in Geraldton.

4
Department of Environment Regulation
2015 Western Australia Air Monitoring Report (August 2016)
Figure A4: DER air quality monitoring station operating in Albany.

5
Department of Environment Regulation
2015 Western Australia Air Monitoring Report (August 2016)
Table A1: Air quality parameters measured at DER monitoring stations.
Monitoring site CO O3 NO2 SO2 PM10
TEOM
PM2.5
TEOM
AL Albany
07/06 to present
BN Bunbury
06/99 to present
04/97 to present
BS Busselton
11/06 to present
CA Caversham
08/93 to present
11/89 to present
09/90 to present
01/04 to present
03/94 to present
CO Collie
02/08 to present
DU Duncraig
08/95 to present
08/95 to present
06/96 to present
01/95 to present
GE Geraldton
09/05 to present
QR Quinns Rock
11/92 to present
11/92 to present
07/06 to present
RO Rockingham
12/95 to present
12/95 to present
07/88 to present
RG Rolling Green
01/93 to present
01/93 to present
SL South Lake
03/00 to present
03/00 to present
03/00 to present
03/00 to present
03/00 to present
04/06 to present
SW Swanbourne
01/93 to present
03/93 to present
WT Wattleup
01/88 to present
DER has from time to time performed campaign monitoring for various projects. While these short-term projects are not reported within this document, detailed reports and/or data can be obtained from www.der.wa.gov.au, by emailing [email protected] or telephoning (08) 6467 5000.

6
Department of Environment Regulation
2015 Western Australia Air Monitoring Report (August 2016)
Table A2: Methods used to monitor air quality at DER monitoring stations.
Pollutant Standard Method
Carbon monoxide AS/NZS 3580.7.1 2011 – Methods for sampling and analysis of ambient air – Determination of carbon monoxide – Direct-reading instrumental method
Gas filter correlation spectrophotometry
Ozone AS 3580.6.1 2011 – Methods for sampling and analysis of ambient air – Determination of ozone – Direct-reading instrumental method
Ultraviolet absorption
Nitrogen dioxide AS 3580.5.1 2011 – Methods for sampling and analysis of ambient air – Determination of oxides of nitrogen – Chemiluminescence method
Chemiluminescence
Sulfur dioxide AS 3580.4.1 2008 – Methods for sampling and analysis of ambient air – Determination of sulfur dioxide – Direct-reading instrumental method
Ultraviolet fluorescence
Particles as PM10 AS 3580.9.8 2008 – Methods for sampling and analysis of ambient air – Determination of suspended particulate matter – PM10 continuous direct mass method using a tapered element oscillating microbalance analyser
Tapered element oscillating microbalance
1
Particles as PM2.5 AS/NZS 3580.9.13 2013 – Methods for sampling and analysis of ambient air – Determination of suspended particulate matter – PM2.5 continuous direct mass method using a tapered element oscillating microbalance analyser
Tapered element oscillating microbalance
1
1: TEOMs within the DER network are not fitted with filter dynamic measurement systems (FDMS).

7
Department of Environment Regulation
2015 Western Australia Air Monitoring Report (August 2016)
Table A3: Monitoring in Western Australia.
Site CO O3 NO2 SO2 PM10 PM2.5
AL – Albany P/T
BN – Bunbury P/T P/T
BS – Busselton DER
CA – Caversham DER P/T P/T P/T P/T
CO - Collie DER
DU - Duncraig P/T DER P/T P/T
GE – Geraldton P/T
QR - Quinns Rocks DER DER DER
RG - Rolling Green DER DER
RO - Rockingham DER DER DER
SL - South Lake P/T P/T P/T P P/T P/T
SW - Swanbourne P/T P/T
WT - Wattleup DER
Key to symbols:
P Performance monitoring station T Trend performance monitoring station DER Instrument will be maintained by DER for the foreseeable future
Table A4: Standards for pollutants
Pollutant Averaging period
Maximum concentration standard
Maximum allowable exceedences (goals)
Carbon monoxide 8 hours 9.0 ppm 1 day a year
Nitrogen dioxide 1 hour 1 year
0.12 ppm 0.03 ppm
1 day a year None
Photochemical oxidants (as ozone) 1 hour 4 hours
0.10 ppm 0.08 ppm
1 day a year 1 day a year
Sulfur dioxide 1 hour 1 day 1 year
0.20 ppm 0.08 ppm 0.02 ppm
1 day a year 1 day a year None
Lead 1 year 0.05 µg/m3 None
Particles as PM10 1 day 1 year
50 µg/m3
25 µg/m3
None None
Particles as PM2.5 1 day 1 year
25 µg/m3
8 µg/m3
None None

8
Department of Environment Regulation
2015 Western Australia Air Monitoring Report (August 2016)
Table A5: Monitoring site description
Site Description
AL – Albany Large rural town located 380 kilometres south south-west of Perth with moderate density housing and typical local traffic flows.
BN – Bunbury Large rural town located 145 kilometres south of Perth with moderate density housing and typical local traffic flows.
BS – Busselton Small rural town located 185 kilometres south of Perth with moderate density housing and typical local traffic flows.
CA – Caversham Semi-rural north-east metropolitan suburb located in the Swan Valley – a grape growing region next to the Perth foothills – 14 kilometres north-east of the Perth CBD. The region mainly comprises low density housing and paddocks. Some brick manufacturing occurs in the region.
CO – Collie Small rural town located within a forested region 152 kilometres south of Perth with moderate density housing and typical traffic flows. Coal mining and power generation industries are located within the region.
DU – Duncraig North metropolitan suburb located 16 kilometres north north-west of the Perth CBD with moderate/high density housing and moderate to high traffic flow. The site is located 200 metres west of the Mitchell freeway, a main north-south arterial road carrying approximately 98,000 vehicles daily.
GE – Geraldton Large rural town located 377 kilometres north of Perth in the mid-west with moderate density housing and typical traffic flows.
QR – Quinns Rocks Outer north coastal suburb located 35 kilometres north of Perth with moderate density housing and typical local traffic flows
RG – Rolling Green Outer east rural suburb located 56 kilometres north-east of Perth with low density rural housing and low traffic flows. The closest road is 80 metres east of the site supporting a traffic flow of 3,200 vehicles per day.
RO – Rockingham A south coastal site located 35 kilometres south of Perth with moderate density housing and typical traffic flows and adjacent to the southern border of the Kwinana Industrial Area. A major arterial road carrying 34,700 vehicles per day runs 1km east of the site.
SL – South Lake South east metropolitan site located 17 kilometres south of Perth with moderate/high density housing and moderate to high traffic flow. The site is located 1.6 kilometres west of the Kwinana freeway, a main north-south arterial road carrying approximately 87,000 vehicles daily and is 4 kilometres north-east of the northern border of the Kwinana industrial area.
SW – Swanbourne An inner coastal site located on coastal sand dunes 9 kilometres west of the Perth CBD, and 150 metres west of a major north-south arterial road carrying approximately 27,200 per day.
WT – Wattleup A south metro site located 25 kilometres south of Perth within a defined buffer area for the Kwinana Industrial Area. Surrounding land uses are retail outlets and market gardens.

9
Department of Environment Regulation
2015 Western Australia Air Monitoring Report (August 2016)
Table A6: Screening procedures used to demonstrate whether pollutants are consistently below standards.
Screening procedures
A. Campaign monitoring at a Generally Representative Upper Bound (GRUB) monitoring location (with no significant deterioration expected over 5–10 years).
B. Use of historical data within a region which will contain one or more GRUB monitoring stations to demonstrate that the full number of stations is not required, either to detect exceedences or gain a more representative depiction of pollutant distribution.
C. Use of modelling within a region which will contain one or more GRUB monitoring stations to demonstrate that the full number of stations is not required, either to detect exceedences or gain a more representative depiction of pollutant distribution.
D. In a region with no performance monitoring, use of validated (1) modelling with detailed and reliable estimates of emissions and meteorological data.
E. In a region with no performance monitoring, and in the absence of emissions and detailed meteorological data, use of generic model results based on gross emissions estimates, ‘worst case’ meteorology estimates and other conservative assumptions.
F. In a region with no performance monitoring, comparison with a NEPM compliant region with greater population, emissions and pollution potential.
P. Performance monitoring.
T. Trend monitoring.
M. Campaign monitoring.
Table A7: Screening procedures satisfied at each station.
Site Pop’na CO O3 NO2 SO2 Pb PM10
Perth and Rockingham
1,740,000 B&C A
Mandurahb 69,000 P P P F F P
Albany 31,000 F F F F F
Bunbury 65,000 A&F E&F E&F D&F F
Kalgoorlie–Boulder
c
31,000 M E&F E&F T F P
Geraldton 36,000 F E&F E&F D&F F
Grey shaded cells represent Performance, Trend or Campaign sites where monitoring is currently underway.
a – 2011 data (www.abs.gov.au)
b – Mandurah station has yet to be established
c – Kalgoorlie station has yet to be established
Details of screening procedures are given in the monitoring plan available at
http://www.scew.gov.au/files/resources/9947318f-af8c-0b24-d928-04e4d3a4b25c/files/aaqprctp04screeningprocedures200705final.pdf
10
Department of Environment Regulation
2015 Western Australia Air Monitoring Report (August 2016)
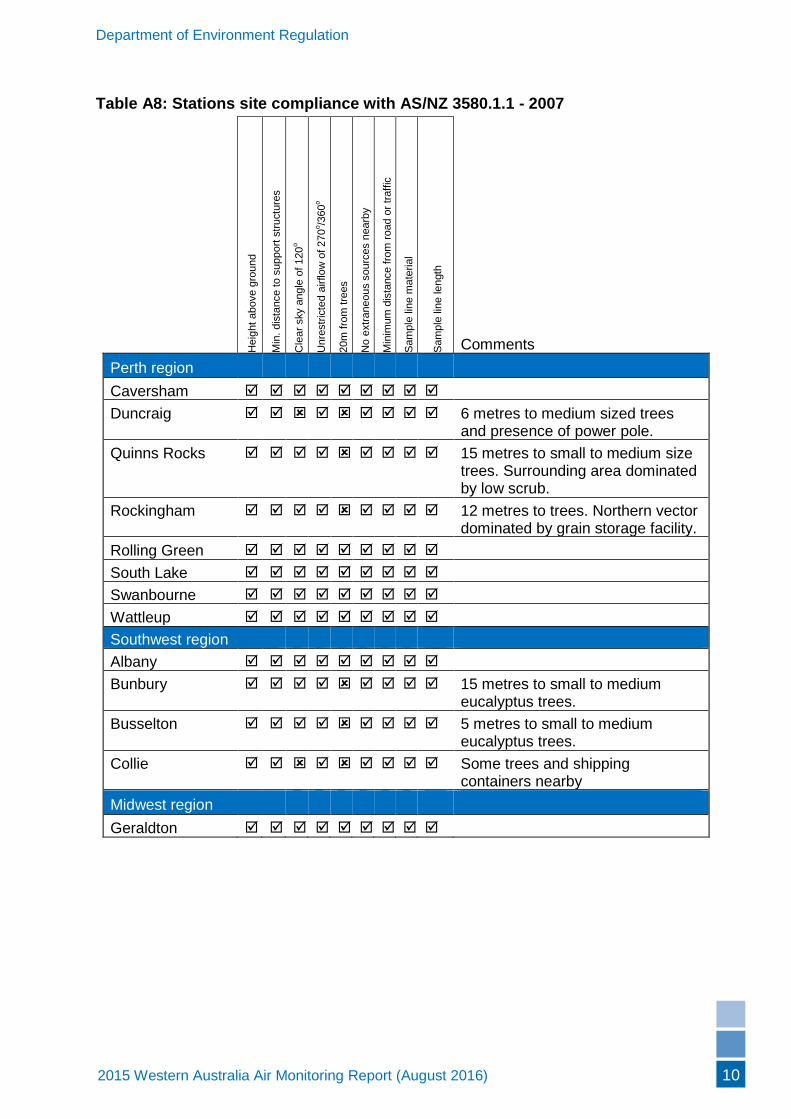
Table A8: Stations site compliance with AS/NZ 3580.1.1 - 2007 H
eig
ht
above g
round
Min
. dis
tance t
o s
upport
str
uctu
res
Cle
ar
sky a
ngle
of 120
o
Unre
str
icte
d a
irflo
w o
f 270
o/3
60
o
20m
fro
m t
rees
No e
xtr
aneous s
ourc
es n
earb
y
Min
imum
dis
tance fro
m r
oad o
r tr
aff
ic
Sam
ple
lin
e m
ate
ria
l
Sam
ple
lin
e le
ngth
Comments
Perth region
Caversham
Duncraig 6 metres to medium sized trees and presence of power pole.
Quinns Rocks 15 metres to small to medium size trees. Surrounding area dominated by low scrub.
Rockingham 12 metres to trees. Northern vector dominated by grain storage facility.
Rolling Green
South Lake
Swanbourne
Wattleup
Southwest region
Albany
Bunbury 15 metres to small to medium eucalyptus trees.
Busselton 5 metres to small to medium eucalyptus trees.
Collie Some trees and shipping containers nearby
Midwest region
Geraldton

11
Department of Environment Regulation
2015 Western Australia Air Monitoring Report (August 2016)
Carbon monoxide
Duncraig monitoring station is an upper bound site for monitoring the combined effects of emissions from vehicles on the nearby Mitchell Freeway, and from domestic wood fires.
The site is located approximately 200 metres west of the Mitchell freeway, so it is well beyond the distance of roadside measurement. By Perth’s standards the site is representative of dense population, and lies in a dunal depression through which the freeway passes, hence the effect of stable air pooling in the depression is likely to lead to elevated concentrations. This feature would be found in many other places across the coastal plain.
South Lake monitoring station lies in a growing urban area and is likely to see moderate levels of CO from wood fires in particular. It is not as close to major roads as the Duncraig site, and is therefore more typical of a population-average site.
Caversham monitoring station is located in a region of low population density and is therefore not considered a performance monitoring station.
In summary, WA maintained performance monitoring of CO at nominated trend stations of Duncraig and South Lake.
Trend analysis for each of these sites shows that overall the maximum of the eight-hourly averages at each site have consistently declined between 0.1 and 0.03 ppm per year as shown in Figure A5.
Figure A5: Smoothed trend (dark lines) for CO at Duncraig(left), South Lake (centre) and Caversham (right).
Photochemical oxidants as ozone
Statistics for the coastal sites of Quinns Rocks, Swanbourne and Rockingham indicate there is little difference between each station over the long-term. Swanbourne was selected as a performance monitoring station, while monitoring stations at Quinns Rocks and at or near Rockingham were maintained to provide additional information on ozone events.
Given its location, there is reason to be confident that Caversham monitoring station represents an upper bound, middle distance, inland site. Accordingly, Caversham was selected as a performance monitoring station site.
A third performance monitoring station was located at South Lake. It has the following desirable attributes:
• it provides spatial spread of stations (it will measure ozone returning on shore in the southern part of the metropolitan area);
• it is a moderate distance inland in a growing urban area, hence it is well classed as a population average station; and

12
Department of Environment Regulation
2015 Western Australia Air Monitoring Report (August 2016)
• it may occasionally detect the interactions of O3-rich air with the NOx-rich plumes from Kwinana industry (potentially giving elevated NO2 concentrations).
Caversham, Swanbourne and South Lake sites are all nominated as trend stations.
DER will continue to maintain the stations at Rockingham, Quinns Rocks and Rolling Green as part of its wider ozone network to enable a better understanding of ozone events.
Long-term analysis is presented in Figure A6. The number of periods when the one hour ozone concentration exceeded the long-term average at Swanbourne has increased for every five year period with the ratio climbing from 0.46 in 1996–00 to 0.54 in 2011–15.
Figure A6: Ratio of the number of hourly averaged ozone concentrations at Quinns Rocks, Swanbourne and Rockingham (top panel) and South Lake, Caversham and Rolling Green (lower panel) that was higher (red) or equal to or lower (blue) than the 20 year average concentration for that site.
A similar pattern is evident at the two other coastal sites of Quinns Rocks and Rockingham. The inland sites of Caversham and Rolling Green have a less distinct pattern. South Lake commenced in February 2000 and therefore cannot be directly compared with the others, but is shown in the figure for completeness.
Nitrogen dioxide
Owing to the close chemical reactivity relationship, NO2 is currently being monitored at all stations where O3 is monitored. Caversham, Swanbourne and South Lake sites were chosen as performance monitoring stations for NO2 as they provided a good spatial distribution.
Caversham, Swanbourne and South Lake sites are also trend stations.
DER will continue to measure NO2 at Quinns Rocks, Rolling Green and Duncraig as part of its wider network to enable a better understanding of photochemical smog formation.

13
Department of Environment Regulation
2015 Western Australia Air Monitoring Report (August 2016)
Figure A7 demonstrates how NOX (NO + NO2) monthly means have decreased at all sites. The median of the daily one hour NO maximum has also seen a general decrease over time with Duncraig experiencing an average of 1.9 ppb per annum decrease since 1996.
A possible unintended result of these decreasing concentrations of oxides of nitrogen is the inability to fully suppress ozone formation by (typically) producing NO2 (NO + O3 → NO2 + O2). The general build-up in O3 therefore commences earlier (and therefore closer to populated areas) than it otherwise would.
Figure A7: Smoothed trend (dark lines) at Quinns Rocks, Swanbourne and Rockingham (top panel) and South Lake, Caversham and Rolling Green (lower panel) using the monthly mean concentration of NOX (green) and O3 (violet).
Sulfur dioxide
DER operates one performance monitoring station at South Lake for sulfur dioxide, while maintaining a source management network which includes Wattleup and Rockingham monitoring stations.
South Lake site is an upper bound performance monitoring station for sulfur dioxide, and a trend station. South Lake is near the southern extent of the main urban population and downwind of Kwinana in sea breeze conditions.
Heavy industries in Kwinana are the only significant sources of sulfur dioxide in the Perth/Kwinana/Rockingham region. Concentrations of sulfur dioxide have reduced markedly since the late 1970’s due to the conversion from high to low sulfur fuels and the installation of sulfur dioxide control technologies. Emissions are controlled through conditions of licences issued by the department under Part V of the Environmental Protection Act 1986 in concert with the Environmental Protection (Kwinana) (Atmospheric Wastes) Policy 1999 (EPP), to ensure ambient concentrations do not exceed ambient standards set in the EPP.

14
Department of Environment Regulation
2015 Western Australia Air Monitoring Report (August 2016)
Figure A8: Trend line for maximum hourly averaged sulfur dioxide concentration at Wattleup, located within the Kwinana Industrial Buffer.
Lead
Since 1995, lead levels within the Perth CBD have been below 60 per cent of the 0.5 μg/m3 annual NEPM standard. In 2001, the average lead level in Perth was 0.022 μg/m3, less than 5 per cent of the NEPM standard.
In accordance with National Environment Protection (Ambient Air Quality) Measure Technical Paper No. 4, Screening Procedures, and the WA Monitoring Plan, a performance monitoring station for lead has not been maintained since 2001.
Figure A9: Trend line for annual moving averaged lead concentration within the Perth CBD.
Particles as PM10
Duncraig site is an upper-bound performance monitoring station site for PM10. High levels of PM10 here are caused by a combination of vehicle and domestic wood heater emissions during strongly stable meteorological conditions.
Likewise, the site at South Lake measures significant PM10 concentrations arising from wood fires.
Duncraig and South Lake sites are both nominated as trend stations.
Campaign monitoring stations were established at Geraldton in September 2005, Albany in July 2006 and Collie in February 2008.

15
Department of Environment Regulation
2015 Western Australia Air Monitoring Report (August 2016)
All Tapered Element Oscillating Microbalances (TEOMs) used by DER are operated continuously and unadjusted for temperature. All TEOM data presented in this report has the manufacturer’s recommended equivalency factor of 1.03x + 3.00 applied.
A frequency distribution, such as that shown in Figure 10, can indicate how the ratio of PM2.5:PM10 differs over three metropolitan sites and also provide some information as to the source of the pollutant. A high ratio of PM2.5:PM10 indicates a high proportion of smaller particles and is generally caused by particles originating from smoke or fumes, while a lower ratio of PM2.5:PM10 may indicate anthropogenic dust or crustal materials.
The lower (blue) plots in Figure A10 represent periods where the one hour averaged PM10 exceeded an arbitrary concentration of 50 µg/m3. This cut-off was chosen to limit the analysis to those at the higher end of the spectrum. Whereas Duncraig exhibits a higher number of high-ratio events, both Caversham and South Lake display a higher number of low-ratio events. These differences can be explained based on the site locations.
Figure A10: Frequency distribution of PM2.5:PM10 ratios of hourly averages at Duncraig (left), South Lake (centre) and Caversham (right) since installation using all data (top) and data where PM10 was greater than or equal to 50 µg/m3 (bottom).
Duncraig is located 3.5 km from the coast within a moderate/high density housing area with no industry close by and will therefore be predominantly influenced by vehicles, sea salt and smoke from the occasional bush fire. One would therefore expect to see a larger proportion of high PM2.5:PM10 ratio. Caversham is in a semi-rural setting north-east of Perth CBD and has a number of vine yards and some brick manufacturing close by. These two industries combine to more likely produce coarse fraction particles. South Lake is also located within a moderate/high density housing area and is close to the Kwinana Industrial Area and a cement manufacturing plant, providing more opportunity to be influenced by lower PM2.5:PM10 ratios.
Particles as PM2.5
To make assessments against the NEPM standard, four PM2.5 TEOMs were installed in the greater Perth Metropolitan Area at Quinns Rocks, Caversham, Duncraig and South Lake and one each in Bunbury and Busselton. All will remain in use at these locations indefinitely with the intention of developing trend data.
All Tapered Element Oscillating Microbalances (TEOMs) used by DER are operated continuously (unadjusted for temperature).

16
Department of Environment Regulation
2015 Western Australia Air Monitoring Report (August 2016)
All TEOM data presented in this report has the manufacturer’s recommended equivalency factor of 1.03x + 3.00 applied.
Variations to the NEPM
In February 2016, the AAQ NEPM was varied to, among other things:
provide for a PM10 annual standard of 25 µg/m3;
create two standards for PM2.5 of 25 µg/m3 averaged over 24 hours and 8 µg/m3 averaged over one year;
remove the five allowable exceedences for PM10 one day average standards when determining compliance with the NEPM goal; and
allow for exceptional events when determining compliance for one day PM10 and PM2.5 with the NEPM goal. An exceptional event means a fire or dust occurrence that adversely affects air quality at a particular location, and causes an exceedence of one day average standards in excess of normal historical fluctuations and background levels, and is directly related to: bushfire; jurisdiction authorised hazard reduction burning; or continental scale windblown dust. For the purpose of reporting compliance against PM10 and PM2.5 one day average standards, jurisdictions are required to exclude monitoring data that has been determined as being directly associated with an exceptional event. For the purpose of reporting compliance against PM10 and PM2.5, one year average standards, jurisdictions are required to include all measured data, including monitoring data that is directly associated with an exceptional event.
This report has been prepared to comply with these NEPM reporting requirements.

17
Department of Environment Regulation
2015 Western Australia Air Monitoring Report (August 2016)
Exceedence Summary
There were a number of exceedences of O3, PM2.5 and PM10 in 2015. The NEPM goal for particles was not met at Geraldton and Duncraig. Detailed summaries of all exceedences are provided in Attachment 2.
Table A9: Air NEPM standard exceedences recorded during 2015
Site Pollutant Concentration1,2
Date/Time Event Cause
Albany PM10 56.9 µg/m3 13/11/2015 PB
Albany PM10 76.7 µg/m3 14/11/2015 PB
Bunbury PM2.5 34.9 µg/m3 06/02/2015 BF
Bunbury PM10 62.9 µg/m3 10/02/2015 BF
Bunbury PM2.5 52.1 µg/m3 10/02/2015 BF
Bunbury PM2.5 39.9 µg/m3 24/04/2015 PB
Bunbury PM2.5 34.8 µg/m3 09/10/2015 PB
Bunbury PM2.5 25.4 µg/m3 10/10/2015 PB
Bunbury PM2.5 30.6 µg/m3 11/10/2015 PB
Bunbury PM10 50.8 µg/m3 28/10/1015 PB
Bunbury PM2.5 44.8 µg/m3 28/10/2015 PB
Bunbury PM2.5 35.1 µg/m3 04/11/2015 PB
Bunbury PM10 50.2 µg/m3 05/11/2015 PB
Bunbury PM2.5 31.6 µg/m3 12/11/2015 PB
Busselton PM2.5 37.8 µg/m3 07/02/2015 BF
Busselton PM2.5 35.5 µg/m3 10/02/2015 BF
Busselton PM2.5 27.3 µg/m3 27/11/2015 PB
Busselton PM2.5 26.4 µg/m3 28/11/2015 PB
Caversham PM2.5 27.6 µg/m3 06/02/2015 BF
Caversham O3 0.103 ppm (1hr av.) 10/02/2015 1400 AS
Caversham PM2.5 29.7 µg/m3 10/02/2015 BF
Caversham O3 0.084 ppm (4 hr av.) 10/02/2015 1500 AS
Caversham PM2.5 28.3 µg/m3 10/05/2015 PB
Caversham PM2.5 26.8 µg/m3 10/10/2015 PB
Caversham PM2.5 30.0 µg/m3 23/11/2015 BF
Collie PM10 53.9 µg/m3 03/02/2015 BF
Collie PM10 56.1 µg/m3 06/02/2015 BF
Collie PM10 79.4 µg/m3 09/02/2015 BF
Collie PM10 68.5 µg/m3 10/02/2015 BF
Collie PM10 82.7 µg/m3 22/04/2015 PB
Collie PM10 55.7 µg/m3 26/09/2015 PB
Collie PM10 66.6 µg/m3 08/10/2015 PB
Collie PM10 111.9 µg/m3 10/10/2015 PB
Collie PM10 53.7 µg/m3 13/10/2015 PB
Collie PM10 52.2 µg/m3 22/11/2015 PB
Duncraig PM2.5 35.8 µg/m3 06/02/2015 BF

18
Department of Environment Regulation
2015 Western Australia Air Monitoring Report (August 2016)
Site Pollutant Concentration1,2
Date/Time Event Cause
Duncraig PM2.5 28.2 µg/m3 10/02/2015 BF
Duncraig PM2.5 26.2 µg/m3 10/10/2015 PB
Duncraig PM10 82.7 µg/m3 03/12/2015 AS
Geraldton PM10 57.7 µg/m3 09/01/2015 BF
Geraldton PM10 52.5 µg/m3 08/02/2015 BF
Geraldton PM10 68.1 µg/m3 10/02/2015 BF
Geraldton PM10 63.1 µg/m3 23/02/2015 AS
Geraldton PM10 62.3 µg/m3 24/02/2015 AS
Quinns Rocks PM2.5 37.9 µg/m3 06/02/2015 BF
Quinns Rocks PM2.5 35.8 µg/m3 10/02/2015 BF
Rolling Green O3 0.105 ppm (1hr av.) 10/02/2015 1600 AS
Rolling Green O3 0.093 ppm (4 hr av.) 10/02/2015 1700 AS
South Lake PM10 53.2 µg/m3 06/02/2015 BF
South Lake PM2.5 34.5 µg/m3 06/02/2015 BF
South Lake PM2.5 28.9 µg/m3 09/02/2015 BF
South Lake PM10 51.0 µg/m3 10/02/2015 BF
South Lake PM2.5 30.8 µg/m3 10/02/2015 BF
South Lake PM2.5 33.6 µg/m3 11/05/2015 PB
South Lake PM2.5 32.9 µg/m3 14/05/2015 PB
1. All concentrations are 24 hour averages (midnight to midnight) unless otherwise stated.
2. All Tapered Element Oscillating Microbalances (TEOMs) used by DER are operated continuously (unadjusted for temperature) and have the manufacturer’s recommended equivalency factor of 1.03x + 3.00 applied. All particle concentrations are displayed as a daily average. AS Assessable event BF Bushfire (Exceptional Event) PB Prescribed burning activities (Exceptional Event)

19
Department of Environment Regulation
2015 Western Australia Air Monitoring Report (August 2016)
Section B – Assessment of compliance with standards and goals Table B1: 2015 compliance summary for carbon monoxide
AAQ NEPM Standard
9.0 ppm (eight-hour average)
Regional Performance Monitoring Station
Data availability rates
(% of hours)
Number of exceedences
Performance against the
standards and goal
Q1 Q2 Q3 Q4 Annual (days)
Perth region
Caversham (North East Metro) 85.9 95.6 98 96.7 94.1 0 met
Duncraig (North Metro) 99.3 99.8 99.9 99.1 99.5 0 met
South Lake (South East Metro) 98.9 97.1 99.6 98.3 98.5 0 met
Performance against the standards and goal: “met”, “not met”, “not demonstrated”.
Table B2: 2015 compliance summary for nitrogen dioxide
AAQ NEPM Standard
0.12 ppm (one-hour average)
0.03 ppm (one-year average)
Regional Performance
Monitoring Station
Data availability rates
(% of hours)
Annual
mean
Number of
exceedences
Performance against the
standards and goal
Q1 Q2 Q3 Q4 Annual (ppm) (days) 1-hour 1-year
Perth region
Caversham (North East Metro) 85.9 99 95.9 97.3 94.6 0.006 0 met met
Duncraig (North Metro) 99.2 96.8 97 99.9 98.2 0.006 0 met met
Quinns Rocks (Outer North Coast) 99.7 99.1 100 96.4 98.8 0.003 0 met met
Rockingham (South Coast) 98.5 98.8 99.3 98.7 98.8 0.005 0 met met
Rolling Green (Outer East Rural) 99.8 100 97.9 94.2 98.0 0.002 0 met met
South Lake (South East Metro) 98.8 98.2 99.5 98.4 98.7 0.007 0 met met
Swanbourne (Inner West Coast) 99.9 98.2 99.9 99.8 99.5 0.005 0 met met
Performance against the standards and goal: “met”, “not met”, “not demonstrated”.

20
Department of Environment Regulation
2015 Western Australia Air Monitoring Report (August 2016)
Table B3: 2015 compliance summary for ozone
AAQ NEPM Standard
0.10 ppm (one-hour average)
0.08 ppm (four-hour average)
Regional Performance Monitoring Station
Data availability rates
(% of hours)
Number of
exceedences
(days)
Performance against the
standards and goal
Q1 Q2 Q3 Q4 Annual 1-hour 4-hour 1-hour 4-hour
Perth region Caversham (North East Metro) 85.9 99 99 97.3 95.4 1 1 met met Quinns Rocks (Outer North Coast) 99.9 99.4 100 96.4 98.9 0 0 met met Rockingham (South Coast) 99.2 98.9 99.4 98.3 98.9 0 0 met met Rolling Green (Outer East Rural) 99.4 100 98.1 99.5 99.2 1 1 met met South Lake (South East Metro) 98.8 98.3 99.5 98.4 98.8 0 0 met met Swanbourne (Inner West Coast) 99.9 99.9 100 99.8 99.9 0 0 met met
Performance against the standards and goal: “met”, “not met”, “not demonstrated”.
Table B4: 2015 compliance summary for sulfur dioxide
AAQ NEPM Standard
0.20 ppm (one-hour average)
0.08 ppm (24-hour average)
0.02 ppm (one-year average)
Regional Performance Monitoring Station
Data availability rates
(% of hours)
Annual mean
Number of
exceedences
(days)
Performance against the standards and goal
Q1 Q2 Q3 Q4 Annual (ppm) 1-hour 24-hour 1-hour 24-hour 1-year
Perth region
Rockingham (South Coast) 95.7 93.4 94.1 95.2 94.6 0.001 0 0 met met met
South Lake (South East Metro) 94.7 95.7 96.4 95.4 95.5 0.002 0 0 met met met
Wattleup (South Metro) 95.7 92.5 97.1 97.0 95.6 0.002 0 0 met met met
Performance against the standards and goal: “met”, “not met”, “not demonstrated”.

21
Department of Environment Regulation
2015 Western Australia Air Monitoring Report (August 2016)
Table B5: 2015 compliance summary for particles as PM10
AAQ NEPM Standard
50 μg/m3 (24-hour average)
25 μg/m3 (annual average)
Regional Performance Monitoring Station
Data availability rates
(% of days)
Number of exceedences
Performance against the
standards and goal
Q1 Q2 Q3 Q4 Annual (days) 24-hour annual
Perth region Caversham (North East Metro) 87.7 98.8 99.2 97.1 95.7 0 met met Duncraig (North Metro) 98.8 99.8 99.7 99.5 99.4 1 not met met South Lake (South East Metro) 98.7 98.1 94.9 98.1 97.4 2 met met
Southwest region Albany 99.7 99.9 97.2 99.5 99.1 2 met met Bunbury 99.5 99.5 99.8 99.8 99.7 3 met met Collie 98.4 99.6 98.7 99.3 99.0 10 met met
Midwest region Geraldton 96.5 99.9 99.6 99.7 98.9 5 not met met
Performance against the standards and goal: "met", "not met", "not demonstrated".
Table B6: 2015 compliance summary for particles as PM2.5
AAQ NEPM Standard
25 μg/m3 (24-hour average)
8 μg/m3 (annual average)
Regional Performance Monitoring Station
Data availability rates
(% of days)
Number of exceedences
Performance against the
standards and goal
Q1 Q2 Q3 Q4 Annual (Days) 24-hour annual
Perth region
Caversham (North East Metro) 87.9 98.9 99 97.2 95.8 5 met met
Duncraig (North Metro) 99.1 99.9 99.8 99.9 99.6 3 met met
Quinns Rocks (Outer North Coast) 99.7 99.6 100 96.2 98.9 2 met met
South Lake (South East Metro) 98.7 96.1 94.9 98.2 97.0 5 met met
Southwest region
Bunbury 98.7 99.6 92.7 99.5 97.6 9 met met
Busselton 99.6 99.7 99.6 97.5 99.1 4 met met

22
Department of Environment Regulation
2015 Western Australia Air Monitoring Report (August 2016)
Section C – Analysis of air quality monitoring
Carbon monoxide
The NEPM standard for carbon monoxide of 9.0 ppm averaged over eight hours was not exceeded at any site during 2015. The NEPM goal of no more than one exceedence at each site was met. Table C1 contains the summary statistics for daily peak eight-hour CO in Western Australia.
Table C1: 2015 summary statistics for daily peak eight-hour carbon monoxide
AAQ NEPM Standard
9.0 ppm (eight-hour average)
Regional Performance
Monitoring Station
Data availability
rates
Highest Highest 2nd highest 2nd highest
(%) (ppm) (date) (time) (ppm) (date) (time)
Perth region
Caversham (North East Metro) 94.1 1.2 05/05/2015 1000 0.9 09/05/2015 0900
Duncraig (North Metro) 99.5 1.7 04/07/2015 0500 1.6 23/05/2015 0700
South Lake (South East Metro) 98.5 1.9 02/02/2015 0700 1.5 15/05/2015 0100

23
Department of Environment Regulation
2015 Western Australia Air Monitoring Report (August 2016)
Nitrogen dioxide
The NEPM standard for nitrogen dioxide of 0.12 ppm averaged over one hour and the 0.03 ppm annual average were not exceeded at any site during 2015. The NEPM goal of no more than one exceedence at each site was met. Table C2 contains the summary statistics for daily peak one-hour NO2 in Western Australia.
Table C2: 2015 summary statistics for daily peak one-hour nitrogen dioxide
AAQ NEPM Standard
0.12 ppm (one-hour average)
Regional Performance
Monitoring Station
Data availability
rates
Highest Highest 2nd highest
2nd highest
(%) (ppm) (date) (time) (ppm) (date) (time)
Perth region Caversham (North East Metro) 94.6 0.041 12/03/2015 2000 0.038 01/10/2015 2000 Duncraig (North Metro) 98.2 0.036 13/03/2015 1900 0.036 23/09/2015 2000 Quinns Rocks (Outer North Coast) 98.8 0.030 07/09/2015 2100 0.029 01/10/2015 2000 Rockingham (South Coast) 98.8 0.062 09/04/2015 2400 0.043 04/06/2015 2200 Rolling Green (Outer East Rural) 98.0 0.023 05/01/2015 2200 0.023 02/02/2015 2100 South Lake (South East Metro) 98.7 0.043 23/09/2015 2100 0.037 22/04/2015 2200 Swanbourne (Inner West Coast) 99.5 0.036 15/08/2015 2200 0.035 28/04/2015 1900

24
Department of Environment Regulation
2015 Western Australia Air Monitoring Report (August 2016)
Photochemical smog as ozone
The NEPM standard for ozone of 0.10 ppm averaged over one hour was exceeded twice during 2015. The NEPM goal of no more than one exceedence at each site was met. Table C3 contains the summary statistics for daily peak one-hour O3 in Western Australia.
Table C3: 2015 summary statistics for daily peak one-hour ozone
AAQ NEPM Standard
0.10 ppm (one-hour average)
Regional Performance
Monitoring Station
Data availability
rates
Highest Highest 2nd highest
2nd highest
(%) (ppm) (date) (time) (ppm) (date) (time)
Perth region Caversham (North East Metro) 95.4 0.103 10/02/2015 1400 0.086 18/02/2015 1300
Quinns Rocks (Outer North Coast) 98.9 0.083 22/12/2015 1300 0.079 10/02/2015 1200
Rockingham (South Coast) 98.9 0.069 14/11/2015 1300 0.065 05/01/2015 1300
Rolling Green (Outer East Rural) 99.2 0.105 10/02/2015 1600 0.089 19/02/2015 1600
South Lake (South East Metro) 98.8 0.067 05/01/2015 1500 0.066 28/01/2015 1400
Swanbourne (Inner West Coast) 99.9 0.074 12/10/2015 1700 0.073 27/01/2015 1500
Bold numerals indicate where a relevant standard has been exceeded.

25
Department of Environment Regulation
2015 Western Australia Air Monitoring Report (August 2016)
The NEPM standard for ozone of 0.08 ppm averaged over four hours was exceeded twice during 2015. The NEPM goal of no more than one exceedence at each site was met. Table C4 contains the summary statistics for daily peak four-hour O3 in Western Australia.
Table C4: 2015 summary statistics for daily peak four-hour ozone
AAQ NEPM Standard
0.08 ppm (four-hour average)
Regional Performance
Monitoring Station
Data availability
rates
Highest Highest 2nd highest
2nd highest
(%) (ppm) (date) (time) (ppm) (date) (time)
Perth region Caversham (North East Metro) 95.4 0.084 10/02/2015 1500 0.074 20/01/2015 1800
Quinns Rocks (Outer North Coast) 98.9 0.071 22/12/2015 1400 0.067 28/12/2015 1500
Rockingham (South Coast) 98.9 0.064 14/11/2015 1500 0.062 05/01/2015 1600
Rolling Green (Outer East Rural) 99.2 0.093 10/02/2015 1700 0.070 19/02/2015 1800
South Lake (South East Metro) 98.8 0.060 28/01/2015 1500 0.060 08/02/2015 1600
Swanbourne (Inner West Coast) 99.9 0.067 12/10/2015 1800 0.063 27/01/2015 1600
Bold numerals indicate where a relevant standard has been exceeded.

26
Department of Environment Regulation
2015 Western Australia Air Monitoring Report (August 2016)
Sulfur dioxide
The NEPM standard for sulfur dioxide of 0.20 ppm averaged over one hour was not exceeded at any site during 2015. The NEPM goal of no more than one exceedence at each site was met. Table C5 contains the summary statistics for daily peak one-hour SO2 in Western Australia.
Table C5: 2015 summary statistics for daily peak one-hour sulfur dioxide
AAQ NEPM Standard
0.20 ppm (one-hour average)
Regional Performance
Monitoring Station
Data availability
rates
Highest Highest 2nd highest
2nd highest
(%) (ppm) (date) (time) (ppm) (date) (time)
Perth region
Rockingham (South Coast) 94.6 0.051 16/05/2015 0200 0.039 02/06/2015 0100
South Lake (South East Metro) 95.5 0.037 08/02/2015 2000 0.036 10/03/2015 1600
Wattleup (South Metro) 95.6 0.067 09/03/2015 1600 0.060 16/11/2015 1700
The NEPM standard for sulfur dioxide of 0.08 ppm averaged over 24 hours was not exceeded at any site during 2015. The NEPM goal of no more than one exceedence at each site was met. Table C6 contains the summary statistics for daily peak 24-hour SO2 in Western Australia.
Table C6: 2015 summary statistics for 24-hour sulfur dioxide
AAQ NEPM Standard
0.08 ppm (24-hour average)
Regional Performance
Monitoring Station
Data availability
rates
Highest Highest 2nd highest
2nd highest
(%) (ppm) (date) (time) (ppm) (date) (time)
Perth region
Rockingham (South Coast) 94.6 0.013 16/05/2015 2400 0.011 01/06/2015 2400
South Lake (South East Metro) 95.5 0.007 13/01/2015 2400 0.007 10/03/2015 2400
Wattleup (South Metro) 95.6 0.009 09/03/2015 2400 0.007 17/12/2015 2400

27
Department of Environment Regulation
2015 Western Australia Air Monitoring Report (August 2016)
The NEPM standard for sulfur dioxide of 0.02 ppm averaged over one year was not exceeded at any site during 2015. Table C7 contains the summary statistics for annual SO2 in Western Australia.
Table C7: 2015 summary statistics for annual sulfur dioxide
AAQ NEPM Standard 0.02 ppm (annual average)
Regional Performance Monitoring Station
Data availability rates
(%)
Annual average
(ppm)
Perth region
Rockingham (South Coast) 93.9 0.001
South Lake (South East Metro) 94.5 0.002
Wattleup (South Metro) 95.1 0.002

28
Department of Environment Regulation
2015 Western Australia Air Monitoring Report (August 2016)
Particles as PM10
The NEPM standard for particles as PM10 of 50 μg/m3 averaged over 24 hours was exceeded a number of times as detailed in Table A9 during 2015. The NEPM goal was not met at Duncraig and Geraldton. Table C8 contains the summary statistics for daily peak 24-hour PM10 in Western Australia.
Table C8: 2015 summary statistics for 24-hour particles as PM10
AAQ NEPM Standard
50 μg/m3 (24-hour average)
Regional Performance
Monitoring Station
Data availability
rates
Highest Highest 6th Highest 6th Highest
(%) (μg/m3) (date) (time) (μg/m3) (date) (time)
Perth region
Caversham1
(North East Metro) 95.7 46.8 23/11/2015 2400 39.9 10/10/2015 2400
Duncraig1
(North Metro) 99.4 82.7 03/12/2015 2400 37.8 23/11/2015 2400
South Lake1
(South East Metro) 97.4 53.3 06/02/2015 2400 43.0 14/05/2015 2400
Southwest region
Albany 1 99.1 76.7 14/11/2015 2400 36.6 06/01/2015 2400
Bunbury 1 99.7 62.9 10/02/2015 2400 42.8 06/02/2015 2400
Collie 1 99.0 111.9 10/10/2015 2400 56.2 06/02/2015 2400
Midwest region
Geraldton 1 98.9 68.1 10/02/2015 2400 47.6 06/02/2015 2400
1. Tapered Element Oscillating Microbalance (TEOM) operating continuously (unadjusted for temperature) and includes the manufacturer’s recommended equivalency factor of 1.03x + 3.00.
Bold numerals indicate where a relevant standard has been exceeded.

29
Department of Environment Regulation
2015 Western Australia Air Monitoring Report (August 2016)
The NEPM standard for particles as PM10 of 25 micrograms per cubic metre averaged over one year was met at all sites during 2015. Table C8a contains the summary statistics for annual PM2.5 in Western Australia.
Table C8a: 2015 summary statistics for annual particles as PM10
AAQ NEPM Standard 25 μg/m3 (annual average)
Regional Performance Monitoring Station
Data availability rates
(%)
Annual average
(μg/m3)
Perth region
Caversham1 (North East Metro) 95.7 16.7
Duncraig1 (North Metro) 99.4 16.5
South Lake1 (South East Metro) 97.4 17.9
Southwest region
Albany1 99.1 15.8
Bunbury1 99.7 17.5
Collie1 99.0 22.4
Midwest region
Geraldton1 98.9 20.2
1. Tapered Element Oscillating Microbalance (TEOM) operating continuously (unadjusted for temperature) and includes the manufacturers recommended equivalency factor of 1.03x + 3.00.

30
Department of Environment Regulation
2015 Western Australia Air Monitoring Report (August 2016)
Particles as PM2.5
The NEPM standard for particles as PM2.5 of 25 micrograms per cubic metre averaged over 24 hours was exceeded a number of times as detailed in Table A9 during 2015. The NEPM goal was met at all sites. Table C9 contains the summary statistics for daily peak 24-hour PM2.5 in Western Australia.
Table C9: 2015 summary statistics for 24-hour particles as PM2.5
AAQ NEPM Standard
25 μg/m3 (24-hour average)
Regional Performance
Monitoring Station
Data availability
rates
Highest Highest 6th highest
6th highest
(%) (μg/m3) (date) (time) (μg/m3) (date) (time)
Perth region
Caversham1
(North East Metro) 95.8 30.0 23/11/2015 2400 24.5 09/05/2015 2400
Duncraig1
(North Metro) 99.6 35.8 06/02/2015 2400 21.6 23/11/2015 2400
Quinns Rocks1
(Outer North Coast) 98.9 37.9 06/02/2015 2400 21.6 11/11/2015 2400
South Lake1
(South East Metro) 97.0 34.5 06/02/2015 2400 24.2 10/10/2015 2400
Southwest region
Bunbury1 97.6 52.1 10/02/2015 2400 34.8 09/10/2015 2400
Busselton1 99.1 37.8 07/02/2015 2400 22.4 04/02/2015 2400
1. Tapered Element Oscillating Microbalance (TEOM) operating continuously (unadjusted for temperature) and includes the manufacturer’s recommended equivalency factor of 1.03x + 3.00.
Bold numerals indicate where a relevant standard has been exceeded.

31
Department of Environment Regulation
2015 Western Australia Air Monitoring Report (August 2016)
The NEPM standard for particles as PM2.5 of 8 micrograms per cubic metre averaged over one year was not met at all sites during 2015. Table C10 contains the summary statistics for annual PM2.5 in Western Australia.
Table C10: 2015 summary statistics for annual particles as PM2.5
AAQ NEPM Standard 8 μg/m3 (annual average)
Regional Performance Monitoring Station
Data availability rates
(%)
Annual average
(μg/m3)
Perth region
Caversham1 (North East Metro) 95.8 8.5
Duncraig1 (North Metro) 99.6 8.4
Quinns Rocks1 (Outer North Coast) 98.9 8.3
South Lake1 (South East Metro) 97.0 8.8
Southwest region
Bunbury1 97.6 9.3
Busselton1 99.1 8.6
1. Tapered Element Oscillating Microbalance (TEOM) operating continuously (unadjusted for temperature) and includes the manufacturer’s recommended equivalency factor of 1.03x + 3.00.
Bold numerals indicate where a relevant standard has been exceeded.

32
Department of Environment Regulation
2015 Western Australia Air Monitoring Report (August 2016)
Section D – Data analysis
Maxima and percentiles by pollutant in 2015 Table D1: 2015 percentiles of daily peak eight-hour carbon monoxide concentrations
AAQ NEPM Standard
9.0 ppm (eight-hour average)
Regional Performance
Monitoring Station
Data availability
rates
Max conc.
99th percentile
98th percentile
95th percentile
90th percentile
75th percentile
50th percentile
(%) (ppm) (ppm) (ppm) (ppm) (ppm) (ppm) (ppm)
Perth region
Caversham (North East Metro) 94.1 1.2 0.8 0.7 0.6 0.5 0.3 0.2
Duncraig (North Metro) 99.5 1.7 1.4 1.3 1.0 0.7 0.5 0.3
South Lake (South East Metro) 98.5 1.9 1.3 1.2 0.9 0.8 0.5 0.3
Table D2: 2015 percentiles of daily peak one-hour nitrogen dioxide concentrations
AAQ NEPM Standard
0.12 ppm (one-hour average)
Regional Performance
Monitoring Station
Data availability
rates
Max conc.
99th percentile
98th percentile
95th percentile
90th percentile
75th percentile
50th percentile
(%) (ppm) (ppm) (ppm) (ppm) (ppm) (ppm) (ppm)
Perth region
Caversham (North East Metro) 94.6 0.041 0.035 0.032 0.027 0.025 0.020 0.014
Duncraig (North Metro) 98.2 0.036 0.034 0.032 0.028 0.026 0.021 0.016
Quinns Rocks (Outer North Coast) 98.8 0.030 0.028 0.026 0.024 0.020 0.013 0.009
Rockingham (South Coast) 98.8 0.062 0.032 0.029 0.026 0.023 0.018 0.012
Rolling Green (Outer East Rural) 98.0 0.023 0.018 0.017 0.016 0.013 0.010 0.006
South Lake (South East Metro) 98.7 0.043 0.034 0.031 0.028 0.026 0.022 0.016
Swanbourne (Inner West Coast) 99.5 0.036 0.034 0.030 0.027 0.023 0.017 0.012

33
Department of Environment Regulation
2015 Western Australia Air Monitoring Report (August 2016)
Table D3: 2015 percentiles of daily peak one-hour ozone concentrations
AAQ NEPM Standard
0.10 ppm (one-hour average)
Regional Performance
Monitoring Station
Data availability
rates
Max conc.
99th percentile
98th percentile
95th percentile
90th percentile
75th percentile
50th percentile
(%) (ppm) (ppm) (ppm) (ppm) (ppm) (ppm) (ppm)
Perth region
Caversham (North East Metro) 95.4 0.103 0.080 0.077 0.062 0.052 0.037 0.030
Quinns Rocks (Outer North Coast) 98.9 0.083 0.070 0.064 0.057 0.049 0.038 0.032
Rockingham (South Coast) 98.9 0.069 0.062 0.061 0.052 0.045 0.035 0.030
Rolling Green (Outer East Rural) 99.2 0.105 0.078 0.073 0.062 0.055 0.039 0.031
South Lake (South East Metro) 98.8 0.067 0.063 0.060 0.051 0.042 0.033 0.028
Swanbourne (Inner West Coast) 99.9 0.074 0.066 0.061 0.056 0.044 0.035 0.030
Bold numerals indicate where a relevant standard has been exceeded.
Table D4: 2015 percentiles of daily peak four-hour ozone concentrations
AAQ NEPM Standard
0.08 ppm (four-hour average)
Regional Performance
Monitoring Station
Data availability
rates
Max conc.
99th percentile
98th percentile
95th percentile
90th percentile
75th percentile
50th percentile
(%) (ppm) (ppm) (ppm) (ppm) (ppm) (ppm) (ppm)
Perth region
Caversham (North East Metro) 95.4 0.084 0.070 0.067 0.054 0.046 0.034 0.029
Quinns Rocks (Outer North Coast) 98.9 0.071 0.063 0.059 0.053 0.042 0.035 0.031
Rockingham (South Coast) 98.9 0.064 0.056 0.055 0.047 0.041 0.034 0.029
Rolling Green (Outer East Rural) 99.2 0.093 0.068 0.063 0.054 0.049 0.036 0.030
South Lake (South East Metro) 98.8 0.060 0.055 0.053 0.045 0.037 0.031 0.027
Swanbourne (Inner West Coast) 99.9 0.067 0.058 0.056 0.049 0.039 0.033 0.029
Bold numerals indicate where a relevant standard has been exceeded.

34
Department of Environment Regulation
2015 Western Australia Air Monitoring Report (August 2016)
Table D5: 2015 percentiles of daily peak one-hour sulfur dioxide concentrations
AAQ NEPM Standard
0.20 ppm (one-hour average)
Regional Performance
Monitoring Station
Data availability
rates
Max conc.
99th percentile
98th percentile
95th percentile
90th percentile
75th percentile
50th percentile
(%) (ppm) (ppm) (ppm) (ppm) (ppm) (ppm) (ppm)
Perth region
Rockingham (South Coast) 94.6 0.051 0.033 0.023 0.018 0.012 0.005 0.002
South Lake (South East Metro) 95.5 0.037 0.031 0.029 0.020 0.016 0.008 0.004
Wattleup (South Metro) 95.6 0.067 0.046 0.045 0.039 0.031 0.019 0.006
.
Table D6: 2015 percentiles of daily peak 24-hour sulfur dioxide concentrations
AAQ NEPM Standard
0.08 ppm (24-hour average)
Regional Performance
Monitoring Station
Data availability
rates
Max conc.
99th percentile
98th percentile
95th percentile
90th percentile
75th percentile
50th percentile
(%) (ppm) (ppm) (ppm) (ppm) (ppm) (ppm) (ppm)
Perth region
Rockingham (South Coast) 94.6 0.013 0.007 0.006 0.004 0.003 0.002 0.001
South Lake (South East Metro) 95.5 0.007 0.006 0.005 0.005 0.004 0.003 0.002
Wattleup (South Metro) 95.6 0.009 0.007 0.006 0.006 0.005 0.003 0.002

35
Department of Environment Regulation
2015 Western Australia Air Monitoring Report (August 2016)
Table D7: 2015 percentiles of daily peak 24-hour particles as PM10 concentrations
AAQ NEPM Standard
50 μg/m3 (24-hour average)
Regional Performance
Monitoring Station
Data availability
rates
Max conc.
99th
percentile 98
th
percentile 95
th
percentile 90
th
percentile 75
th
percentile 50
th
percentile
(%) (μg/m3) (μg/m
3) (μg/m
3) (μg/m
3) (μg/m
3) (μg/m
3) (μg/m
3)
Perth region
Caversham (North East Metro) 95.7 46.8 40.7 37.4 30.4 26.3 20.2 15.3
Duncraig (North Metro) 99.4 82.7 40.1 36.7 28.0 25.2 20.2 15.0
South Lake (South East Metro) 97.4 53.3 45.7 41.7 34.4 28.5 21.9 15.6
Southwest region
Albany 99.1 76.7 37.3 34.7 28.4 24.5 19.4 14.4
Bunbury 99.7 62.9 48.6 40.6 35.6 27.2 20.9 15.3
Collie 99.0 111.9 67.4 53.9 41.9 37.8 26.4 20.1
Midwest region
Geraldton 98.9 68.1 54.5 44.4 39.8 35.2 26.2 17.5
Bold numerals indicate where a relevant standard has been exceeded.
Table D8: 2015 percentiles of daily peak 24-hour particles as PM2.5 concentrations
AAQ NEPM Standard
25 μg/m3 (24-hour average)
Regional Performance
Monitoring Station
Data availability
rates
Max conc.
99th
percentile 98
th
percentile 95
th
percentile 90
th
percentile 75
th
percentile 50
th
percentile
(%) (μg/m3) (μg/m
3) (μg/m
3) (μg/m
3) (μg/m
3) (μg/m
3) (μg/m
3)
Perth region
Caversham (North East Metro) 95.8 30.0 27.2 22.4 16.1 12.8 10.3 7.3
Duncraig (North Metro) 99.6 35.8 22.9 18.3 15.2 12.9 9.9 7.6
Quinns Rocks (Outer North Coast) 98.9 37.9 22.2 20.9 14.8 12.4 9.7 7.4
South Lake (South East Metro) 97.0 34.5 29.8 22.8 17.0 13.4 10.5 7.6
Southwest region
Bunbury 97.6 52.1 35.0 30.2 20.2 14.4 9.9 7.6
Busselton 99.1 37.8 24.4 21.3 18.6 13.9 9.6 7.2
Bold numerals indicate where a relevant standard has been exceeded.

36
Department of Environment Regulation
2015 Western Australia Air Monitoring Report (August 2016)
Maxima and percentiles by site 2006–2015
Table D9: Daily peak eight-hour carbon monoxide at Caversham (2006–2015)
Trend station/region: Caversham AAQ NEPM Standard 9.0 ppm (eight-hour average)
Year Data recovery
No. of exceedences
Max conc.
99th percentile
98th percentile
95th percentile
90th percentile
(%) (days) (ppm) (ppm) (ppm) (ppm) (ppm)
2006 99.7 0 1.8 0.9 0.9 0.6 0.5 2007 98.2 0 0.9 0.6 0.6 0.5 0.4 2008 99.5 0 0.8 0.7 0.7 0.6 0.5 2009 99.2 0 1.0 0.6 0.5 0.4 0.4 2010 85.0 0 1.6 0.8 0.7 0.6 0.5 2011 98.2 0 1.5 1.2 1.0 0.6 0.5 2012 98.0 0 0.9 0.7 0.6 0.5 0.4 2013 97.5 0 0.9 0.7 0.6 0.5 0.4 2014 96.1 0 0.7 0.7 0.6 0.5 0.4 2015 94.1 0 1.2 0.8 0.7 0.6 0.5
Table D10: Daily peak eight-hour carbon monoxide at Duncraig (2006–2015)
Trend station/region: Duncraig AAQ NEPM Standard
9.0 ppm (eight-hour average)
Year Data recovery
No. of exceedences
Max conc.
99th percentile
98th percentile
95th percentile
90th percentile
(%) (days) (ppm) (ppm) (ppm) (ppm) (ppm)
2006 99.3 0 3.4 2.8 2.3 1.8 1.3 2007 99.5 0 2.0 1.6 1.4 1.2 0.8 2008 99.0 0 3.1 1.9 1.7 1.4 1.0 2009 98.2 0 2.6 1.7 1.4 1.0 0.7 2010 87.5 0 2.3 2.0 1.8 1.5 1.1 2011 99.3 0 1.9 1.3 1.2 1.0 0.7 2012 99.5 0 2.4 1.9 1.5 1.1 0.9 2013 99.5 0 2.1 1.8 1.6 1.2 0.8 2014 99.7 0 1.9 1.4 1.0 0.8 0.7 2015 99.5 0 1.7 1.4 1.3 1.0 0.7
Table D11: Daily peak eight-hour carbon monoxide at South Lake (2006–2015)
Trend station/region: South Lake AAQ NEPM Standard
9.0 ppm (eight-hour average)
Year Data recovery
No. of exceedences
Max conc.
99th percentile
98th percentile
95th percentile
90th percentile
(%) (days) (ppm) (ppm) (ppm) (ppm) (ppm)
2006 98.6 0 2.5 2.4 2.2 1.6 1.0 2007 99.3 0 1.7 1.4 1.2 1.0 0.8 2008 99.6 0 2.0 1.6 1.4 1.2 0.9 2009 99.3 0 1.8 1.4 1.1 0.9 0.7 2010 87.8 0 2.2 1.6 1.5 1.2 0.9 2011 98.3 0 1.7 1.5 1.3 1.0 0.8 2012 98.9 0 2.2 1.6 1.4 1.0 0.8 2013 98.5 0 1.7 1.3 1.2 1.0 0.6 2014 99.5 0 1.8 1.4 1.0 0.8 0.7 2015 98.5 0 1.9 1.3 1.2 0.9 0.8

37
Department of Environment Regulation
2015 Western Australia Air Monitoring Report (August 2016)
Table D12: Daily peak one-hour nitrogen dioxide at Caversham (2006–2015)
Trend station/region: Caversham AAQ NEPM Standard 0.12 ppm (one-hour average)
Year Data recovery
No. of exceedences
Max conc.
99th percentile
98th percentile
95th percentile
90th percentile
(%) (days) (ppm) (ppm) (ppm) (ppm) (ppm)
2006 98.3 0 0.084 0.037 0.034 0.031 0.028 2007 98.5 0 0.044 0.037 0.033 0.028 0.026 2008 99.5 0 0.036 0.033 0.032 0.028 0.026 2009 99.3 0 0.044 0.034 0.033 0.028 0.026 2010 84.9 0 0.054 0.040 0.037 0.032 0.029 2011 99.5 0 0.035 0.031 0.029 0.027 0.025 2012 97.0 0 0.037 0.033 0.032 0.029 0.025 2013 97.5 0 0.043 0.034 0.032 0.029 0.025 2014 94.2 0 0.033 0.031 0.030 0.026 0.024 2015 94.6 0 0.041 0.035 0.032 0.027 0.025
Table D13: Daily peak one-hour nitrogen dioxide at Duncraig (2006–2015)
Trend station/region: Duncraig AAQ NEPM Standard
0.12 ppm (one-hour average)
Year Data recovery
No. of exceedences
Max conc.
99th percentile
98th percentile
95th percentile
90th percentile
(%) (days) (ppm) (ppm) (ppm) (ppm) (ppm)
2006 99.5 0 0.056 0.037 0.036 0.032 0.030 2007 99.6 0 0.053 0.034 0.032 0.030 0.028 2008 97.7 0 0.038 0.034 0.030 0.029 0.027 2009 98.5 0 0.042 0.037 0.034 0.030 0.027 2010 87.5 0 0.038 0.035 0.033 0.030 0.028 2011 99.3 0 0.035 0.032 0.030 0.028 0.027 2012 96.8 0 0.047 0.037 0.033 0.030 0.027 2013 97.9 0 0.040 0.031 0.030 0.028 0.026 2014 99.3 0 0.048 0.029 0.028 0.026 0.024 2015 98.2 0 0.036 0.034 0.032 0.028 0.026
Table D14: Daily peak one-hour nitrogen dioxide at Quinns Rocks (2006–2015)
Trend station/region: Quinns Rocks AAQ NEPM Standard
0.12 ppm (one-hour average)
Year Data recovery
No. of exceedences
Max conc.
99th percentile
98th percentile
95th percentile
90th percentile
(%) (days) (ppm) (ppm) (ppm) (ppm) (ppm)
2006 96.9 0 0.065 0.051 0.042 0.035 0.029 2007 99.5 0 0.035 0.031 0.029 0.028 0.025 2008 96.1 0 0.037 0.033 0.032 0.028 0.025 2009 99.0 0 0.034 0.032 0.031 0.027 0.024 2010 88.8 0 0.040 0.032 0.032 0.030 0.027 2011 99.0 0 0.031 0.028 0.027 0.025 0.022 2012 97.3 0 0.041 0.032 0.031 0.027 0.024 2013 97.9 0 0.032 0.026 0.026 0.023 0.020 2014 99.6 0 0.031 0.026 0.024 0.020 0.017 2015 98.8 0 0.030 0.028 0.026 0.024 0.020
Table D15: Daily peak one-hour nitrogen dioxide at Rockingham (2006–2015)

38
Department of Environment Regulation
2015 Western Australia Air Monitoring Report (August 2016)
Trend station/region: Rockingham AAQ NEPM Standard 0.12 ppm (one-hour average)
Year Data recovery
No. of exceedences
Max conc.
99th percentile
98th percentile
95th percentile
90th percentile
(%) (days) (ppm) (ppm) (ppm) (ppm) (ppm)
2006 98.9 0 0.054 0.040 0.036 0.034 0.031 2007 99.4 0 0.040 0.034 0.030 0.028 0.025 2008 99.3 0 0.031 0.028 0.027 0.025 0.024 2009 98.6 0 0.031 0.029 0.028 0.026 0.024 2010 88.7 0 0.036 0.032 0.030 0.028 0.026 2011 96.6 0 0.034 0.028 0.027 0.025 0.022 2012 96.4 0 0.053 0.030 0.030 0.027 0.024 2013 97.8 0 0.035 0.031 0.029 0.027 0.025 2014 98.7 0 0.034 0.027 0.026 0.024 0.021 2015 98.8 0 0.062 0.032 0.029 0.026 0.023
Table D16: Daily peak one-hour nitrogen dioxide at Rolling Green (2006–2015)
Trend station/region: Rolling Green AAQ NEPM Standard 0.12 ppm (one-hour average)
Year Data recovery
No. of exceedences
Max conc.
99th percentile
98th percentile
95th percentile
90th percentile
(%) (days) (ppm) (ppm) (ppm) (ppm) (ppm)
2006 98.0 0 0.026 0.020 0.019 0.017 0.015 2007 98.8 0 0.020 0.019 0.018 0.016 0.014 2008 99.3 0 0.023 0.020 0.019 0.016 0.015 2009 99.5 0 0.035 0.023 0.019 0.017 0.015 2010 87.5 0 0.030 0.022 0.019 0.017 0.016 2011 97.1 0 0.023 0.019 0.018 0.015 0.013 2012 91.9 0 0.029 0.019 0.017 0.016 0.014 2013 96.5 0 0.030 0.018 0.017 0.015 0.013 2014 97.2 0 0.021 0.017 0.015 0.013 0.013 2015 98.0 0 0.023 0.018 0.017 0.016 0.013
Table D17: Daily peak one-hour nitrogen dioxide at South Lake (2006–2015)
Trend station/region: South Lake AAQ NEPM Standard 0.12 ppm (one-hour average)
Year Data recovery
No. of exceedences
Max conc.
99th percentile
98th percentile
95th percentile
90th percentile
(%) (days) (ppm) (ppm) (ppm) (ppm) (ppm)
2006 98.0 0 0.045 0.039 0.037 0.032 0.029 2007 99.1 0 0.057 0.041 0.038 0.032 0.029 2008 99.6 0 0.044 0.040 0.038 0.033 0.030 2009 99.3 0 0.048 0.039 0.036 0.033 0.029 2010 87.8 0 0.058 0.045 0.040 0.036 0.030 2011 96.1 0 0.041 0.033 0.032 0.030 0.028 2012 98.7 0 0.046 0.038 0.035 0.031 0.028 2013 97.1 0 0.043 0.037 0.033 0.031 0.027 2014 99.5 0 0.034 0.032 0.029 0.028 0.026 2015 98.7 0 0.043 0.034 0.031 0.028 0.026

39
Department of Environment Regulation
2015 Western Australia Air Monitoring Report (August 2016)
Table D18: Daily peak one-hour nitrogen dioxide at Swanbourne (2006–2015)
Trend station/region: Swanbourne AAQ NEPM Standard 0.12 ppm (one-hour average)
Year Data recovery
No. of exceedences
Max conc.
99th percentile
98th percentile
95th percentile
90th percentile
(%) (days) (ppm) (ppm) (ppm) (ppm) (ppm)
2006 99.5 0 0.043 0.034 0.033 0.031 0.028 2007 98.7 0 0.038 0.033 0.032 0.030 0.027 2008 98.2 0 0.035 0.034 0.033 0.031 0.029 2009 99.2 0 0.037 0.034 0.032 0.028 0.026 2010 86.6 0 0.038 0.033 0.032 0.031 0.029 2011 99.4 0 0.032 0.029 0.028 0.026 0.024 2012 98.4 0 0.045 0.033 0.032 0.030 0.027 2013 99.6 0 0.037 0.033 0.031 0.027 0.025 2014 99.8 0 0.036 0.029 0.028 0.024 0.022 2015 99.5 0 0.036 0.034 0.030 0.027 0.023
Table D19: Daily peak one-hour ozone at Caversham (2006–2015)
Trend station/region: Caversham AAQ NEPM Standard 0.10 ppm (one-hour average)
Year Data recovery
No. of exceedences
Max conc.
99th percentile
98th percentile
95th percentile
90th percentile
(%) (days) (ppm) (ppm) (ppm) (ppm) (ppm)
2006 99.6 0 0.080 0.072 0.067 0.058 0.049 2007 98.6 0 0.085 0.073 0.066 0.059 0.047 2008 99.5 0 0.083 0.067 0.066 0.053 0.046 2009 99.3 1 0.104 0.072 0.067 0.056 0.050 2010 84.5 0 0.082 0.069 0.059 0.055 0.046 2011 99.2 0 0.077 0.070 0.067 0.054 0.045 2012 97.5 0 0.098 0.078 0.064 0.052 0.047 2013 95.7 1 0.101 0.074 0.070 0.056 0.051 2014 96.3 0 0.091 0.065 0.058 0.052 0.047 2015 95.4 1 0.103 0.080 0.077 0.062 0.052
1
Bold numerals indicate where a relevant standard has been exceeded.
Table D20: Daily peak one-hour ozone at Quinns Rocks (2006–2015)
Trend station/region: Quinns Rocks AAQ NEPM Standard 0.10 ppm (one-hour average)
Year Data recovery
No. of exceedences
Max conc.
99th percentile
98th percentile
95th percentile
90th percentile
(%) (days) (ppm) (ppm) (ppm) (ppm) (ppm)
2006 99.0 0 0.085 0.065 0.063 0.052 0.045 2007 98.8 0 0.081 0.061 0.057 0.050 0.045 2008 99.4 0 0.083 0.073 0.060 0.052 0.043 2009 94.3 0 0.070 0.063 0.061 0.053 0.045 2010 88.7 0 0.091 0.061 0.058 0.054 0.048 2011 99.1 0 0.083 0.068 0.057 0.051 0.045 2012 95.7 1 0.130 0.073 0.069 0.058 0.048 2013 99.2 0 0.087 0.077 0.066 0.058 0.050 2014 99.3 0 0.073 0.065 0.062 0.052 0.045 2015 98.9 0 0.083 0.070 0.064 0.057 0.049
Bold numerals indicate where a relevant standard has been exceeded.

40
Department of Environment Regulation
2015 Western Australia Air Monitoring Report (August 2016)
Table D21: Daily peak one-hour ozone at Rockingham (2006–2015)
Trend station/region: Rockingham AAQ NEPM Standard 0.10 ppm (one-hour average)
Year Data recovery
No. of exceedences
Max conc.
99th percentile
98th percentile
95th percentile
90th percentile
(%) (days) (ppm) (ppm) (ppm) (ppm) (ppm)
2006 98.9 0 0.072 0.061 0.056 0.050 0.041 2007 99.5 0 0.084 0.065 0.056 0.049 0.042 2008 99.4 0 0.077 0.063 0.053 0.045 0.038 2009 99.0 0 0.078 0.064 0.054 0.048 0.041 2010 88.2 0 0.067 0.060 0.057 0.052 0.044 2011 94.9 0 0.065 0.062 0.057 0.048 0.043 2012 99.0 0 0.095 0.073 0.064 0.053 0.044 2013 98.8 0 0.084 0.068 0.065 0.052 0.044 2014 99.0 0 0.076 0.060 0.053 0.047 0.039 2015 98.9 0 0.069 0.062 0.061 0.052 0.045
Table D22: Daily peak one-hour ozone at Rolling Green (2006–2015)
Trend station/region: Rolling Green AAQ NEPM Standard 0.10 ppm (one-hour average)
Year Data recovery
No. of exceedences
Max conc.
99th percentile
98th percentile
95th percentile
90th percentile
(%) (days) (ppm) (ppm) (ppm) (ppm) (ppm)
2006 98.6 0 0.093 0.075 0.072 0.060 0.053 2007 98.9 0 0.095 0.081 0.078 0.062 0.053 2008 99.5 0 0.087 0.080 0.071 0.056 0.047 2009 99.5 1 0.103 0.081 0.069 0.059 0.052 2010 85.6 0 0.088 0.077 0.070 0.056 0.046 2011 95.9 0 0.073 0.068 0.060 0.052 0.043 2012 91.8 1 0.103 0.074 0.066 0.055 0.045 2013 96.8 0 0.099 0.078 0.071 0.061 0.049 2014 98.1 0 0.080 0.069 0.063 0.056 0.047 2015 99.2 1 0.105 0.078 0.073 0.062 0.055
Bold numerals indicate where a relevant standard has been exceeded.
Table D23: Daily peak one-hour ozone at South Lake (2006–2015)
Trend station/region: South Lake AAQ NEPM Standard 0.10 ppm (one-hour average)
Year Data recovery
No. of exceedences
Max conc.
99th percentile
98th percentile
95th percentile
90th percentile
(%) (days) (ppm) (ppm) (ppm) (ppm) (ppm)
2006 99.6 0 0.066 0.057 0.054 0.045 0.040 2007 99.4 0 0.067 0.056 0.053 0.047 0.040 2008 99.6 0 0.082 0.061 0.056 0.044 0.037 2009 99.4 0 0.065 0.057 0.053 0.045 0.039 2010 88.0 0 0.070 0.067 0.062 0.052 0.045 2011 99.4 0 0.076 0.064 0.057 0.050 0.044 2012 98.2 0 0.085 0.065 0.062 0.051 0.041 2013 98.6 0 0.087 0.074 0.062 0.054 0.043 2014 99.4 0 0.065 0.059 0.056 0.046 0.041 2015 98.8 0 0.067 0.063 0.060 0.051 0.042

41
Department of Environment Regulation
2015 Western Australia Air Monitoring Report (August 2016)
Table D24: Daily peak one-hour ozone at Swanbourne (2006–2015)
Trend station/region: Swanbourne AAQ NEPM Standard 0.10 ppm (one-hour average)
Year Data recovery
No. of exceedences
Max conc.
99th percentile
98th percentile
95th percentile
90th percentile
(%) (days) (ppm) (ppm) (ppm) (ppm) (ppm)
2006 99.7 0 0.075 0.066 0.060 0.050 0.044 2007 99.3 0 0.077 0.064 0.057 0.051 0.044 2008 98.2 0 0.076 0.067 0.060 0.048 0.042 2009 99.6 0 0.068 0.063 0.059 0.053 0.044 2010 86.6 0 0.066 0.059 0.056 0.050 0.044 2011 99.6 0 0.085 0.069 0.061 0.051 0.046 2012 98.2 1 0.128 0.074 0.067 0.056 0.047 2013 99.8 0 0.083 0.069 0.064 0.052 0.045 2014 97.8 0 0.066 0.056 0.053 0.048 0.042 2015 99.9 0 0.074 0.066 0.061 0.056 0.044
Bold numerals indicate where a relevant standard has been exceeded.
Table D25: Daily peak four-hour ozone at Caversham (2006–2015)
Trend station/region: Caversham AAQ NEPM Standard 0.08 ppm (four-hour average)
Year Data recovery
No. of exceedences
Max conc.
99th percentile
98th percentile
95th percentile
90th percentile
(%) (days) (ppm) (ppm) (ppm) (ppm) (ppm)
2006 99.6 0 0.072 0.063 0.058 0.049 0.043 2007 98.6 0 0.073 0.062 0.058 0.049 0.042 2008 99.5 0 0.076 0.061 0.056 0.047 0.041 2009 99.3 1 0.092 0.067 0.057 0.051 0.043 2010 84.5 0 0.072 0.056 0.052 0.047 0.041 2011 99.2 0 0.063 0.061 0.056 0.049 0.041 2012 97.5 2 0.086 0.070 0.056 0.047 0.041 2013 95.7 0 0.075 0.065 0.060 0.049 0.044 2014 96.3 0 0.073 0.055 0.050 0.046 0.041 2015 95.4 1 0.084 0.070 0.067 0.054 0.046
Bold numerals indicate where a relevant standard has been exceeded.
Table D26: Daily peak four-hour ozone at Quinns Rocks (2006–2015)
Trend station/region: Quinns Rocks AAQ NEPM Standard 0.08 ppm (four-hour average)
Year Data recovery
No. of exceedences
Max conc.
99th percentile
98th percentile
95th percentile
90th percentile
(%) (days) (ppm) (ppm) (ppm) (ppm) (ppm)
2006 99.0 0 0.074 0.059 0.055 0.046 0.041 2007 98.8 0 0.075 0.056 0.053 0.046 0.041 2008 99.4 0 0.073 0.061 0.055 0.046 0.041 2009 94.3 0 0.062 0.056 0.054 0.048 0.040 2010 88.7 0 0.065 0.056 0.052 0.048 0.042 2011 99.1 0 0.075 0.060 0.052 0.047 0.041 2012 95.7 2 0.108 0.065 0.061 0.051 0.043 2013 99.2 0 0.079 0.068 0.061 0.051 0.045 2014 99.3 0 0.062 0.057 0.051 0.046 0.042 2015 98.9 0 0.071 0.063 0.059 0.053 0.042
Bold numerals indicate where a relevant standard has been exceeded.

42
Department of Environment Regulation
2015 Western Australia Air Monitoring Report (August 2016)
Table D27: Daily peak four-hour ozone at Rockingham (2006–2015)
Trend station/region: Rockingham AAQ NEPM Standard 0.08 ppm (four-hour average)
Year Data recovery
No. of exceedences
Max conc.
99th percentile
98th percentile
95th percentile
90th percentile
(%) (days) (ppm) (ppm) (ppm) (ppm) (ppm)
2006 98.9 0 0.067 0.056 0.051 0.046 0.038 2007 99.5 0 0.079 0.057 0.052 0.046 0.038 2008 99.4 0 0.072 0.058 0.049 0.042 0.036 2009 99.0 0 0.066 0.058 0.051 0.045 0.039 2010 88.2 0 0.064 0.054 0.053 0.046 0.041 2011 94.9 0 0.061 0.058 0.053 0.045 0.040 2012 99.0 0 0.079 0.065 0.060 0.048 0.040 2013 98.8 0 0.075 0.064 0.057 0.047 0.042 2014 99.0 0 0.067 0.051 0.048 0.043 0.037 2015 98.9 0 0.064 0.056 0.055 0.047 0.041
Table D28: Daily peak four-hour ozone at Rolling Green (2006–2015)
Trend station/region: Rolling Green AAQ NEPM Standard 0.08 ppm (four-hour average)
Year Data recovery
No. of exceedences
Max conc.
99th percentile
98th percentile
95th percentile
90th percentile
(%) (days) (ppm) (ppm) (ppm) (ppm) (ppm)
2006 98.6 0 0.079 0.065 0.059 0.053 0.046 2007 98.9 0 0.080 0.070 0.066 0.053 0.046 2008 99.5 0 0.075 0.065 0.062 0.051 0.043 2009 99.5 2 0.083 0.064 0.057 0.051 0.043 2010 85.6 0 0.080 0.065 0.056 0.049 0.042 2011 95.9 0 0.061 0.055 0.051 0.045 0.040 2012 91.8 1 0.081 0.064 0.058 0.049 0.042 2013 96.8 1 0.083 0.065 0.059 0.051 0.045 2014 98.1 0 0.070 0.058 0.054 0.048 0.042 2015 99.2 1 0.093 0.068 0.063 0.054 0.049
.
Bold numerals indicate where a relevant standard has been exceeded.
Table D29: Daily peak four-hour ozone at South Lake (2006–2015)
Trend station/region: South Lake AAQ NEPM Standard 0.08 ppm (four-hour average)
Year Data recovery
No. of exceedences
Max conc.
99th percentile
98th percentile
95th percentile
90th percentile
(%) (days) (ppm) (ppm) (ppm) (ppm) (ppm)
2006 99.6 0 0.063 0.051 0.049 0.041 0.036 2007 99.4 0 0.059 0.051 0.048 0.042 0.037 2008 99.6 0 0.067 0.051 0.046 0.040 0.034 2009 99.4 0 0.057 0.053 0.048 0.040 0.036 2010 88.0 0 0.061 0.055 0.053 0.046 0.042 2011 99.4 0 0.064 0.056 0.051 0.046 0.039 2012 98.2 0 0.080 0.060 0.054 0.046 0.037 2013 98.6 0 0.074 0.063 0.057 0.048 0.039 2014 99.4 0 0.058 0.053 0.049 0.042 0.037 2015 98.8 0 0.060 0.055 0.053 0.045 0.037

43
Department of Environment Regulation
2015 Western Australia Air Monitoring Report (August 2016)
Table D30: Daily peak four-hour ozone at Swanbourne (2006–2015)
Trend station/region: Swanbourne AAQ NEPM Standard 0.08 ppm (four-hour average)
Year Data recovery
No. of exceedences
Max conc.
99th percentile
98th percentile
95th percentile
90th percentile
(%) (days) (ppm) (ppm) (ppm) (ppm) (ppm)
2006 99.7 0 0.069 0.060 0.052 0.045 0.040 2007 99.3 0 0.067 0.054 0.051 0.048 0.042 2008 98.2 0 0.070 0.060 0.053 0.045 0.039 2009 99.6 0 0.063 0.058 0.054 0.046 0.039 2010 86.6 0 0.055 0.053 0.050 0.044 0.040 2011 99.6 0 0.073 0.059 0.056 0.047 0.043 2012 98.2 1 0.108 0.064 0.061 0.051 0.042 2013 99.8 0 0.068 0.063 0.056 0.048 0.042 2014 97.8 0 0.057 0.050 0.049 0.043 0.038 2015 99.9 0 0.067 0.058 0.056 0.049 0.039
Bold numerals indicate where a relevant standard has been exceeded.
Table D31: Daily peak one-hour sulfur dioxide at Rockingham (2006–2015)
Trend station/region: Rockingham AAQ NEPM Standard 0.20 ppm (one-hour average)
Year Data recovery
No. of exceedences
Max conc.
99th percentile
98th percentile
95th percentile
90th percentile
(%) (days) (ppm) (ppm) (ppm) (ppm) (ppm)
2006 98.9 0 0.040 0.031 0.022 0.013 0.008 2007 98.6 0 0.041 0.025 0.020 0.013 0.008 2008 98.3 0 0.079 0.026 0.019 0.015 0.008 2009 98.7 0 0.032 0.022 0.017 0.010 0.007 2010 89.9 0 0.037 0.022 0.019 0.013 0.009 2011 93.7 0 0.040 0.029 0.024 0.017 0.010 2012 94.4 0 0.040 0.020 0.018 0.011 0.008 2013 94.5 0 0.037 0.028 0.022 0.016 0.011 2014 93.9 0 0.036 0.024 0.021 0.013 0.008 2015 94.6 0 0.051 0.033 0.023 0.018 0.012
Table D32: Daily peak one-hour sulfur dioxide at South Lake (2006–2015)
Trend station/region: South Lake AAQ NEPM Standard 0.20 ppm (one-hour average)
Year Data recovery
No. of exceedences
Max conc.
99th percentile
98th percentile
95th percentile
90th percentile
(%) (days) (ppm) (ppm) (ppm) (ppm) (ppm)
2006 99.5 0 0.060 0.044 0.032 0.028 0.022 2007 99.4 0 0.040 0.032 0.028 0.019 0.012 2008 99.6 0 0.046 0.025 0.020 0.014 0.010 2009 98.4 0 0.036 0.033 0.029 0.018 0.015 2010 87.8 0 0.073 0.036 0.033 0.025 0.017 2011 95.7 0 0.044 0.029 0.026 0.017 0.012 2012 94.0 0 0.039 0.027 0.019 0.014 0.010 2013 93.3 0 0.044 0.034 0.031 0.020 0.015 2014 94.5 0 0.051 0.028 0.024 0.016 0.012 2015 95.5 0 0.037 0.031 0.029 0.020 0.016

44
Department of Environment Regulation
2015 Western Australia Air Monitoring Report (August 2016)
Table D33: Daily peak one-hour sulfur dioxide at Wattleup (2006–2015)
Trend station/region: Wattleup AAQ NEPM Standard 0.20 ppm (one-hour average)
Year Data recovery
No. of exceedences
Max conc.
99th percentile
98th percentile
95th percentile
90th percentile
(%) (days) (ppm) (ppm) (ppm) (ppm) (ppm)
2006 99.0 0 0.062 0.046 0.043 0.035 0.028 2007 93.3 0 0.060 0.045 0.040 0.034 0.025 2008 89.6 0 0.077 0.034 0.028 0.022 0.016 2009 95.6 0 0.059 0.039 0.036 0.029 0.022 2010 86.8 0 0.057 0.049 0.043 0.036 0.023 2011 94.3 0 0.067 0.049 0.042 0.032 0.026 2012 94.7 0 0.043 0.039 0.034 0.025 0.017 2013 92.5 0 0.090 0.059 0.047 0.037 0.027 2014 95.1 0 0.061 0.046 0.037 0.031 0.024 2015 95.6 0 0.067 0.046 0.045 0.039 0.031
Table D34: Daily peak 24-hour sulfur dioxide at Rockingham (2006–2015)
Trend station/region: Rockingham AAQ NEPM Standard 0.08 ppm (24-hour average)
Year Data recovery
No. of exceedences
Max conc.
99th percentile
98th percentile
95th percentile
90th percentile
(%) (days) (ppm) (ppm) (ppm) (ppm) (ppm)
2006 98.9 0 0.007 0.004 0.004 0.002 0.002 2007 98.6 0 0.012 0.005 0.004 0.003 0.002 2008 98.3 0 0.007 0.005 0.004 0.002 0.001 2009 98.7 0 0.008 0.003 0.002 0.001 0.001 2010 89.9 0 0.007 0.004 0.003 0.002 0.002 2011 93.7 0 0.008 0.006 0.006 0.003 0.002 2012 94.4 0 0.006 0.005 0.003 0.002 0.002 2013 94.5 0 0.007 0.005 0.004 0.003 0.002 2014 93.9 0 0.007 0.005 0.004 0.003 0.002 2015 94.6 0 0.013 0.007 0.006 0.004 0.003
Table D35: Daily peak 24-hour sulfur dioxide at South Lake (2006–2015)
Trend station/region: South Lake AAQ NEPM Standard 0.08 ppm (24-hour average)
Year Data recovery
No. of exceedences
Max conc.
99th percentile
98th percentile
95th percentile
90th percentile
(%) (days) (ppm) (ppm) (ppm) (ppm) (ppm)
2006 99.5 0 0.009 0.006 0.005 0.004 0.003 2007 99.4 0 0.006 0.004 0.003 0.002 0.002 2008 99.6 0 0.005 0.003 0.003 0.002 0.001 2009 98.4 0 0.006 0.005 0.003 0.003 0.002 2010 87.8 0 0.009 0.005 0.004 0.003 0.002 2011 95.7 0 0.006 0.004 0.003 0.002 0.002 2012 94.0 0 0.006 0.004 0.003 0.003 0.002 2013 93.3 0 0.014 0.005 0.004 0.003 0.002 2014 94.5 0 0.010 0.005 0.004 0.003 0.003 2015 95.5 0 0.007 0.006 0.005 0.005 0.004

45
Department of Environment Regulation
2015 Western Australia Air Monitoring Report (August 2016)
Table D36: Daily peak 24-hour sulfur dioxide at Wattleup (2006–2015)
Trend station/region: Wattleup AAQ NEPM Standard 0.08 ppm (24-hour average)
Year Data recovery
No. of exceedences
Max conc.
99th percentile
98th percentile
95th percentile
90th percentile
(%) (days) (ppm) (ppm) (ppm) (ppm) (ppm)
2006 99.0 0 0.009 0.007 0.006 0.004 0.004 2007 93.3 0 0.010 0.008 0.007 0.005 0.004 2008 89.6 0 0.011 0.005 0.004 0.003 0.002 2009 95.6 0 0.008 0.005 0.005 0.004 0.003 2010 86.8 0 0.010 0.008 0.006 0.005 0.003 2011 94.3 0 0.008 0.006 0.005 0.004 0.003 2012 94.7 0 0.008 0.005 0.004 0.003 0.002 2013 92.5 0 0.010 0.008 0.006 0.005 0.004 2014 95.1 0 0.008 0.007 0.006 0.005 0.004 2015 95.6 0 0.009 0.007 0.006 0.006 0.005
Table D37: Daily peak 24-hour particles as PM10 at Caversham (2006–2015)
Trend station/region: Caversham AAQ NEPM Standard 50 μg/m3 (24-hour average)
Year Data recovery
No. of exceedences
Max conc.
99th percentile
98th percentile
95th percentile
90th percentile
(%) (days) (μg/m3) (μg/m3) (μg/m3) (μg/m3) (μg/m3)
2006 97.3 0 42.6 38.4 35.3 29.3 26.4 2007 98.4 1 58.8 39.7 35.9 30.3 26.1 2008 99.3 0 39.1 37.0 32.5 26.1 22.5 2009 99.4 0 45.7 37.2 32.4 29.0 25.8 2010 99.5 1 63.4 40.7 36.1 30.5 26.3 2011 99.1 1 76.1 33.2 30.2 27.3 23.8 2012 97.8 4 68.7 49.2 36.7 27.2 24.4 2013 97.4 1 62.4 34.4 30.7 26.2 23.6 2014 97.2 1 52.6 37.3 34.5 27.2 24.8 2015 95.7 0 46.8 40.7 37.4 30.4 26.3
Bold numerals indicate where a relevant standard has been exceeded.
Table D38: Daily peak 24-hour particles as PM10 at Duncraig (2006–2015)
Trend station/region: Duncraig AAQ NEPM Standard 50 μg/m3 (24-hour average)
Year Data recovery
No. of exceedences
Max conc.
99th percentile
98th percentile
95th percentile
90th percentile
(%) (days) (μg/m3) (μg/m3) (μg/m3) (μg/m3) (μg/m3)
2006 99.1 0 40.6 32.9 30.5 27.3 24.0 2007 99.7 0 40.3 31.8 29.4 25.8 22.0 2008 99.2 0 46.9 34.4 31.1 25.8 21.9 2009 99.2 0 45.5 36.2 30.4 24.5 22.6 2010 99.4 0 47.9 33.1 30.8 25.1 22.7 2011 99.3 1 65.9 30.1 29.5 25.7 23.2 2012 99.4 2 89.5 35.5 28.3 26.1 23.0 2013 99.3 0 37.6 32.1 28.1 25.6 22.8 2014 99.4 1 53.0 31.2 28.1 25.1 22.4 2015 99.4 1 82.7 40.1 36.7 28.0 25.2
Bold numerals indicate where a relevant standard has been exceeded.

46
Department of Environment Regulation
2015 Western Australia Air Monitoring Report (August 2016)
Table D39: Daily peak 24-hour particles as PM10 at South Lake (2006–2015)
Trend station/region: South Lake AAQ NEPM Standard 50 μg/m3 (24-hour average)
Year Data recovery
No. of exceedences
Max conc.
99th percentile
98th percentile
95th percentile
90th percentile
(%) (days) (μg/m3) (μg/m3) (μg/m3) (μg/m3) (μg/m3)
2006 97.0 0 45.3 39.8 37.0 34.4 29.0 2007 97.9 1 56.7 37.7 36.0 32.9 26.7 2008 99.6 1 55.0 39.9 36.1 30.3 25.8 2009 99.5 0 49.0 38.7 34.3 30.8 27.5 2010 99.7 4 61.0 46.7 39.8 33.9 28.5 2011 99.2 1 66.2 35.8 31.5 28.1 24.8 2012 99.1 2 81.5 36.6 30.3 28.5 24.1 2013 98.6 0 38.8 34.4 32.3 28.9 25.9 2014 99.4 0 44.5 38.2 34.0 29.4 26.3 2015 97.4 2 53.3 45.7 41.7 34.4 28.5
Bold numerals indicate where a relevant standard has been exceeded.
Table D40: Daily peak 24-hour particles as PM10 at Bunbury (2006–2015)
Trend station/region: Bunbury AAQ NEPM Standard 50 μg/m3 (24-hour average)
Year Data recovery
No. of exceedences
Max conc.
99th percentile
98th percentile
95th percentile
90th percentile
(%) (days) (μg/m3) (μg/m3) (μg/m3) (μg/m3) (μg/m3)
2006 99.2 3 123.5 45.6 38.8 28.3 25.8 2007 99.6 0 46.5 32.8 29.6 27.1 24.5 2008 99.4 0 39.1 31.4 30.3 27.3 23.7 2009 99.5 1 53.8 40.3 36.0 29.5 25.4 2010 99.1 2 134.0 37.6 36.0 29.3 25.3 2011 99.6 2 68.4 39.3 33.8 28.0 23.8 2012 99.5 2 53.5 40.0 32.9 26.5 24.1 2013 98.9 0 46.8 38.1 33.5 26.8 22.6 2014 98.1 0 44.5 31.7 26.2 24.6 22.8 2015 99.7 3 62.9 48.6 40.6 35.6 27.2
Bold numerals indicate where a relevant standard has been exceeded.
Table D41: Daily peak 24-hour particles as PM10 at Albany (2006–2015)
Trend station/region: Albany AAQ NEPM Standard 50 μg/m3 (24-hour average)
Year Data recovery
No. of exceedences
Max conc.
99th percentile
98th percentile
95th percentile
90th percentile
(%) (days) (μg/m3) (μg/m3) (μg/m3) (μg/m3) (μg/m3)
2006 52.4 0 39.4 35.4 33.0 26.6 24.6 2007 99.8 1 55.7 31.3 28.0 24.7 22.1 2008 99.2 2 56.3 34.1 32.8 26.1 22.7 2009 97.7 0 36.7 32.3 28.7 24.5 21.4 2010 99.8 1 52.5 36.1 33.2 27.3 25.3 2011 99.3 0 37.3 33.6 30.6 26.3 22.0 2012 99.5 0 37.0 34.6 31.1 27.4 23.6 2013 98.1 3 110.8 43.3 36.0 29.1 23.8 2014 98.6 0 43.5 35.5 31.4 28.1 24.4 2015 99.1 2 76.7 37.3 34.7 28.4 24.5
Bold numerals indicate where a relevant standard has been exceeded.

47
Department of Environment Regulation
2015 Western Australia Air Monitoring Report (August 2016)
Table D42: Daily peak 24-hour particles as PM10 at Geraldton (2006–2015)
Trend station/region: Geraldton AAQ NEPM Standard 50 μg/m3 (24-hour average)
Year Data recovery
No. of exceedences
Max conc.
99th percentile
98th percentile
95th percentile
90th percentile
(%) (days) (μg/m3) (μg/m3) (μg/m3) (μg/m3) (μg/m3)
2006 99.4 4 78.0 48.6 45.8 40.0 35.4 2007 99.7 10 116.3 87.2 67.9 44.7 36.4 2008 98.9 10 150.7 105.2 58.1 45.9 38.6 2009 99.6 14 128.9 69.2 58.6 48.5 40.3 2010 97.7 4 55.6 49.3 47.8 41.6 37.9 2011 98.6 3 63.0 45.4 40.2 35.8 32.2 2012 99.6 3 61.5 47.0 45.3 40.2 33.8 2013 99.3 2 63.1 45.9 42.1 38.9 34.6 2014 98.8 4 55.7 49.7 47.1 41.4 37.5 2015 98.9 5 68.1 54.5 44.4 39.8 35.2
Bold numerals indicate where a relevant standard has been exceeded.
Table D43: Daily peak 24-hour particles as PM10 at Collie (2006–2015)
Trend station/region: Collie AAQ NEPM Standard 50 μg/m3 (24-hour average)
Year Data recovery
No. of exceedences
Max conc.
99th percentile
98th percentile
95th percentile
90th percentile
(%) (days) (μg/m3) (μg/m3) (μg/m3) (μg/m3) (μg/m3)
2006 0.0 2007 0.0 2008 87.6 7 85.9 56.7 50.1 37.4 30.5 2009 99.5 3 80.4 47.3 46.2 38.0 31.3 2010 99.7 16 163.0 86.7 67.3 46.1 34.9 2011 97.6 4 61.5 52.1 40.4 32.0 29.2 2012 99.4 6 91.7 54.9 46.9 35.1 30.1 2013 99.0 3 61.6 46.0 41.3 36.0 32.0 2014 99.3 2 73.3 42.2 38.8 34.0 29.8 2015 99.0 10 111.9 67.4 53.9 41.9 37.8
Bold numerals indicate where a relevant standard has been exceeded.
Table D44: Daily peak 24-hour particles as PM2.5 at Caversham (2006–2015)
Trend station/region: Caversham AAQ NEPM Standard 25 μg/m3 (24-hour average)
Year Data recovery
No. of exceedences
Max conc.
99th percentile
98th percentile
95th percentile
90th percentile
(%) (days) (μg/m3) (μg/m3) (μg/m3) (μg/m3) (μg/m3)
2006 63.8 1 34.0 18.6 15.6 13.4 12.0 2007 98.4 0 24.5 15.1 14.0 12.1 10.7 2008 99.4 1 26.3 15.2 14.0 11.7 10.6 2009 99.5 2 25.5 19.4 17.3 12.9 11.0 2010 99.1 3 45.2 21.9 16.2 13.7 12.1 2011 99.4 1 41.5 12.4 11.7 10.8 9.8 2012 96.9 3 45.9 19.2 15.9 12.3 10.6 2013 97.4 0 22.6 17.2 16.4 13.6 11.6 2014 97.0 1 39.3 16.2 15.2 14.1 11.9 2015 95.8 5 30.0 27.2 22.4 16.1 12.8
Bold numerals indicate where a relevant standard has been exceeded.

48
Department of Environment Regulation
2015 Western Australia Air Monitoring Report (August 2016)
Table D45: Daily peak 24-hour particles as PM2.5 at Duncraig (2006–2015)
Trend station/region: Duncraig AAQ NEPM Standard 25 μg/m3 (24-hour average)
Year Data recovery
No. of exceedences
Max conc.
99th percentile
98th percentile
95th percentile
90th percentile
(%) (days) (μg/m3) (μg/m3) (μg/m3) (μg/m3) (μg/m3)
2006 99.0 2 33.4 18.7 16.2 13.4 11.9 2007 99.6 0 19.6 14.2 13.5 11.6 10.1 2008 99.3 1 38.3 18.0 15.9 12.6 11.1 2009 99.4 3 32.7 22.1 17.5 13.2 11.5 2010 99.3 3 36.4 20.1 15.9 13.7 12.0 2011 99.4 1 52.1 14.7 13.4 11.5 10.4 2012 97.5 3 77.3 22.0 14.4 12.7 11.0 2013 98.5 0 18.7 15.6 14.4 12.7 11.4 2014 99.7 1 47.6 16.8 15.3 13.0 11.0 2015 99.6 3 35.8 22.9 18.3 15.2 12.9
Bold numerals indicate where a relevant standard has been exceeded.
Table D46: Daily peak 24-hour particles as PM2.5 at Quinns Rocks (2006–2015)
Trend station/region: Quinns Rocks AAQ NEPM Standard
25 μg/m3 (24-hour average)
Year Data recovery
No. of exceedences
Max conc.
99th percentile
98th percentile
95th percentile
90th percentile
(%) (days) (μg/m3) (μg/m3) (μg/m3) (μg/m3) (μg/m3)
2006 55.3 1 63.9 17.0 14.3 13.2 11.0 2007 99.7 0 19.9 15.4 13.7 12.1 10.1 2008 99.3 1 53.3 17.3 15.4 12.8 11.3 2009 99.8 2 31.3 20.7 15.2 12.7 11.3 2010 99.6 3 33.7 17.6 14.5 12.0 10.9 2011 99.0 2 43.2 17.3 14.6 11.6 10.1 2012 96.5 4 74.5 22.7 14.3 11.9 10.6 2013 98.5 0 19.3 16.6 15.0 13.1 10.9 2014 98.8 2 39.5 15.8 14.5 13.4 11.7 2015 98.9 2 37.9 22.2 20.9 14.8 12.4
Bold numerals indicate where a relevant standard has been exceeded.
Table D47: Daily peak 24-hour particles as PM2.5 at South Lake (2006–2015)
Trend station/region: South Lake AAQ NEPM Standard 25 μg/m3 (24-hour average)
Year Data recovery
No. of exceedences
Max conc.
99th percentile
98th percentile
95th percentile
90th percentile
(%) (days) (μg/m3) (μg/m3) (μg/m3) (μg/m3) (μg/m3)
2006 76.7 1 30.5 21.5 17.2 14.6 12.8 2007 98.9 0 21.2 15.6 12.9 11.8 10.5 2008 99.4 1 45.2 18.2 14.1 12.7 11.2 2009 99.3 3 32.0 22.8 19.1 14.1 11.7 2010 99.5 2 40.0 22.0 19.2 15.9 13.2 2011 99.2 1 48.2 16.2 15.3 13.1 11.5 2012 99.0 4 71.6 25.0 19.3 14.6 13.2 2013 98.6 0 17.1 15.2 14.9 14.0 11.7 2014 98.7 2 29.8 17.7 15.0 13.4 11.5 2015 97.0 5 34.5 29.8 22.8 17.0 13.4
Bold numerals indicate where a relevant standard has been exceeded.

49
Department of Environment Regulation
2015 Western Australia Air Monitoring Report (August 2016)
Table D48: Daily peak 24-hour particles as PM2.5 at Bunbury (2006–2015)
Trend station/region: Bunbury AAQ NEPM Standard 25 μg/m3 (24-hour average)
Year Data recovery
No. of exceedences
Max conc.
99th percentile
98th percentile
95th percentile
90th percentile
(%) (days) (μg/m3) (μg/m3) (μg/m3) (μg/m3) (μg/m3)
2006 99.3 8 113.5 32.4 26.0 14.8 13.0 2007 99.4 3 34.5 21.2 17.8 13.2 10.7 2008 99.7 2 27.8 21.0 18.6 13.2 11.4 2009 99.5 7 40.0 26.6 22.3 16.9 12.6 2010 98.6 7 115.3 28.4 24.2 14.8 12.2 2011 98.9 5 45.5 26.6 18.7 13.2 11.2 2012 99.6 7 43.0 26.3 21.0 14.9 12.8 2013 99.3 1 38.3 16.6 15.7 14.0 11.5 2014 98.4 1 34.6 16.1 15.0 13.3 11.7 2015 97.6 9 52.1 35.0 30.2 20.2 14.4
Bold numerals indicate where a relevant standard has been exceeded.
Table D49: Daily peak 24-hour particles as PM2.5 at Busselton (2006–2015)
Trend station/region: Busselton AAQ NEPM Standard 25 μg/m3 (24-hour average)
Year Data recovery
No. of exceedences
Max conc.
99th percentile
98th percentile
95th percentile
90th percentile
(%) (days) (μg/m3) (μg/m3) (μg/m3) (μg/m3) (μg/m3)
2006 16.7 0 12.7 11.9 11.3 10.8 10.1 2007 99.4 2 51.1 15.6 14.3 11.7 9.9 2008 99.3 3 35.6 20.5 15.5 11.9 10.5 2009 99.8 12 69.0 45.0 31.6 17.7 14.0 2010 99.4 7 62.5 31.6 22.9 15.7 11.6 2011 99.8 6 85.2 36.7 20.5 13.9 11.4 2012 99.6 5 78.0 27.1 21.4 13.4 11.8 2013 98.6 0 17.9 16.6 15.5 12.9 10.9 2014 99.6 1 25.1 13.2 12.4 11.1 10.2 2015 99.1 4 37.8 24.4 21.3 18.6 13.9
Bold numerals indicate where a relevant standard has been exceeded.

50
Department of Environment Regulation
2015 Western Australia Air Monitoring Report (August 2016)
Maxima by pollutant 2006–2015 Table D50: Annual daily peak eight-hour carbon monoxide concentrations (ppm) for 2006–2015
AAQ NEPM Standard 9.0 ppm (eight-hour average)
Regional Performance Monitoring Station 2006 2007 2008 2009 2010 2011 2012 2013 2014 2015
Perth region
Caversham (North East Metro) 1.8 0.9 0.8 1.0 1.6 1.5 0.9 0.9 0.7 1.2
Duncraig (North Metro) 3.4 2.0 3.1 2.6 2.3 1.9 2.4 2.1 1.9 1.7
South Lake (South East Metro) 2.5 1.7 2.0 1.8 2.2 1.7 2.2 1.7 1.8 1.9
Table D51: Annual daily peak one-hour nitrogen dioxide concentrations (ppm) for 2006–2015
AAQ NEPM Standard 0.12 ppm (one-hour average)
Regional Performance
Monitoring Station 2006 2007 2008 2009 2010 2011 2012 2013 2014 2015
Perth region
Caversham (North East Metro) 0.084 0.044 0.036 0.044 0.054 0.035 0.037 0.043 0.033 0.041
Duncraig (North Metro) 0.056 0.053 0.038 0.042 0.038 0.035 0.047 0.040 0.048 0.036
Quinns Rocks (Outer North Coast) 0.065 0.035 0.037 0.034 0.040 0.031 0.041 0.032 0.031 0.030
Rockingham (South Coast) 0.054 0.040 0.031 0.031 0.036 0.034 0.053 0.035 0.034 0.062
Rolling Green (Outer East Rural) 0.026 0.020 0.023 0.035 0.030 0.023 0.029 0.030 0.021 0.023
South Lake (South East Metro) 0.045 0.057 0.044 0.048 0.058 0.041 0.046 0.043 0.034 0.043
Swanbourne (Inner West Coast) 0.043 0.038 0.035 0.037 0.038 0.032 0.045 0.037 0.036 0.036
.

51
Department of Environment Regulation
2015 Western Australia Air Monitoring Report (August 2016)
Table D52: Annual daily peak one-hour ozone concentrations (ppm) for 2006–2015
AAQ NEPM Standard 0.10 ppm (one-hour average)
Regional Performance Monitoring Station 2006 2007 2008 2009 2010 2011 2012 2013 2014 2015
Perth region
Caversham (North East Metro) 0.080 0.085 0.083 0.104 0.082 0.077 0.098 0.101 0.091 0.103
Quinns Rocks (Outer North Coast) 0.085 0.081 0.083 0.070 0.091 0.083 0.130 0.087 0.073 0.083
Rockingham (South Coast) 0.072 0.084 0.077 0.078 0.067 0.065 0.095 0.084 0.076 0.069
Rolling Green (Outer East Rural) 0.093 0.095 0.087 0.103 0.088 0.073 0.103 0.099 0.080 0.105
South Lake (South East Metro) 0.066 0.067 0.082 0.065 0.070 0.076 0.085 0.087 0.065 0.067
Swanbourne (Inner West Coast) 0.075 0.077 0.076 0.068 0.066 0.085 0.128 0.083 0.066 0.074
Bold numerals indicate where a relevant standard has been exceeded.
For explanation of exceedences in previous years, please refer to the relevant year report.
Table D53: Annual daily peak four-hour ozone concentrations (ppm) for 2006–2015
AAQ NEPM Standard 0.08 ppm (four-hour average)
Regional Performance Monitoring Station 2006 2007 2008 2009 2010 2011 2012 2013 2014 2015
Perth region
Caversham (North East Metro) 0.072 0.073 0.076 0.092 0.072 0.063 0.086 0.075 0.073 0.084
Quinns Rocks (Outer North Coast) 0.074 0.075 0.073 0.062 0.065 0.075 0.108 0.079 0.062 0.071
Rockingham (South Coast) 0.067 0.079 0.072 0.066 0.064 0.061 0.079 0.075 0.067 0.064
Rolling Green (Outer East Rural) 0.079 0.080 0.075 0.083 0.080 0.061 0.081 0.083 0.070 0.093
South Lake (South East Metro) 0.063 0.059 0.067 0.057 0.061 0.064 0.080 0.074 0.058 0.060
Swanbourne (Inner West Coast) 0.069 0.067 0.070 0.063 0.055 0.073 0.108 0.068 0.057 0.067
Bold numerals indicate where a relevant standard has been exceeded.
For explanation of exceedences in previous years, please refer to the relevant year report.

52
Department of Environment Regulation
2015 Western Australia Air Monitoring Report (August 2016)
Table D54: Annual daily peak one-hour sulfur dioxide concentrations (ppm) for 2006–2015
AAQ NEPM Standard 0.20 ppm (one-hour average)
Regional Performance Monitoring Station 2006 2007 2008 2009 2010 2011 2012 2013 2014 2015
Perth region
Rockingham (South Coast) 0.040 0.041 0.079 0.032 0.037 0.040 0.040 0.037 0.036 0.051
South Lake (South East Metro) 0.060 0.040 0.046 0.036 0.073 0.044 0.039 0.044 0.051 0.037
Wattleup (South Metro) 0.062 0.060 0.077 0.059 0.057 0.067 0.043 0.090 0.061 0.067
Table D55: Annual daily peak 24-hour sulfur dioxide concentrations (ppm) for 2006–2015
AAQ NEPM Standard 0.08 ppm (24-hour average)
Regional Performance Monitoring Station 2006 2007 2008 2009 2010 2011 2012 2013 2014 2015
Perth region
Rockingham (South Coast) 0.007 0.012 0.007 0.008 0.007 0.008 0.006 0.007 0.007 0.013
South Lake (South East Metro) 0.009 0.006 0.005 0.006 0.009 0.006 0.006 0.014 0.010 0.007
Wattleup (South Metro) 0.009 0.010 0.011 0.008 0.010 0.008 0.008 0.010 0.008 0.009

53
Department of Environment Regulation
2015 Western Australia Air Monitoring Report (August 2016)
Table D56: Annual daily peak 24-hour particles as PM10 concentrations (μg/m3) for 2006–2015
AAQ NEPM Standard 50 μg/m3 (24-hour average)
Regional Performance Monitoring Station 2006 2007 2008 2009 2010 2011 2012 2013 2014 2015
Perth region
Caversham (North East Metro) 42.6 58.8 39.1 45.7 63.4 76.1 68.7 62.4 52.6 46.8
Duncraig (North Metro) 40.6 40.3 46.9 45.5 47.9 65.9 89.5 37.6 53.0 82.7
South Lake (South East Metro) 45.3 56.7 55.0 49.0 61.0 66.2 81.5 38.8 44.5 53.3
Southwest region
Bunbury 123.5 46.5 39.1 53.8 134.0 68.4 53.5 46.8 44.5 62.9
Collie - - 85.9 80.4 163.0 61.5 91.7 61.6 73.3 111.9
Albany 39.4 55.7 56.3 36.7 52.5 37.3 37.0 110.8 43.5 76.7
Midwest region
Geraldton 78.0 116.3 150.7 128.9 55.6 63.0 61.5 63.1 55.7 68.1
Bold numerals indicate where a relevant standard has been exceeded.
For explanation of this year’s exceedences, please see Table A9 of this report. For explanation of exceedences in previous years, please refer to the relevant year report. Table D57: Annual daily peak 24-hour particles as PM2.5 concentrations (μg/m3) for 2006–2015
AAQ NEPM Standard 25 μg/m3 (24-hour average)
Regional Performance Monitoring Station 2006 2007 2008 2009 2010 2011 2012 2013 2014 2015
Perth region
Caversham (North East Metro) 34.0 24.5 26.3 25.5 45.2 41.5 45.9 22.6 39.3 30.0
Duncraig (North Metro) 33.4 19.6 38.3 32.7 36.4 52.1 77.3 18.7 47.6 35.8
Quinns Rocks (Outer North Coast) 63.9 19.9 53.3 31.3 33.7 43.2 74.5 19.3 39.5 37.9
South Lake (South East Metro) 30.5 21.2 45.2 32.0 40.0 48.2 71.6 17.1 29.8 34.5
Southwest region
Bunbury 113.5 34.5 27.8 40.0 115.3 45.5 43.0 38.3 34.6 52.1
Busselton 12.7 51.1 35.6 69.0 62.5 85.2 78.0 17.9 25.1 37.8
Bold numerals indicate where a relevant standard has been exceeded.
For explanation of this year’s exceedences, please see Table A9 of this report. For explanation of exceedences in previous years, please refer to the relevant year report.

54
Department of Environment Regulation
2015 Western Australia Air Monitoring Report (August 2016)
Table D58: Annual averaged particles as PM10 concentrations (μg/m3) for 2006–2015
AAQ NEPM Standard 25 μg/m3 (annual average)
Regional Performance Monitoring Station 2006 2007 2008 2009 2010 2011 2012 2013 2014 2015
Perth region
Caversham (North East Metro) 16.9 16.4 14.5 17.1 17.0 16.2 16.8 15.4 17.4 16.7
Duncraig (North Metro) 16.1 15.3 15.0 15.9 15.8 15.3 16.2 15.5 15.5 16.5
South Lake (South East Metro) 19.3 17.7 16.3 17.7 19.0 16.3 16.9 16.6 17.4 17.9
Southwest region
Bunbury 18.6 17.2 15.8 17.6 17.6 17.0 17.5 16.8 16.1 17.5
Collie - - 19.2 20.0 22.8 19.6 20.0 20.1 19.5 22.4
Albany 15.8 14.2 14.6 14.3 15.9 14.3 15.0 15.4 16.0 15.9
Midwest region
Geraldton 22.2 23.0 22.4 23.9 21.7 19.6 21.3 20.9 22.3 20.2
Table D58a: Annual averaged particles as PM2.5 concentrations (μg/m3) for 2006–2015
AAQ NEPM Standard 8 μg/m3 (annual average)
Regional Performance Monitoring Station 2006 2007 2008 2009 2010 2011 2012 2013 2014 2015
Perth region
Caversham (North East Metro) 8.1 7.5 7.1 7.8 8.2 7.0 7.8 7.9 8.1 8.5
Duncraig (North Metro) 8.2 7.3 7.7 8.2 8.2 7.8 8.2 7.6 7.6 8.4
Quinns Rocks (Outer North Coast) 7.8 6.9 7.2 7.8 7.8 7.2 7.9 7.8 8.0 8.3
South Lake (South East Metro) 8.7 7.6 7.7 8.2 8.7 7.8 8.9 8.0 8.1 8.8 Southwest region
Bunbury 8.7 7.8 7.6 8.3 9.2 8.0 8.6 7.8 7.8 9.3
Busselton 6.9 7.4 7.3 9.0 8.5 8.5 8.6 7.7 7.2 8.6
Bold numerals indicate where a relevant standard has been exceeded.

55
Department of Environment Regulation
2015 Western Australia Air Monitoring Report (August 2016)
Attachment 1 – Graphical trends
This attachment provides graphical representations of tables D9 to D49 of Section D.
Each graph shows the maximum, 99th percentile, 98th percentile, 95th percentile and 90th percentile of daily maximum concentration for all pollutants monitored by the Department of Environment Regulation (DER) in Western Australia. The nominated percentiles can also be expressed as an Nth highest concentration.
Based on 100 per cent data recovery and a normal year (i.e. 365 days), the following table gives each percentile an equivalent Nth highest ordinal value. The bracketed numbers represent the exact (as calculated) value of the ordinal number.
Percentile Nth highest
100 1 (maximum)
99 5 (4.65)
98 8 (8.3)
95 19 (19.25)
90 38 (37.5)

56
Department of Environment Regulation
2015 Western Australia Air Monitoring Report (August 2016)
Carbon monoxide
Figure A1-1 - eight-hour carbon monoxide at Caversham
Figure A1-2 - eight-hour carbon monoxide at Duncraig
0.0
1.0
2.0
3.0
4.0
5.0
6.0
2006 2007 2008 2009 2010 2011 2012 2013 2014 2015
part
s p
er
millio
n
Daily peak eight-hour carbon monoxide at Caversham
Max conc. 99th percentile 98th percentile 95th percentile 90th percentile
0.0
1.0
2.0
3.0
4.0
5.0
6.0
2006 2007 2008 2009 2010 2011 2012 2013 2014 2015
part
s p
er
millio
n
Daily peak eight-hour carbon monoxide at Duncraig
Max conc. 99th percentile 98th percentile 95th percentile 90th percentile

57
Department of Environment Regulation
2015 Western Australia Air Monitoring Report (August 2016)
Figure A1-3 - eight-hour carbon monoxide at South Lake
Nitrogen dioxide
Figure A1-4 - one-hour nitrogen dioxide at Caversham
0.0
1.0
2.0
3.0
4.0
5.0
6.0
2006 2007 2008 2009 2010 2011 2012 2013 2014 2015
part
s p
er
millio
n
Daily peak eight-hour carbon monoxide at South Lake
Max conc. 99th percentile 98th percentile 95th percentile 90th percentile
0.00
0.01
0.02
0.03
0.04
0.05
0.06
0.07
0.08
0.09
2006 2007 2008 2009 2010 2011 2012 2013 2014 2015
part
s p
er
millio
n
Daily peak one-hour nitrogen dioxide at Caversham
Max conc. 99th percentile 98th percentile 95th percentile 90th percentile

58
Department of Environment Regulation
2015 Western Australia Air Monitoring Report (August 2016)
Figure A1-5 - one-hour nitrogen dioxide at Duncraig
Figure A1-6 - one-hour nitrogen dioxide at Quinns Rocks
0.00
0.01
0.02
0.03
0.04
0.05
0.06
0.07
2006 2007 2008 2009 2010 2011 2012 2013 2014 2015
part
s p
er
millio
n
Daily peak one-hour nitrogen dioxide at Duncraig
Max conc. 99th percentile 98th percentile 95th percentile 90th percentile
0.00
0.01
0.02
0.03
0.04
0.05
0.06
0.07
2006 2007 2008 2009 2010 2011 2012 2013 2014 2015
part
s p
er
millio
n
Daily peak one-hour nitrogen dioxide at Quinns Rocks
Max conc. 99th percentile 98th percentile 95th percentile 90th percentile

59
Department of Environment Regulation
2015 Western Australia Air Monitoring Report (August 2016)
Figure A1-7 - one-hour nitrogen dioxide at Rockingham
Figure A1-8 - one-hour nitrogen dioxide at Rolling Green
0.00
0.01
0.02
0.03
0.04
0.05
0.06
0.07
2006 2007 2008 2009 2010 2011 2012 2013 2014 2015
part
s p
er
millio
n
Daily peak one-hour nitrogen dioxide at Rockingham
Max conc. 99th percentile 98th percentile 95th percentile 90th percentile
0.00
0.01
0.02
0.03
0.04
0.05
0.06
0.07
2006 2007 2008 2009 2010 2011 2012 2013 2014 2015
part
s p
er
millio
n
Daily peak one-hour nitrogen dioxide at Rolling Green
Max conc. 99th percentile 98th percentile 95th percentile 90th percentile

60
Department of Environment Regulation
2015 Western Australia Air Monitoring Report (August 2016)
Figure A1-9 - one-hour nitrogen dioxide at South Lake
Figure A1-10 - one-hour nitrogen dioxide at Swanbourne
0.00
0.01
0.02
0.03
0.04
0.05
0.06
0.07
2006 2007 2008 2009 2010 2011 2012 2013 2014 2015
part
s p
er
millio
n
Daily peak one-hour nitrogen dioxide at South Lake
Max conc. 99th percentile 98th percentile 95th percentile 90th percentile
0.00
0.01
0.02
0.03
0.04
0.05
0.06
0.07
2006 2007 2008 2009 2010 2011 2012 2013 2014 2015
part
s p
er
millio
n
Daily peak one-hour nitrogen dioxide at Swanbourne
Max conc. 99th percentile 98th percentile 95th percentile 90th percentile

61
Department of Environment Regulation
2015 Western Australia Air Monitoring Report (August 2016)
Ozone
Figure A1-11 one-hour ozone at Caversham
Figure A1-12 –one-hour ozone at Quinns Rocks
0.00
0.02
0.04
0.06
0.08
0.10
0.12
0.14
2006 2007 2008 2009 2010 2011 2012 2013 2014 2015
part
s p
er
millio
n
Daily peak one-hour ozone at Caversham
Max conc. 99th percentile 98th percentile 95th percentile 90th percentile
0.00
0.02
0.04
0.06
0.08
0.10
0.12
0.14
2006 2007 2008 2009 2010 2011 2012 2013 2014 2015
part
s p
er
millio
n
Daily peak one-hour ozone at Quinns Rocks
Max conc. 99th percentile 98th percentile 95th percentile 90th percentile

62
Department of Environment Regulation
2015 Western Australia Air Monitoring Report (August 2016)
Figure A1-13 - one-hour ozone at Rockingham
Figure A1-14 - one-hour ozone at Rolling Green
0.00
0.02
0.04
0.06
0.08
0.10
0.12
0.14
2006 2007 2008 2009 2010 2011 2012 2013 2014 2015
pa
rts p
er
mil
lio
n
Daily peak one-hour ozone at Rockingham
Max conc. 99th percentile 98th percentile 95th percentile 90th percentile
0.00
0.02
0.04
0.06
0.08
0.10
0.12
0.14
2006 2007 2008 2009 2010 2011 2012 2013 2014 2015
pa
rts p
er
mil
lio
n
Daily peak one-hour ozone at Rolling Green
Max conc. 99th percentile 98th percentile 95th percentile 90th percentile

63
Department of Environment Regulation
2015 Western Australia Air Monitoring Report (August 2016)
Figure A1-15 - one-hour ozone at South Lake
Figure A1-16 - one-hour ozone at Swanbourne
0.00
0.02
0.04
0.06
0.08
0.10
0.12
0.14
2006 2007 2008 2009 2010 2011 2012 2013 2014 2015
part
s p
er
millio
n
Daily peak one-hour ozone at South Lake
Max conc. 99th percentile 98th percentile 95th percentile 90th percentile
0.00
0.02
0.04
0.06
0.08
0.10
0.12
0.14
2006 2007 2008 2009 2010 2011 2012 2013 2014 2015
part
s p
er
millio
n
Daily peak one-hour ozone at Swanbourne
Max conc. 99th percentile 98th percentile 95th percentile 90th percentile

64
Department of Environment Regulation
2015 Western Australia Air Monitoring Report (August 2016)
Figure A1-17 - four-hour ozone at Caversham
Figure A1-18 - four-hour ozone at Quinns Rocks
0.00
0.02
0.04
0.06
0.08
0.10
0.12
2006 2007 2008 2009 2010 2011 2012 2013 2014 2015
part
s p
er
millio
n
Daily peak four-hour ozone at Caversham
Max conc. 99th percentile 98th percentile 95th percentile 90th percentile
0.00
0.02
0.04
0.06
0.08
0.10
0.12
2006 2007 2008 2009 2010 2011 2012 2013 2014 2015
part
s p
er
millio
n
Daily peak four-hour ozone at Quinns Rocks
Max conc. 99th percentile 98th percentile 95th percentile 90th percentile

65
Department of Environment Regulation
2015 Western Australia Air Monitoring Report (August 2016)
Figure A1-19 - four-hour ozone at Rockingham
Figure A1-20 - four-hour ozone at Rolling Green
0.00
0.02
0.04
0.06
0.08
0.10
0.12
2006 2007 2008 2009 2010 2011 2012 2013 2014 2015
pa
rts p
er
mil
lio
n
Daily peak four-hour ozone at Rockingham
Max conc. 99th percentile 98th percentile 95th percentile 90th percentile
0.00
0.02
0.04
0.06
0.08
0.10
0.12
2006 2007 2008 2009 2010 2011 2012 2013 2014 2015
pa
rts p
er
mil
lio
n
Daily peak four-hour ozone at Rolling Green
Max conc. 99th percentile 98th percentile 95th percentile 90th percentile

66
Department of Environment Regulation
2015 Western Australia Air Monitoring Report (August 2016)
Figure A1-21 - four-hour ozone at South Lake
Figure A1-22 - four-hour ozone at Swanbourne
0.00
0.02
0.04
0.06
0.08
0.10
0.12
2006 2007 2008 2009 2010 2011 2012 2013 2014 2015
part
s p
er
millio
n
Daily peak four-hour ozone at South Lake
Max conc. 99th percentile 98th percentile 95th percentile 90th percentile
0.00
0.02
0.04
0.06
0.08
0.10
0.12
2006 2007 2008 2009 2010 2011 2012 2013 2014 2015
part
s p
er
millio
n
Daily peak four-hour ozone at Swanbourne
Max conc. 99th percentile 98th percentile 95th percentile 90th percentile

67
Department of Environment Regulation
2015 Western Australia Air Monitoring Report (August 2016)
Sulfur dioxide
Figure A1-23 - one-hour sulfur dioxide at Rockingham
Figure A1-24 - one-hour sulfur dioxide at South Lake
0.00
0.02
0.04
0.06
0.08
0.10
0.12
2006 2007 2008 2009 2010 2011 2012 2013 2014 2015
part
s p
er
millio
n
Daily peak one-hour sulfur dioxide at Rockingham
Max conc. 99th percentile 98th percentile 95th percentile 90th percentile
0.00
0.02
0.04
0.06
0.08
0.10
0.12
2006 2007 2008 2009 2010 2011 2012 2013 2014 2015
pa
rts p
er
mil
lio
n
Daily peak one-hour sulfur dioxide at South Lake
Max conc. 99th percentile 98th percentile 95th percentile 90th percentile

68
Department of Environment Regulation
2015 Western Australia Air Monitoring Report (August 2016)
Figure A1-25 - one-hour sulfur dioxide at Wattleup
Figure A1-26 - 24-hour sulfur dioxide at Rockingham
0.00
0.02
0.04
0.06
0.08
0.10
0.12
2006 2007 2008 2009 2010 2011 2012 2013 2014 2015
pa
rts p
er
mil
lio
n
Daily peak one-hour sulfur dioxide at Wattleup
Max conc. 99th percentile 98th percentile 95th percentile 90th percentile
0.00
0.01
0.02
0.03
2006 2007 2008 2009 2010 2011 2012 2013 2014 2015
part
s p
er
millio
n
Daily peak 24-hour sulfur dioxide at Rockingham
Max conc. 99th percentile 98th percentile 95th percentile 90th percentile

69
Department of Environment Regulation
2015 Western Australia Air Monitoring Report (August 2016)
Figure A1-27 - 24-hour sulfur dioxide at South Lake
Figure A1-28 - 24-hour sulfur dioxide at Wattleup
0.00
0.01
0.02
0.03
2006 2007 2008 2009 2010 2011 2012 2013 2014 2015
pa
rts p
er
mil
lio
n
Daily peak 24-hour sulfur dioxide at South Lake
Max conc. 99th percentile 98th percentile 95th percentile 90th percentile
0.00
0.01
0.02
0.03
2006 2007 2008 2009 2010 2011 2012 2013 2014 2015
pa
rts p
er
mil
lio
n
Daily peak 24-sulfur dioxide at Wattleup
Max conc. 99th percentile 98th percentile 95th percentile 90th percentile

70
Department of Environment Regulation
2015 Western Australia Air Monitoring Report (August 2016)
Particles as PM10
Figure A1-29 - 24-hour PM10 at Caversham
Figure A1-30 - 24-hour PM10 at Duncraig
0
20
40
60
80
100
120
2006 2007 2008 2009 2010 2011 2012 2013 2014 2015
mic
rog
ram
s p
er
cu
bic
me
tre
Daily peak 24-hour particles as PM10 at Caversham
Max conc. 99th percentile 98th percentile 95th percentile 90th percentile
0
20
40
60
80
100
120
2006 2007 2008 2009 2010 2011 2012 2013 2014 2015
mic
rog
ram
s p
er
cu
bic
metr
e
Daily peak 24-hour particles as PM10 at Duncraig
Max conc. 99th percentile 98th percentile 95th percentile 90th percentile

71
Department of Environment Regulation
2015 Western Australia Air Monitoring Report (August 2016)
Figure A1-31 - 24-hour PM10 at South Lake
Figure A1-32 - 24-hour PM10 at Bunbury
0
20
40
60
80
100
120
2006 2007 2008 2009 2010 2011 2012 2013 2014 2015
mic
rog
ram
s p
er
cu
bic
metr
e
Daily peak 24-hour particles as PM10 at South Lake
Max conc. 99th percentile 98th percentile 95th percentile 90th percentile
0
20
40
60
80
100
120
140
160
2006 2007 2008 2009 2010 2011 2012 2013 2014 2015
mic
rog
ram
s p
er
cu
bic
me
tre
Daily peak 24-hour particles as PM10 at Bunbury
Max conc. 99th percentile 98th percentile 95th percentile 90th percentile

72
Department of Environment Regulation
2015 Western Australia Air Monitoring Report (August 2016)
Figure A1-33 - 24-hour PM10 at Collie
Figure A1-34 - 24-hour PM10 at Albany
0
20
40
60
80
100
120
140
160
180
2006 2007 2008 2009 2010 2011 2012 2013 2014 2015
mic
rog
ram
s p
er
cu
bic
me
tre
Daily peak 24-hour particles as PM10 at Collie
Max conc. 99th percentile 98th percentile 95th percentile 90th percentile
0
20
40
60
80
100
120
2006 2007 2008 2009 2010 2011 2012 2013 2014 2015
mic
rog
ram
s p
er
cu
bic
metr
e
Daily peak 24-hour particles as PM10 at Albany
Max conc. 99th percentile 98th percentile 95th percentile 90th percentile

73
Department of Environment Regulation
2015 Western Australia Air Monitoring Report (August 2016)
Figure A1-35 - 24-hour PM10 at Geraldton
0
20
40
60
80
100
120
140
160
2006 2007 2008 2009 2010 2011 2012 2013 2014 2015
mic
rog
ram
s p
er
cu
bic
me
tre
Daily peak 24-hour particles as PM10 at Geraldton
Max conc. 99th percentile 98th percentile 95th percentile 90th percentile

74
Department of Environment Regulation
2015 Western Australia Air Monitoring Report (August 2016)
Particles as PM2.5
Figure A1-36 - 24-hour PM2.5 at Caversham
Figure A1-37 - 24-hour PM2.5 at Duncraig
0
10
20
30
40
50
60
70
80
2006 2007 2008 2009 2010 2011 2012 2013 2014 2015
mic
rog
ram
s p
er
cu
bic
metr
e
Daily peak 24-hour particles as PM2.5 at Caversham
Max conc. 99th percentile 98th percentile 95th percentile 90th percentile
0
10
20
30
40
50
60
70
80
2006 2007 2008 2009 2010 2011 2012 2013 2014 2015
mic
rog
ram
s p
er
cu
bic
metr
e
Daily peak 24-hour particles as PM2.5 at Duncraig
Max conc. 99th percentile 98th percentile 95th percentile 90th percentile

75
Department of Environment Regulation
2015 Western Australia Air Monitoring Report (August 2016)
Figure A1-38 - 24-hour PM2.5 at Quinns Rocks
Figure A1-39 - 24-hour PM2.5 at South Lake
0
10
20
30
40
50
60
70
80
2006 2007 2008 2009 2010 2011 2012 2013 2014 2015
mic
rog
ram
s p
er
cu
bic
me
tre
Daily peak 24-hour particles as PM2.5 at Quinns Rocks
Max conc. 99th percentile 98th percentile 95th percentile 90th percentile
0
10
20
30
40
50
60
70
80
2006 2007 2008 2009 2010 2011 2012 2013 2014 2015
mic
rog
ram
s p
er
cu
bic
me
tre
Daily peak 24-hour particles as PM2.5 at South Lake
Max conc. 99th percentile 98th percentile 95th percentile 90th percentile

76
Department of Environment Regulation
2015 Western Australia Air Monitoring Report (August 2016)
Figure A1-40 - 24-hour PM2.5 at Bunbury
Figure A1-41 - 24-hour PM2.5 at Busselton
0
20
40
60
80
100
120
2006 2007 2008 2009 2010 2011 2012 2013 2014 2015
mic
rog
ram
s p
er
cu
bic
me
tre
Daily peak 24-hour particles as PM2.5 at Bunbury
Max conc. 99th percentile 98th percentile 95th percentile 90th percentile
0
20
40
60
80
100
120
2006 2007 2008 2009 2010 2011 2012 2013 2014 2015
mic
rog
ram
s p
er
cu
bic
me
tre
Daily peak 24-hour particles as PM2.5 at Busselton
Max conc. 99th percentile 98th percentile 95th percentile 90th percentile

77
Department of Environment Regulation
2015 Western Australia Air Monitoring Report (August 2016)
Attachment 2 – Exceedence summary
The following pages contain information specific to each parameter exceeding the relevant NEPM standard during 2015. Each analysis is provided in date order and may include one or more of a satellite image of the region, a back trajectory, concentration and/or wind plots together with information on the specific concentrations reached and possible sources.
Each back trajectory is specific to one event and shows a possible path that a parcel of air may have taken through space to have arrived at a particular location at a certain time. Where multiple trajectories are included on one map, the times and back trajectories displayed are those ending at the indicated location at 3am (red), 6am (orange), 9am (yellow), noon (green), 3pm (blue), 6pm (mauve), 9pm (purple) and midnight (black). A back trajectory does no more than use the wind speed and direction information recorded at various monitoring sites to track a simple path backwards to a possible origin site. Some major assumptions made in the calculation of these back trajectories, such as the meteorological conditions, can be interpolated between sites and no air dispersion throughout the path, create large uncertainties in the predicted path and must be acknowledged. Notwithstanding, the back trajectories as calculated provide a reasonable first approximation for the possible path taken by an air parcel in arriving at its destination.
Satellite images are obtained from https://earthdata.nasa.gov/labs/worldview where available and cloud cover does not obscure the plume.
Abbreviations are occasionally used to represent air monitoring sites. The more common of these are:
Metropolitan sites Regional sites
Ca Caversham Al Albany
Du Duncraig Bu Bunbury
QR Quinns Rocks Bn Busselton
Ro Rockingham Co Collie
RG Rolling Green Ge Geraldton
SL South Lake
Sw Swanbourne
Wt Wattleup

78
Department of Environment Regulation
2015 Western Australia Air Monitoring Report (August 2016)
9 January 2015
Back trajectory over 14 hours ending at Geraldton at the indicated times.
Fire map showing hot spot locations from Aqua / MODIS (https://earthdata.nasa.gov/labs/worldview)
60 minute averaged time series plot of PM10 at Geraldton.
Pollutant
PM10
Monitoring Site
Geraldton
NEPM Standard
PM10 – 50.0 µg/m3
Averaging Period
24 hours
Concentration (µg/m3)
57.7 µg/m3
Description of Event
South easterly winds for the majority of the day causing long range transport of smoke from bushfire north of Boonanarring nature reserve.

79
Department of Environment Regulation
2015 Western Australia Air Monitoring Report (August 2016)
3 February 2015
Fire map showing hot spot locations from Aqua / MODIS (https://earthdata.nasa.gov/labs/worldview)
60 minute averaged time series plot of PM10 at Collie.
Pollutant
PM10
Monitoring Site
Collie
NEPM Standard
PM10 – 50.0 µg/m3
Averaging Period
24 hours
Concentration (µg/m3)
54.0 µg/m3
Description of Event
A Lower Hotham Bushfire (about 20,000 ha) was dumping a lot of ash on the town of Collie through the night.

80
Department of Environment Regulation
2015 Western Australia Air Monitoring Report (August 2016)
6 February 2015
Fire map showing hot spot locations from Aqua / MODIS (https://earthdata.nasa.gov/labs/worldview)
60 minute averaged time series plot of PM10 (blue) and PM2.5 (red) at South Lake and Collie.
60 minute averaged time series plot of PM10 (blue) and PM2.5 (red) at Bunbury.
Pollutant
PM10 & PM2.5
Monitoring Sites
Site Parameter
South Lake PM10 & PM2.5
Collie PM10
Quinns Rocks PM2.5
Duncraig PM2.5
Caversham PM2.5
Bunbury PM2.5
NEPM Standards
PM10 – 50.0 µg/m3 PM2.5 – 25.0 µg/m3
Averaging Period
24 hours
Concentrations (µg/m3)
Site PM10 PM2.5
South Lake 53.3 34.5
Collie 56.2
Quinns Rocks 37.9
Duncraig 48.8 35.8
Caversham 37.2 27.6
Bunbury 42.8 35.0
Description of Event
Smoke from a Lower Hotham Bushfire (about 20,000 ha) caused smoke impacts in the southwest and Perth metropolitan areas.

81
Department of Environment Regulation
2015 Western Australia Air Monitoring Report (August 2016)
7 February 2015
Back trajectory over 24 hours ending at Busselton at the indicated times.
60 minute averaged time series plot of PM2.5 at Busselton (black) and Bunbury PM10 (blue) and PM2.5 (red).
Pollutant
PM2.5
Monitoring Sites
Busselton
NEPM Standards
PM2.5 – 25.0 µg/m3
Averaging Period
24 hours
Concentrations (µg/m3)
37.8 µg/m3
Description of Event
Smoke from a Lower Hotham Bushfire (about 20,000 ha) caused smoke impacts in the southwest and Perth metropolitan areas.

82
Department of Environment Regulation
2015 Western Australia Air Monitoring Report (August 2016)
8 February 2015
Back trajectory over 24 hours ending at Geraldton at the indicated times.
60 minute averaged time series plot of PM10 at Geraldton.
5 minute averaged time series plot of wind speed at Geraldton.
Pollutant
PM10
Monitoring Sites
Geraldton
NEPM Standards
PM10 – 50.0 µg/m3
Averaging Period
24 hours
Concentrations (µg/m3)
52.5 µg/m3
Description of Event
Possibly caused by recirculation of smoke from fires located in the southwest of the state.
Wind speeds at Geraldton were low for the majority of the day.
There were no fires in the vicinity of Geraldton.

83
Department of Environment Regulation
2015 Western Australia Air Monitoring Report (August 2016)
9 February 2015
Fire map showing hot spot locations from Terra / MODIS (https://earthdata.nasa.gov/labs/worldview)
60 minute averaged time series plot of PM10 at Collie.
Pollutant
PM10 & PM2.5
Monitoring Sites
Site Parameter
South Lake PM2.5
Collie PM10
NEPM Standards
PM10 – 50.0 µg/m3 PM2.5 – 25.0 µg/m3
Averaging Period
24 hours
Concentrations (µg/m3)
Site PM10 PM2.5
South Lake 46.3 28.9
Collie 79.4
Description of Event
Smoke from a Lower Hotham Bushfire (about 20,000 ha) caused smoke impacts in the southwest and Perth metropolitan areas.

84
Department of Environment Regulation
2015 Western Australia Air Monitoring Report (August 2016)
10 February 2015
Back trajectory over 12 hours ending at 1600 (4pm) at Rolling Green.
Fire map showing hot spot locations from Department of Fire and Emergency Services. http://www.dfes.wa.gov.au/alerts/Pages/alertsmap.aspx
60 minute averaged time series plot of ozone at Caversham and Rolling Green.
Pollutant
O3, PM10 & PM2.5
Monitoring Sites
Site Parameter
Ca O3 (103 ppb 1hr)
O3 (84 ppb 4 hr)
PM2.5 (29.7 µg/m3)
Du PM2.5 (28.2 µg/m3)
RG O3 (105 ppb 1hr)
O3 (93 ppb 4 hr)
SL PM10 (51.0 µg/m3)
PM2.5 (30.8 µg/m3)
QR PM2.5 (35.8 µg/m3)
Bu PM10 (62.9 µg/m3)
PM2.5 (52.1 µg/m3)
Bs PM2.5 (35.5 µg/m3)
Co PM10 (68.5 µg/m3)
Ge PM10 (68.1 µg/m3)
NEPM Standards
O3 – 100 ppb (1 hr)
O3 – 80 ppb (4 hr)
PM10 – 50.0 µg/m3 (24 hr)
PM2.5 – 25.0 µg/m3 (24 hr)
Description of Event
Fires in the southern Perth suburbs of Hammond Park, Success, The Spectacles, Wellard and Baldivis.
Geraldton smoke was a recirculation of smoke from fires in the southwest of the state.

85
Department of Environment Regulation
2015 Western Australia Air Monitoring Report (August 2016)
23 February 2015
Back trajectory over 24 hours ending at Geraldton at the indicated times.
60 minute averaged time series plot of particles at Geraldton.
Pollutant
PM10
Monitoring Sites
Geraldton
NEPM Standards
PM10 – 50.0 µg/m3
Averaging Period
24 hours
Concentrations (µg/m3)
63.1 µg/m3
Description of Event
Possible local activity.
There were no fires in the vicinity of Geraldton.

86
Department of Environment Regulation
2015 Western Australia Air Monitoring Report (August 2016)
24 February 2015
Back trajectory over 24 hours ending at Geraldton at the indicated times.
60 minute averaged time series plot of particles at Geraldton.
Pollutant
PM10
Monitoring Sites
Geraldton
NEPM Standards
PM10 – 50.0 µg/m3
Averaging Period
24 hours
Concentrations (µg/m3)
62.3 µg/m3
Description of Event
Possible local activity.
There were no fires in the vicinity of Geraldton.

87
Department of Environment Regulation
2015 Western Australia Air Monitoring Report (August 2016)
22 April 2015
Fire map showing hot spot locations from Aqua / MODIS (https://earthdata.nasa.gov/labs/worldview)
60 minute averaged time series plot of particles at Bunbury and Collie.
Pollutant
PM10 & PM2.5
Monitoring Sites
Site Parameter
Collie PM10
Bunbury PM2.5
NEPM Standards
PM10 – 50.0 µg/m3 PM2.5 – 25.0 µg/m3
Averaging Period
24 hours
Concentrations (µg/m3)
Site PM10 PM2.5
Collie 82.7
Bunbury 49.9 39.9
Description of Event
Prescribed burn 15km east of Collie (2,800Ha).

88
Department of Environment Regulation
2015 Western Australia Air Monitoring Report (August 2016)
10 May 2015
Fire map showing hot spot locations from Aqua / MODIS (https://earthdata.nasa.gov/labs/worldview)
60 minute averaged time series plot of PM10 (blue) and PM2.5 (red) at Caversham.
Pollutant
PM2.5
Monitoring Sites
Caversham
NEPM Standards
PM10 – 50.0 µg/m3 PM2.5 – 25.0 µg/m3
Averaging Period
24 hours
Concentrations (µg/m3)
Site PM10 PM2.5
Caversham 33.1 28.3
Description of Event
A number of prescribed burns were conducted in and around Perth metropolitan region.

89
Department of Environment Regulation
2015 Western Australia Air Monitoring Report (August 2016)
11 May 2015
Fire map showing hot spot locations from Aqua / MODIS (https://earthdata.nasa.gov/labs/worldview)
60 minute averaged time series plot of PM10 (blue) and PM2.5 (red) at South Lake.
Pollutant
PM2.5
Monitoring Sites
South Lake
NEPM Standards
PM10 – 50.0 µg/m3 PM2.5 – 25.0 µg/m3
Averaging Period
24 hours
Concentrations (µg/m3)
Site PM10 PM2.5
South Lake 41.2 33.6
Description of Event
A number of prescribed burns were conducted in and around Perth metropolitan region.

90
Department of Environment Regulation
2015 Western Australia Air Monitoring Report (August 2016)
14 May 2015
Fire map showing hot spot locations from Aqua / MODIS (https://earthdata.nasa.gov/labs/worldview)
60 minute averaged time series plot of PM10 (blue) and PM2.5 (red) at various sites including South Lake.
Pollutant
PM2.5
Monitoring Sites
South Lake
NEPM Standards
PM10 – 50.0 µg/m3 PM2.5 – 25.0 µg/m3
Averaging Period
24 hours
Concentrations (µg/m3)
Site PM10 PM2.5
South Lake 43.0 32.9
Description of Event
A number of prescribed burns were conducted in and around Perth metropolitan region.

91
Department of Environment Regulation
2015 Western Australia Air Monitoring Report (August 2016)
26 September 2015
Fire map showing hot spot locations from Aqua / MODIS (https://earthdata.nasa.gov/labs/worldview)
60 minute averaged time series plot of PM10 at Collie.
Pollutant
PM10
Monitoring Sites
Collie
NEPM Standards
PM10 – 50.0 µg/m3
Averaging Period
24 hours
Concentrations (µg/m3)
Site PM10
Collie 55.7
Description of Event
A number of prescribed burns were conducted in the southwest including 4,000 hectares south of Collie.

92
Department of Environment Regulation
2015 Western Australia Air Monitoring Report (August 2016)
8 October 2015
Fire map showing hot spot locations from Aqua / MODIS (https://earthdata.nasa.gov/labs/worldview)
60 minute averaged time series plot of PM10 (blue) and PM2.5 (red).
Pollutant
PM10
Monitoring Sites
Collie
NEPM Standards
PM10 – 50.0 µg/m3
Averaging Period
24 hours
Concentrations (µg/m3)
Site PM10
Collie 66.6
Description of Event
A number of prescribed burns were conducted in the southwest including 500 hectares 16 km south-west of Collie and 500 hectares 9km north-west of Collie.

93
Department of Environment Regulation
2015 Western Australia Air Monitoring Report (August 2016)
9 October 2015
Fire map showing hot spot locations from Aqua / MODIS (https://earthdata.nasa.gov/labs/worldview)
60 minute averaged time series plot of PM10 (blue) and PM2.5 (red).
Pollutant
PM2.5
Monitoring Sites
Bunbury
NEPM Standards
PM10 – 50.0 µg/m3 PM2.5 – 25.0 µg/m3
Averaging Period
24 hours
Concentrations (µg/m3)
Site PM10 PM2.5
Bunbury 47.8 34.8
Description of Event
A number of prescribed burns were conducted in the southwest including 500 hectares 16 km south-west of Collie and 500 hectares 9km north-west of Collie.

94
Department of Environment Regulation
2015 Western Australia Air Monitoring Report (August 2016)
10 October 2015
Fire map showing hot spot locations from Aqua / MODIS (https://earthdata.nasa.gov/labs/worldview)
60 minute averaged time series plot of PM10 (blue) and PM2.5 (red).
Pollutant
PM10 & PM2.5
Monitoring Sites
Collie (PM10) Caversham (PM2.5) Duncraig (PM2.5) Bunbury (PM2.5)
NEPM Standards
PM10 – 50.0 µg/m3 PM2.5 – 25.0 µg/m3
Averaging Period
24 hours
Concentrations (µg/m3)
Site PM10 PM2.5
Collie 111.9 NA
Caversham 39.9 26.8
Duncraig 39.8 26.2
Bunbury 33.3 25.4
Description of Event
A number of prescribed burns were conducted in the southwest.

95
Department of Environment Regulation
2015 Western Australia Air Monitoring Report (August 2016)
11 October 2015
Fire map showing hot spot locations from Aqua / MODIS (https://earthdata.nasa.gov/labs/worldview)
60 minute averaged time series plot of PM10 (blue) and PM2.5 (red).
Pollutant
PM2.5
Monitoring Sites
Bunbury
NEPM Standards
PM10 – 50.0 µg/m3 PM2.5 – 25.0 µg/m3
Averaging Period
24 hours
Concentrations (µg/m3)
Site PM10 PM2.5
Bunbury 38.5 30.6
Description of Event
A number of prescribed burns were conducted in the southwest.

96
Department of Environment Regulation
2015 Western Australia Air Monitoring Report (August 2016)
13 October 2015
Fire map showing hot spot locations from Terra / MODIS (https://earthdata.nasa.gov/labs/worldview)
60 minute averaged time series plot of PM10 (blue) and PM2.5 (red).
Pollutant
PM10
Monitoring Sites
Collie
NEPM Standards
PM10 – 50.0 µg/m3
Averaging Period
24 hours
Concentrations (µg/m3)
Site PM10
Collie 53.7
Description of Event
A number of prescribed burns were conducted in the southwest.

97
Department of Environment Regulation
2015 Western Australia Air Monitoring Report (August 2016)
28 October 2015
Fire map showing hot spot locations from Terra / MODIS (https://earthdata.nasa.gov/labs/worldview)
60 minute averaged time series plot of PM10 (blue) and PM2.5 (red).
Pollutant
PM10 & PM2.5
Monitoring Sites
Bunbury
NEPM Standards
PM10 – 50.0 µg/m3 PM2.5 – 25.0 µg/m3
Averaging Period
24 hours
Concentrations (µg/m3)
Site PM10 PM2.5
Bunbury 50.8 44.8
Collie 25.0 NA
Description of Event
A number of prescribed burns were conducted to the east of Bunbury at a location 18 km WSW of Collie.
Collie did not exceed the NEPM standard for PM10.

98
Department of Environment Regulation
2015 Western Australia Air Monitoring Report (August 2016)
4–5 November 2015
Fire map showing hot spot locations from Aqua / MODIS (https://earthdata.nasa.gov/labs/worldview)
60 minute averaged time series plot of PM10 (blue) and PM2.5 (red).
Pollutant
PM10 and PM2.5
Monitoring Sites
Bunbury
NEPM Standards
PM10 – 50.0 µg/m3 PM2.5 – 25.0 µg/m3
Averaging Period
24 hours
Concentrations (µg/m3)
Date PM10 PM2.5
04/11/2015 40.9 35.1
05/11/2015 50.2 N/A
Description of Event
A number of prescribed burns were conducted to the south of Bunbury. All other sites met the NEPM with the highest Perth metropolitan concentrations at Duncraig of 30.7 µg/m3 (PM10) and 24.6 µg/m3 (PM2.5).
Series of back trajectories over 10 hours for 3am, 6am, 9am, 12noon, 3pm, 6pm, 9pm and midnight on 04/11/2015.

99
Department of Environment Regulation
2015 Western Australia Air Monitoring Report (August 2016)
12 November 2015
Fire map showing hot spot locations from Aqua / MODIS (https://earthdata.nasa.gov/labs/worldview)
60 minute averaged time series plot of PM10 (blue) and PM2.5 (red).
Pollutant
PM2.5
Monitoring Sites
Bunbury
NEPM Standards
PM10 – 50.0 µg/m3 PM2.5 – 25.0 µg/m3
Averaging Period
24 hours
Concentrations (µg/m3)
Site PM10 PM2.5
Bunbury 41.5 31.6
Description of Event
A number of prescribed burns were conducted to the south of Bunbury. All other sites met the NEPM with the highest Perth metropolitan concentrations at South Lake of 28.2 µg/m3 (PM10) and Caversham of 12.6 µg/m3 (PM2.5).
Bunbury did not exceed the NEPM standard for PM10.
Series of back trajectories over 10 hours for 3am, 6am, 9am, 12noon, 3pm, 6pm, 9pm and midnight on 12/11/2015.

100
Department of Environment Regulation
2015 Western Australia Air Monitoring Report (August 2016)
13–14 November 2015
Fire map showing hot spot locations from Aqua / MODIS (https://earthdata.nasa.gov/labs/worldview)
60 minute averaged time series plot of PM10 from DER regional sites.
Pollutant
PM10
Monitoring Sites
Albany
NEPM Standards
PM10 – 50.0 µg/m3
Averaging Period
24 hours
Concentrations (µg/m3)
Date PM10
13/11/2015 56.9 µg/m3
14/11/2015 76.7 µg/m3
Description of Event
A number of prescribed burns were conducted between 30 and 60 km south-east of Manjimup (6,500 Ha) and south-east of Rocky Gully (4,900 Ha).
All other sites met the NEPM with the highest Perth metropolitan concentrations at South Lake of 26.2 µg/m3 (PM10) and Quinns Rocks of 11.1 µg/m3 (PM2.5).

101
Department of Environment Regulation
2015 Western Australia Air Monitoring Report (August 2016)
22 November 2015
Fire map showing hot spot locations on 21/11/2015 (left) and 22/11/2015 (right) from Aqua / MODIS (https://earthdata.nasa.gov/labs/worldview)
60 minute averaged time series plot of PM10 (blue) and PM2.5 (red).
Pollutant
PM10
Monitoring Sites
Collie
NEPM Standards
PM10 – 50.0 µg/m3
Averaging Period
24 hours
Concentrations (µg/m3)
Site PM10
Collie 52.2
Description of Event
A number of prescribed burns were conducted both north and south of the Perth metropolitan region.
The highest metropolitan sites were South Lake and Duncraig which both recorded 24 hour averaged PM10 of over 37 µg/m3.
Active control burns around Collie on 22/11/2015.

102
Department of Environment Regulation
2015 Western Australia Air Monitoring Report (August 2016)
23 November 2015
Fire map showing hot spot locations from Aqua / MODIS
(https://earthdata.nasa.gov/labs/worldview)
Series of back trajectories over six hours for 3am, 6am, 9am, 12noon, 3pm, 6pm, 9pm and midnight on 23/11/2015.
60 minute averaged time series plot of PM10 (blue) and PM2.5 (red) at Caversham.
Pollutant
PM2.5
Monitoring Sites
Caversham
NEPM Standards
PM10 – 50.0 µg/m3 PM2.5 – 25.0 µg/m3
Averaging Period
24 hours
Concentrations (µg/m3)
Site PM10 PM2.5
Caversham 46.8 30.0
Description of Event
Smoke from bushfires in North Muchea in the shires of Chittering and Gingin impacted the Perth metropolitan region.
http://www.skynews.com.au/news/top-stories/2015/11/22/bushfire-threatens-homes-and-lives-in-wa.html#sthash.Wsz7cpyL.dpuf :
No other site exceeded the NEPM particle standards.

103
Department of Environment Regulation
2015 Western Australia Air Monitoring Report (August 2016)
27–28 November 2015
Fire map showing hot spot locations from Aqua / MODIS
(https://earthdata.nasa.gov/labs/worldview)
60 minute averaged time series plot of PM2.5 (Black) at Busselton and PM10 (blue) and PM2.5 (red) at Bunbury.
Pollutant
PM2.5
Monitoring Sites
Busselton
NEPM Standards
PM2.5 – 25.0 µg/m3
Averaging Period
24 hours
Concentrations (µg/m3)
Site PM10 PM2.5
27/11/2015 NA 27.3
28/11/2015 NA 26.4
Description of Event
2,000 Ha prescribed burn 33 km west of Manjimup caused elevated smoke haze in Busselton.

104
Department of Environment Regulation
2015 Western Australia Air Monitoring Report (August 2016)
3 December 2015
Council clearance of drainage pit within Duncraig compound.
5 minute (upper) and 60 minute (lower) averaged time series plot of PM10 (blue) and PM2.5 (red) data at Duncraig for 03/12/2015.
Pollutant
PM10
Monitoring Sites
Duncraig
NEPM Standards
PM10 – 50.0 µg/m3
PM2.5 – 25.0 µg/m3 Averaging Period
24 hours
Concentrations (µg/m3)
Site PM10 PM2.5
Duncraig 82.7 18.1
Description of Event
Council cleanup of drainage pit at the Duncraig compound caused a local exceedence of the NEPM PM10 standard. Note the lower levels coinciding with the standard morning tea break taken between 10am and 10:15am.
There were no other exceedences within the metropolitan region.