2015/2016 hr / reward practices survey - kpmg us … have designed the 2016 edition of the hr/reward...
TRANSCRIPT

2015/2016HR / Reward Practices Survey
September 2016
kpmg.com/ng
Tax, Regulatory & People ServicesKPMG in Nigeria

Executive OverviewThe prevailing economic headwinds present Human Resources (HR) professionals with an enormous challenge of helping businesses survive the downturn, while also repositioning to optimise future opportunities. HR realises that a strategic approach, beyond cutting costs and heads, is required to ensure sustainability. To discharge this strategic role, HR requires the right and complete information to demonstrate that proposed reforms are appropriate for steering the business in a positive direction. Internal and external data are required to form a holistic view of issues and determine how best to respond. In line with KPMG’s objective of inspiring confidence and empowering change for companies, we have designed the 2016 edition of the HR/Reward Practices Survey to focus on how companies are dealing with the prevailing economic slowdown. Armed with the right information, an organisation can better review existing programmes, policies and practices, with a view to cutting needless cost, while enhancing efficiency, effectiveness and better alignment with strategic objectives.
We are, therefore, pleased to present the findings from the 4th Edition of the KPMG Annual HR/Reward Practices Survey (“the Survey”). We have expanded the Survey to enhance its robustness and relevance to participants. Majority of companies have either Down/Right-Sized and / or placed a Freeze on Recruitment.
Salary Cuts, on the other hand, are not common. We also noted other measures such as Zero-Based Budgeting, Optimising Cost via Infrastructure Transformation and Reduction in Travel Cost as strategies for surviving the tough times.
Based on the survey results, 76% of the participants implemented salary increases of up to 10% in 2015. Based on our experience of the market, the two major drivers of the increase are inflation and collective bargaining agreements with employee unions. 33% of the respondents review their pay structure every year. It is however left to be seen what the actual pay movements for 2016 will be, in light of the economic uncertainties and widespread focus on cost containment.
In 2017, we expect to see strident agitation by unions for some palliative measures to cushion the effect of the recession on employees. This may, therefore, threaten the relatively-peaceful relationship between unions and management.
The survey showed that the culture of Workcation1 and Sale of Vacation, which are common in the global market, is still alien to the Nigerian market, as 82% and 100% of the respondents, respectively, do not currently adopt these practices.
The survey covers the following key areas:
1. The WorldatWork Society for Human Resources Professionals defines Workcation as “…a situation where employees are provided perks by allowing them log in remotely from vacation destination, but not have those days counted against their leave days”.
HR/Reward Strategy
Compensation & Benefits
Work-Life
HR/ REWARDPRACTICES
Employee Engagement, Development & Career Opportunities
Performance & Recognition
HR Policies

32015/ 2016 HR Rewards Practices Survey
© 2016. KPMG Advisory Services, a partnership registered in Nigeria and a member firm of the KPMG network of independent member firms affiliated with KPMG International Cooperative (‘’KPMG International’’), a Swiss entity. All rights reserved.
0%
Avi
atio
n/ Tr
ansp
ort
Mar
itim
e
Bui
ldin
g M
ater
ials
/C
onst
ruct
ion
Con
glom
erat
es
Con
sulti
ng
FMC
G
Ban
king
Oth
er N
on-B
anki
ng
Fina
ncia
l Ins
titut
ions
)
Hea
lthca
re a
ndP
harm
aceu
tical
s
ICT
& P
aySy
tem
s
Insu
ranc
e
Oil
& G
as(U
pstr
eam
)
Oil
& G
as (S
ervi
ces
& M
arke
ting)
E-C
omm
erce
Tele
com
mun
icat
ions
Oth
ers
2%
4%
6%
8%
10%
12%
14%
16%
18%
20%Survey Participants by Industry Sector
Industry Sector
0.83%
3.31%
2.48%1.65%
4.13%
11.57%
15.70%
18.18%
4.13%3.31%
10.74%
13.22%
6.61%
0.83%
3.31%
500 - < 1,000
≥ 1,000
47.4
11.6
9.5
22.0
6.3
3.2
%
100 - < 500
1 - < 50
50 - < 100
≤ 1
2,000 - 4,999
≥ 10,000
100 - 499
2%1%
500 - 999
5,000 - 9,9991,000 - 1,999
< 100
0%
5%
10%
15%
20%
25%
30%
35%
40%
18%
34%
21%
7%
17%
Respondents Demography
One hundred and twenty-one (121) organizations spanning various sectors of the economy participated in the survey exercise. The sectors covered include Financial Services, Consumer Market, Oil & Gas (Upstream, Mid-Stream and Downstream), Healthcare, Aviation, and Telecommunications. The scope of the survey covers companies with turnover of up to N1 trillion and staff strength ranging from 100 to over 10,000 employees.
Financial Turnover of Survey Participants (N’Billion)
Staff Strength of Survey Participants

Key Findings

52015/ 2016 HR Rewards Practices Survey
© 2016. KPMG Advisory Services, a partnership registered in Nigeria and a member firm of the KPMG network of independent member firms affiliated with KPMG International Cooperative (‘’KPMG International’’), a Swiss entity. All rights reserved.
How Organisations Have Responded to the Economic Recession
0% 20%
Cost cutting/management
Budget freeze
Outsourcing
Recruitment freeze
Salary cut
Salary freeze
Downsized/rightsized
40% 60%
43
20
9
53
15
28
14
80% 100%
Cost containment measures dominate companies’ response to economy downturn
Given the pressure on income, majority of the survey respondents have cut heads or placed embargo on recruitment to keep the business running on lean resources as much as possible. Other measures adopted include budget freeze, salary freeze, outsourcing and zero-based budget. Salary cuts are, however,
unpopular, possibly due to the demotivational effect on employees. Some companies have adopted a more strategic approach such as challenging junior staff to do the work of more senior staff, albeit with some supervision provided.
Note: Multiple responses are possible for this survey item, hence, the total percentage is more than 100%.

6 2015/ 2016 HR Rewards Practices Survey
© 2016. KPMG Advisory Services, a partnership registered in Nigeria and a member firm of the KPMG network of independent member firms affiliated with KPMG International Cooperative (‘’KPMG International’’), a Swiss entity. All rights reserved.
Expectedly, the Oil & Gas Sector had the highest prevalence of Recruitment Freeze and Downsizing at 71% and 57%, respectively, followed by the Consumer Market.
Sector Composition
Financial Services Banking, Non-Banking Institutions & Insurance
Telecommunications & ICT E-Commerce, ICT & Pay Systems, Telecommunications
Oil & Gas Exploration & Production (E&P), Oil Services & Marketing
Consumer Markets Building Materials/ Construction, Conglomerates, FMCG, Healthcare & Pharmaceuticals
Others Aviation, Transport, Maritime, Consulting, Not-for-Profit Organisations
Note: Multiple responses are possible for this survey item, hence, the total percentage is more than 100%.
0%
10%
20%
30%
40%
50%
60%
70%
80%
Financial Services
Telecommunications& ICT
Oil & Gas OthersConsumer Markets
Budget Freeze
Salary Freeze
Outsourcing
Downsized/ Rightsized
Other Measures Taken
Recruitment Freeze
Cost Cutting/ Management
Salary Cut
29
0 0 0 0 0 0 0
14
34
11
43
17
29
17
51
60
20 20 20 21
1414
39
5760
14
29
6
1717
31
11
29
7169
29 29 29
Response to Economic Conditions Per Sector

72015/ 2016 HR Rewards Practices Survey
© 2016. KPMG Advisory Services, a partnership registered in Nigeria and a member firm of the KPMG network of independent member firms affiliated with KPMG International Cooperative (‘’KPMG International’’), a Swiss entity. All rights reserved.
Expected contraction in pay reviews
58% of the respondents review their salaries annually, while 33% review their pay structure every year. Based on the survey results, 76% of the participants carried out salary increases of up to 10% in 2015. Based on our experience of the market, two major drivers of the 2015 increases are inflation and collective bargaining agreements with unions, as most companies
struggled with business results. It is, however, left to be seen what the actual pay movements for 2016 will be, given the lingering economic uncertainties and focus on cost containment. Contrary to the responses reported above, we are of the opinion that actual pay increases in 2016 will contract.
Twice a year
Annually
Once every two years
Not Defines
Frequency of Salary Reviews
58%18%
3%
21%Less than 5%
5 - 10%
10 - 15%
Above 15%
No Increase
Actual Salary Increase in 2015
48%
28%19%
3% 2%
8 2015/ 2016 HR Rewards Practices Survey
© 2016. KPMG Advisory Services, a partnership registered in Nigeria and a member firm of the KPMG network of independent member firms affiliated with KPMG International Cooperative (‘’KPMG International’’), a Swiss entity. All rights reserved.
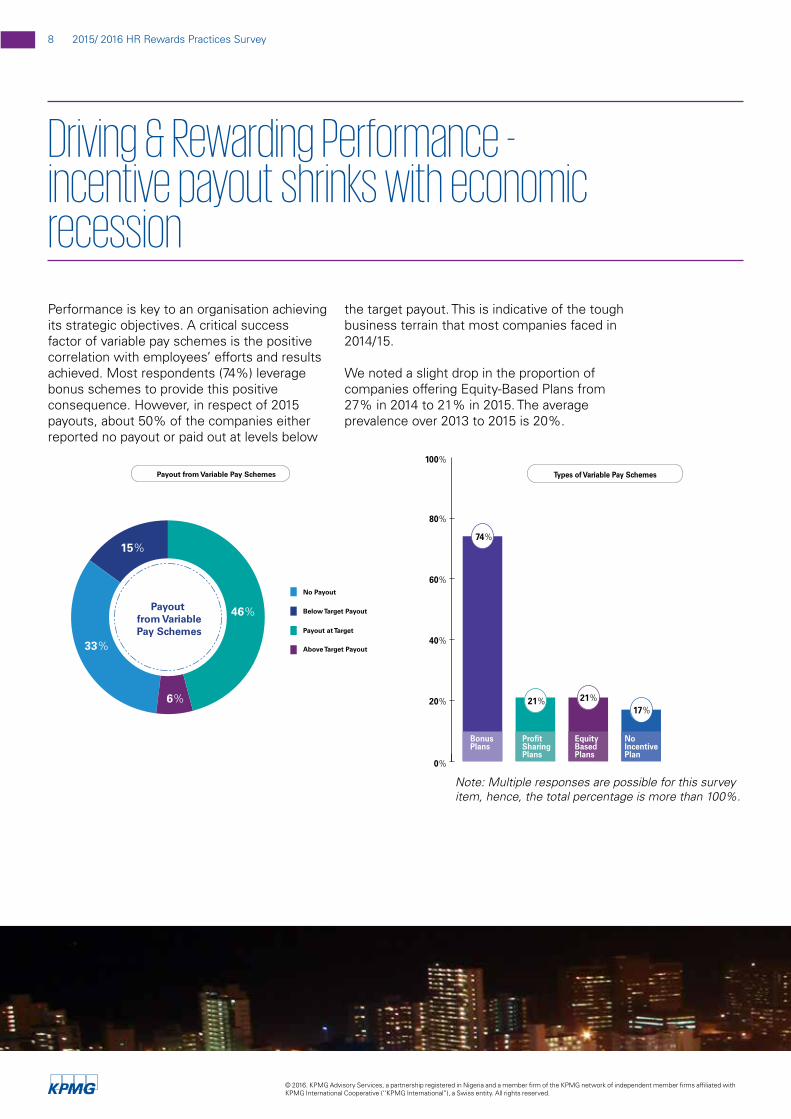
Driving & Rewarding Performance - incentive payout shrinks with economic recession
Performance is key to an organisation achieving its strategic objectives. A critical success factor of variable pay schemes is the positive correlation with employees’ efforts and results achieved. Most respondents (74%) leverage bonus schemes to provide this positive consequence. However, in respect of 2015 payouts, about 50% of the companies either reported no payout or paid out at levels below
the target payout. This is indicative of the tough business terrain that most companies faced in 2014/15.
We noted a slight drop in the proportion of companies offering Equity-Based Plans from 27% in 2014 to 21% in 2015. The average prevalence over 2013 to 2015 is 20%.
46%
33%
15%
6%
Payout from Variable Pay Schemes
No Payout
Below Target Payout
Payout at Target
Above Target Payout
Payout from VariablePay Schemes
0%
20%
40%
60%
80%
100%
74%
21% 21%17%
Types of Variable Pay Schemes
Profit Sharing Plans
EquityBased Plans
NoIncentive Plan
Bonus Plans
Note: Multiple responses are possible for this survey item, hence, the total percentage is more than 100%.

92015/ 2016 HR Rewards Practices Survey
© 2016. KPMG Advisory Services, a partnership registered in Nigeria and a member firm of the KPMG network of independent member firms affiliated with KPMG International Cooperative (‘’KPMG International’’), a Swiss entity. All rights reserved.
Documenting pay strategy enhances alignment with business objectives
Pay PhilosophyThere is a drop in the proportion of companies aiming to anchor pay at above the market median, while there is an increase in the percentage of companies anchoring pay below the median
Companies must ensure alignment between Business, HR and Reward Strategies in order to achieve their objectives. The process of ensuring alignment often entails defining and documenting the approach and belief as to how employees will be remunerated in order to attract, retain and motivate top talents in the
business. 72% of respondents adopt written pay strategies, compared to 70% in 2014. This improvement in proportion of companies documenting their pay strategy may be an indication of increased awareness on best practices.
A pay philosophy is broadly an organisation’s belief as to how its employees should be paid. It defines a peer group for benchmarking purposes as well as a market-anchor point for pay. 38% (48% in 2014) of respondents aim to anchor pay above the median of their respective markets, while 35% (27% in 2014) aim to anchor at / below the median. 27% of the respondents, however, do not have defined philosophies. We noted that about 37% of the companies without a defined philosophy also do not have a defined or documented reward strategy.
8% 10%
27% 27%
28%
Distribution of Organizations by Pay Philosophy
0 - 25th Percentile 76 - 100th Percentile
26 - 50th Percentile
51 - 75th Percentile
Not Defined

10 2015/ 2016 HR Rewards Practices Survey
© 2016. KPMG Advisory Services, a partnership registered in Nigeria and a member firm of the KPMG network of independent member firms affiliated with KPMG International Cooperative (‘’KPMG International’’), a Swiss entity. All rights reserved.
Communicating payMost respondents prefer emails and individual letters
Communication is key to preserving the message embedded in reward programmes as well as enhancing employee buy-in. For optimal results, a communication strategy should adopt a combination of different channels for getting the message across to employees. Most of the participants tend to prefer Emails and Individual Letters in communicating reward programmes to their people. The least explored communication channel is Meetings with Employee Groups. Although Line Managers could be a powerful means of communication, only 50% of participants leverage them for “selling” their reward programmes.
50%
Strategies Adopted by Companies for CommunicatingHR/ Reward Programmes
Through line Managers
4% Do not Communicate
46%Meeting with Employee Groups
66%Emails
67%IndividualLetters
Note: Multiple responses are possible for this survey item, hence, the total percentage is more than 100%.
112015/ 2016 HR Rewards Practices Survey
© 2016. KPMG Advisory Services, a partnership registered in Nigeria and a member firm of the KPMG network of independent member firms affiliated with KPMG International Cooperative (‘’KPMG International’’), a Swiss entity. All rights reserved.
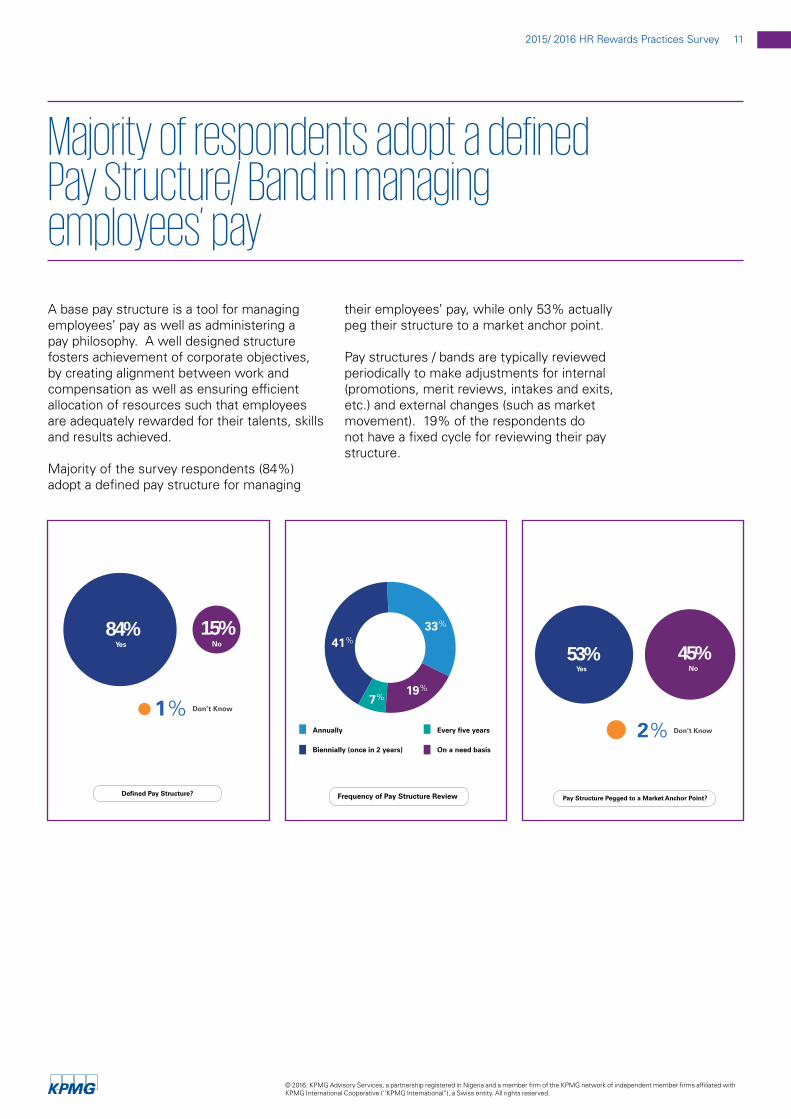
Majority of respondents adopt a defined Pay Structure/ Band in managing employees’ pay
A base pay structure is a tool for managing employees’ pay as well as administering a pay philosophy. A well designed structure fosters achievement of corporate objectives, by creating alignment between work and compensation as well as ensuring efficient allocation of resources such that employees are adequately rewarded for their talents, skills and results achieved.
Majority of the survey respondents (84%) adopt a defined pay structure for managing
their employees’ pay, while only 53% actually peg their structure to a market anchor point.
Pay structures / bands are typically reviewed periodically to make adjustments for internal (promotions, merit reviews, intakes and exits, etc.) and external changes (such as market movement). 19% of the respondents do not have a fixed cycle for reviewing their pay structure.
Don’t Know
Yes No
1%
84% 15%
Defined Pay Structure?
33%
19%
41%
7%
Frequency of Pay Structure Review
Annually
Biennially (once in 2 years)
Every five years
On a need basis
Don’t Know2%
Yes No
53% 45%
Pay Structure Pegged to a Market Anchor Point?
12 2015/ 2016 HR Rewards Practices Survey
© 2016. KPMG Advisory Services, a partnership registered in Nigeria and a member firm of the KPMG network of independent member firms affiliated with KPMG International Cooperative (‘’KPMG International’’), a Swiss entity. All rights reserved.
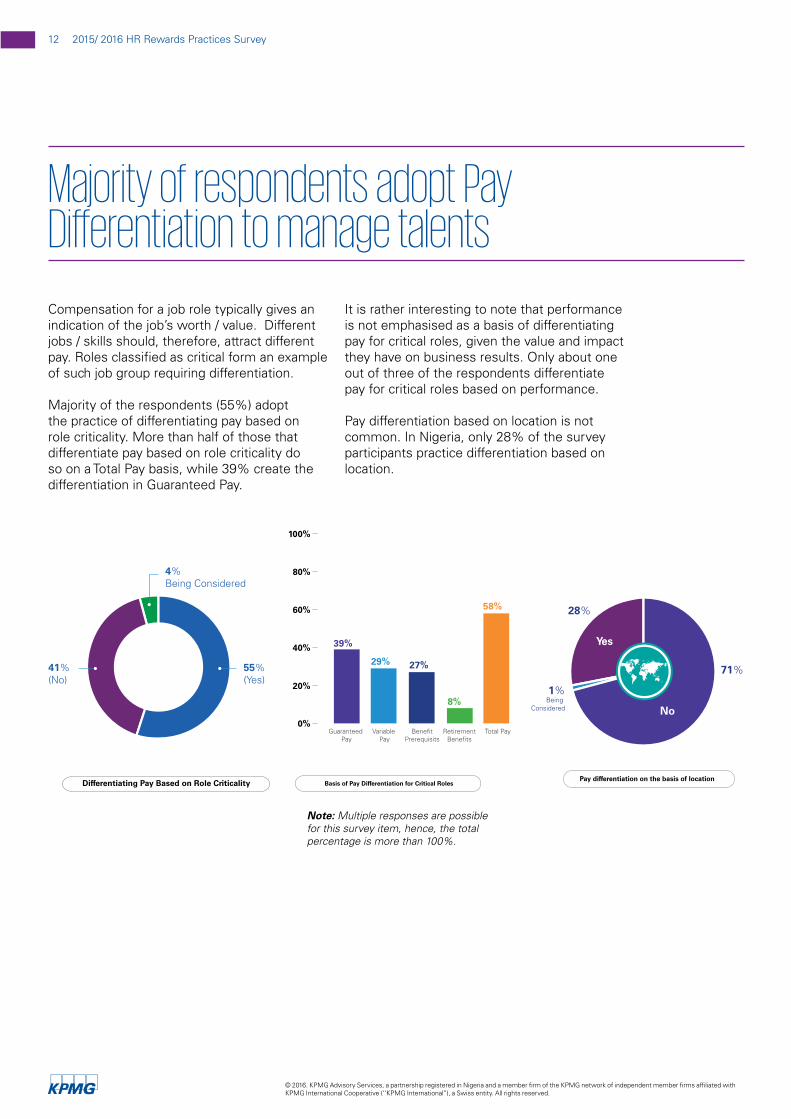
Majority of respondents adopt Pay Differentiation to manage talents
Compensation for a job role typically gives an indication of the job’s worth / value. Different jobs / skills should, therefore, attract different pay. Roles classified as critical form an example of such job group requiring differentiation.
Majority of the respondents (55%) adopt the practice of differentiating pay based on role criticality. More than half of those that differentiate pay based on role criticality do so on a Total Pay basis, while 39% create the differentiation in Guaranteed Pay.
It is rather interesting to note that performance is not emphasised as a basis of differentiating pay for critical roles, given the value and impact they have on business results. Only about one out of three of the respondents differentiate pay for critical roles based on performance.
Pay differentiation based on location is not common. In Nigeria, only 28% of the survey participants practice differentiation based on location.
55% (Yes)
41% (No)
4% Being Considered
Differentiating Pay Based on Role Criticality
0%
40% 39%
Guaranteed Pay
Variable Pay
BenefitPrerequisits
RetirementBenefits
Total Pay
29% 27%
8%
58%
20%
60%
80%
100%
Basis of Pay Differentiation for Critical RolesPay differentiation on the basis of location
1%Being
Considered
71%
28%
No
Yes
Note: Multiple responses are possible for this survey item, hence, the total percentage is more than 100%.

132015/ 2016 HR Rewards Practices Survey
© 2016. KPMG Advisory Services, a partnership registered in Nigeria and a member firm of the KPMG network of independent member firms affiliated with KPMG International Cooperative (‘’KPMG International’’), a Swiss entity. All rights reserved.
Most respondents leverage remuneration surveys in determining employees’ pay
70% of the participating companies rely on market data to take pay decisions for their employees. Management Discretion also plays a large role in pay decisions, according to 57% of the respondents, while 39% consider Inflation. This result shows that pay decisions are mostly taken based on several considerations.
Information obtained through remuneration surveys provides employers with a more accurate view of pay levels and HR practices within their selected pay market. They are therefore better positioned to take informed pay decisions. Armed with the right information, companies can actually save crucial cost, at a time of heightened focus on cost containment.
Majority of the companies that rely on market surveys define their comparator group mostly based on companies in the same industry segment (86%). Fewer companies consider competition for talent and organisational size and efficiency in selecting their pay peers.
0%
20%
40%
60%
80%
100% How Employees Pay Levels are Determined
70% 57% 39% 6%
Market Survey
ManagementDiscretion
Inflation No Defined Basis
0% 20% 40% 60% 80% 100%
Factors that Drive Peer Group Selection
29%
12%
37%
86%
No Defined Basis
Companies that YouHire from or Lose
Talents to
Companies in the Same Industry
Segment
Companies of Similar Size &
Efficiency
Note: Multiple responses are possible for this survey item, hence, the total percentage is more than 100%.
Note: Multiple responses are possible for this survey item, hence, the total percentage is more than 100%.

14 2015/ 2016 HR Rewards Practices Survey
© 2016. KPMG Advisory Services, a partnership registered in Nigeria and a member firm of the KPMG network of independent member firms affiliated with KPMG International Cooperative (‘’KPMG International’’), a Swiss entity. All rights reserved.
Majority of participants use up to two (2) salary surveys for their market pricing analysis
Pension Reforms in Nigeria
Best practice requires that companies utilise more than one salary survey data for taking pay decisions. This practice enables companies to validate the market data they are receiving from different survey providers. In addition, a number of companies are able to combine the different data by applying weights to derive a more balanced view for a robust decision.
Based on the survey results, 53% of the respondents utilise up to two (2) surveys for their pay decisions, as shown in the adjacent chart:
Number of Salary Surveys Used for Market Pricing Analysis
25% - None
26% - One
27% - Two
10% - Three
12% - More than Three
Type of Pension Scheme
5%Defined Benefit &
Defined Contribution
5%Defined Benefit
90%Defined
Contribution
Two years on, most companies have adopted the prescribed minimum contributory rates
Most of the pension schemes in the responding companies are Defined Contribution (DC) in nature (90%). This is not unexpected, given the provisions of the Pension Reform Act, 2014. 87% of the respondents adopt the minimum Employer and Employee contributions rates of 10% and 8% of Gross Emolument (GE), respectively. 85% of the companies have defined GE as the aggregate of Basic, Housing and Transport Allowances.

152015/ 2016 HR Rewards Practices Survey
© 2016. KPMG Advisory Services, a partnership registered in Nigeria and a member firm of the KPMG network of independent member firms affiliated with KPMG International Cooperative (‘’KPMG International’’), a Swiss entity. All rights reserved.
Definition of Gross Emolument for DC Pension Contribution
7%
5%
3%
85%
BHT + Other Allowances
etc.
All Cash Allowances
Basic & Housing Allowances Only
Basic, Housing & Transportation
Allowances (BHT)0% 20% 40% 60% 80% 100%
Employee & Employer Contribution Rates
13%
87%Employer (10)Employee (8)
Employer (Above 10)Employee (Other Rates)

16 2015/ 2016 HR Rewards Practices Survey
© 2016. KPMG Advisory Services, a partnership registered in Nigeria and a member firm of the KPMG network of independent member firms affiliated with KPMG International Cooperative (‘’KPMG International’’), a Swiss entity. All rights reserved.
Most Gratuity Schemes are still Defined Benefit in nature
Prior to the introduction of the mandatory DC Pension regime, Gratuity Schemes were widespread and constituted the major form of retirement benefit for employees in the private sector. Following the mandatory pension regime, we have witnessed a significant decline in the number of companies providing both gratuity and pension. In addition, the cost of managing the schemes has made them unattractive. Companies still operating gratuity schemes are looking for ways to exit them.
56% of the respondents still operate gratuity schemes. Majority of the schemes (77%) are DB schemes, while 69% have some sort of funding in place to back the scheme obligations.
Gratuity Scheme Provided?
56% 44%Yes No
Gratuity Scheme Funded?
4%Partially Funded
31%No
65%Yes
Type of Gratuity Scheme
23%DC
77%DB

172015/ 2016 HR Rewards Practices Survey
© 2016. KPMG Advisory Services, a partnership registered in Nigeria and a member firm of the KPMG network of independent member firms affiliated with KPMG International Cooperative (‘’KPMG International’’), a Swiss entity. All rights reserved.
For companies thinking of restructuring gratuity, most wish to close the scheme to new and existing staff
21% of the companies are considering restructuring their gratuity scheme to address the issue of cost escalation. Most of the companies considering a restructuring (72%) are thinking of closing the scheme to both
new hires and existing staff. Also, 85% of the companies recognise Employee Union buy-in as critical for any restructuring efforts to succeed.
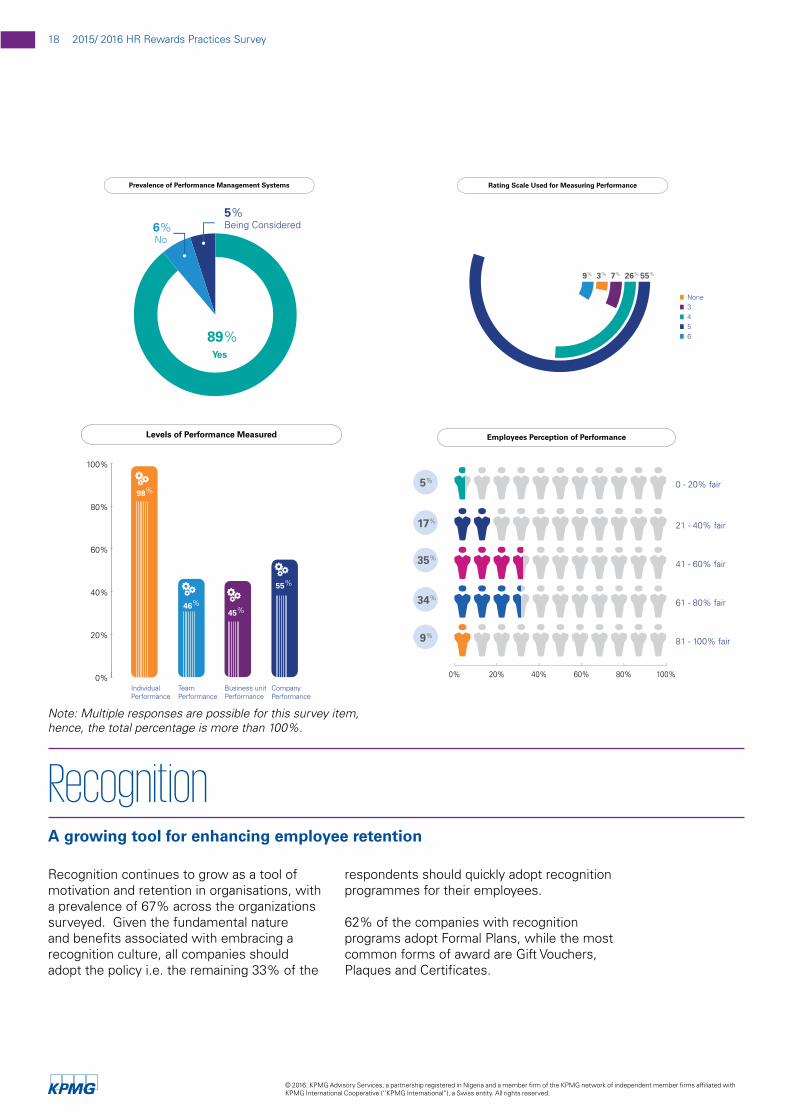
Effective Performance Management (EPM) is key for realising the optimal capabilities of an organisation’s workforce. An EPM system is key to aligning employees’ focus and efforts with strategic objectives.
89% of the respondents have a Performance Management System (PMS) in place. While organisations measure performance across
different levels in the business, majority (98%) focus on individual performance. Majority of the PMS (81%) adopt 4 or 5 point rating scale in measuring employee performance levels. 69% of the companies say their PMS are fair and equitable to a very large extent.
79%
21%
No
Yes
Plans to Restructure Gratuity Scheme?
28
45
Nature of Grauity Restructuring Being Considered
%27
Scheme Closure to New
Hires Only
Scheme Closure to All Staff
Others
Yes
15%85%
No
Consideration of Union input in Gratuity Restructuring
Performance management is critical, but how fair are the systems?
18 2015/ 2016 HR Rewards Practices Survey
© 2016. KPMG Advisory Services, a partnership registered in Nigeria and a member firm of the KPMG network of independent member firms affiliated with KPMG International Cooperative (‘’KPMG International’’), a Swiss entity. All rights reserved.
Recognition continues to grow as a tool of motivation and retention in organisations, with a prevalence of 67% across the organizations surveyed. Given the fundamental nature and benefits associated with embracing a recognition culture, all companies should adopt the policy i.e. the remaining 33% of the
respondents should quickly adopt recognition programmes for their employees.
62% of the companies with recognition programs adopt Formal Plans, while the most common forms of award are Gift Vouchers, Plaques and Certificates.
Yes
89%
6%No
5%Being Considered
Prevalence of Performance Management Systems
0%
20%
40%
60%
80%
100%
IndividualPerformance
TeamPerformance
CompanyPerformance
Business unitPerformance
Levels of Performance Measured
98%
46%45%
55%
55%26%7%3%9%
None3456
Rating Scale Used for Measuring Performance
0% 20% 40% 60% 80% 100%
17%
35%
34%
9%
5%
21 - 40% fair
41 - 60% fair
61 - 80% fair
81 - 100% fair
0 - 20% fair
Employees Perception of Performance
Recognition
Note: Multiple responses are possible for this survey item, hence, the total percentage is more than 100%.
A growing tool for enhancing employee retention

192015/ 2016 HR Rewards Practices Survey
© 2016. KPMG Advisory Services, a partnership registered in Nigeria and a member firm of the KPMG network of independent member firms affiliated with KPMG International Cooperative (‘’KPMG International’’), a Swiss entity. All rights reserved.
Being Considered
Yes
No
Prevalence of Recognition Schemes
7%
26%
67%
0%
20%
40%
60%
80%
100%
Formal Informal Both
Types of Recognition Programme in Place
62%
8%
30%
Money Gift Vouchers/ Items
Forms of Recognition Award
33% 76%
PaySabbaticals
9%
Plaques Certificates
61% 55%
Others
15%
20 2015/ 2016 HR Rewards Practices Survey
© 2016. KPMG Advisory Services, a partnership registered in Nigeria and a member firm of the KPMG network of independent member firms affiliated with KPMG International Cooperative (‘’KPMG International’’), a Swiss entity. All rights reserved.
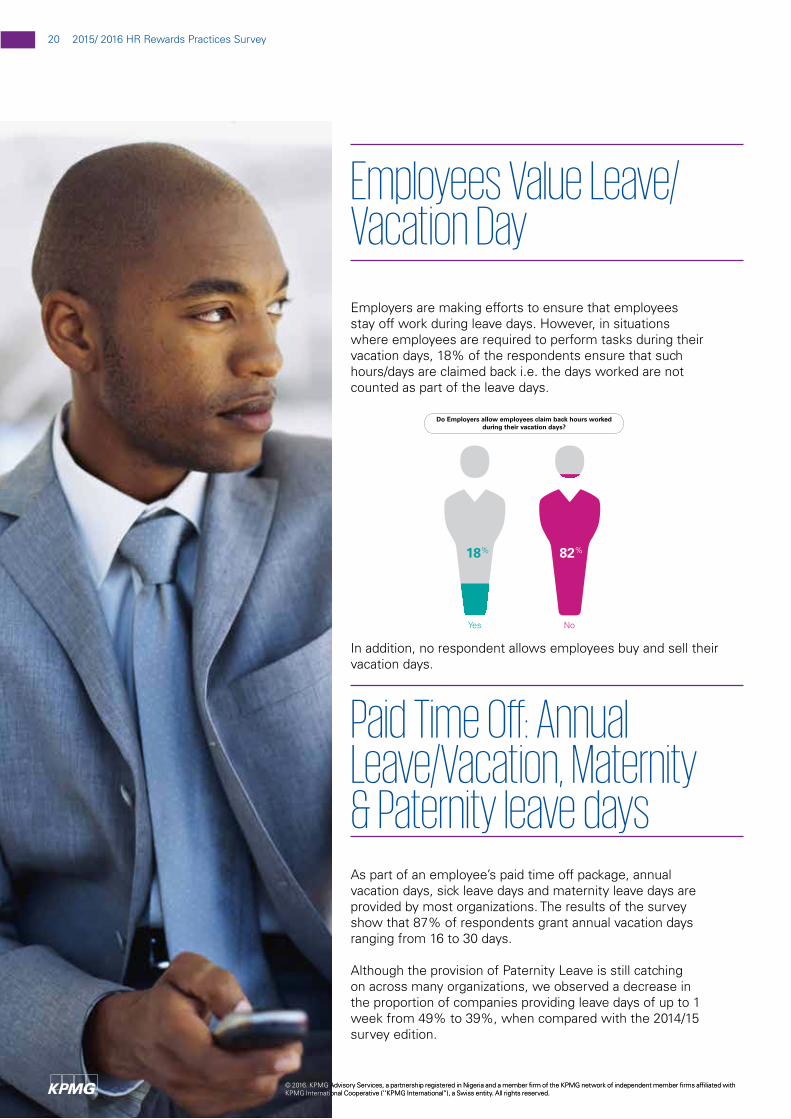
Do Employers allow employees claim back hours workedduring their vacation days?
NoYes
82%18%
Employers are making efforts to ensure that employees stay off work during leave days. However, in situations where employees are required to perform tasks during their vacation days, 18% of the respondents ensure that such hours/days are claimed back i.e. the days worked are not counted as part of the leave days.
In addition, no respondent allows employees buy and sell their vacation days.
As part of an employee’s paid time off package, annual vacation days, sick leave days and maternity leave days are provided by most organizations. The results of the survey show that 87% of respondents grant annual vacation days ranging from 16 to 30 days.
Although the provision of Paternity Leave is still catching on across many organizations, we observed a decrease in the proportion of companies providing leave days of up to 1 week from 49% to 39%, when compared with the 2014/15 survey edition.
Employees Value Leave/Vacation Day
Paid Time Off: Annual Leave/Vacation, Maternity & Paternity leave days
© 2016. KPMG Advisory Services, a partnership registered in Nigeria and a member firm of the KPMG network of independent member firms affiliated with KPMG International Cooperative (‘’KPMG International’’), a Swiss entity. All rights reserved.

212015/ 2016 HR Rewards Practices Survey
© 2016. KPMG Advisory Services, a partnership registered in Nigeria and a member firm of the KPMG network of independent member firms affiliated with KPMG International Cooperative (‘’KPMG International’’), a Swiss entity. All rights reserved.
Duration of Paternity Leave - 2014 & 2015
None
2015 2014
Up to 1 Week
1 - 2 Weeks
Above 2 weeks
0%
20%
40%
60%
80%
100%
56% 45% 39% 49%6%
0%2% 3%
Can Maternity/ Annual Leave be Taken in One Financial Year?
No
Yes
Being Considered
56%
40%
12%
0%
20%
40%
60%
80%
100%
Duration of Annual Leave
11%
2%
87%
16 - 30 days
31 - 45 days
0 - 15 days
Duration of Maternity leave - 2014 & 2015
0%
20%
40%
60%
80%
100%
2015
3 months 4 months0 months 2 months Above 4 months
2014
12%
87%
1%0%0%0% 2%7%
89%
2%
Scheduling Annual/ Maternity Leave
0%
20%
40%
60%
80%
100%
It must be taken at a stretch
It must be spaced out
12.5%
87.5%
For Maternity Leave, majority of the companies (89%) offer three (3) months, while 9% are more generous, providing a minimum of four (4) months leave, compared to 87% and 13%, respectively, in 2014. The survey results also reveal that 40% of respondents allow female employees take annual and maternity leave in same financial year. 12.5% of this group allow both leave periods to be taken at a stretch, while the other 87.5% require that they should be spaced out.

22 2015/ 2016 HR Rewards Practices Survey
© 2016. KPMG Advisory Services, a partnership registered in Nigeria and a member firm of the KPMG network of independent member firms affiliated with KPMG International Cooperative (‘’KPMG International’’), a Swiss entity. All rights reserved.
Length of Annual/ Maternity Leave
12%
Yes
44%No
44%
Being Considered
Types of Work-life Initiatives
55% FlexibleWork Hours
1% Pay Sabbaticals
31% SportingFacilities
11% CompanyCreche
13% Remote Work Policy
23% Others
Employers Who Offer Subsidized Loans to Employees
55% 38% 7%
NoYes Being Considered
Work - Life Initiatives
Loan Subsidy
WorldatWork studies show that work-life initiatives contribute to several positive business outcomes such as reduced labour costs, improved work flow planning, increased employee loyalty and satisfaction, and consequently, improved productivity as employees are given the opportunity, to flexibly manage both work and personal lives to meet their needs and that of the organization.
The survey results show that 44% of the respondents have implemented work-life initiatives for their employees. Flexible Working Hours and Sporting Facilities are still the most prevalent initiatives. The survey also reveals that only 13% of the organisations allow employees to Work Remotely. The survey findings also highlight the need for management to be more supportive of the policy of allowing workers to work remotely, extending flexible hours to all levels of staff, while considering flexible resumption time.
Loan Subsidy is a benefit-in-kind and income protection programme for employees.
In respect of respondents that provide loan subsidy, we observed a 5% decrease from 60% in the 2014/15 to 55% in this edition of the survey.

How we can help
At KPMG, our purpose is to inspire confidence and empower change. We are dedicated to helping our clients take informed decisions and realise their investment in their employees. Through our multi-disciplinary team of experienced and qualified professionals, you can count on us as a valuable partner in the following areas of People Services:
1. Board Remuneration Committee Support 2. Change Management 3. Contract Personnel Recruitment and
Administration 4. Country Briefing5. Executive Resourcing and Workforce Assessment6. HR Function Optimization / HR Transformation 7. Immigration Support Services 8. Incentive Schemes Design9. Organisation Design for Performance 10. Payroll Outsourcing 11. Remuneration Strategy, Compensation
Benchmarking and Design12. Talent Management13. Workforce Optimization / Workforce Cost
Enhancements
Upcoming KPMG Open Training Programmes
1 October 4 – 5, 2016Pay-for-Performance: Strategies for Driving Em-ployee Engagement
2 October 11, 2016Analytical Skills for HR & Reward Practitioners
HR/Reward practitioners are increasingly required to play strategic roles in defining corporate goals and developing capabilities and structures towards achieving the goals. At a time such as the lingering recession, HR needs to support the business in taking decisions and adopting measures to ensure sustainability and repositioning for future growth opportunities. We believe the 2015/16 HR / Reward Practices Survey Report provides valuable information to enable HR/Reward professionals function more strategically. In terms of communicating effectiveness and alignment of HR/Reward programmes to market practice and strategic objectives, companies require critical and complete benchmark data.
As a partner desiring to inspire confidence and empower change, KPMG will continue to make available such information via its various forms of industry surveys and HR thought leadership materials.
Conclusion

The information contained in this document is of a general nature and is not intended to address the circumstances of any particular individual or entity. Although we endeavour to provide accurate and timely information, there can be no guarantee that such information is accurate as of the date it is provided or that it will continue to be accurate in the future. No one should act on such information without appropriate professional advice after a thorough examination of the particular situation.
© 2016 KPMG Advisory Services, a partnership registered in Nigeria and a member firm of the KPMG network of independent member firms affiliated with KPMG International Cooperative (‘’KPMG International’’), a Swiss entity. All rights reserved.
kpmg.com/socialmedia kpmg.com/appkpmg.com/socialmedia kpmg.com/app
Uchechi AnanabaManager, People ServicesTax, Regulatory & People Services T: +234 803 891 2051 E: [email protected]
Nneka Jethro-Iruobe Manager, People ServicesTax, Regulatory & People Services T: +234 808 313 3012E: [email protected]
David Uzosike Manager, People ServicesTax, Regulatory & People Services T: +234 803 402 1043 E: [email protected]
Lucky Sada Manager, People ServicesTax, Regulatory & People Services T: +234 803 403 5538E: [email protected]
Oludolapo Ogunkanmi Manager, People ServicesTax, Regulatory & People Services T: +234 803 853 7737E: [email protected]
Boluwaji Apanpa Senior Manager, People ServicesTax, Regulatory & People Services T: +234 706 417 1642 E: [email protected]
Nike Yomi-FaseunSenior Manager, People ServicesTax, Regulatory & People Services T: +234 803 402 1044 E: [email protected]
Adewale Ajayi Partner, Tax, Regulatory & People Services T: +234 803 402 1014E: [email protected]
Contact us