2016 14 financial risk, main bank system, and cost ... · 2 abstract we examine the relationship...
TRANSCRIPT
2016-14
Financial Risk, Main Bank System, and Cost Behavior: Empirical Evidence from Japan
Mami Koyama Tomohisa Kitada Takehisa Kajiwara
1
Financial Risk, Main Bank System, and Cost Behavior:
Empirical Evidence from Japan
Mami Koyama*
Tomohisa Kitada
Takehisa Kajiwara
Graduate School of Business Administration
Kobe University, Kobe, JAPAN
December 1, 2016
_________________________
*Corresponding author. 2-1, Rokkodai, Nada, Kobe, JAPAN 657-8501; +81 78 803 6988;
2
ABSTRACT
We examine the relationship between financial risk and cost behavior, both theoretically and
empirically. We suggest that financial risk will affect the degree of discretion in managerial
resource adjustment decisions by its impacts on financial flexibility. As expected, our results
show that financial risk increases the degree of cost anti-stickiness in the case of a prior activity
decrease. On the other hand, financial risk appears to have no statistically significant influence
on cost behavior in the case of a prior activity increase. This result is not consistent with our
prediction. We also examine the moderating effect of the close relationships between firms and
banks on the association between financial risk and asymmetric cost behavior using data on the
main bank system in Japan. Consistent with our prediction, our results show that firms’ close ties
with the main banks mitigate the adverse impacts of financial risk and allow managers to adjust
resources flexibly in response to sales changes, even if the firms face high financial risk.
JEL Classification: M41, D24, D81, G32, G33
Keywords: Cost Stickiness, Cost Behavior, Financial Risk, Main Bank System
3
1. Introduction
In recent years, the volume of literature on cost behavior based on archival data has grown
significantly (e.g., Anderson et al. 2003; Balakrishnan et al. 2004; Banker et al. 2013; Banker et
al. 2014a; Banker and Chen 2006; Cannon 2014; Chen et al. 2012; Kama and Weiss 2013; Weiss
2010). The traditional textbook model explains that costs change mechanically in proportion to
the level of activity volume. In contrast, recent studies have documented asymmetric cost
behavior, in which the magnitude of the changes in costs in response to changes in activity
volume depends on the direction of the activity volume changes due to managers’ deliberate
resource adjustment decisions in order to maximize the value of firms (e.g., Anderson et al.
2003; Banker et al. 2014a; Weiss 2010). Since the seminal work by Anderson et al. (2003),
studies have shown the existence of cost stickiness, where costs decrease less in response to
decreases in activity volume than they increase for equivalent increases in activity volume.
Several studies document an empirical phenomenon of cost anti-stickiness, where decreases in
activity volume result in greater changes in costs than do equivalent increases in activity volume,
under specific conditions (e.g., Banker et al. 2014a; Weiss 2010). The determinants of
asymmetric cost behavior, such as managerial incentives of earnings management, capital
utilization, core competence, the direction of prior sales, and corporate governance, have been
investigated (e.g., Balakrishnan et al. 2004; Banker et al. 2014a; Chen et al. 2012). Through
these investigations, prior researches argue that asymmetric cost behavior is a consequence of
deliberate managerial resource adjustment decisions in response to sales changes.
In this study, we focus on the impacts of financial risk on the degree of managerial
discretion in resource adjustment decisions. While prior studies have not focused on the degree
4
of managerial discretion in resource adjustment decisions, it is one of an important determinant
of managers’ deliberate resource adjustment decisions. We show that managers cannot adjust
resources deliberately in response to sales changes because they have limited opportunities to do
so under certain conditions, even if they want to make such adjustments. Financial risk is defined
as the potential future inability of a firm to cover its financial obligations (Holzhacker et al.
2015). Financial risk includes the possibility of a firm defaulting on its debts in future (default
risk) and the variability of a firm’s profit associated with its liabilities (financial leverage). We
predict that financial risk will reduce the degree of discretion in managerial resource adjustment
decisions through its impact on financial flexibility.
We also focus on the roles of the close relationships between industrial firms and banks in
managerial resource adjustment decisions. Traditionally, large firms in Japan have relied heavily
on direct bank finance, rather than equity or bond issues, and have maintained a close
relationship with a particular bank, called a “main bank” (e.g., Aoki and Patrick 1995; Hoshi et al.
1990; Hoshi 1996). We predict that such ties with main banks will mitigate the impacts of
financial risk on the degree of discretion in resource adjustment decisions, and allow managers to
adjust resources flexibly in response to sales changes, even if they face high financial risk.
Understanding the roles of financial risk on asymmetric cost behavior is also important
from the point of view of risk management. Since managerial resource adjustment decisions
affect the cost structure of a firm, they will also affect the risk of the firm. Therefore, managers
take risk into account when they make resource adjustment decisions. Despite the
interdependency between risk management and resource adjustment decisions, with a few
exceptions, previous studies have not paid sufficient attention to this issue.
We examine the relationship between financial risk and asymmetric cost behavior based
5
on publicly available financial data of Japanese firms. We predict that financial risk restricts
financial flexibility by increasing the cost of capital and causing a debt overhang problem, which
alters managerial resource adjustment decisions and determines cost behavior. Consistent with
this prediction, our results indicate that financial risk increases the degree of cost anti-stickiness
in the case of a prior activity decrease. On the other hand, financial risk appears to have no
influence on cost behavior in the case of a prior activity increase. We also examine the
moderating effect of the close relationships between firms and banks on the association between
financial risk and asymmetric cost behavior using data on the main bank system in Japan. We
predict that firms’ close ties with main banks will mitigate the impacts of financial risk on
financial flexibility, as well as increase the degree of managerial discretion when adjusting
resources in firms with high financial risk. Our result generally supports this prediction.
We make several contributions to the growing body of literature on cost behavior. First,
we emphasize the roles of the degree of managerial discretion in resource adjustment decisions,
and financial risk as the determinant of such discretion. Prior studies have not paid sufficient
attention to the roles of the degree of managerial discretion in resource adjustment decisions that
affect the pattern of asymmetric cost behavior. Our results indicate that the degree of managerial
discretion in resource adjustments varies according to the conditions managers face and affects
the pattern of asymmetric cost behavior. Second, we show the roles of bank–firm relationships in
managerial resource adjustment decisions. We present empirical evidence showing that close ties
with main banks mitigate the impact of financial risk on the degree of managerial discretion in
resource adjustments and allow managers to adjust resources deliberately, even if they face high
financial risk. Thus, we provide a deeper understanding of the roles of corporate financing and
bank–firm relationships in managerial resource adjustment decisions.
6
The remainder of this paper is structured as follows. In section 2, we develop the theory
and formulate the hypotheses. In section 3, we describe the data and the empirical model. In
subsequent sections, we present and discuss the empirical results. The final section concludes the
paper.
2. Literature Review and Hypotheses
2.1. Asymmetric Cost Behavior
Since the seminal work by Anderson et al. (2003), numerous studies have documented
how many costs decrease less in response to sales decreases than they rise for equivalent sales
increases, which is known as cost stickiness. The cost stickiness mechanism is explained in terms
of managers’ prospects for future activity, in which resource adjustment costs and retention costs
of unused resources play an important role (Anderson et al. 2003). Resource adjustment costs are
those required to adjust resources in response to changes in activity volume. These costs include
those of dismissing excess employees because of a downturn in activity volume, employing
additional workers to meet future activity increases, and so on. On the other hand, the retention
costs of unused resources result from not cutting slack resources after a reduction in activity
volume, but retaining them until the activity volume recovers. If the resource adjustment costs
exceed the retention costs of unused resources, managers will retain unused resources, even if the
activity volume decreases. This deliberate managerial decision makes costs sticky. In contrast, if
resource adjustment costs fall below the retention costs of unused resources, managers will
remove those unused resources.
Following Anderson et al. (2003), a substantial number of studies have shown that cost
stickiness is prevalent in various contexts, and that the degree of cost stickiness is dependent on
7
various factors, such as capital utilization, core competence, and corporate governance (e.g.,
Balakrishnan et al. 2004; Chen et al. 2012; Kama and Weiss 2013). Several studies also
document an empirical phenomenon of cost anti-stickiness, in which decreases in activity
volume result in greater changes to costs than do equivalent increases in activity volume (e.g.,
Banker et al. 2014a; Weiss 2010). Banker et al. (2014a) complement and refine the theoretical
development of asymmetric cost behavior in Anderson et al. (2003).
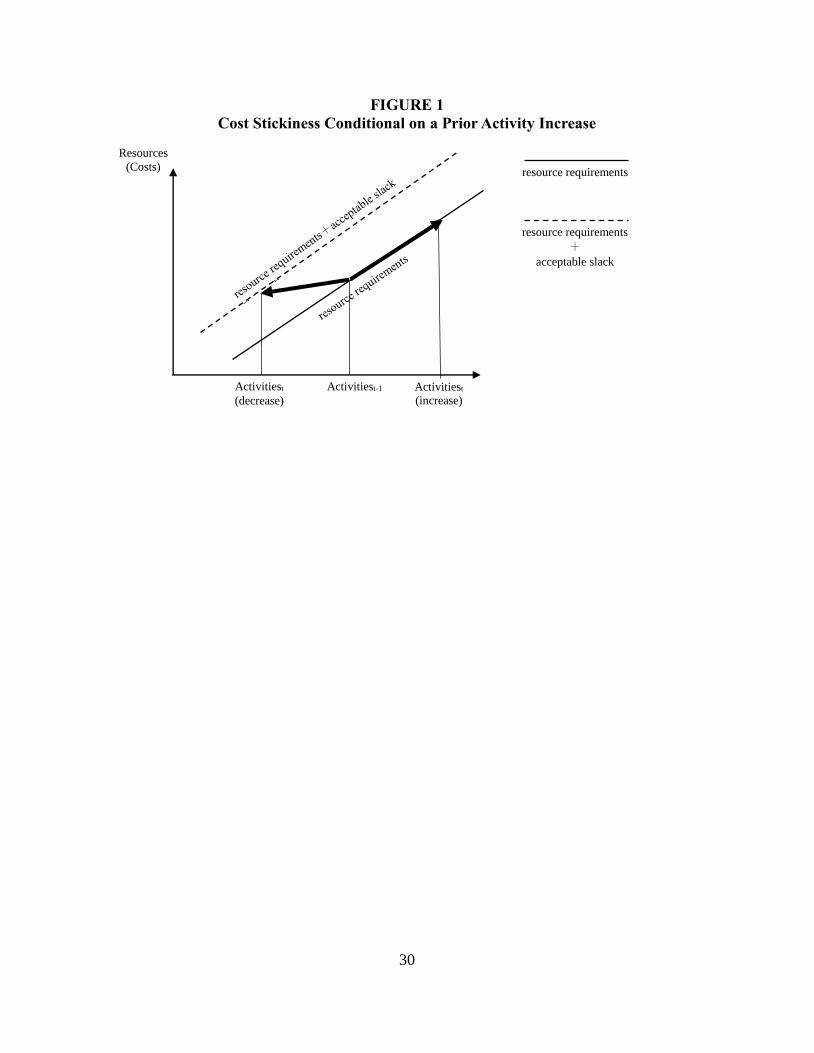
We follow the argument of Banker et al. (2014a) that cost behavior is affected by the
direction of prior activity volume, which determines the amount of unused resources carried over
from the prior period and managerial expectations for future activity volume.1 If activity
increased in period t - 1 (relative to period t - 2), the amount of unused resources carried over
into the current period t will be very low. Even if unused resources had been carried over from
period t - 2, managers would consume them to deal with the increase in activity volume during
period t - 1, and would not secure more resources than required. Therefore, if activity increased
in period t - 1, the resources carried over into the current period will be minimal. Then, if the
activity increases in the current period, managers will increase resources in order to meet the
resource requirements.2 This is because if managers do not acquire these resources, they will be
unable to respond to an increase in demand and, consequently, will miss an opportunity for profit.
On the other hand, if activity decreases in the current period, costs will not decrease
proportionately to activity decreases. This is because managers will likely retain some unused
resources between the resource requirement and the maximum resource level at a certain activity
1 While Banker et al. (2014a) use sales as a proxy for activity, we develop our argument without using a proxy for activity. 2 Resource requirements refer to the minimum resources technically necessary to meet a certain activity volume.
8
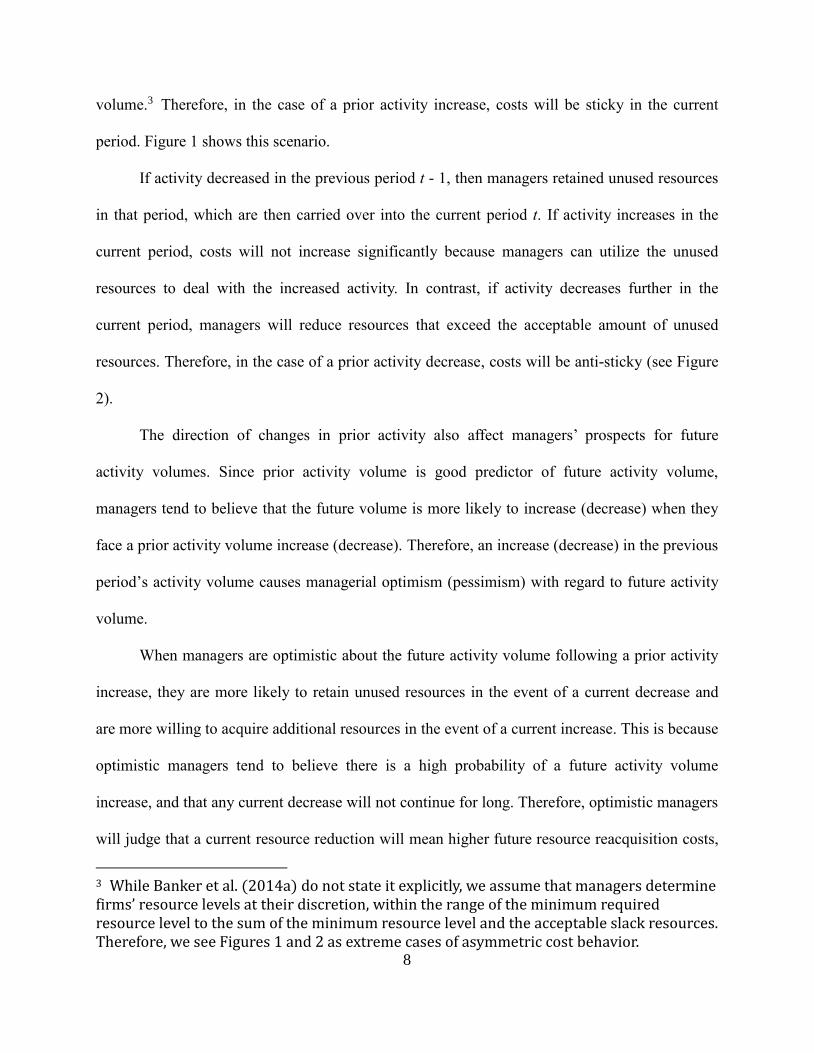
volume.3 Therefore, in the case of a prior activity increase, costs will be sticky in the current
period. Figure 1 shows this scenario.
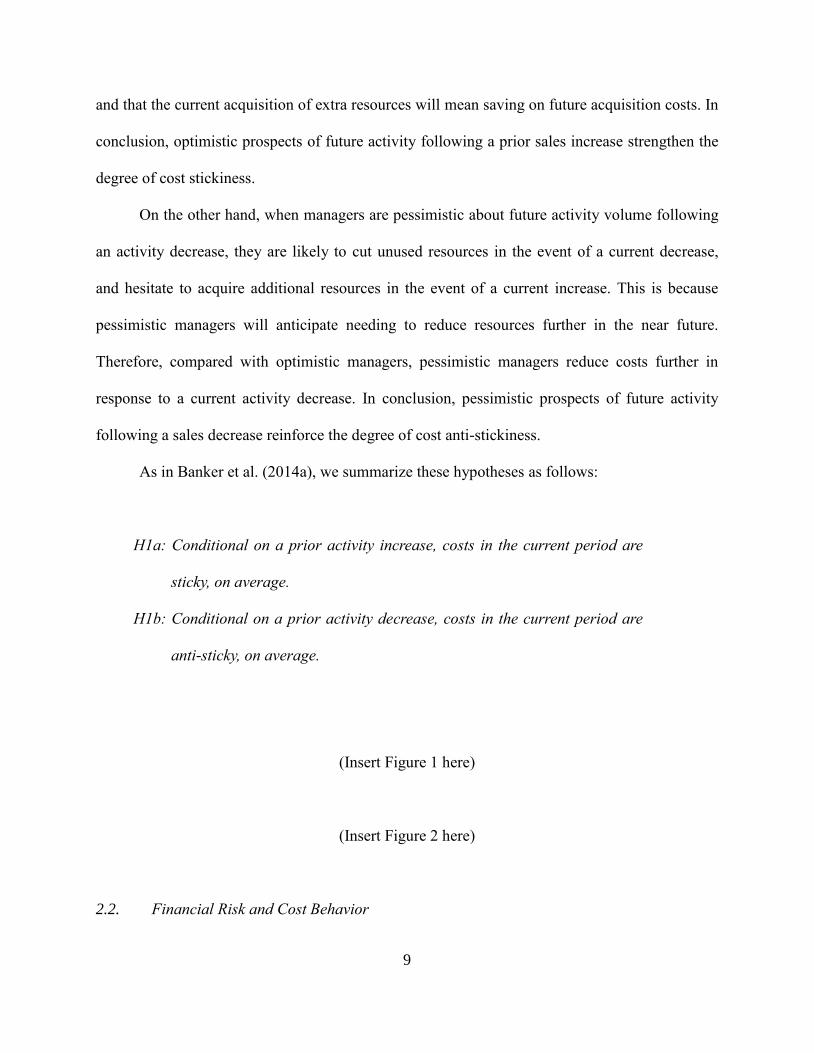
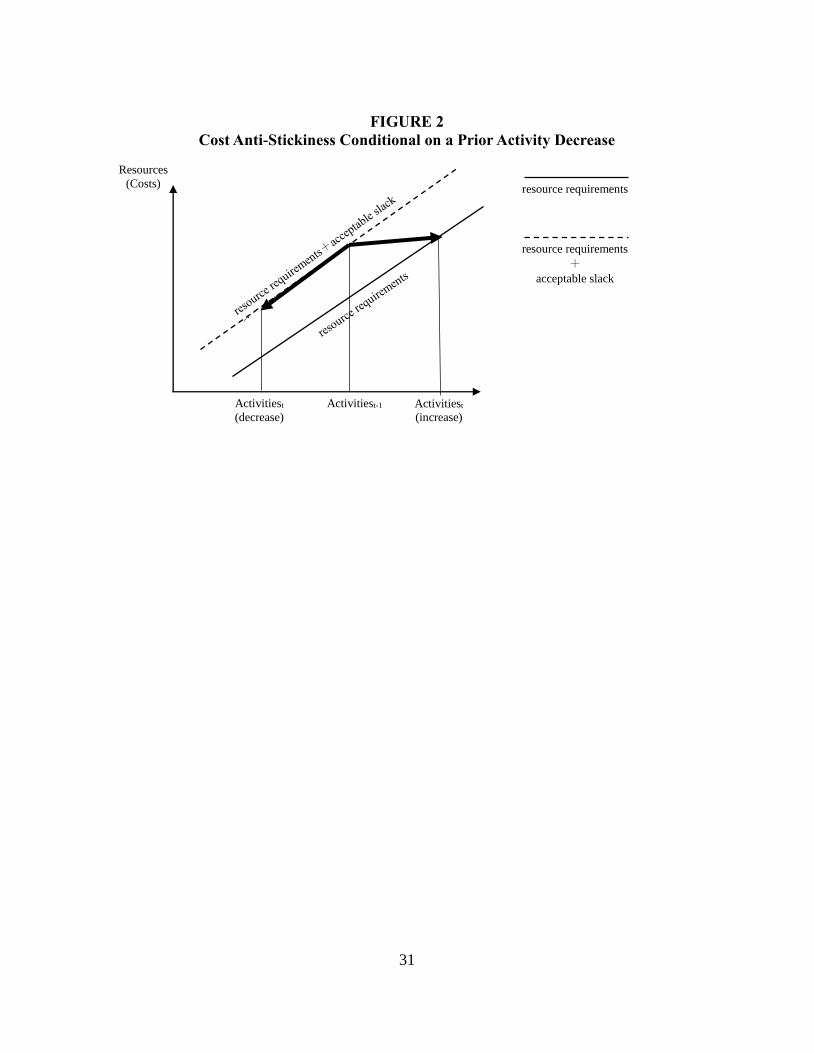
If activity decreased in the previous period t - 1, then managers retained unused resources
in that period, which are then carried over into the current period t. If activity increases in the
current period, costs will not increase significantly because managers can utilize the unused
resources to deal with the increased activity. In contrast, if activity decreases further in the
current period, managers will reduce resources that exceed the acceptable amount of unused
resources. Therefore, in the case of a prior activity decrease, costs will be anti-sticky (see Figure
2).
The direction of changes in prior activity also affect managers’ prospects for future
activity volumes. Since prior activity volume is good predictor of future activity volume,
managers tend to believe that the future volume is more likely to increase (decrease) when they
face a prior activity volume increase (decrease). Therefore, an increase (decrease) in the previous
period’s activity volume causes managerial optimism (pessimism) with regard to future activity
volume.
When managers are optimistic about the future activity volume following a prior activity
increase, they are more likely to retain unused resources in the event of a current decrease and
are more willing to acquire additional resources in the event of a current increase. This is because
optimistic managers tend to believe there is a high probability of a future activity volume
increase, and that any current decrease will not continue for long. Therefore, optimistic managers
will judge that a current resource reduction will mean higher future resource reacquisition costs,
3 While Banker et al. (2014a) do not state it explicitly, we assume that managers determine firms’ resource levels at their discretion, within the range of the minimum required resource level to the sum of the minimum resource level and the acceptable slack resources. Therefore, we see Figures 1 and 2 as extreme cases of asymmetric cost behavior.
9
and that the current acquisition of extra resources will mean saving on future acquisition costs. In
conclusion, optimistic prospects of future activity following a prior sales increase strengthen the
degree of cost stickiness.
On the other hand, when managers are pessimistic about future activity volume following
an activity decrease, they are likely to cut unused resources in the event of a current decrease,
and hesitate to acquire additional resources in the event of a current increase. This is because
pessimistic managers will anticipate needing to reduce resources further in the near future.
Therefore, compared with optimistic managers, pessimistic managers reduce costs further in
response to a current activity decrease. In conclusion, pessimistic prospects of future activity
following a sales decrease reinforce the degree of cost anti-stickiness.
As in Banker et al. (2014a), we summarize these hypotheses as follows:
H1a: Conditional on a prior activity increase, costs in the current period are
sticky, on average.
H1b: Conditional on a prior activity decrease, costs in the current period are
anti-sticky, on average.
(Insert Figure 1 here)
(Insert Figure 2 here)
2.2. Financial Risk and Cost Behavior
10
The explanation of the patterns of cost behavior by Banker et al. (2014a) imply that
managers determine firms’ resource levels at their discretion within the range of the minimum
required resource level to the sum of the minimum resource level and the acceptable slack
resources. Therefore, this range is the room in which a manager can adjust resources at his/her
discretion. If the difference is small, the degree of managerial resource adjustments will be
constrained. On the other hand, a larger range for discretional adjustments will allow managers
to change their resource level more flexibly in response to an activity volume change.
Thus, we suggest that this range will depend on a variety of conditions that firms face.
Since the minimum required resource level is determined technologically by a firm’s production
function, the difference is determined by the acceptable slack resources. We explore the effect of
financial risk on the level of acceptable slack resources. Since firms with high financial risk do
not have sufficient internal reserves, their resource adjustment decisions are significantly affected
by the availability of outside funds. However, high financial risk makes it more difficult to get
outside funds due to an increase in the cost of capital, and debt overhang problem. Since
creditors bearing higher risk require larger repayments, the cost of capital for firms with high
financial risk will increase to reflect their creditors’ expectations. In addition, an increase in
financial risk causes a debt overhang problem (Myers, 1977). These effects mean that firms with
high financial risk will not be able to adjust resources flexibly. Consequently, an increase in
financial risk decreases the degree of managerial discretion, restricting their financial flexibility.
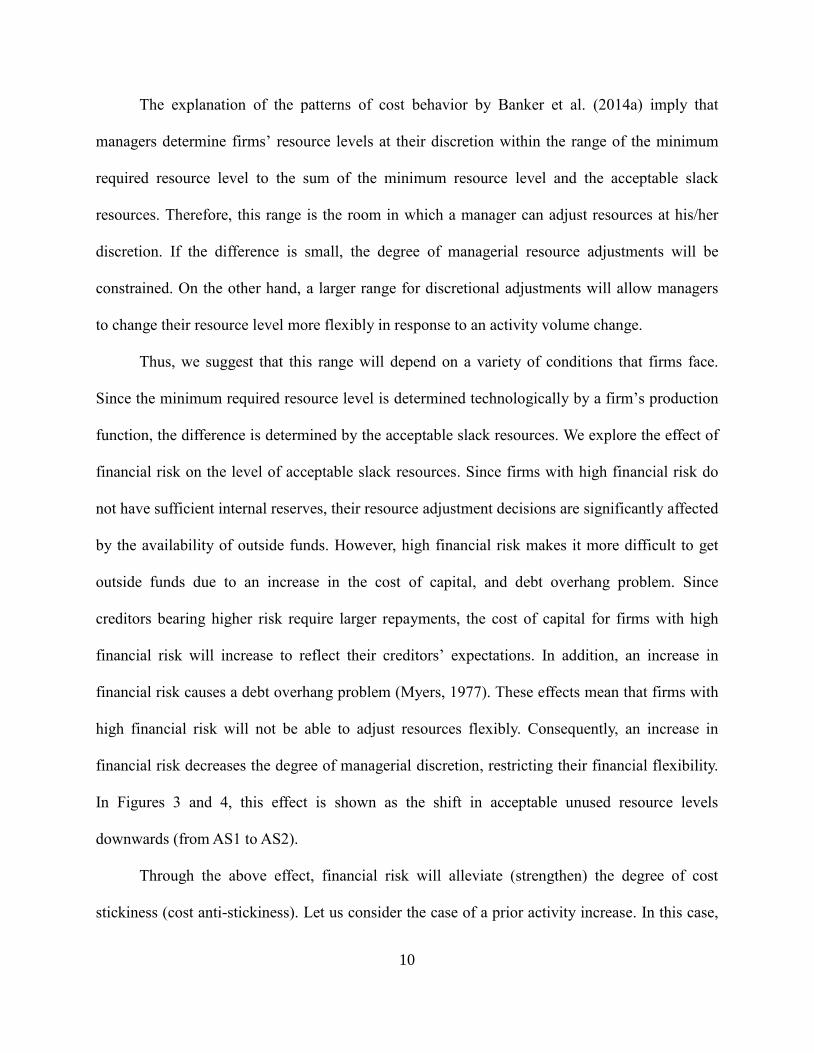
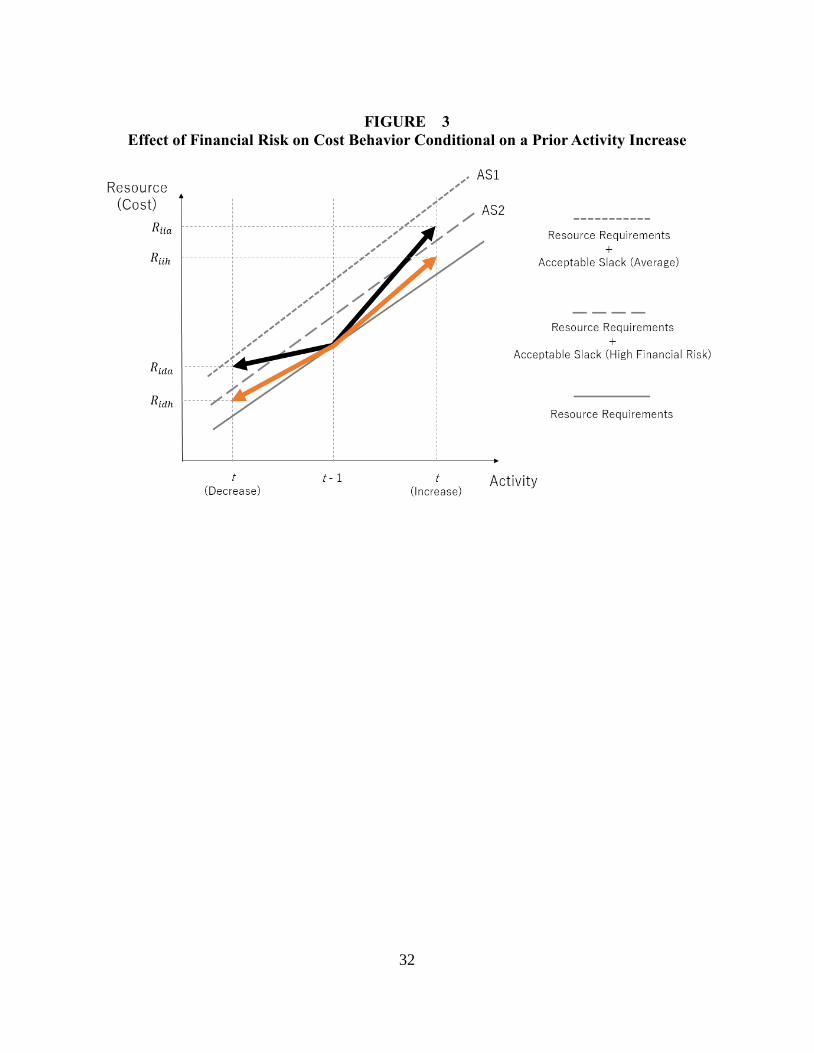
In Figures 3 and 4, this effect is shown as the shift in acceptable unused resource levels
downwards (from AS1 to AS2).
Through the above effect, financial risk will alleviate (strengthen) the degree of cost
stickiness (cost anti-stickiness). Let us consider the case of a prior activity increase. In this case,
11
the amount of resources carried over from the prior period is low. Then, managers must decide
on resource levels, over and above the requirements for the current period, in response to
changes in activity volume. Without the effects of financial risk, costs will be sticky, because
managers are more likely to retain unused resources for future activity increases in the event of a
current decrease, and are willing to increase resources in the event of a current activity increase.
For firms with high financial risk, the acceptable amount of unused resources will decrease
because of the restriction on financial flexibility, irrespective of the direction of a change in
current activity. Higher resource retention costs will restrict the amount of unused resources that
managers retain for a future activity increase. Furthermore, higher resource acquisition costs
mean managers will hesitate to obtain additional unused resources. These effects will constrain
the firm’s resource levels close to its minimum resource requirements at a certain activity
volume. In Figure 3, these effects are shown in the change of resource adjustment decisions from
𝑅𝑖𝑖𝑎 to 𝑅𝑖𝑖ℎ, and from 𝑅𝑖𝑑𝑎 to 𝑅𝑖𝑑ℎ. Hence, we predict that increases in financial risk will
reduce the degree of cost stickiness following a prior activity increase (see Figure 3).
H2a: Conditional on a prior activity increase, the degree of costs stickiness in
the current period has a negative association with financial risk.
(Insert Figure 3 here)
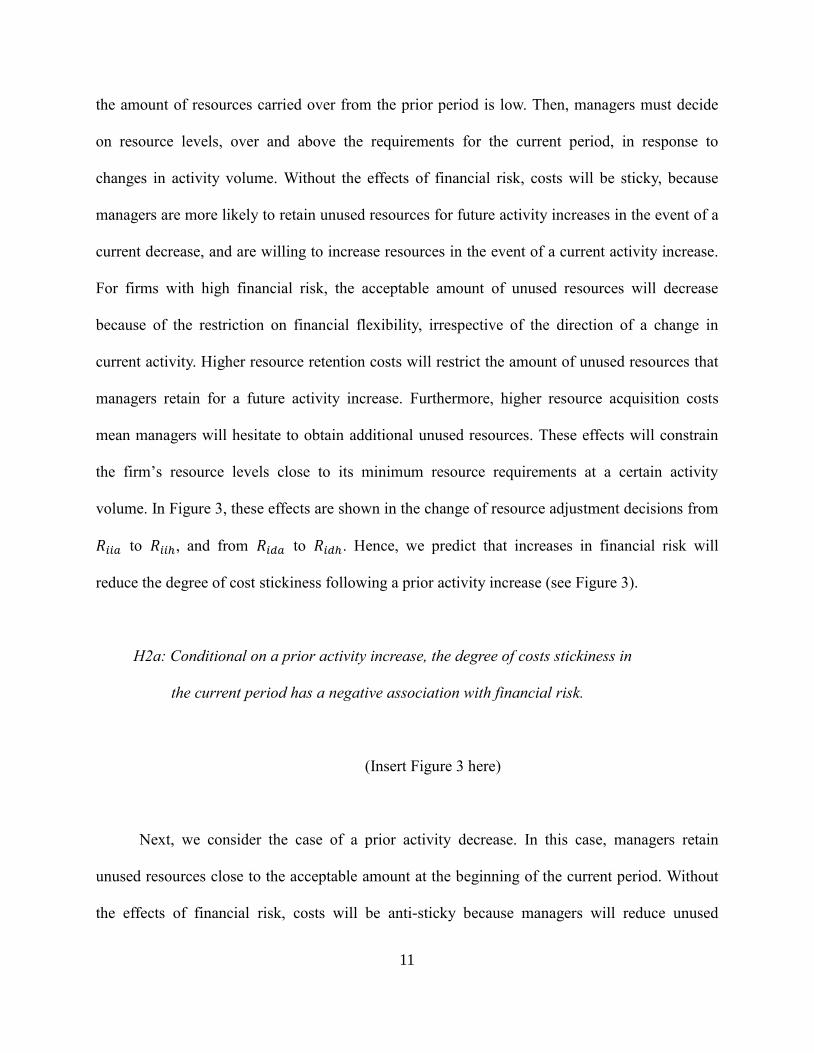
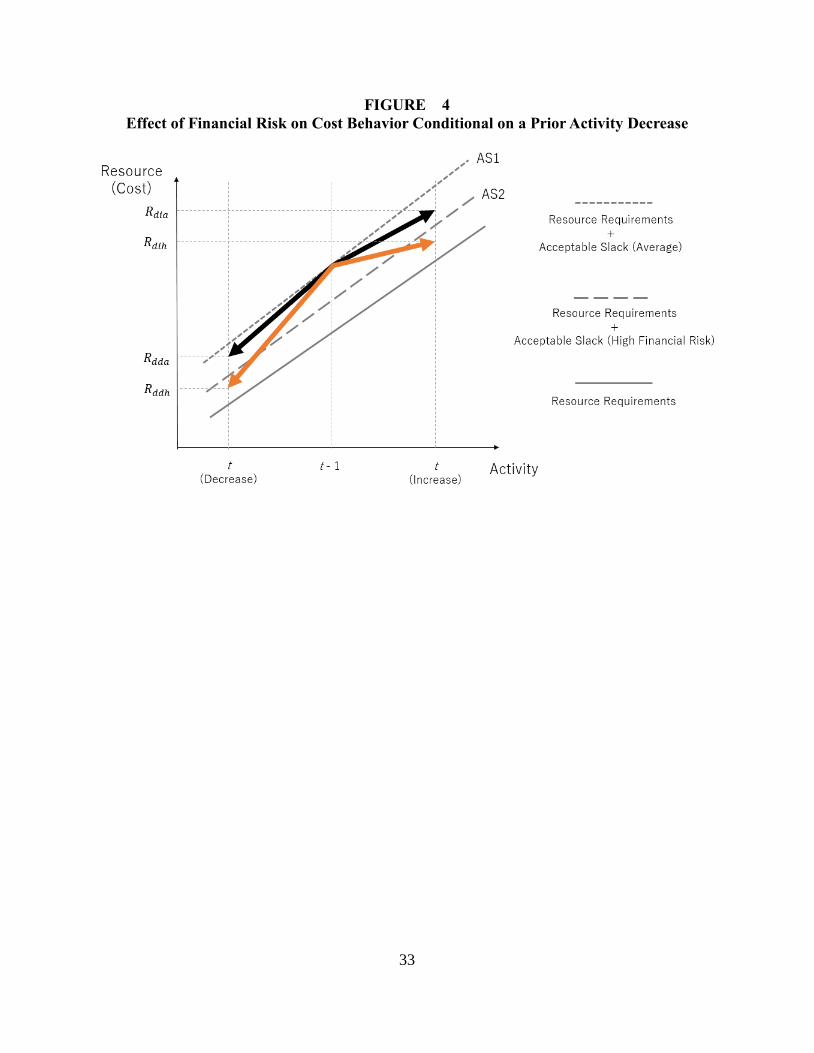
Next, we consider the case of a prior activity decrease. In this case, managers retain
unused resources close to the acceptable amount at the beginning of the current period. Without
the effects of financial risk, costs will be anti-sticky because managers will reduce unused
12
resources in the event of a current activity decrease, and will use unused resources in a current
activity increase. As discussed above, in general, high financial risk will reduce the acceptable
amount of unused resources, irrespective of the direction of changes in current activity. In the
event of a current activity increase, managers with high financial risk will avoid securing excess
resources. Instead, they will use unused resources carried over from the previous period, because
high financial risk makes additional resource acquisition more difficult. Moreover, in the event
of a current activity decrease, managers will reduce the amount of unused resources retained for
future activity increases. In Figure 4, these effects are shown as a change in resource adjustment
decisions from 𝑅𝑑𝑖𝑎 to 𝑅𝑑𝑖ℎ, and from 𝑅𝑑𝑑𝑎 to 𝑅𝑑𝑑ℎ. Thus, we predict that high financial risk
will increase the degree of cost anti-stickiness (see Figure 4).
H2b: Conditional on a prior activity decrease, the degree of cost anti-stickiness
in the current period has a positive association with financial risk.
(Insert Figure 4 here)
2.3. The Roles of the Main Bank System
Traditionally, large firms in Japan have relied heavily on direct bank finance rather
than on equity or bond issues, and have maintained a close relationship with a particular bank,
called a “main bank.” Prior studies show that the main bank system in Japan has several positive
advantages for corporate finance. For example, main banks mitigate informational asymmetry
problems between lenders and borrowers by producing information on client firms, which they
share with other lenders and investors. Main banks also serve as insurance for clients in financial
13
distress by providing funds, a lower interest ratio, or intervening in their management policies4
(e.g., Aoki and Patrick 1995; Hoshi et al. 1990; Hoshi 1996). We expect that an increase in
financial risk will decrease the degree of managerial discretion in making resource adjustments
by increasing the cost of capital and restricting financial flexibility. However, we also expect that
their close ties with main banks will allow managers to adjust resources more flexibly in
response to sales changes, even if they face high financial risk.
First, close ties with main banks reduce informational asymmetry between lenders and
borrowers. Since the main banks hold the major payment settlement account of their client firms,
they can monitor clients’ business activities carefully through their account (Aoki 1994). Main
banks also send key bank personnel to the top management teams in client firms to monitor their
activities (Hoshi et al. 1990). These close ties with client firms allow the main banks to generate
valuable information about their clients’ business activities. Since main banks tend to share such
information with other lenders and investors, the degree of information asymmetry between
borrowers and lenders decreases, preventing the cost of capital of the client firms from
increasing, even if they face high financial risk.
Second, strict corporate monitoring activities by main banks discourage moral hazards in
4 However, the main bank system in Japan also has drawbacks. For example, by examining the effects of bank–firm relationships on firm performance in Japan, Weinstein and Yafeh (1998) show that when access to capital markets is limited, the close ties with main banks increase the availability of capital to borrowing firms, but do not lead to higher profitability or growth. They argue that the slow growth rates of bank clients suggest that banks discourage firms from investing in risky, but profitable projects. In addition, because of their long-term relationships, main banks are more likely to respond to renegotiation offers from clients in financial distress in the expectation of recovering their loans in the long term (Boot 2000). In some cases, recent studies have argued that main banks give rise to “zombie” firms, which are kept alive by bank loans, even though they are less likely to reconstruct management. Kobayashi and Osano (2011) show that the threat of withdrawal of non-main banks forces main banks to perform efficiently in handling troubled loans. In other words, main banks do not necessarily give rise to zombie firms (Caballero et al. 2008; Hoshi and Kashyap 2004; Peek and Rosengren 2005).
14
client firms. If firms behave opportunistically, investors and lenders will require a high risk
premium, which increases the cost of capital. However, because the strict monitoring by main
banks prevents client firms from behaving opportunistically, the cost of capital for such firms
will not increase.5
Third, the main banks also provide a form of insurance for client firms in financial distress
and for other lenders. When firms are in financial distress, their lenders are likely to stop
providing financing and will make financial constraints more severe. However, since main banks
are likely to rescue such clients in order to maintain their reputation as main banks, other lenders
will not stop providing financing. Therefore, by having a relationship with a main bank, firms
can provide a signal of a low possibility of bankruptcy to the financial market. This signal also
alleviates increases in the cost of capital for firms with main banks.
Fourth, by providing additional cash or by applying lower interest rates for their client
firms in financial distress, the main banks alleviate the financial constraints caused by increased
financial risk. Therefore, close ties with main banks allow firms with high financial risk to
maintain unused resources in preparation for future activity increases, even if they face high
financial risk.
For the above-mentioned reasons, we predict that the association between financial risk
and cost behavior will be weaker in firms with close ties to main banks.
H3: The associations between financial risk and cost behavior will be weaker
in firms with close ties to main banks.
5 Client firms of a main bank may have other lenders, called non-main banks. Because monitoring activities in Japan are delegated to the main banks, they are responsible for monitoring their clients. Therefore, Japanese banks are interdependent with non-main banks in terms of monitoring their borrowers (Sheard 1994).
15
3. Empirical Models and Sample Data
3.1 The Empirical Model and Variables
We employ the empirical model developed by Banker et al. (2014a) to examine H1a and
H1b. We use sales as a proxy for activity; selling, general, and administrative (SG&A) costs as a
proxy for costs; and the debt ratio and simple analysis of failure (SAF) value as proxies for
financial risk. The SAF value measures the risk of bankruptcy based on the SAF2002 model
(Shirata 2003). Other models have certain predictive powers for the data used to formulate the
models. In contrast, the SAF2002 model considers the relation between real managerial behavior
and financial figures, which enables us to capture the behavior of managers facing bankruptcy.
The SAF2002 model is given as follows:
𝑆𝐴𝐹𝑖,𝑡 = 0.01036 ∙ 𝑅𝑒𝑡𝑎𝑖𝑛𝑒𝑑 𝐸𝑎𝑟𝑛𝑖𝑛𝑔𝑠 𝑡𝑜 𝑇𝑜𝑡𝑎𝑙 𝐴𝑠𝑠𝑒𝑡𝑠 𝑖,𝑡 +
0.02682 ∙ 𝑁𝑒𝑡 𝐼𝑛𝑐𝑜𝑚𝑒 𝑏𝑒𝑓𝑜𝑟𝑒 𝑡𝑎𝑥 𝑡𝑜 𝑇𝑜𝑡𝑎𝑙 𝐴𝑠𝑠𝑒𝑡𝑠𝑖,𝑡 +
0.06610 ∙ 𝐼𝑛𝑣𝑒𝑛𝑡𝑜𝑟𝑦 𝑇𝑢𝑟𝑛𝑜𝑣𝑒𝑟 𝑃𝑒𝑟𝑖𝑜𝑑𝑖,𝑡 −
0.02368 ∙ 𝐼𝑛𝑡𝑒𝑟𝑒𝑠𝑡 𝐸𝑥𝑝𝑒𝑛𝑠𝑒𝑠 𝑡𝑜 𝑆𝑎𝑙𝑒𝑠𝑖,𝑡 + 0.70773.
If the SAF value is below 0.70, the bankruptcy risk is high (Shirata 2003). That is, a lower SAF
value means a greater risk of bankruptcy. Conversely, a higher SAF value means a lower
bankruptcy risk. The empirical model of Banker et al. (2014a) is expressed in Eq. (1):
∆ ln 𝑆𝐺𝐴𝑖,𝑡 = 𝛽0 + 𝐼𝑖,𝑡−1 (𝛽1𝑃𝐼𝑛𝑐𝑟∆ ln 𝑆𝐴𝐿𝐸𝑆𝑖,𝑡 + 𝛽2
𝑃𝐼𝑛𝑐𝑟𝐷𝑖,𝑡∆ ln 𝑆𝐴𝐿𝐸𝑆𝑖,𝑡) +
𝐷𝑖,𝑡−1 (𝛽1𝑃𝐷𝑒𝑐𝑟∆ ln 𝑆𝐴𝐿𝐸𝑆𝑖,𝑡 + 𝛽2
𝑃𝐷𝑒𝑐𝑟𝐷𝑖,𝑡∆ ln 𝑆𝐴𝐿𝐸𝑆𝑖,𝑡) + 휀𝑖,𝑡. (1)
16
Here, ∆ ln 𝑆𝐺𝐴𝑖,𝑡 is the difference between firm i’s SG&A costs in year t relative to year
𝑡 − 1; ∆ ln 𝑆𝐴𝐿𝐸𝑆𝑖,𝑡 is the difference between firm i’s sales in year t relative to year 𝑡 − 1; 𝐷𝑖,𝑡
is a dummy variable that takes 1 if firm i’s sales decrease in year t relative to year 𝑡 − 1, and 0
otherwise; 𝐷𝑖,𝑡−1 (𝐼𝑖,𝑡−1) is a dummy variable that takes 1 if firm i’s sales increase in year 𝑡 − 1
relative to 𝑡 − 2, and 0 otherwise; and 휀𝑖,𝑡 is an error term.
The coefficient of 𝛽1𝑃𝐼𝑛𝑐𝑟 expresses the proportionate increase in SG&A costs for a 1%
increase in sales in the current period in the case of a prior sales increase; 𝛽1𝑃𝐼𝑛𝑐𝑟 + 𝛽2
𝑃𝐼𝑛𝑐𝑟
expresses the proportionate decrease in SG&A costs for a 1% decrease in sales in the current
period in the case of a prior sales increase; and 𝛽1𝑃𝐷𝑒𝑐𝑟 and 𝛽2
𝑃𝐷𝑒𝑐𝑟 can be interpreted in the
same way, respectively, in the case of a prior sales decrease. Therefore, H1a and H1b imply that
𝛽2𝑃𝐼𝑛𝑐𝑟 is positive and 𝛽2
𝑃𝐷𝑒𝑐𝑟 is negative, which indicate cost stickiness and anti-stickiness,
respectively.
Eq. (2) shows an empirical model that examines the influence of financial risk on cost
behavior.
∆ ln 𝑆𝐺𝐴𝑖,𝑡 = 𝛽0 + 𝐼𝑖,𝑡−1 (𝛽1𝑃𝐼𝑛𝑐𝑟∆ ln 𝑆𝐴𝐿𝐸𝑆𝑖,𝑡 + 𝛽2
𝑃𝐼𝑛𝑐𝑟𝐷𝑖,𝑡∆ ln 𝑆𝐴𝐿𝐸𝑆𝑖,𝑡 +
𝛿1𝑃𝐼𝑛𝑐𝑟∆ ln 𝑆𝐴𝐿𝐸𝑆𝑖,𝑡𝐹𝐼𝑁𝑅𝐼𝑆𝐾𝑖,𝑡 +
𝛿2𝑃𝐼𝑛𝑐𝑟𝐷𝑖,𝑡∆ ln 𝑆𝐴𝐿𝐸𝑆𝑖,𝑡𝐹𝐼𝑁𝑅𝐼𝑆𝐾𝑖,𝑡) +𝐷𝑖,𝑡−1 (𝛽1
𝑃𝐷𝑒𝑐𝑟∆ ln 𝑆𝐴𝐿𝐸𝑆𝑖,𝑡 +
𝛽2𝑃𝐷𝑒𝑐𝑟𝐷𝑖,𝑡∆ ln 𝑆𝐴𝐿𝐸𝑆𝑖,𝑡 + 𝛿1
𝑃𝐷𝑒𝑐𝑟∆ ln 𝑆𝐴𝐿𝐸𝑆𝑖,𝑡𝐹𝐼𝑁𝑅𝐼𝑆𝐾𝑖,𝑡 +
𝛿2𝑃𝐷𝑒𝑐𝑟𝐷𝑖,𝑡∆ ln 𝑆𝐴𝐿𝐸𝑆𝑖,𝑡𝐹𝐼𝑁𝑅𝐼𝑆𝐾𝑖,𝑡) + 𝛽3∆ ln 𝑆𝐴𝐿𝐸𝑆𝑖,𝑡 𝐴𝑆𝐼𝑁𝑇𝑖,𝑡 +
𝛽4∆ ln 𝑆𝐴𝐿𝐸𝑆𝑖,𝑡 𝐸𝑀𝑃𝐼𝑁𝑇𝑖,𝑡 + 휀𝑖,𝑡. (2)
Here, 𝐹𝐼𝑁𝑅𝐼𝑆𝐾𝑖,𝑡 is a variable denoting the log-ratio of total liabilities to the equity of
17
firm i in year t, or the SAF value of firm i in year t; 𝐴𝑆𝐼𝑁𝑇𝑖,𝑡 is a control variable denoting the
log-ratio of the total assets of firm i to sales in year t; and 𝐸𝑀𝑃𝐼𝑁𝑇𝑖,𝑡 is also a control variable,
denoting the log-ratio of the number of regular employees of firm i to sales in year t. All
remaining variables are the same as those in Eq. (1).
If 𝛿1𝑃𝐼𝑛𝑐𝑟 + 𝛿2
𝑃𝐼𝑛𝑐𝑟 or 𝛿1𝑃𝐷𝑒𝑐𝑟 + 𝛿2
𝑃𝐷𝑒𝑐𝑟 is 0, financial risk has no influence on cost
behavior. If 𝛿1𝑃𝐼𝑛𝑐𝑟 + 𝛿2
𝑃𝐼𝑛𝑐𝑟 is positive (negative), the degree of stickiness of SG&A costs in
the current period following a prior sales increase has been alleviated (strengthened). On the
other hand, if 𝛿1𝑃𝐷𝑒𝑐𝑟 + 𝛿2
𝑃𝐷𝑒𝑐𝑟 is positive (negative), the degree of anti-stickiness of SG&A
costs in the current period following a prior sales decrease has strengthened (alleviated). We test
H2a and H2b using these coefficients.
We further divide our sample into two sub-samples based on the value of the main bank
ratio (𝑀𝐵𝑅𝐴𝑇𝐼𝑂𝑖,𝑡). We measure 𝑀𝐵𝑅𝐴𝑇𝐼𝑂𝑖,𝑡 as the fraction of the loan amounts from firm
𝑖’s main bank to total assets. One sub-sample includes firms with a main bank ratio that is higher
than the median value in the full sample. The other sub-sample contains the remaining firms. To
examine H3, we estimate Eq. (2) using these two sub-samples.
3.2 Sample and Descriptive Statistics
We use financial data collected from Nikkei NEEDS-Financial QUEST 2.0. We
extracted the financial data for the period 2000–2014 from the consolidated financial statements
of Japanese listed firms (in all industries other than banking, insurance, and stockbrokers) that
follow Japanese accounting standards. The data also include the financial data of delisted firms.
We require firms to have valid sales data for years t to t - 2, valid SG&A cost data for years t to t
- 1, and valid debt ratio data for year t. We removed observations if a firm’s accounting period
18
was not 12 months, its financial year did not begin in March, its SG&A costs exceeded sales, or
its total liabilities were not positive. We winsorize the data at the top and bottom 1 percent. The
final sample comprised 19,447 firm-year observations.
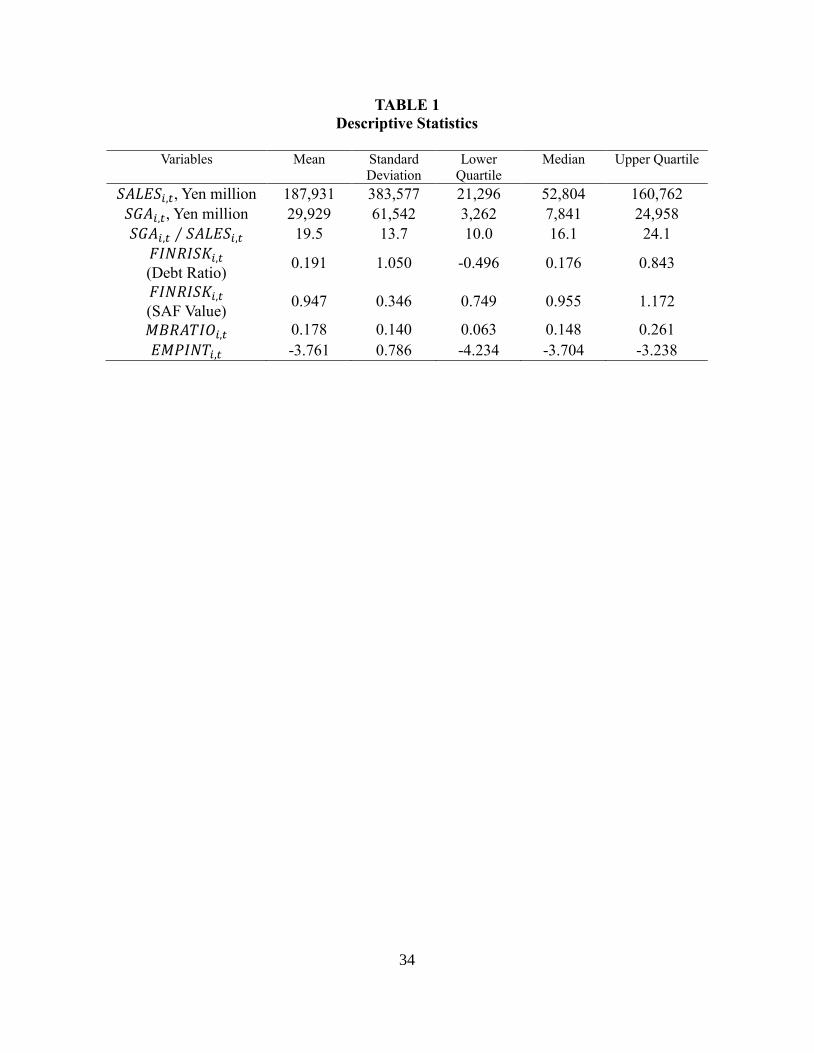
Table 1 presents the descriptive statistics. The mean (median) sales value is 187,931
(52,804) million yen. The mean (median) value of SG&A costs is 29,929 (7,841) million yen.
The mean (median) ratio of SG&A costs to sales is 19.5% (16.1%). Finally, the mean (median)
debt ratio, a measure of financial risk, is 0.191 (0.176), while the mean (median) SAF value,
another measure of financial risk, is 0.947 (0.955).
(Insert Table 1 here)
4. Empirical Results
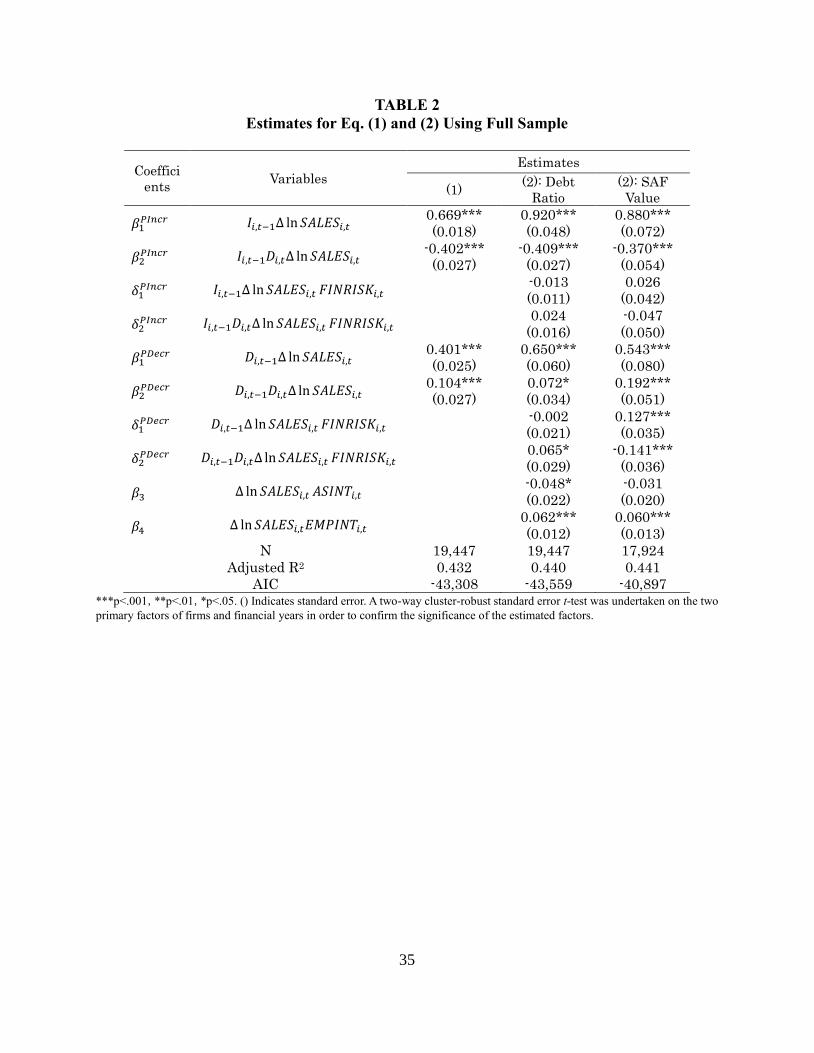
The left-hand column in Table 2 shows the estimated coefficients of Eq. (1). As
expected, 𝛽1𝑃𝐼𝑛𝑐𝑟 is 0.669 (p < .001) and 𝛽2
𝑃𝐼𝑛𝑐𝑟 is -0.402 (p < .001), supporting H1a. The
SG&A costs in the current period are sticky following a prior sales increase. In addition, 𝛽1𝑃𝐷𝑒𝑐𝑟
is 0.401 (p < .001) and 𝛽2𝑃𝐷𝑒𝑐𝑟 is 0.104 (p < .001), supporting H1b. The SG&A costs in the
current period exhibit anti-stickiness in the case of a prior sales decrease. These results are
consistent with those of Banker et al. (2014a).
(Insert Table 2 here)
The central column in Table 2 shows the estimates of Eq. (2), using debt ratios as a
proxy for financial risk. Eq. (2) extends Eq. (1) in order to examine the effect that financial risk
19
has on cost behavior. As with Eq. (1), the results indicate that SG&A costs are sticky in the case
of a prior sales increase and, in contrast, anti-sticky in the case of a prior sales decrease. In
addition, neither 𝛿1𝑃𝐼𝑛𝑐𝑟 nor 𝛿2
𝑃𝐼𝑛𝑐𝑟are statistically significant, suggesting that financial risk has
no effect on SG&A cost changes in the case of a prior sales increase. Therefore, H2a is not
supported. While 𝛿1𝑃𝐷𝑒𝑐𝑟 is not statistically significant, 𝛿2
𝑃𝐷𝑒𝑐𝑟 is 0.065 (p < .05). Thus,
financial risk does strengthen the degree of anti-stickiness following a prior sales decrease.
Consequently, H2b is supported.
The right-hand column in Table 2 shows the estimates of Eq. (2), using SAF values as a
proxy for financial risk. As with Eq. (1), these results exhibit stickiness in the case of a prior
sales increase and anti-stickiness in the case of a prior sales decrease. In addition, neither 𝛿1𝑃𝐼𝑛𝑐𝑟
nor 𝛿2𝑃𝐼𝑛𝑐𝑟 are statistically significant, suggesting that financial risk has no effect on SG&A cost
changes following a prior sales increase. This result is consistent with the estimation of Eq. (2),
which use debt ratios to measure financial risk. Furthermore, 𝛿1𝑃𝐷𝑒𝑐𝑟 is 0.127 (p < .001) and
𝛿2𝑃𝐷𝑒𝑐𝑟 is -0.141 (p < .001), indicating that a lower financial risk means a greater alleviation of
the anti-stickiness in the current period following a prior sales decrease. In other words, greater
financial risk means greater anti-stickiness in the current period, following a prior sales decrease.
Hence, both results for Eq. (2), using either the debt ratio or SAF values, support H2b.
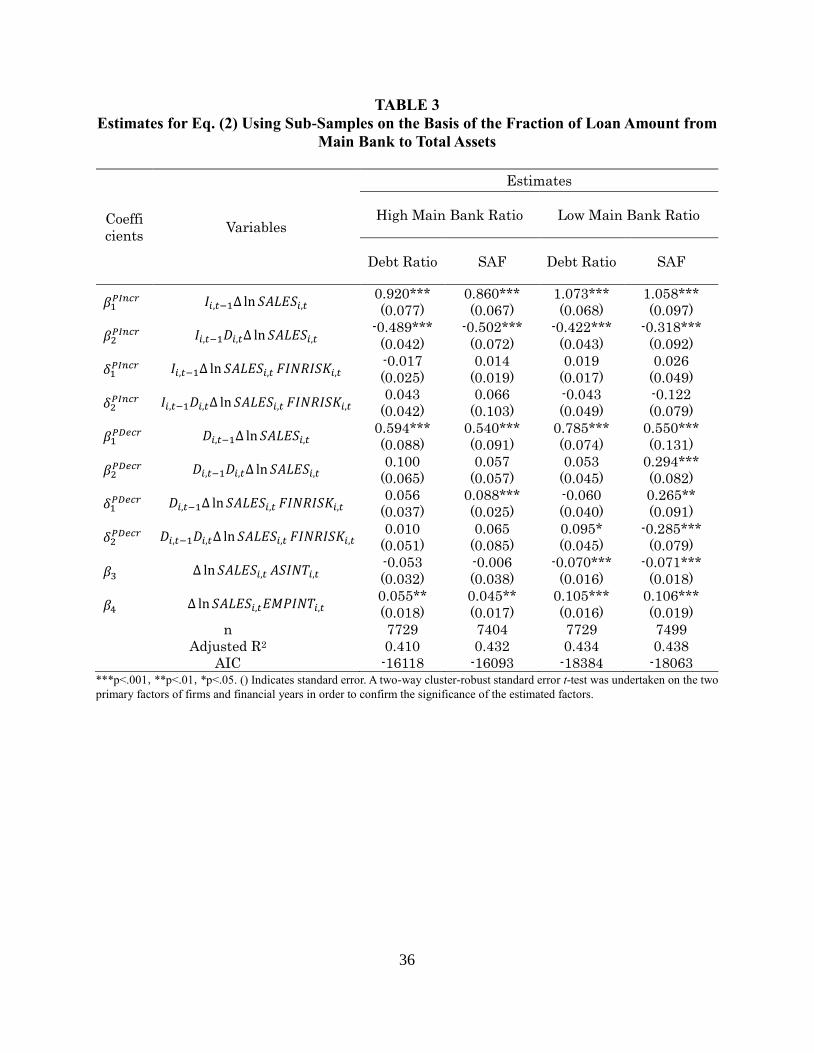
Table 3 shows the estimates of Eq. (2) using the two sub-samples, which indicate firms
with high and low main bank ratios. In the sample with a high main bank ratio, financial risk,
proxied by either the debt ratio or SAF value, has no influence on cost behavior. On the other
hand, in the sample with low main bank ratios, in the case of using the debt ratio as a proxy for
financial risk, 𝛿2𝑃𝐷𝑒𝑐𝑟 is 0.095 (p < .05). Furthermore, when using the SAF value as a proxy for
financial risk, 𝛿1𝑃𝐷𝑒𝑐𝑟 is 0.265 (p < 0.05) and 𝛿2
𝑃𝐷𝑒𝑐𝑟 is -0.285 (p < 0.001). These results
20
suggest that in the sample with low main bank ratios, an increase in financial risk strengthens the
degree of cost anti-stickiness after a prior sales decrease. Therefore, consistent with H3, we
conclude that the association between financial risk and cost behavior is weaker in firms with
close ties to a main bank after a prior sales decrease.
(Insert Table3 here)
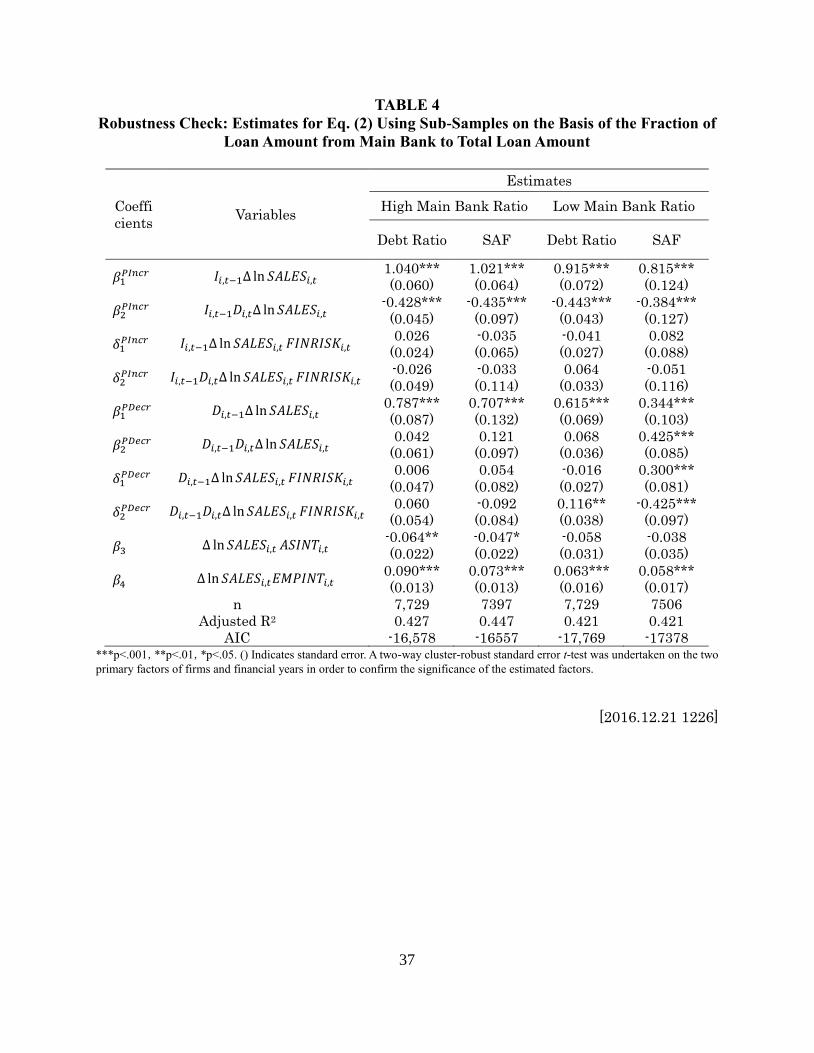
Furthermore, as a robustness check, we estimate Eq. (2) using the two sub-samples, which
are divided based on the median of the ratio of the loan amount from firm 𝑖’s main bank to the
total loan amount. Table 4 shows the estimates of (2) using the sub-samples. The results in Table
4 are similar to those in Table 3.
(Insert Table 4 here)
5. Discussion
Consistent with the findings of Banker et al. (2014a), our results show that the direction of
changes in activity in the previous period influence the cost behavior. More specifically, the
amount of unused resources carried over from the prior period and the managers’ prospects for
future activity, determined by the direction of the activity volume changes in the previous period,
have an important influence on managers’ discretionary resource adjustment decisions.
The results of the study indicate that financial risk has some influence on cost behavior.
We predict that since financial risk influences cost behavior by reducing the degree of
managerial discretion through its impacts on financial flexibility, firms with higher (lower)
21
financial risk weaken (strengthen) the degree of cost stickiness (anti-stickiness). Consistent with
our prediction, our results indicate that when activity decreases in both the previous and current
periods, managers are willing to reduce resources. This result supports H2b, suggesting that
financial risk strengthens the degree of cost anti-stickiness by reducing the acceptable amount of
unused resources.6
In contrast, in the case of a prior activity increase, there is no statistically significant
relationship between financial risk and cost behavior and, thus, H2a is not supported. One of the
reasons for this result might be the effect of managerial overconfidence on resource adjustment
decisions. People are often susceptible to overconfidence when predicting the future (Weinstein
1980). Overconfidence refers to a tendency to overestimate one’s own ability, underestimate the
influence of other factors on an outcome, overestimate one’s own predictive powers, and
underestimate variance of an outcome (Chen et al. 2013). Managerial overconfidence will affect
judgment and decision-making. In the finance literature, managers with a higher debt ratio are
more likely to be overconfident about their future (Malmendier et al. 2011). However, the
accounting literature has shown that overconfident top managers are more optimistic about future
earnings forecasts (Hilary and Hsu 2011; Libby and Rennekamp 2012). Furthermore, Chen et al.
(2013) demonstrated that cost behavior becomes sticky in the case of overconfident CEOs,
because they will not reduce unused resources, even in the face of activity decreases. According
6However, there was no statistically significant influence of financial risk on managerial resource adjustment decisions when activity decreased in the previous period and increases in the current period. This may be because managers become pessimistic towards future activity after the activity decreased during the previous period. Pessimistic managers will not proactively acquire resources in response to increased activity in this period (Banker et al. 2014a). Therefore, irrespective of the degree of financial risk, when the previous period’s activity decreases and the current period’s activity increases, managers avoid acquiring new resources, instead using unused resources carried over from the previous period.
22
to Banker et al. (2014a), following a prior activity increase, managers will be optimistic about
future activity. Therefore, we can assume that a prior activity increase further strengthens
managerial optimism on future activity in firms with high financial risk. If optimism about future
activity increases, any increases in activity volume in the current period will cause a rapid
expansion in resources, while decreases in activity volume in the current period leads managers
to retain unused resources. These effects may strengthen the degree of cost stickiness. Therefore,
in the case of a prior activity increase, higher financial risk can both strengthen and weaken the
degree of cost stickiness in the current period. We infer that these two effects of financial risk on
cost behavior may offset each other, and fail to find evidence supporting H2a.
Here, we found the moderating effects of the close relationships with main banks on the
association between financial risk and asymmetric cost behavior. Specifically, our results show
that for firms with a low main bank ratio, financial risk strengthens the degree of cost
anti-stickiness in the case of a prior sales decrease. However, in firms with a high main bank
ratio, the increase in financial risk is not associated with cost behavior. While previous studies
have not paid adequate attention to the impacts of bank–firm relationships on cost behavior, the
results of our study suggest that bank loans from main banks have a significant impact on the
association between financial risk and cost behavior by alleviating the adverse effects of
financial risk on the degree of managerial discretion in resource adjustment decisions.
6. Conclusion
We examined the association between financial risk and cost behavior and the moderating
effects of the impacts of bank–firm relationships on this association. We proposed theoretical
predictions about the effect of financial risk on cost behavior, and presented empirical evidence
23
using financial data collected from Japanese firms. Our results indicate that financial risk affects
the degree of managers’ discretion in resource adjustment decisions through its impacts on
financial flexibility. Our results also show that close ties with main banks have a significant
impact on the association between financial risk and cost behavior by allowing managers to
adjust resources more flexibly in response to sales changes. In summary, our study shows that
although the increase in financial risk will reduce the degree of managerial discretion in resource
adjustment decisions, the close ties with main banks will mitigate this adverse impact of
financial risk.
Our study contributes to the existing body of literature as follows. First, we extend the
literature on asymmetric cost behavior. We demonstrated empirical evidence showing how
financial risk affects the degree of managerial discretion in resource adjustment decisions, and
determined the pattern of asymmetric cost behavior. By focusing on the roles of financial risk,
we provide deeper insight into the relationship between risk and resource adjustment decisions.
As already noted, the managerial decisions of resource retention, reduction, and acquisition in
response to changes in activity volume ultimately influence cost structures. Therefore, managers
need to adjust their resources, taking risks into account. Our results show that, in firms with high
financial risk, the degree of cost anti-stickiness is strengthened in the case of a prior activity
decrease. Cost anti-stickiness in the case of a prior activity decrease implies that the degree of
cost elasticity in response to activity changes is greater when the activity decreases rather than
increases in the current period. Therefore, our analysis suggests that when activity decreases in
both the previous and current periods, managers with high financial risk choose a more elastic
cost structure by significantly reducing unused resources. Thus, managers’ resources adjustment
decisions are interdependent of risk management. Future research needs to explore the
24
interdependency between managers’ resources adjustment decisions and risk management.
Second, we help to explain the relationship between cost behavior and bank–firm
relationships. While prior studies on banking have shown various potential roles of the close ties
with main banks, it has not discussed their implications for cost behavior. We shed light on new
aspects of roles of long-term relationships between main banks and their clients in terms of cost
behavior. Previous studies on relational banking argue that there are various types of relational
banking other than the Japanese main bank system (Berger and Udel 2002). Future research
should explore the roles of other types of relational banking on cost behavior.
The limitations of our study have to be considered when interpreting our results. First,
while we use the debt ratio and the SAF values as proxies for financial risk, there are other
measures of financial risk, such as those of Ohlson (1980) and Altman (1968). Second, we were
unable to find a statistically significant relationship between financial risk and cost behavior
when activity increased in the previous period. As discussed above, we infer that one of the
reasons is the contradictory effects of financial risk on cost behavior. Future research can
distinguish between these two effects, which would deepen our understanding of the influence of
financial risk on cost behavior. Third, our study implies that risk management and managerial
resource adjustment decisions in response to changes in activity volume have an interdependent
relationship. Future research can explore these associations between cost behavior and a variety
of risks, such as those stemming from diversification or global supply chains.
REFERENCES
Altman, E. 1968. “Financial Rations, Discriminant Analysis and the Predicion of Corporate
Bankuraptcy.” Journal of Finance 23 (4):589-609.
25
Aoki, M. 1994. "Monitoring Characteristics of the Main Bank System: An Analytical and
Development View." In Aoki, M. 2013. "Comparative Institutional Analysis: Theory,
Corporations and East Asia. Selected Papers of Masahiko Aoki" Edward Elgar Publishing.
Chapter19:342-374.
Aoki, M., and H. Patrick. 1995. "The Japanese Main Bank System: Its Relevance for Developing
and Transforming Economies." Oxford University Press.
Anderson, M. C., R. D. Banker, and S. N. Janakiraman. 2003. “Are Selling, General, and
Administrative Costs "Sticky"?” Journal of Accounting Research 41 (1):47-63.
Balakrishnan, R., M. J. Petersen, and N. Soderstrom. 2004. “Does Capacity Utilization Affect the
"Stickiness" of Cost?” Journal of Accounting, Auditing & Finance 19 (3):283-300.
Banker, R. D., D. Byzalov, and L. Chen. 2013. “Employment Protection Legislation, Adjustment
Costs and Cross-Country Differences in Cost Behavior.” Journal of Accounting &
Economics 55 (1):111-127.
Banker, R. D., D. Byzalov, M. Ciftci, and R. Mashruwala. 2014a. “The Moderating Effect of
Prior Sales Changes on Asymmetric Cost Behavior.” Journal of Management Accounting
Research 26 (2):221-242.
Banker, R. D., D. Byzalov, and J. M. Plehn-Dujowich. 2014b. “Demand Uncertainty and Cost
Behavior.” The Accounting Review 89 (3):839-865.
Banker, R. D., and L. Chen. 2006. “Predicting Earnings Using a Model Based on Cost Variability
and Cost Stickiness.” The Accounting Review 81 (2):285-307.
Banker, R. D., and J. S. Hughes. 1994. “Prduct Costing and Pricing.” The Accounting Review 69
(3):479-494.
Berger, A. N. 2002. "Small Business Credit Availability and Relationship Lending: The
26
Importance of Bank Organisational Structure, The Economic Journal 112(477): 32-53.
Boot, A. W. A. 2000. "Relationship Banking: What Do We Know?." Journal of Financial
Intermediation 9 (1):7-25.
Caballero, R. J., T. Hoshi, and A. K. Kashyap. 2008. "Zombie Lending and Depressed
Restructuring in Japan." The American Economic Review 98 (5):1943-1977.
Cannon, J. N. 2014. “Determinants of “Sticky Costs”: An Analysis of Cost Behavior using
United States Air Transportation Industry Data.” The Accounting Review 89
(5):1645-1672.
Chen, C. X., T. Gores, and J. Nasev. 2013. “Managerial Overconfidence and Cost Stickiness.”
SSRN Electronic Journal.
Chen, C. X., H. A. I. Lu, and T. Sougiannis. 2012. “The Agency Problem, Corporate Governance,
and the Asymmetrical Behavior of Selling, General, and Administrative Costs*.”
Contemporary Accounting Research 29 (1):252-282.
Hilary, G., and C. Hsu. 2011. Endogeneous Overconfidence in Managerial Forecasts: INSEAD
Working Paper.
Holzhacker, M., R. Krishnan, and M. D. Mahlendorf. 2015. “Unraveling the Black Box of Cost
Behavior: An Empirical Investigation of Risk Drivers, Managerial Resource Procurement,
and Cost Elasticity.” The Accounting Review 90 (6):2305-2335.
Horngren, C. T., S. M. datar, and M. V. Rajan. 2011. Cost Accounting. 14 ed: Prentice Hall.
Hoshi, T., and A. K. Kashyap. 2004. "Japan's Financial Crisis and Economic Stagnation." The
Journal of Economic Perspectives 18 (1):3-26.
Hoshi, T. 1996. The Economic Role of Corporate Grouping and the Main Bank System. In The
Japanese Firm: The Sources of Competitive Strength, edited by M. Aoki and R. Dore:
27
Oxford University Press.
Hoshi, T., A. Kashyap, and D. Scharfstein. 1990. “The Role of Banks in Reducing the Costs of
FInancial Distress in Japan.” Journal of Financial Economics 27:67-88.
Kallapur, S., and L. Eldenburg. 2005. “Uncertainty, Real Options, and Cost Behavior: Evidence
from Washington State Hospitals.” Journal of Accounting Research 43 (5):735-752.
Kama, I., and D. A. N. Weiss. 2013. “Do Earnings Targets and Managerial Incentives Affect
Sticky Costs?” Journal of Accounting Research 51 (1):201-224.
Kobayashi, M., and H. Osano. 2011. "The New Main Bank System." Journal of The Japanese
and International Economies 25 (3):336-354.
Libby, R., and K. Rennekamp. 2012. “Self-Serving Attribution Bias, Overconfidence, and the
Issuance of Management Forecasts.” Journal of Accounting Research 50 (1):197-231.
Malmendier, U., G. Tate, and J. O. N. Yan. 2011. “Overconfidence and Early-Life Experiences:
The Effect of Managerial Traits on Corporate Financial Policies.” The Journal of Finance
66 (5):1687-1733.
Myers, S. C. 1977. “Determinants of Corporate Borrowing.” Journal of Financial Economics 5
(2):147-175.
Ohlson, J. A. 1980. “Financial Ratios and the Probabilistic Prediction of Bankruptcy.” Journal of
Accounting Research 18 (1):109.
Peek, J., and E. S. Rosengren. 2005. "Unnatural Selection: Perverse Incentives and the
Misallocation of Credit in Japan." The American Economic Review 95 (4):1144-1166.
Prendergast, C. 2002. “The Tenuous Tradeoff between Risk and Incentives. ” Journal of Political
Economy 110 (5):1071-1102.
Rajan, R. G. 1992. "Insiders and Outsiders: The Choice between Informed and Arm's‐length
28
Debt." The Journal of Finance 47 (4):1367-1400.
Sheard, P. 1994. "Reciprocal Delegated Monitoring in the Japanese Main Bank System." Journal
of the Japanese and International Economies 8 (1):1-21.
Sharpe, S. A. 1990. "Asymmetric Information, Bank Lending, and Implicit Contracts: A Stylized
Model of Customer Relationships." The journal of Finance 45 (4):1069-1087.
Shirata, Y. 2003. Bankruptcy Prediction Model: Chuokeizaisha.written in Japanese.
Weinstein, N. D. 1980. “Unrealistic Optimism about Future Life Events.” Journal of Personality
and Social Psychology 39 (5):806-820.
Weiss, D. 2010. “Cost Behavior and Analysts’ Earnings Forecasts.” The Accounting Review 85
(4):1441-1471.
29
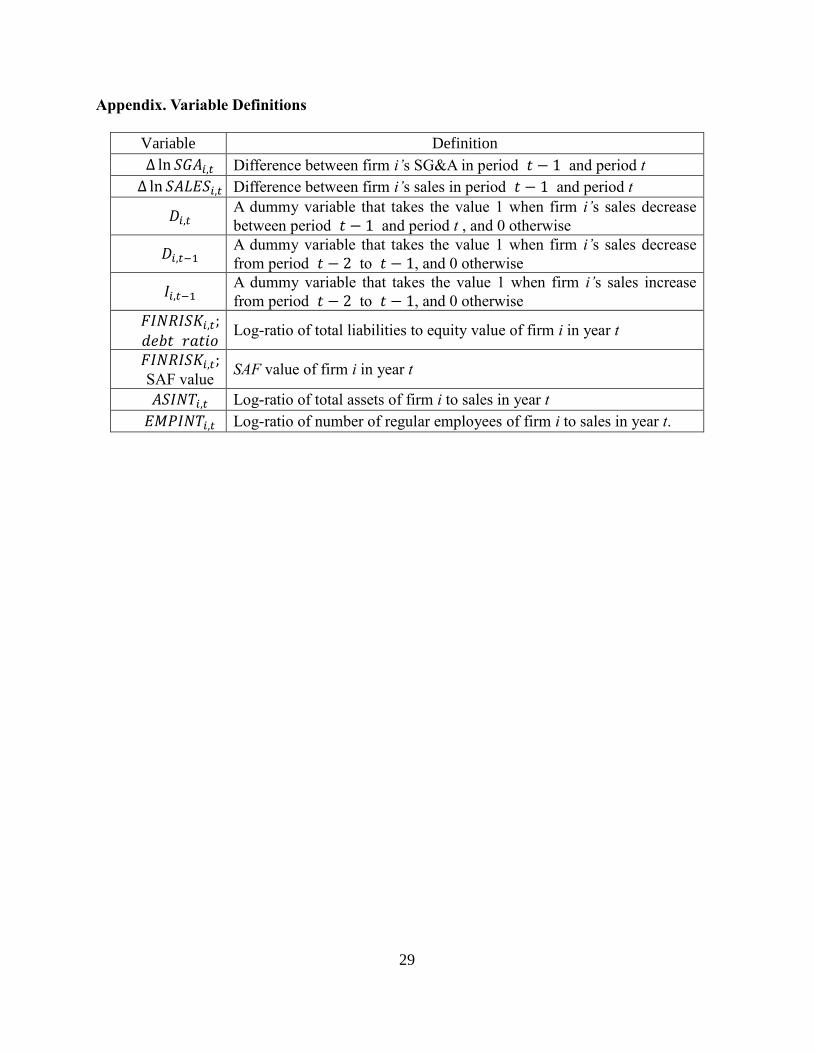
Appendix. Variable Definitions
Variable Definition
∆ ln 𝑆𝐺𝐴𝑖,𝑡 Difference between firm i’s SG&A in period 𝑡 − 1 and period t
∆ ln 𝑆𝐴𝐿𝐸𝑆𝑖,𝑡 Difference between firm i’s sales in period 𝑡 − 1 and period t
𝐷𝑖,𝑡 A dummy variable that takes the value 1 when firm i’s sales decrease
between period 𝑡 − 1 and period t , and 0 otherwise
𝐷𝑖,𝑡−1 A dummy variable that takes the value 1 when firm i’s sales decrease
from period 𝑡 − 2 to 𝑡 − 1, and 0 otherwise
𝐼𝑖,𝑡−1 A dummy variable that takes the value 1 when firm i’s sales increase
from period 𝑡 − 2 to 𝑡 − 1, and 0 otherwise
𝐹𝐼𝑁𝑅𝐼𝑆𝐾𝑖,𝑡;
𝑑𝑒𝑏𝑡 𝑟𝑎𝑡𝑖𝑜 Log-ratio of total liabilities to equity value of firm i in year t
𝐹𝐼𝑁𝑅𝐼𝑆𝐾𝑖,𝑡; SAF value
SAF value of firm i in year t
𝐴𝑆𝐼𝑁𝑇𝑖,𝑡 Log-ratio of total assets of firm i to sales in year t
𝐸𝑀𝑃𝐼𝑁𝑇𝑖,𝑡 Log-ratio of number of regular employees of firm i to sales in year t.
30
FIGURE 1
Cost Stickiness Conditional on a Prior Activity Increase
resource requirements
resource requirements
+
acceptable slack
Resources
(Costs)
Activitiest
(decrease)
Activitiest
(increase)
Activitiest-1
31
FIGURE 2
Cost Anti-Stickiness Conditional on a Prior Activity Decrease
resource requirements
resource requirements
+
acceptable slack
Resources
(Costs)
Activitiest
(decrease)
Activitiest
(increase)
Activitiest-1
32
FIGURE 3
Effect of Financial Risk on Cost Behavior Conditional on a Prior Activity Increase
33
FIGURE 4
Effect of Financial Risk on Cost Behavior Conditional on a Prior Activity Decrease
34
TABLE 1
Descriptive Statistics
Variables Mean Standard
Deviation
Lower
Quartile
Median Upper Quartile
𝑆𝐴𝐿𝐸𝑆𝑖,𝑡, Yen million 187,931 383,577 21,296 52,804 160,762
𝑆𝐺𝐴𝑖,𝑡, Yen million 29,929 61,542 3,262 7,841 24,958
𝑆𝐺𝐴𝑖,𝑡 ∕ 𝑆𝐴𝐿𝐸𝑆𝑖,𝑡 19.5 13.7 10.0 16.1 24.1
𝐹𝐼𝑁𝑅𝐼𝑆𝐾𝑖,𝑡
(Debt Ratio) 0.191 1.050 -0.496 0.176 0.843
𝐹𝐼𝑁𝑅𝐼𝑆𝐾𝑖,𝑡
(SAF Value) 0.947 0.346 0.749 0.955 1.172
𝑀𝐵𝑅𝐴𝑇𝐼𝑂𝑖,𝑡 0.178 0.140 0.063 0.148 0.261
𝐸𝑀𝑃𝐼𝑁𝑇𝑖,𝑡 -3.761 0.786 -4.234 -3.704 -3.238
35
TABLE 2
Estimates for Eq. (1) and (2) Using Full Sample
Coeffici
ents Variables
Estimates
(1) (2): Debt
Ratio
(2): SAF
Value
𝛽1𝑃𝐼𝑛𝑐𝑟 𝐼𝑖,𝑡−1∆ ln 𝑆𝐴𝐿𝐸𝑆𝑖,𝑡
0.669***
(0.018)
0.920***
(0.048)
0.880***
(0.072)
𝛽2𝑃𝐼𝑛𝑐𝑟 𝐼𝑖,𝑡−1𝐷𝑖,𝑡∆ ln 𝑆𝐴𝐿𝐸𝑆𝑖,𝑡
-0.402***
(0.027)
-0.409***
(0.027)
-0.370***
(0.054)
𝛿1𝑃𝐼𝑛𝑐𝑟 𝐼𝑖,𝑡−1∆ ln 𝑆𝐴𝐿𝐸𝑆𝑖,𝑡 𝐹𝐼𝑁𝑅𝐼𝑆𝐾𝑖,𝑡
-0.013
(0.011)
0.026
(0.042)
𝛿2𝑃𝐼𝑛𝑐𝑟 𝐼𝑖,𝑡−1𝐷𝑖,𝑡∆ ln 𝑆𝐴𝐿𝐸𝑆𝑖,𝑡 𝐹𝐼𝑁𝑅𝐼𝑆𝐾𝑖,𝑡
0.024
(0.016)
-0.047
(0.050)
𝛽1𝑃𝐷𝑒𝑐𝑟 𝐷𝑖,𝑡−1∆ ln 𝑆𝐴𝐿𝐸𝑆𝑖,𝑡
0.401***
(0.025)
0.650***
(0.060)
0.543***
(0.080)
𝛽2𝑃𝐷𝑒𝑐𝑟 𝐷𝑖,𝑡−1𝐷𝑖,𝑡∆ ln 𝑆𝐴𝐿𝐸𝑆𝑖,𝑡
0.104***
(0.027)
0.072*
(0.034)
0.192***
(0.051)
𝛿1𝑃𝐷𝑒𝑐𝑟 𝐷𝑖,𝑡−1∆ ln 𝑆𝐴𝐿𝐸𝑆𝑖,𝑡 𝐹𝐼𝑁𝑅𝐼𝑆𝐾𝑖,𝑡
-0.002
(0.021)
0.127***
(0.035)
𝛿2𝑃𝐷𝑒𝑐𝑟 𝐷𝑖,𝑡−1𝐷𝑖,𝑡∆ ln 𝑆𝐴𝐿𝐸𝑆𝑖,𝑡 𝐹𝐼𝑁𝑅𝐼𝑆𝐾𝑖,𝑡
0.065*
(0.029)
-0.141***
(0.036)
𝛽3 ∆ ln 𝑆𝐴𝐿𝐸𝑆𝑖,𝑡 𝐴𝑆𝐼𝑁𝑇𝑖,𝑡 -0.048*
(0.022)
-0.031
(0.020)
𝛽4 ∆ ln 𝑆𝐴𝐿𝐸𝑆𝑖,𝑡𝐸𝑀𝑃𝐼𝑁𝑇𝑖,𝑡 0.062***
(0.012)
0.060***
(0.013)
N 19,447 19,447 17,924
Adjusted R2 0.432 0.440 0.441
AIC -43,308 -43,559 -40,897 ***p<.001,**p<.01,*p<.05. () Indicates standard error. A two-way cluster-robust standard error t-test was undertaken on the two
primary factors of firms and financial years in order to confirm the significance of the estimated factors.
36
TABLE 3
Estimates for Eq. (2) Using Sub-Samples on the Basis of the Fraction of Loan Amount from
Main Bank to Total Assets
Coeffi
cients Variables
Estimates
High Main Bank Ratio Low Main Bank Ratio
Debt Ratio SAF Debt Ratio SAF
𝛽1𝑃𝐼𝑛𝑐𝑟 𝐼𝑖,𝑡−1∆ ln 𝑆𝐴𝐿𝐸𝑆𝑖,𝑡
0.920***
(0.077)
0.860***
(0.067)
1.073***
(0.068)
1.058***
(0.097)
𝛽2𝑃𝐼𝑛𝑐𝑟 𝐼𝑖,𝑡−1𝐷𝑖,𝑡∆ ln 𝑆𝐴𝐿𝐸𝑆𝑖,𝑡
-0.489***
(0.042)
-0.502***
(0.072)
-0.422***
(0.043)
-0.318***
(0.092)
𝛿1𝑃𝐼𝑛𝑐𝑟 𝐼𝑖,𝑡−1∆ ln 𝑆𝐴𝐿𝐸𝑆𝑖,𝑡 𝐹𝐼𝑁𝑅𝐼𝑆𝐾𝑖,𝑡
-0.017
(0.025)
0.014
(0.019)
0.019
(0.017)
0.026
(0.049)
𝛿2𝑃𝐼𝑛𝑐𝑟 𝐼𝑖,𝑡−1𝐷𝑖,𝑡∆ ln 𝑆𝐴𝐿𝐸𝑆𝑖,𝑡 𝐹𝐼𝑁𝑅𝐼𝑆𝐾𝑖,𝑡
0.043
(0.042)
0.066
(0.103)
-0.043
(0.049)
-0.122
(0.079)
𝛽1𝑃𝐷𝑒𝑐𝑟 𝐷𝑖,𝑡−1∆ ln 𝑆𝐴𝐿𝐸𝑆𝑖,𝑡
0.594***
(0.088)
0.540***
(0.091)
0.785***
(0.074)
0.550***
(0.131)
𝛽2𝑃𝐷𝑒𝑐𝑟 𝐷𝑖,𝑡−1𝐷𝑖,𝑡∆ ln 𝑆𝐴𝐿𝐸𝑆𝑖,𝑡
0.100
(0.065)
0.057
(0.057)
0.053
(0.045)
0.294***
(0.082)
𝛿1𝑃𝐷𝑒𝑐𝑟 𝐷𝑖,𝑡−1∆ ln 𝑆𝐴𝐿𝐸𝑆𝑖,𝑡 𝐹𝐼𝑁𝑅𝐼𝑆𝐾𝑖,𝑡
0.056
(0.037)
0.088***
(0.025)
-0.060
(0.040)
0.265**
(0.091)
𝛿2𝑃𝐷𝑒𝑐𝑟 𝐷𝑖,𝑡−1𝐷𝑖,𝑡∆ ln 𝑆𝐴𝐿𝐸𝑆𝑖,𝑡 𝐹𝐼𝑁𝑅𝐼𝑆𝐾𝑖,𝑡
0.010
(0.051)
0.065
(0.085)
0.095*
(0.045)
-0.285***
(0.079)
𝛽3 ∆ ln 𝑆𝐴𝐿𝐸𝑆𝑖,𝑡 𝐴𝑆𝐼𝑁𝑇𝑖,𝑡 -0.053
(0.032)
-0.006
(0.038)
-0.070***
(0.016)
-0.071***
(0.018)
𝛽4 ∆ ln 𝑆𝐴𝐿𝐸𝑆𝑖,𝑡𝐸𝑀𝑃𝐼𝑁𝑇𝑖,𝑡 0.055**
(0.018)
0.045**
(0.017)
0.105***
(0.016)
0.106***
(0.019)
n 7729 7404 7729 7499
Adjusted R2 0.410 0.432 0.434 0.438
AIC -16118 -16093 -18384 -18063 ***p<.001,**p<.01,*p<.05. () Indicates standard error. A two-way cluster-robust standard error t-test was undertaken on the two
primary factors of firms and financial years in order to confirm the significance of the estimated factors.
37
TABLE 4
Robustness Check: Estimates for Eq. (2) Using Sub-Samples on the Basis of the Fraction of
Loan Amount from Main Bank to Total Loan Amount
Coeffi
cients Variables
Estimates
High Main Bank Ratio Low Main Bank Ratio
Debt Ratio SAF Debt Ratio SAF
𝛽1𝑃𝐼𝑛𝑐𝑟 𝐼𝑖,𝑡−1∆ ln 𝑆𝐴𝐿𝐸𝑆𝑖,𝑡
1.040***
(0.060)
1.021***
(0.064)
0.915***
(0.072)
0.815***
(0.124)
𝛽2𝑃𝐼𝑛𝑐𝑟 𝐼𝑖,𝑡−1𝐷𝑖,𝑡∆ ln 𝑆𝐴𝐿𝐸𝑆𝑖,𝑡
-0.428***
(0.045)
-0.435***
(0.097)
-0.443***
(0.043)
-0.384***
(0.127)
𝛿1𝑃𝐼𝑛𝑐𝑟 𝐼𝑖,𝑡−1∆ ln 𝑆𝐴𝐿𝐸𝑆𝑖,𝑡 𝐹𝐼𝑁𝑅𝐼𝑆𝐾𝑖,𝑡
0.026
(0.024)
-0.035
(0.065)
-0.041
(0.027)
0.082
(0.088)
𝛿2𝑃𝐼𝑛𝑐𝑟 𝐼𝑖,𝑡−1𝐷𝑖,𝑡∆ ln 𝑆𝐴𝐿𝐸𝑆𝑖,𝑡 𝐹𝐼𝑁𝑅𝐼𝑆𝐾𝑖,𝑡
-0.026
(0.049)
-0.033
(0.114)
0.064
(0.033)
-0.051
(0.116)
𝛽1𝑃𝐷𝑒𝑐𝑟 𝐷𝑖,𝑡−1∆ ln 𝑆𝐴𝐿𝐸𝑆𝑖,𝑡
0.787***
(0.087)
0.707***
(0.132)
0.615***
(0.069)
0.344***
(0.103)
𝛽2𝑃𝐷𝑒𝑐𝑟 𝐷𝑖,𝑡−1𝐷𝑖,𝑡∆ ln 𝑆𝐴𝐿𝐸𝑆𝑖,𝑡
0.042
(0.061)
0.121
(0.097)
0.068
(0.036)
0.425***
(0.085)
𝛿1𝑃𝐷𝑒𝑐𝑟 𝐷𝑖,𝑡−1∆ ln 𝑆𝐴𝐿𝐸𝑆𝑖,𝑡 𝐹𝐼𝑁𝑅𝐼𝑆𝐾𝑖,𝑡
0.006
(0.047)
0.054
(0.082)
-0.016
(0.027)
0.300***
(0.081)
𝛿2𝑃𝐷𝑒𝑐𝑟 𝐷𝑖,𝑡−1𝐷𝑖,𝑡∆ ln 𝑆𝐴𝐿𝐸𝑆𝑖,𝑡 𝐹𝐼𝑁𝑅𝐼𝑆𝐾𝑖,𝑡
0.060
(0.054)
-0.092
(0.084)
0.116**
(0.038)
-0.425***
(0.097)
𝛽3 ∆ ln 𝑆𝐴𝐿𝐸𝑆𝑖,𝑡 𝐴𝑆𝐼𝑁𝑇𝑖,𝑡 -0.064**
(0.022)
-0.047*
(0.022)
-0.058
(0.031)
-0.038
(0.035)
𝛽4 ∆ ln 𝑆𝐴𝐿𝐸𝑆𝑖,𝑡𝐸𝑀𝑃𝐼𝑁𝑇𝑖,𝑡 0.090***
(0.013)
0.073***
(0.013)
0.063***
(0.016)
0.058***
(0.017)
n 7,729 7397 7,729 7506
Adjusted R2 0.427 0.447 0.421 0.421
AIC -16,578 -16557 -17,769 -17378 ***p<.001,**p<.01,*p<.05. () Indicates standard error. A two-way cluster-robust standard error t-test was undertaken on the two
primary factors of firms and financial years in order to confirm the significance of the estimated factors.
[2016.12.21 1226]