20162016, and construction is well underway, with an expected opening in 2019. mcr development will...
TRANSCRIPT

4 World Trade Center150 Greenwich StreetNew York, NY 10007www.panynj.gov
The Foundation for a New Tomorrow
2016Annual Report
4 World Trade Center150 Greenwich StreetNew York, NY 10007www.panynj.gov
The Foundation for a New Tomorrow
2016Annual Report
Comprehensive Annual Financial Report for the Year Ended December 31, 2016
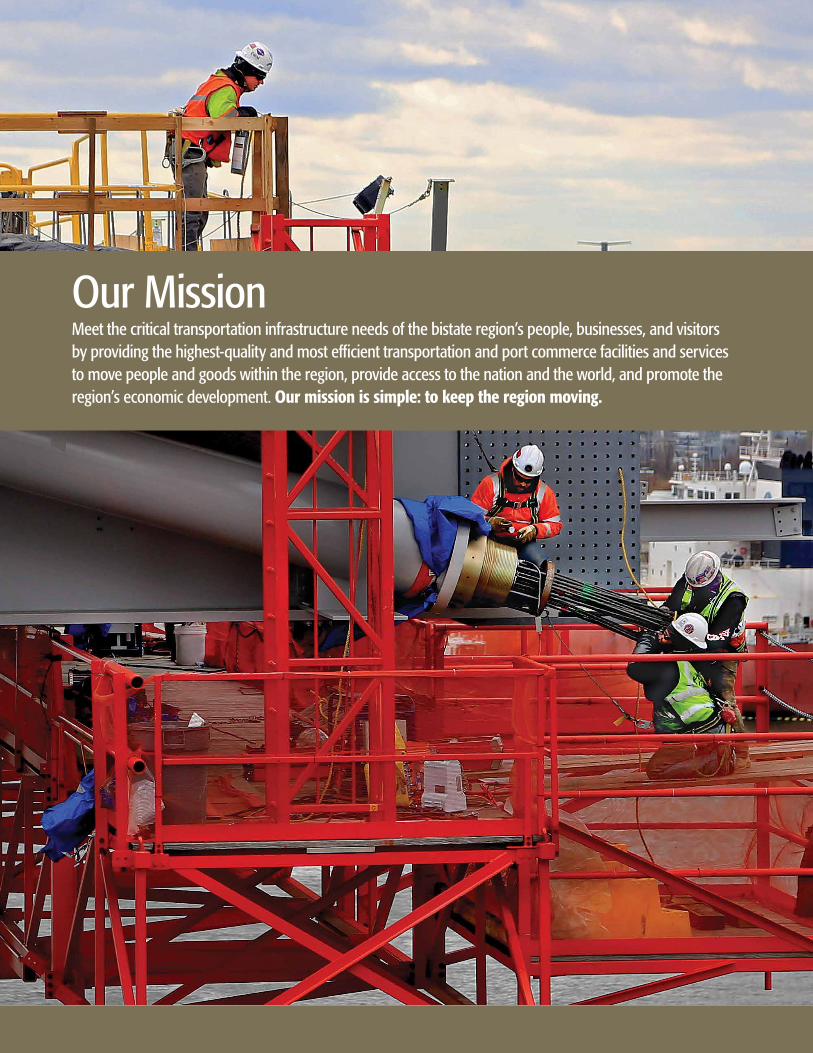
Our MissionMeet the critical transportation infrastructure needs of the bistate region’s people, businesses, and visitors by providing the highest-quality and most efficient transportation and port commerce facilities and services to move people and goods within the region, provide access to the nation and the world, and promote the region’s economic development. Our mission is simple: to keep the region moving.

1THE FOUNDATION FOR A NEW TOMORROW
Table of ContentsIntrOductOry SectIOn
2 Origins of The Port Authority of New York and New Jersey
3 Chairman’s Letter of Transmittal to the Governors
4 Board of Commissioners
5 Leadership of the Port Authority
7 Letter from the Executive Director
10 The Foundation for a New Tomorrow
14 Major Milestones of 2016
21 2016 at a Glance
22 Renew
28 Expand and Connect
34 Partner
40 Deliver
FInancIal SectIOn
48 Chief Financial Officer’s Letter of Transmittal to the Board of Commissioners
51 Index to Financial Section
cOrpOrate InFOrmatIOn SectIOn
138 Selected Statistical, Demographic, and Economic Data
139 Top 20 Salaried Staff as of December 31, 2016
The Port Authority of New York and New Jersey Comprehensive Annual Financial Report for the Year Ended December 31, 2016Prepared by the Marketing and Comptroller’s departments of The Port Authority of New York and New Jersey4 World Trade Center, 150 Greenwich Street, 23rd Floor, New York, NY 10007www.panynj.gov
Construction of the replacement Goethals Bridge
advanced with the installation of 144 powerful stay cables.
They will connect the bridge’s four sets of massive,
V-shaped concrete towers to its twin roadways.
2 THE PORT AUTHORITY OF NY & NJ
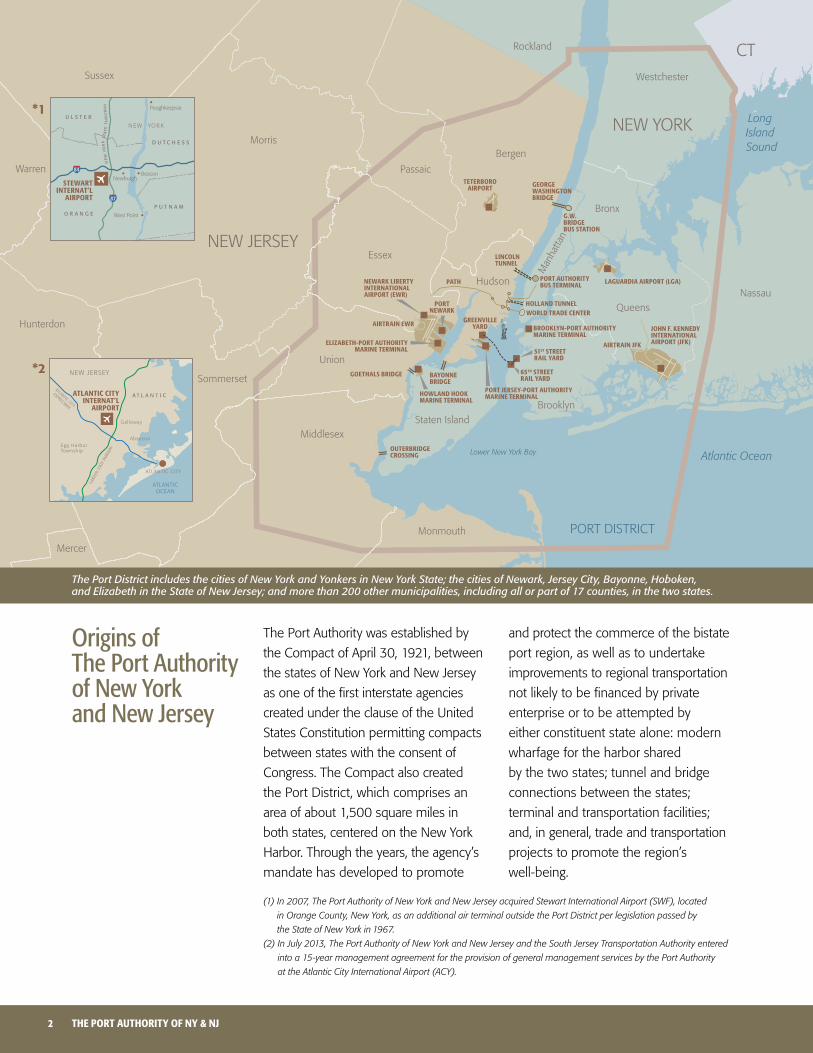
The Port Authority was established by
the Compact of April 30, 1921, between
the states of New York and New Jersey
as one of the first interstate agencies
created under the clause of the United
States Constitution permitting compacts
between states with the consent of
Congress. The Compact also created
the Port District, which comprises an
area of about 1,500 square miles in
both states, centered on the New York
Harbor. Through the years, the agency’s
mandate has developed to promote
and protect the commerce of the bistate
port region, as well as to undertake
improvements to regional transportation
not likely to be financed by private
enterprise or to be attempted by
either constituent state alone: modern
wharfage for the harbor shared
by the two states; tunnel and bridge
connections between the states;
terminal and transportation facilities;
and, in general, trade and transportation
projects to promote the region’s
well-being.
(1) In 2007, The Port Authority of New York and New Jersey acquired Stewart International Airport (SWF), located
in Orange County, New York, as an additional air terminal outside the Port District per legislation passed by
the State of New York in 1967.
(2) In July 2013, The Port Authority of New York and New Jersey and the South Jersey Transportation Authority entered
into a 15-year management agreement for the provision of general management services by the Port Authority
at the Atlantic City International Airport (ACY).
Origins of The Port Authority of New York and New Jersey
The Port District includes the cities of New York and Yonkers in New York State; the cities of Newark, Jersey City, Bayonne, Hoboken, and Elizabeth in the State of New Jersey; and more than 200 other municipalities, including all or part of 17 counties, in the two states.

3THE FOUNDATION FOR A NEW TOMORROW
Dear Governors,
On behalf of the Board of Commissioners, I am pleased to present to you and to the legislatures of New York and
New Jersey the 2016 Comprehensive Annual Report of The Port Authority of New York and New Jersey.
This Annual Report highlights the agency’s continued execution of its core mission to ensure safe and efficient
operations and the development of our region’s critical transportation infrastructure.
Throughout 2016, the Port Authority has taken many innovative steps to continue to create and strengthen the
foundation for moving people and goods throughout the region today, tomorrow, and for future generations. Each step
reflects the forward thinking of committed agency planners, the hard and often unsung work of highly talented agency
staff, and a firm understanding of how a thriving region such as ours must initiate bold plans in the present to prosper
in the future, while demonstrating fiduciary and ethical prudence.
The facilities of the Port Authority are significant to the economic vitality of New York and New Jersey, and it is vital
that we, as stewards of the public’s infrastructure, operate, maintain, and build them to support the evolving needs of the
region. As our bistate region continues to grow, we rely on infrastructure assets that were originally designed to support
fewer commuters, tourists, businesses, and cargo. As an agency, we strive to meet this increased demand by renewing
iconic structures, such as raising the Bayonne Bridge and “Restoring the George,” strengthening our transportation network
by implementing a 21st-century signal system for PATH, constructing a new Terminal A at Newark Liberty International
Airport and a replacement Goethals Bridge, and planning for and developing a reimagined Port Authority Bus Terminal.
You will read how these projects and others were incorporated into the 10-year, $32.2 billion 2017-2026 Capital
Plan approved by the Board of Commissioners in February 2017. This plan, the largest ever in Port Authority history,
reveals a vision of admirable scope while highlighting the many difficult decisions good leaders must make to justly
serve the public good.
It is imperative that the Port Authority develop and operate its many responsibilities with the significant input and
support of our regional stakeholders. Given the impact of our facilities and operations, this agency must coordinate with
stakeholders to accomplish the goals of the region. As the agency plans for its second century, we intend to do so in an
open and transparent manner, welcoming feedback from the public and our partners from early project planning to
construction. The Goethals Bridge Replacement Program, the Gateway Program, and the LaGuardia Airport Redevelopment
Program stand out as signature accomplishments of both urban and fiscal planning. Through strong collaboration with
fellow stakeholders, the Port Authority now stands poised to achieve meaningful service growth across all lines of business.
For these and other reasons, it is my estimation that history will look back on 2016 as a year our agency not only
redefined itself, but took first steps into a new era. Your leadership played a pivotal role in making those steps possible,
and for that I thank you.
Sincerely,
John J. Degnan
Chairman
April 27, 2017
The honorableandrew M. CuoMoGovernor, State of New York
The honorableChris ChrisTieGovernor, State of New Jersey
Chairman’s Letter of Transmittal to the Governors

4 THE PORT AUTHORITY OF NY & NJ
KenneTh lipperChairmanLipper & Co. LLC
riChard h. baggerExecutive Vice President, Corporate Affairs and Market Access Celgene Corporation
haMilTon “TonY” e. JaMesPresidentThe Blackstone Group
MiChael d. FasCiTelliFounderMDF Capital
williaM “paT” sChuberProfessorFairleigh Dickinson University
Caren Z. TurnerChief Executive OfficerTurner Government and Public Affairs
raYMond M. poCinoVice President Laborers International Union of North AmericaEastern Regional Manager
ChairManJohn J. degnan
JeFFreY h. lYnFordPresident and CEOEducational Housing Services, Inc.
Board of Commissioners
As of April 1, 2017
John J. Degnan, Chairman
Richard H. Bagger
Michael D. Fascitelli
Hamilton “Tony” E. James
Kenneth Lipper
Jeffrey H. Lynford
Raymond M. Pocino
William “Pat” Schuber
David S. Steiner
Caren Z. Turner1
1Caren Z. Turner joined the Board on March 17, 2017.
The following also served on the Board of Commissioners during 2016:
Steven M. Cohen, Vice Chair
George R. Laufenberg
Scott H. Rechler, Vice Chair
david s. sTeinerChairmanSteiner Equities Group LLC

5THE FOUNDATION FOR A NEW TOMORROW
exeCuTive direCTorpaTriCK J. FoYe
Leadership of the Port AuthorityThe Governor of each state appoints six members to the agency’s Board of
Commissioners for overlapping six-year terms; each appointment is subject to the
approval of the respective State Senate. Commissioners serve as public officials
of their respective states, and without remuneration. The Governors retain the right
to veto the actions of Commissioners from their respective states. An Executive
Director* elected by the Board is responsible for managing the operation of the
Port Authority in a manner consistent with the agency’s policies, as established by
the Board. The agency undertakes projects and activities in accordance with the
Port Compact of 1921, and amendatory and supplemental bistate legislation.
* The report by the Special Panel on the Future of the Port Authority that was issued to the Governors on December 26, 2014, included a recommendation that the positions of Executive Director and Deputy Executive Director be replaced with a single Chief Executive Officer appointed by and accountable to the Board. A nationwide search for a qualified candidate is currently in progress.
6 THE PORT AUTHORITY OF NY & NJ
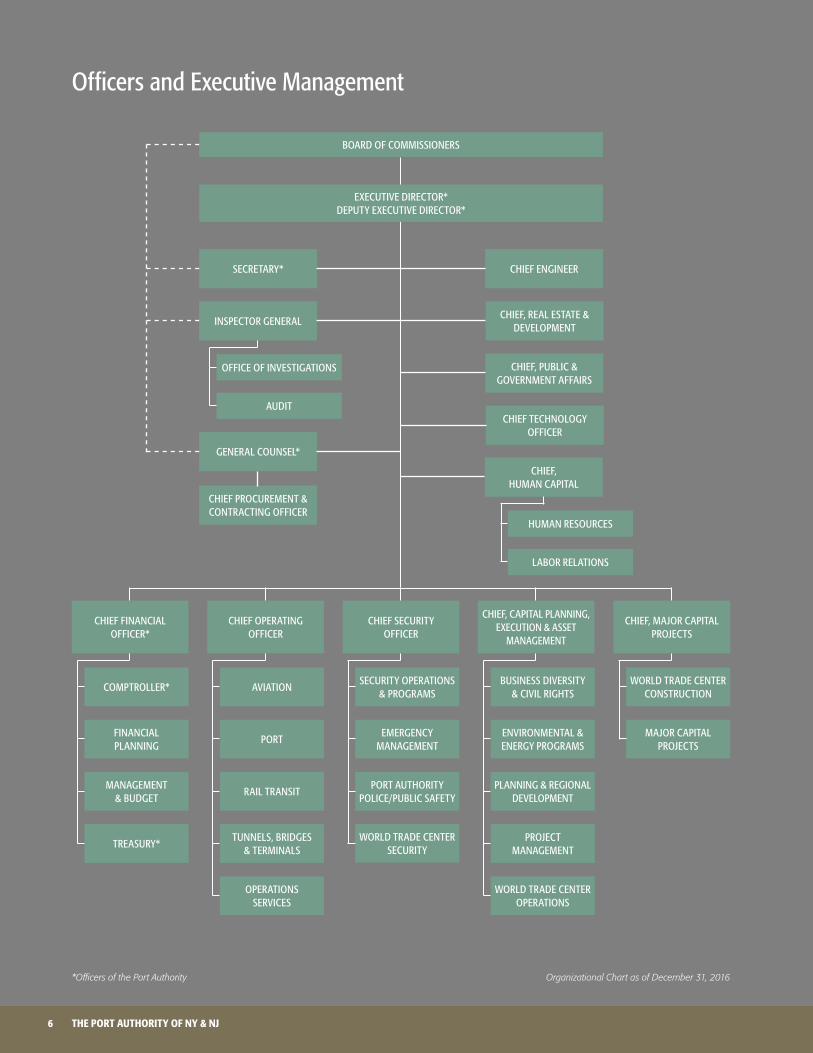
Officers and Executive Management
ChiEf fiNANCiALOffiCEr*
ChiEf OPErATiNG OffiCEr
ChiEf SECUriTY OffiCEr
ChiEf, CAPiTAL PLANNiNG, ExECUTiON & ASSET
MANAGEMENT
ChiEf, MAJOr CAPiTAL PrOJECTS
AViATiONBUSiNESS DiVErSiTY
& CiViL riGhTSWOrLD TrADE CENTEr
CONSTrUCTiONSECUriTY OPErATiONS
& PrOGrAMSCOMPTrOLLEr*
POrTENVirONMENTAL &ENErGY PrOGrAMS
MAJOr CAPiTAL PrOJECTS
EMErGENCYMANAGEMENT
fiNANCiAL PLANNiNG
rAiL TrANSiTPLANNiNG & rEGiONAL
DEVELOPMENTPOrT AUThOriTY
POLiCE/PUBLiC SAfETYMANAGEMENT
& BUDGET
TUNNELS, BriDGES& TErMiNALS
PrOJECT MANAGEMENT
WOrLD TrADE CENTEr SECUriTY
TrEASUrY*
OPErATiONS SErViCES
WOrLD TrADE CENTEr OPErATiONS
BOArD Of COMMiSSiONErS
SECrETArY* ChiEf ENGiNEEr
ChiEf, PUBLiC & GOVErNMENT AffAirS
ChiEf, rEAL ESTATE & DEVELOPMENT
iNSPECTOr GENErAL
GENErAL COUNSEL*
ChiEf PrOCUrEMENT & CONTrACTiNG OffiCEr
ChiEf TEChNOLOGY OffiCEr
ChiEf, hUMAN CAPiTAL
OffiCE Of iNVESTiGATiONS
hUMAN rESOUrCES
AUDiT
LABOr rELATiONS
ExECUTiVE DirECTOr*DEPUTY ExECUTiVE DirECTOr*
*Officers of the Port Authority Organizational Chart as of December 31, 2016

7THE FOUNDATION FOR A NEW TOMORROW
Dear Board of Commissioners:
In 2016, the Port Authority continued to maintain our focus on safely and efficiently moving the millions of travelers
and commuters who pass through our facilities, while reaching major milestones on key projects , which are already
underway, and embarking on new initiatives to ensure that our facilities continue to meet the region’s transportation
needs in the future.
Last year, we again saw consistent growth in passengers and travelers at our facilities, and set new operational
records: our airports welcomed more than 129 million passengers for an increase of 5.1 percent over 2015, marking
the fourth consecutive year of record-setting passenger numbers at our airports. The Port Authority Trans-Hudson
(PATH) rail system moved more than 78 million riders, the highest ridership ever recorded and an increase of
2.6 percent over the previous year. Our six tunnels and bridges supported more than 118 million vehicle crossings in
2016 for an increase of 2.4 percent over 2015. Meanwhile, the Port of New York and New Jersey handled steady
volumes in cargo, moving over 3 million containers in 2016 and maintaining its position as the largest and the busiest
port on the East Coast.
In addition to our operational achievements, we worked together to develop a $32.2 billion 2017-2026 Capital Plan,
which you unanimously adopted in February 2017—the largest in the agency’s history and one that truly provides a
blueprint and foundation for a new tomorrow. Overall, the projects in this Capital Plan are expected to generate over
235,000 job years and contribute $56 billion in overall regional economic activity. The Plan represents a tremendous
long-term investment in our region and in the transportation assets that connect people to jobs, support freight and
cargo access to the region and the country, and keep the bistate region competitive in the global economy.
The Capital Plan commits to reinvesting in our existing infrastructure, while preparing our facilities for the future and
our region’s expected growth. We are making significant investments to keep our facilities in a state of good repair,
including nearly $2 billion to rehabilitate and modernize the George Washington Bridge, the busiest bridge in the world.
Our PATH system continues to be a regional leader in the installation of Positive Train Control (PTC), which is just one
part of the larger $752 million PATH Forward Program to improve the system’s operational reliability and efficiency while
enhancing safety. This past September, with our partners at the U.S. Army Corps of Engineers, we marked the
completion of a $2 billion project to deepen portions of the New York and New Jersey Harbor, to accommodate larger,
modern vessels at our local ports. These are just a few of the projects that will ensure that our assets operate safely,
securely, and efficiently for years to come.
We also reached significant milestones on projects that improve and upgrade our bridge facilities. At the Bayonne
Bridge, we are completing an innovative feat of civil engineering by raising the roadway of the iconic structure 64 feet,
to allow larger container ships to pass underneath. In February 2017, the first vehicles traveled across the Bayonne
Bridge’s new upper span, and demolition of the lower roadway is currently underway. Once demolition is completed,
higher navigational clearance will be available for those larger ships. Nearby, we continue to make progress on the
Goethals Bridge Replacement Project, through a public-private partnership (P3)— the first true surface transportation P3
in the Northeast region.
Letter from the Executive Director
8 THE PORT AUTHORITY OF NY & NJ
In addition to maintaining momentum on our existing portfolio of projects, we continue to lead the nation in
pioneering innovative models to finance and deliver major infrastructure improvements, and leveraging private capital
to make these developments happen. In 2016, the Port Authority advanced two significant projects to modernize
LaGuardia Airport. LaGuardia Gateway Partners broke ground in June on the redevelopment of Terminal B — the
largest P3 project in the U.S. — and has already made significant progress toward its construction milestones. Just next
door, Delta Air Lines will be leading the redevelopment of Terminals C and D. Together, these projects will create a
new LaGuardia for the 21st century, with a single, structurally unified terminal redesigned to provide a world-class
passenger experience.
With our experience on the Goethals Bridge Replacement and LaGuardia Terminal B Redevelopment projects,
we have established a leadership position nationally in public-private partnerships. These transactions have allowed
us to leverage private capital and expertise, and transfer project risk to the private sector. In 2017, we look forward to
the groundbreaking on Delta’s new Terminal C at LaGuardia Airport, a project that similarly uses private sector funding
and expertise to deliver new infrastructure. The Port Authority made a $600 million capped contribution to the
project, with Delta bearing the risk of cost overruns and schedule delays, and financing the remainder of the project,
estimated to be $4.5 billion overall. We will look to apply this approach to our other major projects going forward,
where it makes sense both for the agency and the public that we serve.
In 2016, the Port Authority, working together with USDOT, Amtrak and NJ TRANSIT, made major commitments
to advance and support the Gateway Program, the most critical and urgent rail infrastructure program in the country.
The Program is focused on modernizing and improving a vital section of the Northeast Corridor between Newark,
New Jersey, and Penn Station in New York City, starting with the replacement of the Portal Bridge and the 107-year-old
Hudson River tunnels. In our 2017-2026 Capital Plan, the Port Authority allocated the largest funding of any partner in
the program to date in the form of debt service support on up to $2.7 billion in low-interest federal loans for the Portal
Bridge and Hudson River tunnels projects. Currently, the existing tunnels handle 450 trains carrying over 200,000 daily
passengers each weekday, and are a vital trans-Hudson connection and an integral link to the region and the country.
All of our accomplishments in 2016 demonstrate the Port Authority’s steadfast commitment to our region and its
people. I am deeply proud of all that we achieved this past year, despite challenges and headwinds, and I am grateful
to the skilled staff who work tirelessly to keep our facilities operating safely and smoothly, and keep our projects
moving forward. Each and every one of our agency’s staff members contributes to the safety and vitality of this
region — from our operations staff, who clear airport runways and bridge crossings in a snowstorm, to the engineers
guiding major capital projects; and from our PATH staff to the Port Authority police officers who keep us safe and
protect us from harm each and every day. A vision as broad and sweeping as the one we advanced together this past
year requires hard work, constant vigilance, and an unwavering commitment to our agency’s core mission and values.
The cornerstones have been laid, and now I look forward to working with you as we build for the future.
Patrick J. Foye
Executive Director
April 27, 2017

9THE FOUNDATION FOR A NEW TOMORROW

10 THE PORT AUTHORITY OF NY & NJ
The foundation for a New Tomorrowfor nearly a hundred years, The Port Authority of New York and New Jersey has developed and stewarded some of the nation’s most vital transportation infrastructure. These assets play a critical role in supporting the growth of our bistate region, while contributing substantially to the economy.
11THE FOUNDATION FOR A NEW TOMORROW
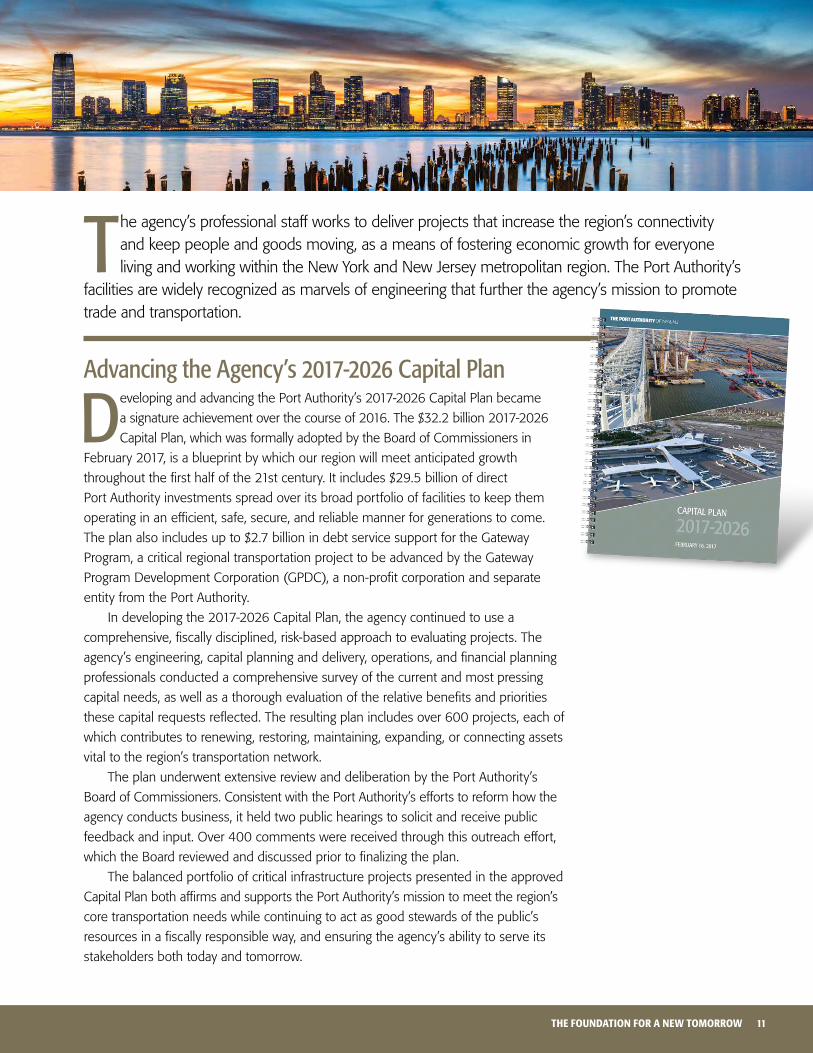
Advancing the Agency’s 2017-2026 Capital Plan
Developing and advancing the Port Authority’s 2017-2026 Capital Plan became
a signature achievement over the course of 2016. The $32.2 billion 2017-2026
Capital Plan, which was formally adopted by the Board of Commissioners in
February 2017, is a blueprint by which our region will meet anticipated growth
throughout the first half of the 21st century. It includes $29.5 billion of direct
Port Authority investments spread over its broad portfolio of facilities to keep them
operating in an efficient, safe, secure, and reliable manner for generations to come.
The plan also includes up to $2.7 billion in debt service support for the Gateway
Program, a critical regional transportation project to be advanced by the Gateway
Program Development Corporation (GPDC), a non-profit corporation and separate
entity from the Port Authority.
In developing the 2017-2026 Capital Plan, the agency continued to use a
comprehensive, fiscally disciplined, risk-based approach to evaluating projects. The
agency’s engineering, capital planning and delivery, operations, and financial planning
professionals conducted a comprehensive survey of the current and most pressing
capital needs, as well as a thorough evaluation of the relative benefits and priorities
these capital requests reflected. The resulting plan includes over 600 projects, each of
which contributes to renewing, restoring, maintaining, expanding, or connecting assets
vital to the region’s transportation network.
The plan underwent extensive review and deliberation by the Port Authority’s
Board of Commissioners. Consistent with the Port Authority’s efforts to reform how the
agency conducts business, it held two public hearings to solicit and receive public
feedback and input. Over 400 comments were received through this outreach effort,
which the Board reviewed and discussed prior to finalizing the plan.
The balanced portfolio of critical infrastructure projects presented in the approved
Capital Plan both affirms and supports the Port Authority’s mission to meet the region’s
core transportation needs while continuing to act as good stewards of the public’s
resources in a fiscally responsible way, and ensuring the agency’s ability to serve its
stakeholders both today and tomorrow.
The agency’s professional staff works to deliver projects that increase the region’s connectivity and keep people and goods moving, as a means of fostering economic growth for everyone living and working within the New York and New Jersey metropolitan region. The Port Authority’s
facilities are widely recognized as marvels of engineering that further the agency’s mission to promote trade and transportation.

12 THE PORT AUTHORITY OF NY & NJ
With the 2017-2026 Capital Plan, the Port Authority and its Board of Commissioners
affirm a renewed focus of investment in our core transportation assets. Approximately
$600 million in unallocated “regional development” funds has been deployed to
transportation projects that align with the agency’s core mission. This was a
recommendation by the Special Panel on the Future of the Port Authority, a report that
was endorsed by both Governors in December 2014.
In determining funding allocation, the first priority was to ensure that there were
sufficient funds to deliver the projects that are currently in construction. Next, funds were
allocated to maintain our assets in full operational capacity and provide for projects
required by law or for security purposes. Finally, funds were allocated to provide for
projects that will restore and fortify assets damaged by Superstorm Sandy, and to other
high-priority projects that will expand and improve critical transportation assets.
This foundation for the future is built on our four main funding priorities and objectives.
$8.8 billion for projects required to renew and maintain assets in a state of good repair and ensure efficient, safe, and secure operations. physical condition, operational impact, risk assessment, and state/federal regulations are among the factors considered to determine criticality of renewal projects. (an additional $3.2 billion in renew projects are currently in construction and included under the deliver portion of the program).
del
IVer
part
ner
eXpa
nd
an
d c
On
nec
tre
neW
$11.1 billion to invest in projects that expand capacity, improve connectivity, support the region’s growth, and advance the region’s transportation needs. projects are evaluated based on scale of impact to the agency and the region as well as potential to enhance revenue generation. (an additional $4.1 billion in expand and Connect projects are currently in construction and included under the deliver portion of the program).
$4.7 billion for projects where we partner with federal and regional stakeholders to complete superstorm sandy restoration, fortify and improve the resiliency of our assets, and build for the future, with $2 billion in direct port authority investment. in addition, the plan also provides for the port authority’s support of the gateway program, a critical trans-hudson rail link and associated infrastructure. These funds, in the amount of $2.7 billion, would support debt service on a portion of the gateway program development Corporation’s (gpdC) low-cost borrowing. gpdC is not a subsidiary or component unit of the port authority. The agency would not be subject to project cost overrun or funding gap risk.
$7.6 billion to complete and deliver the projects that are currently under construction. deliver projects in this capital plan include $3.2 billion in renew projects, $4.1 billion in expand and Connect projects, and $300,000 in partner projects.

13THE FOUNDATION FOR A NEW TOMORROW
Capital Plan by Category
The plan adheres to three guiding principles:• To apply the agency’s financial capacity and full resources toward modernizing and
expanding the region’s aging airports, seaports, mass transit facilities, and other vital
trans-Hudson transportation assets.
• To continue serving our customers efficiently, focusing on maintaining our facilities
in a state of good repair, while ensuring safety, security, and resiliency.
• To allocate the agency’s affordable capital to its highest-priority needs in a fiscally
responsible manner so as to achieve a financially balanced plan.
The capital plan is a blueprint for future spending, and does not supplant the
Port Authority Board’s authorization process for specific projects and contracts. Accordingly,
the capital plan and related questions of funding capacity will be monitored and
adjusted as necessary in the future.
The Port Authority will continue to monitor capital expenditures and capital capacity
on a quarterly basis. In addition, at least every two years, the Board will reassess the
capital plan in light of then-current information as to capital capacity and the progress
of capital projects, and determine whether there are sufficient resources.
Further, the Board has directed staff to enhance its “gates” management process, in
order to determine when construction may begin on a given capital project. This process
includes, among other things, consideration of the revenue-generating potential and
capital capacity impact of the capital project; the relative priority of the project; and the
overall capital capacity of the Port Authority.
For more information on the 2017-2026 Capital Plan and to view the document
itself, please visit http://www.panynj.gov/capitalplan/.
ExPAND AND CONNECT$11.1/34%
DELiVEr$7.6/24%
PArTNEr$4.7/15%
rENEW$8.8/27%
(estimate cost in billions)

14 THE PORT AUTHORITY OF NY & NJ
Major Milestones of 2016

15THE FOUNDATION FOR A NEW TOMORROW
The Port Authority made tremendous strides after breaking ground on a new
LaGuardia Airport in June 2016. Consistent with recommendations made by
New York Governor Andrew Cuomo’s Airport Advisory Panel, the transformation
of LaGuardia is taking place through two major components. The first component is the
redevelopment of Terminal B. LaGuardia Gateway Partners (LGP) is designing, building,
financing, operating, and maintaining the new, 1.3-million-square-foot, state-of-the-art
35-gate terminal. This is the largest public-private partnership in the nation, and
construction of the new Terminal B is well underway.
The second component, the redevelopment of Terminals C and D next door, was
greenlighted in July 2016. The Port Authority’s Board of Commissioners authorized a fixed
$600 million in capital expenditures in July, and the lease of terminals C and D in early
January 2017. Delta Air Lines will design, finance, construct, operate, and maintain a new
Terminal C to replace the existing terminals C and D.
The Terminal B Redevelopment by LGP and Terminal C Redevelopment by Delta
Air Lines will transform LaGuardia Airport to meet the needs of the 21st century, creating
a single, structurally unified terminal with improved transportation access, increased
airside space to mitigate aircraft congestion and delays, and a world-class passenger
experience. As part of the Terminal B project, there will be a new parking garage,
supporting facilities, and a new Central Arrivals and Departures Hall that will connect
to Terminal C. LGP’s new terminal buildings will be located closer to the Grand Central
Parkway, which frees up substantial airside space and will improve the efficiency of
aircraft movements, thus reducing delays.
These projects will result in more than $8 billion in investment at the airport,
80 percent of which leverages private financing and utilizes existing passenger fees.
The private partners will also bear the risk of schedule delays and cost overruns.
Construction of the new Terminal B is advancing steadily with the facility’s opening
expected in 2021. Work on the new Terminal C is expected to begin in 2017, with
anticipated completion in 2026.
LaGuardia Airport plays a vital role in the regional airport system, welcoming more than 28 million passengers annually and generating nearly 130,000 jobs and $6.4 billion in annual wages.
A rendering of LaGuardia’s new Terminal B.
16 THE PORT AUTHORITY OF NY & NJ
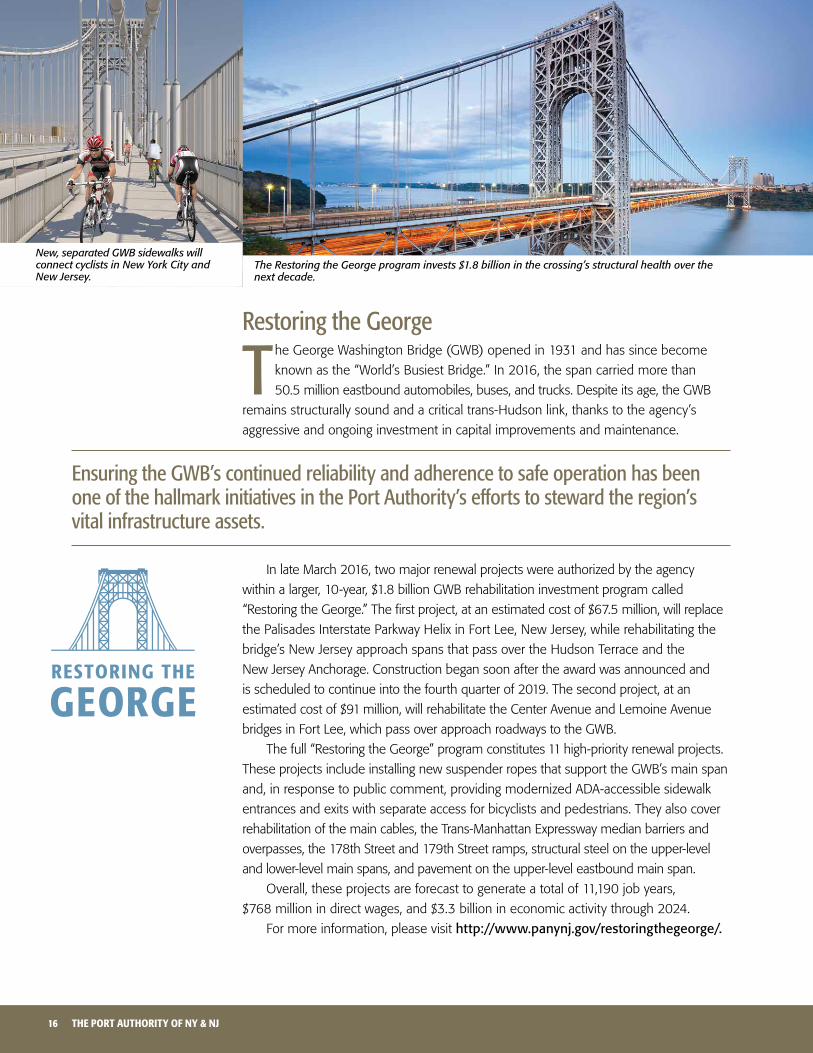
restoring the George
The George Washington Bridge (GWB) opened in 1931 and has since become
known as the “World’s Busiest Bridge.” In 2016, the span carried more than
50.5 million eastbound automobiles, buses, and trucks. Despite its age, the GWB
remains structurally sound and a critical trans-Hudson link, thanks to the agency’s
aggressive and ongoing investment in capital improvements and maintenance.
In late March 2016, two major renewal projects were authorized by the agency
within a larger, 10-year, $1.8 billion GWB rehabilitation investment program called
“Restoring the George.” The first project, at an estimated cost of $67.5 million, will replace
the Palisades Interstate Parkway Helix in Fort Lee, New Jersey, while rehabilitating the
bridge’s New Jersey approach spans that pass over the Hudson Terrace and the
New Jersey Anchorage. Construction began soon after the award was announced and
is scheduled to continue into the fourth quarter of 2019. The second project, at an
estimated cost of $91 million, will rehabilitate the Center Avenue and Lemoine Avenue
bridges in Fort Lee, which pass over approach roadways to the GWB.
The full “Restoring the George” program constitutes 11 high-priority renewal projects.
These projects include installing new suspender ropes that support the GWB’s main span
and, in response to public comment, providing modernized ADA-accessible sidewalk
entrances and exits with separate access for bicyclists and pedestrians. They also cover
rehabilitation of the main cables, the Trans-Manhattan Expressway median barriers and
overpasses, the 178th Street and 179th Street ramps, structural steel on the upper-level
and lower-level main spans, and pavement on the upper-level eastbound main span.
Overall, these projects are forecast to generate a total of 11,190 job years,
$768 million in direct wages, and $3.3 billion in economic activity through 2024.
For more information, please visit http://www.panynj.gov/restoringthegeorge/.
The Restoring the George program invests $1.8 billion in the crossing’s structural health over the next decade.
New, separated GWB sidewalks will connect cyclists in New York City and New Jersey.
Ensuring the GWB’s continued reliability and adherence to safe operation has been one of the hallmark initiatives in the Port Authority’s efforts to steward the region’s vital infrastructure assets.

17THE FOUNDATION FOR A NEW TOMORROW
Moving PATh forward
PATH has been a regional leader in the installation of
Positive Train Control (PTC), a signal system upgrade
mandated by the Federal Railroad Administration
(FRA) to enhance and ensure the safety of all rail systems
across the nation. As of the end of 2016, PATH is on target
to meet the year-end 2018 federal deadline to have the
system installed and operational. Installation of PTC is part
of the PATH Signal System Replacement Program to
replace the aging signal system with a Communications-
based Train Control (CBTC) system. The new PATH CBTC/
PTC system will integrate state-of-the-art hardware,
software, and infrastructure elements to ensure safety and
improve the PATH experience by allowing trains to run
more closely together, especially during peak hours.
By the end of 2016, CBTC equipment had been
installed on 216 of 230 PATH passenger cars, and
95 percent of PATH employees were trained in PTC.
PTC compliance and the PATH Signal System
Replacement Program are parts of the agency’s larger
$752 million PATH Forward Program to improve the
operational reliability and efficiency of the PATH system,
which includes capital investments ranging from station
redevelopment and improvements to system upgrades
and storm resiliency (see “Partner,” page 34).
For more information about this program, please visit
http://www.panynj.gov/pathforward/.
Completing the harbor Deepening Program
in September 2016, the Port Authority and U.S. Army
Corps of Engineers announced the completion of a
$2.1 billion project to deepen the major channels used
to access the Port of New York and New Jersey to a depth
of 50 feet. The Harbor Deepening Program was deemed
pivotal to allow larger, neo-Panamax vessels to access the
port’s container terminals.
In the course of the project, 52 million cubic yards
of silt, sand, till, clay, and six different types of bedrock
were dredged from the harbor floor—enough material to
fill a professional football stadium to a height of five miles.
All dredged material was repurposed to serve the agency’s
sustainability objectives by creating fishing reefs, restoring
marshes, and capping landfills and brownfields.
Thanks to the success of this program, the more than
$203 billion in cargo that passes through the Port of
New York and New Jersey each year will continue to do so.
This, in turn, ensures that our region and nation remain
competitive in the arena of global trade.
PATH Forward is a series of system enhancements that are designed to improve the operational reliability and efficiency of the rail system.
A primary goal of the Harbor Deepening program was to provide improved ocean access to accommodate the demand for international cargo through the region.
FORWARD

18 THE PORT AUTHORITY OF NY & NJ
implementing Agency-Wide Efficiencies
in an effort to address the many transformative
recommendations made by the Special Panel on the
Future of the Port Authority, the agency launched
its Special Panel Implementation Office (SPIO) in
April 2015. Ninety agency professionals worked to
develop improvements in nine teams specific to the
agency’s lines of business or operations: Asset Review
Metric and Capital Planning, Aviation, Board Calendar
and Metrics, Ethics and Transparency, Finance, PATH,
Port, Real Estate Divestiture, and Trans-Hudson.
Each team worked with departments across the
agency to complete its objectives. Their many
accomplishments included recommending the creation
of a new Chief Ethics and Compliance Officer position;
exploring more flexible and innovative financing
techniques; and devising a plan to enhance trans-
Hudson transportation capacity. Together, the teams’
efforts have further refocused the agency on its core
mission and enhanced its commitment to transparency
and integrity.
The agency’s staff continues to explore how insights
gleaned from SPIO can be incorporated into future
efficiency-building efforts across the Port Authority’s
many departments.
Winning the “Greenest fleet” Award
The Port Authority had the “greenest fleet” of motor
vehicles in North America among public agencies,
according to the “100 Best Fleets in North America™”
survey published by Government Green Fleet magazine.
For the previous seven consecutive years, the Port Authority
made the top 50 of the 100 Best Fleets list; 2016 was
the first year it was recognized as number one, a clear
testament to the agency’s aggressive clean air strategy.
The agency’s 2,000 on-road and off-road vehicles
that use alternative fuels constitute 85 percent of the
entire fleet. Combined, they eliminate more than 2,000
tons of carbon dioxide emissions from the air annually.
The Port Authority continually replaces many of its older
gasoline-powered cars and trucks with low-emission
models, including SmartWay vehicles certified by the
Environmental Protection Agency.
In addition to fleet maintenance, the agency’s Central
Automotive Division integrates green and efficient
practices into daily operations through the use of green
cleaning products and oil testing equipment, as well as
experimenting with soy as an alternate cleaning lubricant.
The nine teams of the Special Panel Implementation Office charted their progress and accomplishments using monthly dashboards posted to the agency’s website.
There are over a dozen biodiesel snow removal trucks like this one in the Port Authority’s fleet.
19THE FOUNDATION FOR A NEW TOMORROW
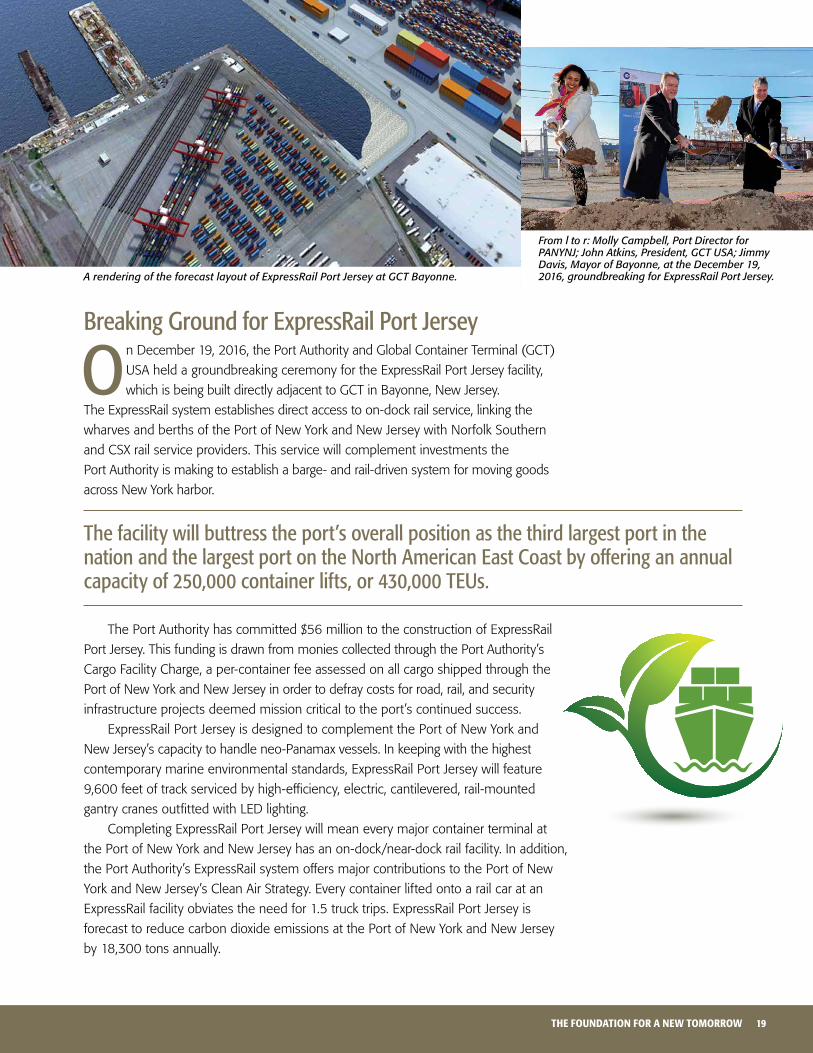
Breaking Ground for Expressrail Port Jersey
On December 19, 2016, the Port Authority and Global Container Terminal (GCT)
USA held a groundbreaking ceremony for the ExpressRail Port Jersey facility,
which is being built directly adjacent to GCT in Bayonne, New Jersey.
The ExpressRail system establishes direct access to on-dock rail service, linking the
wharves and berths of the Port of New York and New Jersey with Norfolk Southern
and CSX rail service providers. This service will complement investments the
Port Authority is making to establish a barge- and rail-driven system for moving goods
across New York harbor.
The Port Authority has committed $56 million to the construction of ExpressRail
Port Jersey. This funding is drawn from monies collected through the Port Authority’s
Cargo Facility Charge, a per-container fee assessed on all cargo shipped through the
Port of New York and New Jersey in order to defray costs for road, rail, and security
infrastructure projects deemed mission critical to the port’s continued success.
ExpressRail Port Jersey is designed to complement the Port of New York and
New Jersey’s capacity to handle neo-Panamax vessels. In keeping with the highest
contemporary marine environmental standards, ExpressRail Port Jersey will feature
9,600 feet of track serviced by high-efficiency, electric, cantilevered, rail-mounted
gantry cranes outfitted with LED lighting.
Completing ExpressRail Port Jersey will mean every major container terminal at
the Port of New York and New Jersey has an on-dock/near-dock rail facility. In addition,
the Port Authority’s ExpressRail system offers major contributions to the Port of New
York and New Jersey’s Clean Air Strategy. Every container lifted onto a rail car at an
ExpressRail facility obviates the need for 1.5 truck trips. ExpressRail Port Jersey is
forecast to reduce carbon dioxide emissions at the Port of New York and New Jersey
by 18,300 tons annually.
The facility will buttress the port’s overall position as the third largest port in the nation and the largest port on the North American East Coast by offering an annual capacity of 250,000 container lifts, or 430,000 TEUs.
A rendering of the forecast layout of ExpressRail Port Jersey at GCT Bayonne.
From l to r: Molly Campbell, Port Director for PANYNJ; John Atkins, President, GCT USA; Jimmy Davis, Mayor of Bayonne, at the December 19, 2016, groundbreaking for ExpressRail Port Jersey.

20 THE PORT AUTHORITY OF NY & NJ
Achieving Milestones in the Goethals Bridge replacement Public-Private Partnership
The Port Authority’s $1.5 billion project to replace the Goethals Bridge was more than
70 percent complete by the end of 2016.
The agency is delivering the Goethals Bridge Replacement project— the agency’s
first new bridge in more than 80 years, and the first true surface transportation public-
private partnership in the Northeast region — through a partnership with NYNJ Link.
Construction on a new Goethals Bridge began in 2014. Once the bridge is complete,
each roadway, eastbound and westbound, will offer three 12-foot travel lanes, plus
shoulders. The new bridge will also include a 10-foot-wide shared-use path for bicycles
and pedestrians, and a central channel to facilitate a possible future light rail system.
In the early part of 2016, workers completed demolition of the entire eastbound
approach to the original Goethals Bridge over the New Jersey Turnpike, even as the
installation of bridge girders for the replacement New Jersey approach commenced.
Construction on the bridge deck began in the spring while an identical process took place
on the New York approach. In all, a total of 56 eastbound, pre-stressed, precast approach
girders were erected, while approximately 150 precast, pre-stressed panels were
constructed atop the girders. According to current estimates by agency staff, substantial
completion of the replacement bridge is expected to occur in the first quarter of 2018,
and project completion, including the demolition of the existing bridge, to occur in the
fourth quarter of 2018.
Also in the spring, workers began to install the new bridge’s 144 stay cables, which
can measure up to 400 feet long and 13 inches in diameter. Connected to both the
bridge’s roadways like giant harp strings, the stays will channel the structural tension of
vehicles traveling across the span into the V-shaped support towers.
For more information, please visit http://www.panynj.gov/goethalsbridgereplacement/.
The new bridge will offer a state-of-the-art traveling experience over a 900-foot cable-stayed twin roadbed suspended from four sets of V-shaped concrete towers, each of which stands 272 feet tall.
Construction proceeds on the new Goethals Bridge.

21THE FOUNDATION FOR A NEW TOMORROW
Note: Estimated data based on available year-end information.
Supporting Growth in Trans-hudson TravelThe agency’s tunnels and bridges are crucial links in the trans-Hudson transportation network. They continue to play a vital role in connecting commuters and travelers across the bistate region.
Breaking records for intermodal rail Rail volumes continue to rise at the Port of New York and New Jersey. New vehicle import/export volumes to and from inland destinations are an important part of past and future economic growth.
2.4% increase in vehicles over 2015.Six tunnels and bridges supported 118,771,000 vehicles in 2016.
2.6% increase in PATh ridership over 2015.PATH system transported 78,553,560 total passengers.
3.4% increase over 2015.Rail volumes rose 540,149 lifts at the Port of New York and New Jersey.
44% increase over 2015.Auto rail volumes at Port Newark surpassed 100,000 vehicles.
Creating Growth in Auto TradeThe Port Authority’s Auto Incentive Program continues to draw positive interest from the Original Equipment Manufacturers (OEM) supporting the Port of New York and New Jersey. In 2016 we added the fifth OEM, which clearly shows the value and ability of the Auto Incentive Program to drive new volume.
2.9% increase in vehicle auto trade over 2015.Aggregate total of 662,913 vehicles served.
5.1% increase in vehicle imports tradeover 2015.Aggregate total of 433,777 vehicles served.
re-setting records at Agency Airports Port Authority’s three major airports welcomed over 129 million passengers in 2016 for an increase of approximately 6 million passengers over totals recorded in 2015. The rise in passenger figures continues a trend and highlights the need to modernize Port Authority airports as addressed in the 2017-2026 Capital Plan.
Newark Liberty international Airport (EWr)
40.3 million passengers overall(includes 12.3 mil. international and 28 mil. domestic passengers).
John f. Kennedy international Airport (JfK)
58.9 million passengers overall(includes 31.7 mil. international and 27.2 mil. domestic passengers).
LaGuardia Airport (LGA)
29.8 million passengers overall(includes 1.8 mil. international and 28 mil. domestic passengers).

22 THE PORT AUTHORITY OF NY & NJ
renewAs the Port Authority approaches its centennial, it is important to remember that many of the agency’s facilities have aged, and some of their functional systems are reaching the end of their useful lives. Additionally, the region has grown significantly since these facilities were built, and in some cases current demand exceeds what was envisioned in their original designs. renewal projects focus on maintaining assets to ensure efficient operations and reflect current security and storm resiliency needs, all of which are important priorities for the agency.
The latest breed of larger, neo-Panamax vessels is more environmentally friendly
than its predecessors, but requires upgrades to wharves and berths.
23THE FOUNDATION FOR A NEW TOMORROW
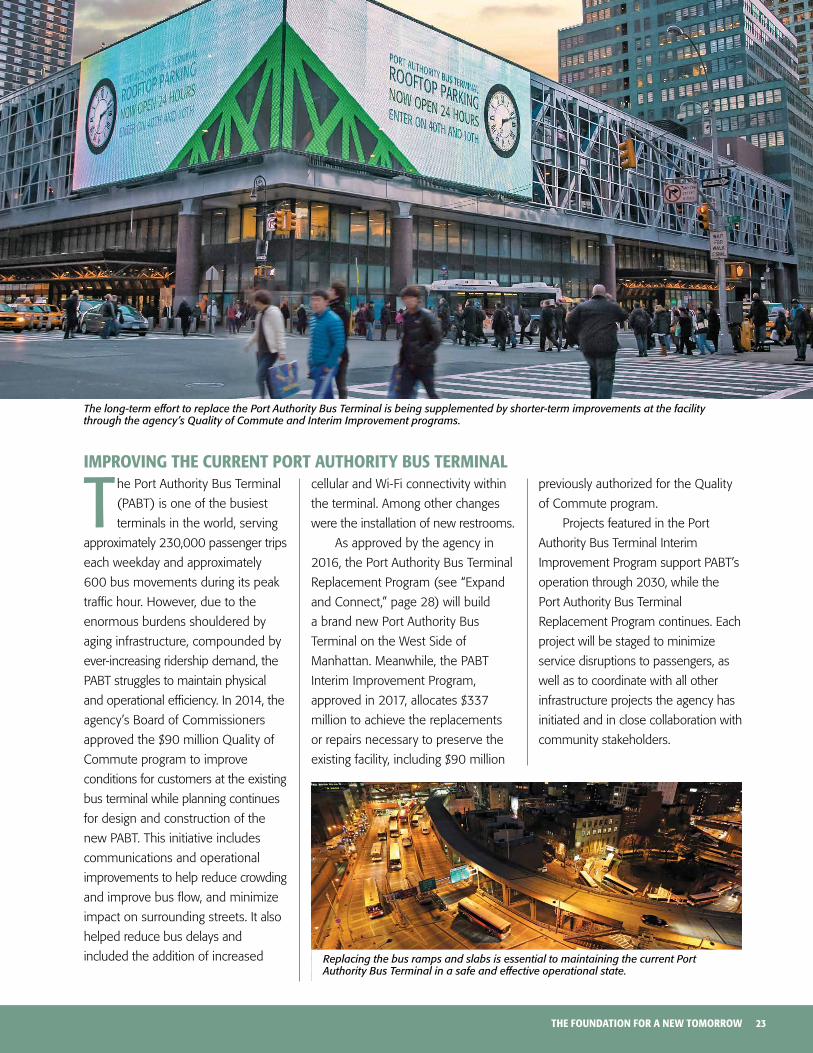
T he Port Authority Bus Terminal
(PABT) is one of the busiest
terminals in the world, serving
approximately 230,000 passenger trips
each weekday and approximately
600 bus movements during its peak
traffic hour. However, due to the
enormous burdens shouldered by
aging infrastructure, compounded by
ever-increasing ridership demand, the
PABT struggles to maintain physical
and operational efficiency. In 2014, the
agency’s Board of Commissioners
approved the $90 million Quality of
Commute program to improve
conditions for customers at the existing
bus terminal while planning continues
for design and construction of the
new PABT. This initiative includes
communications and operational
improvements to help reduce crowding
and improve bus flow, and minimize
impact on surrounding streets. It also
helped reduce bus delays and
included the addition of increased
cellular and Wi-Fi connectivity within
the terminal. Among other changes
were the installation of new restrooms.
As approved by the agency in
2016, the Port Authority Bus Terminal
Replacement Program (see “Expand
and Connect,” page 28) will build
a brand new Port Authority Bus
Terminal on the West Side of
Manhattan. Meanwhile, the PABT
Interim Improvement Program,
approved in 2017, allocates $337
million to achieve the replacements
or repairs necessary to preserve the
existing facility, including $90 million
previously authorized for the Quality
of Commute program.
Projects featured in the Port
Authority Bus Terminal Interim
Improvement Program support PABT’s
operation through 2030, while the
Port Authority Bus Terminal
Replacement Program continues. Each
project will be staged to minimize
service disruptions to passengers, as
well as to coordinate with all other
infrastructure projects the agency has
initiated and in close collaboration with
community stakeholders.
The long-term effort to replace the Port Authority Bus Terminal is being supplemented by shorter-term improvements at the facility through the agency’s Quality of Commute and Interim Improvement programs.
ImprOVInG tHe current pOrt autHOrIty BuS termInal
Replacing the bus ramps and slabs is essential to maintaining the current Port Authority Bus Terminal in a safe and effective operational state.

24 THE PORT AUTHORITY OF NY & NJ
The Port of New York and New
Jersey is the busiest port on the
East Coast of North America,
and a critical link in the world’s supply
chain, facilitating the movement of
millions of cargo containers each year.
The Port Authority took a major
step toward ensuring that our port can
successfully fulfill its regional duty in
the decades to come by beginning
the development of a Maritime Master
Plan. In response to a Request for
Proposals issued on April 11, 2016,
the agency selected a consulting firm
to design a plan that will guide the
growth of the Port of New York
and New Jersey during the next 30
years. The plan will be based upon
information from various studies
conducted by the agency during the
past few years, including the
2014-2015 Land Use Plan and the
2015 Port Demand Capacity Study.
The master planning team will also
solicit ideas and collaborate with
internal and external port stakeholders
while exploring industry trends and
developments that could impact
the port; analyzing the ability of the
existing complex to meet future
demand while increasing revenues
and regional economic activity;
and conducting market analysis
to identify emerging technologies
appropriate for incorporation at
the port.
The development of the Port
Master Plan is expected to occur
through 2018.
The Port of New York and New Jersey has been a leader in cargo innovation. Developing a Master Plan will ensure a holistic outlook toward optimizing all port operations.
Going above and Beyond What’s requiredWilliam radinson is the Port Authority’s Assistant Director for Capital Programs in the Aviation Department. Beyond his job requirements, Bill has served on research panels convened by the Transportation research Board’s Airport Cooperative research Program (ACrP) to explore issues related to best practices in aviation capital planning and creating passenger value. in 2016, he facilitated an ACrP webinar on Developing and Maintaining Support for Airport Capacity Projects, and helped to create the publication “handbook for Addressing Water resource issues Affecting Airport Development Planning.”
deVelOpInG a maSter plan FOr tHe pOrt OF neW yOrK and neW JerSey
25THE FOUNDATION FOR A NEW TOMORROW
prOducInG dIrect FIScal SaVInGS By GOInG Green
for public projects, savings
obtained through environmental
initiatives reduce burdens on
the public by lowering the overall
costs for installation of energy-efficient
equipment and systems over the
lifetime of those systems.
By working with a tax consulting
firm, Port Authority planners were able
to save $660,000 to date, through
either direct payments or credits on
active projects. The savings stem from
a federal Energy Policy tax incentive
that encourages the installation of
energy-efficient measures during
design and construction of public and
private buildings.
These measures were applied to
Port Authority facilities, including One
World Trade Center, the Port Authority
Bus Terminal, Stewart International
Airport, Newark Liberty International
Airport, and LaGuardia Airport.
OpenInG lIBerty parK at tHe WOrld trade center
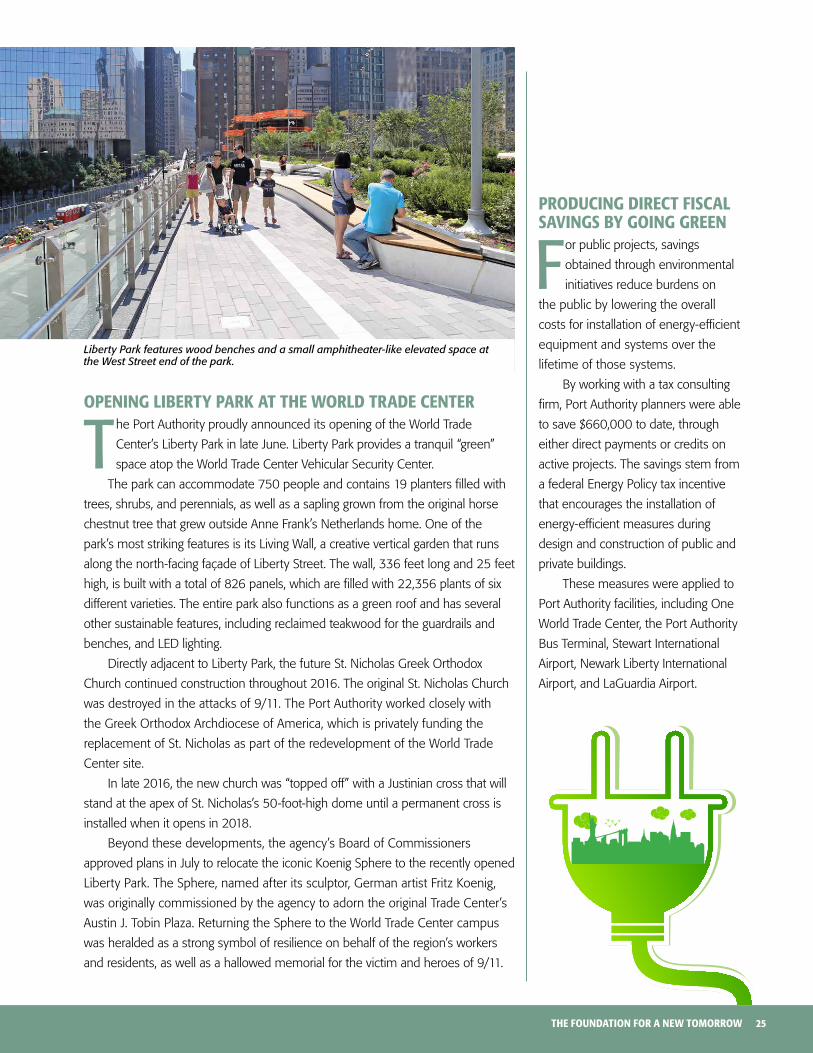
The Port Authority proudly announced its opening of the World Trade
Center’s Liberty Park in late June. Liberty Park provides a tranquil “green”
space atop the World Trade Center Vehicular Security Center.
The park can accommodate 750 people and contains 19 planters filled with
trees, shrubs, and perennials, as well as a sapling grown from the original horse
chestnut tree that grew outside Anne Frank’s Netherlands home. One of the
park’s most striking features is its Living Wall, a creative vertical garden that runs
along the north-facing façade of Liberty Street. The wall, 336 feet long and 25 feet
high, is built with a total of 826 panels, which are filled with 22,356 plants of six
different varieties. The entire park also functions as a green roof and has several
other sustainable features, including reclaimed teakwood for the guardrails and
benches, and LED lighting.
Directly adjacent to Liberty Park, the future St. Nicholas Greek Orthodox
Church continued construction throughout 2016. The original St. Nicholas Church
was destroyed in the attacks of 9/11. The Port Authority worked closely with
the Greek Orthodox Archdiocese of America, which is privately funding the
replacement of St. Nicholas as part of the redevelopment of the World Trade
Center site.
In late 2016, the new church was “topped off” with a Justinian cross that will
stand at the apex of St. Nicholas’s 50-foot-high dome until a permanent cross is
installed when it opens in 2018.
Beyond these developments, the agency’s Board of Commissioners
approved plans in July to relocate the iconic Koenig Sphere to the recently opened
Liberty Park. The Sphere, named after its sculptor, German artist Fritz Koenig,
was originally commissioned by the agency to adorn the original Trade Center’s
Austin J. Tobin Plaza. Returning the Sphere to the World Trade Center campus
was heralded as a strong symbol of resilience on behalf of the region’s workers
and residents, as well as a hallowed memorial for the victim and heroes of 9/11.
Liberty Park features wood benches and a small amphitheater-like elevated space at the West Street end of the park.

26 THE PORT AUTHORITY OF NY & NJ
in 2016 the agency advanced many sustainability initiatives, including these seven:
working with its valued partners to create a landmark Clean air strategy for the port of new York and new Jersey that lays out practical, voluntary actions to reduce port-related diesel and ghg emissions. actions under the Clean air strategy for the port have resulted in an average 41.5 percent reduction in air pollutants and 37.3 percent reduction in all pollutants since 2006, while supporting a 13 percent increase in cargo volume. in addition, expressrail, the port’s on-dock rail service, set a new record in 2015 by handling 522,244 containers, which is the equivalent of nearly 800,000 reduced truck trips.
Creating sustainable design guidelines (established in 2006 and updated in 2017) for all structures built on port authority property. These guidelines align with the us green building Council’s leadership in energy and environmental design (leed) standards.
installing extensive solar photovoltaic installations on several buildings at newark liberty international airport to further reduce ghg emissions by 334 metric tons by generating 840 megawatts of clean energy in 2016 alone. in october 2016, a similar 82-kilowatt solar roof photovoltaic system came on line at stewart international airport and now produces up to 1.5 megawatt hours of clean, renewable power per week.
reducInG GreenHOuSe GaSeS
As reviewed in 2016, the results of the 2015 Port Authority Greenhouse Gas (GHG)
and Criteria Air Pollutant Inventory proved a verified, ongoing trend toward massive
reductions in regional air toxins thanks to the direct actions of the agency and its
sustainability experts.
The Port Authority established its current sustainability initiative in 2008 with the stated
goal of reducing GHG emissions resulting from the agency’s facilities and partners by 80
percent as compared to a 2006 baseline by the year 2050.
Meeting the annual budget of $1.3 million for the port of new York and new Jersey’s Clean vessel incentive program, which encourages operators of ocean going vessels to reduce their emissions.
pursuing energy efficiency, retrofitting, and renewable power generation projects aggressively throughout the agency. energy efficiency projects completed in 2016 included extensive lighting retrofits at JFK and avoided emissions of 3,200 metric tons of carbon dioxide.
Creating sustainable Management plans for three port authority airports between the years 2012 and 2016, with extensive external stakeholder input and involvement. reporting ghg gas emissions from its operations and some tenant operations to the Carbon disclosure project.
Creating sustainable infrastructure guidelines (established in 2011) to impose sustainability requirements on all port authority-initiated infrastructure projects.
27THE FOUNDATION FOR A NEW TOMORROW
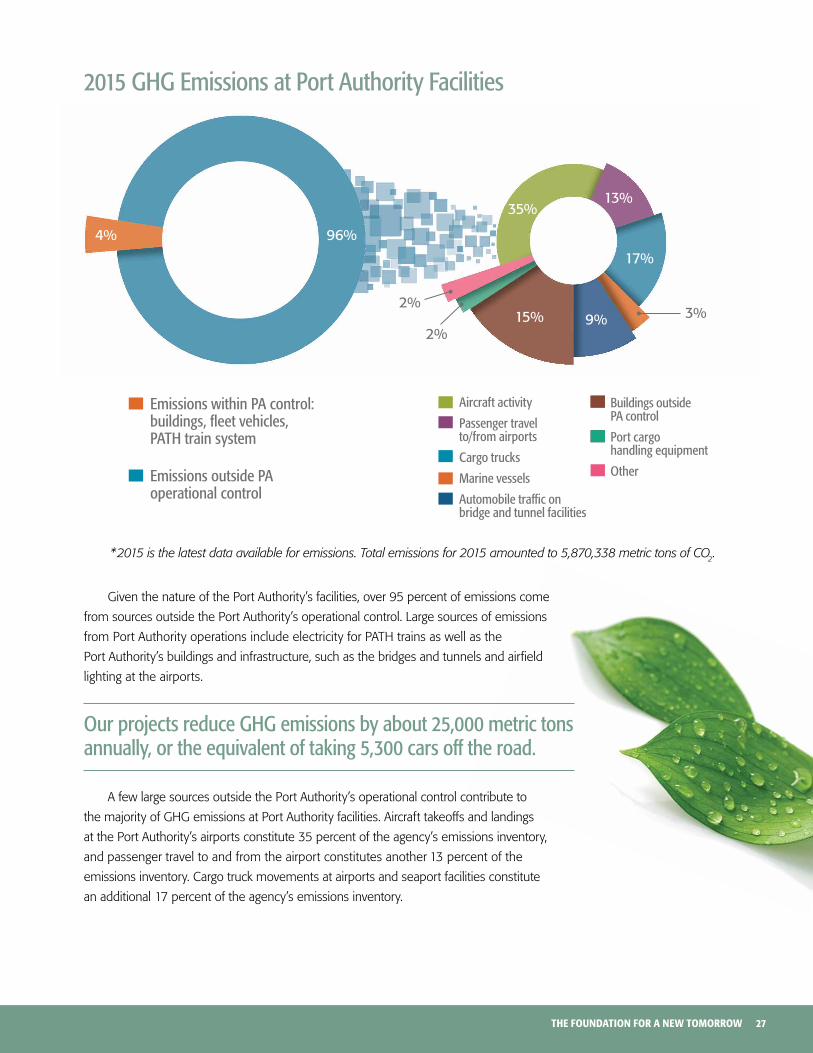
Given the nature of the Port Authority’s facilities, over 95 percent of emissions come
from sources outside the Port Authority’s operational control. Large sources of emissions
from Port Authority operations include electricity for PATH trains as well as the
Port Authority’s buildings and infrastructure, such as the bridges and tunnels and airfield
lighting at the airports.
A few large sources outside the Port Authority’s operational control contribute to
the majority of GHG emissions at Port Authority facilities. Aircraft takeoffs and landings
at the Port Authority’s airports constitute 35 percent of the agency’s emissions inventory,
and passenger travel to and from the airport constitutes another 13 percent of the
emissions inventory. Cargo truck movements at airports and seaport facilities constitute
an additional 17 percent of the agency’s emissions inventory.
15% 3%2%
2%
35%13%
17%
9%
2015 GhG Emissions at Port Authority facilities
4% 96%
Emissions within PA control: buildings, fleet vehicles, PATh train system
Emissions outside PA operational control
Aircraft activity
Passenger travel to/from airports
Cargo trucks
Marine vessels
Automobile traffic on bridge and tunnel facilities
Buildings outside PA control
Port cargo handling equipment
Other
* 2015 is the latest data available for emissions. Total emissions for 2015 amounted to 5,870,338 metric tons of CO2.
Our projects reduce GhG emissions by about 25,000 metric tons annually, or the equivalent of taking 5,300 cars off the road.

28 THE PORT AUTHORITY OF NY & NJ
Expand and ConnectThe Port Authority works constantly to expand its transportation network throughout the entire Port District while deepening the layers of connectivity that make this network invaluable to our regional economy. The programs listed below are timely in that they anticipate future needs and create the foundations for tomorrow today. The slate of work outlined below speaks highly of the agency’s efforts in 2016. But it also supplies an overall brighter vision for our region and its future.
Recognizing the vital importance for our region’s future, agency leadership is working closely with Port Authority
Bus Terminal stakeholders to solicit input throughout project phases.

29THE FOUNDATION FOR A NEW TOMORROW
The transformation and
redevelopment of the Port
Authority’s major airports extends
to John F. Kennedy International Airport
(JFK), the region’s largest airport and
the nation’s busiest in terms of
international passengers. In 2016,
the airport welcomed an estimated
450,000 flights and served a record
59 million passengers. Demand is
expected to continue increasing, with
current forecasts estimating 100
million annual passengers by 2050.
Throughout 2016, the agency
worked with New York Governor
Andrew Cuomo’s Airport Advisory
Panel, expert consultants, and other
local transportation agencies
to reimagine a new JFK to meet the
demands of the 21st century. These
efforts culminated in a vision plan,
which Governor Cuomo presented in
early 2017. The plan details a new
course that will transform JFK into a
unified, world-class airport capable of
accommodating passenger growth
while keeping the region’s economy
moving forward through an estimated
$7 billion in private investment.
It also includes plans for improved
road access and expanded mass
transit options to and from the airport.
The Port Authority is initiating
efforts to develop a master plan, along
with additional conceptual planning
work to address the challenges
highlighted in the vision plan. The
2017-2026 Capital Plan includes a
$1 billion Port Authority commitment,
which will support high-priority
projects aimed at providing airport-
wide infrastructure enhancements
and help catalyze private terminal
investment. Consistent with the
New York Governor’s nation-leading
goal of 30 percent participation of
minority and women-owned business
enterprises (MWBE), the agency
aspires to create significant MWBE
contract opportunities.
Under New York Governor Cuomo’s vision, the agency will transform JFK into a unified, world-class airport as depicted in this rendering.
redeVelOpInG JOHn F. Kennedy InternatIOnal aIrpOrt
Investments for John F. Kennedy International Airport, as depicted in this rendering, will help serve the region’s growing population.

30 THE PORT AUTHORITY OF NY & NJ
redeVelOpInG termInal a at neWarK lIBerty InternatIOnal aIrpOrt
in March 2016, the Board approved the expenditure of $2.3 billion for the
Terminal A Redevelopment Program at Newark Liberty, a program expected
to generate $3.3 billion in regional economic activity, create 9,000 job years,
and provide $600 million in wages. A multi-phased development initiative,
the Terminal A program addresses a new terminal building, a parking garage
complex, and landside components, including roadway and utility upgrades.
It also covers work on bridges and airside elements. Initial work authorized
includes an estimated $196.3 million for continued program management and
design of all program elements, as well as the construction of two bridges
and associated civil, electrical, and paving elements.
Newark Liberty’s Terminal A will be equipped to serve the forecasted
increase in passengers while providing an open, modern terminal that offers a
world-class customer experience. Importantly, the new terminal will, by design,
adapt to increasing demands, including evolving requirements for air travel.
The accompanying improved airfield layout will increase throughput of aircraft
while also accommodating larger planes via dual taxi-lanes serving all gates.
The design-build process will allow the Port Authority to combine design and
construction services into a single contract to expedite the Terminal A project.
The Terminal A redevelopment Program includes four key elements:• A new, 1-million-square-foot common-use terminal with 33 gates that can
accommodate 13.6 million annual passengers and future growth (the terminal
could be expandable to 45 gates).
• Airfield paving on 140 acres contiguous with the new terminal, plus demolition
of the existing Terminal A concourse.
• A new roadway network connecting the new terminal with the Central Terminal
Area, including eight new bridges and frontage roads.
• An “open,” naturally ventilated tiered garage and surface lot featuring
approximately 3,000 parking spaces.
The program is currently in the planning and design stage, with an estimated
partial opening of the new terminal in 2020 and full opening in 2022.
A rendering of the new Terminal A. The new facility will replace the existing Terminal Building at Newark Liberty International Airport that opened to the public in 1973.
The agency is planning opportunities for MWBEs to connect with the shortlisted design and construction firms for the new Terminal A at Newark Liberty International Airport. This image is a rendering.

31THE FOUNDATION FOR A NEW TOMORROW
Forging pivotal relationshipsWinnie chang is a Project Manager in the agency’s rail Transit Department. Apart from performing her job requirements, Winnie liaises routinely with experts outside the agency in fields as diverse as railroad operations, engineering, law, real estate, and urban planning. She says: “With so many colleagues in the transportation sector, the Port Authority serves our region best by building strong working relationships with a diverse group of stakeholders. i make it a habit to seek out the research and leverage the lessons learned by our potential partners.” Winnie is also active on the Transportation research Board (TrB), attending its annual conference and contributing regularly to the TrB’s publications.
The Port Authority’s Office of
Human Capital (HC) advanced
many initiatives in 2016, all
focused on supporting the agency’s
thousands of dedicated and
talented employees.
Topping the list were HC’s efforts
to foster a more diverse workforce
and inclusive workplace — critical to
employee engagement and innovation,
as well as business performance —
while expanding recruitment outreach
to promote career opportunities to
a wider array of job seekers.
Drawing from industry best
practices, HC established the Diversity
and Inclusion (D&I) Council—a
steering committee of executives and
members of Employee Resource
Groups (ERGs) that helps direct our
overarching D&I strategy. HC also
supported the development of a
performance metric that enhances
the Port Authority’s ability to measure
progress in advancing its equal
employment opportunity goals.
Additionally, the office was integral
in organizing the Port Authority’s
inaugural International Women’s Day
event, which celebrated women role
models in the agency with the newly
formed Port Authority Women’s
Council ERG.
With respect to recruitment
outreach, HC also launched the
Talent Ambassadors Program, through
which employees from across the
agency volunteer at job fairs to
provide job seekers with candid,
in-depth insight into a Port Authority
career. The program has enabled the
agency to increase its recruitment
outreach and more effectively
network with a variety of job seekers,
including students, tradespeople, and
military veterans.
FOSterInG a dIVerSe and IncluSIVe aGency
Women across various career levels, with different ethnic backgrounds and family situations, joined together to inspire colleagues for International Women’s Day.

32 THE PORT AUTHORITY OF NY & NJ
replacInG tHe pOrt autHOrIty BuS termInal
Throughout 2016, the Port
Authority followed through on
efforts to support planning for
the design and construction of a new
Bus Terminal. The new Bus Terminal
is a critical element of the trans-Hudson
transportation network’s ability to offer
reliability and capacity for the travel
demand of the future.
Following the Board’s
authorization, the Port Authority
initiated the Port Authority
International Design+Deliverability
Competition and the Trans-Hudson
Commuting Capacity Study. The
purpose of these efforts was to solicit
ideas for a replacement bus terminal
and to evaluate the prospects for
expanding multi-modal trans-Hudson
commuting options prior to initiating
the formal project planning and
environmental review process.
The Design+Deliverability
Competition was launched to
supplement the planning efforts
already undertaken by the Port
Authority in its Midtown Bus Master
Plan and other interstate bus
transportation planning. The
competition sought innovative
concepts and creative ideas as added
input to the transportation and urban
design considerations for a
replacement bus terminal in Midtown
Manhattan. The competition sought
multi-disciplinary teams with expertise
and accomplishment in the planning,
design, and delivery of large-scale,
intermodal transportation projects
within high-density urban
environments. The submissions in
the competition were evaluated by
an international panel of experts from
a broad array of disciplines, who
provided the Port Authority Board of
Commissioners with a comparative
analysis of the submissions from five
finalists. The competition results
represent an increased contribution to
the foundation of materials as the
Port Authority begins the formal
planning and public engagement on
options for the future of the Bus
Terminal and critical bus parking and
staging facilities.
The Trans-Hudson Commuting
Capacity Study evaluated a range of
strategies for meeting and managing
anticipated increases in trans-Hudson
commuter demand through 2040,
to inform deliberations on conceptual
planning for replacement of the Bus
Terminal and supporting facilities.
The study affirmed regional forecasts
that all see strong growth in overall
trans-Hudson commuting demand
across all modes, and identified
emerging constraints and potential
remedies in a fresh analysis of the
Interstate Bus Network—which relies
on efficient integration of the Route
495 Corridor, Lincoln Tunnel, PABT,
and bus parking and staging for
reliable service. As the Bus Terminal is
just one component of the trans-
Hudson commuting system, the study
provided key recommendations for
interim and long-range operational and
technological capacity improvements
for consideration to improve the bus
network and expand other trans-
Hudson commuting options.
Since the completion of the
Design+Deliverability Competition
and Trans-Hudson Commuting
Capacity Study, the Port Authority is
committed to a collaborative
approach with both New York and
New Jersey communities and
representatives. The agency aims to
foster bistate dialogue and
involvement in the planning, design,
and construction of a new Bus
Terminal as we evaluate a range of
alternatives. In addition, the agency’s
10-year Capital Plan has allocated
$3.5 billion to undertake the
applicable federal, state, and local
planning and environmental reviews,
public involvement and participation,
design and permitting, and initial
construction of a replacement
terminal and supporting facilities.
The PABT Interim Improvement Program aims to enhance the customer experience at the 64-year-old terminal.

33THE FOUNDATION FOR A NEW TOMORROW
GrOWInG tHe cruISe InduStry at cape lIBerty cruISe pOrt
in 2016, the Cape Liberty Cruise Port
(CLCP) in Bayonne, New Jersey,
handled an aggregate of 509,609
passengers. This marked the first year
that CLCP surpassed a half-million
passengers in its nine-year history, an
approximately 2.4 percent increase
over the same count in 2015, and a
healthy 59 percent increase in overall
activity from CLCP’s operational
commencement in 2008.
The latest projections show
continued growth for Cape Liberty,
largely due to the terminal’s addition of
two new vessels to its current itinerary.
Royal Caribbean Cruise Line (RCL)
and the German-based TUI Cruises
are adding two ships for the 2017 fall
season. TUI Cruises’ vessel will call
CLCP following its first transatlantic
sailing to North America, thereby
realizing the potential for Cape Liberty
to serve as a destination port with
accommodations for overnight stays.
cOnnectInG laGuardIa WItH aIrtraIn
At its February 2017 meeting, the agency’s Board of Commissioners
authorized the expenditure of $20 million to begin feasibility planning for
a new AirTrain system at LaGuardia. Currently, LaGuardia is the only major
airport in the New York City/Northern New Jersey region without direct rail
transit access. Providing train access to LaGuardia will reduce traffic congestion
and travel time delays while offering improved route predictability to the 34
million passengers forecast to use LaGuardia Airport annually by 2030.
lInKInG patH WItH neWarK lIBerty raIl lInK StatIOn
included in the 2017-2026 Capital Plan, which was approved by the agency’s
Board of Commissioners, is an extension of the PATH rail system from its
current terminus at Newark-Penn Station to the Northeast Corridor Rail Link
Station at Newark Liberty International Airport. Extending the PATH system would
improve transit access for airport customers and commuters coming from many
of the communities currently served by PATH, including Lower Manhattan and
Bergen, Hudson, and Essex counties in New Jersey, as well as providing new
access to transit for the Dayton Street neighborhood, within Newark’s South Ward.
This program, which may include the construction of a new PATH station at
the Newark Liberty Rail Link Station accessible to pedestrians and buses, will
undertake further planning, environmental review, design, and public outreach
and participation.
33RD STREET23RD STREET
14TH STREET9TH STREET
CHRISTOPHER STREET
HOBOKEN
NEWPORT
GROVESTREET
JOURNALSQUARE
HARRISONNEWARK
FUTUREPATH STATION
EXISTING STATIONEWR AIRTRAINNEC (NJT, AMTRAK)
DAYTON/WEEQUAHIC PARKNEIGHBORHOOD
NEWARKSOUTH WARD
EXCHANGE PLACE
WORLDTRADECENTER
Hud
son
Rive
r
Uppe
r Bay
New
ark
Bay
East
Riv
er
A rendering of the proposed LaGuardia AirTrain.
A map of the proposed extension of the PATH system to the Northeast Corridor Rail Link Station.
The 430-acre Cape Liberty Cruise Port site was created in Lower New York Harbor by private developers in the 1930s as a man-made peninsula off the eastern end of Bayonne, New Jersey.

34 THE PORT AUTHORITY OF NY & NJ
PartnerLarge, complex infrastructure projects require increasingly careful planning and vital collaboration with external partners. But the agency’s focus on partnerships also extends to working closely with agencies at both the state and federal levels and collaborating with regional stakeholders to create relationships that benefit all parties, and therefore the people who live and work in our region.
To prepare for the unprecedented capital work taking place at Port Authority facilities, agency
leadership is working to increase its pool of certified minority- and women-owned businesses.

35THE FOUNDATION FOR A NEW TOMORROW
495
3
9A
95
1
New Jersey
New YorkUnion City
Frank R. Lautenberg Station (Secaucus)
Tonn
elle
Ave
Secaucus Rd
Penn Station New York
Hoboken
Weehawken
Jersey City
Secaucus
County Rd
11th
Ave
10th
Ave
34th St
9th
Ave
Hu
ds o
n R
i ve
r
New Jersey
New YorkUnion City
Frank R. Lautenberg Station (Secaucus)
Tonn
elle
Ave
Secaucus Rd
Penn Station New York
Hoboken
Weehawken
Jersey City
Secaucus
County Rd
11th
Ave
10th
Ave
34th St
9th
Ave
Project Study Area Existing North River Tunnel Existing Northeast Corridor
0 5,000 FEET
Phase 1 of the Gateway Program includes the Portal North Bridge Replacement Project, construction of two new rail tubes under the Hudson River, and the rehabilitation of the existing, damaged tunnel.
The Gateway Program is a
comprehensive rail investment
program that works to benefit
the Northeast Corridor (NEC)—the
most heavily used passenger rail line
in the nation, in terms of both
ridership and service frequencies.
The Program focuses on improvements
to the NEC between Newark, NJ and
Pennsylvania Station in New York City,
which carries over 200,000
NJ TRANSIT and Amtrak passengers a
day. It relies on 107-year-old tunnels
under the Hudson River, which
sustained damage in Superstorm
Sandy in 2012.
In 2016, the Port Authority
continued to work with federal and
local partners — including the United
States Department of Transportation
(USDOT), Amtrak, and NJ TRANSIT —
to advance Phase 1 of this series of
critical projects, in accordance with
the framework announced in
November 2015 by the Governors
and U.S. Senators of New York and
New Jersey. The Program’s Phase 1
includes the Hudson Tunnel Project
and the replacement of the existing
Portal Bridge.
In its 2017-2026 Capital Plan, the
Port Authority has included support for
debt service on $2.7 billion in low-
interest borrowing to be obtained by
the Gateway Program Development
Corporation (GPDC), a non-profit
established in 2016 to advance the
Gateway Program. GPDC is not a
subsidiary or component unit of the
Port Authority.
This is the largest commitment
made by any project partner to date
and will ensure that the region
effectively meets future trans-Hudson
travel needs. Included in this
commitment is the Port Authority’s
debt service support on an anticipated
$284 million federal loan to GPDC,
plus up to $18 million in issuance
costs, for the Portal North Bridge that
was approved by the Board of
Commissioners at the October 2016
meeting. On all Port Authority
commitments to support the GPDC’s
low-interest federal loans, the Port
Authority’s commitment is capped
at the agreed principal amount and it
will not be the primary obligor, nor will
it be liable for any construction
completion, cost overrun, or project
funding risk.
SuppOrtInG tHe GateWay prOGram

36 THE PORT AUTHORITY OF NY & NJ
leading the maritime IndustryBethann rooney is the Assistant Director for Strategy and innovation in the agency’s Port Department. She serves on the industry Advisory Board for SUNY Maritime College, the international Association of Maritime and Port Executives, the Science and Education Advisory Board for the U.S. Department of homeland Security’s Center of Excellence on Maritime Security, and the Advisory Board of the United States Maritime resource Center, all of which, she says, informs her work as one of the Port Authority’s foremost maritime experts. She also finds time to teach classes on port terminal management at both SUNY Maritime College and the U.S. Merchant Marine Academy. Beth brought her many talents to bear in developing the concept for the Council on Port Performance, which brings terminal operators, shippers, trucking firms, and warehousemen together to discuss important logistics issues. This routine and open dialogue has created port efficiencies that expedite cargo movement.
preSerVInG and redeVelOpInG tHe tWa FlIGHt center
The Port Authority entered into a lease to launch one of the most anticipated
adaptive reuse projects in New York City—celebrating and preserving Eero
Saarinen’s iconic TWA Flight Center at JFK Airport, and transforming it into
the new TWA Hotel. Groundbreaking on this project took place in December
2016, and construction is well underway, with an expected opening in 2019.
MCR Development will restore the landmarked facility, and transform the
terminal into the centerpiece of a larger hotel, building two new wings with 505
rooms, a new meeting and event space, and an observation deck. MCR will also
install a rebuilt historic Constellation aircraft adjacent to the hotel. The $265
million construction project is completely funded by the private sector, although
the Port Authority has previously invested nearly $20 million to restore historic
elements and stabilize the building, in order to prepare it for this type of
investment and development.
enGaGInG tHe puBlIc On enVIrOnmental StrateGy
in December 2016, the Port Authority
partnered with the U.S. EPA to host a
listening session at which the public,
port industry, environmental, and other
stakeholders could provide comments
and suggestions on ways to further
reduce port-related air emissions and
improve air quality at or around the
Port of New York and New Jersey.
Input gathered during the session
helped to frame a collaborative plan
for dealing with future environmental
issues in our region.
The new TWA Hotel will have an observation deck, bars and restaurants, and a museum that showcases the story of TWA and the history of Queens, where the Jet Age was born.
Between 2006 and October 2015, the Port of New York
and New Jersey achieved a 33 percent reduction in port pollutants.

37THE FOUNDATION FOR A NEW TOMORROW
Opportunities for minority,
women-owned, small, and
disadvantaged business
enterprises (MWSDBEs) to partner
with the Port Authority or build
collaborative relationships with its
prime contractors and developers
continued in 2016. The agency,
including the tenants at its airports
and the WTC construction projects,
accounted for approximately $300
million in contracts and sub-contracts
with MWSDBEs.
The contracts with MWSDBEs
were augmented by another $200
million from activities related to the
LaGuardia Terminal B Redevelopment
Program. LaGuardia Gateway Partners
(LGP) and its contractor, Skanska
Walsh Joint Venture, working with the
Port Authority and New York State,
have been aggressively promoting the
project and pursuing contracts with
MWBEs, in support of Governor
Andrew Cuomo’s goal of 30 percent
MWBE participation — the highest
such pledge in the nation.
The agency’s Office of Business
Diversity and Civil Rights also
sponsored or participated in more
than 50 outreach and networking
events in New York and New Jersey
to promote the agency’s robust
capital program. Among the
highlights, in September 2016, the
Port Authority collaborated with
Engineering News-Record to present
its third annual MWSDBE-focused
industry conference, “Building
Relationships to Drive Success,”
which attracted over 500 attendees.
Port Authority employees and project
partners showcased the agency’s
major capital projects and the diversity
and breadth of opportunities. The
event consisted of panel discussions,
presentations, and networking
sessions facilitated by the Port
Authority, LGP, and other partner
organizations. The half-day event had
record-breaking attendance for the
third year in a row.
As a reflection of the strong
interest in our programs, as well as
Port Authority and partner
opportunities, over 1,000 MWSDBE
certification requests were received
in 2016.
Through networking events and outreach, the agency is striving to meet the Governor of New York’s 30 percent MWBE goal, the highest such goal in the nation.
cOllaBOratInG WItH reGIOnal mWSdBes

38 THE PORT AUTHORITY OF NY & NJ
concretizing expertise in materials engineeringcasimir Bognacki is the agency’s Chief of Materials Engineering. he manages and trains Port Authority employees who test and inspect construction materials used at all agency facilities. To deepen his technical knowledge, Casimir joined (and served as President of) both the New York City and New Jersey chapters of the American Concrete institute. he serves as a voting member on several technical committees of the American Concrete institute, while also serving on the research advisory committee for the rE-CAST University Transportation Center. in 2013, Casimir served as chairman of a technical committee of engineers tasked with updating the concrete section of the New York City Department of Buildings Code. The changes Casimir helped to invoke reduced the cost of concrete and made it possible to produce “greener,” high-strength concrete in New York City.
Superstorm Sandy caused billions of dollars in damages to Port Authority
facilities. Agency staff at airports, marine terminals, tunnels, and the PATH
rail system continue to recover, protect, rebuild, and add resiliency against
future extreme weather events.
The scope and importance of such an undertaking have necessitated
collaboration with the Federal Transit Administration (FTA) and the Federal
Emergency Management Agency (FEMA). Through federal disaster recovery
and resilience grants, these partners act as the primary sources of funding for
the approximately $2 billion Superstorm Sandy Capital Program. In all, the
program encompasses numerous separate projects geared at recovery and
bolstering resilience against future extreme weather events and other
natural disasters.
The Port Authority’s Storm Mitigation and Resilience Office has led this
program since 2013. Current estimates show that nearly 70 percent of the
program’s projects will be completed by 2021.
Restoration and replacement work affects approximately two miles of direct fixation track, and nearly three miles of ballasted track in tunnels and open areas.
recOVery FrOm SuperStOrm Sandy

39THE FOUNDATION FOR A NEW TOMORROW

40 THE PORT AUTHORITY OF NY & NJ
DeliverOne of the agency’s primary goals is to deliver on projects where work has already begun.
The initiatives outlined below represent the more prominent projects the agency shepherded
toward completion, if not completion itself. The agency deems it pivotal to advance all projects
and initiatives necessary to ensure the safe and efficient operation of Port Authority facilities,
and to deliver these projects in a timely fashion.
The George Washington Bridge Bus Station will feature an array of first-class national and local retailers, new
bus loading/unloading areas, passenger amenities, and new ADA-compliant escalators and elevators from the
subway and street to the bus station level.

41THE FOUNDATION FOR A NEW TOMORROW
The iconic Bayonne Bridge spans
the Kill Van Kull, a shipping lane
that runs between Bayonne,
New Jersey, and Staten Island,
New York, and acts as a vital channel
to access the Port of New York and
New Jersey.
Next-generation cargo ships are
so large that they cannot fit under the
Bayonne Bridge’s original roadbed,
which traverses the Kill Van Kull 151
feet above the waterline. After
carefully considering all options, the
Port Authority commissioned a major
project to “Raise the Roadway” of the
Bayonne Bridge by 64 feet (achieving
clearance at 215 feet above the
waterline). Doing so will allow larger,
modern container ships to pass
under the bridge on their way to
regional berths.
The full project entails preserving
the bridge’s existing arch to build a
new main span, as well as approach
structures and access ramps from both
the New York and New Jersey sides.
The new span will conform to current
design standards by providing wider
12-foot lanes, a median safety barrier,
and shoulders. It will also include
amenities such as a bikeway and a
walkway that extend the entire length
of the bridge and allow for a future
transit corridor. Higher navigational
clearance will be available in late 2017,
and the entire project is anticipated to
be complete by mid-2019.
On February 20, 2017, the
Bayonne Bridge’s new upper roadway
opened for automobile traffic, and
launched a new system of cashless
tolling. Demolition of the old, lower
roadway began soon afterward.
Once the newly elevated Bayonne Bridge opened to drivers, the project’s work shifted to removing the old roadbed, thereby offering the proper clearance for larger neo-Panamax vessels.
raISInG tHe rOadWay OF tHe BayOnne BrIdGe
The new roadbed for the Bayonne Bridge features a cashless tolling system that bills drivers heading into New York. Northbound to New Jersey is always free. Some restrictions apply.

42 THE PORT AUTHORITY OF NY & NJ
Located in Jersey City, New
Jersey, the Greenville Yard-Port
Authority Marine Terminal
connects Brooklyn, Queens, and
Long Island to the national rail
network via cross-harbor freight rail
barge service. Traditionally, the facility
has been used in part by the Port
Authority’s New York New Jersey Rail,
LLC (NYNJR).
A redeveloped Greenville Yard will
advance Port Authority objectives to
increase both modal diversity and rail
service capacity within the Port of
New York and New Jersey. The new
Greenville Yard will bolster the port’s
competitiveness by accommodating
both NYNJR’s cross-harbor traffic and
international shipping containers
loaded onto rail at the planned
ExpressRail Port Jersey facility,
otherwise known as Global Container
Terminal (GCT) Bayonne Intermodal
Container Transfer Facility (ICTF).
Overall, the new Greenville Yard
will move goods through our region
with greater efficiency while providing
significant environmental benefits by
reducing vehicular travel times, fuel
consumption, and emissions.
The overall project is slated to
cost $356 million, with costs split
between the Port Authority, Conrail,
and GCT Bayonne. The Port
Authority’s share is limited to $320
million, with Global Marine Terminals
and Conrail contributing an additional
combined $36 million. The overall
scope of the program includes final
design and construction of the
upgraded cross-harbor barge service
infrastructure; the purchase of new,
ultra-low emissions locomotives
(already in service); installation of
support tracks; construction of two
new higher-capacity rail car float
barges; and reconstruction of Transfer
Bridge #10.
Work is scheduled to begin in
2017 and is slated to follow two
phases. In general, Phase 1 covers
completion of all Cross-Harbor and
ICTF support and working tracks while
Phase 2 will cover the acquisition of
key properties, as well as completion
of design and construction access
roads between GCT Bayonne’s ICTF
and the lead tracks to the west.
The redevelopment of Greenville Yard is expected to produce 2,040 job years, $145 million in wages, and $482 million in economic activity.
redeVelOpInG GreenVIlle yard at tHe pOrt OF neW yOrK and neW JerSey
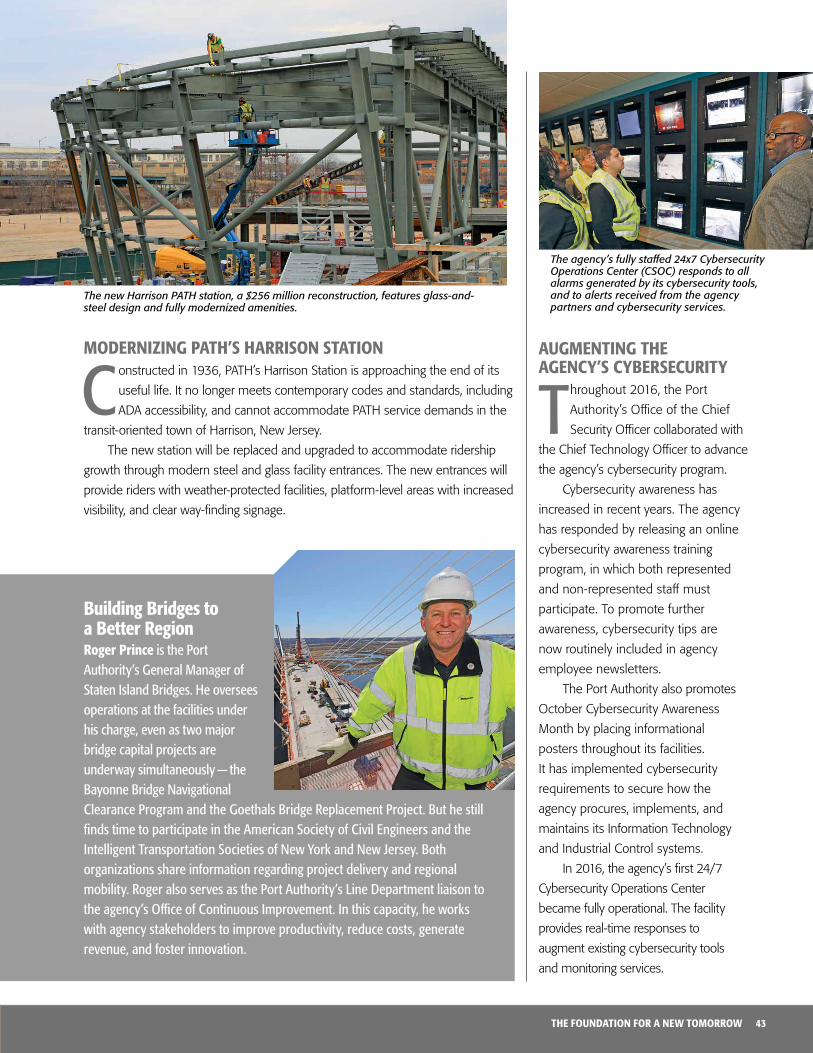
43THE FOUNDATION FOR A NEW TOMORROW
Building Bridges to a Better regionroger prince is the Port Authority’s General Manager of Staten island Bridges. he oversees operations at the facilities under his charge, even as two major bridge capital projects are underway simultaneously — the Bayonne Bridge Navigational Clearance Program and the Goethals Bridge replacement Project. But he still finds time to participate in the American Society of Civil Engineers and the intelligent Transportation Societies of New York and New Jersey. Both organizations share information regarding project delivery and regional mobility. roger also serves as the Port Authority’s Line Department liaison to the agency’s Office of Continuous improvement. in this capacity, he works with agency stakeholders to improve productivity, reduce costs, generate revenue, and foster innovation.
mOdernIzInG patH’S HarrISOn StatIOn
Constructed in 1936, PATH’s Harrison Station is approaching the end of its
useful life. It no longer meets contemporary codes and standards, including
ADA accessibility, and cannot accommodate PATH service demands in the
transit-oriented town of Harrison, New Jersey.
The new station will be replaced and upgraded to accommodate ridership
growth through modern steel and glass facility entrances. The new entrances will
provide riders with weather-protected facilities, platform-level areas with increased
visibility, and clear way-finding signage.
auGmentInG tHe aGency’S cyBerSecurIty
Throughout 2016, the Port
Authority’s Office of the Chief
Security Officer collaborated with
the Chief Technology Officer to advance
the agency’s cybersecurity program.
Cybersecurity awareness has
increased in recent years. The agency
has responded by releasing an online
cybersecurity awareness training
program, in which both represented
and non-represented staff must
participate. To promote further
awareness, cybersecurity tips are
now routinely included in agency
employee newsletters.
The Port Authority also promotes
October Cybersecurity Awareness
Month by placing informational
posters throughout its facilities.
It has implemented cybersecurity
requirements to secure how the
agency procures, implements, and
maintains its Information Technology
and Industrial Control systems.
In 2016, the agency’s first 24/7
Cybersecurity Operations Center
became fully operational. The facility
provides real-time responses to
augment existing cybersecurity tools
and monitoring services.
The agency’s fully staffed 24x7 Cybersecurity Operations Center (CSOC) responds to all alarms generated by its cybersecurity tools, and to alerts received from the agency partners and cybersecurity services.
The new Harrison PATH station, a $256 million reconstruction, features glass-and-steel design and fully modernized amenities.

44 THE PORT AUTHORITY OF NY & NJ
ImplementInG a trucK manaGement SyStem at tHe pOrt OF neW yOrK and neW JerSey
Throughout 2016, the Port Authority worked in conjunction with Sustainable
Terminal Services, a consortium of the port’s six marine terminal
operators, to develop, test, and roll out a Truck Management System
(TMS) at Global Container Terminals (GCT) Bayonne.
The TMS is essentially a reservation system that aims to meter truck arrival
rates while keeping resources for all stakeholders operating at maximum levels,
thereby decreasing truck turn times and adding a level of consistency for each
trip. The system should also improve productivity and terminal capacity, reduce
the number of trouble tickets/transactions, mitigate traffic impacts on
surrounding roads, and decrease emissions. Implementation of the TMS fulfills
a pivotal Tier One Recommendation of the Port of New York and New Jersey’s
Port Performance Task Force.
GCT rolled out the appointment system on a limited basis beginning Sunday,
January 15, 2017. GCT Bayonne is the first of the Port of New York and New
Jersey’s six constituent marine terminals to implement the TMS. Other container
terminals are expected to bring the TMS online in the future.
Reports from the TMS’s pilot program in early 2017 showed promising
results. GCT Bayonne reported the system reduced congestion and improved
efficiency by cutting turn times.
The new Truck Management System is just one measure to improve the flow of trucks and containers through the port. Other measures include extended terminal gate hours and a chassis pool.
The Council on Port Performance publishes free
copies of the Truckers Resource Guide in Spanish, Chinese, and Polish.

45THE FOUNDATION FOR A NEW TOMORROW
Located at the intersection of
Grove Street, Marin Boulevard,
and Christopher Columbus Drive
in Jersey City, New Jersey, the PATH
Grove Street Station was first opened
in 1910 and last modified with the
opening of the northeast entrance in
2005. The facility serves two busy
commuter PATH services, the Newark
to World Trade Center Line and the
Journal Square to 33rd Street Line.
To make the station accessible
under guidelines set forth by the
Americans with Disabilities Act (ADA),
the Port Authority embarked on a
project to construct a new ADA-
compliant elevator at the Grove Street
Station’s southwest entrance. This
work is on schedule for completion
in 2017.
Highlights of the work performed
in 2016 included the construction of
a street-to-mezzanine elevator and a
mezzanine-to-platform elevator. The
work completed included expanding,
reinforcing, and waterproofing the
elevator system, shaft, corresponding
beams, and mechanical room.
Electrical panels were also
installed. Simultaneously, the elevator
access was advanced by opening
the station’s floors and installing steel
framework and other essential forms
on the station’s platform and
mezzanine levels. Electrical and
plumbing work continued apace
concurrently, and featured the
installation of sprinkler systems and
sump pumps.
By the end of 2016, construction
for the Grove Street Station elevator
was more than 80 percent complete.
Informing the public through Social media russell Jordan is the agency’s first Social Media and Website Specialist. he pioneered the Port Authority’s various presences on facebook, Twitter, and instagram, and helps departments across the agency leverage social media to meet their business goals. Throughout 2016, he worked with agency partners to lay the foundation for the agency’s “Crisis Communications Workbook,” a set of policies and protocols that structure the Port Authority’s social media response during emergencies. Beyond his normal job responsibilities, russell contributes regularly to the weekly Tweetchat sessions (#gsmchat) sponsored by the Government Social Media Organization. As a working professional actor, he also teaches the effective use of social media to actors.
GraduatInG tHe 114th claSS OF tHe pOrt autHOrIty pOlIce department
On December 9, 2016, 80 cadets graduated from the Police Academy as
part of the Port Authority Police Department’s (PAPD) 114th class. As the
most recent group to pass this pivotal test, the cadets received the most
up-to-date, comprehensive, and specialized training in modern policing.
This graduating class is among the PAPD’s most diverse. Thirty percent of
the class was composed of officers who are African American, Hispanic, or of
Asian descent. Nine graduates are military veterans. These men and women now
join the front lines in carrying out the PAPD’s mission to protect Port Authority
customers and safeguard our critical transportation facilities.
The PAPD provides a mission-oriented sense of purpose through its fundamental dedication to public service.
upGradInG patH’S GrOVe Street StatIOn

46 THE PORT AUTHORITY OF NY & NJ
Long in the making, and
considered by many a vital sign
of the region’s economic and
spiritual resurgence in the wake of
September 11, 2001, the World Trade
Center received some final touches in
2016. Many of these accomplishments
involved the World Trade Center
Transportation Hub (the Hub), which
includes the well-known Oculus, and
officially opened in March.
In May, the Port Authority
celebrated opening Platform B in
the Hub’s eastern portion. Doing so
provided more than 100,000 PATH
riders with immediate direct
connections via a below-ground,
climate-controlled passage to the
MTA’s Fulton Transit Center and its nine
New York City subway routes. Access
to the MTA’s E subway line followed
later in the year, and was noteworthy
because the agency restored this
entrance to its original pre-9/11 state.
PATH riders who had previously used
Platform C service to access
Newark and Journal Square Stations
were pleased by the convenient option
Platform B offered their traditional
commute, as well as the facility’s
state-of-the-art lighting, speakers,
illuminated signs, and elevators.
The opening of Platform B
dovetailed with the agency’s opening
of a new, ADA-accessible entrance
linking the World Trade Center
Transportation Hub to PATH service
at the corner of Vesey and Church
streets in Lower Manhattan one
month later. Direct access from the
Transportation Hub to the West
Concourse that connects to
Brookfield Place, Battery Park City,
and ferries to New Jersey also
opened in June. By August, the
agency had opened entrances via
Greenwich and Church streets, which
were followed a month later by
the final two platforms on the Hub’s
mezzanine level, which improved
overall circulation for all regional
transit customers.
Also in August, the Port Authority
coordinated with Westfield Corporation
to open various retail spaces in the
Hub, solidifying this facility as a top
shopping destination for travelers
from around the world, and Lower
Manhattan in general as a business
district of enduring remembrance
and cultural vitality.
eXpandInG tHe neW WOrld trade center campuS
The state-of-the-art World Trade Center Transportation Hub, completed in 2016, serves 250,000 PATH daily commuters and millions of annual visitors from around the world.

47THE FOUNDATION FOR A NEW TOMORROW
The ‘Oculus’ (seen here from outside) serves as the centerpiece of the
World Trade Center Transportation Hub, incorporating 78,000 square feet of
multi-level, state-of-the-art retail and dining.

48 THE PORT AUTHORITY OF NY & NJ
The Consolidated Financial Statements (the “Financial Statements”) of The Port Authority of New York and New Jersey (including its component units, collectively referred to herein as the “Port Authority”) as of and for the years ended December 31, 2016 and December 31, 2015, are enclosed. Responsibility for both the accuracy of the data and the completeness and fairness of the presentation in the Financial Statements rests with management of the Port Authority. The Management’s Discussion and Analysis (“MD&A”) and Required Supplementary Information sections of the Financial Statements provide a narrative introduction, overview, and analysis of the Port Authority’s financial performance and are required by the Governmental Accounting Standards Board. Schedules A, B, and C have been prepared in accordance with Port Authority bond resolutions and are not intended to be a presentation in conformity with accounting principles generally accepted in the United States of America (“GAAP”). Schedules D, E, F, and G include other statistical information presented for purposes of additional analysis and are not a required part of the Financial Statements.
Port Authority management is also responsible for establishing and maintaining adequate internal controls over financial reporting for the Port Authority. Internal control over financial reporting is a process designed to provide reasonable assurance regarding the reliability of financial reporting and the preparation of financial statements in accordance with GAAP. The Port Authority has established a comprehensive framework of internal controls that includes maintaining records that accurately and fairly reflect the transactions of the Port Authority; provide reasonable assurance that transactions are recorded as necessary for financial statement preparation; and provide reasonable assurance that unauthorized use, acquisition or disposition of company assets that could have a material impact on the Port Authority’s financial condition would be prevented or detected on a timely basis. Because of its inherent limitations, internal control over financial reporting is not intended to provide absolute assurance that a misstatement of the financial statements would be prevented or detected.
Pursuant to Port Authority by-laws, the Port Authority’s Executive Director, Comptroller and I certified the Financial Statements on March 1, 2017. The Financial Statements certificate is presented herein.
A firm of independent auditors is retained annually by the Port Authority Board of Commissioners’ (“Board of Commissioners”) Audit Committee to conduct an audit of the Financial Statements in accordance with auditing standards generally accepted in the United States of America. The goal of the independent audit is to provide reasonable assurance that these Financial Statements are free of material misstatement. The audit includes an examination, on a test basis, of the evidence supporting the amounts and disclosures in the Financial Statements, an assessment of the accounting principles used and significant estimates made by management, as well as the overall presentation of the Financial Statements. In planning and performing their audit, the independent auditors considered the Port Authority’s comprehensive framework of internal controls in order to determine auditing procedures for purposes of expressing an opinion on the Financial Statements. The independent auditors’ report is presented herein.
This letter of transmittal is designed to complement the MD&A and should be read in conjunction with the independent auditors’ report and the audited Financial Statements.
To The Board of Commissioners of The PorT AuThoriTy of New york ANd New Jersey

49THE FOUNDATION FOR A NEW TOMORROW
Profile of The PorT AuThoriTyThe Port Authority is a municipal corporate instrumentality and political
subdivision of the states of New York and New Jersey, established in 1921 to provide transportation, terminal, and other facilities of commerce within the Port District, an area of about 1,500 square miles in both states centered on New York Harbor. The Port Authority raises the funds necessary for the improvement, construction, or acquisition of its facilities primarily upon the basis of its own credit. The Port Authority has no power to pledge the credit of either state or any municipality, or to levy taxes or assessments.
The financial planning process integrates an annual budget process with multiyear projections. Through the capital plan and budget process, staff identifies strategic, financial, and operational risks that affect resource allocations; and sets forth an expenditure plan for the year that balances priorities across all agency lines of operation. Each new budget is separately considered and approved by the Board of Commissioners, although such approval does not in itself authorize specific expenditures, which are authorized from time to time by, or as contemplated by, other specific actions of the Board of Commissioners.
The approved budget becomes a mechanism that facilitates the systematic review of program expenditures to ensure that they are made consistent with statutory, contractual, and other commitments of the agency, the policies and financial decisions of the Board of Commissioners, and the requirements of the by-laws of the Port Authority. Forecasting models are used to assess the agency’s projected long-range financial condition; determine the financial feasibility of future capital investment; and perform financial tests to measure fiscal risk. This comprehensive approach to planning, budgeting, and forecasting enables the agency to identify, track, and take corrective action with respect to the funding requirements needed to deliver the projects and services that the Port Authority provides.
regioNAl ecoNomic coNdiTioN ANd ouTlook Regional economic conditions in the seventeen counties comprising the Port
District are slightly ahead of the national economy in terms of gains in output and employment. Gains in regional employment are primarily the result of gains in New York City employment sectors, including professional business services, leisure and hospitality, tourism, education and healthcare.
Activity levels at the region’s three major airports saw passenger levels increase 5.1 percent in 2016 to an all-time high of 129 million passengers. Increases in domestic and international aviation passengers were primarily due to increased seating capacity and an overall decline in ticket prices. PATH passenger volumes increased 2.6 percent in 2016 to 78.6 million passengers. This increase in PATH ridership was primarily due to continued employment growth in Manhattan and Hudson County New Jersey. Containerized cargo levels at Port Department facilities decreased 1.7 percent to 3.6 million containers in 2016, primarily due to the normalization of cargo distribution previously diverted from West Coast ports. Vehicular activity levels at the Port Authority’s six (6) vehicular crossings totaled 118.8 million vehicles in 2016, an increase of 2.4 percent when compared to 2015. This rise in vehicular traffic continues the recent growth trends and the interrelated economics, such as improved recreational spending and a continuation of lower fuel prices throughout the region.
The Port Authority continually monitors the economic environment in which it operates in order to develop budgets that are fiscally sustainable and responsive to the transportation and economic needs of the region.

50 THE PORT AUTHORITY OF NY & NJ
Certificate of
Presented to
The Port Authority of New York
For its Comprehensive Annual
December 31, 2015
Executive Director/CEO
Financial Reportfor the Fiscal Year Ended
Reportingin Financial
for ExcellenceAchievement
Text38: and New Jersey
Government Finance Officers Association
CERTIFICATE OF ACHIEVEMENTThe Government Finance Officers Association of the United States and Canada
(“GFOA”) awarded a Certificate of Achievement for Excellence in Financial Reporting to the Port Authority for its Comprehensive Annual Financial Report for the fiscal year ended December 31, 2015. The Port Authority has received this award since 1984, making this the 32nd consecutive year that the Port Authority financial statements have achieved this prestigious award. In order to be awarded a Certificate of Achievement, a government must publish an easily readable and efficiently organized comprehensive annual financial report. This report must satisfy both GAAP and applicable legal requirements.
A Certificate of Achievement is valid for a period of one year. We believe the 2016 Comprehensive Annual Financial Report continues to meet the Certificate of Achievement Program’s requirements, and we are submitting it to the GFOA to determine its eligibility for certificate.
Elizabeth M. McCarthyChief Financial Officer
March 1, 2017
51THE FOUNDATION FOR A NEW TOMORROW
I. 2016 financial statements certification (pursuant to Port Authority by-laws) 53
II. independent Auditors’ report 55
III. management’s discussion And Analysis (Unaudited) 61
IV. financial statements of The Port Authority of New york And New Jersey (in accordance with accounting principles generally accepted in the united states of America (gAAP))
Consolidated Statements of Net Position 76
Consolidated Statements of Revenues, Expenses and Changes in Net Position 77
Consolidated Statements of Cash Flows 78
Notes To The Consolidated Financial Statements 80
V. required supplementary information (Unaudited) 121
VI. financial schedules (pursuant to Port Authority bond resolutions)
Schedule A – Revenues and Reserves 124
Schedule B – Assets and Liabilities 125
Schedule C – Analysis of Reserve Funds 126
VII. statistical And other supplemental information
Narrative 127
Schedule D-1 – Selected Statistical Financial Trends Data (pursuant to GAAP) 128
Schedule D-2 – Selected Statistical Debt Capacity Data (pursuant to Port Authority bond resolutions) 130
Schedule D-3 – Selected Statistical Financial Data by Business Segment (pursuant to GAAP) 132
Schedule E – Information on Port Authority Operations 134
Schedule F – Information on Capital Investment in Port Authority Facilities 135
Schedule G – Port Authority Facility Traffic (Unaudited) 136
iNdex To fiNANciAl secTioN
The Port Authority of New York & New Jersey Financial Statements and Appended Notes for the Year Ended December 31, 2016
Prepared by the Comptroller’s department of the Port Authority of New York and New Jersey. www.panynj.com

52 THE PORT AUTHORITY OF NY & NJ

53THE FOUNDATION FOR A NEW TOMORROW
cerTificATe wiTh resPecT To 2016 coNsolidATed fiNANciAl sTATemeNTs
We, the undersigned officers of The Port Authority of New York and New Jersey, hereby certify, in connection with the release of the consolidated financial statements of The Port Authority of New York and New Jersey (the “Authority”) and its component units for the years ended December 31, 2016 and December 31, 2015 (the “Financial Statements”) that: (a) to the best of our knowledge and belief, the financial and other information, including the summary of significant accounting policies described in the Financial Statements, are accurate in all material respects, and reported in a manner designed to present fairly the Authority’s net position, changes in net position, and cash flows, in conformity with accounting principles generally accepted in the United States of America; and (b) on the basis that the cost of internal controls should not outweigh their benefits, the Authority has established a comprehensive framework of internal controls to protect its assets from loss, theft, or misuse, and to provide reasonable (rather than absolute) assurance regarding the reliability of financial reporting and the preparation of the Financial Statements in conformity with accounting principles generally accepted in the United States of America.
New York, New York
March 1, 2017
Patrick J. Foye
Executive Director
Elizabeth M. McCarthy
Chief Financial Officer
Daniel G. McCarron
Comptroller

54 THE PORT AUTHORITY OF NY & NJ

55THE FOUNDATION FOR A NEW TOMORROW
Independent Auditors’ Report
Board of Commissioners The Port Authority of New York and New Jersey:
Report on the Consolidated Financial Statements We have audited the accompanying consolidated financial statements of The Port Authority of New York and New Jersey (the Port Authority), which comprise the consolidated statements of net position as of December 31, 2016 and 2015, and the related consolidated statements of revenues, expenses, and changes in net position, and cash flows for the years then ended, and the related notes to the consolidated financial statements.
Management’s Responsibility for the Consolidated Financial Statements
Management is responsible for the preparation and fair presentation of these consolidated financial statements in accordance with U.S. generally accepted accounting principles; this includes the design, implementation, and maintenance of internal control relevant to the preparation and fair presentation of consolidated financial statements that are free from material misstatement, whether due to fraud or error.
Auditors’ Responsibility
Our responsibility is to express an opinion on these consolidated financial statements based on our audits. We conducted our audits in accordance with auditing standards generally accepted in the United States of America. Those standards require that we plan and perform the audit to obtain reasonable assurance about whether the consolidated financial statements are free of material misstatement.
An audit involves performing procedures to obtain audit evidence about the amounts and disclosures in the consolidated financial statements. The procedures selected depend on the auditors’ judgment, including the assessment of the risks of material misstatement of the consolidated financial statements, whether due to fraud or error. In making those risk assessments, the auditor considers internal control relevant to the entity’s preparation and fair presentation of the consolidated financial statements in order to design audit procedures that are appropriate in the circumstances, but not for the purpose of expressing an opinion on the effectiveness of the entity’s internal control. Accordingly, we express no such opinion. An audit also includes evaluating the appropriateness of accounting policies used and the reasonableness of significant accounting estimates made by management, as well as evaluating the overall presentation of the consolidated financial statements.
We believe that the audit evidence we have obtained is sufficient and appropriate to provide a basis for our audit opinion.
Opinion
In our opinion, the consolidated financial statements referred to above present fairly, in all material respects, the net position of the Port Authority as of December 31, 2016 and 2015, and the changes in its net position and its cash flows for the years then ended in accordance with U.S. generally accepted accounting principles.
KPMG LLP is a Delaware limited liability partnership and the U.S. member firm of the KPMG network of independent member firms affiliated with KPMG International Cooperative (“KPMG International”), a Swiss entity.
KPMG LLP345 Park AvenueNew York, NY 10154-0102

56 THE PORT AUTHORITY OF NY & NJ
Emphasis of Matter Adoption of New Accounting Pronouncements
As discussed in Note A.3.p to the consolidated financial statements, as of January 1, 2015, the Authority adopted Governmental Accounting Standards Board (GASB) Statement No. 72, Fair Value Measurement and Application. Our opinion is not modified with respect to this matter.
Other Matters Required Supplementary Information
U.S. generally accepted accounting principles require that the Management’s Discussion and Analysis and the schedules included in the Required Supplementary Information Section identified in the Index to Financial Section, be presented to supplement the consolidated financial statements. Such information, although not a part of the consolidated financial statements, is required by the GASB who considers it to be an essential part of financial reporting for placing the consolidated financial statements in an appropriate operational, economic, or historical context. We have applied certain limited procedures to the required supplementary information in accordance with auditing standards generally accepted in the United States of America, which consisted of inquiries of management regarding the methods of preparing the information and comparing the information for consistency with management’s responses to our inquiries, the consolidated financial statements, and other knowledge we obtained during our audit of the consolidated financial statements. We do not express an opinion or provide any assurance on the information because the limited procedures do not provide us with sufficient evidence to express an opinion or provide any assurance.
Supplementary and Other Information
Our audits for the years ended December 31, 2016 and 2015 were conducted for the purpose of forming an opinion on the Port Authority’s consolidated financial statements. The supplementary information included in Schedules D-1, D-2, D-3, E and F, as listed in the Index to Financial Section, related to the years ended December 31, 2016 and 2015 is presented for purposes of additional analysis and is not a required part of the consolidated financial statements. Such information is the responsibility of management and was derived from and relates directly to the underlying accounting and other records used to prepare the consolidated financial statements. This information has been subjected to the auditing procedures applied in the audits of the consolidated financial statements for the years ended December 31, 2016 and 2015, and certain additional procedures, including comparing and reconciling such information directly to the underlying accounting and other records used to prepare the consolidated financial statements or to the consolidated financial statements themselves, and other additional procedures in accordance with auditing standards generally accepted in the United States of America. In our opinion, the supplementary information included in Schedules D-1, D-2, D-3, E and F related to the years ended December 31, 2016 and 2015 is fairly stated, in all material respects, in relation to the 2016 and 2015 consolidated financial statements, respectively, as a whole.
We also previously audited, in accordance with auditing standards generally accepted in the United States of America, the consolidated financial statements of the Port Authority as of and for the years ended December 31, 2014, 2013, and 2012 (not presented herein), and have issued our report thereon dated March 13, 2015, March 6, 2014, and February 25, 2013, respectively, which contained an unmodified opinion on the respective consolidated financial statements. The supplementary information included in Schedules D-1 and D-2, as listed in the Index to Financial Section, for the years ended December 31, 2014, 2013, and 2012, and the supplementary information included in Schedule D-3, as listed in the Index to Financial Section, for the year ended December 31, 2014, is presented for purposes of additional analysis and is not a required part of the consolidated financial statements. Such information is the responsibility of management and was derived from and relates directly to the underlying accounting and other records used to prepare the 2014, 2013, and 2012 consolidated financial statements, as applicable. This information has been subjected to the auditing procedures applied in the audits of the 2014, 2013, and 2012 consolidated financial statements, as applicable,

57THE FOUNDATION FOR A NEW TOMORROW
and certain additional procedures, including comparing and reconciling such information directly to the underlying accounting and other records used to prepare those consolidated financial statements or to those consolidated financial statements themselves, and other additional procedures in accordance with auditing standards generally accepted in the United States of America. In our opinion, the supplementary information included in Schedules D-1 and D-2 related to the years ended December 31, 2014, 2013, and 2012, and the supplementary information included in Schedule D-3 related to the year ended December 31, 2014, is fairly stated, in all material respects, in relation to the 2014, 2013, and 2012 consolidated financial statements, as applicable, as a whole.
The Port Authority’s consolidated financial statements for the years ended December 31, 2007 through 2011 (not presented herein) were audited by other auditors whose reports thereon expressed unmodified opinions on those respective consolidated financial statements. The reports of the other auditors on these consolidated financial statements stated that the supplementary information included in Schedules D-1 and D-2 for fiscal years 2007 through 2011, was subjected to the auditing procedures applied in the audit of the respective consolidated financial statements and, in their opinion, was fairly stated in all material respects in relation to the respective consolidated financial statements as a whole.
The Introductory Section and the Corporate Information Section, as listed in the Table of Contents, and the supplementary information included in Schedule D-3 for fiscal years 2007 through 2013 and Schedule G, as listed in the Index to Financial Section, are presented for the purposes of additional analysis and are not a required part of the basic financial statements. Such information has not been subjected to the auditing procedures applied in the audit of the basic financial statements, and accordingly, we do not express an opinion or provide any assurance on it.
Report on Financial Statements Prepared in Accordance with Port Authority Bond Resolutions We have audited the accompanying Schedules A, B and C of the Port Authority, which comprise financial statements that present the assets and liabilities as of December 31, 2016, and the revenues and reserves for the year then ended, of the Port Authority prepared in accordance with the requirements of the Port Authority’s bond resolutions.
Management’s Responsibility for the Financial Statements
Management is responsible for the preparation and fair presentation of these financial statements in accordance with the requirements of the Port Authority’s bond resolutions; this includes the design, implementation, and maintenance of internal control relevant to the preparation and fair presentation of financial statements that are free from material misstatement, whether due to fraud or error.
Auditor’s Responsibility
Our responsibility is to express an opinion on these financial statements based on our audit. We conducted our audit in accordance with auditing standards generally accepted in the United States of America. Those standards require that we plan and perform the audit to obtain reasonable assurance about whether the financial statements are free from material misstatement.
An audit involves performing procedures to obtain audit evidence about the amounts and disclosures in the financial statements. The procedures selected depend on the auditors’ judgment, including the assessment of the risks of material misstatement of the financial statements, whether due to fraud or error. In making those risk assessments, the auditor considers internal control relevant to the entity’s preparation and fair presentation of the financial statements in order to design audit procedures that are appropriate in the circumstances, but not for the purpose of expressing an opinion on the effectiveness of the entity’s internal control. Accordingly, we express no such opinion. An audit also includes evaluating the appropriateness of accounting policies used and the reasonableness of significant accounting estimates made by management, as well as evaluating the overall presentation of the financial statements.

58 THE PORT AUTHORITY OF NY & NJ
We believe that the audit evidence we have obtained is sufficient and appropriate to provide a basis for our audit opinion.
Opinion
In our opinion, the financial statements referred to above present fairly, in all material respects, the assets and liabilities of the Port Authority as of December 31, 2016, and its revenues and reserves for the year then ended in accordance with the requirements of the Port Authority’s bond resolutions.
Report on Summarized Comparative Information
We have previously audited Schedules A, B and C prepared in accordance with the requirements of the Port Authority’s bond resolutions as of and for the year ended December 31, 2015, and we expressed an unmodified audit opinion on them in our report dated March 7, 2016. In our opinion, the summarized comparative information presented on Schedules A, B, and C herein as of and for the year ended December 31, 2015 is consistent, in all material respects, with the audited Schedules A, B and C as of and for the year ended December 31, 2015 from which it has been derived.
Emphasis of Matters Basis of Accounting
We draw attention to note A.4 of the consolidated financial statements, which describes the basis of accounting used in Schedules A, B and C. Schedules A, B and C are prepared by the Port Authority based on the requirements present in its bond resolutions, which is a basis of accounting other than U.S. generally accepted accounting principles. Our opinion is not modified with respect to this matter.
Restriction on Use
Our report on Schedules A, B, and C is intended solely for the information and use of the Port Authority and those who are a party to the Port Authority’s bond resolutions, and is not intended to be and should not be used by anyone other than these specified parties.
New York, New York March 1, 2017

59THE FOUNDATION FOR A NEW TOMORROW

60 THE PORT AUTHORITY OF NY & NJ

61THE FOUNDATION FOR A NEW TOMORROW
Introduction
The following discussion and analysis of the financial activities of The Port Authority of New York and New Jersey (the Port Authority) and its component units described herein (See Note A.1.d – Nature of the Organization and Summary of Significant Accounting Policies) is intended to provide an introduction to and understanding of the consolidated financial statements of the Port Authority for the year ended December 31, 2016, with selected comparative information for the years ended December 31, 2015 and December 31, 2014. This section has been prepared by management of the Port Authority and should be read in conjunction with the consolidated financial statements and appended note disclosures that follow the Management’s Discussion and Analysis section of this report.
2016 Financial Results
The Port Authority’s increase in net position for the year ended December 31, 2016 totaled $1.0 billion, comprised of $916 million in income from operations and $130 million in income from non-operating activities.
description 2016
(In thousands)
Gross operating revenues $ 5,167,364Operating expenses (3,013,087)Depreciation and amortization (1,238,512)
Income from operations 915,765
Non-operating expenses, net (809,747)
Capital contributions and Passenger Facility Charges (PFCs) 939,313
Income from non-operating activities 129,566
increase in net position $ 1,045,331
Gross operating revenues totaled $5.2 billion in 2016, comprised of:
Operating expenses totaled $3.0 billion in 2016, comprised of:
Management’s Discussion and Analysis (Unaudited)Years ended December 31, 2016 and 2015
TOLLS AND FARES$1,865 36%
RENTALS — SPECIAL PROJECT BONDS PROJECTS$87 2%
2016 Operating Revenues
RENTALS$1,565 30%
AVIATION FEES$1,112 21%
PARKING AND OTHER FEES $399 8%
UTILITIES $139 3%
($ In Millions)
EMPLOYEE COMPENSATION,INCLUDING BENEFITS $1,290 43%
CONTRACT SERVICES $853 28%
RENTS AND PAYMENTS IN-LIEU-OF TAXES $352 12%(PILOT)
INTEREST ON SPECIAL PROJECT BONDS $87 3%
MATERIALS, EQUIPMENT AND OTHER $265 9%
UTILITIES $166 5%
($ In Millions)2016 Operating Expenses
2. On page 10, it looks like the title Materials, Equipment and Other $265 and 9% is swapped with Rents and Payments in-lieu-of taxes $352 and 12% on the Operating Expense chart.

62 THE PORT AUTHORITY OF NY & NJ
Depreciation and amortization totaled $1.2 billion in 2016, comprised of:
Income/(Loss) from operations totaled $916 million in 2016, comprised of:
Income/(Loss) from non-operating activities totaled $130 million in 2016, comprised of:
2016
(In millions)Contributions in aid of construction, PFCs and pass-through grant program payments $ 929Grants, in connection with operating activities 64Financial income, including decreases in fair value of investments 31
Interest expense in connection with bonds and other asset financings, net* (894)
income/(loss) from non-operating activities $ 130
* Includes $41.5 million reimbursement related to Tower 4 Liberty Bonds debt service payments.
Management’s Discussion and Analysis (Unaudited)(continued)
2016 Depreciation and Amortization by Business Segment($ In Millions)
TUNNELS,BRIDGES &
TERMINALS (TB&T)
PATH* AVIATION PORTDEPARTMENT
WORLDTRADE
CENTER
OTHER**
$0
$200
$400
$600
$191 $191
$452
$223
$94 $87
* Port Authority Trans Hudson Corporation (PATH) includes World Trade Center (WTC) Transportation Hub.
** Other includes Regional Facilities and Programs, Development Facilities, Access to the Regions Core and Ferry Transportation.
2016 Income/(Loss) from Operations by Business Segment($ In Millions)
* PATH includes WTC Transportation Hub.
** Other includes Regional Facilities and Programs, Development Facilities, Access to the Regions Core and Ferry Transportation.
TB&T PATH* AVIATION PORTDEPARTMENT
WTC OTHER**
$(500)
$0
$500
$1,000
$1,500 $1,042
$(415)
$581
$(257)
$39
$(74)

63THE FOUNDATION FOR A NEW TOMORROW
Financial Statement Comparison for the Years Ended December 31, 2016, December 31, 2015 and December 31, 2014
Management’s discussion and analysis is intended to serve as an introduction to the Port Authority’s consolidated financial statements, including the notes to the consolidated financial statements, required supplementary information, financial schedules pursuant to Port Authority bond resolutions, and statistical and other supplemental information. The consolidated financial statements comprise the following: the Consolidated Statements of Net Position, the Consolidated Statements of Revenues, Expenses and Changes in Net Position, the Consolidated Statements of Cash Flows, and the Notes to the Consolidated Financial Statements.
Consolidated Statements of Net Position
The Consolidated Statements of Net Position present the financial position of the Port Authority at the end of the fiscal year and include all of the Port Authority’s assets, deferred outflows of resources, liabilities, and deferred inflows of resources as applicable. Net position represents the difference between assets and deferred outflows of resources, and liabilities and deferred inflows of resources. A summarized comparison of the Port Authority’s assets, deferred outflows of resources, liabilities, deferred inflows of resources, and net position follows:
2016 2015 2014*
(In thousands)
AsseTsCurrent assets $ 2,683,308 $ 3,779,062 $ 2,845,980 Noncurrent assets: Facilities, net 34,693,691 32,666,774 30,773,475 Other noncurrent assets 7,884,673 7,902,406 7,974,599
Total assets 45,261,672 44,348,242 41,594,054
deferred ouTflows of resourcesLoss on debt refundings 79,046 97,337 108,447 Pension related amounts 555,794 155,259 —
Total deferred outflows of resources 634,840 252,596 108,447
liABiliTiesCurrent liabilities 3,392,909 3,546,341 3,036,635 Noncurrent liabilities: Bonds and other asset financing obligations 21,533,071 21,533,822 19,920,820 Other noncurrent liabilities 4,288,389 3,962,030 3,963,585
Total liabilities 29,214,369 29,042,193 26,921,040
deferred iNflows of resourcesGain on debt refundings 30,407 21,527 6,921 Pension related amounts 76,842 7,555 —
Total deferred inflows of resources 107,249 29,082 6,921
NeT PosiTioN Net investment in capital assets 12,701,144 11,810,573 10,402,894 Restricted 567,443 456,429 470,857 Unrestricted 3,306,307 3,262,561 3,900,789
Net position, December 31 $16,574,894 $15,529,563 $14,774,540
* Amounts have not been restated for the cumulative effect of implementing GASB Statement No. 68 – Accounting and Financial Reporting for Pensions and other related pronouncements in 2015 totaling $24.7 million.
Management’s Discussion and Analysis (Unaudited)(continued)

64 THE PORT AUTHORITY OF NY & NJ
2016 vs. 2015
Port Authority assets totaled $45.3 billion at December 31, 2016, an increase of $913 million from December 31, 2015. This overall increase was primarily a result of:
• Facilities,net,includingcontributedcapital,increased$2.0billionresultingfromthecontinuedcapitalinvestmentinPortAuthorityfacilitiesasoutlined in the Port Authority’s capital plan, less annual depreciation (see Schedule F - Information on Capital Investment in Port Authority Facilities for additional information on capital investment by business segment).
• Cashbalances,includingrestrictedamounts,of$738milliondecreased$610millionfromDecember31,2015primarilyduetothedrawdownof consolidated bond proceeds received in 2015 to, refund certain outstanding consolidated bond debt obligations in 2016 to achieve savings on future debt service payments and to fund additional capital construction at Port Authority facilities. For additional information related to cash balances see Consolidated Statements of Cash Flows.
• Currentandnoncurrentinvestments,includingrestrictedamounts,of$4.8billiondecreased$435millionprimarilyduetothematurityofcertaininvestments comprised of consolidated bond proceeds received in 2015 and invested on an interim basis until they were utilized to refund certain outstanding consolidated bond debt obligations in 2016, to achieve savings on future debt service payments.
Port Authority deferred outflows of resources totaled $634.8 million at December 31, 2016, an increase of $382.2 million from December 31, 2015. This year-to-year increase was primarily due to an increase in certain actuarially determined pension costs related to the Port Authority’s proportionate share of the New York State and Local Retirement System (NYSLRS) Net Pension Liability (NPL), including the impact of changes to certain actuarial assumptions and the difference between expected and actual earnings on plan investments. 2016 deferred outflows of resources will be amortized as additional pension expense on a straight-line basis over a closed period (see Note I- Pension Plans for additional information related to pensions).
Port Authority liabilities totaled $29.2 billion at December 31, 2016, an increase of $172 million from December 31, 2015. This increase was primarily due to:
• Accruedpensionandotherpost-employmentemployeebenefitsincreased$304millionprimarilyduetoa$379millionincreaseinthePortAuthority’s proportionate share of the NPL of the NYSLRS, including the impact of changes to certain actuarial assumptions and the difference between expected and actual earnings on plan investments. Offsetting these increases was a $77 million decrease in the Other Postemployment Benefits (OPEB) obligation, primarily due to advanced funding of $100 million to The Port Authority of New York and New Jersey Retiree Health Benefits Trust for purposes of paying future OPEB payments. For additional information related to pension obligations and OPEB, see Note I – Pension Plans and Note J – Other Postemployment Employee Benefits (OPEB).
• UnearnedincomerelatedtothePortAuthority’stransferofitsinterestsintheWTCRetailJointVentureincreased$69millionprimarilyduetothereceipt of additional funding in connection with the ongoing development of the retail components of the WTC retail premises. These amounts are being recognized as rental income over the term of the WTC retail net lease agreement.
• Bondsandotherassetfinancingobligations,includingTower4LibertyBonds,decreased$247millionprimarilyduetotherefundingofcertainoutstanding consolidated bonds series in January 2016 and October 2016, respectively, with refunding bond proceeds received in October 2015. Offsetting these amounts was an increase in the Goethals Bridge Replacement Developer Financing Arrangement (DFA) obligation due to the completion of additional capital construction of the replacement bridge.
Port Authority deferred inflows of resources totaled $107.2 million at December 31, 2016, an increase of $78.2 million from December 31, 2015. This year-to-year increase was primarily due to a decrease in the Port Authority’ proportionate share of pension amounts of the New York State and Local Police and Fire Retirement System. 2016 deferred inflows of resources will be amortized as a reduction to pension expense on a straight-line basis over a closed period (see Note I- Pension Plans for additional information related to pensions).
Management’s Discussion and Analysis (Unaudited)(continued)

65THE FOUNDATION FOR A NEW TOMORROW
2015 vs. 2014
Port Authority assets totaled $44.3 billion at December 31, 2015, an increase of $2.8 billion from December 31, 2014. This increase was primarily due to:
• Facilities,net,includingcontributedcapitalamounts,increased$1.9billionresultingfromthecontinuedcapitalinvestmentinPortAuthorityfacilities, less annual depreciation.
• Cashbalances,includingrestrictedamountsdecreased$498millionduring2015primarilydueto$2.5billionincashusedforcapitalconstruction, $1.3 billion related to debt service on outstanding debt obligations and the reallocation of approximately $400 million in cash equivalents to higher yielding United States (U.S.) securities. Offsetting these amounts was a $1.8 billion increase in cash from operations, $1.5 billion net increase in cash related to consolidated bond proceeds issued for purposes of funding capital construction or refunding existing debt obligations and $545 million related to the receipt of capital contributions and Passenger Facility Charges. For additional information see Consolidated Statements of Cash Flows.
• Currentandnoncurrentinvestmentsincreased$1.5billionprimarilyduetoa$1.1billionincreaseinsecuritiespurchasedwithconsolidatedbondproceeds that are being invested on an interim basis until they are needed for their intended purpose of funding capital construction or refunding outstanding debt obligations and the reallocation of approximately $400 million of cash equivalents to higher yielding U.S. securities.
Port Authority liabilities totaled $29 billion at December 31, 2015, an increase of $2.1 billion from December 31, 2014. This increase was primarily due to:
• Bondsandotherassetfinancingobligations,includingdiscountsandpremiumsrelatedtobondissuances,increased$2.2billionprimarilyduetothe issuance of consolidated bonds in connection with expected capital construction funding requirements or for purposes of refunding certain outstanding consolidated bonds.
• Accountspayabledecreased$218millionprimarilyduetothedecreaseinconstructionaccrualsrelatingtocapitalprojectsattheLincolnTunneland George Washington Bridge.
• Accruedpensionandotherpostemploymentemployeebenefitsincreased$40millionprimarilyduetotherecognitionofthePortAuthority’sproportionate share of the net pension liability of the New York State and Local Employees Retirement System and the New York State and Local Police and Fire Retirement System, along with the net pension liability related to the PATH Exempt Employees Supplemental Pension Plan recognized in accordance with GASB Statement No. 68 – Accounting and Reporting for Pensions, which became effective in 2015. Offsetting these increases was an $83 million net decrease in OPEB obligations, primarily due to advanced fundings made to The Port Authority of New York and New Jersey Retiree Health Benefits Trust. For additional information related to pension obligations and OPEB, see Note I – Pension Plans and Note J – Other Postemployment Employee Benefits.
Consolidated Statements of Revenues, Expenses and Changes in Net Position
Change in net position is an indicator of whether the overall fiscal condition of an organization has improved or worsened during the year. Following is a summary of the Consolidated Statements of Revenues, Expenses and Changes in Net Position:
2016 2015* 2014**
(In thousands)
Gross operating revenues $ 5,167,364 $ 4,826,582 $ 4,481,812Operating expenses (3,013,087) (2,900,652) (2,923,254)Depreciation and amortization (1,238,512) (1,189,048) (996,633)Net revenue related to Superstorm Sandy — 123 53,530
Income from operations 915,765 737,005 615,455
Non-operating expenses, net (809,747) (792,214) (502,681)Capital contributions and PFCs 939,313 835,002 933,439
Increase in net position 1,045,331 779,793 1,046,213
Net position, January 1 15,529,563 14,749,770 13,728,327Net position, December 31 $ 16,574,894 $ 15,529,563 $ 14,774,540
* January 1, 2015 net position has been restated to reflect the cumulative effect of implementing GASB Statement No. 68 – Accounting and Financial Reporting for Pensions and other related pronouncements totaling $24.7 million.
** Amounts have not been restated for the cumulative effect of implementing GASB Statement No. 68 – Accounting and Financial Reporting for Pensions and other related pronouncements in 2015 totaling $24.7 million.
Management’s Discussion and Analysis (Unaudited)(continued)

66 THE PORT AUTHORITY OF NY & NJ
Additional information on individual facility financial results can be found in Schedule E – Information on Port Authority Operations located in the Statistical and Other Supplemental Information section of this report.
Operating Revenues
A summary of gross operating revenues follows:
2016 2015 2014
(In thousands)
gross operating revenues: Tolls and fares $ 1,865,481 $ 1,718,770 $ 1,553,625 Rentals 1,564,527 1,446,980 1,300,818 Aviation fees 1,112,436 1,063,902 1,058,416 Parking and other 399,178 359,631 321,760 Utilities 138,987 144,580 149,052 Rentals – Special Project Bonds Projects 86,755 92,719 98,141
Total $ 5,167,364 $ 4,826,582 $ 4,481,812
2016 vs. 2015
Gross operating revenues of $5.2 billion increased $341 million or 7.1% from 2015. Tolls revenue at the Port Authority’s six (6) vehicular crossings increased $142 million or 9.2% from 2015, due to the final scheduled toll increase that became effective in December 2015 and an overall increase in vehicular traffic of 2.4%. PATH fares increased $5 million or 2.8% due to a 2.6% increase in passenger activity. Rental revenue increased $118 million or 8.1% primarily due to increases in fixed and percentage rentals at One World Trade Center (WTC) as a result of increased occupancy, and Aviation facilities, primarily due to scheduled rent increases in certain terminal lease agreements and increased percentage rentals at John F. Kennedy International Airport (JFK). Partially offsetting these increases was a decrease in certain fixed and percentage rentals at LaGuardia Airport (LGA) due to the execution of a lease agreement with LaGuardia Gateway Partners for the operation of the existing Terminal B pursuant to the public private partnership that is redeveloping the terminal. Formulaically determined Aviation fees, which provide for the recovery of certain Port Authority capital investments and operating expenses at its three major airports, increased $49 million or 4.6% primarily due to the recovery of increased policing and security related expenditures and aeronautical related capital investment.
The following chart depicts the 2016 change in total gross operating revenues by business segment when compared to 2015:
Management’s Discussion and Analysis (Unaudited)(continued)
2016 vs. 2015 - Gross Operating Revenues($ In Millions)
TB&T PATH* AVIATION PORTDEPARTMENT
WTC OTHER**$(50)
$0
$50
$100
$150
$142+9%
$6+3%
$110+4%
$53+25% $31
+11%
$(1)-4%
* PATH includes WTC Transportation Hub.
** Other includes Regional Facilities and Programs, Development Facilities and Ferry Transportation.
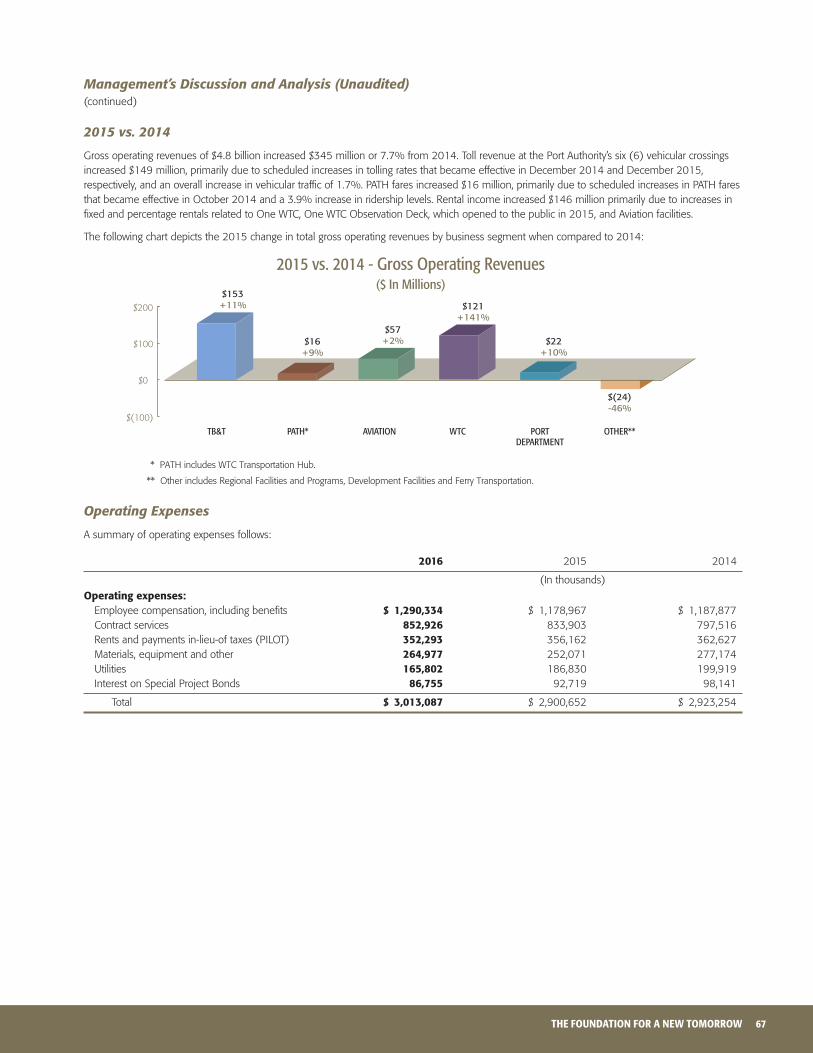
67THE FOUNDATION FOR A NEW TOMORROW
2015 vs. 2014
Gross operating revenues of $4.8 billion increased $345 million or 7.7% from 2014. Toll revenue at the Port Authority’s six (6) vehicular crossings increased $149 million, primarily due to scheduled increases in tolling rates that became effective in December 2014 and December 2015, respectively, and an overall increase in vehicular traffic of 1.7%. PATH fares increased $16 million, primarily due to scheduled increases in PATH fares that became effective in October 2014 and a 3.9% increase in ridership levels. Rental income increased $146 million primarily due to increases in fixed and percentage rentals related to One WTC, One WTC Observation Deck, which opened to the public in 2015, and Aviation facilities.
The following chart depicts the 2015 change in total gross operating revenues by business segment when compared to 2014:
Operating Expenses
A summary of operating expenses follows:
2016 2015 2014
(In thousands)
operating expenses: Employee compensation, including benefits $ 1,290,334 $ 1,178,967 $ 1,187,877 Contract services 852,926 833,903 797,516 Rents and payments in-lieu-of taxes (PILOT) 352,293 356,162 362,627 Materials, equipment and other 264,977 252,071 277,174 Utilities 165,802 186,830 199,919 Interest on Special Project Bonds 86,755 92,719 98,141
Total $ 3,013,087 $ 2,900,652 $ 2,923,254
Management’s Discussion and Analysis (Unaudited)(continued)
$(100)
$100
$0
$200
2015 vs. 2014 - Gross Operating Revenues($ In Millions)
TB&T PATH* AVIATION PORTDEPARTMENT
WTC OTHER**
$153+11%
$16+9%
$57+2%
$121+141%
$22+10%
$(24)-46%
* PATH includes WTC Transportation Hub.
** Other includes Regional Facilities and Programs, Development Facilities and Ferry Transportation.

68 THE PORT AUTHORITY OF NY & NJ
2016 vs. 2015
Operating expenses of $3.0 billion increased $112 million or 3.9% from 2015. Employee compensation of $1.3 billion increased $111 million from 2015 primarily due to increases in actuarially determined costs related to OPEB and pension benefits provided to employees as well as increases in employee compensation due to, heightened security at Aviation facilities, the WTC site and the training of additional police officers. In addition, payments to third-parties for maintenance, security, operational support, payments in-lieu-of-taxes (PILOT) to the City of New York, and insurance increased approximately $39 million due to the continued transitioning of the WTC to a fully operational facility, including the WTC Transportation Hub which opened to the public in March 2016. Partially offsetting these increases were decreases totaling approximately $18 million in material purchases, employee wages, and contractor payments related to snow and ice removal activities, primarily at Aviation facilities, as well as a $20 million decrease in electricity consumption and supply charges at Port Authority facilities due to milder weather conditions.
The following chart depicts the 2016 change in total operating expenses by business segment when compared to 2015:
2015 vs. 2014
Operating expenses totaled $2.9 billion in 2015, a decrease of $23 million or 1% from 2014. Operating expenses at Aviation, Tunnels, Bridges and Terminals (TB&T), Development Facilities and PATH decreased approximately $89 million from 2014, primarily due to lower self-insured public liability and workers compensation loss reserves, lower overtime related to policing activities due to the addition of new police officers, lower employee compensation and third party contractor payments related to snow removal activities due to less severe winter weather conditions throughout 2015, and lower corporate overhead related to rent for vacated corporate offices. Offsetting these decreases was a $66 million increase in WTC operating expenses, including PILOT to the City of New York, primarily related to the continued transitioning of the World Trade Center to a fully operational facility.
The following chart depicts the 2015 change in total operating expenses by business segment when compared to 2014:
Management’s Discussion and Analysis (Unaudited)(continued)
* PATH includes WTC Transportation Hub.
** Other includes Regional Facilities and Programs, Development Facilities, Access to the Regions Core and Ferry Transportation.
2016 vs. 2015 - Operating Expenses($ In Millions)
TB&T PATH* AVIATION PORTDEPARTMENT
WTC OTHER**
$(20)
$0
$20
$40
$60
$10+2%
$26+7%
$54+3%
$35+14%
$(8)-5%
$(5)-26%
2015 vs. 2014 - Operating Expenses($ In Millions)
TB&T PATH* AVIATION PORTDEPARTMENT
WTC OTHER**
$(10)-2%
$(12)-3%
$(65)-4%
$66+34%
$3+2%
$(5)-17%
* PATH includes WTC Transportation Hub.
** Other includes Regional Facilities and Programs, Development Facilities, Access to the Regions Core and Ferry Transportation.
$(100)
$(50)
$50
$0
$100

69THE FOUNDATION FOR A NEW TOMORROW
Depreciation and Amortization
A summary of depreciation and amortization follows:
2016 2015 2014
(In thousands)
depreciation and amortization: Depreciation of facilities $ 1,173,747 $ 1,124,383 $ 932,149 Amortization of costs for regional programs 64,765 64,665 64,484
Total $ 1,238,512 $ 1,189,048 $ 996,633
2016 vs. 2015
Depreciation and amortization of $1.2 billion increased $49 million or 4.2% from 2015. This increase is primarily due to the placement of $2.9 billion of additional capital infrastructure into service during 2016. These capital infrastructure assets, primarily located at the WTC site, TB&T, and Aviation facilities are now being depreciated over their estimated useful life. In addition, the Port Authority accelerated depreciation of approximately $10 million for certain LGA Terminal B capital infrastructure assets which are expected to be taken out of service in 2021 due to the ongoing redevelopment of the terminal.
Additional information related to capital investment in Port Authority facilities can be found in appended Note B – Facilities, net to the 2016 consolidated financial statements, Schedule D-3 – Selected Statistical Financial Data by Business Segment and Schedule F – Information on Capital Investment in Port Authority Facilities located in the Statistical and Other Supplemental Information section of this report.
The following chart depicts the 2016 change in total depreciation by business segment when compared to 2015:
Management’s Discussion and Analysis (Unaudited)(continued)
2016 vs. 2015 - Depreciation and Amortization($ In Millions)
TB&T PATH* AVIATION PORTDEPARTMENT
WTC OTHER**
$(20)
$(10)
$0
$10
$20
$30
* PATH includes WTC Transportation Hub.
** Other includes Regional Facilities and Programs, Development Facilities, Access to the Regions Core and Ferry Transportation.
$12+7%
$(15)-7%
$22+5%
$29+15%
$3+3%
$(2)-2%
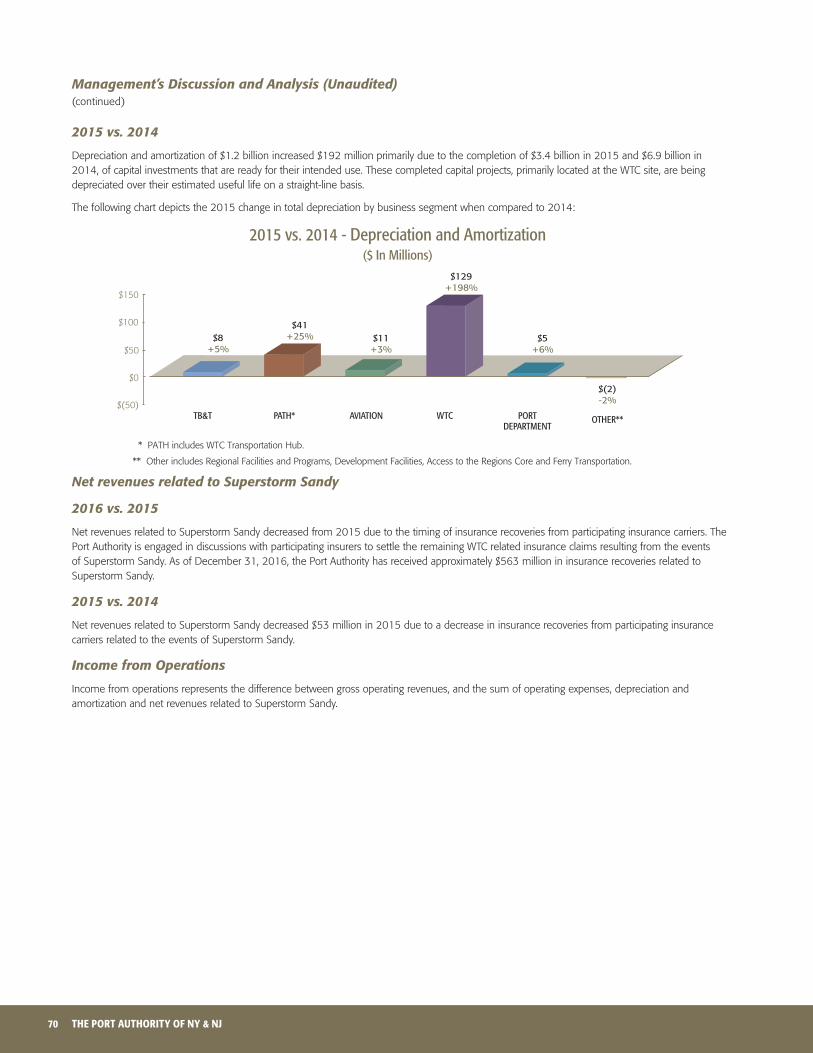
70 THE PORT AUTHORITY OF NY & NJ
2015 vs. 2014
Depreciation and amortization of $1.2 billion increased $192 million primarily due to the completion of $3.4 billion in 2015 and $6.9 billion in 2014, of capital investments that are ready for their intended use. These completed capital projects, primarily located at the WTC site, are being depreciated over their estimated useful life on a straight-line basis.
The following chart depicts the 2015 change in total depreciation by business segment when compared to 2014:
Net revenues related to Superstorm Sandy
2016 vs. 2015
Net revenues related to Superstorm Sandy decreased from 2015 due to the timing of insurance recoveries from participating insurance carriers. The Port Authority is engaged in discussions with participating insurers to settle the remaining WTC related insurance claims resulting from the events of Superstorm Sandy. As of December 31, 2016, the Port Authority has received approximately $563 million in insurance recoveries related to Superstorm Sandy.
2015 vs. 2014
Net revenues related to Superstorm Sandy decreased $53 million in 2015 due to a decrease in insurance recoveries from participating insurance carriers related to the events of Superstorm Sandy.
Income from Operations
Income from operations represents the difference between gross operating revenues, and the sum of operating expenses, depreciation and amortization and net revenues related to Superstorm Sandy.
Management’s Discussion and Analysis (Unaudited)(continued)
2015 vs. 2014 - Depreciation and Amortization($ In Millions)
TB&T PATH* AVIATION PORTDEPARTMENT
WTC OTHER**
$(50)
$50
$100
$150
$0
* PATH includes WTC Transportation Hub.
** Other includes Regional Facilities and Programs, Development Facilities, Access to the Regions Core and Ferry Transportation.
$8+5%
$41+25% $11
+3%
$129+198%
$5+6%
$(2)-2%

71THE FOUNDATION FOR A NEW TOMORROW
2016 vs. 2015
Income from operations of $916 million increased $179 million from 2015 primarily due to increases in tolls at the Port Authority’s six (6) vehicular crossings and fixed and activity-based rentals at the WTC and Aviation facilities.
The following chart depicts 2016 change in income from operations by business segment when compared to 2015:
2015 vs. 2014
Income from operations of $737 million increased $122 million in 2015 primarily due to increases in tolls at the Port Authority’s six (6) vehicular crossings, PATH fares and fixed and activity-based rentals at the WTC and Aviation facilities. Offsetting these amounts were increases in depreciation expense, primarily related to completed WTC capital assets and lower insurance recoveries related to Superstorm Sandy.
The following chart depicts 2015 change in income from operations by business segment when compared to 2014:
Management’s Discussion and Analysis (Unaudited)(continued)
2016 vs. 2015 - Income/(Loss) from Operations($ In Millions)
TB&T PATH* AVIATION PORTDEPARTMENT
WTC OTHER**
$120+13%
$(5)-1%
$34+6%
$(10)-4%
$36+1,200%
* PATH includes WTC Transportation Hub.
** Other includes Regional Facilities and Programs, Development Facilities, Access to the Regions Core, Ferry Transportation and Net revenues related to Superstorm Sandy.
$4+5%
$(50)
$0
$50
$100
$150
2015 vs. 2014 - Income/(Loss) from Operations($ In Millions)
TB&T PATH* AVIATION PORTDEPARTMENT
WTC OTHER**
$153+20%
$(12)-3%
$112+26%
$(73)-42%
$13+130%
* PATH includes WTC Transportation Hub.
** Other includes Regional Facilities and Programs, Development Facilities, Access to the Regions Core, Ferry Transportation and Net revenues related to Superstorm Sandy.
$200
$100
$(100)
$0
$(71)-888%

72 THE PORT AUTHORITY OF NY & NJ
Non-Operating Revenues and Expenses
A summary of non-operating revenues and expenses follows:
2016 2015 2014
(In thousands)
Non-operating revenues and (expenses): Financial income $ 42,047 $ 45,268 $ 41,050 Net (decrease) in fair value of investments (11,493) (14,290) (2,950) Interest expense in connection with bonds and other asset financings, net* (893,921) (872,837) (660,116) Net gain on disposition of assets — — 19,043 Pass-through grant program payments (10,695) (51,429) (107,606) Grants, in connection with operating activities 64,315 101,074 207,898
Non-operating expenses, net $ (809,747) $ (792,214) $ (502,681)
* Includes reimbursements received by the Port Authority related to Tower 4 Liberty Bond debt service payments.
2016 vs. 2015
• Financialincome,comprisedofinterestincomeandchangesinthefairvalueofinvestmentsof$31millionremainedflatwhencomparedto2015. Financial income related to the Port Authority’s $4.8 billion investment portfolio, comprised primarily of U.S. securities, decreased $3 million. Offsetting this decrease was a $3 million increase in market valuation adjustments associated with the fluctuation of interest rates and the resulting impact these fluctuations had on the fair value of the Port Authority’s investment portfolio.
• Interestexpenseinconnectionwithbondsandotherassetfinancingsof$894millionincreased$21millionfrom2015primarilyrelatedtocertainconsolidated bond series that were issued in October 2015 for purposes of refunding certain outstanding consolidated debt obligations in 2016 and 2017 respectively. As the outstanding debt to be refunded was not defeased for financial reporting purposes in 2015, interest accrued on both the refunding bonds issued in 2015 for such purposes and the outstanding debt obligations to be refunded were recognized until such bonds were refunded.
• Pass-throughgrantprogrampaymentstosub-granteesof$11milliondecreased$41millionin2016primarilyduetodecreasedfederalfundingassociated with baggage screening projects at Aviation facilities and Port security projects sponsored by the Port Authority.
Pass-through grant program payments are offset in their entirety by either Contributions in aid of construction or Grants, in connection with operating activities.
• Grants,inconnectionwithoperatingactivitiesof$64milliondecreased$37millionin2016primarilyduetoa$26milliondecreaseingrants related to Superstorm Sandy recovery efforts and a $26 million decrease in security related programs from the Transportation Security Administration (TSA) for baggage screening at LGA, JFK, and Newark Liberty International Airport (EWR) and Urban Area Security Initiative (UASI). Offsetting these amounts was a $9.5 million increase in Airport Improvement Program (AIP) primarily related to certain studies and operating activities at Port Authority Aviation facilities.
2015 vs. 2014
• Financialincome,comprisedofinterestincomeandchangesinthefairvalueofinvestments,decreased$7.1million,primarilyduetoa$11.3million decrease in market valuation adjustments associated with the fluctuation of interest rates and their impact on the fair value of the Port Authority’s investment portfolio. Offsetting this decrease was a $4.2 million increase in financial income related to the Port Authority’s $5 billion investment portfolio, which is primarily comprised of U.S. securities.
• Operatinginterestexpenseinconnectionwithbondsandotherassetfinancingsincreased$213millionin2015primarilyduetolowerinterestbeing allocated to capital projects still under construction, primarily at the WTC site.
• Grants,inconnectionwithoperatingactivitiesdecreased$107millionin2015primarilyduetoa$113milliondecreaseinU.S.DHSfundingforport security related projects and a $19 million decrease in grants related to Superstorm Sandy recovery efforts.
• Pass-throughgrantprogrampaymentstosub-granteesdecreased$56millionin2015primarilyduetodecreasedfundingassociatedwithbaggage screening projects at aviation facilities and port security related projects sponsored by the Port Authority.
Pass-through grant program payments are offset in their entirety by either Contributions in aid of construction or Grants, in connection with operating activities.
Management’s Discussion and Analysis (Unaudited)(continued)
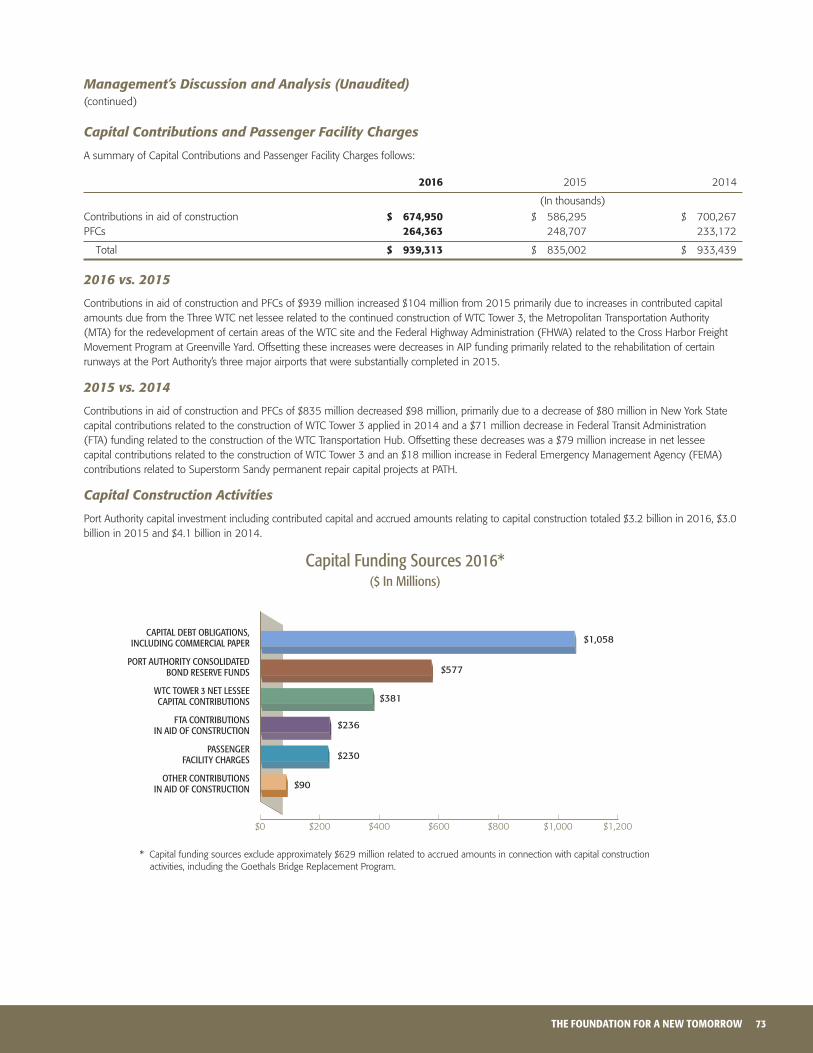
73THE FOUNDATION FOR A NEW TOMORROW
Capital Contributions and Passenger Facility Charges
A summary of Capital Contributions and Passenger Facility Charges follows:
2016 2015 2014
(In thousands)
Contributions in aid of construction $ 674,950 $ 586,295 $ 700,267PFCs 264,363 248,707 233,172
Total $ 939,313 $ 835,002 $ 933,439
2016 vs. 2015
Contributions in aid of construction and PFCs of $939 million increased $104 million from 2015 primarily due to increases in contributed capital amounts due from the Three WTC net lessee related to the continued construction of WTC Tower 3, the Metropolitan Transportation Authority (MTA) for the redevelopment of certain areas of the WTC site and the Federal Highway Administration (FHWA) related to the Cross Harbor Freight Movement Program at Greenville Yard. Offsetting these increases were decreases in AIP funding primarily related to the rehabilitation of certain runways at the Port Authority’s three major airports that were substantially completed in 2015.
2015 vs. 2014
Contributions in aid of construction and PFCs of $835 million decreased $98 million, primarily due to a decrease of $80 million in New York State capital contributions related to the construction of WTC Tower 3 applied in 2014 and a $71 million decrease in Federal Transit Administration (FTA) funding related to the construction of the WTC Transportation Hub. Offsetting these decreases was a $79 million increase in net lessee capital contributions related to the construction of WTC Tower 3 and an $18 million increase in Federal Emergency Management Agency (FEMA) contributions related to Superstorm Sandy permanent repair capital projects at PATH.
Capital Construction Activities
Port Authority capital investment including contributed capital and accrued amounts relating to capital construction totaled $3.2 billion in 2016, $3.0 billion in 2015 and $4.1 billion in 2014.
Management’s Discussion and Analysis (Unaudited)(continued)
Capital Funding Sources 2016*($ In Millions)
$0 $200 $400 $600 $800 $1,000 $1,200
$1,058
$577
$381
$236
$230
$90
* Capital funding sources exclude approximately $629 million related to accrued amounts in connection with capital construction activities, including the Goethals Bridge Replacement Program.
CAPITAL DEBT OBLIGATIONS, INCLUDING COMMERCIAL PAPER
PORT AUTHORITY CONSOLIDATED BOND RESERVE FUNDS
WTC TOWER 3 NET LESSEE CAPITAL CONTRIBUTIONS
FTA CONTRIBUTIONS IN AID OF CONSTRUCTION
PASSENGER FACILITY CHARGES
OTHER CONTRIBUTIONS IN AID OF CONSTRUCTION

74 THE PORT AUTHORITY OF NY & NJ
The following chart depicts capital investment for the last three years summarized by business segment:
Additional information related to capital investment in Port Authority facilities can be found in appended Note B – Facilities, net to the 2016 consolidated financial statements, and Schedule D-3 – Selected Statistical Financial Data by Business Segment and Schedule F – Information on Capital Investment in Port Authority Facilities located in the Statistical and Other Supplemental Information section of this report.
Capital Financing and Debt Management
As of December 31, 2016, bonds and other asset financing obligations of the Port Authority totaled approximately $24.0 billion, including $1.2 billion associated with the Tower 4 Liberty Bonds for which the Port Authority is a co-borrower/obligor.
During 2016, the Port Authority issued $1.4 billion of consolidated bonds and received $139 million in bond premiums at the time of issuance. Of this amount, $394 million was allocated to fund capital construction and $1.1 billion was allocated for purposes of refunding outstanding consolidated bonds to achieve savings on future debt service payments and the pay down of commercial paper. In addition, the Port Authority issued commercial paper obligations totaling $1.8 billion. Of this amount, $1.7 billion was allocated for the purpose of refunding existing commercial paper obligations and $61 million was issued to fund capital construction project expenditures.
On October 9, 2015, the Port Authority issued Consolidated Bonds, One Hundred Ninety-fourth (194th) Series for purposes of funding $216 million of capital project expenditures at certain Port Authority facilities, to refund $68.5 million of certain Consolidated Bonds, One Hundred Forty-eighth (148th) Series in October 2015 and to refund $335.9 million of Consolidated Bonds, One Hundred Forty-second (142nd) Series obligations in January 2016. In addition, $743.4 million of Consolidated Bonds, One Hundred Ninety-fourth (194th) Series bond proceeds were deposited in Port Authority controlled custodial accounts and invested in U.S. securities on an interim basis until needed for purposes of refunding Consolidated Bonds, One Hundred Forty-fourth (144th) Series and Consolidated Bonds, One Hundred Forty-eighth (148th) Series in October 1, 2016 and August 15, 2017, respectively. The maturity dates of the investments coincide with refunding dates of the respective consolidated bond series to be refunded. The invested bond proceeds, along with $5.2 million of fixed income earned on these investments provide for the complete refunding of Consolidated Bonds, One Hundred Forty-fourth (144th) Series and One Hundred Forty-eighth (148th) Series. Because the invested bond proceeds are deposited in Port Authority controlled custodial accounts that are not irrevocable, the outstanding debt obligations to be refunded in August 2017 have not been substantively defeased for financial reporting purposes.
Total debt Total debt service owed service owed as of Principal interest paid as of consolidated Bond Period 12/31/2015 paid in 2016 in 2016 12/31/2016
One Hundred Forty-fourth Series 10/9/15 to 10/1/16 $ 314,621,344 $ 300,000,000 $ 14,621,344 $ —One Hundred Forty-eighth Series* 10/9/15 to 8/15/17 434,038,000 – 19,729,000 414,309,000
Total $ 748,659,344 $ 300,000,000 $ 34,350,344 $ 414,309,000
* Total Debt Service owed as of 12/31/2015 excludes $15.1 million of principal paid in 2016 from Net Operating Revenues.
Management’s Discussion and Analysis (Unaudited)(continued)
Capital Investment by Business Segment 2014-2016($ In Millions)
$0
$400
$800
$1,200
$1,600
$2,000
$1,179
2016 2015 2014
$956 $962
$218 $155 $222
$585$792 $715
$134 $94$2 $5 $6
$211
$1,083 $1,019
$1,965
* Other includes Regional Facilities and Programs, Development Facilities and Ferry Transportation.
TB&T PATH AVIATION PORT DEPARTMENT WTC (including WTC Transportation Hub)
OTHER*

75THE FOUNDATION FOR A NEW TOMORROW
Listed below is a summary of credit ratings assigned to outstanding debt obligations of the Port Authority. All ratings for outstanding obligations in 2016 remained the same when compared to 2015. During 2016, Standard and Poor’s (S&P), Fitch Ratings and Moody’s Investors Service considered the Port Authority’s outlook stable.
obligation s&P fitch ratings moody’s investors service
Consolidated Bonds AA- AA- Aa3Commercial Paper A-1+ F1+ P-1
Each rating reflects only the view of the ratings service issuing such rating and is not a recommendation by such ratings service to purchase, sell or hold any maturity of Port Authority obligations or as to market price or suitability of any maturity of the obligations for a particular investor. An explanation of the significance of a rating may be obtained from the ratings service issuing such rating. There is no assurance that any rating will continue for any period of time or that it will not be revised or withdrawn. A revision or withdrawal of a rating may have an effect on market price. Additional information on Port Authority debt obligations can be found in Note D - Outstanding Obligations and Financing of this report.
Other Activities
• TollschedulesforthePortAuthority’ssix(6)vehicularcrossingswereauthorizedandrevisedeffectiveSeptember18,2011.Thelastscheduledtoll increase for automobiles paying with cash increased from $14.00 to $15.00 in December 2015; the cash toll for truck classes 2-6 increased from $19.00 per axle to $21.00 per axle in December 2015; the cash toll for buses carrying 10 or more people increased from $23.00 to $24.00 in December 2015. Discounts are available for vehicles using the E-ZPass® electronic toll collection system and certain designated user programs.
• ThePATHbasefareschedulewasauthorizedandrevisedeffectiveSeptember18,2011.ThelastscheduledPATHbasefareforasingletripincreased from $2.50 per trip to $2.75 per trip on October 1, 2014. The cost of the multi-trip tickets and SmartLink passes were also increased at that time in a consistent manner with the base fare increase.
• OnMarch24,2016,theBoardauthorizedaMemorandumofUnderstandingwiththeUnitedStatesDepartmentofTransportation(USDOT),Amtrak and New Jersey Transit Corporation to set forth a framework for the parties’ activities, prior to the commencement of operations under a development corporation to advance the first phase of the Gateway Program – whose elements include the Gateway Tunnel Project, the construction of concrete casing on the West side of Manhattan leading to New York Pennsylvania Station to preserve the tunnel right-of-way and the replacement of the Sawtooth and Portal Bridges in New Jersey. The Board also authorized the Port Authority to enter into an agreement with Amtrak to reimburse Amtrak up to $35 million of preliminary engineering and planning costs incurred by Amtrak for design, development and construction of the Gateway Tunnel Project to advance environmental review and permitting for that project, as an element of the Gateway Program. The development of such information will assist the Port Authority to understand and evaluate the scope and elements of the Gateway Tunnel Project as part of the Gateway Program.
On October 20, 2016, in support of a portion of the funding of the Portal North Bridge project component of the Gateway Program, the Board authorized the Port Authority to enter into an agreement with Gateway Program Development Corporation (GPDC) that would provide for payment by the Port Authority to GPDC of amounts equal to the scheduled annual debt service, when due without acceleration, and any fees, costs, or expenses on $284 million of low-interest federal Railroad Rehabilitation and Improvement Financing (RRIF) or Transportation Infrastructure Finance and Innovation Act (TIFIA) loan or loans to be obtained by the GPDC.
Port Authority’s participation in the Gateway Program, is subject to approval by the Board of Commissioners, consistent with statutory, contractual and other commitments of the Port Authority, including agreements between the Port Authority and the holders of its obligations.
• OnDecember8,2016,theBoardofCommissionersapproveda2017budgetthatprovidesforcapitalandoperatingexpendituresduringcalendar year 2017 totaling $7.4 billion. To obtain a copy of the 2017 budget, please refer to the following link: http://corpinfo.panynj.gov/documents/2017-Budget-Book/
• OnFebruary16,2017,theBoardofCommissionersapprovedaten-yearcapitalplancovering2017-2026,totaling$32.2billion.Toobtainacopyof the capital plan, please refer to the following link: http://corpinfo.panynj.gov/documents/Capital-Plan-2017-2026/
Management’s Discussion and Analysis (Unaudited)(continued)

76 THE PORT AUTHORITY OF NY & NJ
december 31, 2016 December 31, 2015
(In thousands)
AsseTscurrent assets: Cash $ 390,809 $ 1,171,781 Restricted cash 342,262 171,286 Investments 1,231,303 1,766,989 Restricted investments - PFC 72,275 — Current receivables, net 460,145 468,707 Other current assets 116,955 127,193 Restricted receivables and other assets 69,559 73,106
Total current assets 2,683,308 3,779,062
Noncurrent assets: Restricted cash 4,964 4,631 Investments 3,245,288 3,252,429 Restricted investments - PAICE 220,462 184,633 Other amounts receivable, net 62,089 52,474 Other noncurrent assets 1,510,086 1,439,303 Restricted noncurrent assets - PAICE 1,932 4,649 Amounts receivable - Special Project Bonds 1,376,882 1,435,940 Amounts receivable - Tower 4 Liberty Bonds 1,246,861 1,247,473 Unamortized costs for regional programs 216,109 280,874 Facilities, net 34,693,691 32,666,774
Total noncurrent assets 42,578,364 40,569,180
Total assets 45,261,672 44,348,242
deferred ouTflows of resources Loss on debt refundings 79,046 97,337 Pension related amounts 555,794 155,259
Total deferred outflows of resources 634,840 252,596
liABiliTies current liabilities: Accounts payable 1,072,412 1,071,047 Accrued interest and other current liabilities 539,966 542,700 Restricted other liabilities - PAICE 12,492 9,446 Accrued payroll and other employee benefits 527,897 436,576 Current portion bonds and other asset financing obligations 1,240,142 1,486,572
Total current liabilities 3,392,909 3,546,341
Noncurrent liabilities: Accrued pension and other postemployment employee benefits 533,835 229,892 Other noncurrent liabilities 307,642 293,645 Unearned income related to WTC Retail Joint Venture 773,998 704,697 Restricted other noncurrent liabilities - PAICE 49,171 50,383 Amounts payable - Special Project Bonds 1,376,882 1,435,940 Amounts payable - Tower 4 Liberty Bonds 1,246,861 1,247,473 Bonds and other asset financing obligations 21,533,071 21,533,822
Total noncurrent liabilities 25,821,460 25,495,852
Total liabilities 29,214,369 29,042,193
deferred iNflows of resources Gain on debt refundings 30,407 21,527 Pension related amounts 76,842 7,555
Total deferred inflows of resources 107,249 29,082
NeT PosiTioN $ 16,574,894 $ 15,529,563
Net position is comprised of: Net investment in capital assets $ 12,746,144 $ 11,810,573 Restricted: Passenger Facility Charges 204,053 168,801 Port Authority Insurance Captive Entity, LLC 263,390 187,628 Minority Interest in Tower 1 Joint Venture 100,000 100,000 Unrestricted 3,261,307 3,262,561
NeT PosiTioN $ 16,574,894 $ 15,529,563
Consolidated Statements of Net Position
see Notes to consolidated financial statements
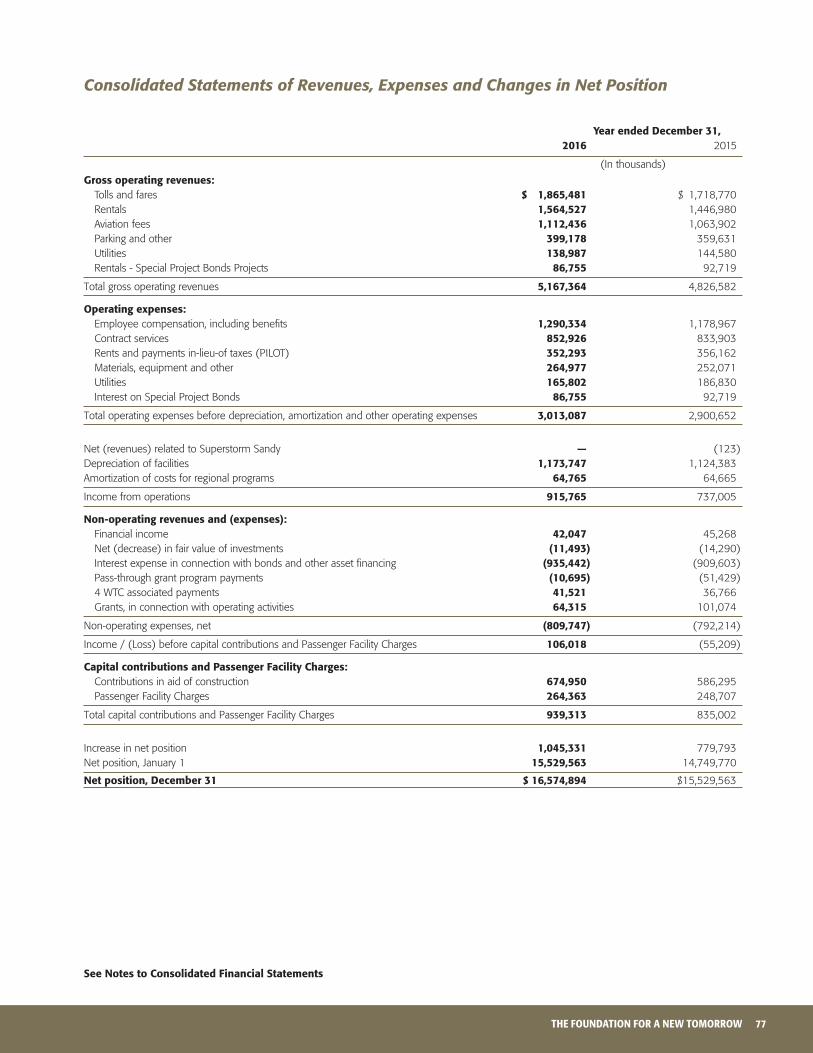
77THE FOUNDATION FOR A NEW TOMORROW
year ended december 31, 2016 2015
(In thousands)
gross operating revenues:: Tolls and fares $ 1,865,481 $ 1,718,770 Rentals 1,564,527 1,446,980 Aviation fees 1,112,436 1,063,902 Parking and other 399,178 359,631 Utilities 138,987 144,580 Rentals - Special Project Bonds Projects 86,755 92,719
Total gross operating revenues 5,167,364 4,826,582
operating expenses: Employee compensation, including benefits 1,290,334 1,178,967 Contract services 852,926 833,903 Rents and payments in-lieu-of taxes (PILOT) 352,293 356,162 Materials, equipment and other 264,977 252,071 Utilities 165,802 186,830 Interest on Special Project Bonds 86,755 92,719
Total operating expenses before depreciation, amortization and other operating expenses 3,013,087 2,900,652
Net (revenues) related to Superstorm Sandy — (123)Depreciation of facilities 1,173,747 1,124,383 Amortization of costs for regional programs 64,765 64,665
Income from operations 915,765 737,005
Non-operating revenues and (expenses): Financial income 42,047 45,268 Net (decrease) in fair value of investments (11,493) (14,290) Interest expense in connection with bonds and other asset financing (935,442) (909,603) Pass-through grant program payments (10,695) (51,429) 4 WTC associated payments 41,521 36,766 Grants, in connection with operating activities 64,315 101,074
Non-operating expenses, net (809,747) (792,214)
Income / (Loss) before capital contributions and Passenger Facility Charges 106,018 (55,209)
capital contributions and Passenger facility charges: Contributions in aid of construction 674,950 586,295 Passenger Facility Charges 264,363 248,707
Total capital contributions and Passenger Facility Charges 939,313 835,002
Increase in net position 1,045,331 779,793 Net position, January 1 15,529,563 14,749,770
Net position, december 31 $ 16,574,894 $15,529,563
Consolidated Statements of Revenues, Expenses and Changes in Net Position
see Notes to consolidated financial statements
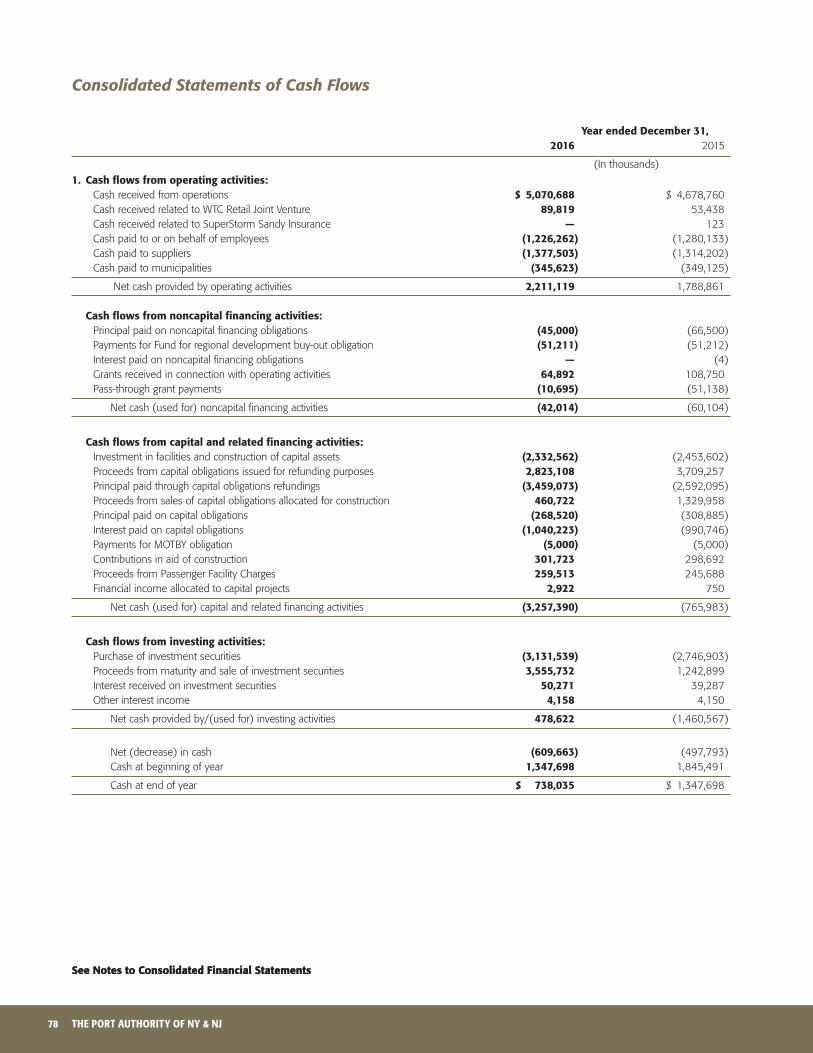
78 THE PORT AUTHORITY OF NY & NJ
year ended december 31, 2016 2015
(In thousands)
1. cash flows from operating activities: Cash received from operations $ 5,070,688 $ 4,678,760 Cash received related to WTC Retail Joint Venture 89,819 53,438 Cash received related to SuperStorm Sandy Insurance — 123 Cash paid to or on behalf of employees (1,226,262) (1,280,133) Cash paid to suppliers (1,377,503) (1,314,202) Cash paid to municipalities (345,623) (349,125)
Net cash provided by operating activities 2,211,119 1,788,861
cash flows from noncapital financing activities: Principal paid on noncapital financing obligations (45,000) (66,500) Payments for Fund for regional development buy-out obligation (51,211) (51,212) Interest paid on noncapital financing obligations — (4) Grants received in connection with operating activities 64,892 108,750 Pass-through grant payments (10,695) (51,138)
Net cash (used for) noncapital financing activities (42,014) (60,104)
cash flows from capital and related financing activities: Investment in facilities and construction of capital assets (2,332,562) (2,453,602) Proceeds from capital obligations issued for refunding purposes 2,823,108 3,709,257 Principal paid through capital obligations refundings (3,459,073) (2,592,095) Proceeds from sales of capital obligations allocated for construction 460,722 1,329,958 Principal paid on capital obligations (268,520) (308,885) Interest paid on capital obligations (1,040,223) (990,746) Payments for MOTBY obligation (5,000) (5,000) Contributions in aid of construction 301,723 298,692 Proceeds from Passenger Facility Charges 259,513 245,688 Financial income allocated to capital projects 2,922 750
Net cash (used for) capital and related financing activities (3,257,390) (765,983)
cash flows from investing activities: Purchase of investment securities (3,131,539) (2,746,903) Proceeds from maturity and sale of investment securities 3,555,732 1,242,899 Interest received on investment securities 50,271 39,287 Other interest income 4,158 4,150
Net cash provided by/(used for) investing activities 478,622 (1,460,567)
Net (decrease) in cash (609,663) (497,793) Cash at beginning of year 1,347,698 1,845,491
Cash at end of year $ 738,035 $ 1,347,698
Consolidated Statements of Cash Flows
see Notes to consolidated financial statementssee Notes to consolidated financial statements

79THE FOUNDATION FOR A NEW TOMORROW
year ended december 31, 2016 2015
(In thousands)
2. reconciliation of income from operations to net cash provided by operating activities:
Income from operations $ 915,765 $ 737,005
Adjustments to reconcile income from operations to net cash provided by operating activities: Depreciation of facilities 1,173,747 1,124,383 Amortization of costs for regional programs 64,765 64,665 Amortization of other assets 60,460 47,684
Change in operating assets and operating liabilities: Decrease/ (increase) in receivables 11,163 (57,303) (Increase) in other assets (132,560) (61,813) Increase/(decrease) in payables 25,190 (33,554) (Decrease) in other liabilities (40,728) (21,002) Increase in unearned income related to WTC Retail Joint Venture 69,301 59,213 Increase/(decrease) in accrued payroll, pension and other employee benefits 64,016 (70,417)
Total adjustments 1,295,354 1,051,856
Net cash provided by operating activities $ 2,211,119 $ 1,788,861
3. capital obligations:
Consolidated bonds and notes, commercial paper, variable rate master notes and Marine Ocean Terminal at Bayonne Peninsula Obligation (MOTBY).
4. Noncash investing, capital and financing activities:
Noncash activity of $122 million in 2016 and $151 million in 2015 includes amortization of discount and premium on outstanding debt obligations and debt service in connection with Special Project Bonds.
Noncash capital financing did not include any activities that required a change in fair value. In 2016 and 2015, the Silverstein net lessees contributed $381 million and $314 million, respectively, towards construction of WTC Tower 3. In 2016 and 2015, preferred returns due to the Tower 1 Joint Venture, Durst Member and the WTC Retail Joint Venture, Westfield member totaled ($48) million and ($27.5) million, respectively. As of December 31, 2016, the Goethals Bridge Replacement Developer Financing Arrangement totaled $744 million, including accrued amounts of $314 million in 2016 and $221 million in 2015.
Noncash capital asset write-offs totaled $18.8 million in 2016 and $5.5 million in 2015.
Consolidated Statements of Cash Flows(continued)
see Notes to consolidated financial statements

80 THE PORT AUTHORITY OF NY & NJ
Note A – Nature of the organization
and summary of significant Accounting Policies
1. reporting entity
a. The Port Authority of New York and New Jersey was created in 1921 by Compact between the States of New York and New Jersey with the consent of the United States Congress. The Compact envisions the Port Authority as being financially self-sustaining. As such, the agency must raise the funds necessary for the improvement, construction or acquisition of its facilities and their operation generally upon the basis of its own credit. Cash derived from Port Authority operations and other cash received may be disbursed only for specific purposes in accordance with provisions of various statutes and agreements with holders of its obligations and others. The costs of providing facilities and services to the general public on a continuing basis are recovered primarily from operating revenue sources, including rentals, tolls, fares, aviation and port fees, and other charges.
b. The Governor of each State, with the consent of the respective State Senate, appoints six of the twelve members of the governing Board of Commissioners. The Commissioners serve without remuneration for six-year overlapping terms. Meetings of the Commissioners of the Port Authority are open to the public in accordance with policies adopted by the Commissioners. The actions taken by the Commissioners at Port Authority meetings are subject to gubernatorial review and may be vetoed by the Governor of their respective State. In accordance with Governmental Accounting Standards Board Statement No. 14, “The Financial Reporting Entity”, for financial reporting purposes The Port Authority of New York and New Jersey is a joint venture between the States of New York and New Jersey.
c. The Audit Committee, which consists of four members of the Board of Commissioners other than the Chairman and Vice Chairman of the Port Authority, provides oversight of the quality and integrity of the Port Authority’s framework of internal controls, compliance systems and the accounting, auditing and financial reporting processes. The Audit Committee retains independent auditors and reviews their performance and independence. The independent auditors are required to provide written disclosure of, and discuss with the Committee, any significant relationships or issues that would have a bearing on their independence. The Audit Committee meets directly, on a regular basis, with the independent auditors, a law firm retained to address certain Audit Committee matters, and management of the Port Authority. On May 26, 2016, the Audit Committee retained KPMG LLP as independent auditors to perform the independent audit of the Port Authority’s consolidated financial statements for the year ending December 31, 2016.
d. The consolidated financial statements and schedules include the accounts of The Port Authority of New York and New Jersey and its component units including:
establishment or Port Authority Blended component units* Acquisition date
Port Authority Trans-Hudson Corporation May 10, 1962Newark Legal and Communications Center Urban Renewal Corporation May 12, 1988New York and New Jersey Railroad Corporation April 30, 1998WTC Retail LLC November 20, 2003Port District Capital Projects LLC July 28, 2005Tower 5 LLC (formerly known as 1 WTC LLC) September 21, 2006Port Authority Insurance Captive Entity, LLC October 16, 2006New York New Jersey Rail, LLC September 18, 2008Tower 1 Member LLC April 19, 2011Tower 1 Joint Venture LLC April 19, 2011Tower 1 Holdings LLC April 19, 2011WTC Tower 1 LLC April 19, 2011PA Retail Newco LLC May 7, 2012Tower 1 Rooftop Holdings LLC June 8, 2012
* The blended component units listed above are included as part of the Port Authority’s reporting entity because (a) the Port Authority’s Board of Commissioners serves as the overall governing body of these related entities and (b) there is a financial benefit or burden relationship between the Port Authority and the respective component unit listed above.
Notes to Consolidated Financial Statements
81THE FOUNDATION FOR A NEW TOMORROW
2. Basis of Accounting
a. The Port Authority’s activities are accounted for using the flow of economic resources measurement focus and the accrual basis of accounting. All assets, deferred outflows of resources, liabilities, deferred inflows of resources, and net position, including revenues and expenses, are accounted for in an enterprise fund with revenues recorded when earned and expenses recorded at the time liabilities are incurred.
b. The Port Authority follows accounting principles generally accepted in the United States of America as prescribed by the Governmental Accounting Standards Board (GASB).
3. significant Accounting Policies
a. Facilities, net are carried at cost. The cost of facilities includes interest incurred during the period that relates to the construction or production of the capital asset. The amount of capitalized interest is calculated by offsetting interest expense incurred with financial income earned on invested debt proceeds, from the date of the borrowing until the project is ready for its intended use. Generally, projects in excess of $100,000 for additions, asset replacements and/or asset improvements that benefit future periods or are expected to prolong the service life of the asset are capitalized (See Note B – Facilities, Net). Facilities, net does not include regional programs undertaken at the request of the Governor of the State of New Jersey or the Governor of the State of New York (See Note H – Regional Facilities and Programs).
b. Depreciation of facilities is computed using the straight-line method during the estimated useful lives of the related assets (See Note B – Facilities, Net). Estimated useful lives are reviewed periodically for each type of asset class. Asset lives used in the calculation of depreciation are generally as follows:
> Buildings, bridges, tunnels and other structures 25 to 100 years > Machinery and equipment 5 to 35 years > Runways, roadways and other paving 7 to 40 years > Utility infrastructure 10 to 100 years
Assets at facilities leased by the Port Authority from others are depreciated over the lesser of, the remaining term of the facility lease or the estimated useful life of the asset stated above.
Costs of regional facilities and programs are amortized on a straight-line basis over the period benefited up to a maximum of 15 years (See Note H – Regional Facilities and Programs).
Costs related to the purchase of ancillary equipment, including operating and maintenance vehicles and corporate information technology, which provide benefits for periods exceeding one year are reported as a component of Other noncurrent assets and amortized over the period benefited, generally 3 to 15 years depending on the type of equipment.
c. Cash consists of cash on hand and short term cash equivalents. Cash equivalents are made up of negotiable order of withdrawal (NOW) accounts, collateralized time deposits, and money market accounts.
d. Restricted cash and investments are primarily comprised of PFCs, cash restricted for use by the Port Authority Insurance Captive Entity, LLC (PAICE), and insurance proceeds that are restricted to business interruption and redevelopment expenditures.
e. Net position is displayed in three components as follows:
> Net investment in capital assets consists of capital assets, net of accumulated depreciation, less the outstanding balances related to payables, bonds, notes, or other liabilities that are attributable to the acquisition, construction, or improvement of those assets.
> Restricted consists of net resources that are legally restricted by outside parties or by law through constitutional provisions or enabling legislation. When both restricted and unrestricted resources are available for use, generally it is the Port Authority’s policy to use restricted resources first.
> Unrestricted consists of net resources that do not meet the definition of Restricted or Net investment in capital assets.
f. Statutorily mandated reserves held by PAICE are restricted for purposes of insuring certain risk exposures.
g. Inventories are valued using an average cost method, which prices items on the basis of the average cost of all similar goods remaining in stock. Inventory is reported as a component of Other noncurrent assets on the Consolidated Statements of Net Position.
h. Operating revenues are derived principally from rentals, tolls, fares, aviation and port fees, and other charges for the use of, and privileges at Port Authority facilities. Operating expenses include those costs incurred for the operation, maintenance and security of Port Authority facilities. All other revenues, including financial income, PFCs, contributions in aid of construction, grants in connection with operating activities, insurance proceeds and gains resulting from the disposition of assets, if any, are reported as non-operating revenues, and all other expenses, such as interest expense, losses resulting from the disposition of assets, and pass-through grant program payment costs are reported as non-operating expenses.
Notes to Consolidated Financial Statements(continued)

82 THE PORT AUTHORITY OF NY & NJ
i. Amounts attributable to the collection and investment of PFCs are restricted and can only be used for Federal Aviation Administration (FAA) approved airport-related projects. Revenues derived from the collection of PFCs, net of the air carriers’ handling charges, are recognized as capital contributions when the passenger activity occurs and the fees are due from the air carriers. Capital investment funded by PFCs is reflected as a component of Facilities, net.
j. Required capital contributions due the Port Authority from the WTC Tower 2, 3 and 4 net lessees related to the replacement of the net leased premises destroyed on September 11, 2001, which are owned by the Port Authority, are recognized as a component of Facilities, net on the Consolidated Statements of Net Position and as Contributions in aid of construction on the Consolidated Statements of Revenues, Expenses and Changes in Net Position as the construction occurs. Subsequent to becoming ready for their intended use, World Trade Center Towers 2, 3 and 4 will be depreciated over their estimated useful life. World Trade Center Tower 4 was placed into service in November 2014.
k. All Port Authority investment values that are affected by interest rate changes have been reported at their fair value, using published market prices. The Port Authority uses a variety of financial instruments to assist in the management of its financing and investment objectives, and may also employ hedging strategies to minimize interest rate risk. The Port Authority may enter into various derivative instruments, including options on United States Treasury securities, repurchase and reverse repurchase (yield maintenance) agreements, United States Treasury and municipal bond futures contracts (See Note C – Cash and Investments).
l. In accordance with GASB Statement No. 23, “Accounting and Financial Reporting for Refundings of Debt Reporting by Proprietary Activities,” when issuing new debt for refunding purposes, the difference between the reacquisition price and the net carrying amount of the refunded debt is recognized as either a deferred outflow of resources or deferred inflow of resources and amortized using the straight-line method as a component of interest expense over the remaining life of the old debt or the life of the new debt, whichever is shorter.
m. Bond premiums received or discounts provided at issuance are deferred and amortized on a straight-line basis as a component of net interest expense (Interest expense less financial income) over the term of the bond as this approximates the effective interest of the bond issuance. Unamortized amounts are presented as either a reduction of (discounts) or additions to (premiums) the face value of the bond payable.
n. The preparation of the consolidated financial statements in conformity with accounting principles generally accepted in the United States of America requires management, where necessary, to make estimates and assumptions that affect the amounts reported in the consolidated financial statements and accompanying notes. Such estimates and assumptions are subject to various uncertainties, the occurrence of which may cause differences between those estimates and assumptions and actual results.
o. For presentation purposes, certain amounts in the fiscal year 2015 financial statements have been reclassified to conform to the fiscal year 2016 financial statements herein. These reclassifications have no impact on the overall change in net position or cash flows.
p. In February 2015, GASB issued Statement No. 72, “Fair Value Measurement and Application.” The requirements of GASB Statement No. 72 are effective for financial statements for periods beginning after June 15, 2015. The objective of this Statement is to improve financial reporting by clarifying the definition of fair value for financial reporting purposes, establishing general principles for measuring fair value, providing additional fair value application guidance and enhancing disclosures about fair value measurements. Adoption of this statement resulted in additional disclosures contained in Note C- Cash and Investments.
4. reconciliation of the consolidated financial statements Prepared in Accordance with Accounting Principles generally Accepted in the united states of America to schedules Prepared Pursuant to Port Authority Bond resolutions
Schedules A, B, C and D-2 which follow the Required Supplementary Information section of this report, have been prepared in accordance with Port Authority bond resolutions which differ in some respects from accounting principles that are generally accepted in the United States of America, as follows:
a. Revenues and expenses of facilities are accounted for in the operating fund. The financial resources received and expended for the construction or acquisition of major facilities or improvements are accounted for in the capital fund. Transactions involving the application of net revenues are accounted for in the reserve funds.
b. Port Authority bond resolutions provide that net operating revenues shall not include an allowance for depreciation on facilities other than depreciation of ancillary equipment. Thus, depreciation is not a significant factor in determining the net revenues and reserves of the Port Authority or their application as provided for in the Port Authority’s bond resolutions. Instead, capital expenditures are provided for through deductions from net revenues or reserves in amounts equal to principal payments on debt outstanding or through the application of reserves for the purposes of direct capital investment in facilities. These amounts are credited at par to Facility infrastructure investment in the capital fund on Schedule B – Assets and Liabilities.
c. Debt service in connection with operating asset obligations is paid from the same revenues and in the same manner as operating expenses of the Port Authority.
Notes to Consolidated Financial Statements(continued)

83THE FOUNDATION FOR A NEW TOMORROW
d. Capital costs for regional facilities and programs are included in Invested in facilities in accordance with Port Authority bond resolutions.
e. Consolidated bonds and notes are recorded as outstanding at their par value commencing on the date that the Port Authority is contractually obligated to issue and sell such obligations.
f. To reflect the cumulative amount invested by the Port Authority since 1921 in connection with its facilities, the historical cost of capital assets removed from service due to retirement is not deducted from Invested in facilities. However, if a capital asset is sold, the proceeds received from the sale are deposited in the capital fund for purposes of funding future capital investment or to retire existing debt obligations and deducted from cumulative Invested in facilities at the time of the sale.
g. Contributed capital amounts resulting from non-exchange transactions, including contributions in aid of construction where the Port Authority does not receive a cash reimbursement for prior cash outlays, are included in Invested in facilities, and credited to Facility Infrastructure Investment in the Capital Fund.
h. Amounts attributable to the collection and investment of PFCs are restricted and can only be used for Federal Aviation Administration (FAA) approved airport-related projects. Revenues derived from the collection and investment of PFCs, net of the air carriers’ handling charges, are initially deferred as Unapplied Passenger Facility Charges on Schedule B – Assets and Liabilities and applied as revenue on Schedule A – Revenues and Reserves after the payment for the capital investment occurs. Capital investment funded by PFCs is reflected as a component of Invested in facilities.
i. Amounts received in connection with the March 18, 2014 transfer of the Port Authority’s interests in the WTC Retail Joint Venture to Westfield are recognized as revenue in their entirety when they are received, and are recorded on that basis on Schedule A – Revenues and Reserves.
j. The cumulative impact of adopting a new accounting standard, which necessitates the restatement of a prior year’s beginning or ending Net position is recognized as either an increase or decrease to the operating fund’s Net position.
k. In accordance with Port Authority bond resolutions, operating expenses provide for contingencies related to future operating and maintenance expenses.
A reconciliation of the Consolidated Statements of Net Position to Schedule B and the Consolidated Statements of Revenues, Expenses and Changes in Net Position to Schedule A follows:
Consolidated Statements of Net Position to Schedule B – Assets and Liabilities
december 31, 2016 December 31, 2015
(In thousands)
Net position reported on Consolidated Statements of Net Position $ 16,574,894 $ 15,529,563
Add: Accumulated depreciation of facilities 15,143,016 14,011,193 Accumulated retirements and gains and losses on disposition of assets 2,462,021 2,420,096 Application of WTC Retail Joint Venture Payments 796,936 719,067 Cumulative amortization of costs for regional programs 1,320,135 1,255,370 Cumulative unamortized discount and premium 816,131 701,234
subtotal 20,538,239 19,106,960
Less: Deferred income – PFCs 204,053 168,801 Income related to WTC Retail Joint Venture 22,938 14,370 Operating and maintenance contingencies 50,000 50,000
subtotal 276,991 233,171
Total $36,836,142 $34,403,352
Net position reported on Schedule B - Assets and Liabilities (pursuant to Port Authority bond resolutions) $ 36,836,142 $ 34,403,352
Notes to Consolidated Financial Statements(continued)

84 THE PORT AUTHORITY OF NY & NJ
Consolidated Statements of Revenues, Expenses and Changes in Net Position to Schedule A – Revenues and Reserves
year ended december 31, 2016 2015
(In thousands)
Increase in Net Position reported on Consolidated Statementsof Revenues, Expenses and Changes in Net Position $ 1,045,331 $ 779,793
Add: Depreciation of facilities 1,173,747 1,124,383 Application of PFCs 229,921 273,721 Amortization of costs for regional programs 64,765 64,665 Amortization of discount and premium (24,181) (15,363) Application of WTC Retail Joint Venture Payments 77,869 66,963
subtotal 1,522,121 1,514,369
Less: Debt maturities and retirements 268,520 259,315 Repayment of asset financing obligations (6,669) 51,928 WTC Towers 2,3,4 Net Lessee capital contributions 381,181 313,960 Direct investment in facilities 1,132,915 1,949,785 Operating and maintenance contingencies — 50,000 Collection of Passenger Facility Charges 264,363 248,707 Income related to WTC Retail Joint Venture 8,568 7,751 PFC interest income/fair value adjustment 774 136
subtotal 2,049,652 2,881,582
Total $ 517,800 $ (587,420)
Increase/(Decrease) in Reserves reported on Schedule A – Revenues and Reserves (pursuant to Port Authority Bond Resolutions) $ 517,800 $ (587,420)
Notes to Consolidated Financial Statements(continued)

85THE FOUNDATION FOR A NEW TOMORROW
Note B – facilities, net
1. facilities, net is comprised of the following:
Transfers to Beginning completed retirements/ end of year Additions construction depreciation dispositions of year
2016 (In thousands)
capital assets not being depreciated: Land $ 1,227,334 $ — $ 146,451 $ — $ — $ 1,373,785 Construction in progress* 8,767,406 3,200,664 (2,998,634) — — 8,969,436
Total capital assets not being depreciated 9,994,740 3,200,664 (2,852,183) — — 10,343,221
depreciable capital assets: Buildings, bridges, tunnels, other structures 16,483,447 — 1 ,534,157 — (27,512) 17,990,092 Machinery and equipment 9,386,919 — 410,888 — (12,997) 9,784,810 Runways, roadways and other paving 5,510,019 — 360,286 — (1,089) 5,869,216 Utility infrastructure 5,302,842 — 546,852 — (326) 5,849,368
Total other capital assets being depreciated 36,683,227 — 2 ,852,183 — (41,924) 39,493,486
Accumulated depreciation: Buildings, bridges, tunnels, other structures (4,474,711) — — (402,693) 27,512 (4,849,892) Machinery and equipment (4,274,159) — — (340,377) 12,997 (4,601,539) Runways, roadways and other paving (3,047,766) — — (223,789) 1,089 (3,270,466) Utility infrastructure (2,214,557) — — (206,888) 326 (2,421,119)
Total accumulated depreciation (14,011,193) — — (1,173,747) 41,924 (15,143,016)
facilities, net $ 32,666,774 $ 3,200,664 $ — $ (1,173,747) $ — $ 34,693,691
Transfers to Beginning completed retirements/ end of year Additions construction depreciation dispositions of year
2015 (In thousands)
capital assets not being depreciated: Land $ 1,197,870 $ — $ 29,464 $ — $ — $ 1,227,334 Construction in progress* 9,166,654 3,017,682 (3,416,930) — — 8,767,406
Total capital assets not being depreciated 10,364,524 3,017,682 (3,387,466) — — 9,994,740
depreciable capital assets: Buildings, bridges, tunnels, other structures 14,523,072 — 1 ,970,158 — (9,783) 16,483,447 Machinery and equipment 9,031,912 — 600,533 — (245,526) 9,386,919 Runways, roadways and other paving 5,072,469 — 441,402 — (3,852) 5,510,019 Utility infrastructure 4,954,836 — 375,373 — (27,367) 5,302,842
Total other capital assets being depreciated 33,582,289 — 3,387,466 — (286,528) 36,683,227
Accumulated depreciation: Buildings, bridges, tunnels, other structures (4,116,014) — — (368,480) 9,783 (4,474,711) Machinery and equipment (4,170,899) — — (348,786) 245,526 (4,274,159) Runways, roadways and other paving (2,841,193) — — (210,425) 3,852 (3,047,766) Utility infrastructure (2,045,232) — — (196,692) 27,367 (2,214,557)
Total accumulated depreciation (13,173,338) — — (1,124,383) 286,528 (14,011,193)
facilities, net $ 30,773,475 $ 3,017,682 $ – $ (1,124,383) $ — $ 32,666,774
* Construction in progress additions include the impact of capital write-offs totaling $19 million in 2016 and $5 million in 2015.1. Net interest expense added to the cost of facilities was $173 million in 2016 and $163 million in 2015. 2. Projects that have been suspended pending determination of their continued viability totaled $43.5 million in 2016 and $61.6 million in 2015.3. The impact on accelerated depreciation for buildings, bridges, tunnels, and other structures was $20.6 million in 2016 and $18.6 million in 2015.4. Retirements and Dispositions include the carrying value associated with the sale of capital assets.
Notes to Consolidated Financial Statements(continued)

86 THE PORT AUTHORITY OF NY & NJ
Note c – cash and investments
1. The components of cash and investments are:
December 31,
cAsh 2016 2015
(In thousands)
Cash on hand $ 1,624 $ 1,127Cash equivalents 736,411 1,346,571
Total cash 738,035 1,347,698Less restricted cash 347,226 175,917
Unrestricted cash $ 390,809 $ 1,171,781
December 31,
iNVesTmeNTs, AT FAIR VALUE 2016 2015
(In thousands) fair Value Port hierarchy levels* Authority PAice Total Total
United States Treasury notes level 1 $ 3,318,934 $ 43,237 $ 3,362,171 $ 3,975,409United States Treasury bonds level 1 — — — 12,878United States Treasury bills level 1 404,002 — 404,002 140,022United States government agency obligations level 2 36,286 25,237 61,523 41,921United States Treasury obligations held pursuant to repurchase agreements** — 677,014 — 677,014 891,267JFK International Air Terminal LLC obligations (JFKIAT)** — 71,746 — 71,746 79,718Other governmental obligations level 2 31,286 — 31,286 33,958Corporate bonds level 2 — 150,701 150,701 18,315Accrued interest receivable 9,598 1,287 10,885 10,563
Total investments 4,548,866 220,462 4,769,328 5,204,051 Less current investments*** 1,303,578 — 1,303,578 1,766,989
Noncurrent investments $ 3,245,288 $ 220,462 $ 3,465,750 $ 3,437,062
* Level 1 inputs are quoted (unadjusted) prices in active markets for identical assets that the government can access at the measurement date. Observable markets include exchange markets, dealer markets, brokered markets and principal-to-principal markets.
Level 2 inputs are inputs other than quoted prices included within Level 1 that are observable for the asset, either directly or indirectly. These inputs are derived from or corroborated by observable market data through correlation.
Level 3 inputs are unobservable inputs for the asset; they should be used only when relevant Level 1 and Level 2 inputs are unavailable. Port Authority investments are valued at the closing price or last trade reported on the major market exchange on which the individual securities are traded.** Investments are valued at unamortized cost.*** Includes PFC restricted investments of $72 million.
2. Port Authority policy provides for funds of the Port Authority to be deposited in banks with offices located in the Port District, provided that the total funds on deposit in any bank do not exceed 50% of the bank’s combined capital and permanent surplus. These funds must be fully secured by deposit of collateral having a minimum market value of 110% of actual daily balances in excess of that part of the deposits secured through the Federal Deposit Insurance Corporation (FDIC) and New Jersey Governmental Unit Deposit Protection Act (GUDPA). The collateral must consist of obligations of the United States of America, the Port Authority, the State of New York or the State of New Jersey held in custodial bank accounts in banks in the Port District having combined capital and surplus in excess of $1 million.
Total actual bank balances excluding amounts held by third party trustees were $660.4 million at December 31, 2016. Of that amount, $2.7 million was secured through the basic FDIC deposit insurance and/or pursuant to the GUDPA. The balance of $657.7 million was fully collateralized with collateral held by a third party custodian acting as the Port Authority’s agent and held by such custodian in the Port Authority’s name.
Notes to Consolidated Financial Statements(continued)

87THE FOUNDATION FOR A NEW TOMORROW
3. The investment policies of the Port Authority are established in conformity with its agreements with the holders of its obligations, generally through resolutions of the Board of Commissioners or its Committee on Finance. For the Port Authority, but not necessarily its component units, individual investment transactions are executed with recognized and established securities dealers and commercial banks. Investment securities are maintained, in the Port Authority’s name, by a third-party financial institution acting as the Port Authority’s agent. Securities transactions are conducted in the open market at competitive prices. Transactions are completed when the Port Authority’s securities custodian, in the Port Authority’s name, makes or receives payment upon receipt of confirmation that the securities have been transferred at the Federal Reserve Bank of New York or other repository in accordance with the Port Authority’s instructions. The notable exception is the execution of Tri-Party Repurchase agreements. These transactions are completed when the Tri-Party custodian posts collateral to the Port Authority’s account in exchange for investment funds.
Proceeds received in connection with consolidated bonds and other asset financing obligation issuances may be invested, on an interim basis, in conformance with applicable Federal laws and regulations, in obligations of (or fully guaranteed by) the United States of America (including such securities held pursuant to repurchase agreements) and collateralized time deposit accounts.
Consolidated Bond Reserve Fund and General Reserve Fund amounts may be invested in obligations of (or fully guaranteed by) the United States of America. Additionally, amounts in the Consolidated Bond Reserve Fund and the General Reserve Fund (subject to certain limitations) may be invested in obligations of the State of New York or the State of New Jersey, collateralized time accounts, and Port Authority bonds actually issued and secured by a pledge of the General Reserve Fund.
Operating funds may be invested in various items including (a) direct obligations of the United States of America, obligations of United States government agencies, and sponsored enterprises that have the highest short-term ratings by two nationally recognized firms; (b) investment grade negotiable certificates of deposit and negotiable Bankers’ Acceptances with banks having AA or better long-term debt rating, premier status and with issues actively traded in secondary markets; (c) commercial paper having only the highest short-term ratings separately issued by two nationally recognized rating agencies; (d) United States Treasury and municipal bond futures contracts; (e) certain interest rate exchange contracts with banks and investment firms; (f) certain interest rate options contracts that are limited to $50 million of underlying securities with a maturity of no greater than five years with primary dealers in United States Treasury securities; and (g) certain unrated obligations of JFKIAT LLC (comprising approximately 1.5% of total Port Authority investments at December 31, 2016) for certain costs attributable to the construction of Terminal 4 (JFKIAT) completed in 2001. The Board has from time to time authorized other investments of operating funds.
It is the general policy of the Port Authority to limit exposure to declines in fair market values by limiting the weighted average maturity of the investment portfolio to less than two years. Extending the weighted average maturity beyond two years requires explicit written approval of the Chief Financial Officer. Committee on Finance authorization is required to extend the weighted average maturity beyond five years.
The fair value and weighted average maturity of investments held by the Port Authority, excluding PAICE, at December 31, 2016, follows:
weighted Average Port Authority investment Type fair Value maturity
(In thousands) (In days)
United States Treasury notes $ 3,318,934 479United States Treasury bills 404,002 50United States government agency obligations 36,286 21United States REPO 677,014 5JFKIAT obligations 71,746 3,273Other government obligations 31,286 205
Total fair value of investments* $ 4,539,268Investments weighted average maturity 409
*Excludes accrued interest receivable amounts of $9.6 million.
The Port Authority has, from time to time, entered into reverse repurchase (yield maintenance) agreements under which the Port Authority contracted to sell a specified United States Treasury security to a counterparty and simultaneously agreed to purchase it back from that party at a predetermined price and future date. All reverse repurchase agreements sold are matched to repurchase agreements (REPO) bought, thereby minimizing market risk. The credit risk is managed by a daily evaluation of the market value of the underlying securities and periodic cash adjustments, as necessary, in accordance with the terms of the repurchase agreements. There were no investments in reverse repurchase agreements at December 31, 2016 and 2015, respectively.
Notes to Consolidated Financial Statements(continued)

88 THE PORT AUTHORITY OF NY & NJ
4. The investment policies of PAICE have been established and approved by the PAICE Board of Directors, which is comprised of Port Authority executive staff. Consistent with the Port Authority Board of Commissioners’ authorization with respect to the establishment of PAICE as a wholly owned entity of the Port Authority, PAICE provides the Port Authority Board of Commissioners’ Committee on Finance with periodic updates on PAICE’s investment activities.
Under PAICE’s investment policies, eligible investments include money market demand accounts of commercial banks, not to exceed bank deposit insurance limits, and/or taxable or tax-exempt money market mutual funds that offer daily purchase and redemption while maintaining a constant share price and whose fund assets are primarily United States Treasury notes and bonds and whose assets are at least $500 million. Other investments include: United States Treasury securities and United States government agency obligations, AAA rated tax-exempt general obligation issues of states, and U.S. dollar denominated corporate debt rated AA or above.
The fair value and weighted average maturity of investments held by PAICE at December 31, 2016, follows:
weighted Average PAice investment Type fair Value maturity
(In thousands) (In days)
United States Treasury notes $ 43,237 1,038United States government agency obligations 25,237 628Corporate bonds 150,701 1,096
Total fair value of investments* $ 219,175Investments weighted average maturity 1,031
* Excludes accrued interest receivable amounts of $1.3 million.
Note d – outstanding obligations and financing
Outstanding bonds and other asset financing obligations
december 31, 2016 current Noncurrent Total
(In thousands)
A. Consolidated Bonds and Notes $ 734,670 $ 20,551,202 $ 21,285,872B. Commercial Paper Obligations 388,315 — 388,315C. Variable Rate Master Notes 77,900 — 77,900D. Port Authority Equipment Notes – — —E. Fund for Regional Development Buy-Out Obligation 37,162 184,231 221,393F. MOTBY Obligation 2,095 53,237 55,332G. Tower 4 Liberty Bonds — 1,246,861 1,246,861H. Goethals Bridge Replacement Developer Financing Arrangement (DFA) — 744,401 744,401
$ 1,240,142 $ 22,779,932 $ 24,020,074
december 31, 2015 current Noncurrent Total
(In thousands)A. Consolidated Bonds and Notes $ 946,895 $ 20,840,924 $ 21,787,819B. Commercial Paper Obligations 425,760 — 425,760C. Variable Rate Master Notes 77,900 — 77,900D. Port Authority Equipment Notes — — —E. Fund for Regional Development Buy-Out Obligation 32,339 221,393 253,732F. MOTBY Obligation 3,678 40,705 44,383G. Tower 4 Liberty Bonds — 1,247,473 1,247,473H. Goethals Bridge Replacement Developer Financing Arrangement (DFA) — 430,800 430,800
$ 1,486,572 $ 22,781,295 $ 24,267,867
Notes to Consolidated Financial Statements(continued)

89THE FOUNDATION FOR A NEW TOMORROW
Note D - Outstanding Obligations and Financing (continued)
A. consolidated Bonds and Notes
dec. 31, refunded/ dec. 31, 2015 issued retired 2016
(In thousands)Eighty-fifth series 5.2%-5.375% due 2017-2028 $ 73,200 $ — $ 2,000 $ 71,200Ninety-third series 6.125% due 2094 100,000 — — 100,000One hundred forty-second series 4%-5% due 2016-2036 335,965 — 335,965 —One hundred forty-third series* 5% due 2016-2036 500,000 — 500,000 —One hundred forty-fourth series 4.25%-5% due 2026-2035 300,000 — 300,000 —One hundred forty-sixth series* 4.25%-5% due 2016-2036 500,000 — 500,000 —One hundred forty-seventh series* 4.75%-5% due 2017-2037 450,000 — — 450,000One hundred forty-eighth series 5% due 2017-2037 420,595 — 15,130 405,465One hundred forty-ninth series 4%-5% due 2017-2037 400,000 — — 400,000One hundred fiftieth series** 4.75%-6.4% due 2017-2027 265,000 — 45,000 220,000One hundred fifty-first series* 5.25%, 6% & 5.75% due 2023, 2028 & 2035 350,000 — — 350,000One hundred fifty-second series* 4.75%-5.75% due 2018-2038 400,000 — — 400,000One hundred fifty-third series 4%-5% due 2018-2038 500,000 — — 500,000One hundred fifty-fourth series 4%-5% due 2017-2029 76,160 — 4,275 71,885One hundred fifty-fifth series 3%-3.5% due 2017-2019 18,600 — 6,600 12,000One hundred fifty-sixth series 4%-5% due 2025-2039 100,000 — — 100,000One hundred fifty-seventh series** 5.309% due 2019 150,000 — — 150,000One hundred fifty-eighth series** 5.859% due 2024 250,000 — — 250,000One hundred fifty-ninth series** 6.04% due 2029 350,000 — — 350,000One hundred sixtieth series 4%-5% due 2030-2039 300,000 — — 300,000One hundred sixty-first series 4.25%-5% due 2030-2039 300,000 — — 300,000One hundred sixty-second series 2.90%-3.3% due 2017-2020 25,000 — 7,000 18,000One hundred sixty-third series 2.375%-5% due 2017-2040 400,000 — — 400,000One hundred sixty-fourth series** 5.647% due 2040 425,000 — — 425,000One hundred sixty-fifth series** 5.647% due 2040 425,000 — — 425,000One hundred sixty-sixth series 5%-5.25% due 2030-2041 300,000 — — 300,000One hundred sixty-seventh series* 5%-5.5% due 2017-2028 173,040 — 14,390 158,650One hundred sixty-eighth series** 4.926% due 2051 1,000,000 — — 1,000,000One hundred sixty-ninth series* 4.5%-5% due 2017-2041 322,950 — 13,285 309,665One hundred seventieth series(a) 5%, 5.25% due 2041 & 2043 672,480 — — 672,480One hundred seventy-first series 4%-5% due 2030-2042 400,000 — — 400,000One hundred seventy-second series* 3%-5% due 2017-2037 320,520 — 7,965 312,555One hundred seventy-third series 3%-5% due 2018-2032 300,000 — — 300,000One hundred seventy-fourth series** 4.458% due 2062 2,000,000 — — 2,000,000One hundred seventy-fifth series 3%-5% due 2017-2042 411,170 — 5,040 406,130One hundred seventy-sixth series** 1.05%-2.5% due 2017-2022 119,000 — 17,000 102,000One hundred seventy-seventh series* 3%-5% due 2017-2043 322,545 — 4,070 318,475One hundred seventy-eighth series* 5% due 2017-2043 453,385 — 15,785 437,600One hundred seventy-ninth series 4%-5% due 2017-2043 866,750 — 28,075 838,675One hundred eightieth series 3%-5% due 2017-2021 78,070 — 15,450 62,620One hundred eighty-first series** 4.96% due 2046 500,000 — — 500,000One hundred eighty-second series** 5.31% due 2046 500,000 — — 500,000One hundred eighty-third series 3%-5% due 2025-2044 400,000 — — 400,000One hundred eighty-fourth series 3%-5% due 2017-2039 346,705 — 285 346,420One hundred eighty-fifth series* 4%-5% due 2017-2034 470,835 — 22,875 447,960One hundred eighty-sixth series* 5% due 2017-2044 381,735 — 20,850 360,885One hundred eighty-seventh series** 2.529%-4.426% due 2020-2034 250,000 — — 250,000One hundred eighty-eighth series* 3%-5% due 2017-2035 116,220 — 9,470 106,750One hundred eighty-ninth series 3%-5% due 2017-2045 490,000 — 13,015 476,985One hundred ninetieth series 5% due 2026-2038 160,000 — — 160,000One hundred ninety-first series** 4.823% due 2045 250,000 — — 250,000One hundred ninety-second series** 4.81% due 2065 500,000 — — 500,000One hundred ninety-third series* 4%-5% due 2017-2035 305,440 — 10,295 295,145One hundred ninety-fourth series(b) 4%-5.25% due 2017-2055 1,194,560 — 4,405 1,190,155One hundred ninety-fifth series* 1.45%-5% due 2017-2036 — 312,620 9,090 303,530One hundred ninety-sixth series* 2.125%-2.625% due 2027-2034 — 200,000 — 200,000One hundred ninety-seventh series* 4%-5% due 2017-2041 — 237,930 — 237,930One hundred ninety-eighth series 5%-5.25% due 2027-2056 — 350,000 — 350,000One hundred ninety-ninth series* 1.58%-3.05% due 2022-2031 — 236,405 — 236,405
Consolidated bonds and notes– at par value $21,019,925 $1,336,955 $1,927,315 $20,429,565Add unamortized premium and (discount) 767,894 139,042 50,629 856,307
Consolidated bonds and notes $21,787,819 $1,475,997 $1,977,944 $21,285,872
(a) The One Hundred Seventieth series was acquired by the New York Liberty Development Corporation in connection with it’s issuance of Liberty Revenue Bonds, Series 1WTC 2011 (Secured by Port Authority Consolidated Bonds).
(b) Includes amounts issued for the purpose of refunding Consolidated Bond Series One Hundred Forty-eighth in 2016 and 2017, respectively.
* Obligations noted with an “(*)”, are subject to the alternative minimum tax imposed under the Internal Revenue Code of 1986, as amended with respect to individuals and corporations.
** Obligations noted with an “(**)”, are subject to federal taxation.
Notes to Consolidated Financial Statements(continued)

90 THE PORT AUTHORITY OF NY & NJ
Note D - Outstanding Obligations and Financing (continued)
Debt service requirements to maturity for Consolidated Bonds and Notes outstanding at December 31, 2016 are as follows:
year ending december 31: Principal interest debt service
(In thousands)
2017(a) $ 734,670 $ 966,544 $ 1,701,214 2018 361,370 938,739 1,300,109 2019 400,950 922,018 1,322,968 2020 420,725 901,252 1,321,977 2021 444,100 880,907 1,325,007 2022–2026 2,504,160 4,072,816 6,576,976 2027–2031 3,187,050 3,414,407 6,601,457 2032–2036 3,645,125 2,581,011 6,226,136 2037–2041 2,805,965 1,783,591 4,589,556 2042–2046 2,123,800 1,152,508 3,276,308 2047–2051 1,224,190 761,756 1,985,946 2052–2056 1,049,600 504,466 1,554,066 2057–2061 1,114,685 240,935 1,355,620 2062–2066 313,175 50,105 363,280 2067–2094(b) 100,000 143,121 243,121
$ 20,429,565 $ 19,314,176 $ 39,743,741
(a) Amount includes the expected refunding of Consolidated Bonds, One hundred Forty-eighth Series.
(b) Debt service for the years 2067-2094 reflects principal and interest payments associated with Consolidated Bonds, Ninety-third Series.
Consolidated Bonds & Notes Outstanding as of December 31, 2015
dec. 31, issued/ refunded/ dec. 31, 2014 Accreted retired 2015
(In thousands)
Cumulative amounts prior to 2015 $19,229,020 $ — $ 1,234,095 $ 17,994,9252015 Activity: One hundred eighty-eight series* – 125,000 – 125,000One hundred eighty-nine series – 490,000 – 490,000One hundred ninetieth series – 160,000 – 160,000One hundred ninety-first series** – 250,000 – 250,000One hundred ninety-second series** – 500,000 – 500,000One hundred ninety-third series* – 305,440 – 305,440One hundred ninety-fourth series – 1,194,560 – 1,194,560
consolidated Bonds & Notes- at par value 19,229,020 3,025,000 1,234,095 21,019,925Add: unamortized premium and (discount) 478,918 334,755 45,779 767,894
Total consolidated Bonds and Notes $ 19,707,938 $ 3,359,755 $ 1,279,874 $ 21,787,819
* Obligations noted with an “(*)”, are subject to the alternative minimum tax imposed under the Internal Revenue Code of 1986, as amended with respect to individuals and corporations.
** Obligations noted with an “(**)”, are subject to federal taxation.
Notes to Consolidated Financial Statements(continued)

91THE FOUNDATION FOR A NEW TOMORROW
Note D - Outstanding Obligations and Financing (continued)
Consolidated bonds outstanding as of March 1, 2017 totaled $20.4 billion.
On July 23, 2015, the Board of Commissioners established Consolidated Bonds, One Hundred Ninety-second Series through Consolidated Bonds, Two Hundred Eleventh Series, and authorized the issuance and sale of each series at a true interest cost to the Authority not in excess of 8 percent, for a term to maturity not in excess of one hundred twenty percent (120%) of the weighted average reasonably expected economic life of the facilities to be provided with the proceeds of such series. The Board also established Consolidated Notes, Series AAA, Series BBB, Series CCC, Series DDD and Series EEE, and authorized the issuance and sale of each series at a true interest cost to the Port Authority not in excess of 8 percent for a term not in excess of 3 years. The total aggregate principal amount of Consolidated Bonds, One Hundred Ninety-second Series through Consolidated Bonds, Two Hundred Eleventh Series, Consolidated Notes, Series AAA, Series BBB, Series CCC, Series DDD and Series EEE, and Versatile Structure Obligations issued and sold shall not exceed $10 billion. The Committee on Finance would be authorized to sell and to deliver all or any part of each of such series with such terms and at such time or times as it deems appropriate, at public or private sale, and would also be authorized to take, and to delegate authority for, certain actions with respect to each of such series. An Authorized Officer of the Authority would be authorized to take any and all action that could be taken by the Committee on Finance in connection with each of such series, provided, however, that such actions in connection with the decision to sell such series shall be subject to prior approval of the Committee on Finance.
During 2016, the Port Authority allocated the proceeds from the sale of consolidated bonds, including bond issuance premiums, to refund $1.1 billion of consolidated bonds and commercial paper notes. As a result of these refundings, the Port Authority decreased its aggregate debt service payments by approximately $282 million over the life of the refunded consolidated bonds. The economic gain resulting from the 2016 debt refundings (the difference between the present value of the cash flows required to service the old debt and the present value of the cash flows required to service the new debt) totaled approximately $207 million in net present value savings.
B. commercial Paper obligations
Commercial paper obligations are special obligations of the Port Authority generally issued to provide interim financing for authorized capital projects. Commercial paper obligations may be outstanding until December 31, 2020 pursuant to the July 2015 resolution authorizing their issuance. In July 2015, the Port Authority established a taxable commercial paper program, Series C. For additional information related to the payment of special obligations of the Port Authority, see Note E – General and Consolidated Bond Reserve Funds.
Under the current program, the maximum aggregate principal amount that may be outstanding at any one time is $250 million for Series A, $250 million for Series B and $250 million for Series C. Commercial paper obligations are issued without third party provider support for payment at their maturity dates.
dec. 31, refunded/ dec. 31, 2015 issued repaid 2016
(In thousands)
Series A* $ 240,120 $ 859,675 $ 894,595 $ 205,200Series B 185,640 945,525 948,050 183,115Series C** — — — —
$ 425,760 $ 1,805,200 $ 1,842,645 $ 388,315
* Obligations noted with an “(*)”, are subject to the alternative minimum tax imposed under the Internal Revenue Code of 1986, as amended with respect to individuals and corporations.
** Obligations noted with an “(**)”, are subject to federal taxation.
dec. 31, refunded/ dec. 31, 2014 issued repaid 2015
(In thousands)
Series A* $ 269,695 $ 987,930 $ 1,017,505 $ 240,120 Series B 178,490 688,020 680,870 185,640 Series C** — — — —
$ 448,185 $ 1,675,950 $ 1,698,375 $ 425,760
* Obligations noted with an “(*)”, are subject to the alternative minimum tax imposed under the Internal Revenue Code of 1986, as amended with respect to individuals and corporations.
** Obligations noted with an “(**)”, are subject to federal taxation.
Interest rates for all commercial paper notes ranged from 0.01% to 0.96% in 2016.
Notes to Consolidated Financial Statements(continued)

92 THE PORT AUTHORITY OF NY & NJ
Note D - Outstanding Obligations and Financing (continued)
c. Variable rate master Notes
Variable rate master notes are special obligations of the Port Authority and may be issued in aggregate principal amounts outstanding at any one time not to exceed $400 million (See Note E – General and Consolidated Bond Reserve Funds for additional information related to the payment of special obligations of the Port Authority).
dec. 31, refunded/ dec. 31, 2015 issued repaid 2016
(In thousands)
Agreements 1989 -1995* $ 44,900 $ — $ — $ 44,900Agreements 1989 -1998 33,000 — — 33,000
$ 77,900 $ — $ — $ 77,900
* Obligations noted with an “(*)”, are subject to the alternative minimum tax imposed under the Internal Revenue Code of 1986, as amended with respect to individuals and corporations.
dec. 31, refunded/ dec. 31, 2014 issued repaid 2015
(In thousands)
Agreements 1989 -1995* $ 44,900 $ — $ — $ 44,900Agreements 1989 -1998 33,000 — — 33,000
$ 77,900 $ — $ — $ 77,900
* Obligations noted with an “(*)”, are subject to the alternative minimum tax imposed under the Internal Revenue Code of 1986, as amended with respect to individuals and corporations.
Interest rates are determined weekly, based upon a spread added to a specific industry index (the Securities Industry and Financial Markets Association rate) as stated in each master note agreement, and ranged from 0.06% to 0.95% in 2016.
Annual debt service requirements on outstanding variable rate master notes, determined for presentation purposes at the rate in effect at December 31, 2016, would be as follows:
year ending december 31: Principal interest debt service
(In thousands)
2017 $ — $ 613 $ 613 2018 — 613 613 2019 — 613 613 2020 — 615 615 2021 25,000 506 25,506 2022–2025 52,900 626 53,526
$ 77,900 $ 3,586 $ 81,486
Variable rate master notes are subject to prepayment at the option of the Port Authority or upon demand of the holders.
d. Port Authority equipment Notes
Port Authority equipment notes may be issued in aggregate principal amounts outstanding at any one time not to exceed $250 million. Equipment notes are special obligations to the Port Authority and are payable in the same manner and from the same sources as operating expenses. For additional information related to the payment of obligations of the Port Authority, see Note E – General and Consolidated Bond Reserve Funds.
There are no outstanding Port Authority Equipment Notes as of December 31, 2016 and 2015.
Notes to Consolidated Financial Statements(continued)
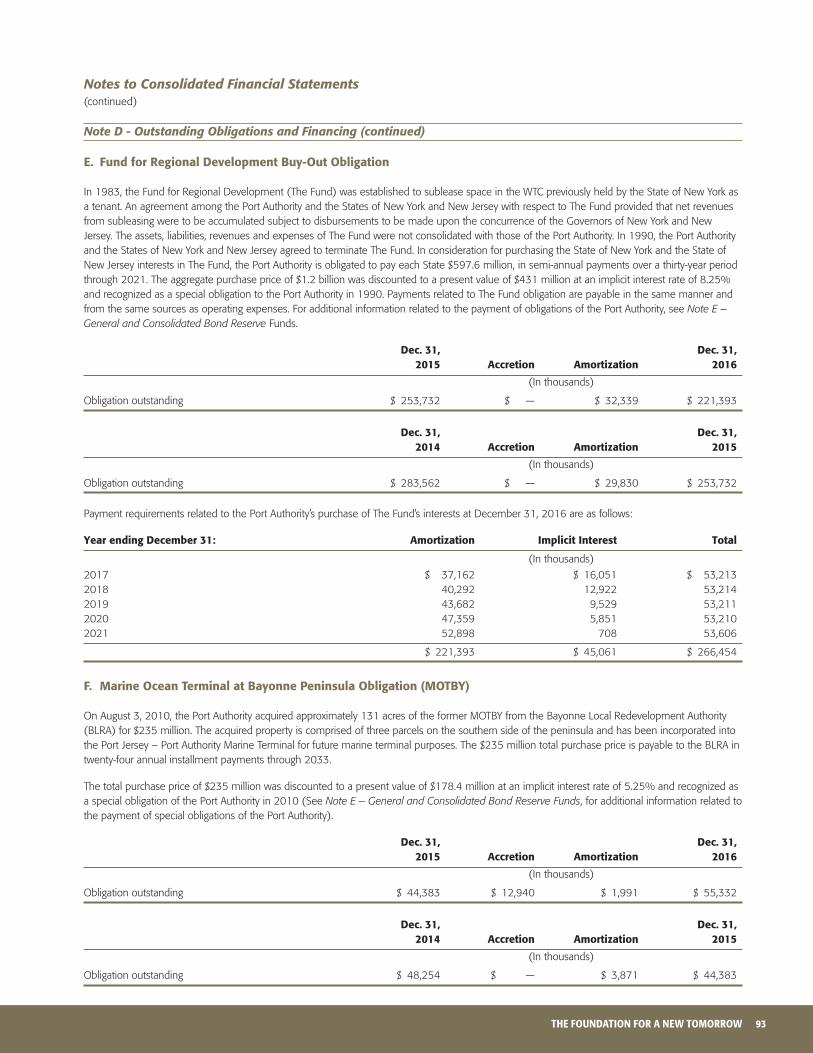
93THE FOUNDATION FOR A NEW TOMORROW
Note D - Outstanding Obligations and Financing (continued)
e. fund for regional development Buy-out obligation
In 1983, the Fund for Regional Development (The Fund) was established to sublease space in the WTC previously held by the State of New York as a tenant. An agreement among the Port Authority and the States of New York and New Jersey with respect to The Fund provided that net revenues from subleasing were to be accumulated subject to disbursements to be made upon the concurrence of the Governors of New York and New Jersey. The assets, liabilities, revenues and expenses of The Fund were not consolidated with those of the Port Authority. In 1990, the Port Authority and the States of New York and New Jersey agreed to terminate The Fund. In consideration for purchasing the State of New York and the State of New Jersey interests in The Fund, the Port Authority is obligated to pay each State $597.6 million, in semi-annual payments over a thirty-year period through 2021. The aggregate purchase price of $1.2 billion was discounted to a present value of $431 million at an implicit interest rate of 8.25% and recognized as a special obligation to the Port Authority in 1990. Payments related to The Fund obligation are payable in the same manner and from the same sources as operating expenses. For additional information related to the payment of obligations of the Port Authority, see Note E – General and Consolidated Bond Reserve Funds.
dec. 31, dec. 31, 2015 Accretion Amortization 2016
(In thousands)
Obligation outstanding $ 253,732 $ — $ 32,339 $ 221,393
dec. 31, dec. 31, 2014 Accretion Amortization 2015
(In thousands)
Obligation outstanding $ 283,562 $ — $ 29,830 $ 253,732
Payment requirements related to the Port Authority’s purchase of The Fund’s interests at December 31, 2016 are as follows:
year ending december 31: Amortization implicit interest Total
(In thousands)
2017 $ 37,162 $ 16,051 $ 53,213 2018 40,292 12,922 53,214 2019 43,682 9,529 53,211 2020 47,359 5,851 53,210 2021 52,898 708 53,606
$ 221,393 $ 45,061 $ 266,454
f. marine ocean Terminal at Bayonne Peninsula obligation (moTBy)
On August 3, 2010, the Port Authority acquired approximately 131 acres of the former MOTBY from the Bayonne Local Redevelopment Authority (BLRA) for $235 million. The acquired property is comprised of three parcels on the southern side of the peninsula and has been incorporated into the Port Jersey – Port Authority Marine Terminal for future marine terminal purposes. The $235 million total purchase price is payable to the BLRA in twenty-four annual installment payments through 2033.
The total purchase price of $235 million was discounted to a present value of $178.4 million at an implicit interest rate of 5.25% and recognized as a special obligation of the Port Authority in 2010 (See Note E – General and Consolidated Bond Reserve Funds, for additional information related to the payment of special obligations of the Port Authority).
dec. 31, dec. 31, 2015 Accretion Amortization 2016
(In thousands)
Obligation outstanding $ 44,383 $ 12,940 $ 1,991 $ 55,332
dec. 31, dec. 31, 2014 Accretion Amortization 2015
(In thousands)
Obligation outstanding $ 48,254 $ — $ 3,871 $ 44,383
Notes to Consolidated Financial Statements(continued)

94 THE PORT AUTHORITY OF NY & NJ
Note D - Outstanding Obligations and Financing (continued)
Payment requirements for the MOTBY obligation outstanding, at December 31, 2016 are as follows:
year ending december 31: Amortization implicit interest Total
(In thousands)
2017 $ 2,095 $ 2,905 $ 5,000 2018 2,205 2,795 5,000 2019 2,321 2,679 5,000 2020 2,443 2,557 5,000 2021 2,571 2,429 5,000 2022–2026 15,026 9,974 25,000 2027–2031 19,407 5,593 25,000 2032–2033 9,264 736 10,000
$ 55,332 $ 29,668 $ 85,000
g. Tower 4 liberty Bonds
In connection with the issuance of the Tower 4 Liberty Bonds by the New York Liberty Development Corporation on November 15, 2011, the Port Authority entered into a Tower 4 Bond Payment Agreement with Tower 4 Trustee to make, as a co-borrower/obligor with respect to the New York Liberty Development Corporation, Liberty Revenue Bonds, Series 2011 (4 World Trade Center Project), debt service payments of principal and interest under the bonds as a special obligation of the Port Authority to the trustee during the term of the agreement, from May 11, 2012 through November 15, 2051 (see Note E – General and Consolidated Bond Reserve Funds, for additional information related to the payment of special obligations of the Port Authority).
Certain Port Authority debt service payments related to Tower 4 Liberty Bonds are reimbursable to the Port Authority from Tower 4 cash flow and to the extent Tower 4 cash flow is not sufficient, would accrue interest until reimbursed or paid with an overall term for such reimbursement or payment not in excess of 40 years (see Note L – Information with Respect to the Redevelopment of the World Trade Center Site for additional information related to the redevelopment of WTC Tower 4).
dec. 31, repaid/ dec. 31, 2015 issued Amortized 2016
(In thousands)
Series 2011 $ 1,225,520 $ — $ — $ 1,225,520Add: unamortized premium 21,953 — 612 21,341
Total Tower 4 Liberty Bonds $ 1,247,473 $ — $ 612 $ 1,246,861
dec. 31, repaid/ dec. 31, 2014 issued Amortized 2015
(In thousands)
Series 2011 $ 1,225,520 $ — $ — $ 1,225,520Add: unamortized premium 22,565 — 612 21,953
Total Tower 4 Liberty Bonds $ 1,248,085 $ — $ 612 $ 1,247,473
Notes to Consolidated Financial Statements(continued)

95THE FOUNDATION FOR A NEW TOMORROW
Note D - Outstanding Obligations and Financing (continued)
Annual debt service payment requirements on outstanding Tower 4 Liberty Bonds at December 31, 2016 would be as follows:
year ending december 31: Principal interest debt service(a)
(In thousands)
2017 $ — $ 65,293 $ 65,293 2018 — 65,293 65,293 2019 — 65,293 65,293 2020 — 65,293 65,293 2021 — 65,293 65,293 2022–2026 — 326,467 326,467 2027–2031 140,180 313,132 453,312 2032–2036 179,025 274,287 453,312 2037–2041 228,840 224,472 453,312 2042–2046 292,955 160,354 453,309 2047–2051 384,520 68,798 453,318
Total $ 1,225,520 $ 1,693,975 $ 2,919,495
(a) Debt Service excludes rent payments of approximately $510.3 million payable by the City of New York directly to the Tower 4 Liberty Bond trustee pursuant to the City of New York WTC Tower 4 space lease.
h. goethals Bridge replacement developer financing Arrangement (dfA)
On August 30, 2013, the Port Authority and a private developer entered into an agreement (the Project Agreement) for the design, construction, financing and maintenance of a replacement Goethals Bridge (the Replacement Bridge). Pursuant to the Project Agreement, after the replacement bridge becomes operational, the private developer will perform certain operation and maintenance work. The Port Authority will retain control over all tolling activities. Port Authority staff presently expects substantial completion of the Replacement Bridge to occur in the first quarter of 2018, and project completion, including the demolition of the existing bridge, to occur in the fourth quarter of 2018.
Pursuant to the Project Agreement, upon substantial completion of the Replacement Bridge, the Port Authority is required to make a payment to the private developer in the amount of $1.02 billion, subject to certain adjustments for the construction of the Replacement Bridge. In lieu of a cash payment at that time, the developer will extend a loan in that principal amount to the Port Authority, to be repaid in monthly payments of principal and interest to the developer. DFA payments are a special obligation of the Port Authority, payable over the term of the Project Agreement, which has a scheduled expiration date on the thirty-fifth anniversary of the substantial completion date of the Replacement Bridge (See Note E – General and Consolidated Bond Reserve Funds, for additional information related to the payment of special obligations of the Port Authority). DFA payments are subject to certain deductions for non-compliance by the private developer with the terms of the Project Agreement.
Construction activities commenced in December 2013. The Port Authority, as owner of the Replacement Bridge currently being constructed has accrued to date $744 million of the total $1.02 billion DFA obligation based on the percentage of construction completed as of December 31, 2016.
dec. 31, dec. 31, 2015 Accretion Amortization 2016
(In thousands)
Goethals Bridge Replacement Developer Financing Arrangement $ 430,800 $ 313,601 $ — $ 744,401
dec. 31, dec. 31, 2014 Accretion Amortization 2015
(In thousands)
Goethals Bridge Replacement Developer Financing Arrangement $ 210,316 $ 220,484 $ — $ 430,800
Notes to Consolidated Financial Statements(continued)

96 THE PORT AUTHORITY OF NY & NJ
Note D - Outstanding Obligations and Financing (continued)
DFA payments, including implicit interest, expected to be made to the private developer after substantial completion of the Replacement Bridge are as follows:
year ending december 31: dfA Payments*
(In thousands)
2018 $ 56,476 2019 57,323 2020 58,183 2021 59,056 2022 59,942 2023–2027 313,469 2028–2032 337,696 2033–2037 363,794 2038–2042 391,910 2043–2047 422,198 2048–2052 454,827
Total $ 2,574,874
* Total DFA payments include the repayment of the $1.02 billion developer loan and $1.55 billion in implicit interest.
Amounts Payable - special Project Bonds
Neither the full faith and credit of the Port Authority, nor the General Reserve Fund, nor the Consolidated Bond Reserve Fund are pledged to the payment of the principal and interest on special project bonds. Principal and interest on each series of special project bonds are secured solely by a mortgage by the Port Authority of facility rental (to the extent received by the Port Authority from a lessee) as set forth in a lease with respect to a project to be financed with the proceeds of the bonds of such series, by a mortgage by the lessee of its leasehold interest under the lease and by a security interest granted by the lessee to the Port Authority and mortgaged by the Port Authority in certain items of the lessee’s personal property to be located at the project, and such other security in addition to the foregoing as may be required by the Port Authority from time to time as appropriate to the particular project.
A summary of December 31, 2016 and December 31, 2015 Special Project Bonds outstanding follows:
dec. 31, repaid/ dec. 31, 2015 issued Amortized 2016
(In thousands)
Series 4, KIAC Partners Project(a)* 6.75% due 2016-2019 $ 77,900 $ — $ 15,800 $ 62,100Less: unamortized discount 719 — 191 528
Total - Series 4 77,181 — 15,609 61,572
Series 6, JFKIAT Project(b)* 5.75%-6.25% due 2016-2025 576,990 — 44,200 532,790Less: unamortized discount 3,327 — 336 2,991
Total - Series 6 573,663 — 43,864 529,799
Series 8, JFKIAT Project(c)
5%-6.5% due 2018-2042 796,280 — — 796,280Less: unamortized discount 11,184 — 415 10,769
Total - Series 8 785,096 — (415) 785,511
Amounts payable - Special Project Bonds $ 1,435,940 $ — $ 59,058 $ 1,376,882
* Obligations noted with an “(*)”, are subject to the alternative minimum tax imposed under the Internal Revenue Code of 1986, as amended with respect to individuals and corporations.
(a) Special project bonds, Series 4, KIAC Partners Project, were issued in 1996 to refund special project bonds, Series 3, KIAC Partners Project, and in connection with a project at JFK, that included the construction of a cogeneration facility, the renovation and expansion of the central heating and refrigeration plant, and the renovation and expansion of the thermal distribution system.
(b) Special project bonds, Series 6, JFKIAT Project, were issued in 1997 in connection with a project that included the development and construction of a new passenger terminal at JFK.
(c) Special project bonds, Series 8, JFKIAT Project, were issued in 2010 in connection with a project that included the expansion of Terminal 4 at JFK.
Notes to Consolidated Financial Statements(continued)

97THE FOUNDATION FOR A NEW TOMORROW
Note D - Outstanding Obligations and Financing (continued)
dec. 31, repaid/ dec. 31, 2014 issued Amortized 2015
(In thousands)
Series 2, Continental Airlines, Inc. andEastern Air Lines, Inc. Project(a)* 9.125% due 2015 $ 22,400 $ — $ 22,400 $ —Less: unamortized discount 446 — 446 —
Total - Series 2 21,954 — 21,954 —
Series 4, KIAC Partners Project(b)* 6.75% due 2015-2019 93,200 — 15,300 77,900Less: unamortized discount 910 — 191 719
Total - Series 4 92,290 — 15,109 77,181
Series 6, JFKIAT Project(c)* 5.75%-6.25% due 2015-2025 618,630 — 41,640 576,990Less: unamortized discount 3,663 — 336 3,327
Total - Series 6 614,967 — 41,304 573,663
Series 8, JFKIAT Project(d)
5%-6.5% due 2018-2042 796,280 — — 796,280Less: unamortized discount 11,599 — 415 11,184
Total - Series 8 784,681 — (415) 785,096
Amounts payable - Special Project Bonds $ 1,513,892 $ — $ 77,952 $ 1,435,940
* Obligations noted with an “(*)”, are subject to the alternative minimum tax imposed under the Internal Revenue Code of 1986, as amended with respect to individuals and corporations.
(a) Special project bonds, Series 2, Continental Airlines, Inc. and Eastern Air Lines, Inc. Project, were issued in 1990 in connection with a project that included the construction of a passenger terminal at LGA leased to and to be occupied by Continental and Eastern. The leasehold interest of Eastern was assigned to Continental. Continental’s leasehold interest in such passenger terminal, including the previously acquired leasehold interest of Eastern, was subsequently assigned to USAir, Inc. and, then, subsequently assigned to Delta Airlines, Inc. (Continental and USAir, Inc. to remain liable under both underlying leases).
(b) Special project bonds, Series 4, KIAC Partners Project, were issued in 1996 to refund special project bonds, Series 3, KIAC Partners Project, and in connection with a project at JFK, that included the construction of a cogeneration facility, the renovation and expansion of the central heating and refrigeration plant, and the renovation and expansion of the thermal distribution system.
(c) Special project bonds, Series 6, JFKIAT Project, were issued in 1997 in connection with a project that included the development and construction of a new passenger terminal at JFK.
(d) Special project bonds, Series 8, JFKIAT Project, were issued in 2010 in connection with a project that included the expansion of Terminal 4 at JFK.
Notes to Consolidated Financial Statements(continued)

98 THE PORT AUTHORITY OF NY & NJ
Note e – general and consolidated Bond reserve funds (pursuant to Port Authority bond resolutions)
The General Reserve Fund is pledged in support of Consolidated Bonds and Notes. Statutes which require the Port Authority to create and maintain the General Reserve Fund established the principle of pooling revenues from all facilities and require that the Port Authority apply surplus revenues from all of its existing facilities to maintain the General Reserve Fund in an amount at least equal to 10% of the par value of outstanding bonds legal for investment. At December 31, 2016, the General Reserve Fund balance was $2,297,475,500 and met the prescribed statutory amount (see Schedule C – Analysis of Reserve Funds).
The balance remaining of all net revenues of the Port Authority’s existing facilities after deducting payments for debt service upon all Consolidated Bonds and Notes and the amount necessary to maintain the General Reserve Fund at its statutorily required amount is to be paid into the Consolidated Bond Reserve Fund, which is pledged as additional security for all outstanding Consolidated Bonds and Notes. Consolidated Bonds and Notes have a first lien upon the net revenues (as defined in the Consolidated Bond Resolution) of all existing facilities of the Port Authority and any additional facility financed by Consolidated Bonds and Notes.
Commercial paper obligations, Variable rate master notes, MOTBY obligation, Tower 4 Liberty Bonds and the Goethals Bridge Replacement Developer Financing Arrangement (DFA) are special obligations of the Port Authority. The Port Authority is also a special limited co-obligor on the senior debt issued for WTC Tower 3, with a capped amount of debt service shortfalls payable as a special obligation of the Port Authority (See Note L- Information with Respect to the Redevelopment of the World Trade Center Site, for additional information related to certain contingent obligations of the Port Authority with respect to the development of WTC Tower 3).
Special obligations of the Port Authority are payable from the proceeds of obligations of the Port Authority issued for such purposes, including Consolidated Bonds issued in whole or in part for such purposes, or from net revenues (as defined below) deposited into the Consolidated Bond Reserve Fund, and in the event such net revenues are insufficient therefore, from other moneys of the Port Authority legally available for such payments when due.
Net revenues for purposes of special obligations of the Port Authority are defined, with respect to any date of calculation, as the revenues of the Port Authority pledged under the Consolidated Bond Resolution, and remaining after, (i) payment or provision for payment of debt service on Consolidated Bonds as required by the applicable provisions of the Consolidated Bond Resolution; (ii) payment into the General Reserve Fund of the amount necessary to maintain the General Reserve Fund at the amount specified in the General Reserve Fund Statutes; and (iii) applications to the authorized purposes under Section 7 of the Consolidated Bond Resolution.
Special obligations of the Port Authority are subject in all respects to payment of debt service on Consolidated Bonds as required by the applicable provisions of the Consolidated Bond Resolution and payment into the General Reserve Fund of the amount necessary to maintain the General Reserve Fund at the amount specified in the General Reserve Fund statutes.
Special obligations of the Port Authority are not secured by or payable from the General Reserve Fund. Additionally, special obligations of the Port Authority do not create any lien on, pledge of or security interest in any revenues, reserve funds or other property of the Port Authority.
Equipment notes and The Fund obligation are special obligations to the Port Authority and payable in the same manner and from the same sources as operating expenses.
Special project bonds are not secured by or payable from the General Reserve Fund or the Consolidated Bond Reserve Fund.
The moneys in the reserve funds may be accumulated or applied only to purposes set forth in legislation and the agreements with the holders of the Port Authority’s obligations pertaining thereto. At December 31, 2016, the Port Authority met the requirements of the Consolidated Bond Resolution to maintain total reserve funds in cash and certain specified securities.
In addition, the Port Authority has a long-standing policy of maintaining total reserve funds in an amount equal to at least the next two years’ bonded debt service on outstanding debt secured by a pledge of the General Reserve Fund.
Notes to Consolidated Financial Statements(continued)

99THE FOUNDATION FOR A NEW TOMORROW
Note f – grants and contributions in Aid of construction
During 2016 and 2015, the Port Authority received certain reimbursements related to certain policing activities as well as federal and state funding for operating and capital construction activities:
1. Policing programs
a. K-9 Program – The FAA and the TSA provided funding for operating costs associated with the training and care of explosive detection dogs. Amounts received in connection with this program were approximately $1.4 million in 2016 and $1 million in 2015.
b. Airport Screening Program – The TSA provided $209,972 in 2016 and $306,600 in 2015 to fund operating costs incurred by Port Authority police personnel involved with passenger screening at JFK and EWR.
c. U.S. Department of State (USDOS) – The Port Authority received $768,597 in 2016 and $604,432 in 2015 from the USDOS to fund operating security costs incurred by Port Authority police personnel for the United Nations General Assembly (UNGA).
Amounts received in connection with the Port Authority Police Department providing services to an unrelated third-party are exchange transactions and recognized as operating revenues on the Consolidated Statements of Revenues, Expenses and Changes in Net Position.
2. grants, in connection with operating activities
a. Security Programs – In 2016 and 2015, the Port Authority recognized approximately $42.5 million and $68.3 million, respectively, for security related programs from the TSA for baggage screening at LGA, JFK and EWR and UASI programs.
b. Superstorm Sandy – The Port Authority recognized $7.5 million in 2016 and $33.3 million in 2015 for FTA grants associated with Superstorm Sandy recovery efforts primarily at PATH.
c. AIP – The Port Authority recognized $9.5 million in AIP funding in 2016 primarily related to certain studies and operating activities at Port Authority aviation facilities.
3. contributions in Aid of capital construction
a. WTC Tower 3 - The Port Authority recognized $381 million in 2016 and $314 million in 2015 in capital contributions due from the Silverstein net lessees for the construction of WTC Tower 3.
b. WTC Transportation Hub – The Port Authority recognized $178 million in 2016 and $179 million in 2015 from the FTA for the construction of the WTC Transportation Hub. As of December 31, 2016, the Port Authority has received $2.8 billion from the FTA for the WTC Transportation Hub.
c. AIP – The Port Authority recognized $22 million in 2016 and $35 million in 2015 in AIP funding primarily related to Rehabilitation of runways at LGA and JFK and School Soundproofing at EWR.
d. Superstorm Sandy – In 2016 and 2015, the Port Authority recognized $29.7 million and $40.7 million, respectively, in FTA and FEMA capital contributions related to Superstorm Sandy permanent repairs primarily at PATH.
e. Federal Highway Administration (FHWA) – In 2016 and 2015, the Port Authority recognized $16 million and $5 million, respectively, in FHWA funding for the Cross Harbor Freight Movement Program at Greenville Yard.
f. Other – In 2016, the Port Authority recognized $27 million from the Metropolitan Transportation Authority (MTA) for the redevelopment of certain locations at the WTC site.
Notes to Consolidated Financial Statements(continued)
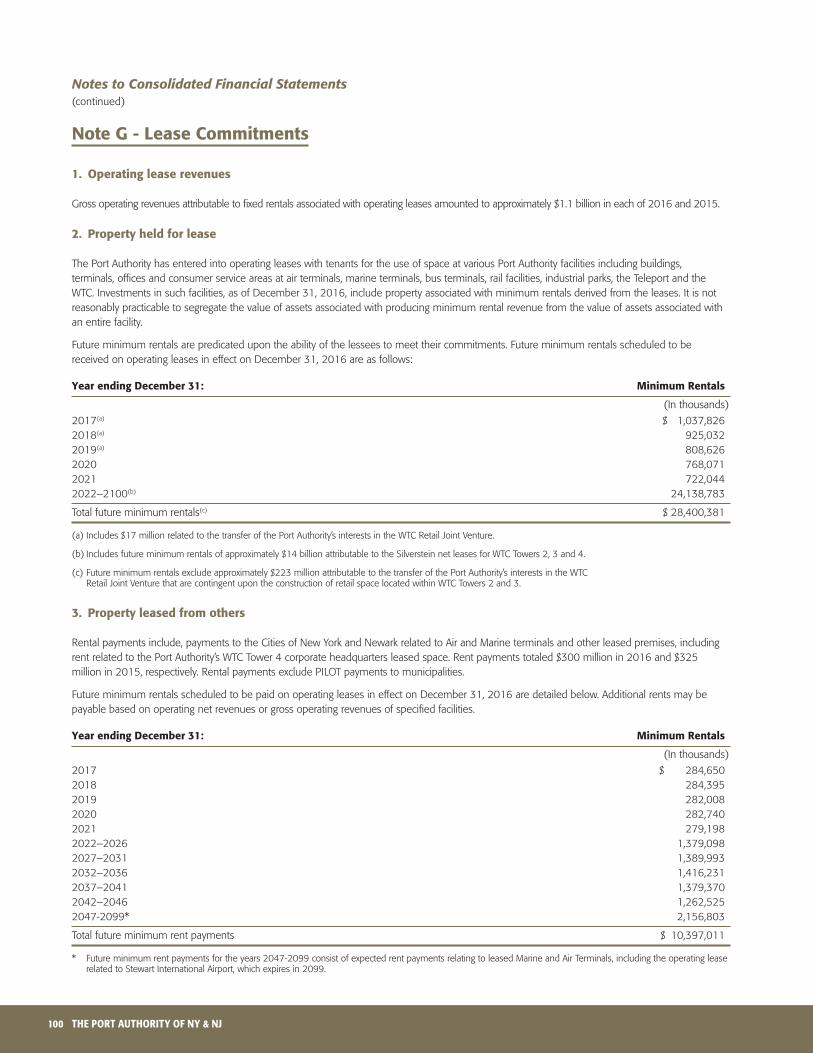
100 THE PORT AUTHORITY OF NY & NJ
Note g - lease commitments
1. operating lease revenues
Gross operating revenues attributable to fixed rentals associated with operating leases amounted to approximately $1.1 billion in each of 2016 and 2015.
2. Property held for lease
The Port Authority has entered into operating leases with tenants for the use of space at various Port Authority facilities including buildings, terminals, offices and consumer service areas at air terminals, marine terminals, bus terminals, rail facilities, industrial parks, the Teleport and the WTC. Investments in such facilities, as of December 31, 2016, include property associated with minimum rentals derived from the leases. It is not reasonably practicable to segregate the value of assets associated with producing minimum rental revenue from the value of assets associated with an entire facility.
Future minimum rentals are predicated upon the ability of the lessees to meet their commitments. Future minimum rentals scheduled to be received on operating leases in effect on December 31, 2016 are as follows:
year ending december 31: minimum rentals
(In thousands)
2017(a) $ 1,037,8262018(a) 925,032 2019(a) 808,626 2020 768,071 2021 722,044 2022–2100(b) 24,138,783
Total future minimum rentals(c) $ 28,400,381
(a) Includes $17 million related to the transfer of the Port Authority’s interests in the WTC Retail Joint Venture.
(b) Includes future minimum rentals of approximately $14 billion attributable to the Silverstein net leases for WTC Towers 2, 3 and 4.
(c) Future minimum rentals exclude approximately $223 million attributable to the transfer of the Port Authority’s interests in the WTC Retail Joint Venture that are contingent upon the construction of retail space located within WTC Towers 2 and 3.
3. Property leased from others
Rental payments include, payments to the Cities of New York and Newark related to Air and Marine terminals and other leased premises, including rent related to the Port Authority’s WTC Tower 4 corporate headquarters leased space. Rent payments totaled $300 million in 2016 and $325 million in 2015, respectively. Rental payments exclude PILOT payments to municipalities.
Future minimum rentals scheduled to be paid on operating leases in effect on December 31, 2016 are detailed below. Additional rents may be payable based on operating net revenues or gross operating revenues of specified facilities.
year ending december 31: minimum rentals
(In thousands)
2017 $ 284,650 2018 284,395 2019 282,008 2020 282,740 2021 279,198 2022–2026 1,379,098 2027–2031 1,389,993 2032–2036 1,416,231 2037–2041 1,379,370 2042–2046 1,262,525 2047-2099* 2,156,803
Total future minimum rent payments $ 10,397,011
* Future minimum rent payments for the years 2047-2099 consist of expected rent payments relating to leased Marine and Air Terminals, including the operating lease related to Stewart International Airport, which expires in 2099.
Notes to Consolidated Financial Statements(continued)

101THE FOUNDATION FOR A NEW TOMORROW
Note h – regional facilities and Programs
At the request of the Governors of the States of New York and New Jersey, the Port Authority participates in certain programs that are deemed essential to the continued economic viability of the two states and the region. These programs, which are generally non-revenue producing to the Port Authority, are addressed by the Port Authority in its budget and business planning process in the context of the Port Authority’s overall financial capacity. To the extent not otherwise a part of existing Port Authority facilities, these projects are effectuated through additional Port Authority facilities established solely for these purposes. The Port Authority does not expect to derive any revenues from regional development facilities described below.
• regional development facility (certified in 1987) – This facility is a centralized program of certain economic development and infrastructure renewal projects. It was expected that $250 million of capital funds would be made available in connection with the Governors’ Program of June 1983. As of December 31, 2016, approximately $249 million has been expended under this program.
• regional economic development Program (certified in 1989) – This facility is to be comprised of up to $400 million for certain transportation, economic development and infrastructure renewal projects. Net expenditures on projects authorized under this program totaled approximately $397 million as of December 31, 2016.
• oak Point rail freight link (certified in 1981) – The Port Authority has participated with the New York State Department of Transportation in the development of the Oak Point Rail Freight Link. As of December 31, 2016, the Port Authority has provided approximately $102 million for this rail project, of which approximately $63 million was made available through the Regional Development Facility and the Regional Economic Development Program.
• New Jersey marine development Program (certified in 1989) – This program was undertaken to fund certain fishery, marine or port development projects in the State of New Jersey at a total cost not to exceed $27 million. All funds under this program have been fully allocated and expended.
• New york Transportation, economic development and infrastructure renewal Program (certified in 2002) – This facility was established to provide up to $250 million for certain transportation, economic development and infrastructure renewal projects in the State of New York. As of December 31, 2016, $249 million has been spent on projects associated with this program.
• regional Transportation Program (certified in 2002) – This facility was established in conjunction with a program to provide up to $500 million for regional transportation initiatives. All funds under this program have been fully allocated and expended.
• hudson-raritan estuary resource Programs (certified in 2002 and 2014) – These facilities were established to acquire certain real property in the Port District area of the Hudson-Raritan Estuary for environmental enhancement/ancillary economic development purposes, in support of the Port Authority’s capital program. The cost of real property acquired under these programs are not to exceed $120 million. As of December 31, 2016, approximately $54 million has been expended under this program.
• regional rail freight Program (certified in 2002) – This facility provides for the Port Authority to participate, in consultation with other governmental entities in the States of New York and New Jersey, in the development of certain regional rail freight projects to provide for increased rail freight capacity. The Port Authority is authorized to provide up to $50 million. All funds under this program have been fully allocated and expended.
• meadowlands Passenger rail facility (certified in 2006) – This facility, which links New Jersey Transit’s (NJT) Pascack Valley Rail Line to the Meadowlands Sports Complex, encourages greater use of PATH service since NJT runs shuttle bus service at peak times to Hoboken. The improved level of passenger rail service provided by the facility also serves to ease traffic congestion on the Port Authority’s interstate tunnel and bridge crossings. The Port Authority is authorized to provide up to $150 million towards the project’s capital costs. All funds under this program have been fully allocated and expended.
Notes to Consolidated Financial Statements(continued)

102 THE PORT AUTHORITY OF NY & NJ
As of December 31, 2016, approximately $2.1 billion has been expended for regional programs. Costs for these programs that are not otherwise recognized as part of an existing Port Authority facility, are deferred and amortized over the period benefited, up to a maximum of 15 years. The unamortized costs of the regional programs are as follows:
dec. 31, Project dec. 31, 2015 expenditures Amortization 2016
(In thousands)
Regional Development Facility $ 7,483 $ — $ 5,491 $ 1,992 Regional Economic Development Program 16,936 — 13,674 3,262Oak Point Rail Freight Link 1,629 — 1,629 —New Jersey Marine Development Program 858 — 834 24New York Transportation, Economic Development and Infrastructure Renewal Program 50,512 — 9,537 40,975Regional Transportation Program 93,386 — 16,667 76,719Hudson-Raritan Estuary Resources Program 30,512 — 3,600 26,912Regional Rail Freight Program 12,163 — 3,333 8,830Meadowlands Passenger Rail Facility 67,395 — 10,000 57,395
Total unamortized costs of regional programs $ 280,874 $ — $ 64,765 $ 216,109
Note i - Pension Plans
Port Authority employees
Generally, full-time employees of the Port Authority (but not its component units) are required to join one of two cost-sharing, multiple-employer defined benefit pension plans administered by the New York State Comptroller’s Office; the New York State and Local Employees’ Retirement System (ERS) or the New York State and Local Police and Fire Retirement System (PFRS), collectively referred to as the New York State and Local Retirement System (NYSLRS). The New York State Constitution provides that membership in a pension plan or retirement system of the State or of a civil division thereof is a contractual relationship, the benefits of which may not be diminished or impaired.
Nyslrs Plan Benefits
Classes of employees covered under the NYSLRS range from Tiers 1–6. Date ranges determining tier membership follows:
ers membership Pfrs membership
Tier on or After: Before: on or After: Before:
1 – July 1, 1973 – July 31, 1973 2 July 1, 1973 July 27, 1976 July 31, 1973 July 1, 2009 3 July 27, 1976 September 1, 1983 July 1, 2009 January 9, 2010 4 September 1, 1983 January 1, 2010 N/A N/A 5 January 1, 2010 April 1, 2012 January 9, 2010 April 1, 2012 6 April 1, 2012 Present April 1, 2012 Present
Members in Tiers 1–4 need five (5) years of service to be 100 percent vested. Tiers 5–6 members require ten (10) years of service credit to be 100 percent vested.
Participating employers are required under the provisions of the New York State Retirement and Social Security Law (RSSL) to contribute to the NYSLRS at an actuarially determined rate adopted annually by the State Comptroller of New York. The average contribution rate for ERS for the fiscal years ended March 31, 2016 and March 31, 2015 were approximately 18.2 percent and 20.1 percent of payroll, respectively. The average contribution rate for PFRS for the fiscal years ended March 31, 2016 and March 31, 2015 were approximately 24.7 percent and 27.6 percent of payroll, respectively.
Notes to Consolidated Financial Statements(continued)

103THE FOUNDATION FOR A NEW TOMORROW
Generally, Tier 3, 4, and 5 members must contribute 3 percent of their salary to the respective NYSLRS plans. As a result of Article 19 of the RSSL, eligible Tier 3 and 4 employees, with a membership date on or after July 27, 1976, who have ten (10) or more years of membership or credited service with the NYSLRS, are not required to contribute. Members cannot be required to begin making contributions or to make increased contributions beyond what was required when membership began. For Tier 6 members, the contribution rate varies from 3 percent to 6 percent depending on salary. Generally, Tier 5 and 6 members are required to contribute for all years of service.
Benefits for each NYSLRS plan are established and may be amended under the provisions contained in the New York State RSSL.
Tier 1 members, with the exception of those retiring under special retirement plans, must be at least age 55 to be eligible to collect a retirement benefit. There is no minimum service requirement for Tier 1 members. Tier 2 members, with the exception of those retiring under special retirement plans, must have five years of service and be at least age 55 to be eligible to collect a retirement benefit. The age at which full benefits may be collected for Tier 1 is 55, and the full benefit age for Tier 2 is 62. Generally, the benefit for Tier 1 and Tier 2 members is 1.67 percent of final average salary for each year of service if the member retires with less than 20 years. If the member retires with 20 or more years of service, the benefit is 2 percent of final average salary for each year of service. Tier 2 members with five or more years of service can retire as early as age 55 with reduced benefits. Tier 2 members age 55 or older with 30 or more years of service can retire with no reduction in benefits. As a result of Article 19 of the RSSL, Tier 1 and Tier 2 members who worked continuously from April 1, 1999 through October 1, 2000 received an additional month of service credit for each year of credited service they have at retirement, up to a maximum of 24 additional months. Final average salary is the average of the wages earned in the three highest consecutive years of employment. For Tier 1 members who joined on or after June 17, 1971, each year used in the final average salary calculation is limited to no more than 20 percent greater than the previous year. For Tier 2 members, each year of final average salary is limited to no more than 20 percent greater than the average of the previous two years.
Tier 3 and 4 members, with the exception of those retiring under special retirement plans, must have five years of service and be at least age 55 to be eligible to collect a retirement benefit. Tier 5 members, with the exception of those retiring under special retirement plans, must have ten years of service and be at least age 55 to be eligible to collect a retirement benefit. The full benefit age for Tiers 3, 4 and 5 is 62. Generally, the benefit for Tier 3, Tier 4 and Tier 5 members is 1.67 percent of final average salary for each year of service if the member retires with less than 20 years. If a member retires with between 20 and 30 years of service, the benefit is 2 percent of final average salary for each year of service. If a member retires with more than 30 years of service, an additional benefit of 1.5 percent of final average salary is applied for each year of service over 30 years. Tier 3 and 4 members with five or more years of service and Tier 5 members with ten or more years of service can retire as early as age 55 with reduced benefits. Tier 3 and 4 members age 55 or older with 30 or more years of service can retire with no reduction in benefits. Final average salary is the average of the wages earned in the three highest consecutive years of employment. For ERS Tier 3, 4 and 5 members, each year used in the final average salary calculation is limited to no more than 10 percent greater than the average of the previous two years. For PFRS Tier 5 (there are no Port Authority members enrolled in PFRS Tier 3 and 4), each year used in the final average salary calculation is limited to no more than 20 percent greater than the average of the previous two years.
Tier 6 members, with the exception of those retiring under special retirement plans, must have ten years of service and be at least age 55 to be eligible to collect a retirement benefit. The full benefit age for Tier 6 is 63 for ERS members and 62 for PFRS members. Generally, the benefit for Tier 6 members is 1.67 percent of final average salary for each year of service if the member retires with less than 20 years. If a member retires with 20 years of service, the benefit is 1.75 percent of final average salary for each year of service. If a member retires with more than 20 years of service, an additional benefit of 2 percent of final average salary is applied for each year of service over 20 years. Tier 6 members with ten or more years of service can retire as early as age 55 with reduced benefits. Final average salary is the average of the wages earned in the five highest consecutive years. For Tier 6 members, each year of final average salary is limited to no more than 10 percent of the average of the previous four years.
Certain Port Authority PFRS members belong to 25-Year Plans, which allows for retirement after 25 years of service with a benefit of one-half of final average salary or 20-Year Plans, which allows for retirement after 20 years of service with a benefit of one-half of final average salary.
Port Authority contributions to NYSLRS in 2016 totaled $115.3 million including, $57.5 million to ERS and $57.8 million to PFRS.
Detailed information about the fiduciary net position and valuation methods related to ERS and PFRS can be found in the NYSLRS Annual Report as of and for the years ended March 31, 2016 and March 31, 2015, which is publically available at the following web address: http://www.osc.state.ny.us/retire/about_us/financial_statements_index.php
Notes to Consolidated Financial Statements(continued)

104 THE PORT AUTHORITY OF NY & NJ
Nyslrs — Net Pension liabilities, Pension expense, deferred outflows of resources and deferred inflows of resources
Nyslrs Net Pension liability — 2016 and 2015
GASB Statement No. 68 defines the Net Pension Liability (NPL) as the difference between the Total Pension Liability (TPL) and the pension plan’s fiduciary net position determined as of a measurement date established by the employer. For purposes of measuring the NPL, the plan’s fiduciary net position has been determined on the same basis as they are reported for ERS and PFRS. Benefit payments are recognized when due and payable in accordance with the benefit terms and investments are measured at their fair value.
The Port Authority’s proportionate share of the NYSLRS plans’ NPLs totaled:
NPl december 31, 2016 december 31, 2015
(In millions)
ERS $ 212.6 $ 44.9PFRS 236.0 24.5
Total Net Pension liability $ 448.6 $ 69.4
The NPLs at December 31, 2016 and 2015 were measured as of March 31, 2016 and 2015, based on actuarial valuations as of April 1, 2015 and 2014, with update procedures used to roll forward the TPL to March 31, 2016 and 2015, respectively.
The Port Authority’s proportion of the NYSLRS plans’ NPL totaled:
march 31, 2016 march 31, 2015
ERS 1.3% 1.3%
PFRS 8.0% 8.9%
The Port Authority’s proportionate share of the ERS and PFRS NPLs were actuarially determined based on the projection of the Port Authority’s long-term share of contributions to each respective plan relative to the projected long-term contributions of all participating employers of each plan.
Nyslrs Pension expense -2016 and 2015
For the twelve months ended December 31, 2016, pension expense related to NYSLRS totaled $161.8 million, including $78.3 million related to ERS and $83.5 million related to PFRS.
For the twelve months ended December 31, 2015, pension expense related to NYSLRS totaled $97.2 million, including $41.9 million related to ERS and $55.3 million related to PFRS.
Nyslrs deferred inflows/outflows of resources- 2016 and 2015
GASB Statement No. 68 requires certain changes in the NPL to be recognized as deferred inflows of resources or deferred outflows of resources. These deferred outflows and deferred inflows of resources are amortized as either an increase or decrease to future years pension expense, using a systematic and rational method over a closed period.
The Port Authority reported deferred outflows of resources and deferred inflows of resources related to NYSLRS from the following sources at December 31, 2016:
deferred outflows of resources ers Pfrs Total
(In thousands)
Differences between expected and actual experience $ 1,074 $ 2,117 $ 3,191 Changes in actuarial assumptions 56,682 101,741 158,423Net difference between projected and actual earnings on pension plan investments 126,099 132,261 258,360 Changes in proportion and differences between Port Authority contributions and proportionate share of contributions 8,326 — 8,326Port Authority contributions subsequent to the measurement date* 57,530 57,807 115,337
Total deferred outflows of resources $ 249,711 $ 293,926 $ 543,637
* Contributions made by participating employers to pension plans after the measurement date to satisfy the pension plan’s Net Pension Liability, but before the end of the financial statement period for the employer, are recognized as deferred outflows of resources.
Notes to Consolidated Financial Statements(continued)

105THE FOUNDATION FOR A NEW TOMORROW
deferred inflows of resources ers Pfrs Total
(In thousands)
Differences between expected and actual experience $ 25,195 $ 35,681 $ 60,876 Changes in proportion and differences between Port Authority contributions and proportionate share of contributions 107 15,136 15,243
Total deferred inflows of resources $ 25,302 $ 50,817 $ 76,119
The amount of deferred outflows of resources associated with contributions made subsequent to the measurement date will be recognized as a reduction to the ERS and PFRS NPL for the fiscal year ended December 31, 2017. The remaining deferred outflows and deferred inflows of resources related to NYSLRS plans to be recognized in future years’ pension expense are as follows:
year ended december 31: ers Pfrs Total
(In thousands)
2017 $ 42,623 $ 43,937 $ 86,560 2018 42,623 43,937 86,5602019 42,623 43,937 86,560 2020 39,010 42,097 81,1072021 — 11,394 11,394
Total $ 166,879 $ 185,302 $ 352,181
The Port Authority reported deferred outflows of resources and deferred inflows of resources related to NYSLRS from the following sources at December 31, 2015:
deferred outflows of resources ers Pfrs Total
(In thousands)
Differences between expected and actual experience $ 1,438 $ 2,952 $ 4,390 Net difference between projected and actual earnings on pension plan investments 7,800 8,222 16,022 Changes in proportion and differences between Port Authority contributions and proportionate share of contributions 5,239 — 5,239Port Authority contributions subsequent to the measurement date* 63,072 53,652 116,724
Total deferred outflows of resources $ 77,549 $ 64,826 $ 142,375
* Contributions made by participating employers to pension plans after the measurement date to satisfy the pension plan’s Net Pension Liability, but before the end of the financial statement period for the employer, are recognized as deferred outflows of resources.
deferred inflows of resources ers Pfrs Total
(In thousands)
Changes in proportion and differences between Port Authority contributions and proportionate share of contributions $ — $ 7,555 $ 7,555
Total deferred inflows of resources $ — $ 7,555 $ 7,555
Notes to Consolidated Financial Statements(continued)

106 THE PORT AUTHORITY OF NY & NJ
Nyslrs Actuarial Assumptions - 2016 and 2015
The TPL for each plan was determined using an actuarial valuation as of April 1, 2015 for fiscal year 2016 and April 1, 2014 for fiscal year 2015, with update procedures used to roll forward the TPL to the measurement dates of March 31, 2016 and March 31, 2015 respectively. These actuarial valuations used the following actuarial assumptions:
ers 2016 2015
Investment rate of return 7.0% compounded annually, 7.5% compounded annually, net of investment expenses, net of investment expenses, including inflation including inflationSalary Scale 3.8%, indexed by service 4.9%, indexed by serviceInflation 2.5% 2.7%
Cost of living adjustment 1.3% 1.4%
Pfrs 2016 2015
Investment rate of return 7.0% compounded annually, 7.5% compounded annually, net of investment expenses, net of investment expenses, including inflation including inflationSalary Scale 4.5%, indexed by service 6.0%, indexed by serviceInflation 2.5% 2.7%
Cost of living adjustment 1.3% 1.4%
Mortality rates for the fiscal year 2016 actuarial valuation are based on each Plan’s 2015 experience study of the period April 1, 2010 through March 31, 2015, with adjustments for mortality improvement based on the Society of Actuaries’ Scale MP-2014.
Mortality rates for the fiscal year 2015 actuarial valuation are based on each Plan’s 2010 experience study of the period April 1, 2005 through March 31, 2010, with adjustments for mortality improvement based on the Society of Actuaries’ Scale MP-2014.
The long-term expected rate of return on pension plan investments for each actuarial valuation for ERS and PFRS was determined using a building-block method in which best-estimate ranges of expected future real rates of return (expected return, net of investment expenses and inflation) are developed for each major asset class. These ranges are combined to produce the long-term expected rate of return by weighting the expected future real rates of return by the target asset allocation percentage and by adding expected inflation. The target allocation and best estimates of arithmetic real rates of return for each major asset class included in the determination of the investment rate of return for each actuarial valuation are summarized in the following table:
Long–Term Expected Asset Class Target Allocation Real Rate of Return
Domestic equity 38% 7.30%International equity 13% 8.55%Private equity 10% 11.00%Real estate 8% 8.25%Absolute return strategies 3% 6.75%Opportunistic portfolio 3% 8.60%Real assets 3% 8.65%Bonds and mortgages 18% 4.00%Cash 2% 2.25%Inflation–indexed bonds 2% 4.00%
Total 100%
Notes to Consolidated Financial Statements(continued)

107THE FOUNDATION FOR A NEW TOMORROW
Nyslrs discount rate Analysis-2016 and 2015
The discount rate used to calculate the TPL for ERS and PFRS was 7.0% for 2016 and 7.5% for 2015, respectively. The projection of cash flows used to determine the discount rate assumes that employee contributions will be made at the current contribution rates and that employer contributions will be made at their contractually required rates, as actuarially determined.
Based upon these assumptions, the fiduciary net position was projected to be available to make all projected future benefit payments of current plan members for both ERS and PFRS. Therefore, the long-term expected rate of return on pension plan investments was applied to all periods of projected benefit payments to determine the TPL for each plan.
The following tables present the Port Authority’s proportionate share of the NPL for ERS and PFRS calculated for 2016 and 2015 using a discount rate that is 1 percentage-point lower or 1 percentage-point higher than the discount rate actually used.
1% Decrease Discount Rate 1% Increase 2016 (6.0%) (7.0%) (8.0%)
(In thousands)
ERS - Port Authority’s proportionate share of the NPL $ 479,295 $ 212,555 $ (12,830)PFRS - Port Authority’s proportionate share of the NPL 527,139 236,004 (8,031)
Total $ 1,006,434 $ 448,559 $ (20,861)
1% Decrease Discount Rate 1% Increase 2015 (6.5%) (7.5%) (8.5%)
(In thousands)
ERS - Port Authority’s proportionate share of the NPL $ 299,320 $ 44,906 $ (169,882)PFRS - Port Authority’s proportionate share of the NPL 326,073 24,490 (228,254)
Total $ 625,393 $ 69,396 $ (398,136)
Additional information related to the Port Authority’s proportionate share of the net pension liability for ERS and PFRS and the Port Authority’s contributions to ERS and PFRS can be found in the Required Supplementary Information (RSI) section of this report following the appended notes.
New york state Voluntary defined contribution Program (Vdc)
Non-represented New York State public employees hired on or after July 1, 2013, with annual wages of $75,000 or more are eligible to participate in the VDC by electing out of the ERS defined benefit pension plan. The VDC plan is administered by TIAA-CREF. System benefits and contribution requirements are established and may be amended under provisions of the RSSL.
An electing VDC employee contributes up to six percent (6%) of their annual gross wages with an additional employer contribution of eight percent (8%) of the employee’s annual gross wages.
As of December 2016 and 2015, 131 and 90 employees, respectively were enrolled in the VDC program since inception. The following table shows employee and employer contributions (reported as pension expense):
2016 2015
Employer Contributions $ 900,994 $ 559,028Employee Contributions 664,349 449,134
Total $ 1,565,343 $ 1,008,162
Notes to Consolidated Financial Statements(continued)

108 THE PORT AUTHORITY OF NY & NJ
Port Authority Trans-hudson corporation (PATh) employees
federal railroad retirement Program
Employees of PATH are not eligible to participate in NYSLRS. In accordance with Federal Railroad Retirement legislation enacted in 1935, and amended thereafter, all PATH employees are members of the two tiered Federal Railroad Retirement Program administered by the U.S. Railroad Retirement Board. The Federal Railroad Retirement Program is a cost-sharing defined benefit pension plan, providing benefits to employees of governmental and private sector railroad entities. Program benefits are established and may be amended by federal legislation. Under the Federal Railroad Retirement Program, employees are entitled to retirement benefits related to years of railroad service, age and salary. Survivor and disability benefits are also available to members based on program eligibility requirements. Vesting of benefits is determined after a set period of credited railroad service. Funding of the Federal Railroad Retirement Program is legislatively determined through the collection of employer and employee Railroad Retirement Taxes. In 2016 and 2015, 1,242 and 1,204 PATH employees, respectively, participated in the Federal Railroad Retirement Program.
Employer and employee contributions to the Federal Railroad Retirement Program were as follows:
railroad retirement employee employee employer employer Total Tier i Tax rate Taxes Tax rate Taxes Taxes
($ In thousands)
2016 7.65% $ 8,086 7.65% $ 8,086 $ 16,1722015 7.65% 7,747 7.65% 7,747 15,494
railroad retirement employee employee employer employer Total Tier ii Tax rate Taxes Tax rate Taxes Taxes
($ In thousands)
2016 4.9% $ 4,475 13.1% $ 11,964 $ 16,4392015 4.9% 4,379 13.1% 11,707 16,086
Detailed information about the Federal Railroad Retirement Program can be found in the U.S. Federal Railroad Retirement Board Performance and Accountability Report, which is publically available at the following web address: http://www.rrb.gov/pdf/oig/reports/1601.pdf
PATh employees supplemental Pension Plans
In addition to pension benefits provided under the Federal Railroad Retirement Program, PATH employees are eligible to participate in certain supplemental pension plans.
PATh represented employees
For PATH employees covered under collective bargaining agreements, PATH makes defined contributions to supplemental pension plans administered exclusively by trustees comprised of and appointed by union members. Benefits are established and may be amended at the sole discretion of the trustees. PATH is not responsible for funding deficiencies or entitled to funding surpluses related to these supplemental pension plans. PATH’s sole responsibility related to these supplemental pension plans are contributions defined in various collective bargaining agreements. Contributions by PATH to these supplemental pension plans totaled approximately $6.7 million in 2016 and $6.4 million in 2015.
PATh exempt employee supplemental Pension Plan
Employees of PATH who are not covered by collective bargaining agreements (PATH Exempt Employees) are members of the PATH Exempt Employees Supplemental Pension Plan, amended and restated as of January 1, 2011 (the Plan). The Plan is a non-contributory, unfunded, single-employer, defined benefit, qualified governmental pension plan administered by PATH. The Plan provides retirement benefits related to years of service as a PATH Exempt Employee and final average salary, death benefits for active PATH Exempt Employees, vesting of retirement benefits after a set period of credited service as a PATH Exempt Employee, and optional methods of retirement benefit payment. Depending upon the date of membership, retirement benefits differ as to the qualifying age or years of service requirement and the benefit formula used in calculating retirement benefits.
On August 22, 2013, The Port Authority established the PATH Exempt Employees Supplemental Pension Plan Trust with Wells Fargo Institutional Retirement Trust services as Trustee. As of December 31, 2016, no amounts have been deposited into the trust to prefund future pension obligations.
Notes to Consolidated Financial Statements(continued)

109THE FOUNDATION FOR A NEW TOMORROW
PATh exempt employee supplemental Pension Plan –
Total Pension liability, Pension expense, deferred outflows of resources and deferred inflows of resources
PATh exempt employee supplemental Pension Plan Total Pension liability - 2016 and 2015
GASB Statement No. 68 defines the Net Pension Liability (NPL) as the difference between the Total Pension Liability (TPL) and the pension plan’s fiduciary net position. As the Plan is unfunded and has no plan assets, the TPL and NPL are of equal amounts. The Plan’s TPL reported at December 31, 2016, was measured as of January 1, 2016, based on an actuarial valuation as of the same date. The plan’s TPL for the year ended December 31, 2016, was $83.4 million. Changes in the TPL from the previous measurement date are as follows:
Total Pension Liability - 2016
(In thousands)
Balance as of 12/31/2015 (based on 1/1/2015 Measurement Date) $ 81,095Changes recognized for the fiscal year: Service cost 1,280 Interest on the total pension liability 2,850 Differences between expected and actual experience (945) Changes in assumptions 3,809 Benefit payments (1/1/15 -12/31/15) (4,701)
Net change in TPL 2,293
Balance recognized at 12/31/2016 (based on 1/1/2016 Measurement Date) $ 83,388
The Plan’s TPL reported at December 31, 2015 was measured as of January 1, 2015 based on an actuarial valuation as of the same date. The plan’s TPL for the year ended December 31, 2015 was $81.1 million.
Total Pension Liability - 2015
(In thousands)
Balance as of 12/31/2014 (based on 1/1/2014 Measurement Date) $ 69,630Changes recognized for the fiscal year: Service cost 900 Interest on the total pension liability 3,271 Differences between expected and actual experience 51 Changes in assumptions 10,632 Benefit payments (1/1/14 -12/31/14) (3,389)
Net change in TPL 11,465
Balance recognized at 12/31/2015 (based on 1/1/2015 Measurement Date) $ 81,095
PATh exempt employee supplemental Pension Plan Pension expense- 2016 and 2015
For the twelve months ended December 31, 2016 and December 31, 2015, pension expense related to the Plan totaled $7.3 million and $6.7 million, respectively.
Notes to Consolidated Financial Statements(continued)

110 THE PORT AUTHORITY OF NY & NJ
PATh exempt employee supplemental Pension Plan deferred outflows/inflows of resources - 2016 and 2015
GASB Statement No. 68 requires certain changes in the NPL to be recognized as deferred inflows of resources or deferred outflows of resources. These deferred outflows and deferred inflows of resources, are amortized as either an increase or decrease to future years pension expense using a systematic and rational method over a closed period.
At December 31, 2016 and December 31, 2015, the Port Authority reported deferred outflows of resources totaling:
Deferred Outflows Deferred Outflows 12/31/2016 12/31/2015
(In thousands)
Differences between actual and expected experience $ 27 $ 39 Changes in actuarial assumptions 8,567 8,143Contributions subsequent to the measurement date* 3,563 4,702
Total $ 12,157 $ 12,884
* Contributions made by participating employers to pension plans after the measurement date to satisfy the pension plan’s Net Pension Liability, but before the end of the financial statement period for the employer, are recognized as deferred outflows of resources.
At December 31, 2016 and December 31, 2015, the Port Authority reported deferred inflows of resources totaling:
Deferred Inflows Deferred Inflows 12/31/2016 12/31/2015
(In thousands)
Differences between actual and expected experience $ 723 $ —
Total $ 723 $ —
The amounts of deferred outflows of resources at December 31, 2016 associated with contributions made subsequent to the measurement date will be recognized as a reduction to the TPL for the fiscal year ended December 31, 2017. The remaining deferred outflows of resources and deferred inflows of resources at December 31, 2016 related to the PATH Exempt Employee Supplemental Pension Plan to be recognized in future years pension expense are as follows:
Year ended December 31, Total Amortization
(In thousands)
2017 $ 3,1752018 3,1752019 1,3522020 169
Total $ 7,871
PATh exempt employee supplemental Pension Plan Actuarial Assumptions- 2016 and 2015
The TPL measured as of January 1, 2016 and January 1, 2015, based on an actuarial valuation as of the same date was determined using the following actuarial assumptions:
Inflation 2.5%Salary increases 3.0%Investment rate of return N/A
Actuarial assumptions used in the January 1, 2016 valuation were based on the results of an actuarial experience study for the period of January 1, 2015 to December 31, 2015. Actuarial assumptions used in the January 1, 2015 valuation were based on the results of an actuarial experience study for the period of January 1, 2014 to December 31, 2014. Mortality rates used in the 2016 valuation were based on RP-2014 Combined Healthy Mortality Table projected on a generational basis with Scale MP-2015 from the central year. Mortality rates used in the 2015 valuation were based on RP-2000 Fully Generational Scale AA Combined Healthy Mortality Table. Projections of benefits for financial reporting purposes are based on the terms of the Plan as described by PATH to participants, and include the types of benefits provided at the time of each valuation.
Notes to Consolidated Financial Statements(continued)

111THE FOUNDATION FOR A NEW TOMORROW
As of the January 1, 2016 and January 1, 2015 valuation date, Plan participants comprised:
2016 2015
Retired PATH Exempt Employees (or their beneficiaries) 104 93 Active PATH Exempt Employees 89 92Terminated but vested employees who are not currently receiving benefits 21 25
Total participants 214 210
PATh exempt employee supplemental Pension Plan discount rate Analysis- 2016 and 2015
Because the plan is unfunded, the discount rate used in the actuarial valuation is based on the 20-year municipal Bond Buyer Index for general obligations which equaled 3.57% as of the January 1, 2016 measurement date and 3.56% as of the January 1, 2015 measurement date.
The following tables present the 2016 and 2015 Plan’s TPL calculated using a discount rate that is 1 percentage-point lower or 1 percentage-point higher than the discount rate actually used.
1% Decrease Discount Rate 1% Increase 2016 (2.57%) (3.57%) (4.57%)
(In thousands)
Total Pension Liability $ 94,940 $ 83,388 $ 73,845
1% Decrease Discount Rate 1% Increase 2015 (2.56%) (3.56%) (4.56%)
(In thousands)
Total Pension Liability $ 91,982 $ 81,095 $ 72,015
Note J – other Postemployment employee Benefits (oPeB)
oPeB Plan Benefits
The Port Authority and PATH provide, pursuant to Board action or as contemplated thereby, certain group health care, prescription, dental, vision and term life insurance benefits for retired employees of the Port Authority and PATH (includes eligible dependents and survivors of retired employees). Collectively, these covered individuals are referred to as “participants.” Contributions toward the costs of these benefits are required of certain non-represented participants. Retiree contributions for certain non-represented participants generally range from 3% to 100% of the Port Authority’s or PATH’s cost of providing retiree benefits and are dependent on a number of factors including, type of benefit, hire date, years of service, pension earnings and retirement date. Benefits are provided through insurance companies whose premiums are based on the benefits paid during the year, or through plans under which benefits are paid by service providers on behalf of the Port Authority or PATH.
oPeB Actuarial methods and Assumptions
The actuarially determined valuation of OPEB is reviewed annually for the purpose of estimating the present value of postemployment benefits earned by plan participants as of the valuation.
Projections of benefits for financial reporting purposes are based on the benefit plans as described by the Port Authority and PATH to participants, and include the types of benefits provided at the time of each valuation and the historical pattern of sharing of benefit costs to that point. The actuarial methods and assumptions used include techniques that are designed to reduce the effects of short-term volatility in actuarial accrued liabilities, consistent with the long-term perspective of the calculations.
Actuarial valuations of an ongoing plan involve estimates and assumptions about the probability of occurrence of events far into the future, including future employment with a salary scale at a rate of 3% per year, mortality, and healthcare cost trends. Actuarially determined amounts are subject to
Notes to Consolidated Financial Statements(continued)

112 THE PORT AUTHORITY OF NY & NJ
continual revision as actual results are compared with past expectations and new estimates are made about the future.
In the January 1, 2016 actuarial valuation of the Port Authority and PATH OPEB obligation, the projected unit credit cost method was used for all 14,930 participants (7,483 active, 5,881 retirees, and 1,566 surviving spouses). The actuarial assumptions used to project future costs included a 7% investment rate of return (discount rate), representing the estimated yield on investments expected to be used for the payment of benefits; medical healthcare cost trend rates of 7.25% for Pre 65 year old participants and 6.25% for Post 65 year old participants, declining to an ultimate medical healthcare cost trend rate of 5% in 2022 (including 2.5% inflation factor), a pharmacy benefit cost trend rate of 10% decreasing to 5% in 2022; a dental benefit cost trend rate of 5% per year for all years; and an Employer Group Waiver Plan (EGWP) savings of 5% per year for all years. The unfunded Actuarial Accrued Liability (AAL) is being amortized as a level dollar amount over an open period of 30 years.
oPeB costs and obligations
OPEB benefit costs and obligations are actuarially determined in accordance with the parameters of GASB Statement No. 45, Accounting and Financial Reporting by Employers for Postemployment Benefits Other Than Pensions.
The AAL, representing the amount of OPEB benefits earned by plan participants in prior periods, totaled $2.9 billion as of January 1, 2016. The 2016 unfunded AAL, totaling $1.9 billion represents the difference between the AAL of $2.9 billion and the amount of plan assets of $956 million.
The following reflects the components of the 2016 and 2015 annual OPEB costs, amounts paid, and changes to the net accrued OPEB obligation based on the January 1, 2016 and 2015 actuarial valuations:
2016 2015
(In millions)
Annual OPEB cost: Annual required contribution (ARC): Normal cost $ 43.8 $ 40.5 Amortization cost 152.9 139.0
Total ARC 196.7 179.5 Adjustments to ARC (27.7) (33.3)
Annual OPEB cost $ 169.0 $ 146.2
2016 2015
(In millions)
Net OPEB Obligation: Net OPEB obligation at the beginning of fiscal year $ 77.4 $ 160.4 Annual OPEB cost 169.0 146.2 Employer contributions: OPEB payments (145.8) (129.2) Trust contributions (100.0) (100.0)
Total employer contributions (245.8) (229.2)
Net accrued OPEB obligation as of December 31st, $ 0.6 $ 77.4
The normal cost of $43.8 million represents the amount of OPEB benefits earned by plan participants in the current period.
Amortization of the unfunded AAL totaling $152.9 million represents the annual funding requirement that if paid quarterly over a thirty-year period at an interest rate of 7% would satisfy the unfunded AAL of $1.9 billion.
The Medicare Prescription Drug, Improvement, and Modernization Act of 2003 established a new prescription drug benefit commonly known as Medicare Part D. The Port Authority’s application to the Centers for Medicare and Medicaid Services (CMS) within the Department of Health and Human Services to sponsor a Part D Plan for retirees was approved effective January 1, 2006. Effective January 1, 2009, the Port Authority contracted with Express Scripts, Inc. for an Employee Group Waiver Plan (CMS approved series 800 plan) covering its retirees. Under the contract, Express Scripts, Inc. assumed responsibility for the administrative and compliance obligations imposed by CMS. In 2016, CMS payments to Express Scripts, Inc., on behalf of the Port Authority, totaled approximately $1.4 million. These amounts were considered in calculating the actuarial valuation of the OPEB liability.
Notes to Consolidated Financial Statements(continued)
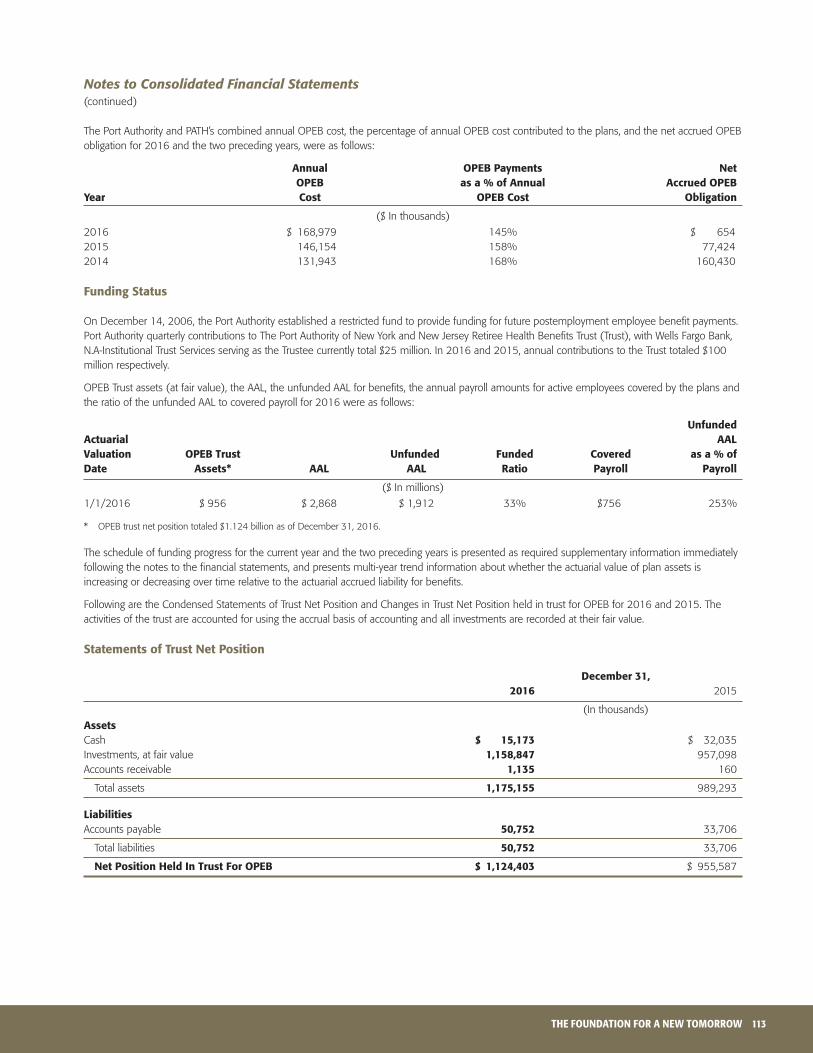
113THE FOUNDATION FOR A NEW TOMORROW
The Port Authority and PATH’s combined annual OPEB cost, the percentage of annual OPEB cost contributed to the plans, and the net accrued OPEB obligation for 2016 and the two preceding years, were as follows:
Annual oPeB Payments Net oPeB as a % of Annual Accrued oPeB year cost oPeB cost obligation
($ In thousands)
2016 $ 168,979 145% $ 6542015 146,154 158% 77,4242014 131,943 168% 160,430
funding status
On December 14, 2006, the Port Authority established a restricted fund to provide funding for future postemployment employee benefit payments. Port Authority quarterly contributions to The Port Authority of New York and New Jersey Retiree Health Benefits Trust (Trust), with Wells Fargo Bank, N.A-Institutional Trust Services serving as the Trustee currently total $25 million. In 2016 and 2015, annual contributions to the Trust totaled $100 million respectively.
OPEB Trust assets (at fair value), the AAL, the unfunded AAL for benefits, the annual payroll amounts for active employees covered by the plans and the ratio of the unfunded AAL to covered payroll for 2016 were as follows:
unfunded Actuarial AAl Valuation oPeB Trust unfunded funded covered as a % of date Assets* AAl AAl ratio Payroll Payroll
($ In millions)
1/1/2016 $ 956 $ 2,868 $ 1,912 33% $756 253%
* OPEB trust net position totaled $1.124 billion as of December 31, 2016.
The schedule of funding progress for the current year and the two preceding years is presented as required supplementary information immediately following the notes to the financial statements, and presents multi-year trend information about whether the actuarial value of plan assets is increasing or decreasing over time relative to the actuarial accrued liability for benefits.
Following are the Condensed Statements of Trust Net Position and Changes in Trust Net Position held in trust for OPEB for 2016 and 2015. The activities of the trust are accounted for using the accrual basis of accounting and all investments are recorded at their fair value.
statements of Trust Net Position
december 31, 2016 2015
(In thousands)
AssetsCash $ 15,173 $ 32,035 Investments, at fair value 1,158,847 957,098 Accounts receivable 1,135 160
Total assets 1,175,155 989,293
liabilitiesAccounts payable 50,752 33,706
Total liabilities 50,752 33,706
Net Position held in Trust for oPeB $ 1,124,403 $ 955,587
Notes to Consolidated Financial Statements(continued)
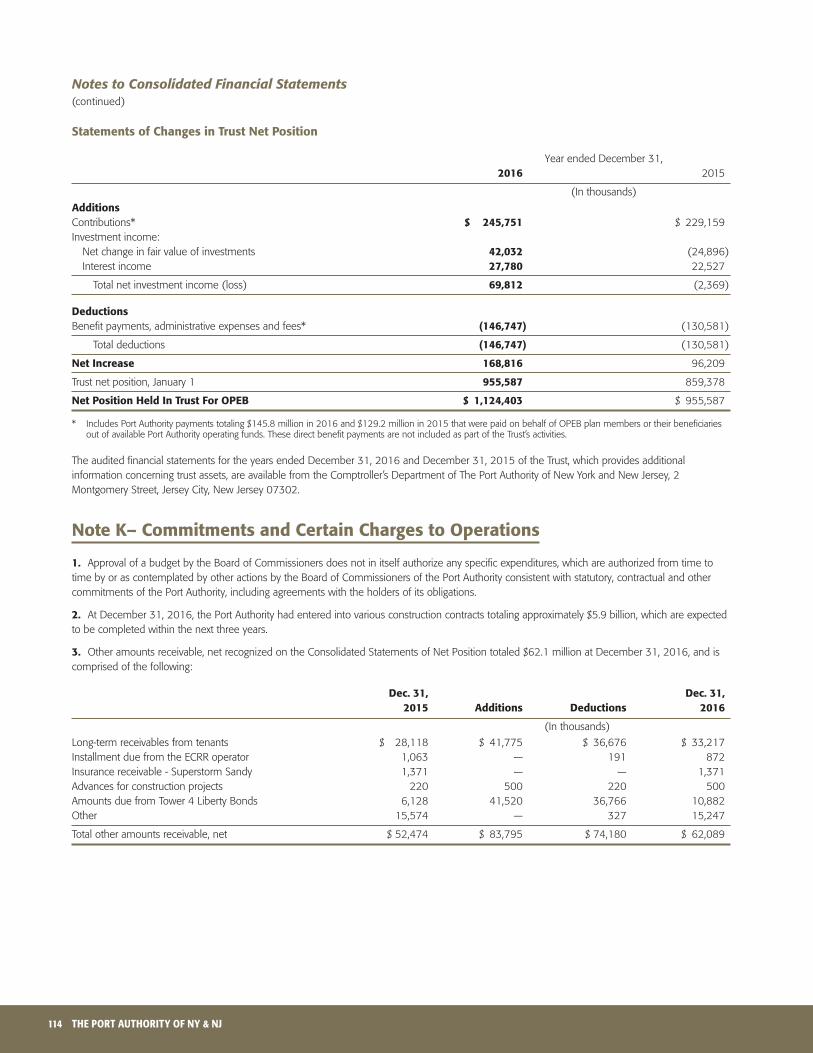
114 THE PORT AUTHORITY OF NY & NJ
statements of changes in Trust Net Position
Year ended December 31, 2016 2015
(In thousands)
AdditionsContributions* $ 245,751 $ 229,159Investment income: Net change in fair value of investments 42,032 (24,896) Interest income 27,780 22,527
Total net investment income (loss) 69,812 (2,369)
deductionsBenefit payments, administrative expenses and fees* (146,747) (130,581)
Total deductions (146,747) (130,581)
Net increase 168,816 96,209
Trust net position, January 1 955,587 859,378
Net Position held in Trust for oPeB $ 1,124,403 $ 955,587
* Includes Port Authority payments totaling $145.8 million in 2016 and $129.2 million in 2015 that were paid on behalf of OPEB plan members or their beneficiaries out of available Port Authority operating funds. These direct benefit payments are not included as part of the Trust’s activities.
The audited financial statements for the years ended December 31, 2016 and December 31, 2015 of the Trust, which provides additional information concerning trust assets, are available from the Comptroller’s Department of The Port Authority of New York and New Jersey, 2 Montgomery Street, Jersey City, New Jersey 07302.
Note k– commitments and certain charges to operations
1. Approval of a budget by the Board of Commissioners does not in itself authorize any specific expenditures, which are authorized from time to time by or as contemplated by other actions by the Board of Commissioners of the Port Authority consistent with statutory, contractual and other commitments of the Port Authority, including agreements with the holders of its obligations.
2. At December 31, 2016, the Port Authority had entered into various construction contracts totaling approximately $5.9 billion, which are expected to be completed within the next three years.
3. Other amounts receivable, net recognized on the Consolidated Statements of Net Position totaled $62.1 million at December 31, 2016, and is comprised of the following:
dec. 31, dec. 31, 2015 Additions deductions 2016
(In thousands)
Long-term receivables from tenants $ 28,118 $ 41,775 $ 36,676 $ 33,217Installment due from the ECRR operator 1,063 — 191 872Insurance receivable - Superstorm Sandy 1,371 — — 1,371Advances for construction projects 220 500 220 500Amounts due from Tower 4 Liberty Bonds 6,128 41,520 36,766 10,882Other 15,574 — 327 15,247
Total other amounts receivable, net $ 52,474 $ 83,795 $ 74,180 $ 62,089
Notes to Consolidated Financial Statements(continued)

115THE FOUNDATION FOR A NEW TOMORROW
4. The 2016 balance of Other noncurrent liabilities consists of the following:
dec. 31, dec. 31, 2015 Additions deductions 2016
(In thousands)
Self-Insured Worker’s Compensation Claims $ 61,422 $ 22,376 $ 20,639 $ 63,159Self-Insured Public Liability Claims 58,900 15,832 6,701 68,031Pollution remediation obligation 18,493 6,564 2,862 22,195Asset forfeiture program 25,932 1,796 4,350 23,378Surety and security deposits 4,570 440 107 4,903WTC Joint Venture Preferred Returns 37,707 48,014 43,107 42,614Vacated temporary offices exit obligations 14,145 407 13,093 1,459Goethals Bridge Replacement milestones 47,182 62,303 25,000 84,485Deferred Gain/Loss on NLCC 4,761 - - 4,761Other 36,623 3,721 5,608 34,736
Total Liabilities $ 309,735 $ 161,453 $ 121,467 $ 349,721 Less: Current worker’s compensation liability 16,090 17,079 Current Goethals Bridge milestones — 25,000
Total other non-current liabilities $ 293,645 $ 307,642
Unearned income related to the transfer of the Port Authority’s interests in the WTC Retail Joint Venture is:
dec. 31, dec. 31, 2015 Additions deductions 2016
(In thousands)
Unearned Income related to WTC Retail Joint Venture $ 704,697 $ 77,869 $ 8,568 $ 773,998
For additional information See Note L- Information with Respect to the Redevelopment of the World Trade Center Site.
5. In accordance with GASB Statement No. 49, Accounting and Financial Reporting for Pollution Remediation Obligations, an operating expense provision and corresponding liability measured at its current value using the expected cash flow method is recognized when an obligating event occurs. In 2016, the Port Authority recognized an additional $6.6 million in pollution remediation obligations, primarily related to asbestos abatement at certain Aviation and Port facilities. Cumulative operating expense remediation provisions through December 31, 2016 totaled $78 million, net of $2.1 million in expected recoveries.
As of December 31, 2016, the outstanding pollution remediation liability totaled $22.2 million, primarily consisting of future remediation activities associated with asbestos removal, lead abatement, ground water contamination, soil contamination, and arsenic contamination at Port Authority facilities.
Note l – information with respect to the
redevelopment of the world Trade center site
conceptual framework for the redevelopment of the office, retail and other components of the world Trade center
The terms of the original July 2001 net leases established both an obligation and concomitant right for the net lessees, at their sole cost and expense, to restore their net leased premises following a casualty whether or not the damage is covered by insurance proceeds in accordance, to the extent feasible, prudent and commercially reasonable, with the plans and specifications as they existed before the casualty or as otherwise agreed to with the Port Authority.
The redevelopment of the WTC provides for approximately 10 million square feet of above-grade office space with associated storage, mechanical, loading, below-grade parking, and other non-office space, and consists of One World Trade Center, Tower 2, Tower 3, Tower 4, Tower 5, approximately 450,000 square feet of retail space, a WTC Transportation Hub, a memorial and interpretive museum (Memorial/Museum) and cultural facilities and related infrastructure. A December 2010, World Trade Center Amended and Restated Master Development Agreement (MDA), among the Port Authority, PATH, 1 WTC LLC, WTC Retail LLC, and the Silverstein net lessees, sets forth the respective rights and obligations of the parties thereto with respect to construction on the WTC site, including the allocation of construction responsibilities and costs between the parties to the MDA.
Notes to Consolidated Financial Statements(continued)

116 THE PORT AUTHORITY OF NY & NJ
Future minimum rentals (See Note G – Lease Commitments) include rentals of approximately $14 billion, for the years 2021-2100, relating to the net leases for WTC Towers 2, 3 and 4. The inclusion of this amount in future rentals is predicated upon the assumption that the net lessees of various components of the WTC will continue to meet their contractual commitments pertaining to their net leased properties, including those with respect to the payment of rent and the restoration of their net leased properties.
one world Trade center
In November 2006, as part of the continuing redevelopment of the WTC, the Port Authority acquired from Silverstein Properties 100% of the membership interests in 1 WTC LLC, the then-net lessee of One World Trade Center and Tower 5, which will comprise, in the aggregate, approximately 4.2 million square feet of office space. On June 13, 2011, the Port Authority and The Durst Organization entered into various agreements in connection with the establishment of a joint venture with respect to the construction, financing, leasing, management and operation of One World Trade Center. In June 2011, The Durst Organization contributed $100 million for a minority equity interest in the joint venture related to One World Trade Center. One World Trade Center contains 3.0 million square feet of space, comprised of commercial office space and an indoor observation deck. As of December 31, 2016 the Port Authority has leased, (i) approximately 2.06 million square feet of office space at One World Trade Center, representing approximately 69% of the leasable office space, (ii) certain portions of the One World Trade Center rooftop, together with ancillary space, for a broadcasting and communications facility, and (iii) the 100th through 102nd floors of One World Trade Center for an observation deck, which opened to the public in 2015.
world Trade center Tower 3
Under agreements between the Port Authority and the Silverstein net lessee of Tower 3, the Silverstein net lessee of Tower 3 is required to construct the Tower 3 podium, with the construction of the office tower to follow. To assist the Silverstein net lessee of Tower 3 in the construction of the Tower 3 office tower following satisfaction of certain private real estate and capital markets triggers, the Port Authority entered into a Tower 3 Tenant Support Agreement in 2010 (the 2010 Tower 3 Tenant Support Agreement) providing for the investment of Port Authority funds towards the construction of the tower and a backstop of $390 million for certain construction and leasing overruns, senior debt service shortfalls and operating expense deficits. These triggers included the Silverstein Tower 3 net lessee raising $300 million of private equity or mezzanine financing, pre-leasing 400,000 square feet of the office tower, and obtaining private financing for the remaining cost of the office tower. Under separate agreements, the State of New York and the City of New York have each agreed to reimburse the Port Authority for $200 million of the $600 million to be provided under the 2010 Tower 3 Tenant Support Agreement for a total reimbursement of $400 million. Under the 2010 Tower 3 Tenant Support Agreement, the Silverstein net lessee of Tower 3 is responsible for the repayment of the $390 million backstop on a subordinated basis, without interest, from Tower 3 revenues. All repayments of the Tower 3 backstop received by the Port Authority would in turn be distributed among the Port Authority, the State of New York and the City of New York in accordance with their respective shares of the $390 million backstop payments.
In order to maintain the World Trade Center site’s redevelopment progress and continue to balance private sector development with public sector support, on June 25, 2014, the Board of Commissioners of the Port Authority authorized certain amendments to the 2010 Tower 3 Tenant Support Agreement. Under the amended 2010 Tower 3 Tenant Support Agreement, the Port Authority would provide $210 million for the construction of Tower 3 as a landlord capital improvement. The backstop funding of $390 million would be provided for (i) construction overruns and certain leasing cost overruns, (ii) operating expense deficits and certain leasing cost overruns through the Tower 3 net lessee’s right to defer payments of rent to the Port Authority under the net lease with respect to Tower 3, and (iii) senior debt service shortfalls, by the Port Authority as a special limited co-obligor on the senior debt issued for Tower 3, with such senior debt service shortfalls payable as a special obligation of the Port Authority, subject in each case to the overall limit of $390 million for the backstop (See Note E- General and Consolidated Bond Reserve Funds for additional information related to the payment of special obligations of the Port Authority).
In December 2014, the Silverstein net lessee of Tower 3 net lessee issued Tower 3 Liberty bonds in the total aggregate principal amount of $1.6 billion. In accordance with the amended Tower 3 Tenant Support Agreement, in December 2014, the Port Authority made a $210 million landlord capital improvement payment towards the construction of Tower 3. Under a separate Public Support Agreement with the State of New York, the Port Authority applied $80 million of previously received funds as a capital contribution for the partial reimbursement of this landlord capital improvement. Additionally, under a Public Support Agreement with the City of New York, the Port Authority will receive $130 million in future WTC PILOT credits as reimbursement for the remaining share of the Port Authority’s landlord capital improvements.
Notes to Consolidated Financial Statements(continued)

117THE FOUNDATION FOR A NEW TOMORROW
world Trade center Tower 4
For the continued development and construction of Tower 4, with approximately 600,000 of its 2 million square feet of office space preleased to the Port Authority, and approximately 580,000 square feet preleased to the City of New York, in December 2010, the Port Authority entered into certain agreements with the Silverstein net lessee of Tower 4, providing for the Port Authority’s participation in the financing for Tower 4 construction. Additionally, the Silverstein net lessee of Tower 4 has the right to, defer certain rent payments payable to the Port Authority under the Tower 4 net lease, defer certain free rent periods available to the Port Authority under its Tower 4 space lease, receive funding related to certain operating expense deficits upon completion of Tower 4 and receive a limited amount of funding related to construction and leasing cost overruns. The 4 WTC net lessee has exercised its right to defer certain Tower 4 net lease rent payments to the Port Authority effective November 2016.
Tower 4 Liberty Bonds were issued on November 15, 2011, in the total aggregate principal amount of $1.2 billion. The Port Authority is a co-borrower/obligor with respect to the Liberty Bonds issued by the New York Liberty Development Corporation in November 2011 to finance construction of WTC Tower 4. The Port Authority’s payment of debt service on the Tower 4 Liberty Bonds is a special obligation of the Port Authority, evidenced by a separate Tower 4 Bond Payment Agreement between the Port Authority and the Tower 4 Liberty Bond trustee (See Note E- General and Consolidated Bond Reserve Funds for additional information related to the payment of special obligations of the Port Authority). Port Authority debt service payments related to Tower 4 Liberty Bonds, deferred rent payable to the Port Authority under the Tower 4 net lease, deferred rent relating to free rent periods available to the Port Authority under its Tower 4 space lease and funding provided to the Silverstein net lessee related to certain operating expense deficits, construction and leasing overruns is reimbursable to the Port Authority from Tower 4 cash flow and to the extent Tower 4 cash flow is not sufficient, would accrue interest until reimbursed or paid with an overall term for such reimbursement or payment of not in excess of 40 years.
WTC Tower 4 was substantially completed in October 2013 by the Silverstein net lessee of Tower 4 and is available for tenant fit-out. In November 2014, Port Authority corporate staff began occupying certain portions of its leased space in Tower 4, with remaining space being occupied in 2015.
The world Trade center Transportation hub
On July 28, 2005, the Board of Commissioners of the Port Authority authorized the WTC Transportation Hub project. Construction of the WTC Transportation Hub commenced on September 6, 2005, at an estimated total project cost range of approximately $3.74 billion to $3.995 billion. It is presently expected that the Port Authority will receive up to $2.872 billion from the FTA towards the construction of the WTC Transportation Hub. As of December 31, 2016, the Port Authority has received $2.8 billion from the FTA related to the construction of the WTC Transportation Hub. On March 3, 2016, the World Trade Center Transportation Hub Oculus and underground pedestrian connections to certain mass transit lines opened to the public and on August 16, 2016, the retail portions opened to the public.
world Trade center infrastructure Projects
In addition to the WTC Transportation Hub, the Port Authority continues to construct various WTC site infrastructure projects toward full build out of the WTC site. In 2014, certain portions of these infrastructure projects, including portions of the vehicular security center for cars, tour buses, and delivery vehicles to access subgrade loading facilities became operational to support commercial activities throughout the WTC site. Other infrastructure work includes street configurations, utilities, a central chiller plant and related electrical distribution systems that support operations of the WTC site.
wTc retail
In December 2003, as part of the redevelopment of the WTC, the Port Authority acquired 100% of the membership interest in the net lessee of the retail components of the WTC from Westfield for $140 million, and is the sole managing member of this bankruptcy remote single purpose entity, which was renamed “WTC Retail LLC.” The retail project at the WTC site includes certain retail space to be located in the WTC Transportation Hub, One World Trade Center, Tower 2, Tower 3, and Tower 4 (collectively the “Retail Premises”). On August 16, 2016, retail portions of the WTC Transportation Hub opened to the public.
On May 16, 2012, the Port Authority and Westfield entered into various agreements in connection with the establishment of a joint venture with respect to the construction, financing, development, leasing, management and operation of certain retail space at the World Trade Center site. On March 18, 2014, the Port Authority transferred its remaining interest in the joint venture to Westfield. As a result of the establishment of, and transfer of its interests in, the joint venture to Westfield, the Port Authority presently expects, subject to the completion of construction of the premises covered by the retail net lease, to receive payments totaling up to $1.4 billion from Westfield. In the event that retail space is built at Tower 2, Westfield would have the option to pay an additional amount to be determined at such time to add such space to its net leased retail premises. The Port Authority continues to be the landlord of the retail components of the World Trade Center site under a net lease which provides for nominal annual rentals. The Port Authority also continues to be responsible for the construction of the retail premises at the World Trade Center site, and is obligated to fund the remaining project costs for its construction.
As of December 31, 2016, excluding Westfield’s initial joint venture membership capital contribution of $100 million recognized in 2011, the
Notes to Consolidated Financial Statements(continued)

118 THE PORT AUTHORITY OF NY & NJ
Port Authority has received $797 million for the transfer of its interests in the WTC retail joint venture to Westfield. The $797 million is reported as Unearned income and subsequently recognized as rental income over the remaining term of the existing WTC Retail net lease. As of December 31, 2016, $23 million has been cumulatively recognized as rental income.
wTc memorial and museum
The Port Authority does not have any responsibility for the operation and maintenance of the Memorial, the Memorial/Museum or the Visitor Orientation and Education Center (VOEC). The Memorial Plaza was substantially completed and opened for public access on September 11, 2011. The museum and VOEC opened to the public on May 21, 2014.
Note m – risk financing Activities
The Port Authority carries insurance or requires insurance to be carried (if available) on or in connection with its facilities to protect against direct physical loss or damage and resulting loss of revenue and against liability in such amounts as it deems appropriate, considering self-insured retentions, purchase of insurance through its captive insurance entity, PAICE, exceptions, or exclusions of portions of facilities, and the scope of insurable hazards. Availability of coverage varies and may be constrained depending on the state of the insurance industry. As a result, insurance premiums may increase for available coverage in connection with the Port Authority’s periodic renewal of its insurance programs.
1. Purchased insurance
Property damage and loss of revenue insurance program
The property damage and loss of revenue insurance program on Port Authority facilities (renewed effective June 1, 2016 and expiring on June 1, 2017) applies to all Port Authority facilities, excluding the World Trade Center*, with program limits of $1.6 billion per occurrence and in the aggregate, subject to certain deductibles, retentions, and sub-limits for certain hazards. Coverage under the property damage and loss of revenue insurance program on the operating portions of the World Trade Center and related infrastructure (renewed March 31, 2016 and expiring on June 1, 2017) applies to those assets with program limits of $2.5 billion per occurrence and in the aggregate for Tower One, and $2 billion per occurrence and in aggregate for WTC Transportation Hub and WTC Vehicular Security Center, subject to certain deductibles, retentions, and sub-limits for certain hazards.
The Port Authority also purchased terrorism insurance with respect to its facilities, excluding the World Trade Center, with limits of $1.6 billion per occurrence and in the aggregate, subject to certain deductibles, retentions and exclusions for certain hazards, and for the operating portions of the World Trade Center, with limits of $5 billion per occurrence and in the aggregate, subject to certain deductibles, retentions, and exclusions for certain hazards. The terrorism coverage is insured through PAICE and reinsured through the Terrorism Risk Insurance Program Reauthorization Act of 2015 (TRIPRA)** and commercial reinsurance.
Public liability insurance program
The public liability insurance program for Port Authority aviation facilities (renewed effective October 27, 2016 and expiring October 27, 2017) applies to such facilities with program limits of $1.25 billion per occurrence and in the aggregate, subject to certain retentions, and insurance for aviation war risk, which includes terrorism, and which has no deductible.
The public liability insurance program for “non-aviation” facilities (renewed effective October 27, 2016 and expiring October 27, 2017) applies to such facilities including WTC* with program limits of $1.0 billion per occurrence and in the aggregate, subject to certain deductibles and retentions. Terrorism insurance with respect thereto totals $300 million, which is insured through PAICE and reinsured through TRIPRA** and commercial insurers. During each of the past three years, payments for public liability claims have not exceeded insurance coverage.
*See “*” footnote on page 119.
**See “**” footnote on page 119.
Notes to Consolidated Financial Statements(continued)

119THE FOUNDATION FOR A NEW TOMORROW
2. construction insurance Programs
The Port Authority’s World Trade Center Owner Controlled Insurance Program applies to such facility with program limits of $150 million per occurrence, subject to certain deductibles, retentions, and sub-limits of certain hazards, annual aggregate limits, and with program limits of $150 million per occurrence for terrorism insurance, effective November 30, 2015 and expires November 30, 2017.
The Port Authority maintains an ongoing wrap-up contractors’ insurance program for all other Port Authority facilities under construction with program limits for builders’ risk of $50 million per occurrence, subject to certain deductibles, retentions, and sub-limits on certain hazards, construction general liability insurance with program limits of $50 million per occurrence, and statutory workers’ compensation coverage, which do not have a deductible. PAICE provides portions of the construction general liability and statutory workers’ compensation insurance. The Port Authority also maintains builders’ risk and terrorism coverage, with respect to the Bayonne Bridge Navigational Clearance Program, each with a program limit of $743 million per occurrence and comprehensive general liability insurance with program limits of $50 million per occurrence and in the aggregate in excess of the $50 million coverage described above.
3. Port Authority insurance captive entity, llc
On October 16, 2006, the District of Columbia approved the establishment of a Port Authority captive insurance company, known as the Port Authority Insurance Captive Entity, LLC, for the purpose of insuring certain risk exposures of the Port Authority and its related entities. Under its current Certificate of Authority issued by the District of Columbia, PAICE is authorized to transact insurance business, in connection with Workers’ Compensation, general liability, builders risk, property and terrorism insurance coverage for the Port Authority and its component units. With the passage of TRIPRA**, PAICE assumed coverage for acts of domestic terrorism with respect to the Port Authority’s public liability and property damage and loss of revenue insurance programs in addition to the previously provided coverage for acts of foreign terrorism. In addition, as of December 31, 2016, PAICE continues to provide the first $1,000,000 in coverage under the Workers’ Compensation portion, and the first $500,000 in coverage under the general liability aspect of the Port Authority’s Contractor’s Insurance Program.
Any changes in the lines of insurance being provided by PAICE or its capitalization are subject to prior approval by the Port Authority Board of Commissioners’ Committee on Finance. PAICE also provides periodic reports with respect to its general operations to the Port Authority’s Board of Commissioners.
The financial results for PAICE for the year ended December 31, 2016 are set forth on the following page of this report. Restricted amounts associated with PAICE recorded on the Port Authority’s consolidated financial statements have been adjusted to eliminate intercompany transfers related to insurance premiums paid to PAICE from the Port Authority.
financial Position Amounts
(In thousands)
Total Assets $ 378,733 Total Liabilities 156,820
Net Position $ 221,913
operating resultsRevenues $ 42,009 Expenses 10,034
Change in Net Position $ 31,975
changes in Net PositionNet Position at January 1, 2016 $ 189,938 Change in Net Position 31,975
Net Position at December 31, 2016 $ 221,913
* The Port Authority’s insurance programs do not provide coverage for World Trade Center Towers 2, 3, 4 (except for the Port Authority’s Tower 4 leased space), Tower 5, the WTC Memorial/Museum and the net leased retail components (except for certain retail infrastructure) of the World Trade Center site.
** Under TRIPRA, the Federal government reinsures 84% of certified terrorism losses in 2016 (and decreases its reinsurance incrementally by 1% per year for the next five (5) years), subject to aggregate industry insured losses of at least $120 million in 2016 (which increases incrementally $20 million per year for the next five years) and a 20% insurance carrier/captive deductible, in an amount not to exceed an annual cap on all such losses payable under TRIPRA of $100 billion. No Federal payments are made under this program until the aggregate industry insured losses from acts of terrorism exceed $120 million. In the event of a certified act of terrorism, the law allows the United States Treasury to recoup 140% of the amount of federal payments for insured losses during that calendar year.
Notes to Consolidated Financial Statements(continued)
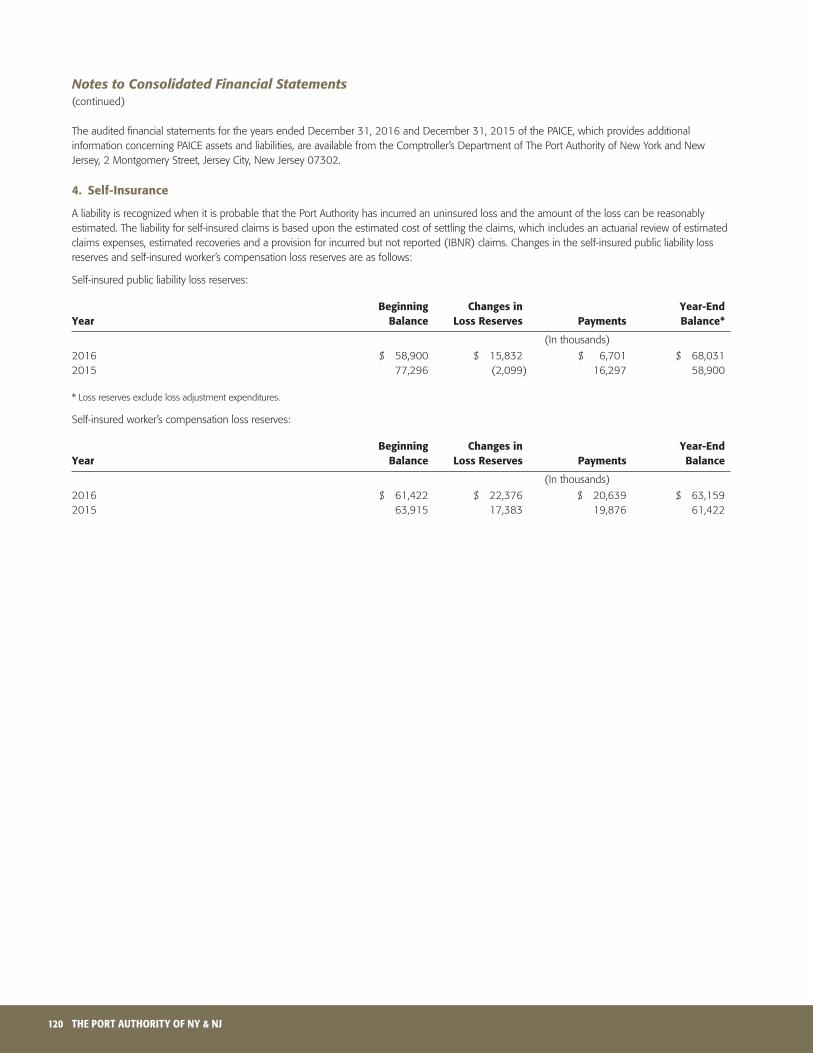
120 THE PORT AUTHORITY OF NY & NJ
The audited financial statements for the years ended December 31, 2016 and December 31, 2015 of the PAICE, which provides additional information concerning PAICE assets and liabilities, are available from the Comptroller’s Department of The Port Authority of New York and New Jersey, 2 Montgomery Street, Jersey City, New Jersey 07302.
4. self-insurance
A liability is recognized when it is probable that the Port Authority has incurred an uninsured loss and the amount of the loss can be reasonably estimated. The liability for self-insured claims is based upon the estimated cost of settling the claims, which includes an actuarial review of estimated claims expenses, estimated recoveries and a provision for incurred but not reported (IBNR) claims. Changes in the self-insured public liability loss reserves and self-insured worker’s compensation loss reserves are as follows:
Self-insured public liability loss reserves:
Beginning changes in year-end year Balance loss reserves Payments Balance*
(In thousands)
2016 $ 58,900 $ 15,832 $ 6,701 $ 68,0312015 77,296 (2,099) 16,297 58,900
* Loss reserves exclude loss adjustment expenditures.
Self-insured worker’s compensation loss reserves:
Beginning changes in year-end year Balance loss reserves Payments Balance
(In thousands)
2016 $ 61,422 $ 22,376 $ 20,639 $ 63,1592015 63,915 17,383 19,876 61,422
Notes to Consolidated Financial Statements(continued)
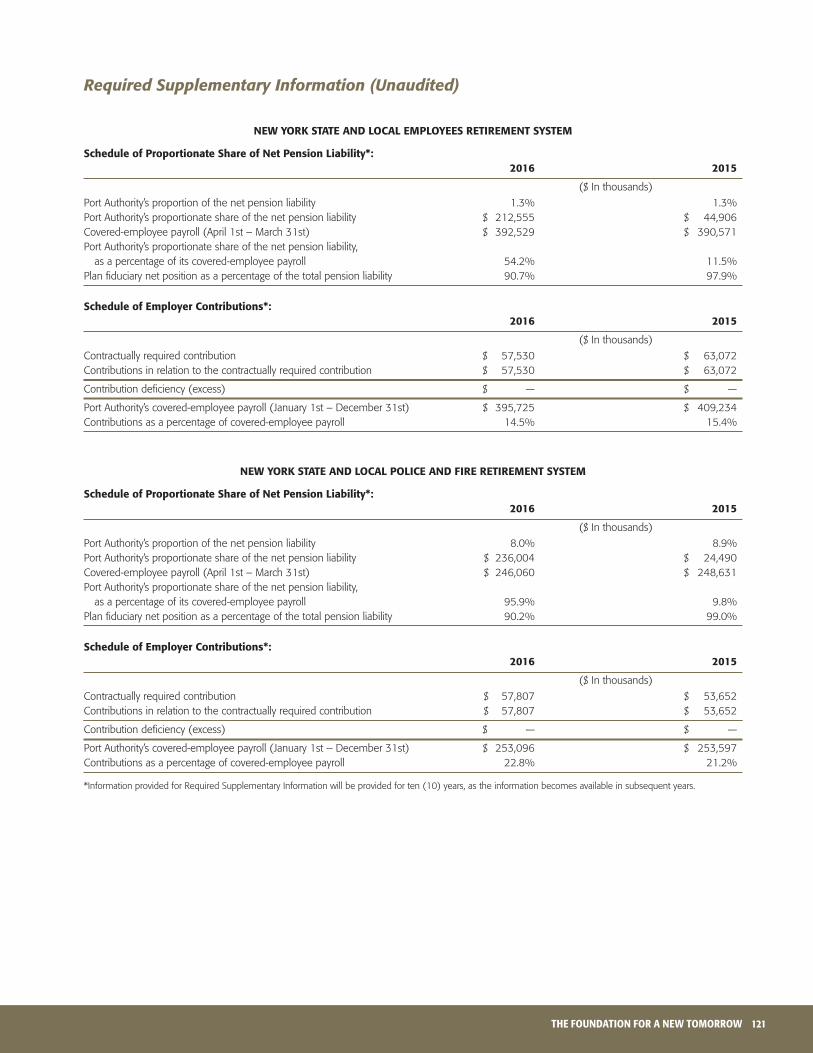
121THE FOUNDATION FOR A NEW TOMORROW
New york sTATe ANd locAl emPloyees reTiremeNT sysTem
schedule of Proportionate share of Net Pension liability*: 2016 2015
($ In thousands)
Port Authority’s proportion of the net pension liability 1.3% 1.3%Port Authority’s proportionate share of the net pension liability $ 212,555 $ 44,906 Covered-employee payroll (April 1st – March 31st) $ 392,529 $ 390,571 Port Authority’s proportionate share of the net pension liability, as a percentage of its covered-employee payroll 54.2% 11.5%Plan fiduciary net position as a percentage of the total pension liability 90.7% 97.9%
schedule of employer contributions*: 2016 2015
($ In thousands)
Contractually required contribution $ 57,530 $ 63,072 Contributions in relation to the contractually required contribution $ 57,530 $ 63,072
Contribution deficiency (excess) $ — $ —
Port Authority’s covered-employee payroll (January 1st – December 31st) $ 395,725 $ 409,234 Contributions as a percentage of covered-employee payroll 14.5% 15.4%
New york sTATe ANd locAl Police ANd fire reTiremeNT sysTem
schedule of Proportionate share of Net Pension liability*: 2016 2015
($ In thousands)
Port Authority’s proportion of the net pension liability 8.0% 8.9%Port Authority’s proportionate share of the net pension liability $ 236,004 $ 24,490 Covered-employee payroll (April 1st – March 31st) $ 246,060 $ 248,631 Port Authority’s proportionate share of the net pension liability, as a percentage of its covered-employee payroll 95.9% 9.8%Plan fiduciary net position as a percentage of the total pension liability 90.2% 99.0%
schedule of employer contributions*: 2016 2015
($ In thousands)
Contractually required contribution $ 57,807 $ 53,652Contributions in relation to the contractually required contribution $ 57,807 $ 53,652
Contribution deficiency (excess) $ — $ —
Port Authority’s covered-employee payroll (January 1st – December 31st) $ 253,096 $ 253,597 Contributions as a percentage of covered-employee payroll 22.8% 21.2%
*Information provided for Required Supplementary Information will be provided for ten (10) years, as the information becomes available in subsequent years.
Required Supplementary Information (Unaudited)

122 THE PORT AUTHORITY OF NY & NJ
federAl rAilroAd reTiremeNT ProgrAm
schedule of employee and employer railroad contributions*
railroad retirement employee employee employer employer Total Tier i Tax rate Taxes Tax rate Taxes Taxes
($ In thousands)
2016 7.65% $ 8,086 7.65% $ 8,086 $ 16,1722015 7.65% 7,747 7.65% 7,747 15,4942014 7.65% 8,119 7.65% 8,119 16,2382013 7.65% 7,551 7.65% 7,551 15,102
Total Taxes $ 31,503 $ 31,503 $ 63,006
railroad retirement employee employee employer employer Total Tier ii Tax rate Taxes Tax rate Taxes Taxes
($ In thousands)
2016 4.9% $ 4,475 13.1% $ 11,964 $ 16,4392015 4.9% 4,379 13.1% 11,707 16,0862014 4.4% 3,971 12.6% 11,371 15,3422013 4.4% 3,714 12.6% 10,636 14,350
Total Taxes $ 16,539 $ 45,678 $ 62,217
*Information provided for Required Supplementary Information will be provided for ten (10) years, as the information becomes available in subsequent years.
PATh exemPT emPloyees suPPlemeNTAl PeNsioN PlAN
schedule of changes to Total Pension liability and related ratios* 2016 2015
($ In thousands)
Total Pension liabilityService cost $ 1,280 $ 900Interest cost 2,850 3,271 Differences between expected and actual experience (945) 51 Changes of assumptions 3,809 10,632Benefit payments, including refunds of member contributions (4,701) (3,389)
Net change in total pension liability 2,293 11,465Total Pension Liability (Beginning) 81,095 69,630
Total Pension liability (ending) $ 83,388 $ 81,095
Covered-Employee Payroll $ 13,187 $ 12,356Total Pension Liability as a % of Payroll 632.4% 656.3%
*Information provided for Required Supplementary Information will be provided for ten (10) years, as the information becomes available in subsequent years.
Note: As of December 31, 2016, there are no plan assets accumulated in a trust for purposes of making future pension payments to members.
Required Supplementary Information (Unaudited)

123THE FOUNDATION FOR A NEW TOMORROW
oTher PosTemPloymeNT emPloyee BeNefiTs (oPeB) PlAN
schedule of funding Progress unfunded AAl oPeB Trust unfunded funded covered as a % of Actuarial Assets* AAl AAl ratio Payroll Payroll Valuation date (a) (b) (c) = (b–a) (a) / (b) (d) (c) / (d)
($ In millions)
1/1/16 $ 956 $ 2,868 $ 1,912 33% $ 756 253%1/1/15 859 2,642 1,783 33% 739 241%1/1/14 708 2,394 1,686 30% 753 224%
*As of December 31, 2016 OPEB trust net position totaled $1.124 billion.
Required Supplementary Information (Unaudited)

124 THE PORT AUTHORITY OF NY & NJ
year ended december 31, 2016 2015
operating reserve combined Combined fund funds Total Total
(In thousands)
gross operating revenues: Tolls and fares $ 1,865,481 $ — $ 1,865,481 $ 1,718,770 Rentals 1,555,958 — 1,555,958 1,439,229 Aviation fees 1,112,436 — 1,112,436 1,063,902 Parking and other 399,178 — 399,178 359,631 Utilities 138,987 — 138,987 144,580 Rentals – Special Project Bonds Projects 86,755 — 86,755 92,719
Total gross operating revenues 5,158,795 — 5,158,795 4,818,831
operating expenses: Employee compensation, including benefits 1,290,334 — 1,290,334 1,178,967 Contract services 852,926 — 852,926 833,903 Rents and payments in-lieu-of taxes (PILOT) 352,293 — 352,293 356,162 Materials, equipment and other 264,977 — 264,977 252,071 Utilities 165,802 — 165,802 186,830 Interest on Special Project Bonds 86,755 — 86,755 92,719
Total operating expenses 3,013,087 — 3,013,087 2,900,652
Operating and maintenance contingencies — — — 50,000 Amounts in connection with operating asset obligations 18,871 — 18,871 21,387 Net (revenue)/expense related to Superstorm Sandy — — — (123)
Net operating revenues 2,126,837 — 2,126,837 1,846,915
financial income: Interest income (29,026) 35,772 6,746 18,370 Net (decrease) in fair value of investments (4,135) (7,395) (11,530) (14,290)Contributions in aid of construction 293,770 — 293,770 272,335 Application of WTC Retail Joint Venture Payments 77,869 — 77,869 66,963 Application of Passenger Facility Charges 229,921 — 229,921 273,721 Application of 4 WTC associated payments 41,520 — 41,520 36,766 Grants, in connection with operating activities 64,315 — 64,315 101,074 Pass–through grant program payments (10,695) — (10,695) (51,429)
Net revenues available for debt service and reserves 2,790,376 28,377 2,818,753 2,550,425
Debt service: Interest on bonds and other asset financing obligations 824,586 81,601 906,187 876,817 Debt maturities and retirements 268,520 — 268,520 259,315 Repayment of asset financing obligations — (6,669) (6,669) 51,928
Total debt service 1,093,106 74,932 1,168,038 1,188,060
Transfers to reserves $ (1,697,270) 1,697,270 — —
Revenues after debt service and transfers to reserves 1,650,715 1,650,715 1,362,365 Direct investment in facilities (1,132,915) (1,132,915) (1,949,785)
Increase/(Decrease) in reserves 517,800 517,800 (587,420) Reserve balances, January 1 3,839,847 3,839,847 4,427,267
Reserve balances, December 31 $ 4,357,647 $ 4,357,647 $ 3,839,847
see Notes to consolidated financial statements
Schedule A – Revenues and Reserves(pursuant to Port Authority bond resolutions)

125THE FOUNDATION FOR A NEW TOMORROW
december 31, 2016 2015
operating capital reserve combined Combined fund fund funds Total Total
AsseTs (In thousands)Current assets: Cash $ 180,166 $ 20,679 $ 189,964 $ 390,809 $ 1,171,781 Restricted cash: Passenger Facility Charges 262,238 — — 262,238 130,751 Port Authority Insurance Captive Entity, LLC 80,024 — — 80,024 40,535 Investments — 443,128 788,173 1,231,301 1,766,989 Restricted investments - PFC 72,275 — — 72,275 — Interfund balances (532,205) (85,640) 617,845 — — Current receivables, net 459,517 628 — 460,145 468,707 Other current assets 94,122 22,833 — 116,955 127,193 Restricted receivables and other assets 69,559 — — 69,559 73,106
Total current assets 685,696 401,628 1,595,982 2,683,306 3,779,062
Noncurrent assets: Restricted cash 4,964 — — 4,964 4,631 Investments 72,126 411,497 2,761,665 3,245,288 3,252,429 Restricted investments - PAICE 220,462 — — 220,462 184,633 Other amounts receivable, net 45,566 16,523 — 62,089 52,474 Other noncurrent assets 1,516,750 1,801 — 1,518,551 1,448,452 Restricted other noncurrent assets - PAICE 1,932 — — 1,932 4,649 Amounts receivable - Special Project Bonds Projects — 1,391,170 — 1,391,170 1,451,170 Amounts receivable - Tower 4 Liberty Bonds — 1,225,520 — 1,225,520 1,225,520 Invested in facilities — 53,830,211 — 53,830,211 50,629,546
Total noncurrent assets 1,861,800 56,876,722 2,761,665 61,500,187 58,253,504
Total assets 2,547,496 57,278,350 4,357,647 64,183,493 62,032,566
deferred ouTflows of resources
Pension related amounts 555,794 — — 555,794 155,259
liABiliTies Current liabilities: Accounts payable 297,529 774,883 — 1,072,412 1,071,047 Accrued interest and other current liabilities 564,226 25,740 — 589,966 592,700 Restricted other liabilities - PAICE 12,492 — — 12,492 9,446 Accrued payroll and other employee benefits 527,897 — — 527,897 436,576 Unapplied Passenger Facility Charges 204,053 — — 204,053 168,801 Current portion bonds and other asset financing obligations 37,981 1,202,161 — 1,240,142 1,486,572
Total current liabilities 1,644,178 2,002,784 — 3,646,962 3,765,142
Noncurrent liabilities: Accrued pension and other postemployment employee benefits 533,835 —- — 533,835 229,892 Other noncurrent liabilities 230,331 72,550 — 302,881 288,883 Restricted other noncurrent liabilities - PAICE 49,171 —- — 49,171 50,383 Amounts payable - Special Project Bonds — 1,391,170 — 1,391,170 1,451,170 Amounts payable - Tower 4 Liberty Bonds — 1,225,520 — 1,225,520 1,225,520 Bonds and other asset financing obligations 593,703 20,083,061 — 20,676,764 20,765,928
Total noncurrent liabilities 1,407,040 22,772,301 — 24,179,341 24,011,776
Total liabilities 3,051,218 24,775,085 — 27,826,303 27,776,918
deferred iNflows of resources
Pension related amounts 76,842 — — 76,842 7,555
NeT PosiTioN $ (24,770) $ 32,503,265 $ 4,357,647 $ 36,836,142 $ 34,403,352
Net position is comprised of: Facility infrastructure investment $ — $ 32,503,265 $ — $ 32,503,265 $ 30,588,275 Cumulative effect of change in accounting principles (24,770) — — (24,770) (24,770) Reserves — — 4,357,647 4,357,647 3,839,847
NeT PosiTioN $ (24,770) $ 32,503,265 $ 4,357,647 $ 36,836,142 $ 34,403,352
see Notes to consolidated financial statements
Schedule B - Assets and Liabilities(pursuant to Port Authority bond resolutions)

126 THE PORT AUTHORITY OF NY & NJ
year ended december 31, 2016 2015
general consolidated reserve Bond reserve combined Combined fund fund Total Total
(In thousands)
Balance, January 1 $ 2,297,475 $ 1,542,372 $ 3,839,847 $ 4,427,267 Increase in reserve funds * — 1,725,647 1,725,647 1,480,754
2,297,475 3,268,019 5,565,494 5,908,021
Applications: Repayment of asset financing obligations — (6,669) (6,669) 51,928 Interest on asset financing obligations — 81,601 81,601 66,461 Direct investment in facilities — 1,132,915 1,132,915 1,949,785
Total applications — 1,207,847 1,207,847 2,068,174
Balance, december 31 $ 2,297,475 $ 2,060,172 $ 4,357,647 $ 3,839,847
* Combined increase in reserve funds consists of “Transfers to reserves” from the operating fund totaling $1.7 billion, plus financial income generated on reserve funds of $28.4 million in 2016.
see Notes to consolidated financial statements
Schedule C - Analysis of Reserve Funds(pursuant to Port Authority bond resolutions)

127THE FOUNDATION FOR A NEW TOMORROW
The Statistical and Other Supplemental Information section presents additional information as a means to provide context to the information contained in the financial statements, note disclosures and schedules.
selected statistical financial Trends data – schedule d-1 (Pursuant to GAAP)
Trend information is provided to help the reader understand how the Port Authority’s financial performance and fiscal health has changed over time.
selected statistical debt capacity – schedule d-2 (Pursuant to Port Authority bond resolutions)
The Port Authority has several forms of outstanding obligations.
Information on Port Authority revenues, outstanding obligations, debt service, and reserves is included here for statistical purposes (more detailed information about the various kinds of debt instruments used by the Port Authority can be found in Note D - Outstanding Obligations and Financing, and reserve funds are described in Note E - General and Consolidated Bond Reserve Funds to the consolidated financial statements). Debt limitations, including in some cases, limits on total authorized amounts or requirements for the issuance of additional bonds, may be found in the various resolutions establishing and authorizing such obligations.
selected statistical financial data by Business segment – schedule d-3
Schedule provides information on gross operating revenues, operating expenses and capital investment, summarized by Port Authority business segments.
information on Port Authority operations – schedule e
Detailed information on Port Authority’s operating results including income from operations, non-operating expenses and contributions, and net income is provided on a Port Authority operating facility level.
information on capital investment in Port Authority facilities – schedule f
Schedule provides information on capital investment, summarized by Port Authority operating facilities, including current year capital investment and depreciation.
Port Authority facility Traffic – schedule g (unaudited)
This schedule provides comparative information on Port Authority facility traffic relative to vehicles, passengers, containers, cargo, waterborne vehicles and plane movements.
sTaTisTiCal and oTher supplemenTal informaTionFor the Year Ended December 31, 2016

128 THE PORT AUTHORITY OF NY & NJ
2016 2015 2014 2013
(In thousands)
Revenues, Expenses and Changes in Net Position: Gross operating revenues: Tolls and fares $ 1,865,481 $ 1,718,770 $ 1,553,625 $ 1,462,957 Rentals(a) 1,564,527 1,446,980 1,300,818 1,228,491 Aviation fees 1,112,436 1,063,902 1,058,416 934,459 Parking and other 399,178 359,631 321,760 315,111 Utilities 138,987 144,580 149,052 139,835 Rentals - Special Project Bonds Projects 86,755 92,719 98,141 103,186
Gross operating revenues 5,167,364 4,826,582 4,481,812 4,184,039
Operating expenses: Employee compensation, including benefits 1,290,334 1,178,967 1,187,877 1,114,397 Contract services 852,926 833,903 797,516 684,411 Rents and amounts in-lieu-of taxes (PILOT) 352,293 356,162 362,627 301,582 Materials, equipment and other 264,977 252,071 277,174 220,859 Utilities 165,802 186,830 199,919 171,833 Interest on Special Project Bonds 86,755 92,719 98,141 103,186
Operating expenses 3,013,087 2,900,652 2,923,254 2,596,268
Net revenue/(expense) related to the events of September 11, 2001 — — — —Net revenue/(expense) related to the events of Superstorm Sandy — 123 53,530 28,229Depreciation of facilities (1,173,747) (1,124,383) (932,149) (875,979) Amortization of costs for regional programs (64,765) (64,665) (64,484) (64,275)
Income from operations 915,765 737,005 615,455 675,746
Income on investments (including fair value adjustment) 30,554 30,978 38,100 8,608 Interest expense on bonds and other asset financing (935,442) (909,603) (666,244) (623,353)Net gain/(loss) on disposition of assets — — 19,043 4,423 Pass-through grant program payments (10,695) (51,429) (107,606) (176,848)4 WTC associated payments 41,521 36,766 6,128 36,660 Grants in connection with operating activities 64,315 101,074 207,898 188,409 Contributions in aid of construction 674,950 586,295 700,267 689,898 Passenger facility charges 264,363 248,707 233,172 224,301 1 WTC LLC/WTC Retail LLC insurance proceeds — — — —
Increase in net position December 31, $ 1,045,331 $ 779,793 $ 1,046,213 $ 1,027,844
Net position is comprised of Net investment in capital assets $ 12,746,144 $ 11,810,573 $ 10,402,894 $ 9,442,138 Restricted 567,443 456,429 470,857 454,467 Unrestricted 3,261,307 3,262,561 3,900,789 3,831,722
Net Position, December 31, $ 16,574,894 $ 15,529,563 $ 14,774,540 $ 13,728,327
(a) Commencing in 2014, Rentals include the recognition of unearned income related to the March 2014 transfer of the Port Authority’s interests in the WTC Retail Joint Venture.
Schedule D-1 - Selected Statistical Financial Trends Data (pursuant to GAAP)

129THE FOUNDATION FOR A NEW TOMORROW
2012 2011 2010 2009 2008 2007
$ 1,337,372 $ 1,148,061 $ 1,069,785 $ 1,068,105 $ 1,054,801 $ 800,244 1,208,730 1,150,569 1,144,709 1,115,652 1,079,634 986,663 904,666 895,356 872,774 839,327 816,628 781,355 338,178 339,131 321,257 316,005 328,220 387,966 152,945 154,810 154,041 140,817 169,576 149,537 108,125 112,553 71,457 72,337 78,693 85,861
4,050,016 3,800,480 3,634,023 3,552,243 3,527,552 3,191,626
1,038,243 1,037,681 1,022,195 974,154 941,289 922,671 749,106 726,883 630,438 683,418 670,489 587,730 304,020 280,237 272,002 276,830 274,916 271,073 215,937 219,183 418,639 263,682 314,722 212,147 174,016 188,432 183,826 168,249 183,583 167,912 108,125 112,553 71,457 72,337 78,693 85,861
2,589,447 2,564,969 2,598,557 2,438,670 2,463,692 2,247,394
— — 53,051 202,978 457,918 (4,563) (30,000) — — — — — (884,239) (852,727) (789,011) (712,331) (644,620) (632,553) (77,719) (77,537) (76,504) (74,617) (70,840) (59,316)
468,611 305,247 223,002 529,603 806,318 247,800
39,661 (46,898) 4,435 146,561 (4,976) 229,812 (658,313) (559,110) (501,607) (501,892) (488,463) (493,689) (4) — — 27,125 7 17,011 (56,446) (11,507) (2,166) (1,120) (3,130) (4,717) 65,293 8,343 — — — — 52,161 23,727 11,708 10,613 9,811 11,310 997,441 767,010 358,268 382,978 313,078 313,504 222,614 214,456 210,387 201,737 211,667 221,380 3,525 — 42,814 50,813 49,771 760,467
$ 1,134,543 $ 701,268 $ 346,841 $ 846,418 $ 894,083 $ 1,302,878
$ 9,273,213 $ 10,020,306 $ 9,200,077 $ 8,415,993 $ 7,526,446 $ 6,609,691 392,389 294,460 222,871 211,725 409,800 719,306 3,034,881 1,411,125 1,601,675 2,050,064 1,895,118 1,608,284
$ 12,700,483 $ 11,725,891 $ 11,024,623 $ 10,677,782 $ 9,831,364 $ 8,937,281

130 THE PORT AUTHORITY OF NY & NJ
2016 2015 2014 2013
(In thousands)
Gross Operating Revenues* $ 5,158,795 $ 4,818,831 $ 4,475,193 $ 4,184,039 Operating expenses (3,013,087) (2,900,652) (2,923,254) (2,596,268)Net revenue/(expense) related to the events of September 11, 2001 — — — — Operating and maintenance contingencies — (50,000) — — Net revenue/(expense) related to Superstorm Sandy — 123 53,530 28,229 Amounts in connection with operating asset obligations (18,871) (21,387) (23,734) (25,908)
Net operating revenues 2,126,837 1,846,915 1,581,735 1,590,092 Financial income (4,784) 4,080 14,687 (2,964)Grants and contributions in aid of construction, net 347,390 321,980 565,444 540,746 Application of WTC Retail Joint Venture Payments* 77,869 66,963 652,104 — Application of Passenger Facility Charges 229,921 273,721 221,156 175,421 Application of 4 WTC associated payments 41,520 36,766 6,128 36,660 Application of 1WTC LLC/WTC LLC Retail insurance proceeds — — — —Restricted Net Revenues - PAICE — — — 4,305
Net revenues available for debt service and reserves (a) 2,818,753 2,550,425 3,041,254 2,344,260
deBT serVice - oPerATioNs Interest on bonds and other asset financing obligations (b) (824,586) (810,356) (635,262) (556,824)Times, interest earned (a/b) 3.42 3.15 4.79 4.21 Debt maturities and retirements (c) (268,520) (259,315) (226,205) (204,000)Times, debt service earned [a/(b+c)] 2.58 2.38 3.53 3.08
APPlicATioN of reserVes Direct investment in facilities (1,132,915) (1,949,785) (1,473,432) (1,059,756)Debt retirement acceleration — — — —Change in appropriations for self-insurance — — 28,100 10,414 Interest on bonds and other asset financing obligations (81,601) (66,461) (11,542) (38,689)Repayment of asset financing obligations 6,669 (51,928) (105,562) (15,701)Acceleration of unamortized brokerage commissions — — — (46,863)
Net increase/(decrease) in reserves 517,800 (587,420) 617,351 432,841
reserVe BAlANces January 1 3,839,847 4,427,267 3,809,916 3,377,075
December 31 4,357,647 3,839,847 4,427,267 3,809,916
Reserve funds balances represented by: General Reserve 2,297,475 2,297,475 2,131,711 2,029,051 Consolidated Bond Reserve 2,060,172 1,542,372 2,295,556 1,780,865
Total $ 4,357,647 $ 3,839,847 $ 4,427,267 $ 3,809,916
oBligATioNs AT decemBer 31 (at par value) Consolidated Bonds and Notes $ 20,429,565 $ 21,019,925 $ 19,229,020 $ 18,212,063 Fund for regional development buy-out obligation 221,393 253,732 283,562 311,077 MOTBY obligation 55,332 44,383 48,254 52,329 Amounts payable - Special Project Bonds 1,391,170 1,451,170 1,530,510 1,605,515 Variable rate master notes 77,900 77,900 77,900 77,900 Commercial paper obligations 388,315 425,760 448,185 348,110 Versatile structure obligations — — — —Port Authority equipment notes — — 31,500 46,925 Tower 4 Liberty Bonds 1,225,520 1,225,520 1,225,520 1,225,520 Goethals Bridge Replacement Developer Financing Arrangement 744,401 430,800 210,316 —
Total obligations $ 24,533,596 $ 24,929,190 $ 23,084,767 $ 21,879,439
* Commencing in 2014, Gross operating revenues exclude the recognition of unearned income related to the March 2014 transfer of the Port Authority interests in the WTC Retail Joint Venture. Amounts related to this transfer are recognized in their entirety in the year in which they are received.
Note: This selected financial data is prepared primarily from information contained in Schedules A, B and C and is presented for general information only and is not intended to reflect the specific applications of the revenues and reserves of the Port Authority, which are governed by statutes and its bond resolutions.
Schedule D-2 - Selected Statistical Debt Capacity Data(Pursuant to Port Authority bond resolutions)

131THE FOUNDATION FOR A NEW TOMORROW
2012 2011 2010 2009 2008 2007
$ 4,050,016 $ 3,800,480 $ 3,634,023 $ 3,552,243 $ 3,527,552 $ 3,191,626 (2,589,447) (2,564,969) (2,598,557) (2,438,670) (2,463,692) (2,247,394) — — 53,051 202,978 457,918 (4,563) — — — — — — (30,000) — — — — — (27,956) (29,580) (46,561) (55,058) (41,301) (40,787)
1,402,613 1,205,931 1,041,956 1,261,493 1,480,477 898,882 29,121 (53,270) (900) 141,136 (19,537) 208,274 565,976 499,516 367,810 392,471 319,759 320,097 — — — — — — 110,015 215,645 207,122 205,164 215,407 220,583 65,293 8,343 — — — — 17,962 57,340 61,468 266,676 411,278 305,532 2,710 644 (102) 3,177 (4,311) (1,354)
2,193,690 1,934,149 1,677,354 2,270,117 2,403,073 1,952,014
(539,436) (480,623) (436,622) (427,384) (409,175) (417,209) 4.07 4.02 3.84 5.31 5.87 4.68 (169,770) (140,390) (178,095) (147,370) (152,275) (177,160) 3.09 3.11 2.73 3.95 4.28 3.28
(691,079) (742,001) (1,375,008) (1,522,096) (1,514,369) (808,694) (54,635) (6,100) — — — — 37,547 1,949 (3,971) 6,463 2,123 (3,220) (87,764) (37,702) (7,580) (8,938) (28,797) (36,077) (16,514) (20,258) (30,062) (13,525) (80,775) (110,424) — — — — — —
672,039 509,024 (353,984) 157,267 219,805 399,230
2,705,036 2,196,012 2,549,996 2,392,729 2,172,924 1,773,694
3,377,075 2,705,036 2,196,012 2,549,996 2,392,729 2,172,924
2,026,605 1,783,370 1,584,955 1,412,221 1,270,215 1,238,915 1,350,470 921,666 611,057 1,137,775 1,122,514 934,009
$ 3,377,075 $ 2,705,036 $ 2,196,012 $ 2,549,996 $ 2,392,729 $ 2,172,924
$ 18,076,497 $ 15,550,039 $ 13,340,378 $ 12,284,449 $ 10,794,831 $ 9,495,419 336,453 359,859 373,707 386,480 398,262 409,128 78,060 105,141 138,396 — — — 1,675,825 1,741,440 1,803,145 1,064,380 1,118,105 1,264,735 77,900 77,900 77,900 90,990 90,990 90,990 384,625 396,155 354,280 321,010 186,040 238,950 — — 175,200 250,900 399,700 1,205,600 49,565 68,160 98,645 110,485 112,485 93,460 1,225,520 1,225,520 — — — — — — — — — —
$ 21,904,445 $ 19,524,214 $ 16,361,651 $ 14,508,694 $ 13,100,413 $ 12,798,282
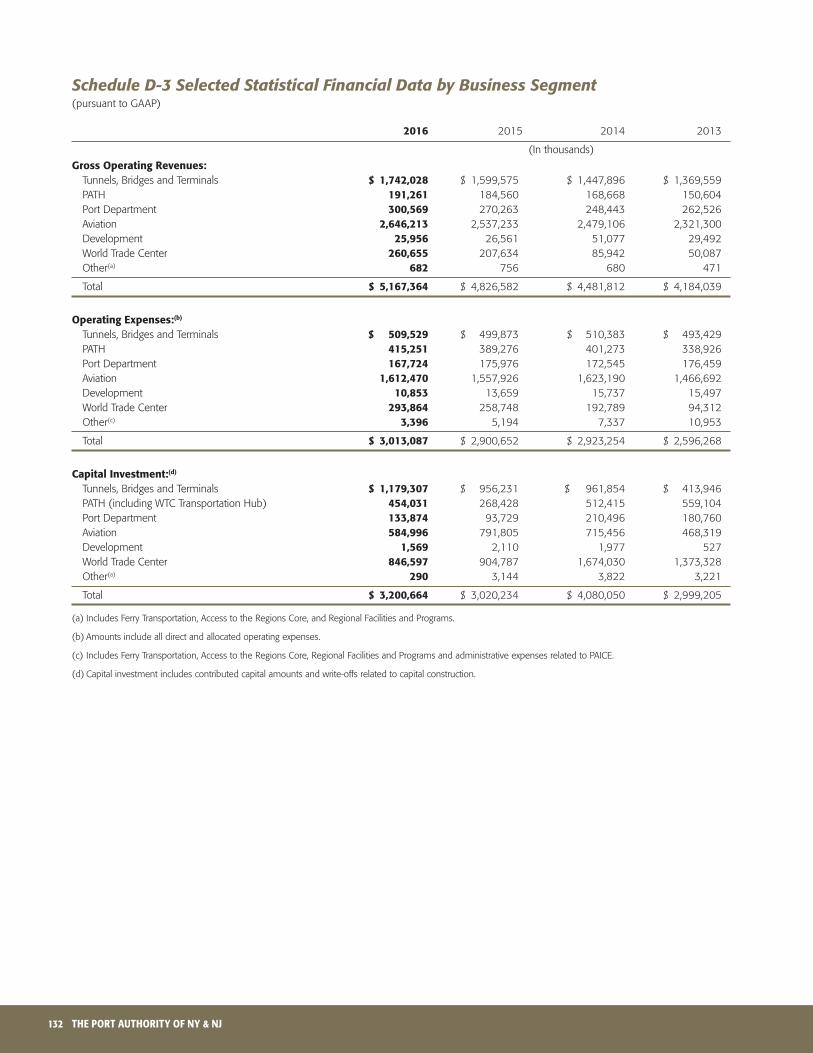
132 THE PORT AUTHORITY OF NY & NJ
2016 2015 2014 2013
(In thousands)
gross operating revenues: Tunnels, Bridges and Terminals $ 1,742,028 $ 1,599,575 $ 1,447,896 $ 1,369,559 PATH 191,261 184,560 168,668 150,604 Port Department 300,569 270,263 248,443 262,526 Aviation 2,646,213 2,537,233 2,479,106 2,321,300 Development 25,956 26,561 51,077 29,492 World Trade Center 260,655 207,634 85,942 50,087 Other(a) 682 756 680 471
Total $ 5,167,364 $ 4,826,582 $ 4,481,812 $ 4,184,039
operating expenses:(b)
Tunnels, Bridges and Terminals $ 509,529 $ 499,873 $ 510,383 $ 493,429 PATH 415,251 389,276 401,273 338,926 Port Department 167,724 175,976 172,545 176,459 Aviation 1,612,470 1,557,926 1,623,190 1,466,692 Development 10,853 13,659 15,737 15,497 World Trade Center 293,864 258,748 192,789 94,312 Other(c) 3,396 5,194 7,337 10,953
Total $ 3,013,087 $ 2,900,652 $ 2,923,254 $ 2,596,268
capital investment:(d)
Tunnels, Bridges and Terminals $ 1,179,307 $ 956,231 $ 961,854 $ 413,946 PATH (including WTC Transportation Hub) 454,031 268,428 512,415 559,104 Port Department 133,874 93,729 210,496 180,760 Aviation 584,996 791,805 715,456 468,319 Development 1,569 2,110 1,977 527 World Trade Center 846,597 904,787 1,674,030 1,373,328 Other(a) 290 3,144 3,822 3,221
Total $ 3,200,664 $ 3,020,234 $ 4,080,050 $ 2,999,205
(a) Includes Ferry Transportation, Access to the Regions Core, and Regional Facilities and Programs.
(b) Amounts include all direct and allocated operating expenses.
(c) Includes Ferry Transportation, Access to the Regions Core, Regional Facilities and Programs and administrative expenses related to PAICE.
(d) Capital investment includes contributed capital amounts and write-offs related to capital construction.
Schedule D-3 Selected Statistical Financial Data by Business Segment (pursuant to GAAP)

133THE FOUNDATION FOR A NEW TOMORROW
2012 2011 2010 2009 2008 2007
$ 1,258,125 $ 1,078,977 $ 1,009,891 $ 1,009,313 $ 991,364 $ 750,634 134,382 121,102 109,704 106,063 111,119 99,400 249,609 236,461 223,095 205,861 201,269 236,002 2,276,018 2,221,157 2,124,955 2,043,091 2,025,881 1,917,998 87,521 100,800 89,457 98,603 108,594 103,603 44,107 41,816 76,704 89,189 89,152 83,738 254 167 217 123 173 251
$ 4,050,016 $ 3,800,480 $ 3,634,023 $ 3,552,243 $ 3,527,552 $ 3,191,626
$ 468,263 $ 460,960 $ 437,775 $ 436,796 $ 436,565 $ 435,835 329,663 322,133 385,686 300,874 290,309 266,886 190,043 185,053 163,424 127,240 143,523 112,607 1,410,070 1,385,582 1,317,749 1,306,078 1,346,197 1,244,954 79,620 82,637 77,200 85,246 83,024 78,461 76,149 106,277 116,797 158,348 144,470 88,647 35,639 22,327 99,926 24,088 19,604 20,004
$ 2,589,447 $ 2,564,969 $ 2,598,557 $ 2,438,670 $ 2,463,692 $ 2,247,394
$ 233,637 $ 168,759 $ 149,803 $ 175,392 $ 174,680 $ 164,846 743,136 720,797 752,486 741,002 609,464 463,796 184,750 228,747 302,858 174,459 181,772 288,677 351,535 243,995 518,545 658,292 624,700 685,787 140 (26,556) 29,297 23,237 22,037 14,593 1,802,009 2,087,741 1,091,464 903,220 602,042 498,041 6,767 9,464 133,229 44,953 145,792 205,432
$ 3,321,974 $ 3,432,947 $ 2,977,682 $ 2,720,555 $ 2,360,487 $ 2,321,172
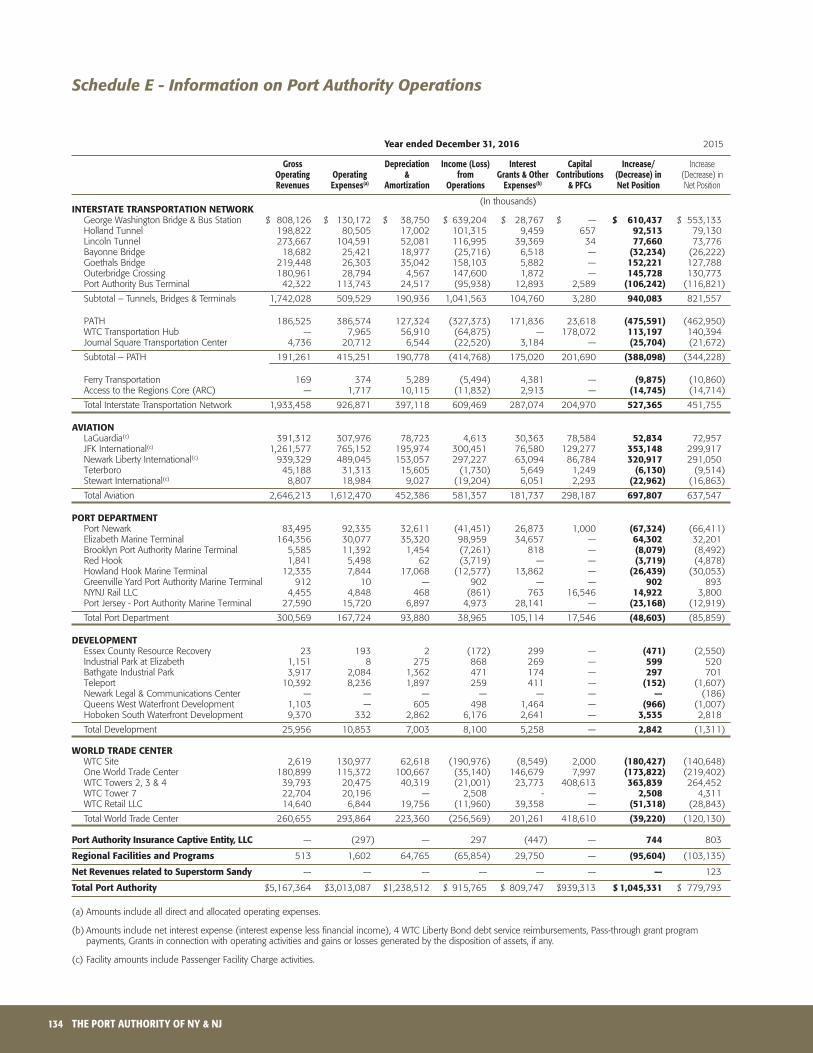
134 THE PORT AUTHORITY OF NY & NJ
Schedule E - Information on Port Authority Operations
year ended december 31, 2016 2015
gross depreciation income (loss) interest capital increase/ Increase operating operating & from grants & other contributions (decrease) in (Decrease) in revenues expenses(a) Amortization operations expenses(b) & Pfcs Net Position Net Position
(In thousands)iNTersTATe TrANsPorTATioN NeTwork George Washington Bridge & Bus Station $ 808,126 $ 130,172 $ 38,750 $ 639,204 $ 28,767 $ — $ 610,437 $ 553,133 Holland Tunnel 198,822 80,505 17,002 101,315 9,459 657 92,513 79,130 Lincoln Tunnel 273,667 104,591 52,081 116,995 39,369 34 77,660 73,776 Bayonne Bridge 18,682 25,421 18,977 (25,716) 6,518 — (32,234) (26,222) Goethals Bridge 219,448 26,303 35,042 158,103 5,882 — 152,221 127,788 Outerbridge Crossing 180,961 28,794 4,567 147,600 1,872 — 145,728 130,773 Port Authority Bus Terminal 42,322 113,743 24,517 (95,938) 12,893 2,589 (106,242) (116,821)
Subtotal – Tunnels, Bridges & Terminals 1,742,028 509,529 190,936 1,041,563 104,760 3,280 940,083 821,557
PATH 186,525 386,574 127,324 (327,373) 171,836 23,618 (475,591) (462,950) WTC Transportation Hub — 7,965 56,910 (64,875) — 178,072 113,197 140,394 Journal Square Transportation Center 4,736 20,712 6,544 (22,520) 3,184 — (25,704) (21,672)
Subtotal – PATH 191,261 415,251 190,778 (414,768) 175,020 201,690 (388,098) (344,228)
Ferry Transportation 169 374 5,289 (5,494) 4,381 — (9,875) (10,860) Access to the Regions Core (ARC) — 1,717 10,115 (11,832) 2,913 — (14,745) (14,714)
Total Interstate Transportation Network 1,933,458 926,871 397,118 609,469 287,074 204,970 527,365 451,755
AViATioN LaGuardia(c) 391,312 307,976 78,723 4,613 30,363 78,584 52,834 72,957 JFK International(c) 1,261,577 765,152 195,974 300,451 76,580 129,277 353,148 299,917 Newark Liberty International(c) 939,329 489,045 153,057 297,227 63,094 86,784 320,917 291,050 Teterboro 45,188 31,313 15,605 (1,730) 5,649 1,249 (6,130) (9,514) Stewart International(c) 8,807 18,984 9,027 (19,204) 6,051 2,293 (22,962) (16,863)
Total Aviation 2,646,213 1,612,470 452,386 581,357 181,737 298,187 697,807 637,547
PorT dePArTmeNT Port Newark 83,495 92,335 32,611 (41,451) 26,873 1,000 (67,324) (66,411) Elizabeth Marine Terminal 164,356 30,077 35,320 98,959 34,657 — 64,302 32,201 Brooklyn Port Authority Marine Terminal 5,585 11,392 1,454 (7,261) 818 — (8,079) (8,492) Red Hook 1,841 5,498 62 (3,719) — — (3,719) (4,878) Howland Hook Marine Terminal 12,335 7,844 17,068 (12,577) 13,862 — (26,439) (30,053) Greenville Yard Port Authority Marine Terminal 912 10 — 902 — — 902 893 NYNJ Rail LLC 4,455 4,848 468 (861) 763 16,546 14,922 3,800 Port Jersey - Port Authority Marine Terminal 27,590 15,720 6,897 4,973 28,141 — (23,168) (12,919)
Total Port Department 300,569 167,724 93,880 38,965 105,114 17,546 (48,603) (85,859)
deVeloPmeNT Essex County Resource Recovery 23 193 2 (172) 299 — (471) (2,550) Industrial Park at Elizabeth 1,151 8 275 868 269 — 599 520 Bathgate Industrial Park 3,917 2,084 1,362 471 174 — 297 701 Teleport 10,392 8,236 1,897 259 411 — (152) (1,607) Newark Legal & Communications Center — — — — — — — (186) Queens West Waterfront Development 1,103 — 605 498 1,464 — (966) (1,007) Hoboken South Waterfront Development 9,370 332 2,862 6,176 2,641 — 3,535 2,818
Total Development 25,956 10,853 7,003 8,100 5,258 — 2,842 (1,311)
world TrAde ceNTer WTC Site 2,619 130,977 62,618 (190,976) (8,549) 2,000 (180,427) (140,648) One World Trade Center 180,899 115,372 100,667 (35,140) 146,679 7,997 (173,822) (219,402) WTC Towers 2, 3 & 4 39,793 20,475 40,319 (21,001) 23,773 408,613 363,839 264,452 WTC Tower 7 22,704 20,196 — 2,508 - — 2,508 4,311 WTC Retail LLC 14,640 6,844 19,756 (11,960) 39,358 — (51,318) (28,843)
Total World Trade Center 260,655 293,864 223,360 (256,569) 201,261 418,610 (39,220) (120,130)
Port Authority insurance captive entity, llc — (297) — 297 (447) — 744 803
regional facilities and Programs 513 1,602 64,765 (65,854) 29,750 — (95,604) (103,135)
Net revenues related to superstorm sandy — — — — — — — 123
Total Port Authority $5,167,364 $3,013,087 $1,238,512 $ 915,765 $ 809,747 $939,313 $ 1,045,331 $ 779,793
(a) Amounts include all direct and allocated operating expenses.
(b) Amounts include net interest expense (interest expense less financial income), 4 WTC Liberty Bond debt service reimbursements, Pass-through grant program payments, Grants in connection with operating activities and gains or losses generated by the disposition of assets, if any.
(c) Facility amounts include Passenger Facility Charge activities.

135THE FOUNDATION FOR A NEW TOMORROW
Schedule F - Information on Capital Investment in Port Authority Facilities
facilities, net facilities, net dec. 31, capital dec. 31, 2015 investment(a) depreciation dispositions 2016
(In thousands)iNTersTATe TrANsPorTATioN NeTwork George Washington Bridge & Bus Station $ 953,965 $ 78,265 $ 38,750 $ — $ 993,480 Holland Tunnel 379,518 44,457 17,002 — 406,973 Lincoln Tunnel 1,040,156 267,604 52,081 — 1,255,679 Bayonne Bridge 860,154 327,328 18,977 — 1,168,505 Goethals Bridge 774,130 427,108 35,042 — 1,166,196 Outerbridge Crossing 90,017 3,125 4,567 — 88,575 Port Authority Bus Terminal 484,131 31,420 24,517 — 491,034
Subtotal - Tunnels, Bridges & Terminals 4,582,071 1,179,307 190,936 — 5,570,442
PATH 2,401,420 217,957 127,324 — 2,492,053 WTC Transportation HUB 3,355,912 236,072 56,910 — 3,535,074 Journal Square Transportation Center 81,366 2 6,544 — 74,824
Subtotal – PATH 5,838,698 454,031 190,778 — 6,101,951
Ferry Transportation 106,729 290 5,289 — 101,730 Access to the Region’s Core (ARC) 78,273 — 10,115 — 68,158
Total Interstate Transportation Network 10,605,771 1,633,628 397,118 — 11,842,281
AViATioN(b)
LaGuardia 1,454,174 365,640 78,723 — 1,741,091 JFK International 3,743,283 89,800 195,974 — 3,637,109 Newark Liberty International 2,379,236 119,125 153,057 — 2,345,304 Teterboro 240,898 2,354 15,605 — 227,647 Stewart International 164,407 8,077 9,027 — 163,457
Total Aviation 7,981,998 584,996 452,386 — 8,114,608
PorT dePArTmeNT Port Newark 799,799 56,064 32,611 — 823,252 Elizabeth Port Authority Marine Terminal 1,042,303 17,810 35,320 — 1,024,793 Brooklyn Port Authority Marine Terminal 61,822 1,897 1,516 — 62,203 Howland Hook Marine Terminal 484,580 22,607 17,068 — 490,119 Greenville Yard / NYNJ Rail LLC 37,063 25,203 468 — 61,798 Port Jersey-Port Authority Marine Terminal 389,492 10,293 6,897 — 392,888
Total Port Department 2,815,059 133,874 93,880 — 2,855,053
deVeloPmeNT Essex County Resource Recovery Facility 5,810 — 2 — 5,808 Industrial Park at Elizabeth 6,091 — 275 — 5,816 Bathgate Industrial Park 4,262 — 1,362 — 2,900 Teleport 11,470 1,569 1,897 — 11,142 Queens West Waterfront Development 86,011 — 605 — 85,406 Hoboken South Waterfront Development 69,106 — 2,862 — 66,244
Total Development 182,750 1,569 7,003 — 177,316
world TrAde ceNTer WTC Site(c) 3,612,261 201,576 62,618 — 3,751,219 One World Trade Center 3,350,528 136,750 100,667 — 3,386,611 WTC Towers 2, 3 & 4(d) 2,562,175 386,980 40,319 — 2,908,836 WTC Retail LLC 1,556,232 121,291 19,756 — 1,657,767
Total World Trade Center 11,081,196 846,597 223,360 — 11,704,433
fAciliTies, net $ 32,666,774 $ 3,200,664 $ 1,173,747 $ — $ 34,693,691
regioNAl ProgrAms $ 280,874 $ — $ 64,765 $ — $ 216,109
(a) Capital investment includes contributed capital amounts and write-offs related to capital construction.
(b) Facility capital investment amounts include projects funded with Passenger Facility Charges.
(c) Capital investment includes site infrastructure primarily related to the WTC Memorial, WTC Vehicular Security Center and the WTC Chiller Plant.
(d) Includes WTC net lessee contributed capital amounts related to the construction of WTC Tower 2, 3 and 4.

136 THE PORT AUTHORITY OF NY & NJ
Schedule G - Port Authority Facility Traffic (Unaudited)*
2016 2015 2014 2013
TuNNels ANd Bridges (eastbound Traffic) AuTomoBiles George Washington Bridge 47,497,000 46,361,000 45,136,000 45,364,000 Lincoln Tunnel 15,993,000 15,706,000 15,597,000 15,580,000 Holland Tunnel 14,727,000 14,763,000 14,915,000 15,511,000 Staten Island Bridges 30,303,000 28,883,000 28,317,000 28,997,000 subtotal Automobiles 108,520,000 105,713,000 103,965,000 105,452,000 Buses George Washington Bridge 440,000 429,000 426,000 429,000 Lincoln Tunnel 2,164,000 2,165,000 2,151,000 2,128,000 Holland Tunnel 191,000 199,000 209,000 220,000 Staten Island Bridges 177,000 176,000 172,000 171,000 subtotal Buses 2,972,000 2,969,000 2,958,000 2,948,000 Trucks George Washington Bridge 3,692,000 3,666,000 3,475,000 3,609,000 Lincoln Tunnel 1,055,000 1,061,000 1,043,000 1,038,000 Holland Tunnel 447,000 447,000 446,000 427,000 Staten Island Bridges 2,085,000 2,091,000 2,131,000 2,214,000 subtotal Trucks 7,279,000 7,265,000 7,095,000 7,288,000 ToTAl Vehicles George Washington Bridge 51,629,000 50,456,000 49,037,000 49,402,000 Lincoln Tunnel 19,212,000 18,932,000 18,791,000 18,746,000 Holland Tunnel 15,365,000 15,409,000 15,570,000 16,158,000 Staten Island Bridges 32,565,000 31,150,000 30,620,000 31,382,000 subtotal Vehicles 118,771,000 115,947,000 114,018,000 115,688,000 PATh Total passengers 78,553,560 76,541,453 73,679,425 72,748,729 Passenger weekday average 269,081 258,425 250,071 244,484 mAriNe TermiNAls General cargo(a) (Metric tons) 32,556,203 36,781,069 35,370,355 34,059,540 Containers (in twenty foot equivalent units) 6,251,953 6,371,720 5,772,303 5,467,347 International waterborne vehicles 505,150 477,170 393,391 452,778 Waterborne bulk commodities (in metric tons) 3,212,603 5,050,519 5,042,690 3,732,292 coNTAiNers New Jersey Marine Terminals 3,416,144 3,427,226 3,098,049 2,895,769 New York Marine Terminals 186,364 236,787 244,237 274,066 subtotal containers 3,602,508 3,664,013 3,342,286 3,169,835
Bus TermiNAls PAsseNgers Port Authority Bus Terminal 75,800,000 74,500,000 66,000,000 65,000,000 George Washington Bridge Bus Station 5,000,000 4,900,000 4,700,000 4,750,000 PATH Journal SquareTransportation Center Bus Station 11,966,000 11,940,000 11,751,500 11,747,500 subtotal Passengers 92,766,000 91,340,000 82,451,500 81,497,500 Bus moVemeNTs Port Authority Bus Terminal 2,380,000 2,350,000 2,320,000 2,288,000 George Washington Bridge Bus Station 345,000 340,000 337,000 335,000 PATH Journal SquareTransportation Center Bus Station 957,280 957,120 940,120 939,800 subtotal Bus movements 3,682,280 3,647,120 3,597,120 3,562,800
AViATioN PlANe moVemeNTs John F. Kennedy International Airport 448,753 439,298 423,421 406,181 LaGuardia Airport 369,987 358,609 360,834 370,861 Newark Liberty International Airport 431,594 413,873 396,386 413,774 subtotal Plane movements 1,250,334 1,211,780 1,180,641 1,190,816 domesTic PAsseNgers John F. Kennedy International Airport 27,245,463 26,806,854 25,021,432 23,913,096 LaGuardia Airport 27,996,763 26,684,923 25,157,202 24,953,572 Newark Liberty International Airport 27,995,353 25,693,128 23,762,627 23,716,837 subtotal domestic Passengers 83,237,579 79,184,905 73,941,261 72,583,505 iNTerNATioNAl PAsseNgers John F. Kennedy International Airport 31,693,184 30,079,898 28,198,994 26,541,183 LaGuardia Airport 1,790,006 1,752,745 1,814,893 1,727,528 Newark Liberty International Airport 12,324,428 11,805,317 11,848,060 11,299,399 subtotal international Passengers 45,807,618 43,637,960 41,861,947 39,568,110 ToTAl PAsseNgers John F. Kennedy International Airport 58,938,647 56,886,752 53,220,426 50,454,279 LaGuardia Airport 29,786,769 28,437,668 26,972,095 26,681,100 Newark Liberty International Airport 40,319,781 37,498,445 35,610,687 35,016,236 subtotal Passengers 129,045,197 122,822,865 115,803,208 112,151,615 cArgo-ToNs John F. Kennedy International Airport 1,311,191 1,332,091 1,343,855 1,321,035 LaGuardia Airport 7,586 7,721 7,140 6,720 Newark Liberty International Airport 746,770 405,214 666,840 663,155 subtotal cargo-tons 2,065,547 1,745,026 2,017,835 1,990,910 revenue mail-tons 140,418 126,026 112,524 158,778
* Some 2016 and 2015 numbers reflect estimated data based on available year-end information.(a) International oceanborne general and bulk cargo as recorded in the New York - New Jersey Customs District.

137THE FOUNDATION FOR A NEW TOMORROW
2012 2011 2010 2009 2008 2007
45,042,000 46,116,000 46,954,000 47,686,000 48,112,000 49,025,000 15,909,000 16,644,000 17,034,000 16,879,000 17,402,000 18,311,000 15,489,000 15,968,000 16,460,000 16,269,000 16,521,000 17,006,000 29,455,000 29,700,000 30,034,000 29,921,000 30,141,000 31,007,000 105,895,000 108,428,000 110,482,000 110,755,000 112,176,000 115,349,000 430,000 487,000 514,000 520,000 550,000 576,000 2,106,000 2,156,000 2,139,000 2,128,000 2,122,000 2,091,000 234,000 268,000 265,000 254,000 253,000 245,000 187,000 200,000 204,000 217,000 233,000 227,000 2,957,000 3,111,000 3,122,000 3,119,000 3,158,000 3,139,000 3,639,000 3,794,000 3,763,000 3,920,000 4,285,000 4,355,000 1,000,000 1,029,000 1,041,000 1,241,000 1,413,000 1,440,000 395,000 354,000 312,000 86,000 97,000 98,000 2,367,000 2,434,000 2,486,000 2,379,000 2,596,000 2,623,000 7,401,000 7,611,000 7,602,000 7,626,000 8,391,000 8,516,000 49,111,000 50,397,000 51,231,000 52,126,000 52,947,000 53,956,000 19,015,000 19,829,000 20,214,000 20,248,000 20,937,000 21,842,000 16,118,000 16,590,000 17,037,000 16,609,000 16,871,000 17,349,000 32,009,000 32,334,000 32,724,000 32,517,000 32,970,000 33,857,000 116,253,000 119,150,000 121,206,000 121,500,000 123,725,000 127,004,000
72,563,052 76,555,644 73,911,000 72,277,000 74,956,000 71,592,000 241,725 256,186 246,890 243,413 253,000 242,000
34,322,209 33,896,217 32,170,041 28,240,770 33,633,613 32,732,000 5,529,908 5,503,485 5,292,020 4,561,527 5,265,053 5,298,000 426,943 387,656 493,245 440,463 723,550 790,000 3,240,189 3,885,614 3,192,132 4,605,609 4,549,572 7,000,000
2,782,059 2,652,744 2,500,503 2,156,961 2,499,054 2,630,849 428,750 544,272 575,892 495,248 569,881 468,190 3,210,809 3,197,016 3,076,395 2,652,209 3,068,935 3,099,039
65,000,000 64,550,000 63,585,000 64,585,000 64,390,000 57,346,000 4,700,000 4,605,000 4,510,000 4,425,000 5,288,000 5,144,000 11,732,600 7,248,160 7,282,900 6,758,800 6,558,000 9,050,000 81,432,600 76,403,160 75,377,900 75,768,800 76,236,000 71,540,000 2,255,000 2,263,500 2,220,000 2,240,000 2,225,000 2,169,000 327,000 307,000 300,000 295,000 324,000 305,000 938,608 814,400 818,300 850,800 825,590 887,000 3,520,608 3,384,900 3,338,300 3,385,800 3,374,590 3,361,000
401,728 408,730 396,912 415,044 437,969 443,750 369,989 365,870 361,616 354,008 378,402 390,765 414,127 410,024 409,321 412,041 432,941 436,113 1,185,844 1,184,624 1,167,849 1,181,093 1,249,312 1,270,628 24,217,083 23,757,976 23,404,277 24,021,233 25,405,948 26,173,650 24,274,029 23,086,756 22,950,115 22,153,236 21,945,239 23,758,362 22,836,683 22,189,669 21,716,886 22,782,126 24,227,815 25,614,140 71,327,795 69,034,401 68,071,278 68,956,595 71,579,002 75,546,152 25,057,093 23,886,084 23,109,877 21,856,709 22,383,907 21,543,251 1,433,755 1,035,722 1,032,967 1,010,223 1,131,664 1,226,902 11,147,344 11,509,823 11,477,304 10,646,771 11,119,078 10,753,100 37,638,192 36,431,629 35,620,148 33,513,703 34,634,649 33,523,253 49,274,176 47,644,060 46,514,154 45,877,942 47,789,855 47,716,901 25,707,784 24,122,478 23,983,082 23,163,459 23,076,903 24,985,264 33,984,027 33,699,492 33,194,190 33,428,897 35,346,893 36,367,240 108,965,987 105,466,030 103,691,426 102,470,298 106,213,651 109,069,405 1,319,226 1,382,949 1,392,866 1,156,040 1,473,809 1,656,431 7,009 7,390 7,516 6,712 8,889 9,595 742,898 812,341 860,970 761,920 860,717 953,556 2,069,133 2,202,680 2,261,352 1,924,672 2,343,415 2,619,582 174,242 184,696 185,681 204,511 237,087 226,512

138 tHe pOrt autHOrIty OF ny & nJ
2016(1) 18,607 1,020,362 $ 54.84 8,758 NA 2015 18,489 981,727 $ 53.10 8,636 5.5% 2014 18,397 960,243 $ 52.20 8,455 6.5% 2013 18,294 921,650 $ 50.38 8,294 7.9% 2012 18,175 934,424 $ 51.41 8,154 8.7% 2011 18,051 892,021 $ 49.42 8,021 8.6% 2010 17,903 857,435 $ 47.89 7,922 8.9% 2009 17,772 830,791 $ 46.75 7,941 8.6% 2008 17,681 825,074 $ 46.66 8,196 5.3% 2007 17,627 801,792 $ 45.49 8,196 4.4%
Note: All data is subject to revision.
Leading Employment by Major Industries (% of Total)(2)
2016(3) 2007 Education & Health Services 17.5% 15.4% Trade Transportation and Utilities 15.5% 16.1% Professional & Business Services 14.3% 13.5% Government 11.9% 13.3% Leisure & Hospitality 8.6% 6.9% Retail Trade 8.5% 8.5% Financial Activities 7.9% 9.0% Other Services 3.9% 3.7% Wholesale Trade 3.8% 4.3% Manufacturing 2.8% 3.7% Information 3.2% 3.3% Construction 2.1% 2.3%
Source: Oxford Economics and BLS
(1) Data is preliminary and subject to revision
(2) Industry definitions can be found at the U.S. Department of Labor Statistics website at www.bls.gov/bls/naics.htm.
(3) BLS Data is preliminary and subject to revision
Selected Statistical Demographic and Economic Data
The New York-New Jersey Metropolitan Region, one of the largest and most diversified in the nation, consists of the five New York boroughs of Manhattan, Brooklyn, Queens, Staten Island, and The Bronx; the four suburban counties of Nassau, Rockland, Suffolk, and Westchester; and the nine northern New Jersey counties of Bergen, Essex, Hudson, Middlesex, Morris, Monmouth, Passaic, Somerset, and Union. The following demographic information is provided for this 18-county region which comprises approximately 4,500 square miles.
(in thousands)
Year PopulationPersonal Disposable
Income
Per-CapitaPersonal Disposable
Income EmploymentUnemployment
Rate

139tHe FOundatIOn FOr a neW tOmOrrOW
MiChael e. FarbiarZ1
General Counsel2016 total compensation: $85,277J.D., Yale Law SchoolA.B., Harvard CollegeExtensive legal experience, including in senior public sector posts.
paTriCK J. FoYeExecutive Director2016 total compensation: $293,745J.D., Fordham Law School B.A., Fordham CollegeMore than 30 years of private sector, legal, and public sector management experience.
eliZabeTh M. MCCarThYChief Financial Officer 2016 total compensation: $274,958B.S., St. Louis UniversityMore than 30 years of financial experience in the public and private sectors.
sTeven p. plaTeChief, Major Capital Projects2016 total compensation: $292,784B.S., Manhattan CollegeMore than 30 years of experience in program management in the private and public sectors.
sTephanie e. dawsonChief Operating Officer 2016 total compensation: $346,875M.S., U.S. Army War CollegeB.A., Cornell UniversityMore than 30 years of experience in logistics, security, and operations management.
MiChael g. MassiahChief, Capital Planning, Execution & Asset Management2016 total compensation: $264,635M.P.A., SUNY AlbanyB.A., LeMoyne CollegeMore than 30 years of public experience in human resources and financial services.
ThoMas l. bosCo2
Director, Aviation2016 total compensation: $253,080M.A., Webster UniversityB.S., United States Military AcademyMore than 30 years of aviation leadership experience.
ThoMas e. belFiore3
Chief Security Officer2016 total compensation: $249,644M.A., John Jay College of Criminal JusticeB.A., John Jay College of Criminal JusticeMore than 35 years of law enforcement, public safety, and security management.
roberT e. galvinChief Technology Officer2016 total compensation: $247,843B.S., Central Michigan University More than 25 years of information technology experience in the public and private sectors.
alan l. reissDirector, World Trade Center Construction 2016 total compensation: $258,602B.S., Northeastern UniversityMore than 30 years of engineering, project management, and executive management experience.
JaMes o. sTaraCeChief Engineer2016 total compensation: $253,954M.S., Stevens Institute of TechnologyB.S., State University of New York Maritime CollegeMore than 30 years of engineering, project, and construction management experience.
MarY lee hannellChief, Human Capital2016 total compensation: $247,201B.A., Drew UniversityMore than 30 years of professional experience in human resources in the private and public sectors.
MiChael nesTorInspector General2016 total compensation: $235,978More than 45 years of public sector experience in law enforcement.
MollY C. CaMpbellDirector, Port2016 total compensation: $232,083M.A., Georgetown UniversityB.A., University of California, Los AngelesMore than 15 years of public experience in maritime operations.
CedriCK T. FulTonDirector, Tunnels, Bridges & Terminals2016 total compensation: $229,526J.D., Seton Hall UniversityB.A., Saint Leo UniversityMore than 35 years of public sector operations, transportation, and leadership experience.
lillian d. valenTiChief Procurement & Contracting Officer2016 total compensation: $234,711M.A., Columbia UniversityB.A., Lafayette CollegeMore than 15 years of public sector leadership and management experience.
andrew s. lYnnDirector, Planning & Regional Development2016 total compensation: $227,804J.D., Harvard UniversityB.A., Harvard UniversityMore than 25 years of public and private experience in planning and development.
MiChael p. MarinoDirector/General Manager, Port Authority Trans-Hudson (PATH)2016 total compensation; $227,965Brooklyn College 2 years Business Administration Penn State Project Management (Amtrak)Old Dominion University Business Management courses, while serving in U.S. NavyU.S. Navy Public Affairs training. More than 20 years of public and private sector railroad construction and logistics experience.
hunTleY a. lawrenCe4
Director, Aviation2016 total compensation: $221,100M.B.A., Dowling CollegeB.S., Florida Institute of TechnologyMore than 30 years of aviation leadership experience.
MiChael a. FedorKoDirector, Public Safety/Superintendent of Police2016 total compensation: $219,202M.G.A., University of PennsylvaniaB.S., Trenton State CollegeMore than 45 years of public safety and public management experience.
tOp 20 SalarIed StaFF aS OF decemBer 31, 2016
1Mr. Farbiarz joined the Port Authority on September 6, 2016.2Mr. Bosco retired from the agency effective February 1, 2017.3Mr. Belfiore left the agency effective December 31, 2016.4Mr. Lawrence became Director of Aviation on December 13, 2016.
Note: Total compensation includes paid wages and imputed income related to taxable employee benefits earned prior to or during calendar year 2016.

4 World Trade Center150 Greenwich StreetNew York, NY 10007www.panynj.gov
The Foundation for a New Tomorrow
2016Annual Report