2016 - ahdb pork · contents poultry pocketbook 2016 page chapter 1 marketing chain table 1.1 uk...
TRANSCRIPT
2016

Contents
Poultry Pocketbook 2016Page
Chapter 1 Marketing chain
Table 1.1 UK poultry meat supply balance ................................................ 3
Table 1.2 UK eggs supply balance .............................................................. 3
Table 1.3 EU poultry meat supply balance ................................................ 4
Table 1.4 EU egg supply balance ................................................................ 4
Chapter 2 Poultry numbers
Figure 2.1 Density of poultry flock, June 2013 ............................................ 5
Table 2.1 UK poultry numbers, June survey ............................................... 6
Table 2.2 UK chick and poult placings ........................................................ 6
Chapter 3 Slaughterings and production
Table 3.1 UK poultry slaughterings ............................................................ 7
Table 3.2 UK poultry meat production ...................................................... 7
Figure 3.1 UK broiler meat production ....................................................... 8
Figure 3.2 Average liveweight of broilers in England and Wales ................ 8
Table 3.3 UK egg packing station throughput ........................................... 9
Table 3.4 UK production of egg products by processors .......................... 9
Figure 3.3 EU broiler meat production, 2015 ........................................... 10
Figure 3.4 EU egg production for human consumption, 2015 .................. 10
Chapter 4 Poultry and egg prices
Table 4.1 Average UK egg packer price paid to producers ...................... 11
Figure 4.1 Average poultry compound feed price, GB .............................. 11
Figure 4.2 UK wholesale chicken prices .................................................... 12
Figure 4.3 UK wholesale hens’ egg prices ................................................. 12
1

Page
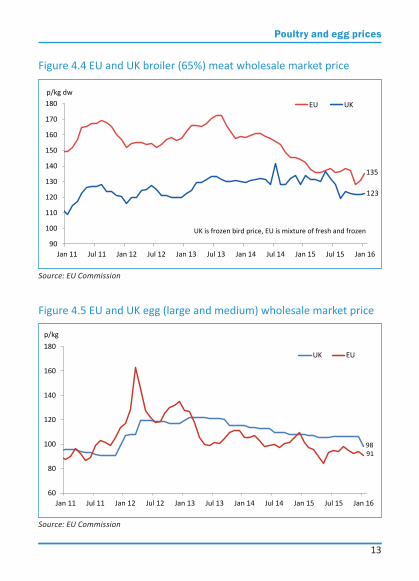
Figure 4.4 EU and UK broiler (65%) meat wholesale market price ........... 13
Figure 4.5 EU and UK egg (large and medium) wholesale market price .. 13
Chapter 5 Imports and exports
Table 5.1 UK egg trade by volume ........................................................... 14
Table 5.2 Volume and value of UK poultry meat imports ....................... 14
Table 5.3 Volume and value of UK poultry meat exports ....................... 15
Table 5.4 UK fresh/frozen poultry meat imports by source .................... 15
Table 5.5 UK fresh/frozen poultry meat exports by destination ............ 16
Table 5.6 UK processed poultry meat imports by source ....................... 16
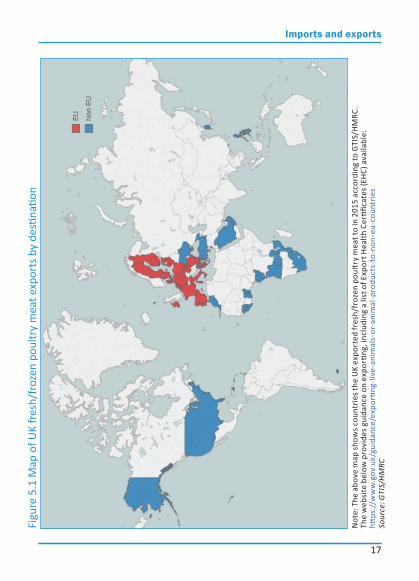
Figure 5.1 Map of UK fresh/frozen poultry meat exports by destination 17
Table 5.7 UK processed poultry meat exports by destination ................ 18
Table 5.8 EU exports of poultry meat ...................................................... 18
Chapter 6 Consumption
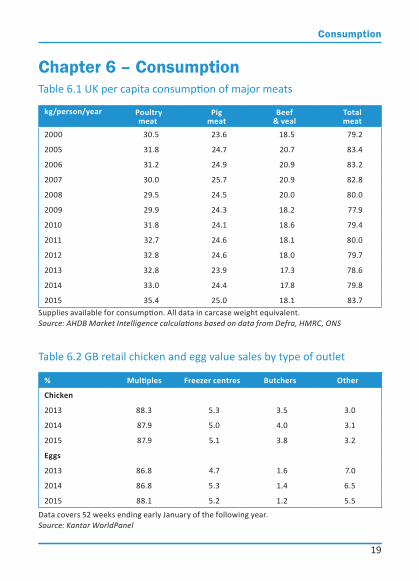
Table 6.1 UK per capita consumption of major meats ............................ 19
Table 6.2 GB retail chicken and egg value sales by type of outlet .......... 19
Figure 6.1 Trends in GB household chicken purchases by volume ........... 20
Figure 6.2 Trends in GB household egg purchases by volume ................. 20
Figure 6.3 Change in GB retail volume and value sales of chicken by product, 2015 ...................................................................... 21
Figure 6.4 GB volume sales of chicken by product, 2015 ......................... 21
Figure 6.5 Change in GB retail volume and value sales of eggs, 2015 ...... 22
Figure 6.6 GB volume sales of eggs, 2015 ................................................. 22
Figure 6.7 Average GB retail price of chicken cuts, 2015 ......................... 23
Figure 6.8 Average GB retail price of eggs, 2015 ...................................... 23
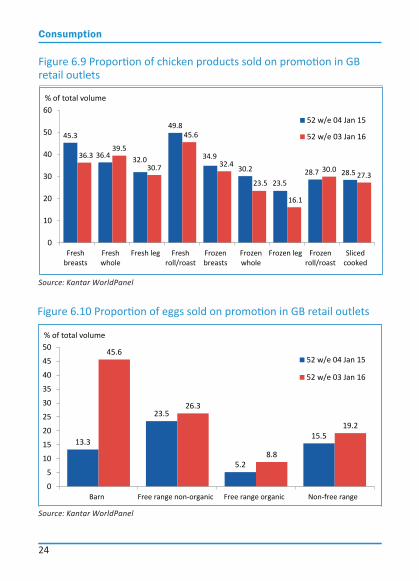
Figure 6.9 Proportion of chicken products sold on promotion in GB retail outlets .................................................................... 24
Figure 6.10 Proportion of eggs sold on promotion in GB retail outlets ..... 24
Contents
2

Marketing chain
3
Chapter 1 – Marketing chainTable 1.1 UK poultry meat supply balance (a)
(a) Includes offals. (b) Includes trade in salted and processed poultry meat. All data in carcase weight equivalent.Source: Defra, GTIS/HMRC, AHDB Market Intelligence
(a) Includes shell egg equivalent of whole egg (dried, frozen and liquid), egg yolk and albumen.* ProvisionalSource: Defra
'000 tonnes 2011 2012 2013 2014 2015
Production 1,558 1,607 1,661 1,646 1,690
Imports (b) 857 817 824 872 939
Exports (b) 344 334 382 388 323
Total consumption 2,070 2,091 2,103 2,130 2,306
Self-sufficiency (%) 75 77 79 77 73
million dozen 2010 2011 2012 2013 2014*
Production (for human consumption) 826 821 797 829 839
of which: sold in shell 673 664 654 695 695
processed 152 158 143 134 144
Imports (a) 136 126 163 153 158
Exports (a) 8 11 19 23 11
Total consumption 953 937 941 959 986
Self-sufficiency (%) 87 88 85 86 85
Table 1.2 UK eggs supply balance

Marketing chain
4
Note: The EU Commission has revised the series compared with last year’s edition of the pocketbook.(a) Includes poultry offals.(e) estimateSource: EU Commission
Note: The EU Commission has revised the series compared with last year’s edition of the pocketbook. All data is in whole egg equivalent.(e) estimateSource: EU Commission
'000 tonnes 2011 2012 2013 2014 2015 (e)
Indigenous production 12,359 12,692 12,798 13,270 13,766
Imports 832 842 792 822 853
Exports 1,299 1,316 1,303 1,361 1,361
Total consumption 11,892 12,217 12,287 12,732 13,258
Self-sufficiency (%) 104 104 104 104 104
'000 tonnes 2011 2012 2013 2014 (e) 2015 (e)
Indigenous production 7,039 7,029 7,341 7,387 7,564
Imports 23 40 22 16 20
Exports 259 235 279 309 346
Eggs for hatching 874 987 910 878 902
Human consumption 5,928 5,847 6,174 6,216 6,336
Self-sufficiency (%) 103 103 104 104 105
Table 1.3 EU poultry meat supply balance (a)
Table 1.4 EU egg supply balance

Poultry numbers
5
Figure 2.1 Density of poultry flock, June 2013
Data covers commercial holdings only.Source: AHDB Market Intelligence, Defra, Welsh Government, DARD, Scottish Government
Chapter 2 – Poultry numbers
6
Poultry numbers
million head 2011 2012 2013 2014 2015
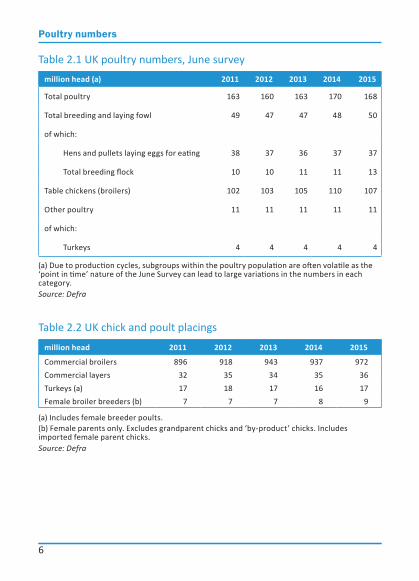
Commercial broilers 896 918 943 937 972Commercial layers 32 35 34 35 36Turkeys (a) 17 18 17 16 17Female broiler breeders (b) 7 7 7 8 9
Table 2.2 UK chick and poult placings
(a) Includes female breeder poults.(b) Female parents only. Excludes grandparent chicks and ‘by-product’ chicks. Includes imported female parent chicks. Source: Defra
Table 2.1 UK poultry numbers, June survey
(a) Due to production cycles, subgroups within the poultry population are often volatile as the ‘point in time’ nature of the June Survey can lead to large variations in the numbers in each category.Source: Defra
million head (a) 2011 2012 2013 2014 2015
Total poultry 163 160 163 170 168
Total breeding and laying fowl 49 47 47 48 50
of which:
Hens and pullets laying eggs for eating 38 37 36 37 37
Total breeding flock 10 10 11 11 13
Table chickens (broilers) 102 103 105 110 107
Other poultry 11 11 11 11 11
of which:
Turkeys 4 4 4 4 4

7
Slaughterings and production
'000 tonnes Broilers Boiling fowl Turkey Ducks Total
2000 1,163 52 264 41 1,5192005 1,282 51 192 37 1,5642010 * 1,323 53 162 30 1,5682011 1,297 56 171 33 1,5582012 1,322 58 196 32 1,6072013 1,388 55 187 30 1,6612014 1,383 58 172 32 1,6462015 1,418 65 178 29 1,690
Table 3.2 UK poultry meat production (a)
Chapter 3 – Slaughterings and productionTable 3.1 UK poultry slaughterings
* 53-week statistical yearNote: Boiling fowl includes spent hens and spent breeders.Source: Defra
* 53-week statistical year(a) Excludes other bird types, eg geese.Source: Defra
million head Broilers Boiling fowl Turkeys2000 760 38 272005 827 38 192010 * 863 41 162011 855 44 172012 874 46 182013 902 42 182014 900 42 152015 930 45 16
Slaughterings and production
8
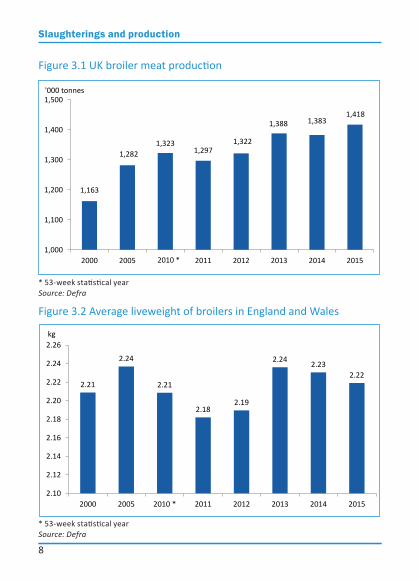
Figure 3.1 UK broiler meat production
Figure 3.2 Average liveweight of broilers in England and Wales
* 53-week statistical yearSource: Defra
* 53-week statistical yearSource: Defra
1,163
1,282 1,323
1,297 1,322
1,388 1,383 1,418
1,000
1,100
1,200
1,300
1,400
1,500
2000 2005 2010 2011 2012 2013 2014 2015
'000 tonnes
2.21
2.24
2.21
2.182.19
2.24 2.232.22
2.10
2.12
2.14
2.16
2.18
2.20
2.22
2.24
2.26
2000 2005 2010 * 2011 2012 2013 2014 2015
kg
2.21
2.24
2.21
2.182.19
2.24 2.232.22
2.10
2.12
2.14
2.16
2.18
2.20
2.22
2.24
2.26
2000 2005 2010 * 2011 2012 2013 2014 2015
kg

Slaughterings and production
9
'000 cases Total Enriched Barn Free range Organic
2000 22,460 16,187 1,675 4,598 n/a
2005 24,584 15,558 1,564 7,462 n/a
2010 27,067 13,522 1,334 11,283 928
2011 26,921 13,128 1,075 11,879 838
2012 25,922 12,596 948 11,716 662
2013 26,901 13,606 890 11,795 610
2014 27,097 14,097 782 11,591 627
2015 27,834 14,213 661 12,302 658
Table 3.3 UK egg packing station throughput
Table 3.4 UK production of egg products by processors
1 case = 360 eggsn/a = Not availableSource: Defra
* combined from 2010 onwardsSource: Defra
tonnes Liquid egg Hard boiled * Other * Total
2000 75,022 n/a 16,756 91,778
2005 78,066 28,649 13,630 120,345
2010 64,459 33,188 97,648
2011 67,908 32,518 100,426
2012 66,338 24,503 90,841
2013 62,338 32,667 95,005
2014 66,910 34,968 101,878
2015 67,624 31,850 99,474

10
Slaughterings and production
Source: EU Commission
Figure 3.3 EU broiler meat production, 2015
Figure 3.4 EU egg production for human consumption, 2015
Source: EU Commission
908800 790
690 653 645
527
335
1,322
0
200
400
600
800
1,000
1,200
1,400
FR IT DE ES UK NL PL RO Others
'000 tonnes
1,748
1,418 1,305
1,178 1,170 1,009
915
349 246
1,973
0
500
1,000
1,500
2,000
PL UK DE ES FR NL IT HU BE Others
'000 tonnes
11
Poultry and egg prices
pence per dozen All Enriched Barn Free range Organic
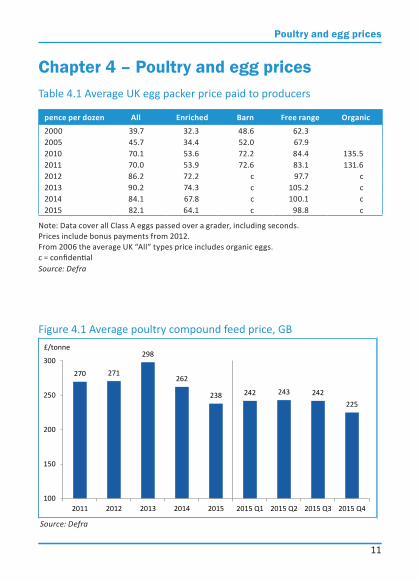
2000 39.7 32.3 48.6 62.32005 45.7 34.4 52.0 67.92010 70.1 53.6 72.2 84.4 135.52011 70.0 53.9 72.6 83.1 131.62012 86.2 72.2 c 97.7 c2013 90.2 74.3 c 105.2 c2014 84.1 67.8 c 100.1 c2015 82.1 64.1 c 98.8 c
Note: Data cover all Class A eggs passed over a grader, including seconds. Prices include bonus payments from 2012.From 2006 the average UK “All” types price includes organic eggs.c = confidentialSource: Defra
Chapter 4 – Poultry and egg pricesTable 4.1 Average UK egg packer price paid to producers
Figure 4.1 Average poultry compound feed price, GB
Source: Defra
270 271
298
262
238 242 243 242225
100
150
200
250
300
2011 2012 2013 2014 2015 2015 Q1 2015 Q2 2015 Q3 2015 Q4
£/tonne
Source: Defra
Figure 4.1 Average poultry compound feed price, GB

Poultry and egg prices
12
Figure 4.2 UK wholesale chicken prices
Source: Defra/London wholesale market
Figure 4.3 UK wholesale hens’ egg prices
Source: Defra/London wholesale market
50
100
150
200
250
300
350
400
Jan 11 Jul 11 Jan 12 Jul 12 Jan 13 Jul 13 Jan 14 Jul 14 Jan 15 Jul 15 Jan 16
p/kg
Fresh broiler - 1.35kg - 1.55kg Fresh skinless breast filletsFresh skinless breast fillets (callibrated) Frozen broiler - 1.15kg - 2.05kg
320
140125
20
40
60
80
100
120
140
Jan 11 Jul 11 Jan 12 Jul 12 Jan 13 Jul 13 Jan 14 Jul 14 Jan 15 Jul 15 Jan 16
p/dozen
Large 63-73 g
Medium 53-63 g
98
108
Poultry and egg prices
13
Figure 4.4 EU and UK broiler (65%) meat wholesale market price
Source: EU Commission
Figure 4.5 EU and UK egg (large and medium) wholesale market price
Source: EU Commission
90
100
110
120
130
140
150
160
170
180
Jan 11 Jul 11 Jan 12 Jul 12 Jan 13 Jul 13 Jan 14 Jul 14 Jan 15 Jul 15 Jan 16
p/kg dwEU UK
UK is frozen bird price, EU is mixture of fresh and frozen
135
123
60
80
100
120
140
160
180
Jan 11 Jul 11 Jan 12 Jul 12 Jan 13 Jul 13 Jan 14 Jul 14 Jan 15 Jul 15 Jan 16
p/kg
UK EU
9891

14
Imports and exports
Chapter 5 – Imports and exportsTable 5.1 UK egg trade by volume
'000 cases 2011 2012 2013 2014 2015 (e)
ImportsShell eggs 1,395 2,281 1,718 1,851 1,606 Egg products 2,815 3,157 3,382 3,413 3,957 Total 4,210 5,438 5,099 5,263 5,564
ExportsShell eggs 221 269 280 243 180Egg products 137 363 504 130 118Total 358 632 784 374 298
1 case = 360 eggs All data converted to shell egg equivalent. (e) estimate Source: Defra
tonnes, product weight 2011 2012 2013 2014 2015
Fresh/frozen poultry (inc offals) 412,368 382,067 383,812 407,833 438,237
Salted poultry 47,508 43,439 49,610 56,098 60,390
Processed poultry 278,732 292,288 291,197 305,893 336,424Total 738,608 717,794 724,619 769,824 835,051
£'000 2011 2012 2013 2014 2015
Fresh/frozen poultry (inc offals) 1,078,530 936,144 956,793 1,020,954 1,030,287 Salted poultry 102,571 85,009 103,090 113,318 112,304 Processed poultry 797,679 802,476 848,425 888,716 913,179
Total 1,978,780 1,823,629 1,908,308 2,022,987 2,055,771
Source: GTIS/HMRC
Table 5.2 Volume and value of UK poultry meat imports

15
Imports and exports
tonnes, product weight 2011 2012 2013 2014 2015
Fresh/frozen poultry (inc offals) 295,241 289,787 342,161 351,058 291,107
Salted poultry 3,971 2,929 2,433 3,411 3,571Processed poultry 45,511 45,850 42,586 48,517 44,776Total 344,723 338,566 387,180 402,986 339,454
£’000 2011 2012 2013 2014 2015
Fresh/frozen poultry (inc offals) 306,725 273,987 329,627 296,300 227,784Salted poultry 9,623 6,646 5,466 8,593 6,665Processed poultry 143,602 137,584 126,483 135,492 116,016Total 459,950 418,217 461,577 440,385 350,465
Source: GTIS/HMRC
Table 5.3 Volume and value of UK poultry meat exports
tonnes, product weight 2011 2012 2013 2014 2015
Total 412,368 382,067 383,812 407,833 438,237
of which from:
Netherlands 169,462 180,940 178,619 178,496 190,549
Poland 43,497 46,817 51,874 55,873 65,583
Ireland 66,799 28,694 25,456 35,154 38,133
Germany 31,272 25,979 26,331 30,133 31,662
Belgium 20,644 28,008 25,887 30,786 30,761
Italy 9,709 14,679 12,449 10,587 15,775
France 20,276 14,877 13,224 13,476 10,724
Romania 2,224 3,086 7,052 6,901 10,572
Spain 2,508 1,442 3,647 6,005 8,198
Note: Includes offals.Source: GTIS/HMRC
Table 5.4 UK fresh/frozen poultry meat imports by source

16
Imports and exports
tonnes, product weight 2011 2012 2013 2014 2015
Total 295,241 289,787 342,161 351,058 291,107
of which to:
(EU 28) (197,773) (203,352) (249,115) (244,619) (222,480)
Netherlands 52,799 66,378 100,521 107,917 92,028
Ireland 46,048 48,786 46,437 45,877 43,090
Germany 26,212 15,882 19,339 22,702 23,770
France 23,986 18,657 21,073 21,911 21,675
Spain 15,555 17,029 16,020 12,454 16,509
Belgium 5,917 8,862 14,822 11,569 6,777
South Africa 24,722 26,602 38,341 43,013 18,157
Hong Kong 40,215 25,449 20,876 25,811 17,688
Philippines 2,696 1,413 2,222 3,272 5,274
Note: Includes offals.Source: GTIS/HMRC
Table 5.5 UK fresh/frozen poultry meat exports by destination
tonnes, product weight 2011 2012 2013 2014 2015
Total 278,732 292,288 291,197 305,893 336,424
of which from:
(EU 28) (111,180) (128,400) (134,143) (132,495) (159,166)
Netherlands 28,164 33,467 31,370 32,312 39,784
Ireland 27,674 28,539 33,300 29,970 31,490
Poland 10,490 11,989 14,633 16,478 25,678
Germany 13,092 15,607 14,665 14,324 25,348
France 4,817 9,013 11,411 11,375 11,994
Belgium 2,596 4,594 5,028 8,683 7,496
Thailand 138,900 134,479 116,651 124,650 127,223
Brazil 19,939 21,456 29,008 40,414 42,229
China 5,861 6,008 8,963 7,223 6,894
Source: GTIS/HMRC
Table 5.6 UK processed poultry meat imports by source
17
Imports and exportsFi
gure
5.1
Map
of U
K fr
esh/
froz
en p
oultr
y m
eat e
xpor
ts b
y de
stina
tion
Not
e: T
he a
bove
map
sho
ws c
ount
ries t
he U
K ex
port
ed fr
esh/
froz
en p
oultr
y m
eat t
o in
201
5 ac
cord
ing
to G
TIS/
HM
RC.
The
web
site
bel
ow p
rovi
des g
uida
nce
on e
xpor
ting,
incl
udin
g a
list o
f Exp
ort H
ealth
Cer
tifica
tes (
EHC)
ava
ilabl
e:htt
ps://
ww
w.g
ov.u
k/gu
idan
ce/e
xpor
ting-
live-
anim
als-
or-a
nim
al-p
rodu
cts-
to-n
on-e
u-co
untr
ies
Sour
ce: G
TIS/
HM
RC

18
Imports and exports
tonnes, product weight 2011 2012 2013 2014 2015
Total 45,511 45,850 42,586 48,517 44,776
of which to:
Ireland 27,602 25,598 22,159 22,124 20,157
Netherlands 5,912 6,543 5,642 9,299 8,872
Germany 4,981 5,972 6,724 5,705 5,476
Source: GTIS/HMRC
Table 5.7 UK processed poultry meat exports by destination
Table 5.8 EU exports of poultry meattonnes, product weight 2011 2012 2013 2014 2015
Total 1,265,163 1,236,838 1,231,484 1,294,613 1,301,119
of which to:
South Africa 89,207 129,690 150,993 195,083 209,465
Saudi Arabia 150,523 147,725 153,514 121,817 141,375
Benin 123,994 136,887 137,102 162,840 135,721
Hong Kong 187,230 109,611 101,565 120,083 87,155
Philippines 22,179 22,186 26,707 43,794 73,069
Ghana 66,855 66,951 72,953 56,115 67,464
Ukraine 60,550 77,250 54,672 57,775 66,251
Gabon 24,970 25,601 24,494 28,788 36,432
Congo Dem. Rep. 28,727 33,050 27,340 32,496 34,845
Congo 18,170 17,957 22,108 26,299 33,523
Macedonia 20,318 27,177 30,143 28,187 26,687
Malaysia 20,524 23,499 26,938 25,149 24,571
Vietnam 29,001 17,447 11,651 18,038 24,484
China 16,159 10,115 14,196 13,734 21,997
Togo 18,467 18,387 18,074 18,382 20,973
Liberia 10,478 11,606 13,394 12,656 20,825
Source: GTIS, Eurostat
19
Consumption
Chapter 6 – Consumption
Supplies available for consumption. All data in carcase weight equivalent. Source: AHDB Market Intelligence calculations based on data from Defra, HMRC, ONS
kg/person/year Poultry meat
Pig meat
Beef & veal
Total meat
2000 30.5 23.6 18.5 79.2
2005 31.8 24.7 20.7 83.4
2006 31.2 24.9 20.9 83.2
2007 30.0 25.7 20.9 82.8
2008 29.5 24.5 20.0 80.0
2009 29.9 24.3 18.2 77.9
2010 31.8 24.1 18.6 79.4
2011 32.7 24.6 18.1 80.0
2012 32.8 24.6 18.0 79.7
2013 32.8 23.9 17.3 78.6
2014 33.0 24.4 17.8 79.8
2015 35.4 25.0 18.1 83.7
Table 6.2 GB retail chicken and egg value sales by type of outlet
Data covers 52 weeks ending early January of the following year.Source: Kantar WorldPanel
% Multiples Freezer centres Butchers Other
Chicken
2013 88.3 5.3 3.5 3.0
2014 87.9 5.0 4.0 3.1
2015 87.9 5.1 3.8 3.2
Eggs
2013 86.8 4.7 1.6 7.0
2014 86.8 5.3 1.4 6.5
2015 88.1 5.2 1.2 5.5
Table 6.1 UK per capita consumption of major meats

20
Consumption
Figure 6.1 Trends in GB household chicken purchases by volume
Figure 6.2 Trends in GB household egg purchases by volume
Note: Figures include ‘Ready to cook’ and ‘Chilled main meal accompaniment’ products.Source: Kantar WorldPanel
Source: Kantar WorldPanel
5,000,000
5,100,000
5,200,000
5,300,000
5,400,000
5,500,000
5,600,000
01Feb
01Mar
29Mar
26Apr
24May
21Jun
19Jul
16Aug
13Sep
11Oct
08Nov
06Dec
03Jan
2013 2014 2015
'000s (52 weeks ending)
570,000
575,000
580,000
585,000
590,000
595,000
600,000
605,000
610,000
01Feb
01Mar
29Mar
26Apr
24May
21Jun
19Jul
16Aug
13Sep
11Oct
08Nov
06Dec
03Jan
2013 2014 2015
tonnes (52 weeks ending)

21
Consumption
Figure 6.3 Change in GB retail volume and value sales of chicken by product, 2015
Data covers 52 weeks ending early January of the following year. Source: Kantar WorldPanel
Figure 6.4 GB volume sales of chicken by product, 2015
Data covers 52 weeks ending 3 January 2016. Source: Kantar WorldPanel
137,610
212,642
78,317
2,773
43,210
1,459 5,122 4,35023,128
0
50,000
100,000
150,000
200,000
250,000
Freshbreasts
Freshwhole
Freshleg
Freshroll/roast
Frozenbreasts
Frozenwhole
FrozenLeg
Frozenroll/roast
Slicedcooked
tonnes
12.5
-0.7
3.9
-2.5 -0.2
-58.3
-17.7
15.4
4.12.1
-4.9-1.7
-7.2 -4.9
-57.7
-16.3
5.8
-0.6
-70
-60
-50
-40
-30
-20
-10
0
10
20
Freshbreasts
Freshwhole
Freshleg
Freshroll/roast
Frozenbreasts
Frozenwhole
FrozenLeg
Frozenroll/roast
Slicedcooked
yoy % change
Volume Value

22
Consumption
Figure 6.5 Change in GB retail volume and value sales of eggs, 2015
Data covers 52 weeks ending early January of the following year. Source: Kantar WorldPanel
Figure 6.6 GB volume sales of eggs, 2015
Data covers 52 weeks ending 3 January 2016. Source: Kantar WorldPanel
1.0
8.8
14.6
1.0
-24.8
-3.7
8.9
-9.7
-28-24-20-16-12
-8-4048
121620
Barn Free range non-organic
Free range organic Non-free range
yoy % changeVolume Value
159,717
2,923,694
68,926
2,430,022
0
500,000
1,000,000
1,500,000
2,000,000
2,500,000
3,000,000
Barn Free range non-organic
Free range organic Non-free range
'000 eggs

23
Consumption
Figure 6.7 Average GB retail price of chicken cuts, 2015
Figure 6.8 Average GB retail price of eggs, 2015
Data covers 52 weeks ending 3 January 2016. Source: Kantar WorldPanel
Data covers 52 weeks ending 3 January 2016. Source: Kantar WorldPanel
10
18
35
10
0
5
10
15
20
25
30
35
40
Barn Free rangenon-organic
Free range organic Non-free range
price per egg (p)
7.02
2.793.39
8.38
3.95
2.36 2.07
5.10
6.84
0
1
2
3
4
5
6
7
8
9
Freshbreasts
Freshwhole
Fresh leg Freshroll/roast
Frozenbreasts
Frozenwhole
Frozen leg Frozenroll/roast
Slicedcooked
price per kg (£)
24
Consumption
Figure 6.9 Proportion of chicken products sold on promotion in GB retail outlets
Figure 6.10 Proportion of eggs sold on promotion in GB retail outlets
Source: Kantar WorldPanel
Source: Kantar WorldPanel
13.3
23.5
5.2
15.5
45.6
26.3
8.8
19.2
0
5
10
15
20
25
30
35
40
45
50
Barn Free range non-organic Free range organic Non-free range
% of total volume
52 w/e 04 Jan 15
52 w/e 03 Jan 16
45.3
36.4 32.0
49.8
34.930.2
23.528.7 28.5
36.339.5
30.7
45.6
32.4
23.5
16.1
30.027.3
0
10
20
30
40
50
60
Freshbreasts
Freshwhole
Fresh leg Freshroll/roast
Frozenbreasts
Frozenwhole
Frozen leg Frozenroll/roast
Slicedcooked
% of total volume
52 w/e 04 Jan 15
52 w/e 03 Jan 16

Agriculture and Horticulture Development Board Stoneleigh Park Kenilworth Warwickshire CV8 2TL Tel: 024 7669 2051 www.ahdb.org.uk
© Agriculture and Horticulture Development Board 2016. All rights reserved.
While the Agriculture and Horticulture Development Board seeks to ensure that the information contained within this document is accurate at the time of publication, no warranty is given in respect thereof and, to the maximum extent permitted by law, the Agriculture and Horticulture Development Board accepts no liability for loss, damage or injury howsoever caused (including that caused by negligence) or suffered directly or indirectly in relation to information and opinions contained in or omitted from this document.
Cover Images:Chicken & Egg - Tsekhmister/Shutterstock.comRaw Chicken - Jiri Hera/Shutterstock.com
ISBN 978-1-904437-97-0