2016 annual portfolio performance report · 2016 annual portfolio performance report ... portfolio...
TRANSCRIPT

May 2017
2016 Annual Portfolio Performance Report
This is a redacted version of the document that excludes information that is subject to exceptions to disclosure set forth in ADB's Public Communications Policy 2011.

ABBREVIATIONS
NOTES
(i) In this report, “$” refers to US dollars.
(ii) Totals may not sum precisely because of rounding.
ADB – Asian Development Bank ADF – Asian Development Fund APPR – annual portfolio performance report BER – bid evaluation report PRC – People’s Republic of China DEfR – Development Effectiveness Review DVA – direct value added MFF – multitranche financing facility OCR – ordinary capital resources PASS – Procurement Accreditation Skills Scheme PPTA – project preparatory technical assistance RBL – results-based lending

Vice-President D. Stokes, Vice-President (Administration and Corporate Management)
Director General R. Subramaniam, Operations Services and Financial Management Department (OSFMD)
Head M. Parkash, Advisor and Head, Operations Management Unit, OSFMD
Team leader D. Zhang, Principal Portfolio Management Specialist, OSFMD
Team members M. Abrera, Senior Financial Control Officer, Controller’s Department (CTL) M. Barcenas, Senior Portfolio Management Officer, OSFMD B.R. Bathula, Principal Project Management Specialist, South Asia Department S. Beck, Principal Investment Specialist, Private Sector Operations Department
(PSOD) R. Caluag, Senior Investment Officer, PSOD P. Comia, Associate Portfolio Management Officer, OSFMD O. Dyloco-Canto, Senior Portfolio Management Officer, OSFMD I. Flores, Senior Portfolio Management Assistant, OSFMD C. Horiuchi, Risk Management Specialist, Office of Risk Management (ORM) H.W. Hwang, Financial Control Specialist, CTL R. Kausar, Principal Portfolio Management Specialist, Southeast Asia Department M. Lahoz, Senior Finance Officer, PSOD E. Mangampat, Senior Investment Officer, PSOD M. Monreal, Portfolio Management Analyst, OSFMD S. Muramoto, Unit Head, Project Administration, Pacific Department D. Ordonez, Risk Management Officer, ORM J. Pascual, Portfolio Management Officer (Systems Support), OSFMD J.K. Petersen, Principal Portfolio Management Specialist, Central and West Asia
Department C.L. Roberts, Director, PSOD G. Rublee, Principal Risk Management Specialist, ORM M.L. Tan, Portfolio Management Officer, OSFMD A.M. Tirona, Associate Risk Management Officer, ORM M. Villareal, Principal Portfolio Management Specialist, East Asia Department
In preparing any country program or strategy, financing any project, or by making any designation of or reference to a particular territory or geographic area in this document, the Asian Development Bank does not intend to make any judgments as to the legal or other status of any territory or area.

CONTENTS
Page EXECUTIVE SUMMARY i
I. INTRODUCTION 1
II. 2016 SOVEREIGN PORTFOLIO 1 A. Portfolio Composition and Trends 1 B. Portfolio Key Findings 2 C. Conclusions and Agreed Actions 24
III. 2016 NONSOVEREIGN PORTFOLIO 30 A. Portfolio Composition and Trends 30 B. Portfolio Key Findings 36 C. Conclusions and Agreed Actions 36
APPENDIXES
1. 2016 Sovereign Portfolio: Key Indicators 37 2. Update of Midterm Review of Procurement Actions (10-Point Action Plan)
Implementation and Procurement Reforms 3. Status of the 2015 Annual Portfolio Performance Report Recommended Actions
39 40
4. Sovereign Operations Glossary 43 5. Nonsovereign Operations Glossary 47

EXECUTIVE SUMMARY
The annual portfolio performance report (APPR) is a Management report detailing the state of the sovereign and nonsovereign portfolios of the Asian Development Bank (ADB). It presents a snapshot of ADB’s operational performance in 2016, analyzes portfolio composition and trends, and identifies key issues. It concludes with agreed actions to improve portfolio performance. 2016 Sovereign Portfolio The active sovereign portfolio of loans, grants, technical assistance (TA), and equity increased by $5.2 billion or 7.2% over 2015 and totaled $78.4 billion at the end of 2016. The loan and grant portfolio of 705 active projects increased by 6.7% to $76.2 billion. ADB’s ordinary capital resources (OCR) financed 70.6% of the loan, guarantee, and equity portfolio value ($55.4 billion). The Asian Development Fund (ADF) financed 24.6% and other special funds and cofinancing financed 4.8%. The average project size increased by 2.0% to $108.1 million from $105.9 million in 2015. The core sectors of Strategy 20201 accounted for 82.9% of the portfolio value, a slight increase from 82.8% in 2015. In 2016, contract awards for project loans and grants totaled $9.3 billion, 13.6% more than in 2015. Disbursements for projects totaled $7.9 billion in 2016, an increase of 11.9% from $7.0 billion in 2015. ADF-funded projects performed better than OCR-funded projects. The cumulative portfolio disbursement (S-curve) for 2016 improved over 2015 actual S-curve. Disbursements in projects for all age groups except ages 0, 2 and 4, were higher in 2016 compared to 2015. The uncontracted percentage was 42.8%, which was lower than 43.8% in 2015 and the 5-year average of 44.1%.
The implementation of Procurement Reform 10-Point Action Plan2 continued to have good results. In 2016, the average time taken by ADB for processing approvals of bid evaluation reports of $10 million and above contracts was reduced to 45 days compared with 49 days 2015.
The average age of projects from approval increased from 3.3 years to 3.4 years in 2016.
When measured by value, 57.1% of the portfolio was in ages 0–3 years of implementation, compared with 57.8% in 2015. The percentage by number was 56, down from 58.1 in 2015. Some 20.5% of the total project portfolio ($14.9 billion) and 21.9% in number (217) were 6 years old and above. Seventy-nine loans and 29 grants are already past their closing dates. Ninety-six percent of the projects closed went beyond the original closing date with 50% of these delayed by 2 years or more.
The entry of effective loans and grants within the same year of approval into the portfolio
was 20.8% in 2016 compared with 21.5% in 2015. The new initiative to focus on commitment rather than approvals should help improve the entry. In 2016, $1,341.2 million of loans and grants were terminated and canceled, an increase of 77.1% from 2015. The 2016 net resource transfer for project loans was $3.2 billion, 3.9% higher than in 2015 ($3.0 billion).
The 2016 TA portfolio decreased $5.1 million (0.3%) by value and 68 (7.0%) by number.
By number, 22.1% were project preparatory TA (PPTA) and 77.9% were non-PPTA. The average
1 ADB. 2008. Strategy 2020: The Long-Term Strategic Framework of the Asian Development Bank, 2008–2020.
Manila. 2 ADB. 2014. Procurement Reform – 10-Point Action Plan. Manila

ii
age of a TA project from approval was 2.3 years, and 55.9% of the active TA projects had been extended for an average of 1.9 years. In addition, at the end of December 2016, 88 TA projects were age 5 and above, with an undisbursed balance of $126.6 million. Eighty-six of these TAs have extended their completion date and 33 have uncontracted balances equal or less than $100,000.
The performance of the sovereign portfolio in 2016 improved in terms of contract awards,
disbursements, and project performance ratings. Contract awards and disbursements were the highest in absolute amounts and higher in ratios than in 2015. The increase in contract awards and disbursement performance is attributed to the strong performance of the South Asia Department (SARD), and Central and West Department (CWRD). However, contract awards in the year 4 and 5 age groups decreased by 36.5% ($692.0 million) and disbursements in the year 4 age group decreased by 21.1% ($282.5 million), highlighting the need to monitor the performance of projects in these age groups. Based on the 2016 performance, the following actions have been agreed amongst the
concerned departments to improve the portfolio’s performance:
(i) Continue rigorous efforts to improve project readiness, monitor large contracts and large disbursements, and tighten monitoring on projects with large uncontracted and undisbursed balances in ages 4 and above.
(ii) Monitor closely projects already delayed by 2 years or more beyond the original implementation period, and close projects past closing date.
(iii) Improve the entry of approved projects becoming effective in the same year to between 30% and 50%.
(iv) Review TA projects that are more than 5 years and close those that have less than $100,000 uncontracted balance, and limit extensions.
(v) Approve and implement the second phase of the procurement reform to reduce the end to end procurement time.
2016 Nonsovereign Portfolio
The total committed nonsovereign portfolio grew by 17.3% to $9.2 billion at the end of 2016 because of an 11.7% increase in the loan portfolio and an 88.7% increase in guarantees.
[This information contains sensitive financial information subject to disclosure restrictions per paragraph 97, exception (viii) of ADB’s Public Communications Policy (2011).]

I. INTRODUCTION 1. The annual portfolio performance report (APPR) is a Management report that details the state of the sovereign and nonsovereign portfolios of the Asian Development Bank (ADB). It presents a snapshot of ADB’s operating performance in 2016, analyzes portfolio composition and trends, and identifies key issues. It concludes with agreed actions to improve portfolio performance. 2. The APPR is an integral building block of the ADB performance management information system and complements ADB’s annual Development Effectiveness Review3
(DEfR) by providing a more focused and in-depth analysis of the sovereign and nonsovereign portfolios. By providing an analytical framework for country portfolio assessments, the APPR is a key input in annual country portfolio reviews, regional department portfolio management, and long-term country partnership strategies. 3. The APPR provides information on and the status of the sovereign and nonsovereign portfolios at the start and end of 2016 (Figures 1 and 47). It shows the composition of and illustrates trends in the two portfolios by approvals, commitments, disbursements, sector, country, and modality. The report assesses the quality and performance of each portfolio and identifies key findings.
II. 2016 SOVEREIGN PORTFOLIO4
A. Portfolio Composition and Trends
4. Overall portfolio. The active sovereign portfolio of loans, grants, technical assistance (TA), guarantees, and equity increased by $5.2 billion or 7.2% over 2015 and totaled $78.4 billion at the end of 2016 (Figures 1 and 2). The loan and grant portfolio comprised 705 active projects and increased by 6.7% to $76.2 billion. Ordinary capital resources (OCR) financed 70.6% of the portfolio value ($55.4 billion). The Asian Development Fund (ADF) financed 24.6% ($19.3 billion) and other special funds and cofinancing financed 4.8% ($3.8 billion). The average project size increased by 2.0% to $108.1 million ($105.9 million in 2015). 5. Regional distribution. Composition by regional department has remained stable. The South Asia Department (SARD) accounted for 33.1% ($25.9 billion) of the portfolio at the end of 2016, followed by the Central and West Asia Department (CWRD) with 27.0% ($21.2 billion), the Southeast Asia Department (SERD) with 21.1% ($16.5 billion), the East Asia Department (EARD) with 15.3% ($12.0 billion), and the Pacific Department (PARD) with 3.0% ($2.4 billion) (Figure 3). CWRD, PARD, and SARD contributed to the overall portfolio growth in 2016. SARD portfolio grew by $3.2 billion (13.9%), CWRD’s portfolio grew by $1.8 billion (9.3%), and PARD’s by $0.3 billion (17.2%). Distribution has been largely unchanged since 2009. SARD had the biggest share (5-year average of 32.1%) and PARD had the smallest share (5-year average of 2.8%). 6. The CWRD portfolio comprised 153 active projects, 121 TA projects, and one guarantee. Five countries accounted for 84.0%—Pakistan ($6.6 billion), Uzbekistan ($3.9 billion), Afghanistan ($3.4 billion), Azerbaijan ($2.8 billion), and Kazakhstan ($1.1 billion). EARD had 109 active projects and 134 TA projects, with the People’s Republic of China (PRC) accounting for 93.6% ($11.3 billion), Mongolia for 6.2% ($0.7 billion), and regional projects for 0.2% ($0.02
3 ADB. 2015. Development Effectiveness Review 2014 Report. Manila. 4 Beginning 2017, as a result of the Asian Development Fund (ADF) and Ordinary Capital Resources (OCR) merger,
lending operation has been combined with the OCR balance sheet. The new classification is: (i) regular OCR, (ii) concessional OCR, and (iii) ADF grants. These will be reflected in the 2017 APPR.
2
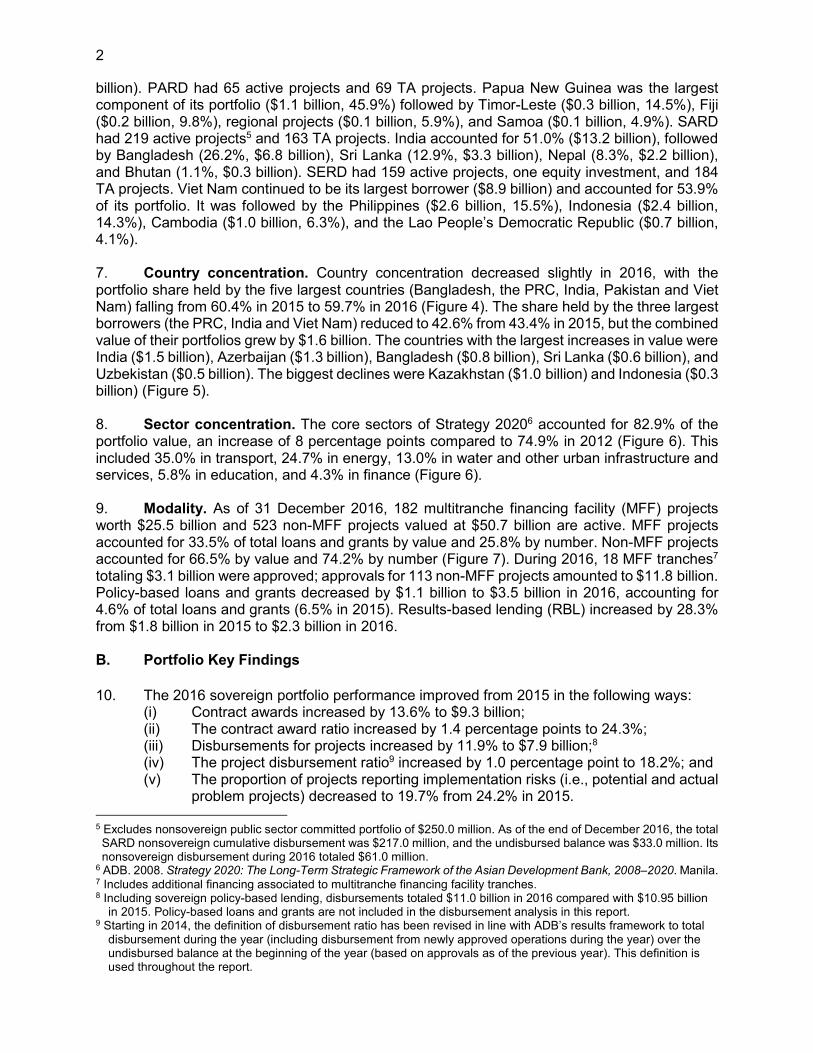
billion). PARD had 65 active projects and 69 TA projects. Papua New Guinea was the largest component of its portfolio ($1.1 billion, 45.9%) followed by Timor-Leste ($0.3 billion, 14.5%), Fiji ($0.2 billion, 9.8%), regional projects ($0.1 billion, 5.9%), and Samoa ($0.1 billion, 4.9%). SARD had 219 active projects5 and 163 TA projects. India accounted for 51.0% ($13.2 billion), followed by Bangladesh (26.2%, $6.8 billion), Sri Lanka (12.9%, $3.3 billion), Nepal (8.3%, $2.2 billion), and Bhutan (1.1%, $0.3 billion). SERD had 159 active projects, one equity investment, and 184 TA projects. Viet Nam continued to be its largest borrower ($8.9 billion) and accounted for 53.9% of its portfolio. It was followed by the Philippines ($2.6 billion, 15.5%), Indonesia ($2.4 billion, 14.3%), Cambodia ($1.0 billion, 6.3%), and the Lao People’s Democratic Republic ($0.7 billion, 4.1%). 7. Country concentration. Country concentration decreased slightly in 2016, with the portfolio share held by the five largest countries (Bangladesh, the PRC, India, Pakistan and Viet Nam) falling from 60.4% in 2015 to 59.7% in 2016 (Figure 4). The share held by the three largest borrowers (the PRC, India and Viet Nam) reduced to 42.6% from 43.4% in 2015, but the combined value of their portfolios grew by $1.6 billion. The countries with the largest increases in value were India ($1.5 billion), Azerbaijan ($1.3 billion), Bangladesh ($0.8 billion), Sri Lanka ($0.6 billion), and Uzbekistan ($0.5 billion). The biggest declines were Kazakhstan ($1.0 billion) and Indonesia ($0.3 billion) (Figure 5).
8. Sector concentration. The core sectors of Strategy 20206 accounted for 82.9% of the portfolio value, an increase of 8 percentage points compared to 74.9% in 2012 (Figure 6). This included 35.0% in transport, 24.7% in energy, 13.0% in water and other urban infrastructure and services, 5.8% in education, and 4.3% in finance (Figure 6). 9. Modality. As of 31 December 2016, 182 multitranche financing facility (MFF) projects worth $25.5 billion and 523 non-MFF projects valued at $50.7 billion are active. MFF projects accounted for 33.5% of total loans and grants by value and 25.8% by number. Non-MFF projects accounted for 66.5% by value and 74.2% by number (Figure 7). During 2016, 18 MFF tranches7 totaling $3.1 billion were approved; approvals for 113 non-MFF projects amounted to $11.8 billion. Policy-based loans and grants decreased by $1.1 billion to $3.5 billion in 2016, accounting for 4.6% of total loans and grants (6.5% in 2015). Results-based lending (RBL) increased by 28.3% from $1.8 billion in 2015 to $2.3 billion in 2016. B. Portfolio Key Findings
10. The 2016 sovereign portfolio performance improved from 2015 in the following ways: (i) Contract awards increased by 13.6% to $9.3 billion; (ii) The contract award ratio increased by 1.4 percentage points to 24.3%; (iii) Disbursements for projects increased by 11.9% to $7.9 billion;8 (iv) The project disbursement ratio9 increased by 1.0 percentage point to 18.2%; and (v) The proportion of projects reporting implementation risks (i.e., potential and actual
problem projects) decreased to 19.7% from 24.2% in 2015. 5 Excludes nonsovereign public sector committed portfolio of $250.0 million. As of the end of December 2016, the total SARD nonsovereign cumulative disbursement was $217.0 million, and the undisbursed balance was $33.0 million. Its nonsovereign disbursement during 2016 totaled $61.0 million.
6 ADB. 2008. Strategy 2020: The Long-Term Strategic Framework of the Asian Development Bank, 2008–2020. Manila. 7 Includes additional financing associated to multitranche financing facility tranches. 8 Including sovereign policy-based lending, disbursements totaled $11.0 billion in 2016 compared with $10.95 billion
in 2015. Policy-based loans and grants are not included in the disbursement analysis in this report. 9 Starting in 2014, the definition of disbursement ratio has been revised in line with ADB’s results framework to total
disbursement during the year (including disbursement from newly approved operations during the year) over the undisbursed balance at the beginning of the year (based on approvals as of the previous year). This definition is used throughout the report.

3
Figure 1: Sovereign Portfolio at a Glance
(as of 31 December 2016)
Active portfolio as of 1 January 2016
ADB’s active portfolio had a value of $73.2 billion, comprising (i) $64.9 billion in loans (no. = 644), (ii) $6.5 billion in grants (no. = 312), (iii) $1.6 billion in TA (no. = 922), and (iv) $0.2 billion in equity (no. = 1). A total of 674 active projects were funded by loans and grants.
Approvals
Approvals in 2016 totaled $15.7 billion, comprising (i) $13.9 billion in loans, (ii) $1.1 billion in grants, (iii) $0.3 billion in TA, (iv) $0.5 billion in guarantee.
Closures
Closures totaled $9.4 billion, comprising $9.1 billion in loans and grants and $0.3 billion in TA.
Cancellations
Cancellations totaled $1.1 billion, of which 93.8% was loan and grant cancellations.
Entry ratio
The net entry ratio was 33.4%, lower than 49.3% in 2015, mainly due to a 43.8% ($2.8 billion) increase in closures and a 41.2% ($0.3 billion) increase in cancellations, while approvals increased by 9.2% ($1.3 billion).
Active portfolio as of 31 December 2016
The active portfolio grew by 7.2% to $78.4 billion in 2016, comprising (i) $69.3 billion in loans (no. = 696), (ii) $6.9 billion in grants (no. = 331), (iii) $1.5 billion in TA (no. = 855), (iv) $0.2 billion in equity (no. = 1), and (v) $0.5 billion in guarantee (no. = 1) A total of 705 active projects were funded by loans and grants.
( ) = negative, ADB = Asian Development Bank, no. = number, TA = technical assistance. Source: Asian Development Bank data
$64.9
$6.5 $1.6$0.2
0.0
20.0
40.0
60.0
80.0
$ b
illio
n1 January 2016($73.2 billion)
Loans Grants TA Equity
15.7
(9.4)
(1.1)
5.2
-15.0
-10.0
-5.0
0.0
5.0
10.0
15.0
20.0
$ b
illio
n
Net Sovereign Portfolio Change ($5.2 billion)
Approvals Closures
Cancellations Net change
69.3
6.9 1.5
0.2
0.5
0.0
20.0
40.0
60.0
80.0
$ b
illio
n
31 December 2016($78.4 billion)
Loans Grants TA Equity Guarantee
CH
AN
GE
S
TO
T
HE
S
OV
ER
EIG
N
PO
RT
FO
LIO
IN
2
01
6

4
Figure 2: ADB Overall Portfolio
ADB = Asian Development Bank. Source: Asian Development Bank data.
Figure 3: Portfolio by Region
CWRD = Central and West Asia Department, EARD = East Asia Department, Non-Ops = non-operations, PARD = Pacific Department, SARD = South Asia Department, SERD = Southeast Asia Department. Source: Asian Development Bank data.
Figure 4: Five Largest Portfolios by Country
Source: Asian Development Bank data.
Figure 5: Portfolios with Largest Changes
( ) = negative. Source: Asian Development Bank data.
Figure 6: Portfolio by Sector
EDU = education, ENE = energy, FIN = finance, TRA = transport, WUS = water and other urban infrastructure and services. Source: Asian Development Bank data.
Figure 7: Multitranche Financing Facility and Non-Multitranche Financing Facility
MFF = multitranche financing facility. Source: Asian Development Bank data.
61.3 64.1 67.8
73.2 78.4
0.0
10.0
20.0
30.0
40.0
50.0
60.0
70.0
80.0
90.0
2012 2013 2014 2015 2016
$ b
illio
n
CWRD$21.2billion27%
EARD$12.0billion15%PARD
$2.4billion 3%
SARD$25.9billion33%
SERD$16.5billion21%
Non-Ops$0.4
billion0.5%
40%
8%
9%
11%14%
17%
60%
Others Pakistan
Bangladesh Viet Nam
People's Republic of China India
1,523 1,314
800 608 512
(1,016)(327)
-1,500
-1,000
-500
0
500
1,000
1,500
2,000
India
Azerb
aija
n
Ba
ngla
desh
Sri L
anka
Uzb
eki
stan
Ka
zakh
sta
n
Indonesi
a
Ch
an
ge
s in
Po
rtfo
lio V
alu
e($
mill
ion
)
3% 6%
21%25%
4%4%
36%35%
11%13%
25%17%
0%
20%
40%
60%
80%
100%
2012 2016
Sh
are
of A
ctive
Po
rtfo
lioV
alu
e o
n C
ut-
off
Da
te
EDU ENE FIN TRA WUS Others
75% 83%
23.7 47.725.5 50.7
175
499
182
523
0
100
200
300
400
500
600
0.0
10.0
20.0
30.0
40.0
50.0
60.0
MFF NON-MFF
Nu
mb
er o
f Pro
jects
Po
rtfo
lio V
alu
e
($ b
illio
n)
2015 Value 2016 Value2015 Number 2016 Number

5
Figure 8: Contract Awards, Projects
Source: Asian Development Bank Data.
Figure 9: Disbursements, Projects
Source: Asian Development Bank Data.
11. The sovereign portfolio performance indicators for each country are in Appendix 1. The major findings of the sovereign loan and grant portfolio performance in 2016 are discussed below.
1. Contract Award and Disbursement Performance Overview
12. In 2016, both contract awards and disbursements achieved record highs. Contract awards for project loans and grants (hereafter, projects) totaled $9.3 billion,10 13.6% higher than the $8.1 billion in 2015 (Figure 8). Disbursements for projects totaled $7.9 billion in 2016,11 an increase of 11.9% from $7.0 billion in 2015 (Figure 9).
13. Consistent with the absolute results, the contract awards ratio increased by 1.4 percentage points to 24.3% from 22.9% in 2015 (Figure 10) and the disbursement ratio increased by 1 percentage point to 18.2% from 17.2% in 2015 (Figure 11).
14. For the three major borrowers—India, the PRC, and Viet Nam, which together account for 44.4% of the active project portfolio—the contract award ratio declined from 25.4% in 2015 to 22.2% in 2016 (lowest since 2014) and the disbursement ratio improved to 17.5% in 2016 from 15.8% in 2015. The PRC’s contract award ratio declined from 21.3% to 19.1% and India’s declined from 34.3% to 30.1%. The decline in Viet Nam’s contract award ratio from 20.0% in 2015 to 15.8% in 2016 was mainly due to low contract awards on projects in the transport sector with a contract award ratio of only 8.1%. India’s disbursement ratio improved from 16.5% to 18.2%, the PRC’s improved from 18.0% to 19.6%, and Viet Nam’s slightly improved from 12.1% to 13.9% (Figures 10 and 11). 15. Among the top 10 project portfolios, Bangladesh (30.8%), Nepal (30.5%), and India (30.1%) had the highest contract award ratio while the Philippines (16.2%) and Viet Nam (15.8%) had the lowest. An MFF tranche in the energy sector12 approved in 2015 was also not yet effective. By amount, Uzbekistan increased by $393.0 million and Afghanistan rose by $366.3 million.
10 Including $422.1 million from results-based lending (RBL) projects, a 162.6% increase from $160.8 million in 2015. 11 Including $442.1 million from RBL projects, an 84.5% increase from $239.6 million in 2015. 12 ADB. 2015. Report and Recommendation of the President to the Board of Directors: Multitranche Financing Facility
to Viet Nam for the Power Transmission Investment Program. Manila. (Loan 3374-VIE).
7.5
6.4
8.2 8.1
9.3
0.0
1.0
2.0
3.0
4.0
5.0
6.0
7.0
8.0
9.0
10.0
2012 2013 2014 2015 2016
$ b
illio
n
6.2 6.6
7.3 7.0
7.9
0.0
2.0
4.0
6.0
8.0
2012 2013 2014 2015 2016
$ b
illio
n

6
Bangladesh had the highest disbursement ratio (23.2%), followed by Sri Lanka (21.6%), while the Philippines (14.2%), Viet Nam (13.9%), Afghanistan (11.2%) and Uzbekistan (10.3%) had the lowest. By amount, the Philippines had the largest decline, $460.3 million, partly due to low disbursement in a special assistance project13 and closing of another special assistance project in the public sector management sector, which had a large disbursement in 2015. Uzbekistan’s disbursement ratio was low because of low disbursements in the energy and transport sectors. The PRC, the Philippines, and Viet Nam had lower contract award ratios than the ADB average, while Afghanistan, Nepal, the Philippines, Uzbekistan, and Viet Nam had lower disbursement ratio than the ADB average.
16. MFF projects performed better than non-MFF projects in both contract award and disbursement ratios. The MFF contract award ratio was 27.8% (26.8% in 2015), higher than 22.9% for non-MFF and ADB’s overall average of 24.3%. Armenia had the highest contract award ratio (53.1% in 2016 against 5.9% in 2015). The finance sector had the highest MFF contract award ratio at 61.7% (24.9% in 2015) as a result of three loans in CWRD countries (two in Kazakhstan and one in Uzbekistan). The disbursement ratio for MFF projects was 20.3% (17.8% in 2015), higher than 17.0% for non-MFF and ADB’s overall average of 18.2%. This was the highest disbursement ratio since 2006.
17. The contract award ratio for the transport sector, which accounts for 37.4% of the active project portfolio, declined to 27.5% in 2016 from 31.0% in 2015, while the disbursement ratio increased from 17.0% to 19.8%. The energy sector, which accounts for 25.8% of the active project portfolio, achieved higher contract award ratio and disbursement ratio than in 2015. Its contract award ratio of 23.3% also had the highest increase by percentage points (8.1) among all sectors compared to 2015 (15.2%), while disbursement ratio improved by 4 percentage points from 11.5% in 2015 to 15.3% in 2016. The agriculture sector had its highest contract awards ratio (23.6%) since 2004 partly due to the good performance in India (61.4%) and Viet Nam (42.0%). Its disbursement ratio of 16.9% was also the highest since 2010. The water and other urban infrastructure and services sector slightly improved in both contract awards ratio (20.2% to 21.1%) and disbursement ratio (13.4% to 13.9%) from 2015. Compared with the water and other urban infrastructure and services sector’s disbursement ratio, the PRC, Pakistan, and Viet Nam were below its average. By amount, the energy sector had the highest increase of contract awards from $1.4 billion in 2015 to $2.4 billion in 2016, and disbursements from $1.2 billion to $1.8 billion.
18. ADF-funded projects performed better than OCR-funded projects on these two ratios. The contract award ratio for ADF-funded projects was 28.4%, compared with 22.7% for OCR-funded projects. The ADF-funded disbursement ratio was 19.8%, against 17.6% for OCR-funded projects. Compared with 2015, the OCR-funded projects had a higher performance in disbursement ratio but were slightly lower in contract award ratio. ADF-funded projects improved their contract award ratio by 6.0 percentage points and disbursement ratio by 2.7 percentage points.
13 ADB. 2013. Report and Recommendation of the President to the Board of Directors: KALAHI-CIDSS National
Community-Driven Development Project. Manila. (Loan 3100-PHI).

7
Figure 10: Contract Award Ratio, Projects
ADB = Asian Development Bank, PRC = People’s Republic of China, IND = India, VIE = Viet Nam. Source: Asian Development Bank data.
Figure 11: Disbursement Ratio, Projects
ADB = Asian Development Bank, PRC = People’s Republic of China, IND = India, VIE = Viet Nam. Source: Asian Development Bank data.
19. The cumulative portfolio contract award S-curve14 for 2016 performed the best in the last five years. Compared to the 2015 S-curve, 2016 was higher in all ages except in age 1 which was lower by 1.6 percentage points implying readiness issue with projects approved in 2015 (Figure 12). By the seventh year of implementation after approval, ADB contract awards improved to 93.2% from 86.0% in 2015. However, this is lower than the 2006–2016 average of 97.1%. 20. A comparison of the actual 2016 S-curve with the average S-curve in a sample of 63 projects approved in 2016 shows a 15.0% difference by age 2 and 8.8% by age 5, a significant improvement from 2015 (32% at age 2 and 18% at age 5). This indicates increased attention had been given by regional departments to project readiness and implementation.
14 The project contract award S-curve shows the project contract award profile over its life and is a useful graphical
presentation of project performance.
22%
20%
26% 25%
22%
27%
20%22%
21%
26%25%
20%
24% 23% 24%
0.0%
5.0%
10.0%
15.0%
20.0%
25.0%
30.0%
2012 2013 2014 2015 2016
3 largest (IND, PRC, VIE)
Others
ADB
17%
18%19%
16%17.5%
18%
18% 18%
18% 18.8%
18% 18%18%
17%
18.2%
0%
5%
10%
15%
20%
25%
30%
2012 2013 2014 2015 2016
3 largest (IND, PRC, VIE)OthersADB

8
Figure 12: Contract Award S-curve
Source: Asian Development Bank data.
21. The cumulative portfolio disbursement (S-curve) for 2016 improved over 2015 actual S-curve. Except for age 0, which was 1.4% lower, disbursement for all age groups was higher in 2016 than in 2015. A comparison with the average S-curve15 in a sample of 63 projects approved in 2016 shows a 12.0 percentage points difference by age 2 and 29.5 percentage points by age 5. By the end of the sixth year of implementation after approval, ADB project disbursement was 72.1%, compared with 67.2% in 2015, and 82.2% during 2006–2016.
Figure 13: Disbursement S-curve
Source: Asian Development Bank data.
15 The project disbursement S-curve shows the project disbursement profile over its life and is a useful graphical
presentation of project performance.
0%
20%
40%
60%
80%
100%
120%
0%
20%
40%
60%
80%
100%
120%
0 1 2 3 4 5 6 7 8 9 10Age from approval
Average 2006 to 2016 2016 S-curve (actual)2015 S-curve (actual) 2014 S-curve (actual)2013 S-curve (actual) 2012 S-curve (actual)Sample of 2016 63 Approved Projects
15%
9%
0%
20%
40%
60%
80%
100%
120%
0.0%
20.0%
40.0%
60.0%
80.0%
100.0%
120.0%
0 1 2 3 4 5 6 7 8 9 10
Age from approvalAverage 2006 to 2016 2016 S-curve (actual)2015 S-curve (actual) 2014 S-curve (actual)2013 S-curve (actual) 2012 S-curve (actual)Sample of 2016 63 Approved Projects
29%
12%

9
2. Analysis of Uncontracted Balance and Contract Award 22. The uncontracted balance as a percentage of the total value to be awarded (hereafter, uncontracted percentage) was 42.8%, the lowest since 2010, and below the 5-year average of 44.1% (Figure 14). The uncontracted balance as of 31 December increased by $1.3 billion (4.7%) to $28.9 billion16 ($27.6 billion in 2015) largely because of $1.5 billion higher approvals. SARD had the highest contract award ratio at 30.2% and the lowest uncontracted percentage at 35.2% (Figure 15).
23. India, the PRC, and Viet Nam accounted for 41.8% ($12.1 billion) of the total uncontracted balance in 2016, lower compared with 42.6% in 2015 (Figure 16). Among the top 10 countries with the largest project portfolio, the Philippines (56.2%), Pakistan (51.4%), the PRC (50.3%), Uzbekistan (44.0%), and Afghanistan (42.9%) had a higher uncontracted percentage than the ADB average of 42.8%. Countries with the largest increases in uncontracted balance were the PRC ($469.7 million), the Philippines ($331.3 million), and Afghanistan ($263.5 million). Some 56.4% of the PRC's uncontracted amount was from the agriculture and transport sectors, 70.9% of the Philippines' was from education and energy, and 87.0% of Afghanistan's from transport and energy.
24. Among the largest sectors, agriculture, education, water and other urban infrastructure and services, finance, and energy all had higher uncontracted percentages than the ADB average (Figure 17). The uncontracted balance for the energy sector increased to a record $7.9 billion, up from $7.7 billion in 2015, $6.2 billion in 2014, $6.0 billion in 2013, $5.3 billion in 2012, $4.8 billion in 2011, and $4.13 billion in 2010, even though it had lower approvals in 2016.
Figure 14: Contract Award Ratio and Uncontracted Percentage, Projects,
2012–2016
Uncontracted % by 5-year Average
Contract Award Ratio by 5-year Average
Source: Asian Development Bank data.
Figure 15: Contract Award Ratio and Uncontracted Percentage by Department,
Projects, 2016
ADB = Asian Development, CWRD = Central and West Asia Department, EARD = East Asia Department, PARD = Pacific Department, SARD = South Asia Department, SERD = Southeast Asia Department. Source: Asian Development Bank data.
16 Including $1.6 billion from RBL.
25%20%
24% 23% 24%
43%46% 44% 44% 43%
0%
20%
40%
60%
80%
100%
2012 2013 2014 2015 2016
Contract Award Ratio Uncontracted %
23%
27%19% 23% 30%
17%24%
44%51%
47%
35%
46% 43%
0%
20%
40%
60%
80%
100%
CWRD EARD PARD SARD SERD ADB
Contract Award Ratio Uncontracted %
44%
%

10
Figure 16: Uncontracted Balance and Percentage by Country, Projects, 2015–2016
2016 ADB Uncontracted % BAN = Bangladesh, PRC = People’s Republic of China, IND = India, PAK = Pakistan, UZB = Uzbekistan. Source: Asian Development Bank data.
Figure 17: Uncontracted Balance and Percentage by Sector, Projects, 2015–2016
2016 ADB Uncontracted %
ANR = agriculture, natural resources, and rural development; EDU = education; ENE = energy; FIN = finance; TRA = transport, WUS = water and other urban infrastructure and services. Source: Asian Development Bank data.
25. The contract awards’ age analysis shows that in 2016 most contract awards came from the age 2 projects (27.7% or $2.6 billion), and age 3 projects (22.6% or $2.1 billion). The largest percentage increase of 65% was at age 3 and 52.5% at age 0. Contract awards in ages 1, 4 and 5 projects decreased compared to 2015 (Figure 18). The uncontracted percentage of age 4 projects of 37% was highest in the last five years (Figure 19). The decline in age 4 and 5 contract awards implies that projects in these age groups need closer implementation monitoring.
5.0 3.6 2.9 3.1 2.35.5 3.8 2.8 2.8 2.3
46%
34%
55%
40%44%
50%
32%
51%
37%39%
0%
10%
20%
30%
40%
50%
60%
0.0
1.0
2.0
3.0
4.0
5.0
6.0
PRC IND PAK VIE BAN
$ b
illio
n
2015 Uncontracted Balance 2016 Uncontracted Balance
2015 Uncontracted % 2016 Uncontracted %
8.2 7.8 4.1 3.2 1.8 1.1 8.6 7.9 4.2 3.1 2.1 1.2
33%
49% 50% 50% 52% 52%
34%
45% 47% 48%51%
48%
0%
10%
20%
30%
40%
50%
60%
0.0
2.0
4.0
6.0
8.0
10.0
TRA ENE WUS ANR EDU FIN
$ b
illio
n
2015 Uncontracted Balance 2016 Uncontracted Balance
2015 Uncontracted % 2016 Uncontracted %
43%
43%

11
Figure 18: Annual Contract Awards by Age, Projects, 2012–2016
Source: Asian Development Bank data.
Figure 19: Uncontracted Percentage by Age, Projects, 2012–2016
ADB = Asian Development Bank. Source: Asian Development Bank data.
3. Analysis of Contracting Time for Contracts
26. In 2016, the average end-to-end contracting period from receipt of bidding documents to the signing of contracts for $10 million and above was 373 days, 8.1% shorter than in 2015 (Figure 20). ADB took 136 days on average (144 days in 2015) and the executing agencies took 237 days (262 days in 2015). The one-stage-one-envelope procurement method for goods and plant or turnkey or design and build took more time than the one-stage-two-envelope and two-stage methods. The two-stage method for works required the most time (Figure 21).
399
2,087
1,959
1,266
994 902
540 608
2,085
2,564
2,089
664 540
707
0
500
1,000
1,500
2,000
2,500
3,000
3,500
0 1 2 3 4 5 =>6
$ m
illio
n
2012 2013 2014 2015 2016
96%
74%
56%
44%
17%10%
7%
44%
94%
73%
42%37% 37%
14%7%
43%
0%
20%
40%
60%
80%
100%
0 1 2 3 4 5 =>6 ADB
2012 2013 2014 2015 2016
12
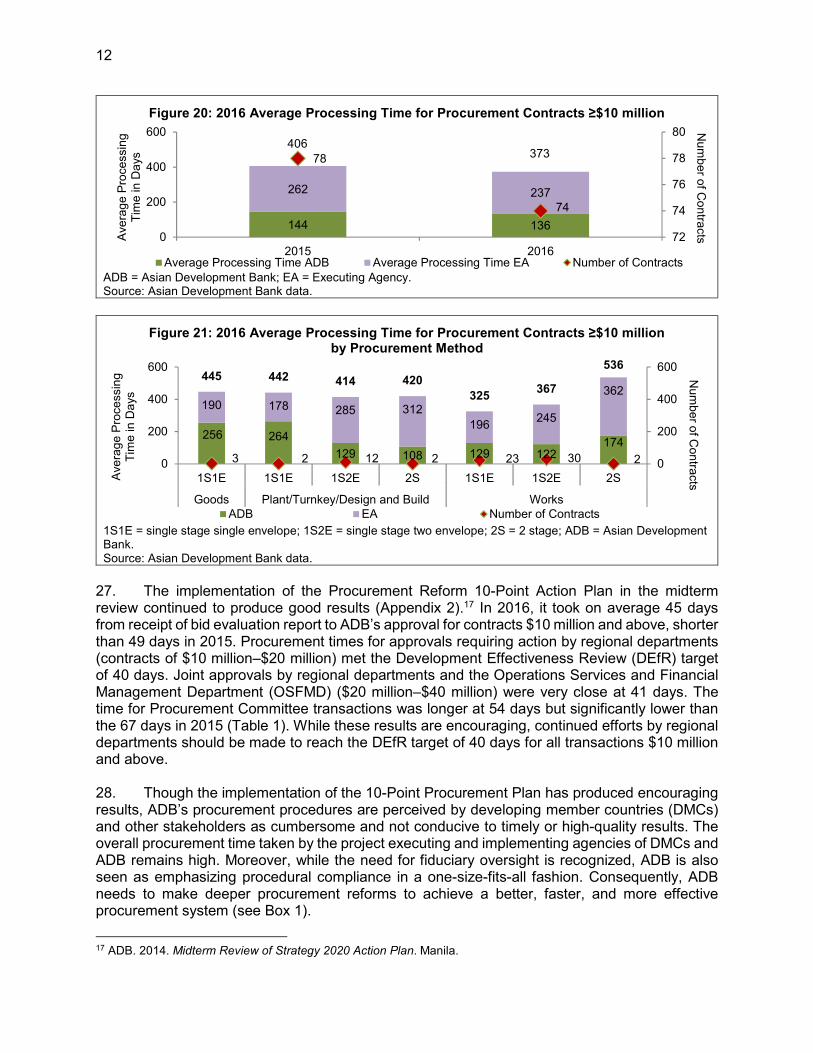
Figure 20: 2016 Average Processing Time for Procurement Contracts ≥$10 million
ADB = Asian Development Bank; EA = Executing Agency. Source: Asian Development Bank data.
Figure 21: 2016 Average Processing Time for Procurement Contracts ≥$10 million by Procurement Method
1S1E = single stage single envelope; 1S2E = single stage two envelope; 2S = 2 stage; ADB = Asian Development Bank. Source: Asian Development Bank data.
27. The implementation of the Procurement Reform 10-Point Action Plan in the midterm review continued to produce good results (Appendix 2).17 In 2016, it took on average 45 days from receipt of bid evaluation report to ADB’s approval for contracts $10 million and above, shorter than 49 days in 2015. Procurement times for approvals requiring action by regional departments (contracts of $10 million–$20 million) met the Development Effectiveness Review (DEfR) target of 40 days. Joint approvals by regional departments and the Operations Services and Financial Management Department (OSFMD) ($20 million–$40 million) were very close at 41 days. The time for Procurement Committee transactions was longer at 54 days but significantly lower than the 67 days in 2015 (Table 1). While these results are encouraging, continued efforts by regional departments should be made to reach the DEfR target of 40 days for all transactions $10 million and above. 28. Though the implementation of the 10-Point Procurement Plan has produced encouraging results, ADB’s procurement procedures are perceived by developing member countries (DMCs) and other stakeholders as cumbersome and not conducive to timely or high-quality results. The overall procurement time taken by the project executing and implementing agencies of DMCs and ADB remains high. Moreover, while the need for fiduciary oversight is recognized, ADB is also seen as emphasizing procedural compliance in a one-size-fits-all fashion. Consequently, ADB needs to make deeper procurement reforms to achieve a better, faster, and more effective procurement system (see Box 1).
17 ADB. 2014. Midterm Review of Strategy 2020 Action Plan. Manila.
144 136
262 237
78
74
72
74
76
78
80
0
200
400
600
2015 2016
Nu
mb
er o
f Co
ntra
ctsA
vera
ge
Pro
ce
ssin
g
Tim
e in
Da
ys
Average Processing Time ADB Average Processing Time EA Number of Contracts
406373
256 264
129 108 129 122174
190 178 285 312
196245
362
3 2 12 2 23 30 2
445 442 414 420
325367
536
0
200
400
600
0
200
400
600
1S1E 1S1E 1S2E 2S 1S1E 1S2E 2S
Goods Plant/Turnkey/Design and Build Works
Nu
mb
er o
f Co
ntra
ctsA
vera
ge
Pro
ce
ssin
g
Tim
e in
Da
ys
ADB EA Number of Contracts

13
Table 1: 2016 Procurement Time (≥$10 million)
Year No. of
Submissions Receipt of BER to
ADB approvala
2013 212 57 days
2014 219 58 days
2015 184 49 days 2016 197 45 days
Item No. of Submissions Receipt of BER to
ADB approval
$10–$20 million (RD) 54 40 $20–$40 million (RD+OSFMD) 79 41 $40 million and above (PC) 64 54 Average time 45 ADB = Asian Development Bank, BER = bid evaluation report, no. = number, OSFMD = Operations Services and Financial Management Department, PC = Procurement Committee, RD = regional department. a Refers to the average number of days from the date of the first receipt of BER to ADB’s approval of BER. It includes the time spent on any clarification and revision needed to finalize evaluation of BER. Source: Asian Development Bank data.
Box 1: Proposed Procurement Reforms
ADB has now finalized its second-phase of procurement reforms, building on the 10-Point Procurement Plan with inputs from a range of stakeholders. The reforms aim to (i) reduce overall procurement time, (ii) improve the quality of procurement outcomes, and (iii) strengthen the procurement delivery system. The key features of the proposed reforms are:
• Procurement principles expanded to include Quality and Value for Money, in addition to Economy, Efficiency, Fairness, and Transparency.
• A less prescriptive and more principles-based procurement policy, to meet emerging needs of developing member countries (DMCs), as well as market conditions.
• Fitness-of-purpose as the operational model in designing procurement arrangements. • Risk-based procurement encouraged, to free up time for ADB to help on more complex
projects. • Support for procurement of high-level technologies, particularly to help DMCs address
climate change and meet growth aspirations. • Alternative procurement arrangements to reduce transaction costs for DMCs as well
as for ADB’s co-financiers.
ADB will also overhaul its procurement delivery model, by decentralizing more to its operational departments and posting procurement specialists in all resident missions and sector divisions with a portfolio of more than $1 billion.
The second phase of procurement reform was approved by the Board on 12 April 2017 and will be implemented from 1 July 2017 in a phased manner. The reforms are expected to improve ADB’s project delivery and outcomes.
Source: ADB Operations Services and Financial Management Department.

14
4. Analysis of Undisbursed Balances and Disbursement 29. The total undisbursed balance of active project loans and grants18 as of 31 December 2016 was $45.8 billion,19 a 5.8% increase over $43.3 billion at the end of 2015. ADB’s undisbursed balance as a percentage of total active projects (hereafter, undisbursed percentage) improved to 63.0% from 64.0% in 2015. In 2016, PARD (67.7%), CWRD (65.6%) and EARD (64.3%) had undisbursed percentages that were higher than the ADB average (Figure 22). Of the top 10 countries with the largest project portfolio, Pakistan (72.3%), Afghanistan (70.6%) and Nepal (67.9%) had the largest undisbursed percentage, while India ($7.8 billion), the PRC ($7.1 billion), and Viet Nam ($4.7 billion) continued to have the largest undisbursed balance (Figure 23) due to their portfolio size. The Philippines had the largest increase ($467.6 million) in undisbursed balance, from $0.9 billion in 2015 to $1.3 billion in 2016, largely because its age 0 projects had 43.4% undisbursed balance and age 4 projects had 30.2%.
Figure 22: Disbursement Ratio and Undisbursed Percentage by Department, Projects, 2016
ADB = Asian Development Bank, CWRD = Central and West Asia Department, EARD = East Asia Department, PARD = Pacific Department, SARD = South Asia Department, SERD = Southeast Asia Department. Source: Asian Development Bank data.
Figure 23: Undisbursed Balance and Percentage by Country, Projects, 2015 and 2016
2016 ADB Undisbursed % BAN = Bangladesh, PRC = People’s Republic of China, IND = India, PAK = Pakistan, VIE = Viet Nam Source: Asian Development Bank data.
18 Undisbursed balance is the amount available for disbursement at the end of the year for active project loans and
grants. 19 Including $1.5 billion from RBL.
18% 19% 21% 19% 16% 18%
66% 64% 68%62% 60% 63%
0%
20%
40%
60%
80%
100%
CWRD EARD PARD SARD SERD ADB
Disbursement Ratio Undisbursed %
7.6 6.7 5.2 4.5 3.6
7.8 7.1 4.7 4.5 3.8
67%
60%
60%75%
63%
63%
63%
55%
72%
60%
0%
20%
40%
60%
80%
100%
0.0
2.0
4.0
6.0
8.0
10.0
IND PRC VIE PAK BAN
$ b
illio
n
2015 Undisbursed Balance 2016 Undisbursed Balance
2015 Undisbursed % 2016 Undisbursed %
63%

15
30. By sector, transport and energy continued to have the largest undisbursed balance in 2016. At $29.1 billion, both accounted for 63.6% of the overall undisbursed balance. Energy showed the largest increase in undisbursed balance among the sectors, increasing from $12.0 billion to $12.6 billion in 2016. Finance had the second largest increase from $752.1 million to $1.2 billion due to new approvals in 2016 (Figure 24). The highest undisbursed percentage was in industry and trade projects, increasing from 73.4% in 2015 to 91.2% in 2016. This was mainly due to MFF tranche 1 projects in India and the PRC totaling $380.0 million approved in 2016 but not yet effective. The education sector had its lowest undisbursed percentage (54.8%) since 2006. Among the core sectors, the highest undisbursed percentages were in energy, in water and other urban infrastructure and services, and in agriculture. These also had undisbursed percentages that were higher than the ADB average.
Figure 24: Undisbursed Balance and Percentage by Sector, Projects, 2015 and 2016
2016 ADB Undisbursed %
ANR = agriculture, natural resources, and rural development; EDU = education; ENE = energy; FIN = finance; TRA = transport, WUS = water and other urban infrastructure and services. Source: Asian Development Bank data.
31. The disbursement age analysis of 2016 shows that the age 3 projects have the largest disbursement at $1,451.3 million (18.4% share), closely followed by $1,250.9 million in age 2 projects. Age 4 projects had the largest decrease in disbursement against 2015 at 21.1% ($282.5 million) (Figure 25), reflecting possible implementation problems (Figure 26). A closer look into age 4 projects by sector, indicated that 2016 disbursement in the transport sector was lower by $203.3 million (30.1%) compared with 2015, and water and other urban infrastructure and services by $122.6 million (66.2%). These projects with high undisbursed balances have closing dates in 2018 and will require actions to speed up disbursements or extend their closing dates. Disbursements in age 6 and above projects were highest in the last five years signaling more attention was given to disburse older projects in 2016.
4.2 2.0
12.0
0.8
16.3
6.3 4.5 2.4
12.6
1.2
16.5
6.6
63% 55%
71%
37%
61%
71%65%
55%
67%
46%
61% 68%
0%
20%
40%
60%
80%
100%
-
2.0
4.0
6.0
8.0
10.0
12.0
14.0
16.0
18.0
ANR EDU ENE FIN TRA WUS
$ b
illio
n
2015 Undisbursed Balance 2016 Undisbursed Balance
2015 Undisbursed % 2016 Undisbursed %
63%

16
Figure 25: Annual Disbursement by Age from Approvals, Projects 2012–2016
Source: Asian Development Bank data.
Figure 26: Undisbursed Percentage by Age from Approvals, Projects 2012–2016
ADB = Asian Development Bank. Source: Asian Development Bank data.
5. Portfolio Structure
32. ADB’s overall portfolio grew $5.2 billion, or 7.2%, in 2016 to $78.4 billion. The average age of loans and grants from approval increased from 3.3 to 3.4 years despite higher approvals of $1.6 billion in 2016 (Figure 27). This indicates that projects are taking longer to close. A look at the active projects as of the end of 2016, showed that 79 loans and 29 grants were already past their closing date (Table 2) and had a total uncontracted balance of $154.9 million. Eighty-nine loans and grants had less than $1 million (total of $13.1 million) and 19 had a total uncontracted balance of $141.8 million. These loans and grants should be extended or closed on priority. 33. Some 20.5% of the total project portfolio ($14.9 billion) and 21.9% in number (217) were 6 years old and above (Figures 28 and 29). Compared with 2015, the number of six-year-old and above projects increased by 24.0%, highlighting the need to expedite the implementation and completion of these projects.
352
676
1,424
1,044
1,336
985
1,229
250
988
1,251
1,451
1,054 1,132
1,757
0
500
1,000
1,500
2,000
0 1 2 3 4 5 =>6
$ m
illio
n
2012 2013 2014 2015 2016
97% 91%
78%74%
48%
40%
21%
64%
98%87%
77%66% 63%
41%
21%
63%
0%
10%
20%
30%
40%
50%
60%
70%
80%
90%
100%
0 1 2 3 4 5 =>6 ADB
2012 2013 2014 2015 2016

17
Figure 27: Project Portfolio by Age, 2012–2016
Source: Asian Development Bank data.
Table 2: Loan and Grants Past Closing Date
Loans Grants
Number Net Amount ($ million) Number
Net Amount ($ million)
CWRD 13 1,224 4 75
EARD 3 280 2 7
PARD 6 122 6 65
SARD 40 3,190 6 17
SERD 17 1,922 11 121
TOTAL 79 6,738 29 285 CWRD = Central and West Asia Department, EARD = East Asia Department, PARD = Pacific
Department, SARD = South Asia Department, SERD = Southeast Asia Department.
Figure 28: Project Portfolio by Value, Age from Approval, 2016
Bn = billion Source: Asian Development Bank data.
Figure 29: Project Portfolio by Number, Age from Approval, 2016
Source: Asian Development Bank data.
34. The entry of effective loans and grants by number within the same year of approval into the portfolio was higher at 29.7% (47 of 158) in 2016 compared with 23.0% (31 of 135) in 2015. However, the entry of effective loans and grants by amount within the same year of approval into the portfolio was lower in 2016 at 20.8% compared with 21.5% in 2015. In 2016, $2.5 billion of $11.9 billion approved was made effective compared with $2.2 billion of $10.3 billion in 2015 (Figure 30).
2.95 3.02 3.12 3.28 3.35
0.0
1.0
2.0
3.0
4.0
2012 2013 2014 2015 2016
Ye
ars
Age from Approval
11.9
10.0 8.8
10.8
8.3 8.0
6.2
3.9 4.8
16%14%12%15%11%11% 9% 5% 7%0%
20%
40%
60%
80%
100%
120%
0.0
5.0
10.0
15.0
Cu
mu
lative
Pe
rce
nta
ge
$ b
illio
n
Age
Net Amount $bnPercent by Age from ApprovalCumulative %
158 132 135 129 129
93 98
54 65
16%13%14%13%13%9%10%5% 7%0%
20%
40%
60%
80%
100%
120%
0
40
80
120
160
0 1 2 3 4 5 6 7
Mo
re
Cu
mu
lative
Pe
rce
nta
ge
Nu
mb
er
Age
NumberPercent by Age from ApprovalCumulative %

18
35. Approvals during the first three quarters of 2016 by number were also higher at 51.3% compared to 40.7% in 2015. By amount, the approvals during the first to third quarter (Q1–Q3) of 2016 were 52.3% ($6.2 billion) compared with 42.5% ($4.4 billion) in 2015 (Figure 31).
36. Despite the increase in Q1–Q3 approvals in 2016 by amount, the entry of effective loans and grants was 0.7 percentage points lower than 2015. This is due to 42 loans and grants amounting to $4.3 billion, 69.3% of Q1–Q3 approvals of $6.2 billion that did not become effective during the year. This was higher than 59.1% ($2.6 billion) in 2015. However, the new initiative to focus on commitments than approvals should result in higher number of projects becoming effective within the same year of approval. This will contribute to higher contract awards and disbursements.
Figure 30: Effectiveness within the Same Year of Approval
Source: Asian Development Bank data.
Figure 31: Approval of Projects by Amount
Q = quarter. Source: Asian Development Bank data.
6. Termination and Cancellation
37. In 2016, $1,341.2 million of loans and grants were terminated and canceled (Figure 32). This was a significant increase from the $757.3 million in 2015. Full termination was made on a loan ($300 million) in India prior to signing as the borrower decided not to avail themselves of the loan due to an increase in the sovereign guarantee fee charged by the government. An additional financing to a grant ($0.4 million) was also fully terminated as the funding was not in compliance with the cofinancier’s financial policies. One project in the Solomon Islands ($18.0 million) was canceled prior to effectivity due to the lapse of the terminal date for loan effectivity. Seventy-five loans and 41 grants amounting to $1,022.8 million were partially canceled. The largest cancellations were in Pakistan ($268.7 million) and accounted for 26.3% of the 2016 total, followed by India ($267.0 million, 26.1%), and Viet Nam ($261.9 million, 25.6%). Cancellations in Pakistan were due to (i) the substitution of the loan amount with a grant amount from the Department for International Development of the United Kingdom (DFID), and (ii) insufficient MFF utilization period for contract award and implementation of packages. The latter will be financed under the new MFF. Cancellation in India and Viet Nam were mainly due to an unutilized amount at closing.
9.2
11.7
9.4
10.3 11.9
0.9 1.52.2 2.2 2.5
10%
13%
24%
21% 21%
0%
5%
10%
15%
20%
25%
0.0
2.0
4.0
6.0
8.0
10.0
12.0
14.0
2012 2013 2014 2015 2016
Pe
rce
nta
ge
Ap
pro
ved
Va
lue
(Effe
ctive
Ye
ar=
0)
$ b
illio
n
Approval YearTotal Value in $billion Effective year=0
Effective year=0 (%)
2%
14%
26%
57%
10%
18%24%
48%
0%
10%
20%
30%
40%
50%
60%
0
1,000
2,000
3,000
4,000
5,000
6,000
7,000
Q1 Q2 Q3 Q4
$ m
illio
n
2015 Amount 2016 Amount 2015 % 2016 %

19
Figure 32: Total Termination and Cancellation, 2012–2016
Note: 2016 termination (not signed) was from loan 3307-IND (Accelerating Infrastructure Investment Facility in India–Tranche 2). Source: Asian Development Bank data.
7. Net Resource Transfer
38. ADB’s net resource transfer is directly affected by disbursement performance and loan service payments received. The 2016 net resource transfer for project loans was $3.2 billion, which was 3.9% higher than in 2015 ($3.0 billion) (Figure 33). This was due to an 11.3% increase in disbursements and a 17.9% increase in payments compared to the 2015 levels. India had the highest net resource transfer of $742.7 million, followed by $482.5 million for Viet Nam and $468.3 million for the Pakistan (Figure 34). As in 2015, Indonesia had the largest negative net resource transfer of $273.7 million because of higher loan service payment of $585.4 million than disbursements of $311.7 million during the year.
Figure 33: Net Resource Transfer, Project Loans
Source: Asian Development Bank data.
Figure 34: Countries with Highest and Lowest Net Resource Transfers, Project Loans
( ) = negative, BAN = Bangladesh, PRC = People’s Republic of China, IND = India, INO = Indonesia, KAZ = Kazakhstan, LAO = Lao People’s Democratic Republic, MAL = Malaysia, PAK = Pakistan, PHI = Philippines, VIE = Viet Nam. Source: Asian Development Bank data.
518 1,289
769 718 1,023
615
18
855
10 39 300
0
1,000
2,000
3,000
2012 2013 2014 2015 2016
$ m
illio
n
Cancellation (Effective) Cancellation (Not Effective) Termination (Not Signed)
5.6 6.0 6.8 6.5
7.2
3.2 3.9 3.3
3.4 4.0
2.4 2.1
3.4 3.0
3.2
-
2.0
4.0
6.0
8.0
2012 2013 2014 2015 2016
$ b
illio
n
Disbursement Loan Service Payment Net Resource Transfer
743
482 468 460 435
(274)(40) (26) (24) (17)
(400)
(200)
0
200
400
600
800
IND VIE PAK BAN PRC INO PHI LAO MAL KAZ
$ m
illio
n

20
8. Project Performance Ratings
39. Project performance ratings are a key indicator of portfolio performance. As of the end of 2016, more than 20% of EARD and PARD projects had implementation risks (Figure 35). The agriculture, natural resources, and rural development; finance; industry and trade; public sector management; and water and other urban infrastructure and services sectors had more than 20% of projects with implementation risks (Figure 36). An increase in the overall project performance ratings from 2015 reflected the higher achievement of contract awards and disbursement in 2016.
Figure 35: Portfolio Ratings by Department
2015
2016
ADB = Asian Development Bank, CWRD = Central and West Asia Department, EARD = East Asia Department, PARD = Pacific Department, SARD = South Asia Department, SERD = Southeast Asia Department. Source: Asian Development Bank data.
Figure 36: 2016 Portfolio Ratings by Sector
ADB = Asian Development Bank; ANR = agriculture, natural resources, and rural development; EDU = education; ENE = energy; FIN = finance; HLT = health; ICT = information and communication technology; IND = industry and trade; MUL = multisector; PSM = public sector management; TRA = transport; WUS = water and other urban infrastructure and services. Source: Asian Development Bank data.
78% 74% 73%83%
68%76%
18% 21%13%
15%
20%17%
4% 5%15%
3%12% 7%
0%
20%
40%
60%
80%
100%
CWRD EARD PARD SARD SERD ADB
85%69% 65%
87% 81% 80%
13%
21% 24%
12%14% 15%
2%10% 11%
2% 5% 5%
0%
20%
40%
60%
80%
100%
CWRD EARD PARD SARD SERD ADB
78%88% 83%
68%82% 80%
56%
100%
67%
82% 79% 80%
14%7% 14%
27%12% 20%
33%
0%
25%
13% 17% 15%
7% 5% 3% 5% 6% 0%11%
0%8% 4% 4% 5%
0%
20%
40%
60%
80%
100%
ANR EDU ENE FIN HLT ICT IND MUL PSM TRA WUS ADB
On Track Potential Problem Actual Problem

21
Box 2: Good Portfolio Management Practices and Lessons to Share (Central and West Asia Department, and South Asia Department)
In 2016, ADB achieved a record high $9.3 billion of contracts awarded. Of this amount, SARD contributed 37.2% ($3.4 billion) and CWRD contributed 31.3% ($2.9 billion). This was also a record performance by the two departments. SARD achieved a contract award ratio of 30.2%, the highest since 2010 and CWRD achieved 26.8%, their highest ever contract award ratio. Some of the good practices, which helped the two departments achieve these results included:
• Restructure implementation arrangements in a timely fashion to help speed up project implementation.
• Carry out joint portfolio performance reviews with other development partners. • Carry out country- and sector-focused portfolio performance reviews, and spring clean non-
performing portions of loans. • Organize regular portfolio review meetings led by resident missions rather than sector divisions. • Strengthen resident missions’ capacity to administer the implementation of projects and
transfer responsibility from sector divisions to resident missions. • Delegate projects to resident missions, which allows for the quicker resolution to any urgent
issue on the ground. • Conduct portfolio-wide annual capacity building and training activities for executing agencies
and/or implementing agencies. • Utilize consultants to enhance capacity in project management, increase efficiency, improve
quality in procurement, resolve procurement problems, and add critical project analyst support. • Schedule award of contracts, especially high-value contracts, in the first half of the year. • Monitor closely the status of procurement plans and track contract packages, particularly with
high-risk contracts. • Provide timely support for complex and/or challenging procurement cases, including requesting
OSFMD support. • Ensure project and procurement readiness at approval with appropriate procurement
packaging. • Schedule project review missions early in the year for projects that have large contract awards
and disbursements. These missions should assess the likelihood of achieving the yearly target and set up measures to facilitate a smoother implementation. Scheduling missions early allows the executing agency’s project management unit (PMU) to implement these measures.
• Assist executing agencies and implementing agencies from project processing until effectiveness, for advance action and PMU set-up.
• Encourage extra efforts by sector divisions and resident missions to pursue potential disbursements and advancing actions—notably result-based lending—realizing additional disbursements from the 2016 contract awards through the timely mobilization and tracking of all possible disbursement opportunities (particularly from transport, energy, and urban projects).
ADB = Asian Development Bank, CWRD = Central and West Asia Department, OSFMD = Operations Services and Financial Management Department, SARD = South Asia Department. Source: ADB Operations Services and Financial Management Department.

22
9. Technical Assistance Portfolio 40. In 2016, the TA portfolio decreased 0.3% by value and 7.0% by number (Figure 37)20. Of the total TA projects, 22.1% were project preparatory technical assistance (PPTA) and 77.9% were non-PPTA projects. Of the $1.6 billion TA portfolio, SERD continued to hold the largest portfolio by value ($499.2 million) and number (184) in 2016 (Figure 38). 41. The average age of a TA project from approval was 2.3 years in 2016. Of the active TA portfolio, 55.9% had been extended. The average extension was 1.9 years compared to 1.8 years in 2014 and 1.7 years in 2015. The age distribution of the active TA portfolio showed 25.4% by amount in age 5 years and above, an increase by 2.7 percentage points (Figure 39). Non-PPTA accounted for 83.9% ($783.1 million) of undisbursed amounts and 81.7% ($430.4 million) of uncontracted TA amounts (Figure 40).
Figure 37: Technical Assistance Portfolio Growth, 2012–2016
No. = number, TA = technical assistance. Source: Asian Development Bank data.
Figure 38: Technical Assistance Portfolio Growth by Department, 2015–2016
CWRD = Central and West Asia Department, EARD = East Asia Department, KMSD = knowledge management services departments, No. = number, PARD = Pacific Department, PSOD = Private Sector Operations Department, SARD = South Asia Department, SERD = Southeast Asia Department, TA = technical assistance. Source: Asian Development Bank data.
20 Includes PSOD TA projects.
1,379 1,626 1,665 1,599 1,594
9911069 1070
965897
0
200
400
600
800
1000
1200
2012 2013 2014 2015 20160
200400600800
1,0001,2001,4001,6001,800
Nu
mb
er$
mill
ion
Net TA Amount No. of Active TA Projects
115
153
68 42
166
215
149
57
121 134 69
42
163 184
120
64
0
100
200
300
CWRD EARD PARD PSOD SARD SERD KMSD Others0
100
200
300
400
500
600
Nu
mb
er
$ m
illio
n
2015 Net TA Amount 2016 Net TA Amount
2015 No. of Active TA Projects 2016 No. of Active TA Projects

23
Figure 39: Technical Assistance Portfolio by Age
No. = number, TA = technical assistance. Source Asian Development Bank data.
Figure 40: Active Technical Assistance Portfolio Undisbursed and Uncontracted Value – Project Preparatory and Non-Project Preparatory,
2015–2016
Non-PPTA = non-project preparatory technical assistance, PPTA = project preparatory technical assistance. Source: Asian Development Bank data.
42. As of the end of December 2016, 88 TA projects21 were age 5 and above, with an undisbursed balance of $126.6 million (Figures 41 and 42). Of these 88 TA projects, 86 have extended their completion date by an average of 4.1 years, 33 have uncontracted balances equal or less than $100,000, 30 are overdue closure, and 43 have supplementary approvals to increase the original TA amount. Four TA projects have implementation schedules of more than 10 years (one each from PSOD, SARD, Sustainable Development and Climate Change Department,22 and SERD). These 88 TA projects have a total of $43.9 million (10.8%) still uncontracted. The highest uncontracted percentages were in age 8 (22.0%) and age 10 (15.3%) (Figure 43). Knowledge management services departments had an uncontracted balance of $16.1 million23 and SERD had $9.6 million (Figure 44). 43. TA projects that serve either as channel mechanism of funds, or support corporate strategic objectives, may have longer implementation period. TA administering divisions should give additional attention and efforts should be given to managing the older TA projects, including speeding up TA implementation, closing TA projects, and limiting extensions and multiple supplementary approvals. These actions will also help reduce the administrative burden on staff.
21 This includes 10 regional TA projects (PSOD, SARD, and SDCC had two each, and EARD, the Office of Public-
Private Partnership, PARD and SPD had 1 each). 22 This includes a TA project that serves as a channel mechanism for funds to support pre-feasibility studies for
priority urban infrastructure projects and prepare urban infrastructure investment plans. 23 Knowledge management services departments consist of Economic Research and Regional Cooperation
Department and SDCC. This includes $9.3 million uncontracted balances from two TA projects managed by SDCC that serve as channel mechanism of funds from donors to support urban and water operations.
224
365
220
88
264
452 473 405
0
100
200
300
400
500
0100200300400500600700
0 year 1 to 2 years 3 to 4 years =>5 years
$ m
illionN
um
ber
No. of TA Projects Net Amount
838 783466 430
122 150
73 96
0
500
1000
1500
2015 2016 2015 2016
Undisbursed Uncontracted
$ m
illio
n
Non-PPTA PPTA

24
Figure 41: Undisbursed Balance on Technical Assistance with Age ≥ 5 years, 2016
TASF = Technical Assistance Special Fund. Source: Asian Development Bank data.
Figure 42: Undisbursed Balance on Technical Assistance with Age ≥ 5 years
by Department, 2016
CWRD = Central and West Asia Department, EARD = East Asia Department, KMSD = knowledge management services departments, PARD = Pacific Department, PSOD = Private Sector Operations Department, SARD = South Asia Department, SERD = Southeast Asia Department, TASF = Technical Assistance Special Fund. Source: Asian Development Bank data.
Figure 43: Uncontracted Balance and Percentage on Technical Assistance
with Age > 5 years by Age, 2016
Source: Asian Development Bank data.
Figure 44: Uncontracted Balance and Percentage on Technical Assistance
with Age > 5 years by Department, 2016
CWRD = Central and West Asia Department, EARD = East Asia Department, KMSD = knowledge management services departments, PARD = Pacific Department, PSOD = Private Sector Operations Department, SARD = South Asia Department, SERD = Southeast Asia Department. Source: Asian Development Bank data.
C. Conclusions and Agreed Actions
1. Portfolio Performance 44. The performance of the sovereign portfolio in 2016 improved in terms of contract awards, disbursements, and project performance ratings. Contract awards and disbursements were higher in absolute amounts and in ratios than in 2015.
9.6 10.1
5.4 1.8 1.7 0.2
46.5
28.1
0.5
12.5
2.5 2.5
0.0
10.0
20.0
30.0
40.0
50.0
60.0
5 6 7 8 9 10
$ m
illio
n
Age from Approval date
TASF Other Funds
1.5 3.6 1.9
9.7
3.7 1.4 5.6 2.2 0.7 0.2
7.5 6.8
55.9
1.6
24.1
0.1 0.0
10.0
20.0
30.0
40.0
50.0
60.0
70.0
$ m
illio
n
TASF Other Funds
16.1
10.9
2.2
8.8
1.9 1.5 2.4
11%
9%7%
22%
7%
15%
10%
0%
5%
10%
15%
20%
25%
0.0
10.0
20.0
30.0
40.0
5 6 7 8 9 10 11
$ m
illio
n
Age from Approval date
Uncontracted Balance Uncontracted %
1.0 2.6 3.5
8.1 9.6
1.6
16.1
1.3
13%
23.4%
10%14.5%
6%8%
17%
11%
0%
5%
10%
15%
20%
25%
0.0
5.0
10.0
15.0
20.0
25.0
$ m
illio
n
Uncontracted Balance Uncontracted %

25
45. The increase in contract awards performance was attributed to the better performance of CWRD and SARD countries. The contract award ratio of Afghanistan (28.4%), Uzbekistan (27.4%), and Pakistan (25.2%) in CWRD, and Bangladesh (30.8%), Nepal (30.5%), India (30.1%), and Sri Lanka (25.6%) in SARD were higher than the ADB average of 24.3%. The disbursement ratios of Pakistan (20.0%) in CWRD, and Bangladesh (23.2%) and Sri Lanka (21.6%) in SARD were higher than the ADB average of 18.2%. Both departments attributed this performance to more attention given to project and procurement readiness, regular portfolio reviews, monitoring of high-value contracts and disbursements, and capacity building efforts (see Box 2). 46. Among the countries with the largest portfolio, the contract award ratio in Viet Nam (15.8%), the Philippines (16.2%) and the PRC (19.1%) were lower than ADB average. The uncontracted balance of the PRC increased by $469.7 million and the Philippines by $331.3 million. Contract awards in years 4 and 5 age groups declined by 36.5% ($692.0 million), showing implementation problems in these age groups. The disbursement ratios of Uzbekistan (10.3%), Afghanistan (11.2%), Viet Nam (13.9%), the Philippines (14.2%), and Nepal (15.2%) were lower than ADB average. The undisbursed balances of the Philippines, the PRC, and Uzbekistan increased by a total of $1.2 billion partly due to new project approvals. Disbursements in the year 4 age group fell by 21.1% ($282.5 million). All this highlights the need to closely monitor projects with large uncontracted and undisbursed balances in ages 4 and above. 47. Ninety-six percent of the projects closed in 2016 were extended, of which about 50% were delayed by two years or more. In addition, the number of six-year-old and above projects increased by 24.0% from 2015. Seventy-nine loans and 29 grants were already past their closing dates. This shows the need to closely monitor projects already delayed by two years or more and close projects past closing dates. 48. Though the Q1–Q3 approvals increased in 2016, the entry of effective loans and grants by amount within the same year of approval declined to 20.8% in 2016 compared with 21.5% in 2015 due to 69.3% of Q1–Q3 approvals not becoming effective. The small number of projects becoming effective during the year of approval impacted contract awards and disbursement performance. The new initiative to focus on commitments rather than approvals should help in higher number of projects becoming effective within the same year of approval. This will contribute to higher contract awards and disbursements. 49. A review of annual approvals, contract awards, and disbursements during 2007−2016 indicates that the level of contract awards and disbursements continue to lag approvals by $3 billion–$4 billion per year (Figure 45). Even with higher disbursements in 2016, the gap between approvals and disbursements increased by $0.2 billion over 2015. With higher approvals expected in the next 2-3 years, there will be more pressure on contract award and disbursement ratios. This calls for increased efforts in achieving contract awards and disbursements.

26
Figure 45: Annual ADB Approvals, Contract Awards, and Disbursements, 2007–2016
ADB = Asian Development Bank, ADF = Asian Development Fund, OCR = ordinary capital resources. Note: Covers sovereign OCR and ADF projects only (excludes policy-based projects). Source: Asian Development Bank data.
50. The use of a harmonized disbursement ratio definition shows that ADB’s achievement continues to be lower than that of the World Bank since 2011 and an even wider gap exists when compared with the African Development Bank (Table 3). This highlights the need for ADB to continue to improve its disbursement performance.
Table 3: Disbursement Ratio – ADB, African Development Bank, and World Bank,
2009–2016 Year ADB World Bank AfDB
2009 20.9% 28%
2010 20.5% 19% 2011 20.4% 21.5% 18%
2012 17.8% 20.0% 22%
2013 17.7% 19.8% 24% 2014 18.2% 20.0% 19% 2015 17.2% 21.2% 21% 2016 18.2% 19.3% ADB = Asian Development Bank, AfDB = African Development Bank. Sources: World Bank. 2016. World Bank Group and World Bank Corporate Scorecard October 2016. Washington, DC: World Bank Group; African Development Bank Group. 2016. Annual Development Effectiveness Review 2016 Accelerating the Pace of Change. Tunisia: African Development Bank Group; Asian Development Bank data.
51. While project readiness and procurement times improved in 2016, ADB must accelerate the positive trend in design and procurement readiness, contract management, and realistic implementation schedules to deal with the demands that come with an increasing portfolio. ADB should continue its efforts to implement further procurement reforms to reduce the end to end time and improve ADB’s project delivery and outcome. 52. Though the TA portfolio fell 7.0% by number in 2016, the overall number remains high (897 TA projects). Eighty-eight TA projects were age 5 and above with a total undisbursed balance of $126.6 million. Of these, 86 have extended their completion date by an average of 4.1 years and 33 have uncontracted balances equal or less than $100,000. This highlights the need to close old TA projects and monitor TA implementation.
6.5 6.77.6
9.810.5
8.7
11.4
9.310.3
11.3
4.64.8
6.55.6
7.57.3
6.2
7.9 7.8
8.8
3.94.6
5.0 5.36.2 6.0 6.5
7.2 6.97.6
0
2
4
6
8
10
12
2007 2008 2009 2010 2011 2012 2013 2014 2015 2016
$ b
illio
n
Annual Approvals Annual Contract Awards Annual Disbursements

27
2. Looking Forward
53. Performance is expected to improve in 2017 due to the portfolio structure conditions, particularly the portfolio age and the 5-year average performance of contract awards and disbursements. Contract awards are expected to increase to $9.7 billion and disbursements to $9.4 billion in 2017 (Figure 46). Regional departments should continue their efforts to achieve higher levels of performance in 2017 to be able to manage the anticipated increase in approvals.
Figure 46: Project Loan and Grant Contracts and Disbursements— Funds Available versus Actual, 2012–2017
Source: Asian Development Bank data.
55.7
35.1
46.4
8.9 8.8
51.9
37.1
47.6
9.2 9.6
52.5
38.147.7
9.79.4
0
10
20
30
40
50
60
70
Active Loan & GrantPortfolio 31 Dec
Funds Available forContracting
Funds Available forDisbursement
(beginning of year)
Contract Awards Disbursement
$ b
illio
n
2012 2013 2014 2015 2016 2017

28
Box 3: 2017 Portfolio Actions Proposed by ADB’s Regional Departments The regional departments have committed to the following actions for 2017: Central and West Asia Department
(i) Strengthen the monitoring of procurement turn-around and reduce processing time. (ii) Move to more country-focused portfolio management and empower resident missions. (iii) Accelerate delegation of projects to resident missions. (iv) Improve design and procurement readiness. (v) Make better strategic use of midterm review missions. (vi) Conduct all country portfolio review missions in the first quarter of 2017.
East Asia Department (i) Strengthen one EARD approach to project administration. (ii) Engage national procurement officers as mission members during project preparation to
improve contract packaging. (iii) Utilize potential loan savings to existing subprojects faster, identify replacement of
subprojects or new subprojects to facilitate implementation and reduce the need for loan extensions.
(iv) Monitor low bids closely. Project teams to validate and update cost estimates and procurement plan prior to bidding. For abnormally low bids, examine the nature of works and the need for higher amount of performance security. Review the qualification criteria as to the need for stricter criteria on financial capacity and experience, particularly for smaller contractors.
(v) Monitor procurement milestones, preliminary engineering design, detailed engineering design monitoring sheet from loan inception, and strengthen contract management. Ensure the timely recruitment of consulting services by utilizing advance action for loan consultants and expedite review and approval to ensure fielding of consultants upon loan effectiveness.
(vi) Conduct tailored training for executing agencies and/or implementing agencies to strengthen procurement, disbursements, financial management, safeguards, preparation of project performance management system (PPMS) reports, and project management capacity during processing and implementation.
Pacific Department (i) Enhance project readiness by using the Project Readiness Checklist prepared at project
concept stage and reporting implementation status at staff review meeting or management review meeting.
(ii) Supplement the resources available under project preparatory technical assistance (PPTA) by having the procurement specialists of a regional technical assistance participate in the PPTA.
(iii) Establish the one consultant for one project approach to expedite project preparation and implementation.
(iv) Collaborate with OSFMD Procurement Division in identifying the revisions needed to incorporate a provision for rejecting abnormally low bids in the standard bidding documents, Guide on Bid Evaluation, and the Users’ Guide.
(v) Pilot test revised bidding documents after Board approval of the new policy and regulations. continued on page 29

29
continuation from page 28
South Asia Department (i) Monitor contract award and disbursement targets closely. (ii) Achieve at least 65% overall delegation of project administration to resident missions. (iii) Reduce the TA portfolio to 160 projects and reduce the undisbursed TA amount. (iv) Reduce the overall procurement lead time by 50%. (v) Deliver larger projects with better procurement packaging. (vi) Increase Procurement Accreditation Skills Scheme (PASS) accreditation to 50% of project
administration unit staff in all units with project (infrastructure) investments. (vii) Achieve 100% design and procurement readiness; closely monitor project readiness
compliance with more stringent design and procurement readiness requirements.
Southeast Asia Department (i) Continue to post staff to resident missions. (ii) Reach a project delegation target of 68% by end 2017. Delegate at least another 37 projects
to the resident missions. (iii) Utilize excess analyst staff in headquarters to support delegated projects. Continue to
enforce the “one ADB one SERD” model to project implementation and administration. (iv) Incorporate project readiness in all projects at concept paper stage. (v) Close at least 39 non-PPTAs by end 2017.
ADB = Asian Development Bank, OSFMD = Operations Services and Financial Management Department, SERD = Southeast Asia Department. Source: ADB Operations Services and Financial Management Department.
3. Agreed Actions 54. The progress made in implementing the 2015 APPR recommendations is updated in Appendix 3. 55. 2016 performance has been discussed with regional departments and each regional department has proposed its own set of actions to enhance portfolio performance in 2017 (Box 3). In addition, the following actions are recommended and agreed to improve portfolio performance further:
(i) Continue rigorous efforts to improve project readiness, monitor large contracts and large disbursements, and tighten monitoring on projects with large uncontracted and undisbursed balances in ages 4 and above.
(ii) Monitor closely projects already delayed by 2 years or more beyond the original implementation period, and close projects past closing date.
(iii) Improve the entry of approved projects becoming effective in the same year to between 30% and 50%.
(iv) Review TA projects that are more than 5 years and close those that have less than $100,000 uncontracted balance, and limit extensions.
(v) Approve and implement the second phase of the procurement reform to reduce the end to end procurement time.

30
III. 2016 NONSOVEREIGN PORTFOLIO
A. Portfolio Composition and Trends
56. Overall Portfolio. Nonsovereign operations include loans, guarantees and equities.24 The total committed nonsovereign portfolio25 increased by 17.3% to $9.2 billion at the end of 2016 ($7.9 billion at the end of 2015) (Figure 47).26 Nonsovereign committed loans totaled $6.7 billion ($6.0 billion in 2015), committed guarantees totaled $1.5 billion ($0.8 billion in 2015), and committed equities (at carrying value) totaled $1.0 billion ($1.1 billion in 2015). Direct value-added (DVA) commercial cofinancing totaled $5.6 billion, a 22.6% increase from $4.6 billion in 2015, driven by increases in parallel loans and Trade Finance Program (TFP) cofinancing.
57. The total outstanding portfolio increased by 26.9% to $7.6 billion at the end of 2016 ($6.0 billion at the end of 2015), with loans constituting the largest share at $5.4 billion ($4.5 billion at the end of 2015).27 The top two sectors—energy and finance—accounted for 86.3% of the outstanding portfolio (85.2% in 2015). The concentration in the top three countries—the People’s Republic of China (PRC), India, and Vietnam—decreased to 48.5% of the outstanding portfolio. In 2015, the top three countries—the PRC, India, and Thailand—accounted for 55.0%.
1. Approvals, Commitments, and Disbursements
58. In 2016, nonsovereign approvals declined, but commitments and disbursements rose. Approvals decreased by 4.7% to $2.5 billion, 3.8% below the 2016 planning figures for nonsovereign operations of $2.6 billion. Commitments increased by 9.9% to $1.8 billion ($1.6 billion in 2015). Loan and equity disbursements increased by 11.2% to a record high of $1.7 billion (Figure 48).
59. Loan approvals totaled $2.4 billion in 2016, a 12.1% increase over 2015. Loan commitments increased by 1.3% to $1.5 billion. Loan disbursements increased by 15.2% to $1.7 billion. Guarantee approvals dropped sharply by 95.6% to $15.0 million ($341.2 million in 2015). Guarantee commitments increased to $211.7 million ($12.3 million in 2015). Equity approvals declined by 42.9% to $76.5 million, of which $20.0 million was for investment funds and $56.5 million for direct equities. Equity commitments fell by 37.1% to $95.9 million and equity disbursements declined by 36.0% to $78.8 million. 60. In 2016, total approvals in group A countries fell to $103.6 million and group B countries to $966.0 million (from $315.0 million in group A countries and $1.1 billion in group B countries in 2015). Total approvals in group C countries increased to $1.4 billion ($1.1 billion in 2015).28 The PRC and India accounted for $1.1 billion or 44.8% of total approvals ($1.2 billion or 44.2% in 2015).
24 In this paper, loans include debt securities that are similar to loans and equities include compulsory convertible
debentures, a form of debt security that is similar to equities. 25 In 2016, loans include a debt security of $147.7 million. Equities include a $3.0 million compulsory convertible
debenture. 26 The committed loan and equity portfolio consists of outstanding balances plus undisbursed balances. The committed
guarantee portfolio consists of outstanding balances plus non-executed commitments. 27 The total outstanding portfolio is the disbursed loans and equity investments (on the balance sheet) plus executed
guarantees (off the balance sheet). 28 Countries that received nonsovereign project assistance from ADB in Group A: Afghanistan, Bhutan, Cambodia, the
Kyrgyz Republic, the Lao People’s Democratic Republic, the Maldives, Myanmar, Nepal, Samoa, and Tajikistan. In Group B countries: Armenia, Bangladesh, Georgia, India, Mongolia, Pakistan, Papua New Guinea, Sri Lanka, Uzbekistan, and Viet Nam. In Group C countries: Azerbaijan, the PRC, Indonesia, Kazakhstan, Malaysia, the Philippines, and Thailand.

31
Figure 47: Nonsovereign Portfolio at a Glance (As of 31 December 2016)
Source: Asian Development Bank data.
Total Nonsovereign Portfolio
• Total year-end committed portfolio increased by 17.3% to $9.2 billion
• Total loans committed increased to $6.7 billion, guarantees committed increased to $1.5 billion, and equity committed decreased marginally to $1.0 billion
• Approvals decreased by 4.7% to $2.5 billion • Commitments increased by 9.9% to $1.8 billion • Disbursements increased by 11.2% to $1.7 billion • Droppages and cancellations decreased to $415.9
million from $836.2 million in 2015
Loan Portfolio
• Total committed loans increased by 11.7% to $6.7 billion • Outstanding loans increased by 21.5% to $5.4 billion • Undisbursed balances decreased by 16.1% to $1.3
billion • Approvals increased by 12.1% to $2.4 billion • Commitments increased by 1.3%, remained at $1.5
billion • Disbursements increased by 15.2% to $1.7 billion • Droppages and cancellations decreased by 50.4% to
$404.8 million • Prepayments increased by 34.2% to $153.8 million
Guarantee Portfolio
• Total committed guarantees increased by 88.7% to $1,483.0 million
• Outstanding guarantees increased by 88.7% to $1,482.9 million
• Signed non-executed guarantees remained unchanged at $0.1 million (excluding Trade Finance Program and revolving Partial Credit Guarantees)
• Approvals decreased by 95.6% to $15.0 million • Commitments increased to $211.7 million • No droppages or cancellations
Equity Portfolio
• Total committed equities decreased by 3.5% to $1.0 billion
• Outstanding equities (at carrying value) decreased by 7.1% to $666.7 million
• Undisbursed equities increased by 3.9% to $359.1 million
• Approvals decreased by 42.9% to $76.5 million, of which $56.5 million was for direct equities
• Commitments decreased by 37.1% to $95.9 million • Disbursements decreased by 36.0% to $78.8 million • Droppages and cancellations were $11.0 million

32
Table 4: Nonsovereign Portfolio Quality and Performance, 2015–2016
[This information contains sensitive financial information subject to disclosure
restrictions per paragraph 97, exception (viii) of ADB’s Public Communications Policy
(2011).]

33
Figure 48: Portfolio Growth, 2012–2016
Source: Asian Development Bank data.
61. Approvals by sector have been volatile year to year. In 2016, the energy and finance sectors continued to dominate—the energy sector at $1.5 billion ($1.2 billion in 2015) and the finance sector at $592.5 million ($1.0 billion in 2015). Water and other urban infrastructure and services totaled $200.0 million ($285.0 million in 2015); agriculture, natural resources, and rural development sector totaled $145.0 million ($3.0 million in 2015); information and communication technology totaled $50.0 million ($150.0 million in 2015); and the transport sector registered no approvals, as in the previous year. 62. Trade Finance Program. The TFP supported $3.1 billion in trade in 2016 ($2.5 billion in 2015), of which $1.3 billion was in guarantees and loans provided by ADB and $1.8 billion was cofinancing. The number of transactions the TFP supported in 2016 increased to 2,079 (1,908 in 2015). Over 90% of the 2016 transactions were in Asian Development Fund (ADF) countries. Of the 2016 transactions, 76.8% supported small and medium-sized business and 80.2% supported intraregional trade. Among the 20 countries of operation, the most active were Armenia, Bangladesh, Mongolia, Pakistan, Sri Lanka, and Viet Nam. TFP expanded to the Pacific and added new banks in Cambodia, Georgia, Kazakhstan, Myanmar, and Uzbekistan. Notwithstanding a difficult environment for trade, with historically low levels of trade growth, TFP remained well positioned to fill market gaps where private sector capacity is limited due to perceptions of risk. TFP also expanded its distribution network to increase cofinancing and manage growth within existing limits.
[This information contains sensitive financial information subject to disclosure restrictions per paragraph 97, exception (viii) of ADB’s Public Communications Policy (2011).] 63. Supply Chain Finance Program. After a slow start due to a soft market and banks being in retrenchment, the Supply Chain Finance Program (SCFP) more than doubled its transactions both in number and in volume. SCFP executed 188 transactions (77 in 2015) valued at $203 million ($98.0 million in 2015), half of which were cofinanced in 2016. SCFP expanded to Malaysia. All SCFP transactions in 2016 supported small and medium-sized businesses. As the SCFP pilot period comes to an end in 2018, a discussion will take place in 2017 about the future of the program and how ADB may want to build it up and expand its scope and impact.
1,841 1,602
1,929
2,626 2,502
1,789
668
1,889
1,632 1,794
590
924 1,229
1,567 1,743
-
500
1,000
1,500
2,000
2,500
3,000
2012 2013 2014 2015 2016
$ m
illio
n
Approvals Commitments Disbursements

34
64. Microfinance Risk Participation Program. Since 2010, ADB has successfully implemented the $240 million Microfinance Risk Participation and Guarantee Program in partnership with participating financial institutions (PFIs). ADB guarantees up to 50% of the default risk arising from loans made by these PFIs to Microfinance Institutions (MFIs). In 2016, the program supported 42 transactions (57 in 2015) with a total volume of $154.0 million ($149.0 million in 2015) and cofinancing of $84.6 million ($39.2 million in 2015). This supported more than 15 MFIs in India, Indonesia, and Bangladesh and benefitted approximately 2.4 million low-income individuals, mostly women. 65. Direct Value-added Cofinancing. In 2016, Direct Value-added (DVA) commercial cofinancing totaled $5.6 billion, a 22.6% increase from $4.6 billion in 2015. This was mainly driven by an increase of parallel loans to $3.2 billion due to one transaction29 ($1.1 billion in 2015) and by an increase of TFP cofinancing to $1.8 billion ($1.4 billion in 2015). In addition, DVA official cofinancing approvals for nonsovereign operations in 2016 increased to $238.0 million ($25.0 million in 2015). B loans decreased to $203.0 million ($1.1 billion in 2015). Total approvals (ADB plus total DVA cofinancing) increased by 15.5% in 2016 to $8.3 billion ($7.2 billion in 2015). The mobilization rate increased to 2.34 from 1.75 in 2015 and from the 3-year 2013–2015 average of 2.07.30
2. Droppages and Cancellations 66. Droppages and cancellations decreased to $415.9 million in 2016 from $836.2 million in 2015 (Figure 49). Droppages totaled $241.0 million ($429.1 million in 2015).31 Cancellations totaled $174.8 million ($407.1 million in 2015).32 In 2016, droppages were reduced to 9.6% of approvals and cancellations were reduced to 10.4% of undisbursed balances, within the 10%–
15% guidance limit established in 2015 APPR. From 2012 to 2016, loan droppages averaged 16.1% of approvals, equity droppages averaged 11.2%, and guarantee droppages averaged 73.8%. Loan cancellations averaged 10.2% of commitments, equity cancellations averaged 18.7%, and guarantee cancellations averaged 31.1%. Changes in market, country, and/or macroeconomic conditions, and regulatory and pricing issues caused most of the loan droppages (67.4%). Most of the droppages in equities were due to sponsor issues (98.9%) such as a change in project scope and sponsor’s poor performance. Most guarantee droppages (98.2%) were caused by a change in external conditions such as pricing and alternative financing. The majority of cancellations on loans (68.1%) were caused by sponsor issues such as a change in project cost, change of scope, and excess of cash flows. Equity cancellations (84.8%) were mostly due to sponsor issues such as sponsor’s integrity issues or poor performance. Most guarantee cancellations (97.6%) were due to the sponsor’s poor performance.
29 Tangguh Liquefied Natural Gas Expansion Project. 30 The mobilization rate is the ratio of total DVA cofinancing approvals to total ADB approvals. 31 The largest in 2016 were the droppage of a $160.0 million from a loan in Indonesia due to a change in market
condition and a $50.0 million loan in India as the project was terminated after change of control. 32 The largest in 2016 was the cancellation of a $125.0 million from a loan in India due to a sponsor issue as the project
now can be supported by internally generated cash flows.
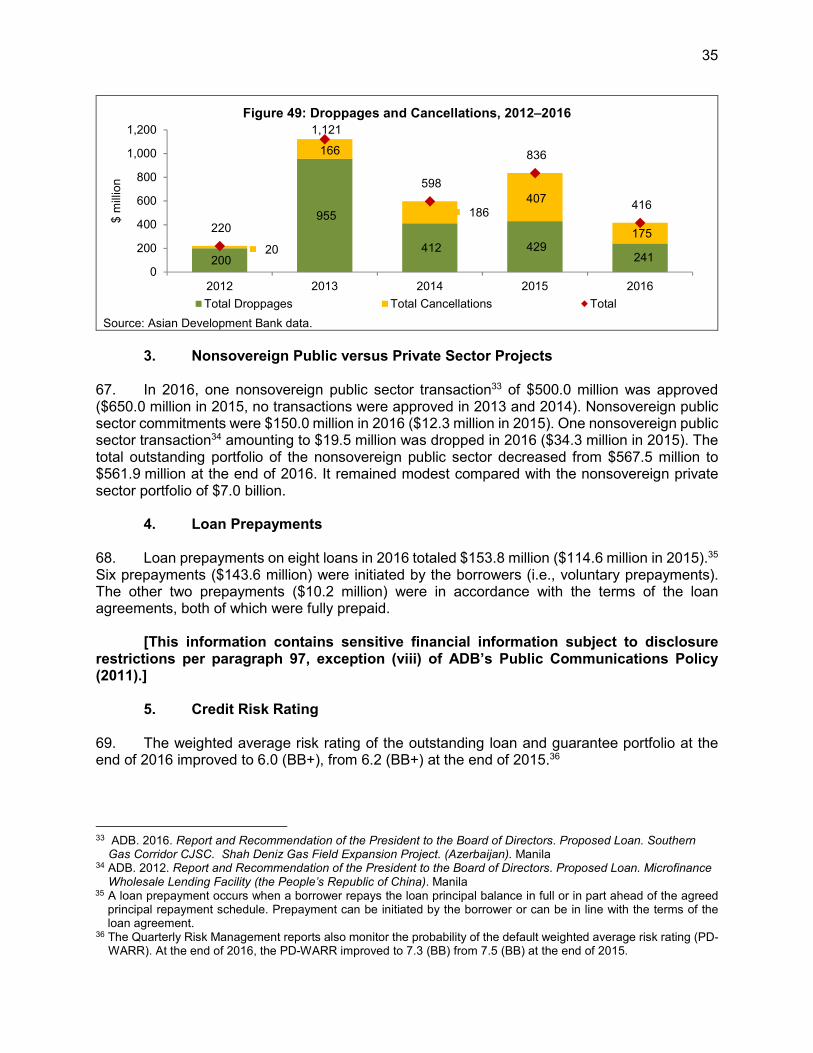
35
Figure 49: Droppages and Cancellations, 2012–2016
Source: Asian Development Bank data.
3. Nonsovereign Public versus Private Sector Projects
67. In 2016, one nonsovereign public sector transaction33 of $500.0 million was approved ($650.0 million in 2015, no transactions were approved in 2013 and 2014). Nonsovereign public sector commitments were $150.0 million in 2016 ($12.3 million in 2015). One nonsovereign public sector transaction34 amounting to $19.5 million was dropped in 2016 ($34.3 million in 2015). The total outstanding portfolio of the nonsovereign public sector decreased from $567.5 million to $561.9 million at the end of 2016. It remained modest compared with the nonsovereign private sector portfolio of $7.0 billion.
4. Loan Prepayments
68. Loan prepayments on eight loans in 2016 totaled $153.8 million ($114.6 million in 2015).35 Six prepayments ($143.6 million) were initiated by the borrowers (i.e., voluntary prepayments). The other two prepayments ($10.2 million) were in accordance with the terms of the loan agreements, both of which were fully prepaid.
[This information contains sensitive financial information subject to disclosure restrictions per paragraph 97, exception (viii) of ADB’s Public Communications Policy (2011).]
5. Credit Risk Rating 69. The weighted average risk rating of the outstanding loan and guarantee portfolio at the end of 2016 improved to 6.0 (BB+), from 6.2 (BB+) at the end of 2015.36
33 ADB. 2016. Report and Recommendation of the President to the Board of Directors. Proposed Loan. Southern
Gas Corridor CJSC. Shah Deniz Gas Field Expansion Project. (Azerbaijan). Manila 34 ADB. 2012. Report and Recommendation of the President to the Board of Directors. Proposed Loan. Microfinance
Wholesale Lending Facility (the People’s Republic of China). Manila 35 A loan prepayment occurs when a borrower repays the loan principal balance in full or in part ahead of the agreed
principal repayment schedule. Prepayment can be initiated by the borrower or can be in line with the terms of the loan agreement.
36 The Quarterly Risk Management reports also monitor the probability of the default weighted average risk rating (PD-WARR). At the end of 2016, the PD-WARR improved to 7.3 (BB) from 7.5 (BB) at the end of 2015.
200
955
412 429 241
20
166
186 407
175 220
1,121
598
836
416
0
200
400
600
800
1,000
1,200
2012 2013 2014 2015 2016
$ m
illio
n
Total Droppages Total Cancellations Total

36
B. Portfolio Key Findings
[This information contains sensitive financial information subject to disclosure
restrictions per paragraph 97, exception (viii) of ADB’s Public Communications Policy
(2011).]
C. Conclusions and Agreed Actions
[This information contains sensitive financial information subject to disclosure
restrictions per paragraph 97, exception (viii) of ADB’s Public Communications Policy
(2011).]

Appendix 1 37
2016 SOVEREIGN PORTFOLIO: KEY INDICATORS PPR Rating
Active Portfolio ($
million)a
Contract Awards Ratio (%)b
Uncontracted (%)b
Disbursement Ratio (%)b
Undisbursed (%)b
On Track (%)
Implementation Risk (%)
2016 2015 2016 2015 2016 2015 2016 2015 2016 2015 2016 2015 2016 2015 OPERATIONS 78,043 72,809 24 23 43 44 18 17 63 64 80 76 20 24 CWRD 21,183 19,386 27 18 44 46 18 17 66 66 85 78 15 22 Afghanistan 3,419 2,931 28 14 43 41 11 8 71 72 83 82 17 18 Armenia 804 666 35 14 32 47 16 19 62 70 89 75 11 25 Azerbaijan 2,791 1,477 40 36 26 27 33 19 49 56 100 63 - 38 Georgia 1,021 921 20 34 34 34 18 18 55 62 92 80 8 - Kazakhstan 1,061 2,077 24 20 61 41 34 52 62 34 100 100 - - Kyrgyz Republic 648 547 6 22 66 47 11 12 79 63 82 90 18 10 Pakistan 6,632 6,430 25 19 51 55 20 11 72 75 82 77 18 23 Regional 42 46 - - - - - - - - 100 - - 100 Tajikistan 766 804 41 19 25 31 31 27 50 52 91 80 9 20 Turkmenistan 117 117 - - - - 97 22 - 19 100 100 - - Uzbekistan 3,881 3,369 27 11 44 51 10 27 65 65 75 68 25 32 EARD 12,019 12,049 19 22 51 47 19 17 64 61 69 74 31 26 China, People’s Republic of 11,256 11,170 19 21 50 46 20 18 63 60 69 72 31 28 Mongolia 745 861 13 26 63 61 11 8 81 81 68 79 32 21 Regional 18 18 - - - - - - - - - - - - PARD 2,366 2,019 23 23 47 39 21 19 68 58 65 73 35 27 Cook Islands 30 16 37 18 57 82 10 2 91 98 100 100 - - Fiji Islands 232 107 3 - 97 100 3 1 99 100 50 - 50 100 Kiribati 48 36 39 2 28 34 42 27 47 50 100 100 - - Marshall Islands 11 11 57 3 43 97 9 - 91 97 50 67 50 33 Micronesia, Federated States of 29 30 99 8 0 24 59 18 13 32 - 50 100 50 Nauru 14 14 87 7 13 93 23 2 77 99 100 - - 100 Palau 54 54 77 0 22 92 20 4 78 97 50 50 50 50 Papua New Guinea 1,087 1,016 14 33 49 26 26 23 67 47 54 63 46 38 Regional 139 119 - 65 72 2 28 74 74 12 100 100 - - Samoa 115 116 64 19 15 41 18 14 44 52 60 100 40 - Solomon Islands 93 64 31 7 44 49 28 12 53 56 60 75 40 25 Timor-Leste 343 281 33 36 32 33 17 30 63 61 80 86 20 14 Tonga 68 66 52 23 27 53 33 16 52 71 100 80 - 20 Tuvalu 16 4 14 - 86 100 29 - 96 100 - 100 100 - Vanuatu 88 86 35 14 48 74 - 12 - 91 75 67 25 33

38 Appendix 1
2016 SOVEREIGN PORTFOLIO: KEY INDICATORS Active Portfolio Contract Uncontracted Disbursement Undisbursed PPR Rating
($ million)a Awards Ratio
(%)b (%)b Ratio (%)b (%) b
On Track (%) Implementation
Risk (%) 2016 2015 2016 2015 2016 2015 2016 2015 2016 2015 2016 2015 2016 2015 SARD 25,940 22,770 30 29 35 39 19 16 62 66 87 83 14 18 Bangladesh 6,785 5,985 31 25 39 44 23 18 60 63 83 92 17 8 Bhutan 280 319 65 13 30 57 9 6 82 69 75 88 25 13 India 13,233 11,710 30 34 32 34 18 17 63 67 86 77 14 23 Maldives 76 67 22 25 60 73 17 4 81 94 67 100 33 - Nepal 2,164 1,898 30 14 42 53 15 11 68 74 91 78 9 22 Regional 66 61 38 15 24 31 18 39 31 38 100 100 - - Sri Lanka 3,336 2,729 26 29 36 39 22 21 54 58 92 84 8 16 SERD 16,534 16,584 17 21 46 47 16 17 60 62 81 68 19 32 Cambodia 1,040 1,140 25 23 47 42 17 18 68 57 77 58 23 42 Indonesia 2,366 2,693 20 6 65 71 24 12 71 79 80 50 20 50 Lao PDR 672 687 17 15 52 46 14 13 67 60 84 94 16 6 Malaysia 0.4 - - - - - - - - - - - - Myanmar 621 427 14 21 73 79 11 5 91 98 80 17 20 83 Philippines 2,568 2,335 16 38 56 55 14 40 59 52 82 67 18 33 Regional 288 332 6 20 69 76 9 8 80 88 100 70 - 30 Thailand 75 84 2 - 3 9 23 65 3 16 50 100 50 - Viet Nam 8,904 8,888 16 20 37 40 14 12 55 60 79 74 21 26 NON- OPERATIONS 353 346 - 11 - 83 - 4 - 84 - - - 100 TOTAL 78,396 73,155 24 23 43 44 18 17 63 64 80 76 20 24 - = nil; 0 = amount less than $0.5 million or percentage less than 0.5% CWRD = Central and West Asia Department, EARD = East Asia Department, Lao PDR = Lao People's Democratic Republic, PARD = Pacific Department, PRC = the People's Republic of China, PPR = Project Performance Rating, SARD = South Asia Department, SERD = Southeast Asia Department a Covers loans, grants, technical assistance, equity investments, and guarantees. b Covers project loans and grants only. Notes: 1. 2015 figures will not tally with figures used in the 2015 APPR due to adjustments after year-end. 2. Totals may not sum precisely because of rounding. Source: Asian Development Bank data

Appendix 2 39
Update of Midterm Review of Procurement Actions (10-Point Action Plan) Implementation and Procurement Reforms
• In 2014, ADB initiated its procurement reforms through the 10-Point Procurement Action Plan as part of the Midterm Review of its Strategy 2020. Implementation of these actions has helped ADB increase operational efficiency and reduce its internal procurement time.
• Actions taken to date include:
• New procurement risk assessments: Fourteen country, sector, and agency risk assessments have been completed [Bangladesh (including the Bangladesh Railway), Cambodia, Fiji, India (Karnataka, Rajasthan, and Power Grid), Indonesia, Lao, Nepal, Pakistan, Tajikistan, Timor-Leste, and Viet Nam. More are in process and expected to be completed in 2017.a
• New international competitive bidding thresholds: Twenty-six member countries have adopted the revised international competitive bidding thresholds.
• New prior review limits and post review (sampling): New risk-based prior review limits are available for all ongoing and new projects.
• New procurement committee and regional department procurement decision-making authorities: The revised decision-making authorities are in effect and have delivered significant efficiency gains. In 2016, 197 approvals of contracts over $10 million benefited from these improvements.
• Project procurement classification: Fifty-five projects were classified as Category A (complex) or as requiring specialized procurement support from OSFMD during project processing.
• Launch of full procurement review system: Launched on 1 January 2015 for transactions amounting to $10 million and above. In 2016, 574 transaction stages used this information-technology-based review system.
• Agree master bidding documents during project preparation: Around 60 projects have adopted master bidding documents facilitating smoother implementation and greater consistency during bidding process by executing agencies.
• New streamlined procurement committee process: Seven senior staff have been posted to Bangladesh, PRC, India, Pakistan, Uzbekistan, and Viet Nam resident missions with delegated authority to sign off on transactions up to $40 million on behalf of OSFMD Directors. In addition, three OSFMD staff provide exclusive support to CWRD, PARD, SARD, and SERD front offices. As a result, the procurement turnaround time from the receipt of a borrower’s recommendation to ADB until it’s approval has decreased from 49 days in 2015 to 45 days in 2016 (for contracts above $10 million).
• New procurement approval form: Regional departments now make all procurement submissions using an electronic template for simpler and streamlined data entry directly into the procurement review system.
• End to end consulting services process review: The Consulting Services Unit (CSU) was established in April 2015 to streamline recruitment and improve the quality of consulting services. The business processes continue to be simplified through revision of forms and templates, introduction of new contract forms (such as output-based, fixed-fee, retainer, service contracts), development of a framework contract agreement, more flexible and new methods of selection, clearer procedures, and more flexible rules for the engagement of resource persons and one-project-one-consultant concept.
The new procurement framework, approved on 12 April 2017, aims to reduce end to end procurement time, improve the quality of consultants and contractors in ADB-financed operations, and enhance procurement delivery systems. The changes included in the framework will help to achieve better project designs, procure goods, works and services with quality and value for money, and implement projects faster by resolving procurement-related issues. __________________________ a These are the Cook Islands, Kiribati, Marshall Islands, Federated States of Micronesia, Mongolia, Myanmar, Nauru, Palau, Papua New Guinea, Samoa, Solomon Islands, Sri Lanka, Tonga, Tuvalu, and Vanuatu. PRC = People’s Republic of China, CWRD = Central and West Asia Department, OSFMD = Operations Services and Financial Management Department, PARD = Pacific Department, SARD = South Asia Department, SERD = Southeast Asia Department Source: Asian Development Bank Operations Services and Financial Management Department.

40 Appendix 3
STATUS OF THE 2015 ANNUAL PORTFOLIO PERFORMANCE REPORT RECOMMENDED ACTIONS
Table A3.1: Sovereign Section
Actions Responsible
Departments Status
1. Provide appropriate resources, incentives, and staff skill mix for project design and implementation to regional and operations support departments.
Budget, Personnel, and Management Systems Department (BPMSD), regional departments
• Reorganized and strengthened the structure of the project administration unit (PAU) in Bangladesh and India resident missions. (SARD)
• As of 2016, 219 staff are accredited under the Procurement Accreditation Skills Scheme (PASS) of which, 179 are for consultant recruitment, 174 are for procurement and 134 for both.
• Resident missions became responsible for portfolio monitoring and reporting functions. (SERD)
• Established extended missions in the Pacific and a working group on “one consultant for one project” approach. (PARD)
• Further delegated the procurement review of projects administered by headquarters to the PRC resident mission. (EARD)
2. Apply procurement readiness and design criteria to all projects strictly before approval. Encourage use of project design advance (PDA) and provide more preparatory technical assistance (PPTA) resources to ensure higher project readiness.
Regional departments
• Implemented improvements to project design before approvals: (i) incorporated stakeholder/ institutional analysis into terms of references of PPTA to better understand country systems and greater emphasis to country ownership as early as design stage; (ii) introduce thorough review of detailed design; (iii) aim to prepare draft bid documents at PPTA stage; and (iv) implemented the assessment of market and industry conditions in client countries (i.e., fuller knowledge of potential and capacity of contractors and suppliers). (CWRD)
• Operationalized the Nordic Development Fund Project Readiness Improvement Trust Fund to improve project readiness and complete detailed design at the outset. (SERD)
• Maintained the annual training program to executing agencies and/or implementing agencies on the guidelines to advance action and disseminated readiness filters. (SERD)
• Engaged in dialogue with line ministries to improve country systems on procurement, project management, and safeguards. (SERD)
• Enforced project readiness criteria and undertook pre-implementation arrangements on procurement and safeguards, such as approval of first bidding documents and revised resettlement plans, in parallel with loan signing and effectiveness. (EARD)
• Engaged national procurement officers as mission members during project preparation to improve contract packaging, and early preparation of request for proposals (RFPs). (EARD)

Appendix 3 41
Actions Responsible Departments
Status
3. Resolve contracting and disbursement issues, provide capacity building support to executing agencies and implementing agencies, and strengthen contract management.
Regional departments
• Executed rigorous monitoring of large contracts and their due dates, which contributed to an increase of contracts awarded in 2016. (CWRD)
• Monitored the status of procurement plans and tracked contract packages, particularly of high-risk contracts. (SARD)
• Strengthened agency’s capacity through tailored training programs, focusing on important and weak agencies. (SARD)
• Increased the use of force account, direct contracting, and single source consultant selection to improve contract lead time and implementation. (PARD)
• Increased thresholds for shopping, national competitive bidding (NCB) and international competitive bidding (ICB). (PARD)
• Removed the ceiling on imprest accounts and state-owned enterprises (SOEs) for executing agencies with adequate capacity. Encouraged executing agencies to finance imprest accounts on the basis of 6 months estimated expenditures. (EARD).
• Held a quarterly dialogue with the Ministry of Finance and various agencies to seek guidance on the multi-level and layers of review for domestic approval, approval of minor changes, difficulty in coordinating a large number of implementing agencies, and counterpart funding support. (EARD)
4. Review age 6 and above portfolio to reduce implementation problems.
Regional departments
• Carried out country and sector portfolio performance reviews, spring clean non-performing portions of loans, and restructured implementation arrangements early to help speed up project implementation. (CWRD)
5. Limit the number of technical assistance (TA) projects, close old TA projects, limit extensions and supplementary approvals.
Regional and non-regional departments
• The number of active TA portfolio reduced by 7% from 965 in 2015 to 897 as of end 2016.
6. Make efforts to reduce the procurement time for contracts above $20 million.
Regional departments and Operations Services and Financial Management Department (OSFMD)
• Improved the procurement time for contracts above $20 million in 2016. Contracts $20 million–$40 million (joint approvals by regional department and OSFMD) were shorter by 6 days, while $40 million and above contracts by the Procurement Committee were shorter by 13 days.
ADB = Asian Development Bank, BPMSD = Budget, Personnel, and Management Systems Department, OSFMD = Operations Services and Financial Management Department, PDA = project design advance, PPTA = project preparatory technical assistance, TA = technical assistance. Source: Asian Development Bank data.

42 Appendix 3
Table A3.2: Nonsovereign Section
[This information contains sensitive financial information subject to disclosure
restrictions per paragraph 97, exception (viii) of ADB’s Public Communications Policy
(2011).]

Appendix 4 43
SOVEREIGN OPERATIONS GLOSSARY
Active portfolio All loans, grants, technical assistance (TA), equities, and guarantees approved and not financially closed (i.e., disbursement ended) as of the end of the financial year. The active portfolio includes funding from ordinary capital resources (OCR), the Asian Development Fund (ADF), other special funds, and cofinanced grants and TA projects administered by the Asian Development Bank (ADB).
Advance action Initiation of the process for procuring goods, services, and works before the effective date of the financing agreement.
Cancellation (Effective) The principal amount of a loan, grant, or TA in part (partial cancellation) or in full (full cancellation) after effectivity is reduced and removed from the portfolio.
Cancellation (Not Effective)
Refers to amount of products signed but canceled prior to product effectiveness.
Closing date or closure The last date for the borrower to withdraw from the account.
Contract award ratio The ratio of total contracts awarded during the year over the total value for contract awards available at the beginning of the year including newly approved projects (loans and grants) during the year.
Disbursement ratio The ratio of total disbursements during the year (including disbursement from newly approved operations during the year) over the undisbursed balance at the beginning of the year (based on approvals as of the previous year).
Effective (date) The date on which ADB dispatches to the borrower or recipient notice of accepting supporting evidence of the satisfaction of project (loan or grant) effectiveness conditions set out in the project (loan or grant) agreement.
Entry ratio The ratio of new approvals, less cancellations and closures, to total new approvals during the year.
Implementation risks Projects rated as potential problem or actual problem.
Multitranche financing facility (MFF)
A flexible financing instrument offered by ADB. It enables ADB to provide assistance programmatically by aligning the provision of financing with project readiness and the long-term needs of a client.
Product (or instrument) The generic means of providing financing—debt (mostly loans), equities, guarantees, grants, or TA.

44 Appendix 4
Project Defined by its unique design and monitoring framework regardless of the number of its financing instruments or sources. It refers to a project or program with a common outcome (one design and monitoring framework) regardless of which financing instrument or source ADB has agreed to provide.
Project performance rating
Projects are rated using five performance indicators: technical, contract awards, disbursement, financial management, and safeguards. A three-level traffic light rating system applies: green is on track, amber is potential problem, and red is actual problem (at risk).
Processing time for procurement contracts (≥$10 million)
Refers to the average number of days from the date of the first receipt of draft bidding document by ADB to the contract signing. Covers all contracts signed during the year.
Procurement time (from receipt of bid evaluation report [BER] to ADB’s approval)
Refers to the average number of days from the date of the first receipt of BER to ADB’s approval of the BER. It includes the time spent for any clarification and revision needed to finalize evaluation of BER.
S-curve The project S-curve shows the project contract award and disbursement over its life and is a useful graphical presentation of project performance.
Single-stage, one-envelope bidding procedure
Bidders submit bids in one envelope containing both the price proposal and the technical proposal. The envelopes are opened in public at the date and time advised in the bidding document. The bids are evaluated and, following ADB approval, the contract is awarded to the bidder whose bid has been determined to be the lowest evaluated substantially responsive bid.
Single-stage, two-envelope bidding procedure
Bidders submit two sealed envelopes simultaneously, one containing the technical proposal and the other the price proposal. These are enclosed together in an outer single envelope.
Initially, only the technical proposals are opened at the date and time advised in the bidding document; the price proposals remain sealed and are held in custody by the purchaser. The technical proposals are evaluated by the purchaser. No amendments or changes to the technical proposals are permitted.
Following ADB approval of the technical evaluation and at a date and time advised by the purchaser, the price proposals are opened in public. The price proposals are evaluated and following ADB approval of the price evaluation, the contract is awarded to the bidder whose bid has been determined to be the lowest substantially responsive bid.
Appendix 4 45
Special funds Asian Development Fund, Technical Assistance Special Fund, Japan Special Fund, Asian Tsunami Fund, Pakistan Earthquake Fund, Regional Cooperation and Integration Fund, Climate Change Fund, Asia Pacific Disaster Response Fund, and Asian Development Bank Institute Special Fund.
Terminated Refers to amount of products approved but terminated prior to signing of agreement
Tranche (MFF) Loan, grant, guarantee, or ADB-administered cofinancing for a project or a component under an MFF.
Two-stage, two-envelope bidding procedure
In the first stage, bidders submit two sealed envelopes simultaneously, one containing the technical proposal and the other the price proposal. These are enclosed together in an outer single envelope.
Only the technical proposals are opened at the date and time advised in the bidding document; the price proposals remain sealed and are held in custody by the purchaser. The technical proposals are evaluated. If the purchaser requires amendments or changes to the technical proposals, such amendments and changes are discussed with the bidders. The bidders are allowed to revise or adjust their technical proposals to meet the requirements of the purchaser.
Following ADB approval of the evaluation of the technical proposals, bidders are invited at the second stage to submit modified bid proposals consisting of revised technical proposals and supplementary price proposals based on the technical standard agreed.
The original price proposals and the modified bid proposals are opened at a date and time advised by the purchaser. In setting the date, the purchaser will allow sufficient time for the bidders to incorporate the changes in the revised technical proposals that are needed to meet the agreed technical standard and to prepare the supplementary price proposals that reflect these changes.
The price proposals, supplementary price proposals, and revised technical proposals are evaluated; and, following ADB approval, the contract is awarded to the bidder whose bid is determined to be the lowest substantially responsive bid.
Two-stage bidding procedure
Bidders first submit their technical proposals, in accordance with the specifications, but without prices.
The technical proposals are opened at the date and time advised in the bidding document. The technical proposals are evaluated and discussed with the bidders.

46 Appendix 4
Any deficiencies, extraneous provisions, and unsatisfactory technical features are pointed out to the bidders, whose comments are carefully evaluated. The bidders are allowed to revise or adjust their technical proposals to meet the requirements of the purchaser.
After ADB has approved the evaluation of the technical proposals, the second stage is to invite bidders to submit price proposals and revised technical proposals in compliance with the acceptable technical standard. The revised technical proposals and price proposals are opened in public at a date and time advised by the purchaser.
In setting the date, the purchaser should allow sufficient time for bidders to incorporate the changes involved in the technical proposals and prepare price proposals.
The price proposals and revised technical proposals are evaluated. Following ADB approval, the contract is awarded to the bidder whose bid has been determined to be the lowest substantially responsive bid.
Uncontracted balance Amount available for contract awards at the end of the year for active project loans and grants.
Uncontracted percentage Uncontracted balance as a percentage of the total value to be awarded.
Undisbursed balance Amount available for disbursement at the end of the year for active project loans and grants.
Undisbursed percentage Undisbursed balance as a percentage of the net loan or grant amount

Appendix 5 47
NONSOVEREIGN OPERATIONS GLOSSARY
Approvals An investment approved by the Board of Directors of the Asian
Development Bank (ADB). B-loan A loan made by ADB funded by a third party or parties without the
borrower or third parties having any recourse to ADB. It involves the prearranged transfer to commercial lenders of participation in an ADB complementary loan, but without credit recourse to ADB for debt service. ADB is the lender-of-record as the B-loan is made in the name of ADB.
Book value (of an equity) Historical cost adjusted for gains and losses recognized through the income statement. For cost method equities and equity method equities, this is the carrying value. For fair value method equities (listed equities), this is the historical cost.
Cancellation Undisbursed, committed balance of an equity investment, loan, or guarantee canceled by the mutual consent of ADB and an investee company.
Carrying value (of an equity)
Value at which an equity is carried on the balance sheet. The carrying value depends on the accounting method used (cost method, equity method, market value method, or fair value method).
Closed-out loan
Loans that are fully repaid or prepaid.
Collective loss allowance An allowance for existing probable losses resulting from risks that cannot be identified with specific investments. Also called “unallocated allowance.”
Commitment An investment approved by ADB’s Board of Directors for which the investment agreement has been signed by the investee company and ADB.
Compulsory convertible debenture (CCD)
Is a debt security that, at a given point in time, must be converted into equity shares of the issuer of the debt security.
Debt Security A traded instrument that can be bought or sold between two parties. A debt security represents borrowed funds that must be repaid by the borrower to the holder of the debt security. It includes government bonds, corporate bonds, municipal bonds, preferred stock, and collateralized securities.
Default status A loan in default is a loan on which payments (principal, interest, or
fees) are overdue by more than 1 day.
48 Appendix 5
Direct value-added commercial cofinancing
Cofinancing with contractual or collaborative arrangements between ADB and financing partners. Direct value-added commercial cofinancing includes b-loans, parallel loans, parallel equities, Trade Finance Program cofinancing, guarantee cofinancing, and risk transfer.
Droppage An investment approved by ADB’s Board of Directors but failed to become a signed agreement.
Equity A security representing an ownership in a corporation. Equity income Income from equity investments, including dividends and realized
and unrealized capital gains and/or losses.
Fair value (of an equity) Current market value (i.e., realizable sales value) of an equity. For a listed and liquid equity, this is the current market price on a public exchange. For an unlisted equity and listed but illiquid equity, this is an estimate of realizable sales value based on valuation methods.
Guarantee A formal pledge to pay a borrower’s debt (in part or in full) in the
case of default by the borrower.
Impairment status A loan in impairment status is a loan with a probable loss against which a specific loan loss allowance has been established.
Internal rate of return A measure of an investment’s financial performance over the entire holding period. The internal rate of return takes into account both the amount and timing of disbursements and cash receipts. In the case of an outstanding equity investment, an estimated valuation of the investment is included as an element in calculating the internal rate of return.
Listed Equities Equity investment in a company whose shares are traded on a public exchange.
Loan loss provision The charge against income that is the net result of increases and decreases in loan loss allowances on specific investments, plus the increase or decrease in collective loan loss allowance
Loss allowance The accumulation of charges to income made to accommodate significant and relatively permanent declines in the value of specific investments (specific loss allowances) and to cover portfolio risks that cannot be identified with specific investments (collective loss allowance).
Nonaccrual status Transactions in arrears for more than 180 days where ADB recognizes interest income on a cash basis and no longer on an accrual basis.

Appendix 5 49
Non-accruing A loan on which interest and/or principal is overdue more than 180 days and for which interest income is recognized on a cash received basis.
Outstanding guarantee A committed guarantee for which the underlying instrument has been issued and that is earning fees for the risks being guaranteed. Also called an “executed guarantee.”
Pooled internal rate of return
Is the internal rate of return of a group of equities calculated by pooling the cash flows.
Prepaid loan A loan paid in full ahead of the original amortization schedule.
Private equity Equity investment in a company whose shares are not traded on a public exchange.
Rate of return (portfolio) Portfolio income, representing total income before imputed cost of funds or capital divided by the average outstanding portfolio for the year (calculated either before or after specific loan loss provisions and charges, impairment losses, and charges and expenses).
Restructuring (of a loan) Significant change in loan agreement terms as a result of a financial restructuring. Changes may involve change in the amortization period or change in interest rate, waiving of overdue interest and charges, partial write-off of principal, or conversion into equity.
Risk rating A rating that indicates the risk that a borrower may default. An ADB rating of 1 (>A-) indicates the lowest risk and 14 (default) the highest risk.
Risk transfer
The debt service risk of a borrower is off-loaded through a risk participation agreement with a third party. The third party effectively guarantees the debt service. Hence, the risk becomes the credit risk of the third party.
Total committed portfolio Committed (disbursed and undisbursed) loans, debt securities, and equity investments net of repayments, prepayments, sales, and cancellations.
Undisbursed portfolio Committed but not yet disbursed loan and equity investments. Weighted average risk rating
Average risk rating weighted by exposure (outstanding or outstanding net of risk transfer).
Write-off An accounting procedure used when an asset is determined to be uncollectible, considered to be a loss and taken off the balance sheet.