2016 annual report - pakgulfleasing.com report 2016.pdf · national bank of pakistan silkbank...
TRANSCRIPT

Pak-Gulf Leasing Company Limited
ANNUAL REPORT2016


CONTENTS
Company Information
Mission Statement
Notice of Annual General Meeting
Directors� Report to the Shareholders
Directors� Report to the Shareholders (Urdu)
Statement of compliance with the Code of Corporate Governance
Auditors� review report to members on Statement of Compliance with
the best practices of the Code of Corporate Governance
Shariah Advisory Report
Auditors� Report to the members
Balance Sheet
Profit and Loss Account
Statement of Comprehensive Income
Cash Flow Statement
Statement of Changes in Equity
Notes to the Accounts
Pattern of Shareholding
Categories of Shareholders
Proxy Form
.......................................................................... 1
2
3
6
28
29
31
32
33
34
35
36
37
38
39
76
77
...............................................................................
........................................................
..................................................
.......
..................
.....................................................................
.........................................................
....................................................................................
.....................................................................
..................................................
..........................................................................
..........................................................
........................................................................
.....................................................................
................................................................
.......................................

1
Board of Directors
Mr. Sohail Inam Ellahi
Brig. Naveed Nasar Khan (Retd.)
Mr. Shaheed H. Gaylani
Mr. Fawad Salim Malik
Mr. Pervez Inam
Mr. Rizwan Humayun
Lt. Col. Saleem Ahmed Zafar (Retd.)
Mr. Ismail H. Ahmed
Mr. Mahfuz-ur-Rehman Pasha
Chairman
Vice Chairman
Director
Director
Director
Director
Executive Director
Director
Chief Executive Officer
Auditors
M/s. BDO Ebrahim & Co.
Chartered Accountants
2nd Floor, Block C Lakson Square Building No. 1
Sarwar Shaheed Road
Karachi-74200.
COMPANY INFORMATION
BankersIslamic Banks
Albaraka Bank (Pakistan) Limited
Conventional Banks
Askari Commercial Bank Limited
Bank Al-Falah Limited
Bank Al Habib Limited
Bank of Punjab
JS Bank Limited
MCB Bank Limited
National Bank of Pakistan
Silkbank Limited
Soneri Bank Limited
Company Secretary
Ms. Mehreen Usama
Audit Committee
Mr. Rizwan Humayun
Mr. Ismail H. Ahmed
Brig. Naveed Nasar Khan (Retd.)
Mr. Shaheed H. Gaylani
Mr. Pervez Inam
Chairman
Vice Chairman
Member
Member
Member
Senior Management
Mr. Mahfuz-ur-Rehman Pasha Chief Executive Officer
Mr. Khalil Anwer Hassan Chief Manager
Ms. Farah Farooq Head of Audit
Major Arifullah Lodhi (Retd.) Manager HR &
Administration
Credit Rating Agency
JCR-VIS Credit Rating Company Limited
Entity Rating
A- (Single A Minus) for Medium to Long term
A-2 (A-Two) for Short term
Outlook: Stable
___
Mr. Afzal-ul-Haque Deputy Chief Operating Officer
& Senior Manager Risk
Lt. Col. Saleem Ahmed Zafar(Retd.) Chief Operating Officer
Human Resource & Remuneration Committee
Mr. Pervez Inam
Brig. Naveed Nasar Khan (Retd.)
Mr. Sohail Inam Ellahi
Lt. Col. Saleem Ahmed Zafar (Retd.)
Chairman
Vice Chairman
Member
Member
Legal Advisors
M/s. Mohsin Tayebaly & Company
2nd Floor, Dime Centre,
BC-4, Block # 9, Kehkashan, Clifton,
Karachi.
Tel # : (92-21) 111-682-529
Fax # : 35870240, 35870468
Shariah Advisor
Mufti Muhammad Ibrahim Essa
Ms. Mehreen Usama Chief Financial Officer
Mr. Ayaz Latif Manager IT
Registrar / Share Transfer Office
THK Associates (Pvt) Limited
Ground Floor, State Life Building - 3,
Dr. Ziauddin Ahmed Road,
Karachi - 75530
P. O. Box No. 8533.
Tel # : (92-21) 111-000-322
Fax # : (92-21) 35655595
Registered Office
Pak-Gulf Leasing Company Limited
UNIBRO HOUSE
Ground and Mezzanine Floor,
Plot No. 114, 9th East Street, Phase I, DHA
Clifton, P.O.Box # 12215, Karachi-75600.
Tel #: (92-21) 35820301, 35820965-6
35824401, 35375986-7
Fax #: (92-21) 35820302, 35375985
E-mail: [email protected]
Website: www.pakgulfleasing.com

Mission Statement
The Company will:
Aim to gain the confidence of all its stakeholders by earning a
credible reputation for being an innovative enterprise that is
prepared to change in the best interests of its stakeholders.
Continually monitor structural changes in the various sectors of
the economy, and accordingly alter the Company�s business
strategy to benefit from the emerging opportunities.
Focus on changing customer needs and strive to improve tangible
and intangible returns to its customers by providing service and
satisfaction at par with the best in the industry, which would be
reflected in prompt risk evaluation and facility disbursement
procedures and practices.
Consciously share, and remain part of all initiatives by the leasing
industry to play a positive role in the evolution of small and
medium-size enterprises to expand the country�s industrial base
and support economic growth, higher employment, and a better
future for all.
2
3
NOTICE OFANNUAL GENERAL MEETING
Notice is hereby given that the 23 Annual General Meeting of Pak-Gulf Leasing Company Limited
will be held at the Company's Registered Office, UNIBRO House, Ground and Mezzanine Floor, Plot
No. 114, 9th East Street, Phase I DHA, Karachi-75500, on Monday, October 24, 2016 at 4:00 p.m.to
transact the following business.
Ordinary Business
1. To read and confirm the minutes of the Extra-Ordinary General Meeting held on April 20, 2016.
2. To receive, consider and adopt the audited financial statements of the Company for the year
ended June 30, 2016 together with Directors� and Auditors' Report thereon.
3. To approve the payment of cash dividend to the shareholders at the rate of Rs. 0.5 per share of
Rs. 10 each for the year ended June 30, 2016.
4. To appoint Auditors for the year 2016-17 and fix their remuneration. The present Auditors
M/s BDO Ebrahim & Co., Chartered Accountants retire and being eligible, offer themselves for
re-appointment.
Any Other Business
5. To transact any other business with the permission of the Chair.
By Order of the Board
Mehreen Usama
Company Secretary
Karachi: October 01, 2016.
Notes:
1. The Register of Members of the Company shall remain closed from October 18, 2016 to October
24, 2016 (both days inclusive).
2. A Member entitled to attend and vote at the Annual General Meeting of Members is entitled to
appoint a proxy to attend and vote on his/her behalf.
3. The instrument appointing a proxy and the power of attorney or other authority under which it is
signed or a notarially certified copy of the power of attorney must be deposited at the registered
office of the Company at least 48 hours before the time of the meeting. A form of proxy is enclosed.
4. CDC account holders will further have to follow the under mentioned guidelines as laid down by
the Securities and Exchange Commission of Pakistan (SECP).
rd
4
NOTICE OFANNUAL GENERAL MEETING
A. For attending the meeting:
(i) In case of individuals, the account holder or sub-account holder and / or the person whose
securities are in group account and their registration details are uploaded as per the regulations,
shall authenticate his/her identity by showing his/her original CNIC or original passport at the
time of attending the meeting.
(ii) In case of corporate entity, the Board of Directors resolution / power of attorney with specimen
signature of the nominees shall be produced (unless it has been provided earlier) at the time of
the Meeting.
B. For appointing proxies:
(i) In case of individuals, the account holder or sub-account holder and/or the person whose securities
are in group account and their registration details are uploaded as per the Regulations, shall
submit the proxy form accordingly.
(ii) The proxy form shall be witnessed by two persons whose names, addresses and CNIC numbers
shall be mentioned on the form.
(iii) Attested copies of CNIC or the passport of the beneficial owners and the proxy shall be furnished
with the proxy form.
(iv) The proxy shall produce his/her original CNIC or original passport at the time of meeting.
(v) In case of corporate entity, the Board of Directors� resolution/power of attorney with specimen
signature shall be submitted (unless it has been provided earlier) along with proxy form to the
Company.
CNIC / NTN
5. The Securities and Exchange Commission of Pakistan (SECP) vide its notification SRO 831(1)/2012
dated 5 July 2012 require that the dividend warrant(s) should bear CNIC number of the registered
member or the authorised person, except in case of minor(s) and corporate members. Accordingly,
members who have not yet submitted copy of their valid CNIC or NTN (in case of corporate
entities) are requested to submit the same to the Company�s Share Registrar. In case of non-
compliance, the Company may withhold dispatch of dividend warrants under intimation to regulator
till such time they provide the valid copy of their CNIC as per law.
Filer and Non-Filer Status
6. Pursuant to the provisions of Finance Act, 2016 effective 1 July 2016, deduction of income tax
from dividend payments shall be made on the basis of filers and non-filers as follows:
� For filers of income tax returns 12.5%
� For non-filers of income tax returns 20%
Income Tax will be deducted on the basis of Active Tax Payers List posted on the Federal Board
of Revenue website. Members seeking exemption from deduction of income tax or are eligible
for deduction at a reduced rate are requested to submit a valid tax certificate or necessary
documentary evidence, as the case may be.
The shareholders who have joint shareholdings held by Filers and Non-Filers shall be dealt with
separately and in such particular situation, each account holder is to be treated as either a Filer
or a Non-Filer and tax will be deducted according to his shareholding. If the share is not
ascertainable then each account holder will be assumed to hold equal proportion of shares and
the deduction will be made accordingly. Therefore, in order to avoid deduction of tax at a higher
rate, the joint account holders are requested to provide the below details of their shareholding
to the Share Registrar of the Company latest by the AGM date.
7. Shareholders are requested to notify change of their addresses, if any immediately.
5
NOTICE OFANNUAL GENERAL MEETING

6
Dear Shareholders,
Your directors are pleased to present the 23 Annual Report of Pak-Gulf Leasing Company Limited
(PGL), including financial statements and the Auditors� Report, for the year ended June 30, 2016.
OPERATIONAL OVERVIEW
Notwithstanding the restrictive operational environment, under which your Company was required to
perform during the financial year under review, PGL�s growth could easily be termed as fairly impressive.
During the year under review, your Company maintained the prudent and well tested policy of
undertaking repeat business with some of PGL�s most consistently performing and well established
lessees, adding at the same time a few fresh client relationships having a good market standing.
Wherever the quantum of exposure to a lessee necessitated mitigation of risk, additional collateral
securities were obtained from the lessees, other than those covered by the assets being leased. This
approach to beefing up the underlying security package for assets based financing is unique to your
Company as most leasing companies in the market choose to restrict the security for leasing finance
only to the relative assets being leased.
New business relationships are considered by PGL, by taking into account the related financials of
the prospective lessee, its market reputation and historical track record, in addition to other risk
evaluation factors justifying the viability of the financing proposition offered to the Company. All
approvals are subject to an independent survey and valuation of the assets to be leased.
It has been a cornerstone of PGL�s fund management policy to rely on internally generated financial
resource for funding the Company�s business. Consequently, your Company lays great emphasis on
timely and regular repayments from the lessees under all leasing commitments. It is a matter of pride
to state that your Company for the past couple of years has been reporting an extraordinary Recovery
Rate. For the year under review this Rate was 98.7%.
The exceptionally high growth in business, during FY-2016, despite the outstanding performance with
respect to lease rental payments, required your Company to finance its increased business through
Short Term Borrowings from commercial banks, in addition to heavily relying on subvention on the
part of the Sponsors of PGL in the form of their enhanced investment in the Company�s CoI Scheme,
besides a short term clean placement from an Associated Undertaking. The Sponsors of your Company
must be thanked, for their timely contribution to meet the Company�s funding requirements and for
the trust and confidence reposed by them in the management of your Company�s affairs.
ANALYSIS OF PGL�s OPERATIONAL AND FINANCIAL PERFORMANCE IN FY-2016
Leases and Ijarah Written
80 new leases (inclusive of Shariah-compliant Ijarahs) of Rs. 901.15 million were written, during FY-
2016, as compared to 51 leases of Rs. 710.10 million in the FY-2015, translating into a growth of
26.89% in the lease portfolio. Shariah-compliant Ijarah, a product which was introduced by PGL
towards the end of the Financial Year 2013 (FY-2013), amounted to a total of three (03) Ijarahs of Rs.
56.19 million written in FY-2016 (FY-2015: Rs. 39.21 million). Each Ijarah requires the approval of
your Company�s Shariah Adviser, who has been appointed from an Approved Panel of Advisers notified
by the SECP and the NBFIs & Modaraba Association of Pakistan. The growth in Leases written by
your Company, over the past 6 years, is shown by the following Chart:
DIRECTORS� REPORTTO THE SHAREHOLDERS
rd
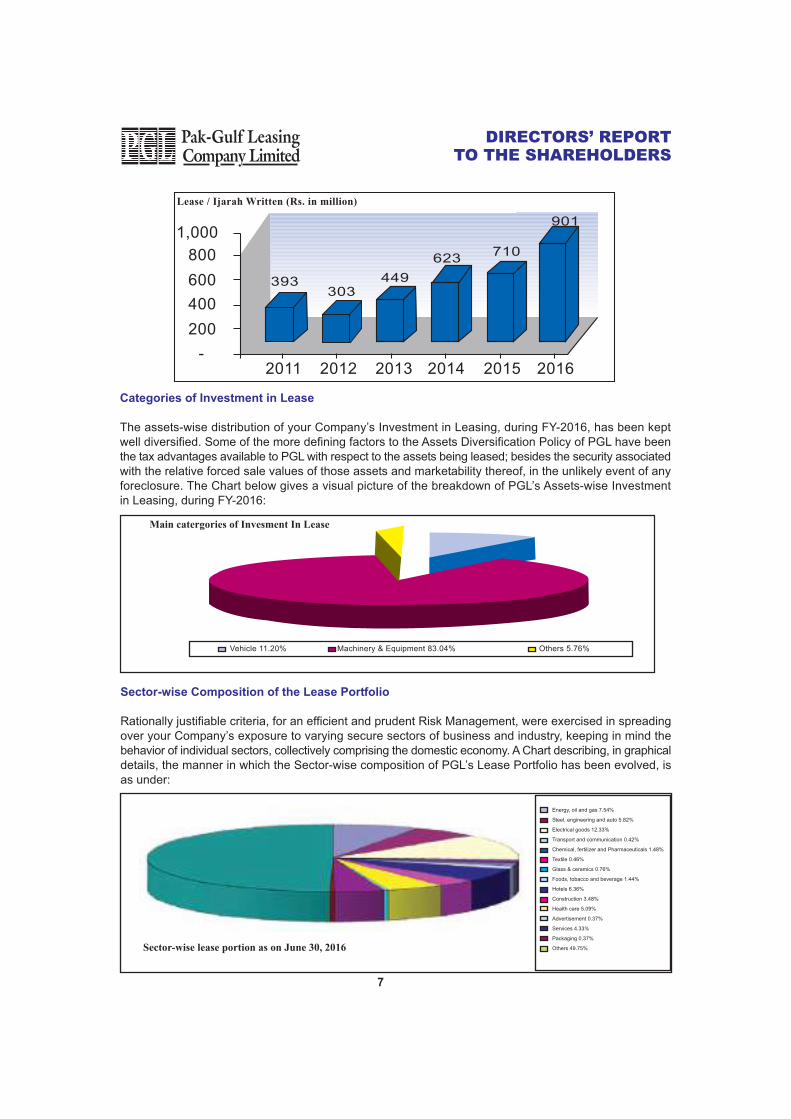
Sector-wise Composition of the Lease Portfolio
Rationally justifiable criteria, for an efficient and prudent Risk Management, were exercised in spreading
over your Company�s exposure to varying secure sectors of business and industry, keeping in mind the
behavior of individual sectors, collectively comprising the domestic economy. A Chart describing, in graphical
details, the manner in which the Sector-wise composition of PGL�s Lease Portfolio has been evolved, is
as under:
DIRECTORS� REPORTTO THE SHAREHOLDERS
Categories of Investment in Lease
The assets-wise distribution of your Company�s Investment in Leasing, during FY-2016, has been kept
well diversified. Some of the more defining factors to the Assets Diversification Policy of PGL have been
the tax advantages available to PGL with respect to the assets being leased; besides the security associated
with the relative forced sale values of those assets and marketability thereof, in the unlikely event of any
foreclosure. The Chart below gives a visual picture of the breakdown of PGL�s Assets-wise Investment
in Leasing, during FY-2016:
7
Sector-wise lease portion as on June 30, 2016
Energy, oil and gas 7.54%
Steel, engineering and auto 5.82%
Electrical goods 12.33%
Transport and communication 0.42%
Chemical, fertilizer and Pharmaceuticals 1.48%
Textile 0.46%
Glass & ceramics 0.76%
Foods, tobacco and beverage 1.44%
Hotels 6.36%
Construction 3.48%
Health care 5.09%
Advertisement 0.37%
Services 4.33%
Packaging 0.37%
Others 49.75%
800
600
400
200
2011 2012 2013 2014 2015 2016
Lease / Ijarah Written (Rs. in million)
1,000
-
393303
449
623710
901
Main catergories of Invesment In Lease
Vehicle 11.20% Machinery & Equipment 83.04% Others 5.76%

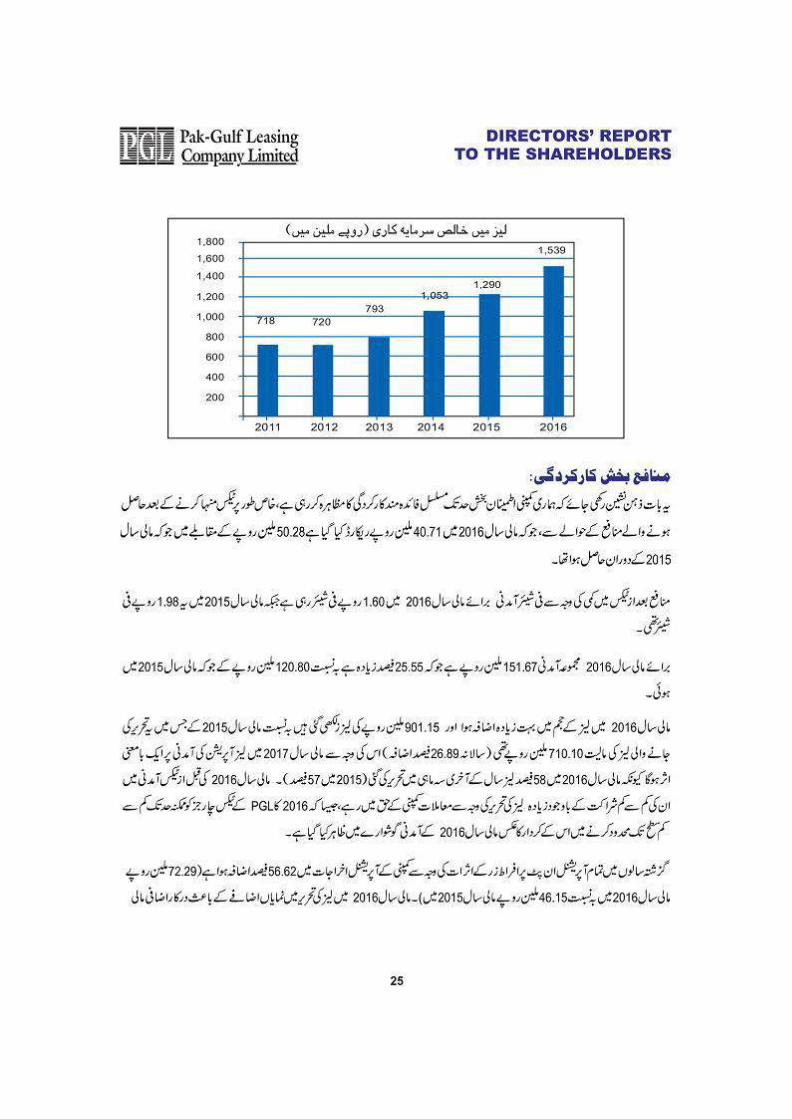
Gross Investment in Leases, stood at Rs. 1,710 million as on June 30, 2016 (FY-2015: Rs. 1,453 million),
representing a year-on-year increase of 17.73% (FY-2015: 20.69%). Net Investment in Leases, after
deduction of Unearned Income (Rs. 170.60 million), Mark-up held in Suspense (Rs. 0.11 million) and a
Provision for Potential Lease Losses (Rs. 0.88 million), amounted to Rs. 1,538.65 million at the end of
FY-2016, showing an increase of 19.32% over the previous year�s corresponding figure of Rs. 1,289.56
million as at June 30, 2015. The Net Investment in Leases of the Company during the last six (6) years
is shown in the Chart below:
8
DIRECTORS� REPORTTO THE SHAREHOLDERS
Profitability Performance
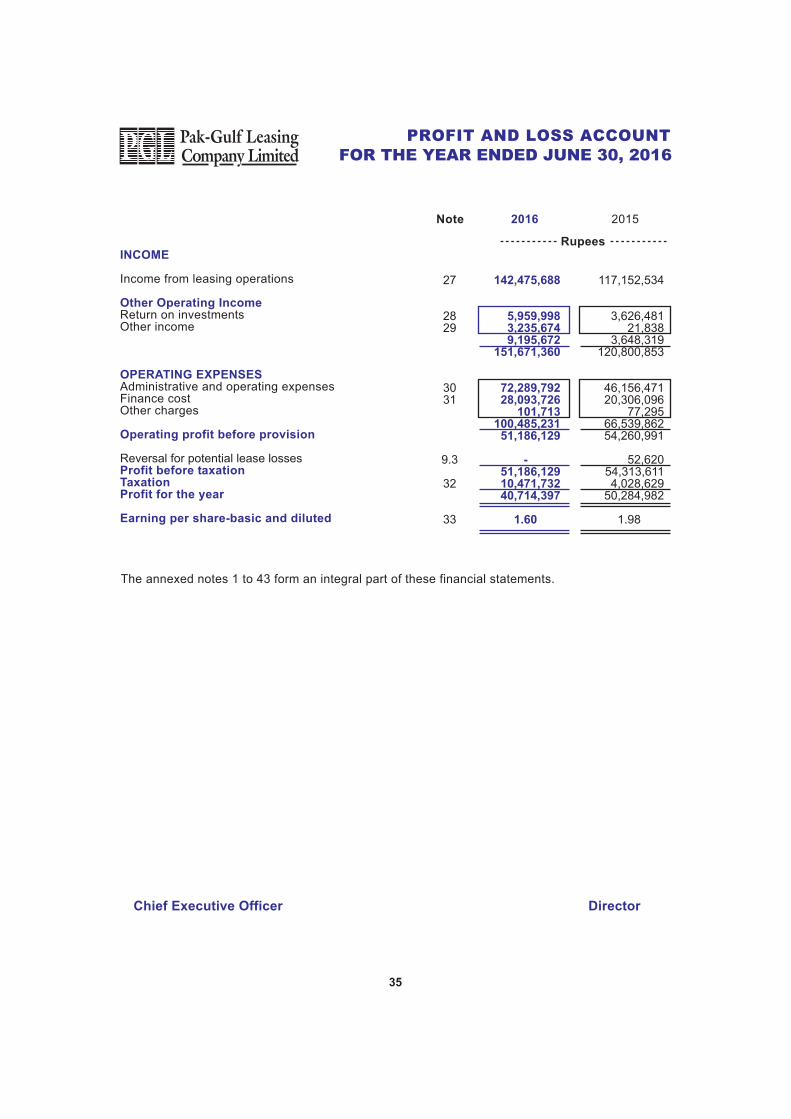
It is noted with satisfaction that your Company has been consistent with its profitability performance,
specifically with respect to its After-Tax-Profit which, for the Financial Year 2016, was recorded at Rs.
40.71 million, as against Rs. 50.28 million, attained during the corresponding period last year FY-2015.
EPS for FY-2016 due to the decrease in profit after tax for the year has shown a fall to Rs. 1.60, as
compared to Rs. 1.98 for FY-2015.
Gross Revenue for the period under review (FY-2016), was 25.55% higher at Rs. 151.67 million, as
compared to Rs. 120.80 million, for the corresponding period in FY-2015.
Financial Achievements
The Balance Sheet footings, which stood at Rs. 1,500.76 million as on June 30, 2015 as at June 30, 2016
has further increased to Rs. 1,851.17 million. This year-on-year increase of 23.35%, in the Total Assets
of your Company, signifies a remarkable improvement, when compared with the performance of the few
remaining profitable leasing companies, presently operating in Pakistan. The Balance Sheet growth of
PGL is depicted in the following Chart:
1,200
1,000
800
600
400
200
2011 2012 2013 2014 2015 2016
1,400
Net Investment in Leases (Rs. in Million)
1,600
1,800
718 720
793
1,0531,290
1,539
2,000
1500
1000
500
-
Balance Sheet Growth (Rs. in Million)
2011 2012 2013 2014 2015 2016
816850 910
1,2091,500
1,851
9
DIRECTORS� REPORTTO THE SHAREHOLDERS
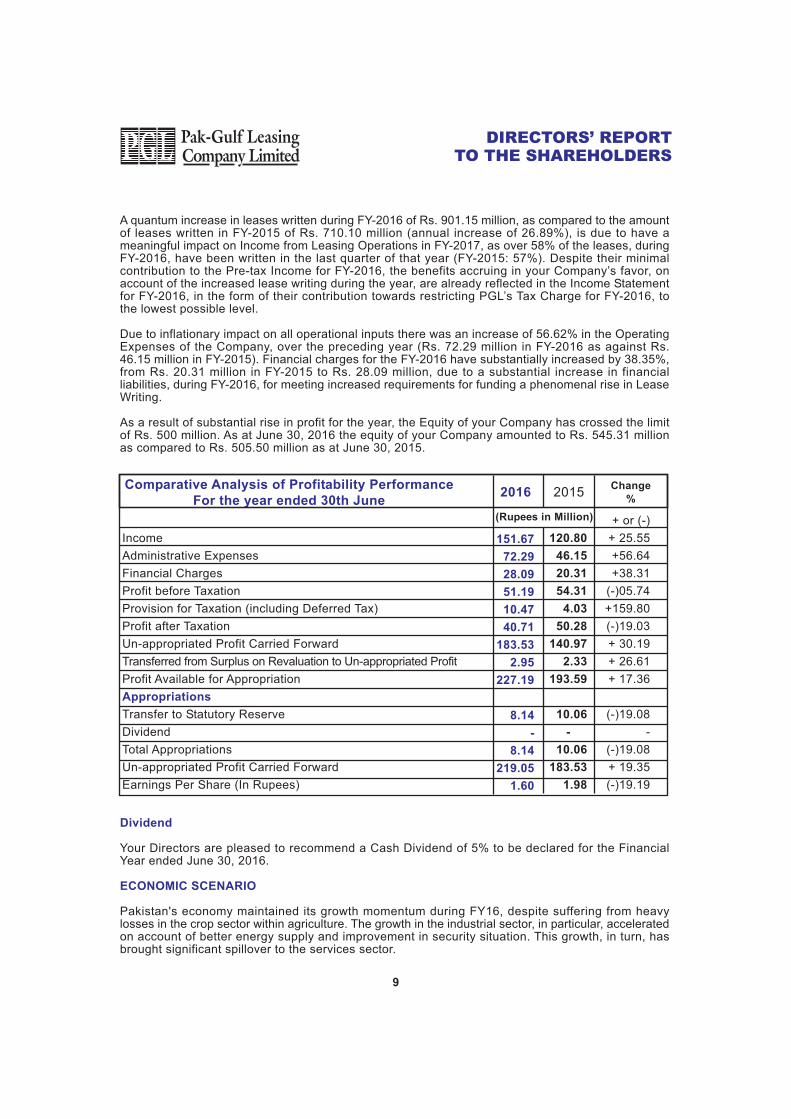
A quantum increase in leases written during FY-2016 of Rs. 901.15 million, as compared to the amountof leases written in FY-2015 of Rs. 710.10 million (annual increase of 26.89%), is due to have ameaningful impact on Income from Leasing Operations in FY-2017, as over 58% of the leases, duringFY-2016, have been written in the last quarter of that year (FY-2015: 57%). Despite their minimalcontribution to the Pre-tax Income for FY-2016, the benefits accruing in your Company�s favor, onaccount of the increased lease writing during the year, are already reflected in the Income Statementfor FY-2016, in the form of their contribution towards restricting PGL�s Tax Charge for FY-2016, tothe lowest possible level.
Due to inflationary impact on all operational inputs there was an increase of 56.62% in the OperatingExpenses of the Company, over the preceding year (Rs. 72.29 million in FY-2016 as against Rs.46.15 million in FY-2015). Financial charges for the FY-2016 have substantially increased by 38.35%,from Rs. 20.31 million in FY-2015 to Rs. 28.09 million, due to a substantial increase in financialliabilities, during FY-2016, for meeting increased requirements for funding a phenomenal rise in LeaseWriting.
As a result of substantial rise in profit for the year, the Equity of your Company has crossed the limitof Rs. 500 million. As at June 30, 2016 the equity of your Company amounted to Rs. 545.31 millionas compared to Rs. 505.50 million as at June 30, 2015.
(Rupees in Million)
Income
Administrative Expenses
Financial Charges
Profit before Taxation
Provision for Taxation (including Deferred Tax)
Profit after Taxation
Un-appropriated Profit Carried Forward
Transferred from Surplus on Revaluation to Un-appropriated Profit
Profit Available for Appropriation
Appropriations
Transfer to Statutory Reserve
Dividend
Total Appropriations
Un-appropriated Profit Carried Forward
Earnings Per Share (In Rupees)
2016
151.67
72.29
28.09
51.19
10.47
40.71
183.53
2.95
227.19
8.14
-
8.14
219.05
1.60
Comparative Analysis of Profitability Performance
For the year ended 30th June2015
120.80
46.15
20.31
54.31
4.03
50.28
140.97
2.33
193.59
10.06
-
10.06
183.53
1.98
Change
%
+ or (-)
+ 25.55
+56.64
+38.31
(-)05.74
+159.80
(-)19.03
+ 30.19
+ 26.61
+ 17.36
(-)19.08
-
(-)19.08
+ 19.35
(-)19.19
Dividend
Your Directors are pleased to recommend a Cash Dividend of 5% to be declared for the FinancialYear ended June 30, 2016.
ECONOMIC SCENARIO
Pakistan's economy maintained its growth momentum during FY16, despite suffering from heavylosses in the crop sector within agriculture. The growth in the industrial sector, in particular, acceleratedon account of better energy supply and improvement in security situation. This growth, in turn, hasbrought significant spillover to the services sector.

10
DIRECTORS� REPORTTO THE SHAREHOLDERS
Other key macro-economic indicators also improved during FY16 as compared to the correspondingperiod of last year: fiscal deficit was contained at lower level than the last year; exchange rate remainedstable in general; and FX reserves continued to increase. Some of these developments were due tosubdued commodity prices (particularly oil) in the global market.
Policy support also played a key role in improving macro fundamentals: expansionary monetary policyfor the last one and a half year, and development focus of fiscal spending (particularly on infrastructureprojects which also encouraged construction and related activities). Besides introducing sector specificpolicy initiatives, the government also ensured better energy management; for instance, LNG importsallowed adequate gas availability for fertilizer and other industries. Finally, the initiatives under China-Pakistan Economic Corridor (CPEC) not only attracted foreign direct investment (FDI), but also helpedin reviving the confidence of local businesses.
Having said this, some challenges still exist for the economy. Investment rate continues to remainlow, whereas the non-CPEC FDI has not picked up the pace. The tax base stays narrow, despitestop-gap measures by the government to increase tax revenues. Furthermore, low commodity prices(and continued slowdown in the global economy) have also had an adverse impact on some sectorsof the economy. For example, exports have continued to show weakness, and remittance growth isalso slowing down. Nonetheless, current FX reserves have reached their historic high, which wouldhelp the country in achieving high and sustained growth going forward. But this needs to besupplemented by deep rooted structural reforms so that the recent improvement in macro fundamentalscan be sustained.
Leasing Companies which, for several years until 2007, had fueled the demands of the consumerand the industrial sectors, as members of the quasi-banking sector in the form of NBFIs, have beenleft high and dry, with respect to liquidity, by the rising capital adequacy requirements, enforced bythe regulators, the unwillingness of commercial banks to lend a helping hand by providing credit atacceptable terms and the escalating cost of doing business. The general downturn in the economyhaving hit hard the lease finance servicing capability of their customers, the very viability of the leasingcompanies has been rendered doubtful. A good majority of the smaller leasing companies have eitheropted for mergers with stronger financial institutions, or have taken the path of closing down theirdoors to customers by choosing voluntary liquidation. Currently there are only a few leasing companiesoperating in Pakistan which are also finding it hard to survive due to competition from the banks andtax disadvantages in the form of imposition of Alternate Corporate Tax (ACT) on accounting incomeby Federal Government and sales tax on I jarah Income by Provincial Government.
During the year Securities & Exchange Corporation of Pakistan (SECP) has issued amended NBFCand Notified Entities Regulations, 2008 and NBFC (Establishment and Regulation) Rules, 2003, themajor amendment of which relating to leasing companies is reduction of minimum equity requirementfrom Rs.700 million to Rs. 500 million for existing deposit taking leasing companies and Rs. 50 millionfor non-deposit taking leasing companies.
Further to the reduction in Minimum equity requirement notified through amended NBFC Regulationssome preferential Tax Reforms are also needed for the Leasing Sector per se, to reduce the incidenceof Taxation for making Leasing Companies as viable as Banks and Modarabas.
PGL would need to closely watch and constantly monitor the emerging position of the economy foryour Company to withstand the pressures caused by the situation taking an adverse turn. Cautionhas been the hall mark of PGL, throughout its operations, over the years. The Company might needto exercise this attribute to the maximum extent in the period to come.
11
DIRECTORS� REPORTTO THE SHAREHOLDERS
FUTURE PROSPECTS
Assets-backed financing, particularly Leasing, relies heavily on the ability of the borrowers�/lessees�cash flow generation capacity to ensure prompt and punctual servicing of their respective liabilities.None of the financial institutions is in the business, either of initiating foreclosures, or managing thebusinesses of its defaulting borrowers.
A sound economic environment is a must for any business to prosper and progress. All businessesmust have the ability to enjoy adequate profit margins, leaving them with enough room, in terms ofliquidity needed to promptly and punctually honor their repayment commitments, towards their lendersor financiers. For the present at least, the capacity of businesses to service their debts is impairedby diminishing profit margins, resulting from an escalating cost of inputs and direct or indirect taxation.
Lack of support from commercial banks in advancing credit to the Private Sector is further erodingthe propensity of businesses for undertaking much needed initiatives for improving their efficiencyand output. This scenario is leading more and more entrepreneurs to seek financial support throughleasing transactions, which are relatively expensive to afford, but do carry the advantage of some taxbenefits for the lessees.
Leasing companies are now faced with the situation of an increase, in terms both in the number ofprospective lessees, as well as the quantum of their financial demands. At the same time, thesecompanies are finding the commercial banks increasingly shy in supporting them with the requiredamount of l iquidity for funding the quantitat ive rise in demand for leasing f inance.
Moreover, using the increasing rate of return on their substantial investment in Government Securities,as the benchmark, the Spread being demanded by commercial banks for lending to leasing companies,has always been kept on a much higher side. To make matter worse, the lending banks are alsolooking for collateral securities, before undertaking any credit commitment for the Leasing Sector.Leasing companies are, therefore, faced with the dilemma of having to raise funds on tougher termsand at higher interest rates for financing the requirements of their lessees at rates, which might makeit difficult for such lessees to afford.
To further compound the problems for the Leasing Companies, commercial banks (particularly, IslamicBanks or Islamic Banking Divisions of commercial banks) have become exceedingly active in offeringthe Islamic equivalent mode of leasing namely, Ijarah to the public. With their low cost of funds, suchbanks can write leases at rates, which are hard to match by the leasing companies. The situation iscompounded by Modarabas, which enjoy an almost Tax Free Status, also serving as tough competitorsto the leasing companies.
A leasing company is required to maintain, at all times, minimum equity of Rs. 500 million which isbeing met by the Company.
Taxation
The Federal Board of Revenue (FBR), despite a number of representations made by your Company,even at the level of the Finance Minister, has remained oblivious to the predicaments of the LeasingSector, as a whole, with respect particularly to privately-owned leasing companies. Leasing is allabout Tax Management. In the absence of an enabling and conducive taxation regime, it is almostimpossible for a leasing company to maintain its profitability profile.
Two adverse tax measures have been undertaken by the FBR from the standpoint of leasing companies.To begin with Initial Depreciation Allowance admissible for a first time use of assets in Pakistan hasbeen halved to 25% from the originally available rate of 50%. This has, in one sharp blow, curtailedthe ability of leasing companies to enjoy temporary Tax Losses arising from Depreciation on leasedassets, thereby reducing their appetite for financing larger amounts of Plant & Equipment.
12
DIRECTORS� REPORTTO THE SHAREHOLDERS
The second discouraging step taken under The Federal Finance Act 2014 was the introduction of anAlternate Corporate Tax (ACT) at 17%, which has been retrospectively applied on Accounting Income,starting from current Tax Year 2014. This has increased the tax burden on leasing companies, ascompared to other financial institutions engaged in a similar business activity, such as banks andmodarabas. Your Company has filed a Constitutional Petition in Sindh High Court against the impositionof ACT, and the Honorable Court has granted an injunction against application of ACT on PGL. It ishoped, that PGL would be exempted from a levying of this Tax, as a result of the Company�s Petition.
Further, the Assistant Commissioner of the Sindh Revenue Board vide Order 551 of 2016 dated 15June 2016 has charged Sales Tax on gross amount of Ijarah Rental declared by PGL in its auditedfinancial statements for Tax Year 2015, Tax Year 2014 and Tax Year 2013 as Income from Ijarahoperations as per the requirements of IFAS 2 Ijarah under certain provisions of the Sindh Sales TaxAct, 2011 and Sindh Sales Tax Rules, 2011. Against the Order an appeal has been filed by PGL beforethe learned Commissioner (Appeals) the hearing of which was held on 31 August 2016 and the caseis again fixed for hearing on 30 September 2016. Constitutional Petition has also been filed in theHonorable Sindh High Court on 30 August 2016 and stay against demand has been granted by theHonorable Court. As demand created by the SRB is unrealistic and much more than the profit earnedby PGL on Ijarah operations therefore the Board of Directors in their meeting held on 20 April 2015has decided not to further engage in Ijarah financing. If this state of affairs persists sooner or later,banks and other NBFIs would also disengage from Ijarah financing and this would be a serious setbackfor the Islamic finance.
CORPORATE GOVERNANCE
Your Company has fully implemented the "The Code of Corporate Governance" (the 'Code') in bothletter and spirit. The Review Report of the External Auditors to the Members, represented by theStatements in Compliance with the Best Practices of the Code of Corporate Governance, is appendedto this Report.
Board of Directors
Air Marshal Syed Masood Hatif (Retd) had tendered his resignation from the directorship of theCompany with effect from 11 January 2016. The services rendered by Air Marshal Syed Masood Hatif(Retd) for the wellbeing of the Company and its employees, and the contribution made by him in theprogression of the Company will always be remembered.
To fill in the casual vacancy created on Board by resignation of Air Marshal Syed Masood Hatif (Retd),the Board members with consensus and approval of SECP co-opted Mr. Ismail H. Ahmed as theDirector of the Company for the remaining tenure of the outgoing Director.
The tenure of the Board ended on April 19, 2016. In the Extra-Ordinary General Meeting held on April20, 2016 at the registered office of the Company the shareholders of the Company approved theappointment of the following as the Directors of the Company for the next tenure of three (3) years.
1 Mr. Sohail Inam Ellahi
2 Brigadier (R) Naveed Nasar Khan
3 Mr. Shaheed H Gaylani
4 Mr. Fawad Salim Mailk
5 Mr. Pervez Inam
6 Mr. Rizwan Humayun
7 Lt. Col (R) Saleem Ahmed Zafar
8 Mr. Ismail H. Ahmed

13
DIRECTORS� REPORTTO THE SHAREHOLDERS
Human Resource and Remuneration Committee (HR & RC)
In keeping with the requirements of The Code of Corporate Governance, your directors have reconstitutedthe Human Resource and Remuneration Committee of the Board of Directors of your Company as shownbelow:
S.No. Name of Member Designation
1. Mr. Pervez Inam Chairman2. Brigadier (R) Naveed Nasar Khan Vice Chairman3. Mr. Sohail Inam Ellahi Member4. Mr. Saleem Ahmed Zafar Member
Audit Committee
The Board of Directors, in compliance with the Code of Corporate Governance, has established an AuditCommittee consisting of the following directors. During the year under review four (4) meetings of theAudit Committee were held the meeting wise attendance details of which are given below:
S.No. Name of Member Designation No. of Meetings Attended
1. Mr. Rizwan Humayun Chairman 42. Air Marshal (R) Syed Masood Hatif* Vice Chairman 23. Mr. Ismail H. Ahmed ** Vice Chairman 14. Brigadier (R) Naveed Nasar Khan Member 25. Mr. Shaheed H Gaylani Member 46. Mr. Pervez Inam *** Member 17. Ms. Farah Farooq Secretary 4
* Casual vacancy on January 11, 2016** Co-opted on February 23, 2016*** Appointment as Member of Audit Committee by the Board on February 23, 2016.
Credit Rating
It should be a matter of great satisfaction for the Company�s Shareholders to note, that JCR-VIS, followinga detailed analysis and evaluation of your Company�s performance, on November 27, 2015, re-affirmedthe Company�s Entity Rating; Medium to Long-term Rating at A-, and the Short-term Rating at A-2. TheOutlook for the Company has been marked as Stable.
Auditors
For the FY-2016 M/s. BDO Ebrahim & Co., Chartered Accountants were re-appointed as statutory auditorsafter audit of FY-2015.
The Board of Directors wishes to place, on record, their appreciation for the high standards of professionalism,integrity and ethics maintained by the auditors M/s. BDO Ebrahim & Co., Chartered Accountants.
Acknowledgements
The Board would like to place on record its appreciation for the management team of your Company andeach and every member of its staff for their hard work and dedication, which has been reflected in aconsistently maintained and highly satisfactory performance of your Company, in the challenging economicenvironment. We, the Members of the Board, as representatives of the Shareholders of the Company,assure the management and staff of the Company of our continued support and commitment towardsstrengthening the Company and leading it to maintain its growth and performance. We are confident, thatthe management and the staff will continue to serve the customers of the Company with the same zeal,as demonstrated by them in all the previous years, enabling your Company to further improve its reputationin the financial services sector of Pakistan.

14
DIRECTORS� REPORTTO THE SHAREHOLDERS
The Board also acknowledges the cooperation and guidance extended to the Company by the Securitiesand Exchange Commission of Pakistan (SECP), the State Bank of Pakistan and other regulatory authorities.Their role is critical in developing the Financial Services Sector and we hope that their actions will continueto strengthen this sector. The Board would also like to praise the NBFI�s & Modaraba Association ofPakistan for its assistance and support in professionally safe-guarding your Company�s interest.
At the end, we would like to thank our valued Shareholders, Customers, Bankers, Investors and otherStakeholders for their valuable support during the year. We look forward to reinforcing and building thisrelationship further in the years to come.
Statements in Compliance with the Code of Corporate Governance
The Board of Directors has reviewed the Code of Corporate Governance and confirms the correctnessof the following statements to the best of our knowledge and belief:
� Financial statements prepared by the management of the Pak-Gulf Leasing Company Limited,present fairly its state of affairs, the result of its operations, cash flows and changes in equity.
� Proper books of account of the Company have been maintained.
� Appropriate accounting policies have been consistently applied in preparation of the financialstatements and the accounting estimates presented in the report are based on reasonable andprudent judgment.
� International Financial Reporting Standards, as applicable in Pakistan, have been followed inpreparation of financial statements and any departures there from has been adequately disclosedand explained.
� The system of internal control is sound in design, and has been effectively implemented andmonitored.
� There is no significant doubt upon the Company's ability to continue as a going concern.
� There was no trade in shares of the Company, carried out by its directors, CEO, COO, CFO,Company Secretary, Head of Internal Audit and their spouses and minor children.
� There has been no material departure from best practices of corporate governance, as detailedin the listing regulations.
Pattern of Shareholding
Pattern of Shareholdings, as required by the Code of Corporate Governance, as at June 30, 2016, isappended at the end of this Report.
Significant deviations from the last year, in the operating results, have been highlighted at the beginningof this Report, along with reasons thereof.
* Casual vacancy on January 11, 2016** Co-opted on February 23, 2016
Statutory Payment of Rs. 1,729,221 on account of taxes, duties, levies and/or charges was outstandingagainst the Company as on June 30, 2016.
Value of investments of the Staff Provident Fund stood at Rs. 4,501,061 as at June 30, 2016. Thisrepresents funds placed with a rated commercial bank and investment in the Registered Units of theNational Investment Trust.
Chairman Chief Executive OfficerSeptember 20, 2016Karachi
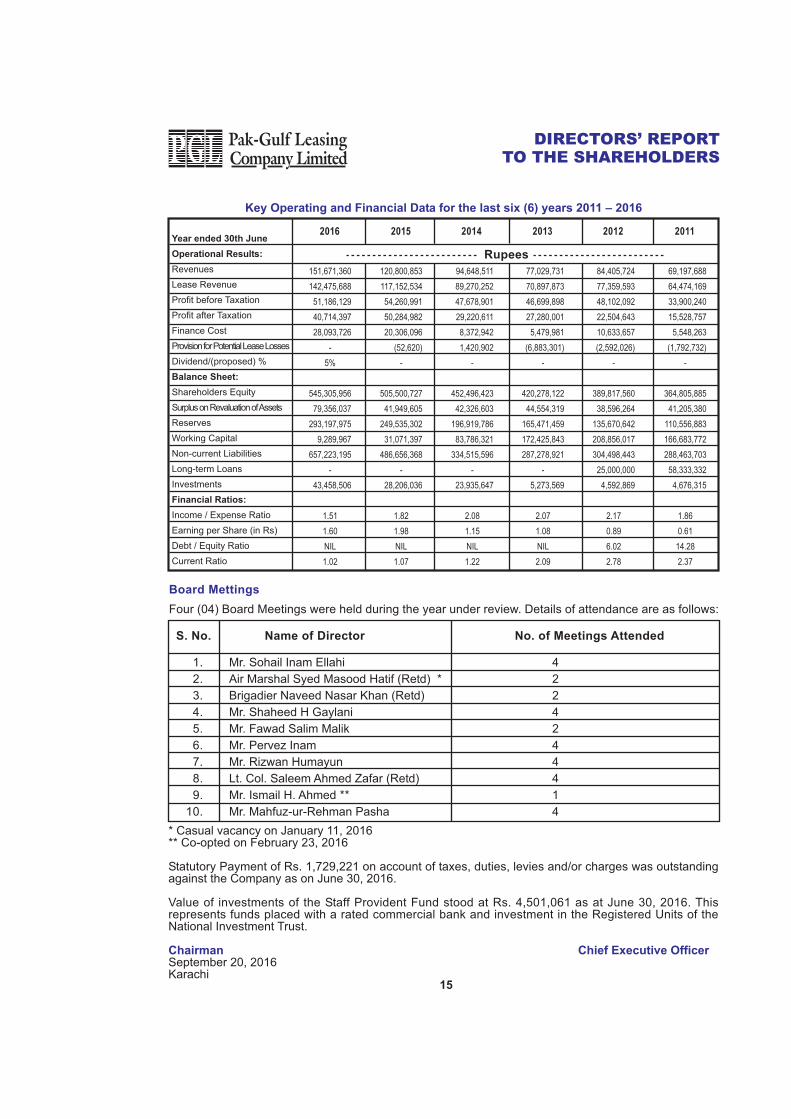
Board Mettings
Four (04) Board Meetings were held during the year under review. Details of attendance are as follows:
4
2
2
4
2
4
4
4
1
4
1.
2.
3.
4.
5.
6.
7.
8.
9.
10.
S. No. Name of Director No. of Meetings Attended
Mr. Sohail Inam Ellahi
Air Marshal Syed Masood Hatif (Retd) *
Brigadier Naveed Nasar Khan (Retd)
Mr. Shaheed H Gaylani
Mr. Fawad Salim Malik
Mr. Pervez Inam
Mr. Rizwan Humayun
Lt. Col. Saleem Ahmed Zafar (Retd)
Mr. Ismail H. Ahmed **
Mr. Mahfuz-ur-Rehman Pasha
120,800,853
117,152,534
54,260,991
50,284,982
20,306,096
(52,620)
-
505,500,727
41,949,605
249,535,302
31,071,397
486,656,368
-
28,206,036
1.82
1.98
NIL
1.07
94,648,511
89,270,252
47,678,901
29,220,611
8,372,942
1,420,902
-
452,496,423
42,326,603
196,919,786
83,786,321
334,515,596
-
23,935,647
2.08
1.15
NIL
1.22
77,029,731
70,897,873
46,699,898
27,280,001
5,479,981
(6,883,301)
-
420,278,122
44,554,319
165,471,459
172,425,843
287,278,921
-
5,273,569
2.07
1.08
NIL
2.09
Key Operating and Financial Data for the last six (6) years 2011 � 2016
Year ended 30th June
Operational Results:
Revenues
Lease Revenue
Profit before Taxation
Profit after Taxation
Finance Cost
Provision for Potential Lease Losses
Dividend/(proposed) %
Balance Sheet:
Shareholders Equity
Surplus on Revaluation of Assets
Reserves
Working Capital
Non-current Liabilities
Long-term Loans
Investments
Financial Ratios:
Income / Expense Ratio
Earning per Share (in Rs)
Debt / Equity Ratio
Current Ratio
20142015 2011
69,197,688
64,474,169
33,900,240
15,528,757
5,548,263
(1,792,732)
-
364,805,885
41,205,380
110,556,883
166,683,772
288,463,703
58,333,332
4,676,315
1.86
0.61
14.28
2.37
20122013
Rupees
151,671,360
142,475,688
51,186,129
40,714,397
28,093,726
-
5%
545,305,956
79,356,037
293,197,975
9,289,967
657,223,195
-
43,458,506
1.51
1.60
NIL
1.02
2016
84,405,724
77,359,593
48,102,092
22,504,643
10,633,657
(2,592,026)
-
389,817,560
38,596,264
135,670,642
208,856,017
304,498,443
25,000,000
4,592,869
2.17
0.89
6.02
2.78
15
DIRECTORS� REPORTTO THE SHAREHOLDERS


This statement is being presented to comply with the Code of Corporate Governance contained inRegulation No. 5.19 of Pakistan Stock Exchange Limited Regulations for the purpose of establishinga framework of good governance, whereby a listed company is managed in compliance with the bestpractices of corporate governance.
The Company has applied the principles contained in the CCG in the following manner:
1. The Company encourages representation of independent non-executive directors and directorsrepresenting minority interests on its Board of Directors. At present the Board includes:
29
STATEMENT OF COMPLIANCE WITH
THE CODE OF CORPORATE GOVERNANCE
FOR THE YEAR ENDED JUNE 30, 2016
*The independent directors meet the criteria of independence under Regulation No. 5.19.1 (b) of thePakistan Stock Exchange Limited Regulations.
2. The Directors have confirmed that none of them is serving as a Director on more than sevenlisted companies, including this Company (excluding the listed subsidiaries of listed holdingcompanies where applicable).
3. All the resident Directors of the Company are registered as taxpayers and none of them hasdefaulted in payment of any loan to a banking Company, a DFI or NBFI or, being a brokerof a stock exchange, has been declared as a defaulter by that stock exchange.
4. During the year casual vacancy occurring on the Board on January 11, 2016 was filledup by the directors within 90 days.
5. The Company has prepared a �Code of Conduct� and has ensured that appropriate stepshave been taken to disseminate it throughout the Company along with its supporting policiesand procedures.
6. The Board has developed a vision / mission statement, overall corporate strategy andsignificant policies of the company. A complete record of particulars of significant policiesalong with the dates on which they were approved or amended has been maintained.
7. All the powers of the Board have been duly exercised and decisions on material transactions,including appointment and determination of remuneration and terms and conditions ofemployment of the CEO, other executive and non-executive directors have been taken bythe board/shareholders.
8. The meetings of the Board were presided over by the Chairman and, in his absence, by adirector elected by the board for this purpose and the board met at least once in every quarter.Written notices of the board meetings, along with agenda and working papers, were circulatedat least seven days before the meetings. The minutes of the meetings were appropriatelyrecorded and circulated.
9. During the year further three (3) Directors of the Company have acquired the requiredcertificate of Directors Training course from an Institute approved by the Securities andExchange Commission of Pakistan (SECP). Further, the domestic and international business
Category Names
Brig. Naveed Nasar Khan (Retd)
Mr. Rizwan Humayun
Mr. Ismail H. Ahmed
Lt. Col. Saleem Ahmed Zafar (Retd)
Mr. Mahfuz-ur-Rehman Pasha
Mr. Sohail Inam Ellahi
Mr. Shaheed H. Gaylani
Mr. Fawad Salim Malik
Mr. Pervez Inam
Independent Directors *
Executive Director
Non-Executive Directors
30
FOR THE YEAR ENDED JUNE 30, 2016
STATEMENT OF COMPLIANCE WITH
THE CODE OF CORPORATE GOVERNANCE
environment and regulatory changes were discussed with the directors in the BOD meetingsheld during the year. Till June 30, 2016 five (5) directors of the Company have acquired therequired certificate of Directors Training course while two (2) are exempt from this requirement.
10. The appointment, remuneration and terms and conditions of employment of the CFO, CompanySecretary and Head of Internal Audit are approved by the Board of Directors, however, therewas no new appointment of CFO, Company Secretary and Head of Internal audit during theyear.
11. The Directors� report for this year has been prepared in compliance with the requirementsof the CCG and fully describes the salient matters required to be disclosed.
12. The financial statements of the Company were duly endorsed by CEO and CFO beforeapproval of the Board.
13. The Directors, CEO and executives do not hold any interest in the shares of the Companyother than that disclosed in the pattern of shareholding.
14. The Company has complied with all the corporate and financial reporting requirements ofthe CCG.
15. The Board has formed an Audit Committee. It comprises of five members, all are non-executive directors and the chairman of the committee is an independent director.
16. The meetings of the audit committee were held at least once every quarter prior to approvalof interim and final results of the company as required by the CCG. The terms of referenceof the committee have been formed and advised to the committee for compliance.
17. The Board has formed an HR and Remuneration Committee. It comprises of four membersincluding two non-executive directors, one executive director and one independent director.The chairman of the committee is a non-executive director.
18. The Board has set up an effective internal audit function and the internal auditor is consideredsuitably qualified and experienced for the purpose and is conversant with the policies andprocedures of the Company.
19. The statutory auditors of the Company have confirmed that they have been given a satisfactoryrating under the quality control review program of the ICAP, that they or any of the partnersof the firm, their spouses and minor children do not hold shares of the company and that thefirm and all its partners are in compliance with International Federation of Accountants (IFAC)guidelines on code of ethics as adopted by the ICAP.
20. The statutory auditors or the persons associated with them have not been appointed toprovide other services except in accordance with the listing regulations and the auditors haveconfirmed that they have observed IFAC guidelines in this regard.
21. The �closed period�, prior to the announcement of interim/final results, and business decisions,which may materially affect the market price of company�s securities, was determined andintimated to directors, employees and stock exchange.
22. Material/price sensitive information has been disseminated among all the participants at oncethrough stock exchange.
23. We confirm that all other material principles enshrined in the CCG have been duly compliedwith.
Chief Executive Officer Director
September 20, 2016Karachi

32
Shariah Advisor�s Report

33

ASSETS
Current assetsCash and bank balancesShort term investmentsOther receivables - netIjarah rental receivablesAdvances to employeesAccrued mark-up / return on investmentsPrepaymentsCurrent portion of net investment in finance leaseTaxation - netTotal current assets
Non-current assetsNet investment in finance leaseLong-term investmentsLong-term depositsProperty, plant and equipmentIntangible assetsTotal non-current assetsTotal assets
LIABILITIES
Current liabilitiesTrade and other payablesAccrued mark-upCertificates of investmentShort term borrowingsShort term loan from a related partyCurrent portion of advance rental against Ijarah leasingCurrent portion of long-term depositsTotal current liabilities
Non-current liabilitiesLong-term depositsAdvance rental against Ijarah leasingDeferred taxation - netTotal non-current liabilitiesTotal liabilitiesNET ASSETS
Financed by:Share capitalReserves
Surplus on revaluation of available for sale investment
Surplus on revaluation of property, plant and equipment - net of tax
Contingencies and commitments
The annexed notes 1 to 43 form an integral part of these financial statements.
34
AS AT JUNE 30, 2016
Chief Executive Officer Director
2015Note 2016
Rupees
567
8
910
911121314
15161718192120
202122
2324
6
25
26
44,296,138 16,259,209
1,795,739 904,009 196,006
1,475,668 2,819,664
499,111,879 7,787,572
574,645,884
1,039,542,601 27,199,297
300,460 207,896,308
1,590,019 1,276,528,685 1,851,174,569
16,704,576 8,410,233
264,835,006 187,854,564
- 8,136,396
79,415,142 565,355,917
482,845,368 14,601,119
159,776,708 657,223,195
1,222,579,112 628,595,457
253,698,000 293,197,975 546,895,975
2,343,445 549,239,420
79,356,037 628,595,457
43,753,913 3,461,625 1,328,723
-78,304
1,229,408 527,043
438,608,838 8,734,754
497,722,608
850,949,630 24,744,411
109,500 125,763,680
1,468,082 1,003,035,303 1,500,757,911
9,170,873 4,161,639
156,466,231 192,856,269
40,000,000 3,337,816
60,658,383 466,651,211
345,791,150 7,222,006
133,643,212 486,656,368 953,307,579 547,450,332
253,698,000 249,535,302 503,233,302
2,267,425 505,500,727
41,949,605 547,450,332
142,475,688
5,959,998 3,235,674 9,195,672
151,671,360
72,289,792 28,093,726
101,713 100,485,231
51,186,129
- 51,186,129 10,471,732 40,714,397
1.60
Chief Executive Officer Director
FOR THE YEAR ENDED JUNE 30, 2016
35
INCOME
Income from leasing operations
Other Operating IncomeReturn on investmentsOther income
OPERATING EXPENSESAdministrative and operating expensesFinance costOther charges
Operating profit before provision
Reversal for potential lease lossesProfit before taxationTaxationProfit for the year
Earning per share-basic and diluted
27
2829
3031
9.3
32
33
2015Note 2016
Rupees
The annexed notes 1 to 43 form an integral part of these financial statements.
117,152,534
3,626,481 21,838
3,648,319 120,800,853
46,156,471 20,306,096
77,295 66,539,862 54,260,991
52,62054,313,6114,028,629
50,284,982
1.98

FOR THE YEAR ENDED JUNE 30, 2016
STATEMENT OFCOMPREHENSIVE INCOME
Chief Executive Officer Director
Profit for the year
Other comprehensive income for the year
Items to be reclassified to income statement in subsequent periods:
Surplus on revaluation of available for sale investment
Total comprehensive income for the year
Surplus arising on revaluation of property, plant and equipment has been reported in accordance withthe requirements of the Companies Ordinance, 1984 in a separate account below equity.
36
2015Note 2016
Rupees
50,284,982
388,788
50,673,770
40,714,397
76,020
40,790,417
6
The annexed notes 1 to 43 form an integral part of these financial statements.

Chief Executive Officer Director
CASH FLOWS FROM OPERATING ACTIVITIESProfit before taxation
Adjustment for:DepreciationAmortisationFinance costAmortisation of premiun / (discount) on PIB investmentReversal of potential lease losses Gain on disposal of operating fixed asset Operating profit before working capital changes
Movement in working capital
(Increase) / decrease in current assetsAdvance to employeesAccrued mark-up / return on investmentsOther receivables - netIjarah rental receivablesLong-term depositsPrepayments
Increase / (decrease) in current liabilitiesTrade and other payablesCash generated from operations
Finance cost paidTax paidDeposits received from to lesseesAdvance Ijarah rental received from lesseesIncrease in net investment in finance lease - net
Net cash generated from / (used in) operating activities
CASH FLOWS FROM INVESTING ACTIVITIESAdditions in property, plant and equipmentsAdditions in intangible assetsProceeds from disposal of operating fixed assetShort-term investment in Market Treasury BillsLong-term investmentNet cash used in investing activities
CASH FLOWS FROM FINANCING ACTIVITIESProceeds from certificates of investment - netDeposit on Ijarah finance facility obtainedShort term loan from a related party - netNet cash generated from financing activitiesNet increase / (decrease) in cash and cash equivalentsCash and cash equivalents at the begining of the yearCash and cash equivalents at the end of the year
37
FOR THE YEAR ENDED JUNE 30, 2016
2015Note 2016
Rupees
51,186,129
34,700,966 149,802
28,093,726 29,013
- (1,364,100) 61,609,407
112,795,536
(117,702) (246,260) (467,016) (904,009)
(3,000) (2,292,621) (4,030,608)
7,533,703 116,298,631
(23,845,132) (627,365)
155,810,977 12,177,693
(249,096,012) (105,579,839)
10,718,792
(59,704,875) (271,739) 1,826,400
(12,721,564) (2,483,899)
(73,355,677)
108,368,775 (187,960)
(40,000,000) 68,180,815
5,543,930 (149,102,356) (143,558,426)
54,313,611
15,769,054 149,802
20,306,096 (46,702) (52,620)
- 36,125,630 90,439,241
3,610 (184,894) 4,544,538
- -
190,882 4,554,136
(890,756) 94,102,621
(19,582,795) (1,014,902) 97,854,551
5,805,687 (236,878,536) (153,815,995)
(59,713,374)
(40,556,462) (1,168,478)
- -
(3,834,899) (45,559,839)
19,359,055 -
18,000,000 37,359,055
(67,914,158) (81,188,198)
(149,102,356)
The annexed notes 1 to 43 form an integral part of these financial statements.
37
13.1 & 13.51431
29
13.1 & 13.514.113.6

Chief Executive Officer Director
38
Balance as at July 01, 2014
Total comprehensive income for the year ended June 30, 2015
Profit for the year
Other comprehensive income
Surplus on revaluation of available for sale investment
Transfer from surplus on revaluation of property, plant and equipment to unappropriated profit - net of deferred tax
Transfer to statutory reserve(note 24.1)
Balance as at June 30, 2015
Total comprehensive income for the year ended June 30, 2016
Profit for the year
Other comprehensive income
Surplus on revaluation of available for sale investment
Transfer from surplus on revaluation of property, plant and equipment to unappropriated profit - net of deferred tax
Transfer to statutory reserve(note 24.1)
Balance as at June 30, 2016
Rupees
196,919,786
50,284,982
- 50,284,982
2,330,534
-
249,535,302
40,714,397
- 40,714,397
2,948,276
-
293,197,975
452,496,423
50,284,982
388,78850,673,770
2,330,534
-
505,500,727
40,714,397
76,020 40,790,417
2,948,276
-
549,239,420
253,698,000
-
--
-
-
253,698,000
-
--
-
-
253,698,000
Surplus on
revaluation
of available
for sale
investment
Sharecapital
Sub TotalStatutoryreserve
Capital
Reserve forissue of
bonus shares
Unappropriatedprofit
Revenue
Reserves
Totalequity
FOR THE YEAR ENDED JUNE 30, 2016
4,402,000
-
--
-
-
4,402,000
-
--
-
-
4,402,000
140,971,690
50,284,982
- 50,284,982
2,330,534
(10,056,996)
183,530,210
40,714,397
- 40,714,397
2,948,276
(8,142,880)
219,050,003
The annexed notes 1 to 43 form an integral part of these financial statements.
51,546,096
-
--
-
10,056,996
61,603,092
-
--
-
8,142,880
69,745,972
1,878,637
-
388,788388,788
-
-
2,267,425
-
76,02076,020
-
-
2,343,445

1. STATUS AND NATURE OF BUSINESS
1.1 Pak-Gulf Leasing Company Limited ("the Company") was incorporated in Pakistan on December27, 1994 as a public limited company under the Companies Ordinance, 1984 and commencedits operations on September 16, 1996. The Company is principally engaged in the business ofleasing and is listed on Pakistan Stock Exchange Limited, however, before the merger of thethree (3) stock exchanges of Pakistan into Pakistan Stock Exchange Limited the Company waslisted on all three (3) stock exchanges of Pakistan; i.e. Karachi Stock Exchange Limited, LahoreStock Exchange Limited and Islamabad Stock Exchange Limited. The registered office of theCompany has been shifted to UNIBRO House, Ground and Mezzanine Floor, Plot No. 114, 9thEast Street, Phase-1, Defence Housing Authority, Karachi w.e.f. April 15, 2016. Previously theregistered office of the Company was situated at The Forum, Rooms 125-127, First Floor, MainKhayaban-e-Jami, Clifton, Karachi.
1.2 Regulation 4 of Non-Banking Finance Companies and Notified Entities Regulations, 2008 (NBFCRegulations 2008) vide SRO1002(I)/2015 dated October 15, 2015, requires an existing deposittaking leasing company to maintain, at all times, minimum equity of Rs. 500 million by November25, 2016. The equity of the Company as at June 30, 2016 is Rs. 545.306 million which isRs. 45.306 million in excess of the minimum equity requirement.
1.3 JCR-VIS Credit Rating Company Limited (JCR-VIS) has re-affirmed A- and A-2 ratings to theCompany for medium to long term and short term, respectively on November 27, 2015.
2. BASIS OF PREPARATION
2.1 Statement of compliance
These financial statements have been prepared in accordance with the approved accountingstandards as applicable in Pakistan. Approved accounting standards comprise of such InternationalFinancial Reporting Standards (IFRSs) issued by International Accounting Standards Board(IASB) as are notified under the Companies Ordinance 1984, Islamic Financial AccountingStandard - 2 Ijarah (IFAS-2) issued by Institute of Chartered Accountants of Pakistan (ICAP), theNon-Banking Finance Companies (Establishment and Regulations) Rules, 2003 (the NBFCRules), the Non-Banking Finance Companies and Notified Entities Regulations, 2008 (the NBFCRegulations), provisions of and directives issued under the Companies Ordinance, 1984 and thedirectives issued by the Securities and Exchange Commission of Pakistan (SECP). In case therequirements differ, the provisions of and directives issued under the NBFC Rules, the NBFCRegulations, Companies Ordinance, 1984 and the directives issued by SECP shall prevail.
2.2 Basis of measurement
These financial statements have been prepared under the historical cost convention, except thatcertain property, plant and equipment are stated at revalued amount and certain investmentswhich have been classified as 'available for sale' are marked to market and carried at fair value.
These financial statements have been prepared following accrual basis of accounting except forcash flow information.
2.3 Functional and presentation currency
These financial statements are presented in Pak Rupees which is the functional and presentationcurrency of the Company. All financial information presented in Pakistan Rupees has beenrounded off to the nearest rupee.
3. NEW STANDARDS, INTERPRETATIONS AND AMENDMENTS TO PUBLISHED APPROVEDACCOUNTING STANDARDS
3.1 Standards or interpretations that are effective in current year but not relevant to theCompany
The following new standards and interpretations have been issued by the International Accounting
FOR THE YEAR ENDED JUNE 30, 2016
39

Standards Board (IASB) which have been adopted locally by the Securities and ExchangeCommission of Pakistan vide SRO 633(I)/2014 dated July 10, 2014 with effect from followingdates. The Company has adopted these accounting standards and interpretations which do nothave significant impact on the Company's financial statements other than certain additionaldisclosures regarding fair value of financial instruments as per IFRS 13 "Fair Value Measurement".
IFRS 10 Consolidated Financial Statements January 1, 2015IFRS 11 Joint Arrangements January 1, 2015IFRS 12 Disclosure of Interests in Other Entities January 1, 2015IFRS 13 Fair Value Measurement January 1, 2015IAS 27 Separate Financial Statements (Revised 2011) January 1, 2015IAS 28 Investments in Associates and Joint Ventures (Revised 2011) January 1, 2015
3.2 Amendments not yet effective
The following amendments and interpretations with respect to the approved accounting standardsas applicable in Pakistan would be effective from the dates mentioned below against the respectivestandard or interpretation:
Effective date (annual periodsbeginning on or after)
IFRS 2 Share-based Payment - Amendments to clarify the classification andmeasurement of share-based payment transactions Jan. 01, 2018
IFRS 10 Consolidated Financial Statements - Amendments regarding the saleor contribution of assets between an investor and its associate or joint Deferredventure Indefinitely
IFRS 10 Consolidated Financial Statements - Amendments regarding theapplication of the consolidation exception Jan. 01, 2016
IFRS 11 Joint Arrangements - Amendments regarding the accounting foracquisitions of an interest in a joint operation Jan. 01, 2016
IFRS 12 Disclosure of Interests in Other Entities - Amendments regarding theapplication of the consolidation exception Jan. 01, 2016
IAS 1 Presentation of Financial Statements - Amendments resulting from thedisclosure initiative Jan. 01, 2016
IAS 7 Statement of Cash Flows - Amendments resulting from the disclosureinitiative Jan. 01, 2016
IAS 12 Income Taxes - Amendments regarding the recognition of deferred taxassets for unrealised losses Jan. 01, 2016
IAS 16 Property, Plant and Equipment - Amendments regarding the clarificationof acceptable methods of depreciation and amortisation and amendmentsbringing bearer plants into the scope of IAS 16 Jan. 01, 2016
IAS 27 Separate Financial Statements (as amended in 2011) - Amendmentsreinstating the equity method as an accounting option for investmentsin subsidiaries, joint ventures and associates in an entity's separatefinancial statements Jan. 01, 2016
FOR THE YEAR ENDED JUNE 30, 2016
40
Effective date(annualperiods
beginning onor after)

IAS 28 Investments in Associates and Joint Ventures - Amendments regardingthe sale or contribution of assets between an investor and its associate Deferedor joint venture indefinitely
IAS 28 Investments in Associates and Joint Ventures - Amendments regardingthe application of the consolidation exception Jan. 01, 2016
IAS 38 Intangible Assets - Amendments regarding the clarification of acceptablemethods of depreciation and amortisation Jan. 01, 2016
IAS 41 Agriculture - Amendments bringing bearer plants into the scope of IAS 16 Jan. 01, 2016
The Annual Improvements to IFRSs that are effective for annual periods beginning on or afterJanuary 01, 2016 are as follows:
Annual Improvements to IFRSs (2012 � 2014) Cycle:
IFRS 5 Non-current Assets Held for Sale and Discontinued OperationsIFRS 7 Financial Instruments: DisclosuresIAS 19 Employee BenefitsIAS 34 Interim Financial Reporting
3.3 Standards or interpretations not yet effective
The following new standards and interpretations have been issued by the International AccountingStandards Board (IASB), which have not been adopted locally by the Securities and ExchangeCommission of Pakistan:
IFRS 1 First Time Adoption of International Financial Reporting StandardsIFRS 9 Financial InstrumentsIFRS 14 Regulatory Deferral AccountsIFRS 15 Revenue from Contracts with CustomersIFRS 16 Leases
The effects of IFRS 9 - Financial Instruments, IFRS 15 - Revenues from Contracts with Customersand IFRS 16 - Leases are still being assessed, as these new standards may have a significanteffect on the Company�s future financial statements.
The Company expects that the adoption of the other amendments and interpretations of the standards will not have any material impact and therefore will not affect the Company's financialstatements in the period of initial application.
4. SUMMARY OF SIGNIFICANT ACCOUNTING POLICIES
The accounting policies set out below have been applied consistently to all the periods presentedin these financial statements.
4.1 Financial assets
4.1.1 Classification
The Company classifies its financial assets in the following categories: loans and receivables,held to maturity and available for sale. The classification depends on the purpose for which thefinancial assets were acquired. Management determines the appropriate classification of itsfinancial assets at initial recognition and re-evaluates this classification on a regular basis.
FOR THE YEAR ENDED JUNE 30, 2016
41
Effective date(annualperiods
beginning onor after)

a) Loans and receivables
These are non-derivative financial assets with fixed or determinable payments that are not quotedin an active market.
b) Held-to-maturity
Held-to-maturity investments are financial assets with fixed or determinable payments and fixedmaturity that the Company has a positive intent and ability to hold to maturity.
c) Available for sale
Available for sale financial assets are those non-derivative financial assets that are designatedas available for sale or are not classified as (a) loans and receivables, (b) held to maturityinvestments or financial assets at fair value through profit or loss.
4.1.2 Initial recognition and measurement
Financial assets are initially recognised at fair value plus any related transaction costs directlyattributable to the acquisition.
4.1.3 Subsequent measurement
Subsequent to initial recognition, financial assets designated by the management as loans andreceivables, held to maturity and available for sale are valued as follows:
a) Loans and receivables
Loans and receivables are carried at amortised cost.
b) Held to maturity
Subsequent to initial measurement, held to maturity investments are carried at amortised cost.
c) Available for sale
Subsequent to initial measurement, available for sale investments are revalued and are remeasuredto fair value.
Surplus or deficit arising on changes in fair value of available for sale financial assets are takento equity through statement of comprehensive income until these are derecognised. At this time,the cumulative surplus or deficit previously recognised directly in equity is transferred to the profitand loss account.
4.1.4 Impairment
The carrying value of the Company's assets are reviewed at each balance sheet date to determinewhether there is any indication of impairment. If such an indication exists, the recoverable amountof such asset is estimated. An impairment loss is recognised whenever the carrying amount ofan asset exceeds its recoverable amount. Impairment losses are recognised in the profit andloss account.
4.1.5 Derecognition
Financial assets are derecognised when the rights to receive cash flows from the financial assetshave expired or have been transferred and the Company has transferred substantially all risksand rewards of ownership attached to such financial assets.
42
FOR THE YEAR ENDED JUNE 30, 2016

4.2 Financial liabilities
All financial liabilities are recognised at the time when the Company becomes a party to thecontractual provisions of the instrument.
A financial liability is derecognised when the obligation under the liability is discharged or cancelledor expired.
4.3 Offsetting of financial assets and liabilities
Financial assets and financial liabilities are offset and the net amount is reported in the balancesheet when there is a legally enforceable right to set off the recognised amounts and there isan intention to settle on a net basis, or realise the assets and settle the liabilities simultaneously.
4.4 Cash and bank balances
Cash in hand and at banks are carried at nominal amount.
4.5 Cash and cash equivalents
Cash and cash equivalents comprise of cash balances and bank deposit, and other short-termhighly liquid investments with original maturities of three months or less, short-term runningfinance facilities that are repayable on demand and form an integral part of the Company�s cashmanagement are included as a component of cash and cash equivalents for the purpose of thecash flow statement.
4.6 Net investment in finance lease
Leases where the Company transfers substantially all the risks and rewards incidental to ownershipof the leased assets to the lessees, are classified as finance leases.
The leased asset is derecognised and the present value of the lease receivable (net of initialdirect costs for negotiating and arranging the lease) is recognised on the balance sheet. Thedifference between the gross lease receivables and the present value of the lease receivablesis recognised as unearned finance income.
A receivable is recognised at an amount equal to the present value of the minimum leasepayments under the lease agreements, including guaranteed residual value, if any.
Each lease payment received is applied against the gross investment in the finance leasereceivable to reduce both the principal and the unearned finance income. The finance incomeis recognised in the profit and loss account on a basis that reflects a constant periodic rate ofreturn on the net investment in the finance lease receivables.
Initial direct costs incurred by the Company in negotiating and arranging finance leases areadded to finance lease receivables and are recognised as an expense in the profit and lossaccount over the lease term on the same basis as the finance lease income.
4.7 Provision for potential lease losses and provision for terminated leases
Calculating the provision for net investment in finance lease losses and provision for terminatedleases is subject to numerous judgments and estimates. In evaluating the adequacy of provision,management considers various factors, including the requirements of the NBFC Regulations,2008 issued by Securities and Exchange Commission of Pakistan, the nature and characteristicsof the obligor, current economic conditions, credit concentrations, historical loss experience anddelinquencies. Lease receivables are charged off, when in the opinion of management, thelikelihood of any future collection is believed to be minimal.
43
FOR THE YEAR ENDED JUNE 30, 2016

4.8 Property, plant and equipment
These are stated at cost less accumulated depreciation and impairment losses, if any, exceptfor leasehold premises which is stated at revalued amount less accumulated depreciation andimpairment losses.
Subsequent costs are included in the assets' carrying amounts or recognised as a separateasset, as appropriate, only when it is probable that future benefits associated with the item willflow to the Company and the cost of the item can be measured reliably. All other subsequentcosts including repairs and maintenance are charged to the profit and loss account as and whenincurred.
Depreciation is charged using the straight line method, whereby the depreciable amount of anasset is written off over its estimated useful life at the rates specified in note 13.1 after takinginto account residual value, if any. The residual values, useful lives and depreciation methodsare reviewed and adjusted, if appropriate, at each balance sheet date.
Depreciation on additions is charged from the month the assets are put to use while no depreciationis charged in the month in which the assets are disposed off.
Any surplus arising on revaluation of property, plant and equipment is credited to the surplus onrevaluation account. Revaluation is carried out with sufficient regularity to ensure that the carryingamounts of assets do not differ materially from the fair value of such assets. To the extent of theincremental depreciation charged on the revalued assets, the surplus on revaluation of operatingfixed assets (net of deferred taxation) is transferred directly to unappropriated profit.
Gains or losses on sale of assets are charged to the profit and loss account in the period in whichthey arise, except that the related surplus on revaluation of assets (net of deferred taxation) istransferred directly to accumulated profit.
Ijarah assets
Rental from Ijarah arrangements are recognised in profit and loss on accrual basis as and whenrentals become due. Costs including depreciation, incurred in earning the Ijarah income arerecognised as expense. Initial direct costs incurred specifically to earn revenues from Ijarah arerecognised as an expense in the period in which they are incurred. Assets leased out aredepreciated over the period of lease term on a straight line basis.
4.9 Intangible assets
Intangible assets are stated at cost less accumulated amortisation and accumulated impairmentlosses, if any. These are amortised using the straight line method reflecting the pattern in whichthe economic benefits of the asset are consumed by the Company as mentioned in note 14.
4.10 Other receivables
Other receivables are carried at original invoice amount less an estimate made for doubtfulreceivables based on a review of all outstanding amounts at the year end. Balances consideredbad and irrecoverable are written off when considered irrecoverable.
4.11 Provisions
Provisions are recognised when the company has a legal or constructive obligation as a resultof past events and it is probable that an outflow of resources will be required to settle the obligationand a reliable estimate of the amount can be made. Provisions are reviewed at each balancesheet date and are adjusted to reflect the current best estimate.
44
FOR THE YEAR ENDED JUNE 30, 2016

4.12 Taxation
4.12.1 Current
Provision for current taxation is based on taxable income at the current rates of taxation aftertaking into account tax credits and rebates available, if any. The charge for current taxation alsoincludes adjustments where necessary, relating to prior years which arise from assessmentsframed / finalised during the year.
Taxable income for the purpose of computing current taxation is determined under the provisionsof the tax laws, whereby, lease rentals received and receivable are deemed to be the incomeof the Company.
Provision for taxation is thus based on taxable income determined in accordance with therequirements of such laws, and is made at the current rates of taxation in the Income TaxOrdinance, 2001.
4.12.2 Deferred
Deferred tax is recognised, using the balance sheet liability method, on all temporary differencesarising between the tax base of assets and liabilities and their carrying amount. Deferred tax iscalculated using the rates that are expected to apply to the period when the differences reversebased on the tax rates that have been enacted at the balance sheet date.
Deferred tax liabilities are recognised for all taxable temporary differences, whereas deferred taxassets are recognised for all deductible temporary differences. A deferred tax asset is recognisedonly to the extent that it is probable that future taxable profits or taxable temporary differenceswill be available against which the asset can be utilised. Deferred tax assets are reduced to theextent that it is no longer probable that the related tax benefit will be realised. In addition, theCompany also recognises deferred tax liability on the surplus on revaluation of tangible fixedassets which is adjusted against the related surplus in accordance with the requirements ofInternational Accounting Standard 12 (IAS 12), 'Income Taxes'.
4.13 Trade and other payables
Liabilities for trade and other payables are recognised initially at fair value and subsequentlycarried at amortised cost.
4.14 Borrowings
Loans and borrowings are recorded at the proceeds received. Finance cost are accounted foron accrual basis and are shown as interest and mark-up accrued to the extent of the amountremaining unpaid.
Short term borrowings are classified as current liabilities unless the Company has unconditionalright to defer settlement of the liability for at least twelve months after the balance sheet date.
4.15 Staff retirement benefits
Defined contribution plan
The Company operates an approved defined contributory provident fund for all its permanentemployees. Monthly contributions are made to the fund equally by the Company and the employeesin accordance with the rules of the Fund. The contributions are recognised as employee benefitexpense when they become due.
Staff retirement benefits are payable to employees on completion of the prescribed qualifyingperiod of service under the scheme.
45
FOR THE YEAR ENDED JUNE 30, 2016

4.16 Employees' compensated absences
The Company accounts for the liability in respect of employees' compensated absences in theyear in which these are earned. Provision to cover the obligations under the scheme is madebased on the current leave entitlements of the employees and by using the current salary levelof the employees.
4.17 Currency translation
Foreign currency transactions
Items included in financial statements are measured using the currency of the primary economicenvironment in which the Company operates.
Transactions in foreign currencies are translated to Pakistani Rupees at the foreign exchangerates prevailing on the date of the transaction. Monetary assets and liabilities in foreign currenciesare translated into Pakistani Rupees at the rates of exchange approximating those prevailing onthe balance sheet date. Exchange differences are taken to the profit and loss account.
4.18 Revenue recognition
Finance lease income
The Company follows the finance lease method in accounting for the recognition of lease income.Under this method, the unearned lease income i.e. the excess of gross lease rentals and theestimated residual value over the cost of the leased assets is deferred and taken to income overthe term of the lease contract, so as to produce a systematic return on the net investment infinance lease. Unrealised lease income is held in suspense account, where necessary, inaccordance with the requirements of the NBFC Regulations.
Documentation charges, late payment charges and processing fee are taken to income whenrealised.
Rental income from Ijarah
In accordance with the requirements of IFAS 2 - Ijarah rental from Ijarah arrangements arerecognised in profit and loss on accrual basis as and when rentals become due.
Return on investments
Mark-up income on debt securities is recognised on time proportion basis using the effectiveyield on instruments and return on equity securities is accounted for on accrual basis.
Dividend income
Dividend income from investment is recognised when the Company`s right to receive dividendis established.
Interest income
Interest income on bank deposits is recognised on time proportion basis using the effectiveinterest method.
Gain or losses on sale of investments
Capital gain or losses arising on sale of investments are taken to income in the period in whichthey arise.
46
FOR THE YEAR ENDED JUNE 30, 2016

47
FOR THE YEAR ENDED JUNE 30, 2016
4.19 Earnings per share
The Company presents basic and diluted earnings per share (EPS) for its shareholders. Basic EPSis calculated by dividing the profit or loss attributable to ordinary share holders of the Company bythe weighted average number of ordinary shares outstanding during the year. Diluted EPS isdetermined by adjusting the profit or loss attributable to ordinary shareholders and the weightedaverage number of ordinary shares outstanding for the effect of all dilutive potential ordinary shares,if any.
4.20 Dividend distribution and transfer between reserves
Dividend distribution (including stock dividend) to the Company's shareholders and transfer betweenreserves, except appropriations which are required under law, are recognised in the financialstatements in the period in which such dividends are declared or such transfers between reservesare made.
4.21 Segment reporting
An operating segment is a component of the Company that engages in business activities fromwhich it may earn revenues and incur expenses including revenues and expenses that relate totransactions with any of the Company�s other components. All operating segments� results arereviewed regularly by the Company�s chief operating decision maker to make decisions aboutresources to be allocated to the segment and assess its performance, and for which discretefinancial information is available.
The Company has two primary business segments, namely, leasing and Ijarah operations.
Financing, investment, revenue, expenses and income taxes are managed on an overall basis andare therefore, not allocated to any segment.
Assets, liabilities and capital expenditures that are directly attributable to segments have beenassigned to them. Those assets and liabilities, which cannot be allocated to a particular segmenton a reasonable basis, are reported as unallocated corporate assets and liabilities.
4.22 Critical accounting estimates and judgments
The preparation of financial statements in conformity with approved accounting standards requiresmanagement to make estimates and assumptions that affect the reported amounts of assets andliabilities, income and expenses. It also requires management to exercise judgment in applicationof the Company's accounting policies. The estimates and associated assumptions are based onhistorical experience and various other factors that are believed to be reasonable under thecircumstances, the results of which form the basis of making judgment about the carrying valueof assets and liabilities that are not readily apparent from other sources, actual results may differfrom those estimates. These estimates and assumptions are reviewed on an ongoing basis.Revisions to accounting estimates are recognised in the period in which the estimate is revised ifthe revision affects only that period, or in the period of revision and future periods if the revisionaffects both current and future periods.
The areas where various assumptions and estimates are significant to the Company's financialstatements or where judgment was exercised in application of accounting policies are as follows:
i) Classification and valuation of investments (notes 4.1, 6 and 11).ii) Provision for current and deferred taxation (notes 4.12, 22 and 32).iii) Recognition and measurement of deferred tax assets and liabilities (note 4.12.2, 22
and 32).iv) Classification and provision of net investment in finance lease (notes 4.6, 4.7 and 9).v) Determination and measurement of useful life and residual value of property, plant and
equipment (note 4.8 and 13).

48
FOR THE YEAR ENDED JUNE 30, 2016
vi) Determination and measurement of useful life and residual value of intangible assets (note4.9 and 14).
vii) Measurement of lease hold premises carried at revalued amount. (note 4.8, 13.2 and 25).
This amount includes Rs. 3.22 mil l ion (2015: Rs. 16.20 mil l ion) which represents
balance of bank account(s) maintained with Islamic bank(s) by the Company. The
balance in current accounts does not carry any mark up or interest.
5.2 These carry mark-up rates ranging from 4% to 5.7% (2015: 5% to 6.25%) per annum.
Cash in hand
Balance with banks:
- in current accounts
- in saving accounts
5.1
5.2
Note5. CASH AND BANK BALANCES
1,425
15,245,692
29,049,021
44,296,138
2016
Rupees
5.1
17,082
38,733,438
5,003,393
43,753,913
2015
OTHER RECEIVABLES - NET
Lease receivable held under litigation
Insurance premium and other receivable
Provision against lease receivable held under
litigation
Mark-up held in suspense against lease
receivable held under litigation
Provision against insurance premium and
other receivable
7.
28,581,952
2,973,576
31,555,528
(25,600,250)
(2,728,847)
(1,430,692)
1,795,739
28,581,952
2,506,560
31,088,512
(25,600,250)
(2,728,847)
(1,430,692)
1,328,723
7.1
7.2
7.3
7.4
SHORT TERM INVESTMENT
Available for sale
Cost
54,300 units of National Investment (Unit) Trust
(2015: 54,300)
Revaluation surplus
As at July 01
Surplus / (deficit) for the year
As at June 30
Held to maturity
Government Securities -
Market Treasury Bills
6.
1,194,200
2,267,425
76,020
2,343,445
3,537,645
12,721,564
16,259,209
1,194,200
1,878,637
388,788
2,267,425
3,461,625
-
3,461,625
6.1
6.1 Market Treasury Bills (MTB) carry interest rate ranging from 5.95% to 6.35% per annum and has
maturity date ranging from August 04, 2016 to April 13, 2017. The market value of investment in
MTB as at June 30, 2016 amounted to Rs. 13.008 million (2015: nil).
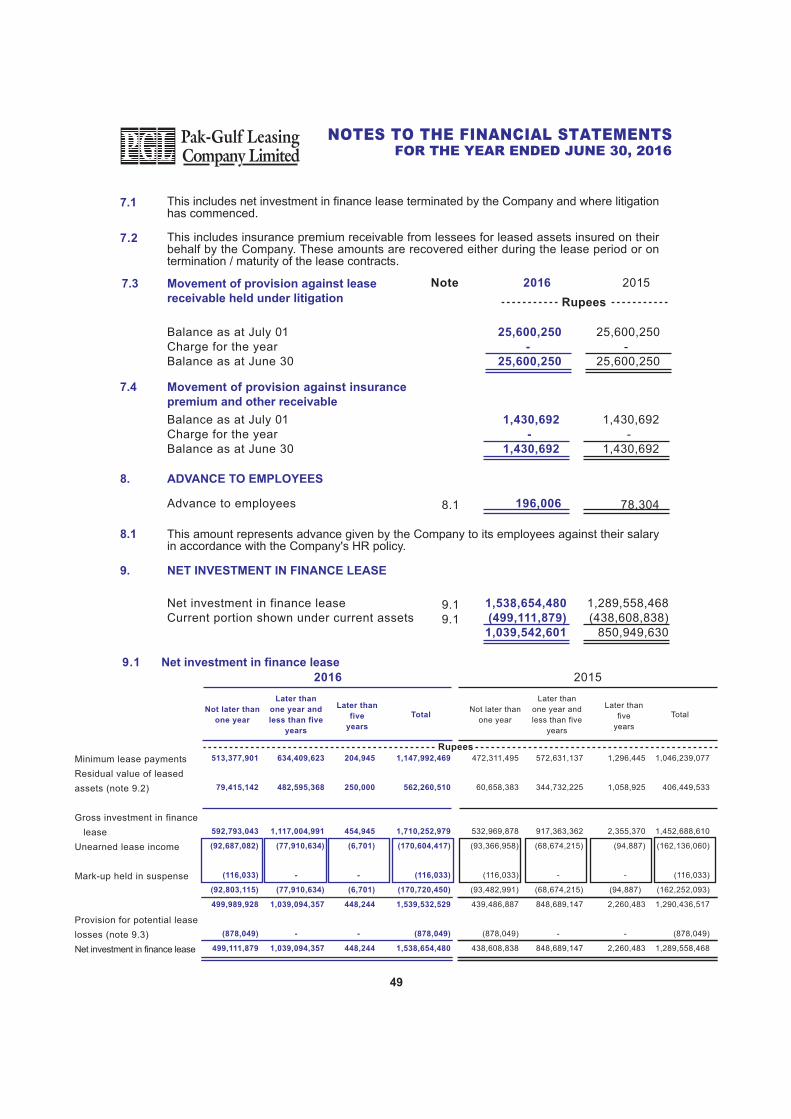
Later than
five
years
1,296,445
1,058,925
2,355,370
(94,887)
-
(94,887)
2,260,483
-
2,260,483
Total
1,046,239,077
406,449,533
1,452,688,610
(162,136,060)
(116,033)
(162,252,093)
1,290,436,517
(878,049)
1,289,558,468
Not later than
one year
472,311,495
60,658,383
532,969,878
(93,366,958)
(116,033)
(93,482,991)
439,486,887
(878,049)
438,608,838
Later than
one year and
less than five
years
572,631,137
344,732,225
917,363,362
(68,674,215)
-
(68,674,215)
848,689,147
-
848,689,147
9.1 Net investment in finance lease
2015
Rupees
Minimum lease payments
Residual value of leased
assets (note 9.2)
Gross investment in finance
lease
Unearned lease income
Mark-up held in suspense
Provision for potential lease
losses (note 9.3)
Net investment in finance lease
2016
Later than
five
years
204,945
250,000
454,945
(6,701)
-
(6,701)
448,244
-
448,244
Total
1,147,992,469
562,260,510
1,710,252,979
(170,604,417)
(116,033)
(170,720,450)
1,539,532,529
(878,049)
1,538,654,480
Not later than
one year
513,377,901
79,415,142
592,793,043
(92,687,082)
(116,033)
(92,803,115)
499,989,928
(878,049)
499,111,879
Later than
one year and
less than five
years
634,409,623
482,595,368
1,117,004,991
(77,910,634)
-
(77,910,634)
1,039,094,357
-
1,039,094,357
49
FOR THE YEAR ENDED JUNE 30, 2016
7.1
7.2
This includes net investment in finance lease terminated by the Company and where litigationhas commenced.
This includes insurance premium receivable from lessees for leased assets insured on theirbehalf by the Company. These amounts are recovered either during the lease period or ontermination / maturity of the lease contracts.
Balance as at July 01
Charge for the year
Balance as at June 30
25,600,250
-
25,600,250
25,600,250
-
25,600,250
7.3 Movement of provision against lease
receivable held under litigation
Note 2016
Rupees
2015
Movement of provision against insurance
premium and other receivable
1,430,692
-
1,430,692
Balance as at July 01
Charge for the year
Balance as at June 30
7.4
1,430,692
-
1,430,692
78,304Advance to employees
8. ADVANCE TO EMPLOYEES
196,0068.1
1,289,558,468
(438,608,838)
850,949,630
Net investment in finance lease
Current portion shown under current assets
9. NET INVESTMENT IN FINANCE LEASE
1,538,654,480
(499,111,879)
1,039,542,601
9.1
9.1
This amount represents advance given by the Company to its employees against their salaryin accordance with the Company's HR policy.
8.1

50
FOR THE YEAR ENDED JUNE 30, 2016
In certain leases, the Company has security, in addition to leased assets, in the form of
mortgages / corporate / personal guarantees of associated companies / directors.
9.2 These represent interest free security deposits received against lease contracts and are
refundable / adjustable at the expiry / termination of the respective leases. The amount is
net of security deposit held against matured leases amounting to Rs. 85.742 million (2015:
Rs. 62.290 million).
930,669
(52,620)
878,049
Balance as at July 01
Reversal for the year
Balance as at June 30
9.3 Provision for potential lease losses
878,049
-
878,049
Note 2016
Rupees
2015
9.4 The net investment in finance lease portfolio includes Rs. 0.88 million (2015: Rs. 0.88 million)which has been placed under non-performing status.
9.5 The Company has entered into various lease agreements for periods ranging from one to sevenyears (2015: one to seven years). Security deposits ranging from 5% to 64.5% (2015: 5% to64.5%) are obtained at the time of entering into the lease arrangement. The rate of return implicitin the leases ranges from 8.08% to 17.92% (2015: 10.51% to 22.36%) per annum.
10. TAXATION - NET
Balance as at July 01
Advance tax paid
Charge for the year
Reversal of prior year tax
Balance as at June 30
4,579,176
1,014,902
(1,228,026)
4,368,702
8,734,754
8,734,754
627,365
(1,574,547)
-
7,787,572
32
32.3
12. LONG-TERM DEPOSITS
300,460Long-term deposits 109,50012.1
11. LONG TERM INVESTMENT
As per the requirements of Regulations14(4)(i) of the Non Banking Finance Companies andNotified Entities Regulations, 2008, the Company is required to invest at least 15% of its outstandingfunds raised through issue of Certificates of Investment in the Government securities. As at June30, 2016, the Company had 15.07% of its funds raised through Certificates of Investment investedin Pakistan Investment Bonds (PIBs) and Market Treasury Bills (Refer Note 6).
PIBs carries interest rate ranging from 9.25% to 11.50% per annum and has maturity date rangingfrom July 19, 2017 to March 25, 2020. The market value of investment in PIBs as at June 30,2016 amounted to Rs. 29.687 million (2015: Rs. 26.765 million).
24,744,411
Held to maturity
27,199,297
Government Security
Pakistan Investment Bonds
11.1
11.2

13.1 Fixed Assets - own use
73,913,448
3,515,213
(462,300)
57,591,019
(6,361,334)
128,196,046
141,937,645
(13,741,599)
128,196,046
77,754,130
1,344,962
-
(5,185,644)
73,913,448
95,550,632
(21,637,184)
73,913,448
1,168,885
564,662
-
-
(614,381)
1,119,166
4,231,921
(3,112,755)
1,119,166
395,361
1,106,862
-
(333,338)
1,168,885
3,903,765
(2,734,880)
1,168,885
33.33
3,617,359
-
(459,254)
-
(856,630)
2,301,475
6,875,735
(4,574,260)
2,301,475
4,473,989
-
-
(856,630)
3,617,359
9,761,520
(6,144,161)
3,617,359
20
453,883
2,351,510
(3,046)
-
(204,388)
2,597,959
4,162,230
(1,564,271)
2,597,959
339,732
222,800
-
(108,649)
453,883
2,148,625
(1,694,742)
453,883
20
138,340
101,825
-
-
(26,317)
213,848
1,947,562
(1,733,714)
213,848
149,067
15,300
-
(26,027)
138,340
1,845,737
(1,707,397)
138,340
10
-
497,216
-
-
(26,418)
470,798
1,168,197
(697,399)
470,798
-
-
-
-
-
670,981
(670,981)
-
33.33
68,534,981
-
-
57,591,019
(4,633,200)
121,492,800
123,552,000
(2,059,200)
121,492,800
72,395,981
-
-
(3,861,000)
68,534,981
77,220,004
(8,685,023)
68,534,981
5
Year ended June 30, 2016
Net carrying value basis
Opening net book value (NBV)
Additions
Disposals (NBV)
Revaluation
Depreciation charge
Closing net book value
Gross carrying value basis
Cost
Accumulated depreciation
Net book value
Year ended June 30, 2015
Net carrying value basis
Opening book value
Additions during the year
Disposals (NBV)
Depreciation charge
Closing net book value
Gross carrying value basis
Cost
Accumulated depreciation
Net book value
Depreciation rate % per annum
TotalComputer
equipment
VehiclesOffice
equipment
Furniture
and
fittings
Leasehold
improvements
Leasehold
premisesDescription
Rupees
13. PROPERTY, PLANT AND EQUIPMENT
128,196,046
79,700,262
207,896,308
Fixed assets - own use
Fixed assets - Ijarah finance
73,913,448
51,850,232
125,763,680
13.1
13.5
This amount includes Rs. 0.188 million (2015: nil) given by the Company as security deposit toFirst Habib Moadarba under Ijarah arrangement to obtain the Ijarah asset. These deposits donot carry any markup or interest.
12.1
20152016Rupees
Note
51
FOR THE YEAR ENDED JUNE 30, 2016
13.2 The Company follows the revaluation model for its leasehold premises. The leasehold premisesof the Company were revalued as at November 1, 2005, October 27, 2008 April 1, 2013 andMarch 11, 2016 by M/s. Akbani & Javed Associates, independent valuation consultants, basedon active market prices and relevant inquiries and information as considered necessary, adjustedfor any difference in nature and location. The revaluations resulted in a net surplus of Rs. 41.224million, Rs. 39.057 million, Rs. 13.044 million and Rs. 57.591 million, respectively over the writtendown values of Rs. 9.731 million, Rs. 43.311 million, Rs. 64.178 million and Rs. 65.961 million,respectively. Out of the revaluation surplus, an amount of Rs. 115.009 million remains undepreciatedas at June 30, 2016 (2015: Rs. 61.690 million). Had there been no revaluation, the book valueof leasehold premises would have been Rs. 6.484 million (2015: Rs. 6.844 million).

52
FOR THE YEAR ENDED JUNE 30, 2016
Fair value measurement (revalued property, plant and equipment)
Fair value measurement of lease hold premises is based on the valuations carried out by anindependent valuer M/s. Akbani and Javed Associates as on March 11, 2016 on the basis ofmarket value.
Fair value measurement of revalued land is based on assumptions considered to be level 2 inputs.
Valuation techniques used to derive level 2 fair values - Lease hold premises
Fair value of lease hold premises has been derived using a sales comparison approach. Thevaluation is considered on the basis of location, needs of the buyer, the overall prevailing marketsituation and other consideration associated with such type of property. The most significant inputin this valuation approach is price / rate per square foot in particular locality. This valuation isconsidered to be level 2 in fair value hierarchy due to significant observable inputs used in thevaluation.
13.3
13.3.2
13.4
13.3.1
Year ended June 30, 2016
Net carrying value basis
Opening book value
Additions during the year
Disposal (NBV)
Depreciation charge
Closing net book value
Gross carrying value basis
Cost
Accumulated depreciation
Net book value
Year ended June 30, 2015
Net carrying value basis
Opening book value
Additions during the year
Disposal - (NBV)
Depreciation charge
Closing net book value
Gross carrying value basis
Cost
Accumulated depreciation
Net book value
Depreciation rate % per annum
Description
13.5 Fixed assets - Ijarah finance
(Rupees)
48,873,984
56,189,662
-
(27,264,852)
77,798,794
115,663,662
(37,864,868)
77,798,794
21,038,614
37,344,000
-
(9,508,630)
48,873,984
59,474,000
(10,600,016)
48,873,984
20 to 50
Machinery
2,976,248
-
-
(1,074,780)
1,901,468
4,098,740
(2,197,272)
1,901,468
2,183,528
1,867,500
-
(1,074,780)
2,976,248
4,098,740
(1,122,492)
2,976,248
20 to 33.33
Vehicles
51,850,232
56,189,662
-
(28,339,632)
79,700,262
119,762,402
(40,062,140)
79,700,262
23,222,142
39,211,500
-
(10,583,410)
51,850,232
63,572,740
(11,722,508)
51,850,232
Total
13.6 The detail of �property, plant and equipment - own use / ijarah finance disposed off during theyear is as follow:

FOR THE YEAR ENDED JUNE 30, 2016
53
13.7
403,000
1,105,000
1,377,785
2,885,785
337,905
236,506
3,460,196
2,087,500
Original
Cost
Accumulated
depriciation
80,600
103,096
275,558
459,254
3,046
-
462,300
-
Written
down value
293,900
628,000
838,000
1,759,900
59,500
7,000
1,826,400
-
Sale
proceeds
213,300
524,904
562,442
1,300,646
56,454
7,000
1,364,100
-
Gain / (loss)
on disposal
Bid sale
Bid sale
Lease
Scrap sale
Scrap sale
End of
Ijarah term
Mode of
disposal
Mr. Waqar Ahmed Khan
Mr. Waseem Mirza
Mr. Ayaz Latif
Various buyers
Excellent Computer
Scrap
Lessee
Particulars
of buyer
Rupees2016
Vehicle
AJZ-632
AEK-596
AJQ-517
Office
equipment
Computer
equipment
Total
2015
322,400
1,001,904
1,102,227
2,426,531
334,859
236,506
2,997,896
2,087,500
As at June 30, 2016 cost of asset acquired under Ijarah arrangements amounts toRs. 1.88 million (2015: nil) which do not form part of the assets of the Company in accordancewith the requirements to IFAS 2.
1,468,082Intangible assets
14. INTANGIBLE ASSETS
1,590,01914.1
2015Note 2016Rupees
Year ended June 30, 2016
Net carrying value basis
Opening book value
Additions during the year
Disposal (NBV)
Amortisation charge
Closing net book value
Gross carrying value basis
Cost
Accumulated amortisation
Net book value
Year ended June 30, 2015
Net carrying value basis
Opening book value
Additions during the year
Disposal (NBV)
Amortisation charge
Closing net book value
Gross carrying value basis
Cost
Accumulated amortisation
Net book value
Amortisation rate % per annum
Description
14.1 Intangible assets
1,168,478
271,739
-
-
1,440,217
1,440,217
-
1,440,217
-
1,168,478
-
-
1,168,478
1,168,478
-
1,168,478
-
299,604
-
-
(149,802)
149,802
749,010
(599,208)
149,802
449,406
-
-
(149,802)
299,604
749,010
(449,406)
299,604
20
1,468,082
271,739
-
(149,802)
1,590,019
2,189,227
(599,208)
1,590,019
449,406
1,168,478
-
(149,802)
1,468,082
1,917,488
(449,406)
1,468,082
(Rupees)
Software
under
development
Computer
SoftwareTotal

2,649,138
180,544
5,402,964
-
-
938,227
9,170,873
3,957,545
184,412
19,682
4,161,639
2015
Accrued liabilities
Unclaimed dividend
Sundry creditors - Lease
Security deposit
Unearned rental income
Other liabilities
15. TRADE AND OTHER PAYABLES
3,087,417
180,544
4,258,740
2,054,052
5,796,991
1,326,832
16,704,576
7,816,197
594,036
-
8,410,233
2016
Rupees
Accrued mark-up on:
Certificates of investment
Running finance facilities
Short term loan from a related party
16. ACCRUED MARKUP
Note
17.1 These represent certificates of investment issued by the Company for periods ranging from 3to 12 months and carry mark-up rates ranging from 7% to 9.5% (2015: 8.5% to 11%) per annum.
192,856,269From banking companies - secured
Running finances under mark-up arrangements
18. SHORT TERM BORROWING
187,854,56418.1
137,107,176
165,018,986
(110,779,993)
(34,879,938)
156,466,231
Opening balance
Certificates issued during the year
Rolled over during the year
Payments made during the year
Closing balance
17. CERTIFICATES OF INVESTMENT - unsecured
156,466,231
289,835,005
(180,816,230)
(650,000)
264,835,006
17.1
The Company has availed short-term running finance facilities from various commercial bankshaving sanctioned limit amounting to Rs. 250 million (2015: Rs. 200 million). The facilities carrymark-up at the rate ranging from 3 months KIBOR plus 1.5% to 3 months KIBOR plus 2.5% perannum. The facilities are secured by hypothecation charge over leased assets and lease rentalsreceivable.
18.1
19.1 The amount represented unsecured short term finance availed from a related party that carriedmark-up at the rate of 6 months KIBOR plus 2% per annum.
40,000,000Short term loan from a related party
19. SHORT TERM LOAN FROM A RELATED
PARTY - unsecured
-19.1
Long-term security deposits
Current portion shown under current liabilities
20. LONG-TERM DEPOSITS
562,260,510
(79,415,142)
482,845,368
20.1
20.1
406,449,533
(60,658,383)
345,791,150
54
FOR THE YEAR ENDED JUNE 30, 2016

55
FOR THE YEAR ENDED JUNE 30, 2016
19,740,990
3,204,615
122,044,365
30,212
145,020,182
(2,121,856)
(280,976)
(8,649,901)
-
(324,237)
(11,376,970)
133,643,212
Taxable temporary difference arising in respect of:
Surplus on revaluation of fixed assets
Accelerated tax depreciation
Investment in finance lease and tax book value of assets
given on finance lease
Long-term investments
Deductible temporary difference arising in respect of:
Carried forward tax losses
Provision against potential lease losses
Provision against other receivable
Accelerated tax depreciation
Provision for leave encashment
22. DEFERRED TAXATION - Net
35,652,713
-
141,990,199
46,282
177,689,194
(8,467,816)
(272,195)
(8,379,592)
(428,820)
(364,063)
(17,912,486)
159,776,708
22.1
20152016
Rupees
20.1 These represent interest free security deposits received against lease contracts and are refundable/ adjustable at the expiry / termination of the respective leases.
Advance rental against Ijarah leasing
Current portion shown under current liabilities
21. ADVANCE RENTAL AGAINST IJARAH LEASING
22,737,515
14,601,119
(8,136,396) 10,559,822
7,222,006
(3,337,816)
22.2 Movement in temporary differences is as follows:
35,652,713
(428,820)
46,282
141,990,199
(8,467,816)
(272,195)
(8,379,592)
(364,063)
159,776,708
Surplus on revaluation of
property, plant & equipment
Excess of accounting WDV
over Tax WDV
Long-term investments
Investment in finance lease
and tax book value of assets
given on finance lease
Recognised tax losses
Provision against potential
lease losses
Provision against other
receivable
Provision for leave encashment
(17,236,311)
-
-
-
-
-
-
-
(17,236,311)
19,740,990
3,204,615
30,212
122,044,365
(2,121,856)
(280,976)
(8,649,901)
(324,237)
133,643,212
(1,324,588)
(3,633,435)
16,070
19,945,834
(6,345,960)
8,781
270,309
(39,826)
8,897,185
Balance
as at
July 1, 2015
Balance
as at
June 30, 2016
Rupees
Recognised
in profit and
loss account
Recognised
in equity

FOR THE YEAR ENDED JUNE 30, 2016
56
23.1 As at June 30, 2016, 10,646,529 shares (2015: 10,650,076 shares) of the Company were
held by related parties.
23.2 The Board of Directors of the Company in its meeting held on April 29, 2015 had recommended
to issue 28.15496 % right shares at a discount of Rs. 3 per share in proportion of 2.815496
shares for every 10 share. The proposed right issue was subject to approval from shareholders
and regulatory authorities. However, the Securities and Exchange Commission of Pakistan
vide its letter dated November 30, 2015 has not acceded to the request of right issue of
shares at discount. Accordingly, the recommendation could not be put into effect.
Authorised capital
Ordinary shares of Rs. 10 each50,000,00050,000,000
Number of shares
Issued, Subscribed and paid-up share capital
100,000,000
23,698,000
130,000,000
253,698,000
Ordinary shares of Rs.10 each
fully paid in cash
Ordinary shares of Rs. 10 each
issued as fully paid bonus shares
Ordinary shares of Rs. 10 each
issued as fully paid Right shares
10,000,000
2,369,800
13,000,000
25,369,800
10,000,000
2,369,800
13,000,000
25,369,800
100,000,000
23,698,000
130,000,000
253,698,000
23. SHARE CAPITAL
500,000,000
2016 2015Rupees
500,000,000
2016 2015
61,603,092
4,402,000
66,005,092
183,530,210
249,535,302
RESERVES
Capital reserve
Statutory reserve
Reserve for issue of bonus shares
Revenue reserve
Unappropriated profit
24.
24.1 69,745,972
4,402,000
74,147,972
219,050,003
293,197,975
24.1 In accordance with the requirements of the NBFC Regulations, an amount of not less than
20 percent of after tax profits shall be transferred to statutory reserve till such time when
the reserve equals the amount of paid-up capital, and thereafter a sum of not less than
5 percent shall be transferred. Consequently, during the current year the Company has
transferred an amount of Rs. 8.143 million (2015: Rs. 10.057 million) to its statutory
reserve.

57
FOR THE YEAR ENDED JUNE 30, 2016
26. CONTINGENCIES AND COMMITMENTS
26.1 Contingency
26.1.1 The Alternate Corporate Tax charge for the Tax Year 2016, 2015 and 2014 amounted toRs. 8.702 million, Rs. 9.233 million and Rs. 8.100 million, respectively which is Rs. 7.127 million,Rs. 8.005 million and Rs. 7.140 million in excess of the minimum tax payable at Rs. 1.575 million,Rs. 1.228 million and Rs. 0.960 million, respectively under section 113 of the Income TaxOrdinance, 2001 (Ordinance). The Company has filed a Constitutional Petition against the levyand payment of Alternate Corporate Tax (ACT) in the Honorable Sindh High Court and onDecember 29, 2014 the Honorable Court has issued an order restraining the Federal Board ofRevenue (FBR) from taking any coercive action against the Company. Accordingly, payment foronly minimum tax has been made. The Company has a strong case and the management isconfident that the decision will be in the Company's favor.
26.1.2 The Assistant Commissioner of the Sindh Revenue Board (SRB) vide Order-in-original No. 551of 2016 dated June 15, 2016 has created a demand amounting to Rs. 3.199 million under Sections23, 43(2)(3)(6d) and 44 of the Sindh Sales Tax on Services Act, 2011 (the �Act�) relating to TaxYears 2012 to 2015. The demand includes Rs. 2.353 million on account of sales tax on Incomefrom Ijarah Operations. The Company has filed an appeal against the Order under Section 57of the Sindh Sales Tax on Services Act, 2011 before the Commissioner (Appeals) of the SRB.Further, a Constitutional Petition against the Order in the Honorable Sindh High Court was alsofiled by the Company subsequent to the year end which has been disposed of by the HonorableSindh High Court with the consent of both the parties with direction to the SRB not to enforcerecovery of the impugned demand, which is subject to matter of the appeal before the Commissioner(appeals), SRB, till final disposal of such appeal. In case of any adverse order passed by theCommissiner (Appeals), SRB, SRB has been further directed that recovery of the impugneddemand shall not be enforced through coercive measures for another period of seven days toenable the Company to file appeal before the Appellate Tribunal in accordance with law.
No payment against the unjustified demand created under the Order has been made by theCompany. The Company has a strong case and the management is confident that the outcomeof the appeal will be in the Company's favor. Accordingly, no provision has been recorded inrespect of the matter.
Surplus on revaluation of leasehold premises as at July 01
Surplus on revaluation conducted during the year
Transferred to unappropriated profit in respect of incremental
depreciation charged during the year - net of deferred tax
Related deferred tax liability of incremental depreciation
charged during the year
Surplus on revaluation of operating fixed asset as at June 30
Related deferred tax liability at the beginning of the year
Related deferred tax liability on surplus on revaluation
conducted during the year
Related to incremental depreciation charged during the year
Effect of change in tax rate
65,117,851
-
(2,330,534)
(1,096,722)
(3,427,256)
61,690,595
22,791,248
-
(1,096,722)
(1,953,536)
19,740,990
41,949,605
25. SURPLUS ON REVALUATION OF
PROPERTY, PLANT AND EQUIPMENT
- net of deferred tax
61,690,595
57,591,019
(2,948,276)
(1,324,588)
(4,272,864)
115,008,750
19,740,990
17,853,216
(1,324,588)
(616,905)
35,652,713
79,356,037
2016 2015
Rupees

FOR THE YEAR ENDED JUNE 30, 2016
58
20152016
Rupees
40,842,000Commitments for finance lease
26.2 Commitments
55,960,530
Note
26.2.1
This represents the rentals receivable by the Company in respect of Ijarah assets.
26.2.2 Contractual rentals receivable on Ijarah contracts
76,425,89547,441,58328,984,312
TotalDue after 1 year
but within
5 years
Due within 1
year
2016
(Rupees)
Rentals receivable in future
102,446,65176,425,89526,020,756
TotalDue after 1 year
but within
5 years
Due within 1
year
2015
(Rupees)
Rentals receivable in future
This represents the Ijarah rentals payable by the Company in respect of asset acquired
under Ijarah arrangement.
26.2.3 Ijarah rentals payable
1,415,492762,188653,304
TotalDue after 1 year
but within
5 years
Due within 1
year
2016
(Rupees)
Future Ijarah rentals payable
---
TotalDue after 1 year
but within
5 years
Due within 1
year
2015
(Rupees)
Future Ijarah rentals payable

FOR THE YEAR ENDED JUNE 30, 2016
59
20152016
Rupees
Note
102,550,969
466,254
574,402
953,750
328,800
12,278,359
117,152,534
Finance Income
Gain / (loss) on lease termination
Late payment charges
Processing fee
Documentation charges
Income from Ijarah operations
107,566,457
(2,416,770)
851,812
1,748,625
447,500
34,278,064
142,475,688
27. INCOME FROM LEASING OPERATIONS
27.1
9,962,201
52,500
20,200
1,941,744
301,714
12,278,359
Ijarah rental income
Processing fee
Documentation charges
Advance rental amortisation
Others
26,388,932
56,500
26,800
7,221,974
583,858
34,278,064
27.1 Income from Ijarah operations
27.1.1
27.1.1 Ijarah rental income comprises of principal and profit component.
877,649
2,526,202
-
222,630
3,626,481
Profit on bank accounts
Income from Pakistan Investment Bonds
Income from Market Treasury Bills
Dividend income
2,170,468
2,956,428
357,977
475,125
5,959,998
28. RETURN ON INVESTMENT
28.1
28.2
28.1 This amount includes Rs. 3,206 (2015: Rs. 1,175) which represents profit on bank account(s)
maintained with Islamic bank(s) by the Company.
28.2 This amount represents dividend income earned during the year on investment in National
Investment Unit Trust.
3,388
-
-
18,450
21,838
Income from financial assets
Income from non-financial assets
Gain on disposal of fixed assets
Rental income
Others
5,866
1,364,100
1,734,533
131,175
3,235,674
29. OTHER INCOME
13.6
29.1
29.1 This amount includes commitment fees, duplicate transfer letter charges and
miscellaneous income.
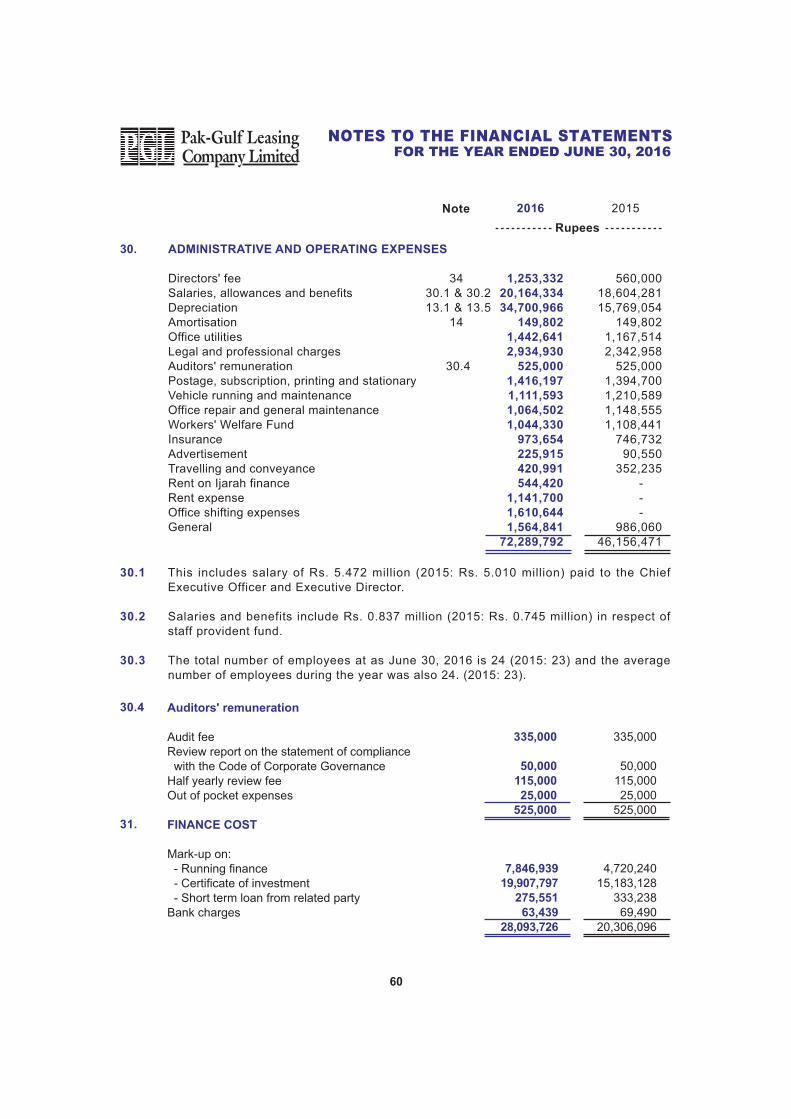
FOR THE YEAR ENDED JUNE 30, 2016
60
560,000
18,604,281
15,769,054
149,802
1,167,514
2,342,958
525,000
1,394,700
1,210,589
1,148,555
1,108,441
746,732
90,550
352,235
-
-
-
986,060
46,156,471
1,253,332
20,164,334
34,700,966
149,802
1,442,641
2,934,930
525,000
1,416,197
1,111,593
1,064,502
1,044,330
973,654
225,915
420,991
544,420
1,141,700
1,610,644
1,564,841
72,289,792
ADMINISTRATIVE AND OPERATING EXPENSES
Directors' fee
Salaries, allowances and benefits
Depreciation
Amortisation
Office utilities
Legal and professional charges
Auditors' remuneration
Postage, subscription, printing and stationary
Vehicle running and maintenance
Office repair and general maintenance
Workers' Welfare Fund
Insurance
Advertisement
Travelling and conveyance
Rent on Ijarah finance
Rent expense
Office shifting expenses
General
30.
34
30.1 & 30.2
13.1 & 13.5
14
30.4
20152016
Rupees
Note
30.1 This includes salary of Rs. 5.472 million (2015: Rs. 5.010 million) paid to the Chief
Executive Officer and Executive Director.
30.2 Salaries and benefits include Rs. 0.837 million (2015: Rs. 0.745 million) in respect of
staff provident fund.
30.3 The total number of employees at as June 30, 2016 is 24 (2015: 23) and the average
number of employees during the year was also 24. (2015: 23).
Auditors' remuneration
Audit fee
Review report on the statement of compliance
with the Code of Corporate Governance
Half yearly review fee
Out of pocket expenses
30.4
335,000
50,000
115,000
25,000
525,000
335,000
50,000
115,000
25,000
525,000
FINANCE COST
Mark-up on:
- Running finance
- Certificate of investment
- Short term loan from related party
Bank charges
31.
4,720,240
15,183,128
333,238
69,490
20,306,096
7,846,939
19,907,797
275,551
63,439
28,093,726
FOR THE YEAR ENDED JUNE 30, 2016
61
EARNINGS PER SHARE - BASIC AND DILUTED
Profit after taxation attributable to
ordinary shareholders
Weighted average number of
outstanding ordinary shares
Earning per share - basic and diluted
There were no convertible dilutive potential ordinary shares in issue as at June 30, 2016.
50,284,982
25,369,800
1.98
40,714,397
25,369,800
1.60
33.1
33.
2016 2015
Rupees
(Rupees)
(Number of shares)
34. REMUNERATION OF CHIEF EXECUTIVE, DIRECTORS AND EXECUTIVES
32.1 Numerical reconciliation between the average tax rate and the applicable tax rate has not
been presented as Company is subject to the provisions of taxation under Section 113 of the
Income Tax Ordinance, 2001.
32.2 The returns of income have been filed upto and including Tax Year 2015 corresponding to
financial year ended June 30, 2015 under self assessment scheme. However, the return may
be selected for which an amendment within six years from the end of the respective Tax Year
and within five years from the end of financial year in which assessment order is issued as
treated to have been issued for that tax years to the Company respectively.
32.3 During the last financial year, the Company had filed revised tax returns for Tax Year 2011
and Tax Year 2012 to claim refund of cumulative excess tax charged for those Tax Years
amounting to Rs. 4.368 million after obtaining requisite approval from the Income Tax
authorities under the Income Tax Ordinance, 2001.
1,228,026
(4,368,702)
7,169,305
4,028,629
32. TAXATION
Current
Prior
Deferred
1,574,547
-
8,897,185
10,471,732
32.3
22.2
Note
Managerial
remuneration
Housing and utilities
Provident Fund
contribution
Number of persons
Rupees
2016
1,858,068
1,021,932
-
2,880,000
1
Chief
Executive
Officer
1,253,332
-
-
1,253,332
7
NonExecutiveDirectors
6,112,982
3,774,174
172,837
10,059,993
6
Executive
Director &
Executives
2015
1,703,226
936,774
-
2,640,000
1
Chief
Executive
Officer
560,000
-
-
560,000
7
NonExecutiveDirectors
5,610,921
3,337,995
122,580
9,071,496
6
Executive
Director &
Executives
34.1 The executives of the Company are also entitled to free use of Company owned and maintained
vehicles.
34.2 The amount charged in the financial statements as the fee of directors for attending a Board
of Directors meeting was Rs. 40,000 per meeting.
35. TRANSACTIONS AND BALANCES WITH RELATED PARTIES
The Company has related party relationships with the companies with common directorship,
directors of the company, key management personnel and employee's contribution plan
(provident fund).
Contributions to the provident fund are made in accordance with the terms of employment.
Salaries and allowances of the key management personal are in accordance with the terms
of employment. Other transactions are at agreed terms.
2016 2015
Rupees
31
Note
Certificates of investment
Certificates of investment issued
during the year
Certificates of investment matured
during the year
Financial charges on above certificates
of investment for the year
Certificates of Investment
Certificates of investment issued
during the year
Certificates of investment matured
during the year
Financial charges on above certificates
of investment for the year
Finance Lease
Finance leases disbursed during
the year
Rental received / adjusted
Finance leases disbursed during
the year
Rental received / adjusted
Short term loan
Short term loan obtained during the year
Short term loan repaid during the year
Financial charges on short term
loan for the year
62,800,510
66,285,510
6,868,634
89,265,720
69,265,720
8,233,811
4,502,500
1,109,355
4,400,000
1,287,057
50,000,000
32,000,000
333,238
62,400,000
108,178,990
8,991,994
26,000,000
96,506,015
10,279,494
-
5,891,845
-
1,907,904
-
40,000,000
275,551
Directors
Directors
Directors
Close relatives
of directors
Close relatives
of directors
Close relatives
of directors
Directors
Directors
Associated
undertaking
Associated
undertaking
Associated
undertaking
Associated
undertaking
Associated
undertaking
Relation with
the Company
Nature of transaction
FOR THE YEAR ENDED JUNE 30, 2016
62
FOR THE YEAR ENDED JUNE 30, 2016
63
2016 2015
Rupees
19
16
Note
35.1
Any receivable from related parties was not overdue at June 30, 2016. Particulars of
remuneration to chief executive, directors and executives are disclosed in note 34 to these
financial statements.
Prepaid rent and Security deposit
Prepaid rent paid during the year
Security deposit paid during the year
Prepaid rent paid charged as expense
the year
Employee �P�rovident Fund
Contribution during the year
Year ended balances
Certificates of investment
Accrued mark-up on above
Certificates of investment
Closing balance of rentals receivable
related to finance leases
Short term loan
Accrued mark-up on short term loan
Prepaid rent
Security deposit
-
-
-
745,634
152,066,230
3,765,052
14,309,838
40,000,000
19,682
-
-
2,695,000
245,000
980,000
837,298
253,085,005
7,441,240
6,510,089
-
-
1,715,000
245,000
Associated
undertaking
Associated
undertaking
Associated
undertaking
Relation with
the Company
Nature of transaction
Size of the fund - Net assets
Cost of investments made
Percentage of the investments made
Fair value of the investments made
4,452,274
252,000
6%
520,774
4,501,061
252,000
6%
532,210
The Company operates approved funded contributory provident fund for both its management
and non management employees. Details of net assets and investments of the fund is as follows:
PROVIDENT FUND DISCLOSURE36.

FOR THE YEAR ENDED JUNE 30, 2016
64
The management, based on the unaudited financial statements of the Fund, is of the view that
the investments out of provident fund have been made in accordance with the provisions of
section 227 of the Companies Ordinance, 1984 and Rules formulated for this purpose.
43,753,913
(192,856,269)
(149,102,356)
37. CASH AND CASH EQUIVALENTS
Cash and cash equivalents comprise of the
following items:
Cash and bank balances
Short term borrowings 44,296,138
(187,854,564)
(143,558,426)
2016 2015
RupeesNote
5
18
38. FINANCIAL RISK MANAGEMENT
Introduction and overview
The Company has exposure to the following risks from its use of financial instruments:
- Credit risk
- Liquidity risk
- Market risk
38.1 Risk management framework
The Board of Directors has overall responsibility for the establishment and oversight of
the Company�s risk management framework. The Board is also responsible for developing
and monitoring the Company's risk management policies.
The Company�s risk management policies are established to identify and analyse the risks faced
by the Company, to set appropriate risk limits and controls, and to monitor risks and adherence
to limits. Risk management policies and systems are reviewed regularly to reflect changes in
market conditions and the Company�s activities. The Company, through its training and management
standards and procedures, aims to develop a disciplined and constructive control environment
in which all employees understand their roles and obligations.
38.2 Credit risk
Credit risk is the risk that a counterparty to a financial instrument will fail to discharge an obligation
or commitment that it has entered into with the Company, resulting in a financial loss to the
Company. The risk is generally limited to principal amounts and accrued interest thereon, if any,
and arises principally from the Company's receivables from customers and balances with the
banks.
The breakup of the fair value of the investments is:
Mutual Funds 100520,774100532,210
2016
Rupees %
2015
Rupees %

FOR THE YEAR ENDED JUNE 30, 2016
65
38.2.1 Management of credit risk
The Company's policy is to enter into financial contracts in accordance with the internal risk
management policies and the requirements of the NBFC Rules and Regulations. The Company
attempts to control credit risk by monitoring credit exposures, limiting transactions with specific
counter parties, and continually assessing the credit worthiness of counter parties.
38.2.2 Exposure to credit risk
In summary, compared to the maximum amount included in the balance sheet, the maximum
exposure to credit risk as at June 30, 2016 is as follows:
Cash and bank balances
Investments
Ijarah rental receivables
Advances to employees
Accrued markup /
return on investment
Net Investment in
finance lease
Other receivable - net
Long term deposits
43,736,831
3,461,625
-
78,304
-
883,108,935
1,328,723
109,500
931,823,918
43,753,913
28,206,036
-
78,304
1,229,408
1,289,558,468
1,328,723
109,500
1,364,264,352
44,294,713
3,537,645
904,009
196,006
180,000
976,393,970
1,795,739
300,460
1,027,602,542
44,296,138
43,458,506
904,009
196,006
1,475,668
1,538,654,480
1,795,739
300,460
1,631,081,006
2016
Rupees
2015
Balance
Sheet
Maximum
exposure
Balance
Sheet
Maximum
exposure
Differences in the balances as per balance sheet and maximum exposures in investments
and investment in finance lease were due to the fact that investments of Rs. 39.921 million
(2015: Rs. 24.744 million) relates to investments in government securities and investment
in finance lease includes Rs. 562.261 million (2015: Rs. 406.449 million) relating to security
deposit which are not considered to carry credit risk.
38.2.3 Credit ratings and Collaterals
Details of the credit ratings of balances with the banks as at 30 June were as follows:
0.66%
50.14%
11.10%
0.24%
0.18%
37.09%
0.59%
100.00%
2015Ratings
AAA
AA+
AA
AA-
A+
A
A-
2.54%
31.84%
7.91%
0.48%
15.09%
6.45%
35.69%
100.00%
2016
FOR THE YEAR ENDED JUNE 30, 2016
66
Impairment is recognised by the Company in accordance with NBFC Regulations, 2008
and subjective evaluation of investment portfolio is carried out on an ongoing basis.
* No impairment loss has been recorded as these finance leases do not meet the criteria
for provisioning requirements under NBFC Regulations, 2008.
38.2.4 Description of Collaterals held
The Company's leases are secured against assets leased out and post dated cheques. In a few
leases additional collateral is also obtained.
38.2.5 Aging analysis of net investment in finance lease
-
-
-
-
878,049
878,049
-
-
-
-
-
878,049
878,049
Past due
Neither over due not impaired
1 - 89 days *
90 days - 1 year
1 year - 2 years
2 years - 3 years
More than 3 years
Carrying
Amount
Amount on
which no
impairment
recognised
Amount on
which
impairment
recognised
Impairment
recognised
1,532,555,637
6,098,843
-
-
-
878,049
1,539,532,529
1,532,555,637
6,098,843
-
-
-
-
1,538,654,480
Rupees
2016
-
-
-
-
878,049
878,049
-
-
-
-
-
878,049
878,049
Past due
Neither over due not impaired
1 - 89 days *
90 days - 1 year *
1 year - 2 years
2 years - 3 years
More than 3 years
Carrying
Amount
Amount on
which no
impairment
recognised
Amount on
which
impairment
recognised
Impairment
recognised
1,280,111,874
6,053,432
3,393,162
-
-
878,049
1,290,436,517
1,280,111,874
6,053,432
3,393,162
-
-
-
1,289,558,468
Rupees
2015
38.2.6 Concentration of credit risk - gross investment in finance lease
The Company seeks to manage its credit risk through diversification of financing activities
to avoid undue concentration of credit risk with individuals or groups of customers in
specific locations or business sectors.

FOR THE YEAR ENDED JUNE 30, 2016
67
The management of the Company follows two sets of guidelines. Internally, it has its own
operating policy duly approved by the Board of Directors whereas externally it adheres
to the regulations issued by the Securities and Exchange Commission of Pakistan. The
operating policy defines the extent of exposures with reference to a particular sector or
group of leases.
Details of the composition of gross investment in finance lease portfolio of the Company
are given below:
1.21
9.73
18.40
0.22
1.04
0.69
4.39
4.42
2.87
3.56
8.94
0.37
0.59
0.66
0.02
42.90
100.00
18,304,526
147,381,149
278,695,541
3,404,660
15,733,291
10,391,244
66,560,704
66,963,352
43,405,182
53,858,758
135,429,562
5,631,333
8,934,830
10,060,457
356,594
649,868,546
1,514,979,729
Energy, oil and gas
Steel, engineering and auto
Electrical goods
Transport and communication
Chemical, fertilizer and
pharmaceuticals
Textile
Glass and ceramics
Food, tobacco and
beverage
Hotels
Construction
Health care
Advertisement
Services
Packaging
Banking and Financial
Institutions
Others
Rupees Percentage Rupees Percentage
135,459,061
104,503,295
221,503,525
7,483,458
26,617,560
8,220,659
13,673,255
25,911,741
114,224,949
62,548,587
91,382,766
6,598,664
77,736,939
6,572,070
-
893,558,089
1,795,994,618
7.54
5.82
12.33
0.42
1.48
0.46
0.76
1.44
6.36
3.48
5.09
0.37
4.33
0.37
-
49.75
100.00
2016 2015
38.3 Liquidity risk
Liquidity risk is the risk that the Company will encounter difficulty in meeting its financial
obligations as they fall due. Liquidity risk arises because of the possibility that the Company
could be required to pay its liabilities earlier than expected or difficulty in raising funds to
meet commitments associated with financial liabilities as they fall due.
38.3.1 Management of liquidity risk
The Company manages liquidity risk by following the internal guidelines of the management
such as monitoring maturities of financial liabilities, continuously monitoring its liquidity
position and ensuring availability of the funds by maintaining flexibility in funding by keeping
committed credit lines available, under both normal and stress conditions, without incurring
unacceptable losses or risking damage to the Company's reputation.
38.3.2 Maturity analysis for financial liabilities
The table below summarises the maturity profile of the Company�s liabilities:

FOR THE YEAR ENDED JUNE 30, 2016
68
38.3.3 The contractual cash flow relating to the above financial liabilities have been determined
on the basis mark-up rates effective at year end. The rates of mark-up have been disclosed
in notes 17 to 19 to these financial statements.
38.4 Market risk
Market risk is the risk that changes in market prices, such as interest rates, equity prices,
foreign exchange rates and credit spreads (not relating to changes in the obligor�s/issuer�s
credit standing) will affect the Company�s income or the value of its holdings of financial
instruments.
38.4.1 Management of market risk
The objective of market risk management is to manage and control market risk exposures
within acceptable parameters, while optimising the return on risk. The Company manages
the market risk by monitoring exposure on marketable securities by following internal risk
management policies and regulations laid down by the Securities and Exchange Commission
of Pakistan. The Company is exposed to interest rate and other price risk only.
38.4.2 Interest rate risk
Interest rate risk is the risk that the fair value or future cash flows of a financial instrument
will fluctuate because of changes in market interest rates. Majority of the interest rate
exposure arises on investment in finance lease, investment in government securities, bank
balances and borrowing from banks. The Company carries a mix of fixed and floating rate
financial instruments.
At June 30, details of the interest rate profile of the Company's interest bearing financial
instruments were as follows:
Total
Rupees
Contractualcash flow
Over fiveyears
2016
Upto threemonths
More thanthree months and
uptoone year
More thanone year and
uptofive years
Non derivative financial
liabilities
Trade and other payable
Accrued mark-up
Certificate of investment -
unsecured
Short term borrowing
14,975,355
8,410,233
264,835,006
187,854,564
476,075,158
14,975,355
8,410,233
276,822,668
187,854,564
488,062,820
14,975,355
8,410,233
68,411,567
138,111,293
229,908,448
-
-
208,411,101
49,743,271
258,154,372
-
-
-
-
-
-
-
-
-
-
Total
Rupees
Contractualcash flow
Over fiveyears
2015
Upto threemonths
More thanthree months and
uptoone year
More thanone year and
uptofive years
Non derivative financial
liabilities
Trade and other payable
Accrued mark-up
Certificate of investment -
unsecured
Short term borrowing
Short term loan - related party
7,377,541
4,161,639
156,466,231
192,856,269
40,000,000
400,861,680
7,377,541
4,161,639
167,416,844
192,856,269
40,295,233
412,107,526
7,377,541
4,161,639
28,644,371
192,856,269
40,295,233
273,335,053
-
-
138,772,473
-
-
138,772,473
-
-
-
-
-
-
-
-
-
-
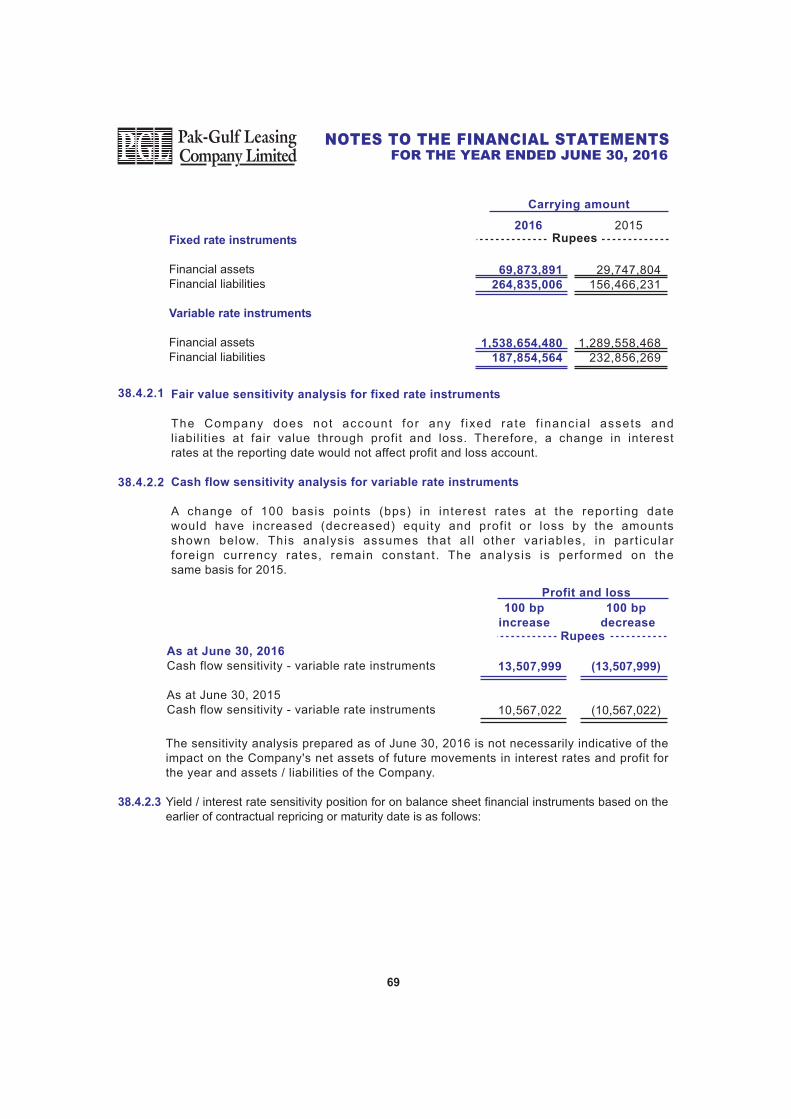
100 bp
decrease
(13,507,999)
(10,567,022)
As at June 30, 2016
Cash flow sensitivity - variable rate instruments
As at June 30, 2015
Cash flow sensitivity - variable rate instruments
100 bp
increase
13,507,999
10,567,022
Rupees
Profit and loss
The sensitivity analysis prepared as of June 30, 2016 is not necessarily indicative of the
impact on the Company's net assets of future movements in interest rates and profit for
the year and assets / liabilities of the Company.
38.4.2.3 Yield / interest rate sensitivity position for on balance sheet financial instruments based on the
earlier of contractual repricing or maturity date is as follows:
69
FOR THE YEAR ENDED JUNE 30, 2016
Fair value sensitivity analysis for fixed rate instruments
The Company does not account for any f ixed rate f inancia l assets and
liabilities at fair value through profit and loss. Therefore, a change in interest
rates at the reporting date would not affect profit and loss account.
Cash flow sensitivity analysis for variable rate instruments
A change of 100 basis points (bps) in interest rates at the report ing date
would have increased (decreased) equity and profit or loss by the amounts
shown below. This analysis assumes that al l other variables, in part icular
foreign currency rates, remain constant. The analysis is performed on the
same basis for 2015.
29,747,804
156,466,231
1,289,558,468
232,856,269
Fixed rate instruments
Financial assets
Financial liabilities
Variable rate instruments
Financial assets
Financial liabilities
69,873,891
264,835,006
1,538,654,480
187,854,564
2016 2015Rupees
Carrying amount
38.4.2.1
38.4.2.2

Financial assets
Cash and bank balances
Short term investments
Other receivables - net
Loans and advances to employees
- considered good
Accrued mark-up / return on
investments
Net investment in finance lease
(net of security deposit)
Long-term Investments
Long-term deposits
Financial liabilities
Trade and other payables
Accrued mark-up
Certificates of investment - unsecured
Short term borrowings
Short term loan - related party
On balance sheet gap
Effectivemark-up/interest/
profit rate
RupeesPercent(%)
Total
5 - 6.25
-
-
-
-
10.51 - 22.36
9.25 - 11.5
-
-
-
8.5 - 11
9.49 - 10.49
8.98
43,753,913
3,461,625
1,328,723
78,304
1,229,408
883,108,935
24,744,411
109,500
957,814,819
7,377,541
4,161,639
156,466,231
192,856,269
40,000,000
400,861,680
556,953,139
5,003,393
-
-
-
-
95,636,474
-
-
100,639,867
-
-
25,857,710
192,856,269
40,000,000
258,713,979
(158,074,112)
-
-
-
-
-
282,313,981
-
-
282,313,981
-
-
130,608,521
-
-
130,608,521
151,705,460
-
-
-
-
-
1,201,558
-
-
1,201,558
-
-
-
-
-
1,201,558
Over fiveyears
2015
Upto threemonths
More thanthree months and
uptoone year
More thanone year and
uptofive years
Exposed to mark-up / interest / profit rate risk
38,750,520
3,461,625
1,328,723
78,304
1,229,408
-
-
109,500
44,958,080
7,377,541
4,161,639
-
-
-
11,539,180
33,418,900
Not exposedto mark-up/
interest /profit rate
risk
-
-
-
-
-
503,956,922
24,744,411
-
528,701,333
-
-
-
-
-
-
528,701,333
The effective mark-up / interest / profit rate for each of the monetary financial instrument is as indicated
above.
70
FOR THE YEAR ENDED JUNE 30, 2016
Financial assets
Cash and bank balances
Short term investments
Other receivables - net
Ijarah rental receivables
Loans and advances to employees
- considered good
Accrued mark-up / return on
investments
Net investment in finance lease
(net of security deposit)
Long-term Investments
Long-term deposits
Financial liabilities
Trade and other payables
Accrued mark-up
Certificates of investment - unsecured
Short term borrowings
On balance sheet gap
Effectivemark-up/interest/
profit rate
RupeesPercent(%)
Total
4 - 5.7
5.95-6.35
-
12.04-12.88
-
-
8.08 - 17.92
9.25 - 11.5
-
-
-
7 - 9.5
7.85 - 8.85
44,296,138
16,259,209
1,795,739
904,009
196,006
1,475,668
976,393,970
27,199,297
300,460
1,068,820,496
14,975,355
8,410,233
264,835,006
187,854,564
476,075,158
592,745,338
29,049,021
6,462,496
-
904,009
-
-
108,539,271
-
-
144,954,797
-
-
68,103,273
138,111,293
206,214,566
(61,259,769)
-
6,259,068
-
-
-
-
311,157,466
-
-
317,416,534
-
-
196,731,733
49,743,271
246,475,004
70,941,530
-
-
-
-
-
198,244
-
-
198,244
-
-
-
-
-
198,244
Over fiveyears
2016
Upto threemonths
More thanthree months and
uptoone year
More thanone year and
uptofive years
Exposed to mark-up / interest / profit rate risk
15,247,117
3,537,645
1,795,739
-
196,006
1,475,668
-
-
300,460
22,552,635
14,975,355
8,410,233
-
-
23,385,588
(832,953)
Not exposedto mark-up/
interest /profit rate
risk
-
-
-
-
-
556,498,989
27,199,297
-
583,698,286
-
-
-
-
-
583,698,286

Particulars
Financial Liabilities
Trade and other payables
Accrued mark-up
Certificates of investment - unsecured
Short term borrowings
Short term loan from a related party
- unsecured
Rupees
-
-
-
-
-
-
14,975,355
8,410,233
264,835,006
187,854,564
-
476,075,158
Total Financial liabilities
'at fair value throughprofit or loss'
Other financialliabilities
14,975,355
8,410,233
264,835,006
187,854,564
-
476,075,158
Particulars
Financial assets
Cash and bank balances
Short term investments
Other receivables - net
Advance to employees
Accrued markup /
return on investments
Net investment in finance lease
(net of security deposit)
Long-term investments
Long-term deposits
Rupees
Loans andreceivables
43,753,913
-
1,328,723
78,304
1,229,408
883,108,935
-
109,500
929,608,783
-
-
-
-
-
-
24,744,411
-
24,744,411
-
-
-
-
-
-
-
-
-
43,753,913
3,461,625
1,328,723
78,304
1,229,408
883,108,935
24,744,411
109,500
957,814,819
Total
2015
Held tomaturity
Financial assets'at fair valuethrough profit
or loss'
Financial assets'available for sale'
-
3,461,625
-
-
-
-
-
-
3,461,625
Financial instruments by category38.4.3
Particulars
Financial assets
Cash and bank balances
Short term investments
Other receivables - net
Ijarah rental receivables
Advance to employees
Accrued markup /
return on investments
Net investment in finance lease
(net of security deposit)
Long-term investments
Long-term deposits
Rupees
Loans andreceivables
44,296,138
-
1,795,739
904,009
196,006
1,475,668
976,393,970
-
300,460
1,025,361,990
-
12,721,564
-
-
-
-
-
27,199,297
-
39,920,861
-
-
-
-
-
-
-
-
-
-
44,296,138
16,259,209
1,795,739
904,009
196,006
1,475,668
976,393,970
27,199,297
300,460
1,068,820,496
Total
2016
Held tomaturity
Financial assets'at fair value
through profitor loss'
Financial assets'available for sale'
-
3,537,645
-
-
-
-
-
-
-
3,537,645
71
FOR THE YEAR ENDED JUNE 30, 2016

72
FOR THE YEAR ENDED JUNE 30, 2016
Particulars
Financial Liabilities
Trade and other payables
Accrued mark-up
Certificates of investment - unsecured
Short term borrowings
Short term loan from a related party
- unsecured
Rupees
-
-
-
-
-
-
7,377,541
4,161,639
156,466,231
192,856,269
40,000,000
400,861,680
Total Financial liabilities
'at fair value throughprofit or loss'
Other financialliabilities
7,377,541
4,161,639
156,466,231
192,856,269
40,000,000
400,861,680
389,322,500
505,500,727
894,823,227
43.51%
Total debt
Total equity
Total capital employed
Gearing ratio
452,689,570
545,305,956
997,995,526
45.36%
2016
Rupees
2015
38.5 Price risk
Price risk is the risk that the fair value or future cash flows of a financial instrument will fluctuate
because of changes in market prices (other than those arising from interest risk or currency risk)
whether those changes are caused by factors specific to the individual financial instrument or
its issuer, or factors affecting all similar financial instruments traded in the market. Presently, the
Company is not exposed to equity securities price risk as the Company does not hold any equity
securities as at June 30, 2016.
However, the Company holds National Investment Trust units, exposing the Company to cash
flow market risk. In case of one percent increase / decrease in the net assets value of such units
as on June 30, 2016, with all other variables held constant, the net assets of the Company and
total comprehensive income for the year would have been higher / lower by Rs. 35,376 (2015:
Rs. 34,616).
39. CAPITAL RISK MANAGEMENT
The Company's prime objective when managing capital is to safeguard its ability to continue as
a going concern in order to provide adequate returns for shareholders and benefits for other
stakeholders and to maintain an optimal capital structure to reduce its cost of capital.
Consistent with others in the industry, the Company monitors capital on the basis of the gearing
ratio. This ratio is calculated as total debt divided by total capital employed:

39.1 Financial risk management objectives and policies
The Company finances its operations through equity, borrowings and management of its working
capital with a view to maintaining an appropriate mix between various sources of finance to
minimise liquidity risk. Taken as a whole, the Company's risk arising from financial instruments
is limited as there is no significant exposure to price and cash flow risk in respect of such
instruments.
40. SEGMENT INFORMATION
The Company has two primary reporting segments namely, �Finance lease� and �Ijarah finance�,
based on the mode of finance, related risks and returns associated with the segments and
reporting of income and expenditure in accordance with the applicable accounting standards as
disclosed in Note 2.1. Other operations, which are not deemed by management to be sufficiently
significant to disclose as separate items and do not fall into the above segment categories, are
reported under �Others�.
73
FOR THE YEAR ENDED JUNE 30, 2016
151,671,360
53,457,872
98,213,488
(1,044,330)
(17,787,590)
79,381,568
(28,195,439)
(10,471,732)
40,714,397
1,832,878,102
18,296,467
1,851,174,569
597,107,808
625,471,304
1,222,579,112
56,189,662
29,304,882
3,515,213
5,396,084
9,058,631
3,536,243
5,522,388
210,320,220
7,851,043
-
965,250
Segment revenue
Administrative and operating expenses
Segment result
Provision for Workers� Welfare Fund
Unallocated expenses
Result from operating activities
Finance cost
Provision for taxation
Profit for the year
Other Information
Segment assets
Unallocated assets
Total assets
Segment liabilities
Unallocated liabilities
Total liabilities
Capital expenditure
Depreciation
Unallocated Capital expenditure
Unallocated Depreciation
Finance
lease
Ijarah
finance
Others Total
108,334,165
19,951,153
88,383,012
1,539,835,719
566,519,250
-
-
34,278,564
29,970,476
4,308,088
82,722,163
22,737,515
56,189,662
28,339,632
Rupees
2016

74
FOR THE YEAR ENDED JUNE 30, 2016
120,800,853
30,877,516
52,620
89,975,957
(1,108,441)
(14,170,514)
74,697,002
(20,383,391)
(4,028,629)
50,284,982
1,415,633,855
85,124,056
1,500,757,911
422,412,319
530,895,260
953,307,579
39,211,500
10,583,410
1,344,962
5,185,644
3,625,306
139,461
-
3,485,845
72,577,552
-
-
-
Segment revenue
Administrative and operating expenses
Reversal of potential lease losses
Segment result
Provision for Workers� Welfare Fund
Unallocated expenses
Result from operating activities
Finance cost
Provision for taxation
Profit for the year
Other Information
Segment assets
Unallocated assets
Total assets
Segment liabilities
Unallocated liabilities
Total liabilities
Capital expenditure
Depreciation
Unallocated Capital expenditure
Unallocated Depreciation
Finance
lease
Ijarah
finance
Others Total
104,888,623
19,089,197
52,620
85,852,046
1,290,594,266
411,852,497
-
-
12,286,924
11,648,858
-
638,066
52,462,037
10,559,822
39,211,500
10,583,410
Rupees
2015
41. FAIR VALUE OF FINANCIAL INSTRUMENTS
Fair value is the amount for which an asset could be exchanged, or a liability settled, between
knowledgeable, willing parties in an arm�s length transaction. The carrying values of the financial
assets and financial liabilities approximate their fair values except for investments held to maturity
and leases at fixed rate of return. The fair value of leases at fixed rate of return cannot be
reasonably estimated due to absence of market for such leases. The fair value of held-to-maturity
investments is disclosed in note 6 and note 11.
The Company's accounting policy on fair value measurements is discussed in note 4.1.
The Company measures fair values using the following fair value hierarchy that reflects the
significance of the inputs used in making the measurements:
Level 1: Fair value measurements using quoted prices (unadjusted) in active markets for identical
assets or liabilities.
Level 2: Fair value measurements using inputs other than quoted prices included within
level 1 that are observable for the asset or liability, either directly (i.e. as prices) or
indirectly (i.e. derived from prices).
Level 3: Fair value measurements using inputs for the asset or liability that are not based on
observable market data (i.e. unobservable inputs).

75
FOR THE YEAR ENDED JUNE 30, 2016
As at June 30, 2016, short term investments - available for sale amounting to Rs. 3.54 million
(2015: Rs. 3.46 million), mentioned in note 6, were categorised in level 1. Revaluation rates
announced by Mutual Funds Association of Pakistan (MUFAP) are used to determine fair value
of investment in mutual funds categorised as 'available for sale'.
Transfer between levels of the fair value hierarchy are recognised at the end of the reporting
year during which the changes have occurred. However, there were no transfers between levels
of fair value hierarchy during the year.
42. DATE OF AUTHORISATION FOR ISSUE
These financial statements were authorised for issue on September 20, 2016 by the Board of
Directors of the Company.
43. NON-ADJUSTING EVENTS AFTER THE BALANCE SHEET DATE
The Board of Directors in its meeting held on September 20, 2016, proposed a final dividend
of Rs. 0.50 per share (2015: nil) for the year ended June 30, 2016, amounting to Rs. 12.68
million (2015: nil) for approval of members at the Annual General Meeting to be held on October
24, 2016. These financial statements do no reflect the impact of this proposed dividend.
Chief Executive Officer Director

No. of
Share Holders From ToShares
Held
Percentage
%
AS OF JUNE 30, 2016
76
PATTERN OF SHAREHOLDING
1
101
501
1001
5001
10001
15001
20001
25001
30001
45001
55001
90001
100001
115001
120001
125001
155001
195001
495001
580001
795001
810001
1145001
1285001
1495001
1660001
2345001
2450001
3950001
4220001
100
500
1000
5000
10000
15000
20000
25000
30000
35000
50000
60000
95000
105000
120000
125000
130000
160000
200000
500000
585000
800000
815000
1150000
1290000
1500000
1665000
2350000
2455000
3955000
4225000
Company Total
Having Shares
58
17
25
28
5
1
4
2
2
1
1
4
1
1
1
1
1
1
2
1
1
1
1
1
1
1
1
2
1
1
1
169
585
6866
19078
61213
42182
14551
69475
49690
50736
32000
49950
229241
94080
100831
116787
122127
128560
159116
399800
500000
582007
799899
813885
1148770
1286994
1499785
1663524
4700000
2451090
3953394
4223584
25369800
0.0023
0.0271
0.0752
0.2413
0.1663
0.0574
0.2738
0.1959
0.2000
0.1261
0.1969
0.9036
0.3708
0.3974
0.4603
0.4814
0.5067
0.6272
1.5759
1.9708
2.2941
3.1530
3.2081
4.5281
5.0729
5.9117
6.5571
18.5260
9.6614
15.5831
16.6481
100.0000
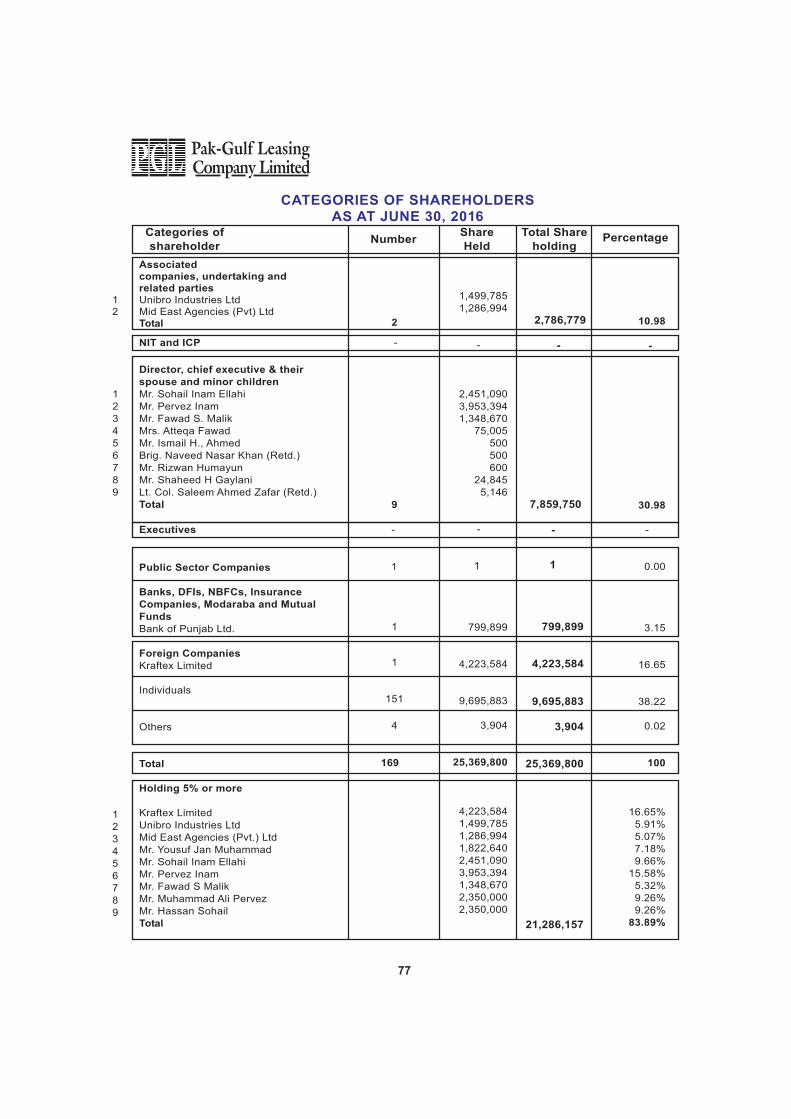
Holding 5% or more
Kraftex Limited
Unibro Industries Ltd
Mid East Agencies (Pvt.) Ltd
Mr. Yousuf Jan Muhammad
Mr. Sohail Inam Ellahi
Mr. Pervez Inam
Mr. Fawad S Malik
Mr. Muhammad Ali Pervez
Mr. Hassan Sohail
Total
Associated
companies, undertaking and
related parties
Unibro Industries Ltd
Mid East Agencies (Pvt) Ltd
Total
CATEGORIES OF SHAREHOLDERS
AS AT JUNE 30, 2016
Public Sector Companies
Banks, DFIs, NBFCs, Insurance
Companies, Modaraba and Mutual
Funds
Bank of Punjab Ltd.
Foreign Companies
Kraftex Limited
Individuals
Others
Total
Director, chief executive & their
spouse and minor children
Mr. Sohail Inam Ellahi
Mr. Pervez Inam
Mr. Fawad S. Malik
Mrs. Atteqa Fawad
Mr. Ismail H., Ahmed
Brig. Naveed Nasar Khan (Retd.)
Mr. Rizwan Humayun
Mr. Shaheed H Gaylani
Lt. Col. Saleem Ahmed Zafar (Retd.)
Total 9
1
2
3
4
5
6
7
8
9
NIT and ICP -
Categories of
shareholder
Share
HeldPercentageNumber
Total Share
holding
1,499,785
1,286,994
-
2,451,090
3,953,394
1,348,670
75,005
500
500
600
24,845
5,146
-
1
799,899
4,223,584
9,695,883
3,904
25,369,800
4,223,584
1,499,785
1,286,994
1,822,640
2,451,090
3,953,394
1,348,670
2,350,000
2,350,000
2,786,779
-
2 10.98
-
30.98
-
0.00
3.15
16.65
38.22
0.02
100
16.65%
5.91%
5.07%
7.18%
9.66%
15.58%
5.32%
9.26%
9.26%
83.89%
1
2
Executives
1
151
1
4
1
2
3
4
5
6
7
8
9
77
-
169
1
-
1
799,899
4,223,584
9,695,883
3,904
25,369,800
21,286,157
7,859,750

I/We of
being member(s) of
PAK-GULF LEASING COMPANY LIMITED holding ordinary shares as per Registered
Folio No./CDC A/c No. (for members who have shares in CDS)
hereby appoint of
or failing him/her
of
as my/our Proxy to attend and vote for me/us and on my/our behalf at the 23 Annual General Meeting
to be held on Monday, October 24, 2016 and at any adjournment thereof.
As witness my/our hand this day of 2016.
Signed by in presence of
Please affix
Rs. 5/- Revenue
Stamp
Signature of Member(s)Signature and address of witness
Share Folio No. Share Folio No.
A member entitled to attend, speak and vote at a General Meeting is entitled to appoint a proxy to
attend, speak and voter for him/her. A proxy must be a member of the Company.
The instrument appointing a proxy shall be in writing under the hand of the appointer of this attorney
duly authorised in writing if the appointer is a corporation under its common seal or the hand of an
officer or attorney duly authorised.
The instrument appointing a proxy together with the Power of Attorney if any under which it is signed
or a notarially certified copy thereof, should be deposited at the Company�s Registered Office not later
than 48 hours before the time of holding the meeting.
rd