2016 annual report - tungsten mining
TRANSCRIPT

2016 Annual Report

“ The quality of our decisions today will determine our success for the years ahead ”Gary LyonsChairman

2016 Annual Report Pg 1
Contents
Chairman’s Letter ......................................................................................................................2
Review of Operations ................................................................................................................4
Annual Mineral Resources and Ore Reserves Statement .......................................................16
Schedule of Interests in Mining Tenements .............................................................................20
Directors’ Report ......................................................................................................................21
Auditor’s Independence Declaration .......................................................................................30
Consolidated Statement of Profit or Loss and Other Comprehensive Income ........................32
Consolidated Statement of Financial Position .........................................................................33
Consolidated Statement of Changes in Equity ........................................................................34
Consolidated Statement of Cash Flows ..................................................................................35
Consolidated Notes to the Financial Statements.....................................................................36
Directors’ Declaration ..............................................................................................................57
Independent Auditor’s Report ..................................................................................................58
Additional Information ..............................................................................................................60
About Tungsten Mining
Emerging Australian tungsten developer, Tungsten Mining NL is an Australian based resources company listed on the Australian Securities Exchange. The Company’s prime focus is the exploration and development of tungsten projects in Australia.
Tungsten (chemical symbol W), occurs naturally on Earth, not in its pure form but as a constituent of other minerals, only two of which support commercial extraction and processing - wolframite ((Fe, Mn)WO4) and scheelite (CaWO4).
Tungsten has the highest melting point of all elements except carbon – around 3400°C giving it excellent high temperature mechanical properties and the lowest expansion coefficient of all metals. Tungsten is a metal of considerable strategic importance, essential to modern industrial development (across aerospace and defence, electronics, automotive, extractive and construction sectors) with uses in cemented carbides, high-speed steels and super alloys, tungsten mill products and chemicals.
Tungsten Mining has three advanced tungsten projects in Australia: the Mt Mulgine Project in the Murchison region, the Big Hill Project in the Pilbara region and the Kilba Project in the Ashburton region of Western Australia. The Mt Mulgine, Big Hill and Kilba Projects, together contain Mineral Resources reported at a 0.10% WO3 cut-off grade comprising Indicated Resources of 15.4Mt at 0.20% WO3 and 26ppm Mo and Inferred Resources of 73.2Mt at 0.17% WO3 and 220ppm Mo, totalling 88.6Mt at 0.18% WO3 and 186ppm Mo. This represents more than 15.5 million MTU (metric tonne units) of WO3 and 16,480 tonnes of contained Molybdenum.
Tungsten Mining is currently identifying opportunities for near term tungsten production, particularly from the Mulgine Hill and Mulgine Trench deposits within the Mt Mulgine Project.

2016 Annual ReportPg 2
Chairman’s Letter
Dear Shareholders,It is a pleasure to be able to report on the progress of your Company over this past year.
In my inaugural letter last year, I foreshadowed that the Board was assessing options to create value for shareholders from our existing suite of projects and also new opportunities against a backdrop of falling commodity prices. That ambition was realised through a major project acquisition in late 2015, with the Company reaching agreement and settling the purchase of the Mt Mulgine and Big Hill tungsten projects from Hazelwood Resources.
The ability to participate and complete that transaction was facilitated by our associate, GWR Group Limited, who by providing a funding facility, gave Tungsten Mining the freedom to negotiate and the capacity to transact on the opportunity.
The Hazelwood projects acquisition has substantially increased our Mineral Resource base and positioned Tungsten Mining to become a significant player within the global tungsten industry. Following the acquisition, the Company now has the second largest tungsten resource base for ASX-listed companies.
The Board and Company executive have outlined a Strategic Development Plan for the Mt Mulgine Project, directed towards the production of tungsten concentrate within two years. This strategy aims to produce early cashflow and ensure tungsten production is sustainable long term.
The Board believes this is a realistic and attainable goal, given the projects’ advanced nature and proximity to existing infrastructure and facilities. Our objective is to ensure that we can deliver low cost concentrate production – both in terms of capital outlay and operating costs.
We remain optimistic of the prospects for the tungsten industry and improving price outlook for concentrates. We believe that market conditions, which faced new supply additions and anaemic demand in the past two years, will continue to improve over 2017 and through the balance of this decade. Given the length of commodity cycles and project development timeframes, the quality of our decisions today will determine our success for the years ahead.
Finally, I would like to acknowledge the continued support of shareholders and welcome those who participated in our share placement undertaken late last year. We are confident that with a clear purpose and well defined strategy, the Company is positioned for growth and future success.
Yours sincerely
Gary Lyons Chairman

2016 Annual Report Pg 3
83.7
50,000metres drilled
MtMineral Resources
The Mt Mulgine and Big Hill tungsten projects acquired from Hazelwood Resources contain significant Mineral Resources.
Included in the $15 million historical spend, the Big Hill and Mt Mulgine Projects have had over 50,000m of drilling completed, of which 40,000m was high quality diamond drilling. Tungsten Mining has access to all historical diamond core and has commenced a program of sampling of unsampled core, which has already shown significant widening of some historical intercepts.
$1.2$15
millionAcquisitioncost
The acquisition cost for the Hazelwood package was $1 million plus 5 million Ordinary Tungsten Mining shares, escrowed for 12 months. Given the scale and advanced stage of the projects, the Company considers the acquisition to be extremely low cost and provides significant leverage for Tungsten shareholders to an improving tungsten price.
The Mt Mulgine and Big Hill Projects have had in excess of $15 million spent on them by previous operators, including a significant amount of high quality drilling and pre-feasibility study assessments. Tungsten has acquired all of this information as part of the acquisition and it will be used by the Company as it progresses its plans to develop a near term mining operation.
million Historical spend
At a 0.1% WO3 cut-off, Mulgine Trench contains an Indicated Resource of 0.4Mt at 0.14% WO3 and 400ppm Mo and Inferred Resources of 63.4Mt at 0.17% WO3 and 250ppm Mo. Mulgine Hill contains Indicated Resources of 4.7Mt at 0.21% WO3 and 50ppm Mo and Inferred Resources of 3.7Mt at 0.15% WO3 and 64ppm Mo. The Big Hill tungsten project contains an Indicated Resource of 6.2Mt at 0.16% WO3 and Inferred Resources of 5.3Mt at 0.13% WO3.

2016 Annual ReportPg 4
Review of OperationsOverviewTungsten Mining NL (“the Company”) is focussed on the discovery and development of tungsten deposits in Australia. Since listing on the ASX in December 2012, the Company has delineated a JORC-2012 compliant Mineral Resource on its Kilba Project and, in December 2015, the Company expanded the portfolio with the acquisition of the advanced Mt Mulgine and Big Hill projects.
Through exploration and acquisition, the Company has established a portfolio of advanced tungsten projects with Mineral Resources at a 0.10% WO3 cut-off comprising Indicated Resources of 15.4Mt at 0.20% WO3 and 26ppm Mo and Inferred Resources of 73.2Mt at 0.17% WO3 and 220ppm Mo, totalling
88.6Mt at 0.18% WO3 and 186ppm Mo. This represents more than 15.5 million MTU (metric tonne units) of WO3 and 16,480 tonnes of contained Molybdenum, providing the platform for the Company to become a globally significant player within the primary tungsten market through the development of low cost tungsten concentrate production.
In December 2015, Tungsten Mining completed the acquisition of the Mt Mulgine and Big Hill Projects from ATC Alloys Limited (formerly named Hazelwood
Resources Limited and herein referred to as “Hazelwood”) at a cost of $1.35 million, including cash consideration of $1m and the issue of 5 million fully paid ordinary shares.
Funding for completion of the acquisition was provided by way of loan by associated entity, GWR Group Limited (GWR) pursuant to the terms of a Funding Deed. GWR assisted with the acquisition by funding the cash component of the consideration for the asset purchase.
In January 2016, the Company completed a Placement of 48m ordinary fully paid shares at an issue price of 4 cents each to sophisticated investors to raise $1.92m
before costs. The purpose of the issue was to provide working capital for advancing the Company’s expanded project portfolio.
The Company’s principal activities during the year were focussed on completing the Hazelwood acquisition, data validation and consolidation following the asset acquisition as well as developing and progressing the Mt Mulgine Strategic Development Plan.
Figure 1: Project Location Map

2016 Annual Report Pg 5
Tungsten Industry Tungsten, also known as wolfram, is a chemical element with symbol W and atomic number 74. The word tungsten comes from the Swedish language tung sten, which directly translates to heavy stone.
Tungsten, occurs naturally on Earth, not in its pure form but as a constituent of other minerals, only two of which support commercial extraction and processing - wolframite ((Fe, Mn)WO4) and scheelite (CaWO4). The free element is remarkable for its unique properties, especially the fact that it has the highest melting point of all the elements (~3,400°C). Its high density is 19.3 times that of water, making it among the heaviest metals. Its electrical conductivity at 0°C is about 28% of that of silver, which itself has the highest conductivity, and its coefficient of thermal expansion is the lowest of all metals.
These properties ensure tungsten makes an important contribution, through its use in cemented carbide and high speed steel tools, to the achievement of high productivity levels in industries on which the world’s economic well-being depend. It is used in Lighting Technology, Electronics, Power Engineering, Coating and Joining Technology, the Automotive and Aerospace Industries, Medical Technology, the generation of High Temperatures, the Tooling Industry (as tungsten monocarbide) and even in Sports and Jewellery.
Cemented carbides, also called hardmetals, are the most important usage of tungsten today. The main constituent is tungsten monocarbide (WC), which has hardness close to diamond. Hardmetal tools are the workhorses for the shaping of metals, alloys, wood, composites, plastics and ceramics, as well as for the mining and construction industries.
According to the most recent US Geological Survey (USGS) report on the metal, world mine tungsten (W) production reached 87,000 metric tonnes (t) in 2015, a marginal increase over the prior year. The market remained in oversupply, putting pressure on prices, leading a number of Chinese producers to announce plans to reduce their output and forcing Canada’s only tungsten mine into care-and-maintenance mode.
China is the largest producer of tungsten, accounting for over 80 percent of the world’s total output, and is also the world’s largest consumer of the metal. In 2015, mine production in China was reported to total 71,000t of tungsten, the same amount as the previous year. After China, production levels drop dramatically, with Vietnam second with 5,000t, followed by Russia (1,700t), Canada (1,700t) and Bolivia (1,200t).
Prices for tungsten concentrates tend to follow the same trend as prices for ammonium paratungstate (APT), which is the key intermediary product in the tungsten supply chain. APT Prices are quoted on the basis of metric tonne units. A metric ton unit (mtu) is 10kg. A metric ton unit of tungsten trioxide (WO3) contains 7.93kgs of tungsten (W). Standard industry grade specification for tungsten concentrate is 65% WO3.
Mt Mulgine Project, Murchison WAThe Mt Mulgine Project is located within the Murchison Region of Western Australia, approximately 350km north northeast of Perth. The Company has 100% of the tungsten and molybdenum rights on a contiguous group of tenements that have been the subject of significant previous exploration for tungsten and molybdenum.
Two near surface Mineral Resources have been delineated by previous explorers at the Mulgine Trench and Mulgine Hill deposits. Currently, there is a combined Mineral Resource estimate of 72.2Mt at 0.18% WO3 and 230ppm Mo (0.10% WO3 cut-off). A breakdown of this resource is presented in the Annual Statement of Mineral Resources and Ore Reserves on page 16 of this report.
Historical metallurgical testwork conducted in the 1970s/1980s indicates tungsten is present as coarse-grained scheelite that will respond well to conventional gravity separation and is capable of producing commercial grade concentrate.
Figure 2: Tungsten carbide cutting tool

2016 Annual ReportPg 6
GeologyTungsten-molybdenum mineralisation at Mt Mulgine is associated with the Mulgine Granite - a high-level leucogranite forming a 2km stock intruding the Mulgine anticline. The granite intrudes a greenstone sequence composed of micaceous schists, amphibolite and talc-chlorite schist, which were formerly metasediments, mafic and ultramafic rocks respectively.
The intrusion is associated with intense hydrothermal alteration with late stage fluids containing tungsten, molybdenum, gold, silver, bismuth and fluorite. Mineralisation is zoned as follows:
• Porphyry-style molybdenum-only mineralization in the core of the granite.
• Principally tungsten mineralisation with accessory molybdenum, bismuth and fluorite at the Mulgine Hill Prospect on the granite contact.
• Tungsten and molybdenum mineralisation with accessory precious metals at the Mulgine Trench Prospect.
Exploration potential is excellent with numerous open positions at Mulgine Trench and Mulgine Hill.
Figure 3: Mt Mulgine with Mulgine Hill in the mid-ground of the image
Figure 4: Mt Mulgine Project Geology

2016 Annual Report Pg 7
Exploration and Development ActivityFollowing the acquisition of the Mt Mulgine Project, the Company’s geologists reviewed the geology in a number of historic diamond drillholes. During this process, it was identified that there were zones of core that had been excluded from the sampling program despite UV lamping showing evidence of mineralisation.
Encouraging results were achieved from the initial phase of a core sampling program at the Mulgine Hill deposit at the Mt Mulgine Project (described further below). The reported results are considered to highlight the potential to add to existing intersections plus to identify new zones of mineralisation from the historical Minefields and ANZECO drilling.
The Company has developed a Strategic Development Plan for the Mt Mulgine Project, directed towards the production of tungsten concentrate within two years. Leveraging off the project’s proximity to existing infrastructure and facilities, a staged development approach will be adopted with the initial focus on the Mulgine Hill deposit, while concurrently progressing metallurgical test work and development activities on the significantly larger Mulgine Trench deposit. This strategy aims to produce early cashflow and ensure tungsten production is sustainable long term.
Work to date has defined significant shallow tungsten mineralisation at Mulgine Hill that is open toward the surface. Since the end of the reporting period, the Company has completed a shallow reverse circulation (RC) drilling program targeting these zones to increase the near-surface resource. Large diameter diamond
drilling was also completed at Mulgine Hill to provide testwork material to confirm previous metallurgical studies that indicated simple metallurgical treatment produces a saleable WO3 concentrate. Assay results from the drilling program are pending and the metallurgical test-work program scheduled to commence in September.
The Company is also progressing the much larger Mulgine Trench Deposit, with diamond drilling planned to provide material for metallurgical tests. Work will focus on understanding the distribution and mineralogy of tungsten mineralisation in the overlying Trench deposit oxide layer and potential methods of extraction. The Company has engaged Australia’s pre-eminent minerals research facility at CSIRO to support components of this activity and an initial review of past work has been completed and a forward work plan presented. Diamond drilling for metallurgical samples was also undertaken at Trench during the recently completed drilling campaign.
Figure 5: Diamond core from August 2016 drilling program showing course grained scheelite under ultraviolet

2016 Annual ReportPg 8
Mulgine Hill – Core Sampling April 2016Minefields Exploration NL (Minefields) and Australian and New Zealand Exploration Company (ANZECO) drilled 213 diamond drillholes at the Mulgine Hill prospect over several campaigns from 1970 to 1980. Diamond holes were logged and UV lamped to determine mineralised material and only these mineralised intervals were assayed.
Subsequent re-inspection of core under UV light by the Company indicated Minefields/ANZECO selective sampling potentially excluded significant tungsten mineralisation. The Company sampled 249.75 metres of previously unsampled BQ and NQ core and submitted 251 samples to Nagrom Laboratories for tungsten analysis by XRF. Results from this sampling is shown below in Table 1.
Hole_ID North East DEPTH Samples Recent Assays Comments
(MGA Z50) From To Interval WO3 DDM080 6,771,984 497,366 47.4 20 No significant intersection
DDM120 6,772,207 497,724 42.7 16 35.1 36.0 1.0 0.11 Extended adjacent intersection
DDM140 6,772,110 497,149 45.7 9 11.0 12.2 1.2 0.11 Extended adjacent intersection
DDM141 6,772,167 497,110 78.9 38 40.0 43.0 3.0 0.13 New Zone
DDM167 6,772,174 497,879 54.9 21 No significant intersection
DDM172 6,772,089 497,753 80.8 11 No significant intersection
DDM175 6,772,049 497,689 87.9 34 60.0 62.0 2.0 0.14 New Zone
DDM176 6,772,071 497,581 38.4 8 No significant intersection
DDM179 6,772,028 497,657 76.2 15 No significant intersection
DDM182 6,772,113 497,647 69.5 15 No significant intersection
DDM186 6,772,045 497,819 59.4 4 No significant intersection
DDM189 6,771,971 497,852 61.0 21 38.1 43.0 4.9 0.18 Extended adjacent intersection
DDM195 6,771,949 497,820 48.5 17 31.0 39.6 8.6 0.24 Extended adjacent intersection
DDM231 6,772,126 497,860 65.0 22 No significant intersection
All holes are vertical. Samples consisted of 1m BQ or NQ half core. Analysis is XRF determination by Nagrom laboratories, Kelmscott WA. Lower cut-off grade 0.10% WO3, no top cut grade, up to 2.0m of internal waste. Grid coordinates are MGA Zone 50. NSI – no significant intersection.
Table 1: Tungsten Mining sampling of diamond drilling at Mulgine Hill – April 2016
These results are considered to provide encouraging indications of the potential to add to existing intersections plus to identify new zones of mineralisation in the Minefields and ANZECO drilling. Sampling of hole DDM195 identified strong mineralisation of 8.6 metres at 0.24% WO3 adjacent to an existing intersection of 4.6 metres at 0.63% WO3, making a combined intersection
of 13.2 metres at 0.37% WO3 (Figure 6). Three other holes returned assays that added to existing intersections (DDM120, DDM140 and DDM189) and two holes located new zones of mineralisation.
There exists a further 1,500 to 2,000 metres of core that requires sampling and the Company is progressing this work during the current drilling program.

2016 Annual Report Pg 9
These sample results were received after the close-off date for data supplied to Optiro to support the June 2016 Mineral Resource update for Mulgine Hill. These
results indicates further sampling of core at Mulgine Hill may add additional tonnes to Mineral Resources during future updates.
Development StrategyThe Company is implementing a staged approach to the development of the Mt Mulgine Project that will support low capital start-up costs, directed at demonstrating a short pathway to positive cashflow for the project and, in turn, the Company’s shareholders. Initial work is proposed to build on previous metallurgical testwork results to produce an economic extraction method for
WO3 and other valuable metals within the deposits.
The Company is targeting small scale production facility capable of producing saleable concentrate and by-products by end 2018. In order to achieve this target, the Company will undertake the following measured approach:
Figure 6: Cross section showing Tungsten Mining sampling of Minefields and ANZECO drilling
Drilling Phase 1 RC and PQ diamond drilling (August 2016) – targeting shallow mineralisation at Mulgine Hill
Metallurgical Testwork Program designed and scheduled to commence in September 2016 – building on previous work
Pilot Plant Nagrom and Guangzhou Research Institute of Non-ferrous Metals preferred specialist laboratories
Infrastructure Discussions advancing with regional operators for infrastructure access
Engineering Specialist equipment vendors including ore sorting technologies being assessed for early contractor involvement (ECI) to enable expedited engineering and equipment supply schedule

2016 Annual ReportPg 10
Engineering work undertaken by previous owners on 330ktpa concentrator. Feasibility Study work completed on the project was predicated on the same size concentrator. Production will leverage off existing infrastructure and utilise modular plant where feasible.
With regards to targeting development by the end of 2018, the Company has developed an aggressive 24-month work program in order to potentially achieve this outcome.
Figure 6: Mt Mulgine Development timetable
Figure 7: Diamond Drilling at Mulgine Hill – August 2016
Task Sept 16
Dec 16
Mar 17
Jun 17
Sep 17
Dec 17
Mar 18
Jun 18
Geology and resource development
Metallurgy
Engineering
Pilot Scale Testwork
Project management, permitting and approvals
Marketing and Commercial
Mining

2016 Annual Report Pg 11
Big Hill Project, Eastern Pilbara, WAThe Big Hill Project area is located approximately 30 km northeast of the Nullagine township in the Eastern Pilbara of Western Australia. The project contains the Big Hill deposit where 22,871 metres of diamond and RC drilling have defined a JORC-2012 Mineral Resource estimate of 11.5Mt at 0.15% WO3. A breakdown of this resource is presented in the Annual Statement of Mineral Resources and Ore Reserves on page 16 of this report
and under the section titled “Mineral Resource Update” of this Review of Operations.
Historical metallurgical testwork conducted on samples from Big Hill at bench and pilot scale have produced high quality tungsten concentrates at acceptable scheelite recoveries. This work has identified a simple and potentially low cost processing route.
Figure 8: Big Hill project geology
GeologyTungsten mineralisation at Big Hill is associated with vein-hosted scheelite within a tremolite-rich unit on the western margins of the Cookes Creek granite. The geometry of the Big Hill deposit is controlled by the overall shape of the tremolite-rich unit and the density of veins that host scheelite mineralisation.
Historical exploration identified additional targets that have not been adequately tested and warrant further investigation.
Planned WorkIn the period ahead, the Company plans to undertake a preliminary review of previous studies with a view to developing a low cost mining and processing route, utilising dry x-ray ore sorting technology, focussed on the near surface resource at Big Hill. This would be consistent with the low-capex approach and development plan for Mt Mulgine and look to build on knowledge gained in progressing that project.

2016 Annual ReportPg 12
Kilba Project, Ashburton Region, WAThe Kilba Project is located within the Ashburton Region of Western Australia, 250km southwest of Karratha. To date, the Company has focused on the historic Zones 8, 11 and 12 that Union Carbide discovered in the 1970s. Drilling has targeted high-grade tungsten mineralisation associated with skarns and calc-silicate units situated close to the Kilba granite.
This work has defined a JORC-2012 compliant Mineral Resource of 5.0Mt at 0.24% WO3 (0.10% WO3 cut-off). A breakdown of this resource is presented in the Annual Statement of Mineral Resources and Ore Reserves on page 16 of this report. The Mineral Resource is located on the Company’s 100%-owned Mining Lease 08/314.
Metallurgical testwork shows that the tungsten is present as coarse-grained scheelite that will respond well to conventional gravity separation. Testwork completed in 2015 has demonstrated the ability to produce an extremely high grade tungsten concentrate.
GeologyTungsten mineralisation at Kilba is associated with skarns and calc-silicate units that wrap around the Kilba granite forming a dome structure. These skarns and calc-silicate units occur in a 40 to 100 metre wide carbonate-rich unit of the Morrissey Metamorphic suite and recent mapping has defined significant strike lengths of this unit around the Kilba granite.
Drilling has only targeted a small portion of mapped skarns and there is excellent potential to discover additional tungsten mineralisation.
In May 2013, the Company announced a Maiden Indicated and Inferred Mineral Resource at Zone 8 and Zone 11 of the Kilba project (ASX announcement 31 May 2013). During the second half of 2014, the Company completed a phased drilling program to increasing the confidence level of the Kilba Mineral Resource at Zones 8 and 11 to an Indicated status in support of future detailed Feasibility Studies. Drilling was completed to infill sections to a 40 metre spacing over the entire May 2013 Mineral Resource.
Figure 9: Plan displaying location of recent drilling and Mineral Resource at the Kilba Project

2016 Annual Report Pg 13
In January 2015, the Company announced an updated JORC-2012 Mineral Resource estimate of Indicated Resources of 4.1Mt at 0.25% WO3 and Inferred Resources of 0.8Mt at 0.20% WO3 for a combined Mineral Resource of 5.0Mt at 0.24% WO3 at Zones 8, 11 and 12 of the Kilba Project. The infill drilling has taken the confidence level to 86% of contained metal falling within the Indicated category.
Metallurgical TestworkA Phase Two investigative metallurgical test work program commenced in November 2014 and was completed at Nagrom’s Test Laboratory in June 2015. The program built on the findings and recommendations of the Phase One test program (undertaken by Mintrex Pty Ltd in 2013), in particular to further investigate the potential of a pre-scalping stage to remove a significant proportion of the feed mass as waste prior to beneficiation. The remainder of the program was to determine the amenability of the sample to upgrading the WO3 content using gravity, magnetic characterisation and flotation test work. Detailed results of the program have been set out in previous activities reports.
In summary, the Phase Two program results were as follows:
• The continuous dense media separation (DMS) test circuit was successful in removing 19% of the feed mass for a loss of only 1% WO3.
• Subsequent beneficiation test work upgraded the WO3 from a calculated head grade of 0.3% to 70.6%, with an overall circuit recovery rate of 37%. Magnetic separation has shown to be an effective method for cleaning this gravity concentrate, with high intensity magnetic separation increasing the gravity concentrate grade from 58.9% to 76.6% WO3 at a recovery of 96.5% within that circuit.
• Middlings flotation test work, directed at improving WO3 yield, produced a WO3 recovery >90%, however the grade was well below expectations. It is suspected that insufficient WO3 liberation is the cause of the poor grade. Future metallurgical test work programs will invest in mineralogical analysis of the middlings and tailings streams to better understand the minerals present and particle liberation size in order to improve yield and optimise the process flow sheet.
Future metallurgical test work programs will focus on:
• Metallurgical testwork on PQ diamond core from Zone 8 (drilled in the 2014 program);
• Establishing a full set of physical characteristics of the ore;
• Increasing the recovery of WO3 from the middlings and tailings stream of the circuit;
• Evaluation of ore sorting technology as a pre-concentration step; and
• Recovery of a large enough concentrate mass for marketing purposes, filtration, thickening and tailings rheology testwork.
The timing and commitment to future testwork will be dependent on the price outlook for tungsten concentrates and relative priority of the work within the Company’s project portfolio.
Regional TargetsA review of historical data indicates that stream sediment sampling conducted by ANZECO in 1973 defined a number of targets that surround Kilba. Geological mapping of these targets was completed in September 2015 locating favourable lithologies (i.e. calc-silicate units, marbles and skarns) over considerable strike lengths. From UV lamping, scheelite mineralisation within these units was considered to be generally narrow.
A small soil sampling programme totalling 339 samples was completed across six of these targets in October 2015. Results from this work defined anomalous tungsten to 400 ppm W associated with skarns and calc-silicates at three of these targets warranting further investigation in the form of follow-up soil sampling and drill testing.
Other ProjectsThe Company has a portfolio of other projects in Western Australia prospective for tungsten. These include Loves Find in the Ashburton region (which also hosts the Kilba Project) and the Koolyanobbing Project.
Work on these projects is in the initial stages of reconnaissance and target generation and it is hoped that these tenements will yield additional mineralisation of a similar nature to Kilba, which Tungsten Mining can exploit.
The Whiskey Pool tenement was relinquished during the year after geological mapping and soil geochemistry indicated tungsten mineralisation to have limited tonnage potential.
Ashburton RegionThe Ashburton region includes the Loves Find project that is in close proximity to the Kilba Project. Exploration is at an early stage and work is planned to progress these projects.
At Loves Find, geological mapping, UV lamping and rockchip sampling has identified significant tungsten mineralisation associated with garnet-epidote-clinozoisite-diopsite skarns. Two selective rockchip samples from these skarns returned assays of 4.2% WO3 and 5.6 WO3.
2016 Annual ReportPg 14
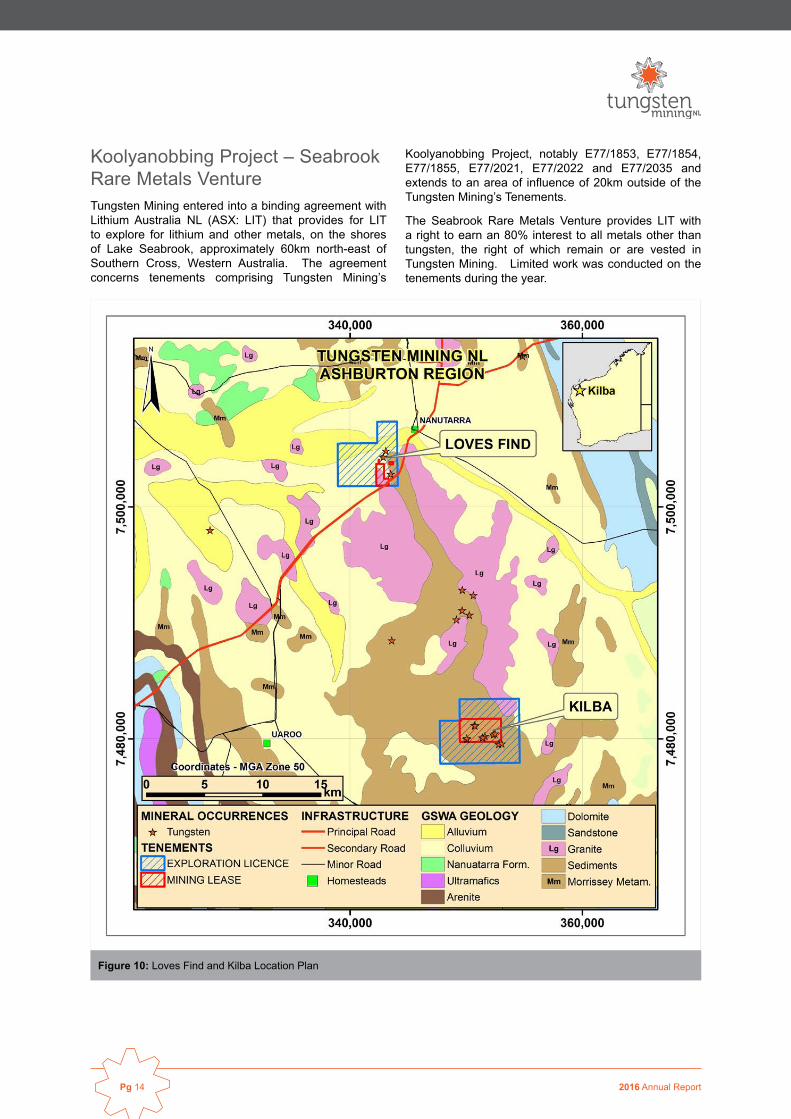
Koolyanobbing Project – Seabrook Rare Metals VentureTungsten Mining entered into a binding agreement with Lithium Australia NL (ASX: LIT) that provides for LIT to explore for lithium and other metals, on the shores of Lake Seabrook, approximately 60km north-east of Southern Cross, Western Australia. The agreement concerns tenements comprising Tungsten Mining’s
Koolyanobbing Project, notably E77/1853, E77/1854, E77/1855, E77/2021, E77/2022 and E77/2035 and extends to an area of influence of 20km outside of the Tungsten Mining’s Tenements.
The Seabrook Rare Metals Venture provides LIT with a right to earn an 80% interest to all metals other than tungsten, the right of which remain or are vested in Tungsten Mining. Limited work was conducted on the tenements during the year.
Figure 10: Loves Find and Kilba Location Plan

2016 Annual Report Pg 15
Mineral Resource Update In consolidating and integrating the geological data for the Mt Mulgine and Big Hill projects, updated Mineral Resource estimates were commissioned by the Company for the Mulgine Hill and Big Hill prospects and completed by independent geological consultants, Optiro Pty Limited (Optiro).
Mt Mulgine, located in the Murchison Region of Western Australia, contains two known resources – Mulgine Trench and Mulgine Hill. Big Hill, located in the Pilbara Region contains a single defined resource.
The Company has a third tungsten deposit, referred to as Kilba, located in the Ashburton region of Western Australia.
Mulgine Trench had previously been reported using JORC-2012 guidelines. However, at acquisition, both Mulgine Hill and Big Hill were classified and reported in accordance with earlier JORC-2004 guidelines. The Company released updated Mineral Resource estimates for Mulgine Hill and Big Hill in accordance with JORC-2012 guidelines in June 2016, as follows:
Table 2: June 2016 Mineral Resource estimates for Big Hill and Mulgine Hill
Mulgine Hill Deposit – June 2016
Reported above a 0.10% WO3 cut-off
Classification Tonnes WO3% Mo ppm
Indicated 4,700,000 0.21 50
Inferred 3,700,000 0.15 64
Total 8,500,000 0.19 56
Big Hill Deposit – June 2016
Reported above a 0.10% WO3 cut-off
Classification Tonnes WO3%
Indicated 6,200,000 0.16
Inferred 5,300,000 0.13
Total 11,500,000 0.15Note: Totals may differ from sum of individual numbers as numbers have been rounded in accordance with the Australian JORC code 2012 guidance on Mineral Resource reporting.
Full details of the Mineral Resource estimates for the Mt Mulgine (Mulgine Trench and Mulgine Hill prospects), Big Hill and Kilba Projects are set out in the Annual Statement of Mineral Resources and Ore Reserves on page 16 of this report.
The June 2016 Mineral Resource Updates for Mulgine Hill and Big Hill have collectively resulted in a modest reduction of tonnes (down 5%) and contained metal (down 6%) for the Company’s tungsten Mineral Resources. (Refer ASX Announcement 23 June 2016). The Directors recognise that the purchase of the tungsten assets from Hazelwood was a relatively low cost acquisition of resources with significant potential. Whilst the Mineral Resource update
for Big Hill has resulted in lower tonnes and grade, the Company does not consider this to be material in the context of the overall value of the acquisition package.
The Mulgine Hill deposit remains the focus of the Company’s exploration and evaluation activities for the foreseeable future and we see excellent opportunities to upgrade this resource and progress it to a development project.
For further information on the June 2016 Mineral Resource update for both Mulgine Hill and Big Hill, refer to ASX announcements released on 22 June 2016.

2016 Annual ReportPg 16
Annual Mineral Resources and Ore Reserves Statement
As at 30 June 2016Annual ReviewThe Company has conducted a review of its Mineral Resources and Ore Reserves. As set out below, this review reveals a material change to the Mineral Resource and Ore Reserve information previously announced in the Company’s 2015 Annual Report. This
change was a result of the acquisition in December 2015 of two advanced projects, the Mt Mulgine and Big Hill tungsten projects. Details of the Mineral Resources for these projects and the Kilba Project are set out below.
Mt Mulgine ProjectThe Mt Mulgine Project is located within the Murchison Region of Western Australia, approximately 350km north northeast of Perth. The Company has 100% of the tungsten and molybdenum rights on a contiguous group of tenements that have been the subject of significant previous exploration for tungsten and molybdenum.
Two near surface Mineral Resources have been delineated by previous explorers at the Mulgine Trench and Mulgine Hill deposits. Mulgine Trench has previously been reported using JORC-2012 guidelines. In June 2016, the Company published an updated Mineral Resource estimate for Mulgine Hill in accordance with JORC-2012 guidelines.
Mineral ResourcesAs at 30 June 2016, total JORC-2012 Measured, Indicated and Inferred Mineral Resources were as follows:
Mt Mulgine Mineral Resource estimate based on a 0.10% WO3 cut-off grade.
Prospect Class Tonnes WO3 WO3 Mo Mo
'000 t % t ppm t
Mulgine Trench
Indicated 400 0.14 500 400 160
Inferred 63,400 0.17 110,500 250 15,900
Total 63,800 0.17 111,000 250 16,000
Mulgine Hill
Indicated 4,700 0.21 9,900 50 240
Inferred 3,700 0.15 5,600 64 240
Total 8,500 0.19 16,200 56 480
Total
Indicated 5,100 0.20 10,400 80 400
Inferred 67,100 0.17 116,000 240 16,100
Total 72,200 0.18 126,400 230 16,500
Note: Totals may differ from sum of individual numbers as numbers have been rounded in accordance with the Australian JORC code 2012 guidance on Mineral Resource reporting.
The Mineral Resource Statement for the Mulgine Trench prospect was published by Hazelwood (refer ASX announcement - 5 November 2014), whilst the Mineral Resource Statement for the Mulgine Hill prospect was published in the ASX announcements of the Company on 22 June 2016. The Company confirms
it is not aware of any new information or data that materially affects the information and that all material assumptions and technical parameters underpinning the Mineral Resource estimates in the relevant market announcement continue to apply and have not materially changed.

2016 Annual Report Pg 17
Big Hill ProjectThe Big Hill Project area is located approximately 30 km northeast of the Nullagine township in the Eastern Pilbara of Western Australia. In June 2016, the Company
published an updated mineral resource estimate for Big Hill in accordance with JORC-2012 guidelines.
Mineral ResourcesAs at 30 June 2016, total JORC-2012 Measured, Indicated and Inferred Mineral Resources were as follows:
Big Hill Mineral Resource estimate based on a 0.10% WO3 cut-off grade.
Prospect Class Tonnes WO3 WO3
'000 t % t
Big Hill
Indicated 6,200 0.16 9,900
Inferred 5,300 0.13 6,900
Total 11,500 0.15 17,300
Note: Totals may differ from sum of individual numbers as numbers have been rounded in accordance with the Australian JORC code 2012 guidance on Mineral Resource reporting.
The Mineral Resource Statement for the Big Hill prospect was announced by the Company on 22 June 2016 and prepared in accordance with the 2012 edition of the JORC Code. The Company confirms it is not aware of any new information or data that
materially affects the information and that all material assumptions and technical parameters underpinning the Mineral Resource estimates in the relevant market announcement continue to apply and have not materially changed.
Kilba ProjectThe Kilba Project is located within the Ashburton Region of Western Australia, 320 km northeast of the regional centre of Carnarvon, and 250km southwest of the town
of Karratha. The project area hosts tungsten deposits at Zone 8, Zone 11 and Zone 12.
Mineral ResourcesAs at 30 June 2016, total JORC-2012 Measured, Indicated and Inferred Mineral Resources were as follows:
Kilba Mineral Resource estimate based on a 0.10% WO3 cut-off grade.
Prospect Class Tonnes WO3 WO3
'000 t % t
Zone 8
Indicated 540 0.27 1,500
Inferred 150 0.31 500
Total 700 0.28 1,900
Zone 11
Indicated 3,600 0.25 9,000
Inferred 460 0.19 900
Total 4,000 0.24 9,800
Zone 12Inferred 230 0.15 400
Total 230 0.15 400
Total
Indicated 4,100 0.25 10,400
Inferred 830 0.20 1,700
Total 5,000 0.24 12,100
Note: Totals may differ from sum of individual numbers as numbers have been rounded in accordance with the Australian JORC code 2012 guidance on Mineral Resource reporting.

2016 Annual ReportPg 18
The Mineral Resource Statement for the Kilba Project was published by the Company on 30 January 2015 and prepared in accordance with the 2012 edition of the JORC Code. The Company confirms it is not aware of any new information or data that
materially affects the information and that all material assumptions and technical parameters underpinning the Mineral Resource estimate in the relevant market announcement continue to apply and have not materially changed.
Comparison of Mineral Resources against the 2015 Annual ReportIn January 2015, the Company announced an Indicated and Inferred Mineral Resource at Zone 8, Zone 11 and Zone 12 of the Kilba project (ASX announcement; 30 January 2015) and this was reported in the 2015 Annual Report. The Company has subsequently added to the Mineral Resource Statement during the reporting period
through the acquisition of the Mt Mulgine and Big Hill projects in December 2015.
A comparison of the Company’s current Mineral Resources against the 2015 Annual Report is tabulated below.
Comparison of Mineral Resources against the 2015 Annual Report (0.10% WO3 cut-off grade).
30 June 2015 30 June 2016
Zone CategoryTonnes WO3 WO3 Metal Tonnes WO3 WO3 Metal
'000 t % t % '000 t % t %
Mulgine Trench
Indicated 400 0.14 500 0.5%
Inferred 63,400 0.17 110,500 99.5%
Total 63,800 0.17 111,100 100.0%
Mulgine Hill
Indicated 4,700 0.21 9,900 64%
Inferred 3,700 0.15 5,600 36%
Total 8,500 0.19 16,200 100%
Big Hill
Indicated 6,200 0.16 9,900 59%
Inferred 5,300 0.13 6,900 41%
Total 11,500 0.15 17,300 100%
Kilba
Indicated 4,100 0.25 10,400 86% 4,100 0.25 10,400 86%
Inferred 830 0.20 1,700 14% 830 0.20 1,700 14%
Total 5,000 0.24 12,100 100% 5,000 0.24 12,100 100%
Total
Indicated 4,100 0.25 10,400 86% 15,400 0.20 30,700 20%
Inferred 830 0.20 1,700 14% 73,230 0.17 124,700 80%
Total 4,900 0.24 12,100 100% 88,600 0.18 156,700 100%
Note: Totals may differ from sum of individual numbers as numbers have been rounded in accordance with the Australian JORC code 2012 guidance on Mineral Resource reporting. (Table only includes tungsten being the mineral of primary interest).

2016 Annual Report Pg 19
Governance and Internal Controls - Reserve and Resource CalculationsThe Company used third party resource consultants to estimate its ore reserves and resources at each of its projects according to the 2012 JORC Code, as have previously been reported.
No further mineral resource estimations or upgrading work has been undertaken on the Company’s Kilba or Big Hill projects since the estimates reported on 30 January 2015 and 22 June 2016 respectively, and the Company is not aware of any additional information that would have a material effect on these estimates as reported.
The company has completed drilling at Mulgine Hill and Mulgine Trench since 30 June 2016. Results from this work were incomplete at the time of reporting and the Mineral Resource estimate for Mulgine Hill
will be updated upon compilation of all data and interpretation of results. Drilling at Mulgine Trench was located on the eastern edge of the Mineral Resource and the additional information would not have a material effect on the estimate as reported.
Due to the nature, stage and size of the Company’s existing operations, the Board believes there would be no efficiencies gained by establishing a separate Ore Reserves and Mineral Resources committee responsible for reviewing and monitoring the Company’s processes for calculating Ore Reserves and Mineral Resources and for ensuring that the appropriate internal controls are applied to such calculations.
Competent Person’s StatementThe information in this Annual Mineral Resources and Ore Reserves Statement is based on, and fairly represents, information and supporting documentation compiled by Peter Bleakley, who is a Member of the Australasian Institute of Mining and Metallurgy. Mr Bleakley is not a full-time employee of the company. Mr Bleakley is a consultant to the mining industry. Mr Bleakley has sufficient experience that is relevant to
the style of mineralisation and type of deposit under consideration and to the activity being undertaken to qualify as a Competent Person as defined in the 2012 Edition of the ‘Australasian Code for Reporting of Exploration Results, Mineral Resources and Ore Reserves’. Mr Bleakley consents to the inclusion in the report of the matters based on his information in the form and context in which it appears.
Figure 11: Drilling at Kilba
2016 Annual ReportPg 20
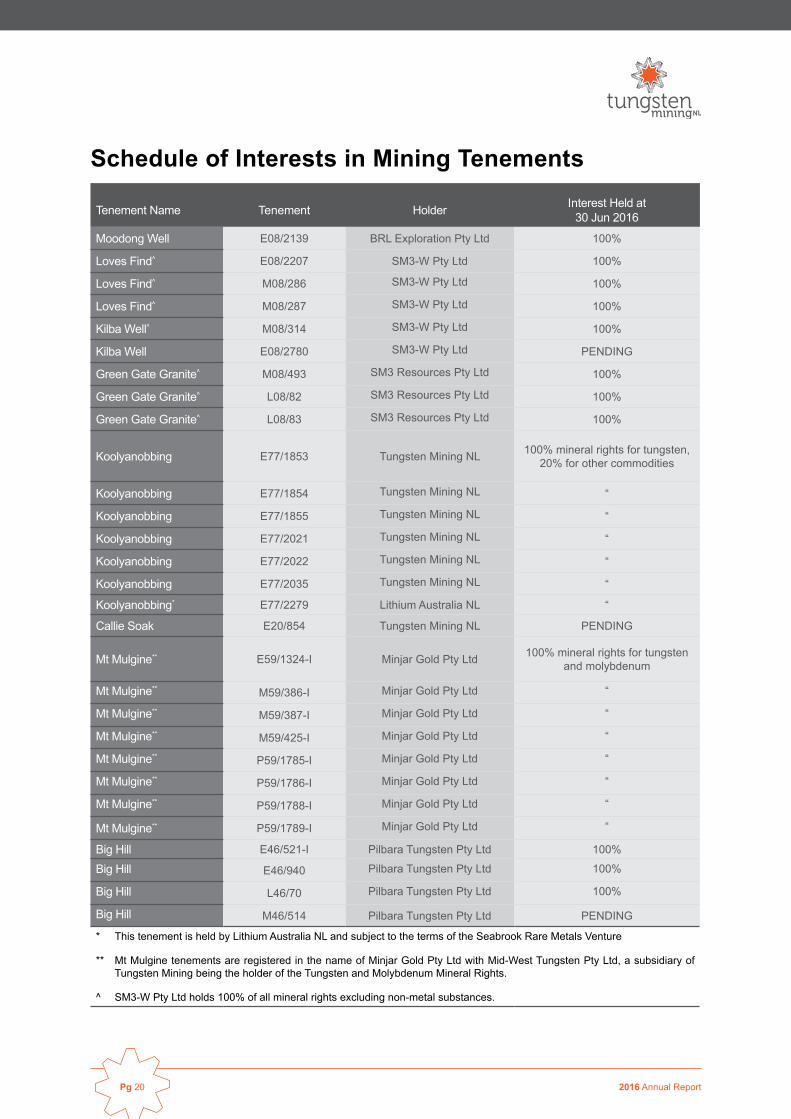
Schedule of Interests in Mining Tenements
Tenement Name Tenement Holder Interest Held at 30 Jun 2016
Moodong Well E08/2139 BRL Exploration Pty Ltd 100%
Loves Find^ E08/2207 SM3-W Pty Ltd 100%
Loves Find^ M08/286 SM3-W Pty Ltd 100%
Loves Find^ M08/287 SM3-W Pty Ltd 100%
Kilba Well^ M08/314 SM3-W Pty Ltd 100%
Kilba Well E08/2780 SM3-W Pty Ltd PENDING
Green Gate Granite^ M08/493 SM3 Resources Pty Ltd 100%
Green Gate Granite^ L08/82 SM3 Resources Pty Ltd 100%
Green Gate Granite^ L08/83 SM3 Resources Pty Ltd 100%
Koolyanobbing E77/1853 Tungsten Mining NL 100% mineral rights for tungsten, 20% for other commodities
Koolyanobbing E77/1854 Tungsten Mining NL “
Koolyanobbing E77/1855 Tungsten Mining NL “
Koolyanobbing E77/2021 Tungsten Mining NL “
Koolyanobbing E77/2022 Tungsten Mining NL “
Koolyanobbing E77/2035 Tungsten Mining NL “
Koolyanobbing* E77/2279 Lithium Australia NL “
Callie Soak E20/854 Tungsten Mining NL PENDING
Mt Mulgine** E59/1324-I Minjar Gold Pty Ltd 100% mineral rights for tungsten and molybdenum
Mt Mulgine** M59/386-I Minjar Gold Pty Ltd “
Mt Mulgine** M59/387-I Minjar Gold Pty Ltd “
Mt Mulgine** M59/425-I Minjar Gold Pty Ltd “
Mt Mulgine** P59/1785-I Minjar Gold Pty Ltd “
Mt Mulgine** P59/1786-I Minjar Gold Pty Ltd “
Mt Mulgine** P59/1788-I Minjar Gold Pty Ltd “
Mt Mulgine** P59/1789-I Minjar Gold Pty Ltd “
Big Hill E46/521-I Pilbara Tungsten Pty Ltd 100%
Big Hill E46/940 Pilbara Tungsten Pty Ltd 100%
Big Hill L46/70 Pilbara Tungsten Pty Ltd 100%
Big Hill M46/514 Pilbara Tungsten Pty Ltd PENDING
* This tenement is held by Lithium Australia NL and subject to the terms of the Seabrook Rare Metals Venture
** Mt Mulgine tenements are registered in the name of Minjar Gold Pty Ltd with Mid-West Tungsten Pty Ltd, a subsidiary of Tungsten Mining being the holder of the Tungsten and Molybdenum Mineral Rights.
^ SM3-W Pty Ltd holds 100% of all mineral rights excluding non-metal substances.

DIRECTORS’ REPORT

Directors’ Report The directors of Tungsten Mining NL (“Tungsten Mining” or “the Company”) present their report for Tungsten Mining NL, comprising the Company and the entities it controls (“the Group”), for the year ended 30 June 2016. Directors The names and details of the Company’s directors in office during the financial year and until the date of this report are as follows. Directors were in office for the entire period unless otherwise stated. Names, qualifications, experience and special responsibilities
Gary Lyons Non-executive Chairman Mr Lyons is a successful and well respected Perth based businessman; being a shareholder and the Managing Director of the Heiniger Group’s Australasian operations for over 25 years. Mr Lyons was appointed a director on 16 July 2014 and elected non-executive chairman on 5 January 2015. Mr Lyons is a member of the audit committee.
Present ASX company directorships: GWR Group Limited, Corizon Limited Previous ASX company directorships: Nil
Kong Leng (Jimmy) Lee Non-executive Director
Mr Lee is a mining engineer with more than 30 years of industry experience and is a member of AusIMM. He has successfully worked with a number of major Australian mining companies and has held senior positions with Hamersley Iron Ltd, Dominion Mining Ltd, Christmas Island Phosphates, North Ltd and Carey Mining Ltd. Mr Lee provides mining and corporate advisory services to the mining industry and was formerly a founding director of Terrain Minerals Limited. In addition, he has a successful track record with contract negotiations and company investment strategies. Mr Lee is a member of the audit committee. Present ASX company directorships: GWR Group Limited, Excelsior Gold Limited Previous ASX company directorships: Corizon Limited
Chew Wai Chuen Non-executive Director
Mr Chuen is a financial advisor with more than 15 years of industry experience, specialising in the provision of corporate and wealth management for ultra-high net worth individuals. He has experience in South East Asia capital markets and extensive networks of clients based in Singapore and Malaysia. Mr Chuen is also the Managing Partner with a financial advisory firm, providing personal investing planning and wealth management for high net worth individuals and has a good track record of investment into junior mining companies in Australia and South East Asia. Mr Chuen is a member of the audit committee. Present ASX company directorships: Potash West NLPrevious ASX company directorships: Nil
Directors’ Report
Teck Siong Wong Non-executive Director (appointed 8 February 2016) Mr Wong has considerable international business experience having worked in Hong Kong, the United Kingdom and now in Malaysia and Indonesia after graduating with a Bachelor of Business degree from Swinburne University (Melbourne). Mr Wong is involved with the iron ore mining industry in Indonesia. He was previously involved in the sales and export of steel related products and was a director of a retail chain business in the United Kingdom, previously known as JW Carpenter Ltd. Mr Wong was working in the OEM plastic manufacturing industry in Hong Kong prior to taking up a position in the steel industry in Malaysia.
Mr Wong is a member of the audit committee. Present ASX company directorships: Corizon Limited Previous ASX company directorships (last 3 years): Nil
Company Secretary Mark Pitts Mr Pitts is a Fellow of the Institute of Chartered Accountants with more than 25 years’ experience in statutory reporting and business administration. He has been directly involved with, and consulted to a number of public companies holding senior financial management positions. He is a Partner in the corporate advisory firm Endeavour Corporate providing company secretarial support, corporate and compliance advice to a number of ASX listed public companies.
Interests in the shares and options of the Company and related bodies corporate
Ordinary shares Options (unlisted) Number Number Non-executive Directors Gary Lyons - - Kong Leng (Jimmy) Lee - - Teck Siong Wong - - Chew Wai Chuen 416,667 -
2016 Annual ReportPg 22

Directors’ Report The directors of Tungsten Mining NL (“Tungsten Mining” or “the Company”) present their report for Tungsten Mining NL, comprising the Company and the entities it controls (“the Group”), for the year ended 30 June 2016. Directors The names and details of the Company’s directors in office during the financial year and until the date of this report are as follows. Directors were in office for the entire period unless otherwise stated. Names, qualifications, experience and special responsibilities
Gary Lyons Non-executive Chairman Mr Lyons is a successful and well respected Perth based businessman; being a shareholder and the Managing Director of the Heiniger Group’s Australasian operations for over 25 years. Mr Lyons was appointed a director on 16 July 2014 and elected non-executive chairman on 5 January 2015. Mr Lyons is a member of the audit committee.
Present ASX company directorships: GWR Group Limited, Corizon Limited Previous ASX company directorships: Nil
Kong Leng (Jimmy) Lee Non-executive Director
Mr Lee is a mining engineer with more than 30 years of industry experience and is a member of AusIMM. He has successfully worked with a number of major Australian mining companies and has held senior positions with Hamersley Iron Ltd, Dominion Mining Ltd, Christmas Island Phosphates, North Ltd and Carey Mining Ltd. Mr Lee provides mining and corporate advisory services to the mining industry and was formerly a founding director of Terrain Minerals Limited. In addition, he has a successful track record with contract negotiations and company investment strategies. Mr Lee is a member of the audit committee. Present ASX company directorships: GWR Group Limited, Excelsior Gold Limited Previous ASX company directorships: Corizon Limited
Chew Wai Chuen Non-executive Director
Mr Chuen is a financial advisor with more than 15 years of industry experience, specialising in the provision of corporate and wealth management for ultra-high net worth individuals. He has experience in South East Asia capital markets and extensive networks of clients based in Singapore and Malaysia. Mr Chuen is also the Managing Partner with a financial advisory firm, providing personal investing planning and wealth management for high net worth individuals and has a good track record of investment into junior mining companies in Australia and South East Asia. Mr Chuen is a member of the audit committee. Present ASX company directorships: Potash West NLPrevious ASX company directorships: Nil
Directors’ Report
Teck Siong Wong Non-executive Director (appointed 8 February 2016) Mr Wong has considerable international business experience having worked in Hong Kong, the United Kingdom and now in Malaysia and Indonesia after graduating with a Bachelor of Business degree from Swinburne University (Melbourne). Mr Wong is involved with the iron ore mining industry in Indonesia. He was previously involved in the sales and export of steel related products and was a director of a retail chain business in the United Kingdom, previously known as JW Carpenter Ltd. Mr Wong was working in the OEM plastic manufacturing industry in Hong Kong prior to taking up a position in the steel industry in Malaysia.
Mr Wong is a member of the audit committee. Present ASX company directorships: Corizon Limited Previous ASX company directorships (last 3 years): Nil
Company Secretary Mark Pitts Mr Pitts is a Fellow of the Institute of Chartered Accountants with more than 25 years’ experience in statutory reporting and business administration. He has been directly involved with, and consulted to a number of public companies holding senior financial management positions. He is a Partner in the corporate advisory firm Endeavour Corporate providing company secretarial support, corporate and compliance advice to a number of ASX listed public companies.
Interests in the shares and options of the Company and related bodies corporate
Ordinary shares Options (unlisted) Number Number Non-executive Directors Gary Lyons - - Kong Leng (Jimmy) Lee - - Teck Siong Wong - - Chew Wai Chuen 416,667 -
2016 Annual Report Pg 23
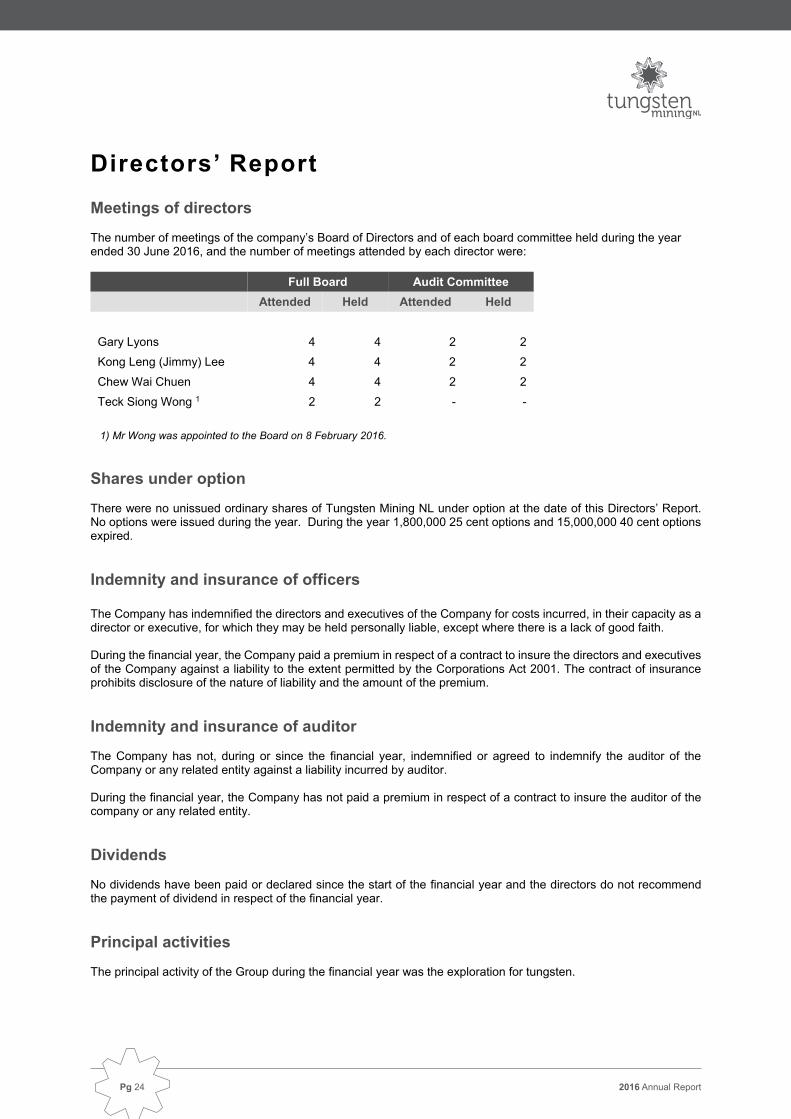
Directors’ Report Meetings of directors The number of meetings of the company’s Board of Directors and of each board committee held during the year ended 30 June 2016, and the number of meetings attended by each director were:
Full Board Audit Committee Attended Held Attended Held Gary Lyons 4 4 2 2 Kong Leng (Jimmy) Lee 4 4 2 2 Chew Wai Chuen 4 4 2 2 Teck Siong Wong 1 2 2 - -
1) Mr Wong was appointed to the Board on 8 February 2016.
Shares under option There were no unissued ordinary shares of Tungsten Mining NL under option at the date of this Directors’ Report. No options were issued during the year. During the year 1,800,000 25 cent options and 15,000,000 40 cent options expired. Indemnity and insurance of officers The Company has indemnified the directors and executives of the Company for costs incurred, in their capacity as a director or executive, for which they may be held personally liable, except where there is a lack of good faith. During the financial year, the Company paid a premium in respect of a contract to insure the directors and executives of the Company against a liability to the extent permitted by the Corporations Act 2001. The contract of insurance prohibits disclosure of the nature of liability and the amount of the premium. Indemnity and insurance of auditor The Company has not, during or since the financial year, indemnified or agreed to indemnify the auditor of the Company or any related entity against a liability incurred by auditor. During the financial year, the Company has not paid a premium in respect of a contract to insure the auditor of the company or any related entity. Dividends No dividends have been paid or declared since the start of the financial year and the directors do not recommend the payment of dividend in respect of the financial year. Principal activities The principal activity of the Group during the financial year was the exploration for tungsten.
Directors’ Report Operating and financial review Review of operations A detailed review of operations, strategies and prospects for future finance years is presented under Review of Operations section of this Annual Report. Operating results for the year The loss after income tax benefit for the year ended 30 June 2016 was $1,555,948 (2015: $3,396,740), which included $564,351 (2015: $2,768,136) of exploration expenditure. The Group impaired $510,079 (2015: Nil) in capitalised exploration and evaluation costs that related to tenement and project interests acquired prior to the Company’s initial public offer. The financial position of the Group is presented in the attached Consolidated Statement of Financial Position. Remuneration Report (Audited) This report outlines the remuneration arrangements in place for Key Management Personnel (KMP) of the Group. KMP’s Remuneration Policy
(a) The policy of the Group is to pay remuneration of KMP in line with employment market conditions relevant in the minerals exploration industry.
(b) The Group’s performance, and hence that of its KMP, is measured in terms of a combination of Group share price growth, its liquidity and the success of its exploration and development activities.
Relationship between Remuneration Policy and Company Performance Objective The Company aims to reward executives with a level and mix of remuneration commensurate with their position and responsibilities within the Group and so as to:
reward executives for Group, business team and individual performance;
align the interests of executives with those of shareholders; and
ensure total remuneration is competitive by market standards.
Structure At this time, the cash component of remuneration paid to the Directors, the Company Secretary and other
senior managers is not dependent upon the satisfaction of performance conditions.
It is current policy that some executives be engaged by way of consultancy agreements with the Group, under which they receive a contract rate based upon the number of hours of service supplied to the Group. There is provision for yearly review and adjustment based on consumer price indices. Such remuneration is hence not dependent upon the achievement of specific performance conditions. This policy is considered to be appropriate for the Group, having regard to the current state of its development.
The Company recognises the benefit of directors, managers and other employees of the Group holding
securities in the Company and directors are encouraged to hold shares, provided that any trading is consistent with its Policy for Trading in Company Securities. The Directors, officers and employees of the Group may also participate in the share and option plans as described in this report.
2016 Annual ReportPg 24

Directors’ Report Meetings of directors The number of meetings of the company’s Board of Directors and of each board committee held during the year ended 30 June 2016, and the number of meetings attended by each director were:
Full Board Audit Committee Attended Held Attended Held Gary Lyons 4 4 2 2 Kong Leng (Jimmy) Lee 4 4 2 2 Chew Wai Chuen 4 4 2 2 Teck Siong Wong 1 2 2 - -
1) Mr Wong was appointed to the Board on 8 February 2016.
Shares under option There were no unissued ordinary shares of Tungsten Mining NL under option at the date of this Directors’ Report. No options were issued during the year. During the year 1,800,000 25 cent options and 15,000,000 40 cent options expired. Indemnity and insurance of officers The Company has indemnified the directors and executives of the Company for costs incurred, in their capacity as a director or executive, for which they may be held personally liable, except where there is a lack of good faith. During the financial year, the Company paid a premium in respect of a contract to insure the directors and executives of the Company against a liability to the extent permitted by the Corporations Act 2001. The contract of insurance prohibits disclosure of the nature of liability and the amount of the premium. Indemnity and insurance of auditor The Company has not, during or since the financial year, indemnified or agreed to indemnify the auditor of the Company or any related entity against a liability incurred by auditor. During the financial year, the Company has not paid a premium in respect of a contract to insure the auditor of the company or any related entity. Dividends No dividends have been paid or declared since the start of the financial year and the directors do not recommend the payment of dividend in respect of the financial year. Principal activities The principal activity of the Group during the financial year was the exploration for tungsten.
Directors’ Report Operating and financial review Review of operations A detailed review of operations, strategies and prospects for future finance years is presented under Review of Operations section of this Annual Report. Operating results for the year The loss after income tax benefit for the year ended 30 June 2016 was $1,555,948 (2015: $3,396,740), which included $564,351 (2015: $2,768,136) of exploration expenditure. The Group impaired $510,079 (2015: Nil) in capitalised exploration and evaluation costs that related to tenement and project interests acquired prior to the Company’s initial public offer. The financial position of the Group is presented in the attached Consolidated Statement of Financial Position. Remuneration Report (Audited) This report outlines the remuneration arrangements in place for Key Management Personnel (KMP) of the Group. KMP’s Remuneration Policy
(a) The policy of the Group is to pay remuneration of KMP in line with employment market conditions relevant in the minerals exploration industry.
(b) The Group’s performance, and hence that of its KMP, is measured in terms of a combination of Group share price growth, its liquidity and the success of its exploration and development activities.
Relationship between Remuneration Policy and Company Performance Objective The Company aims to reward executives with a level and mix of remuneration commensurate with their position and responsibilities within the Group and so as to:
reward executives for Group, business team and individual performance;
align the interests of executives with those of shareholders; and
ensure total remuneration is competitive by market standards.
Structure At this time, the cash component of remuneration paid to the Directors, the Company Secretary and other
senior managers is not dependent upon the satisfaction of performance conditions.
It is current policy that some executives be engaged by way of consultancy agreements with the Group, under which they receive a contract rate based upon the number of hours of service supplied to the Group. There is provision for yearly review and adjustment based on consumer price indices. Such remuneration is hence not dependent upon the achievement of specific performance conditions. This policy is considered to be appropriate for the Group, having regard to the current state of its development.
The Company recognises the benefit of directors, managers and other employees of the Group holding
securities in the Company and directors are encouraged to hold shares, provided that any trading is consistent with its Policy for Trading in Company Securities. The Directors, officers and employees of the Group may also participate in the share and option plans as described in this report.
2016 Annual Report Pg 25

Directors’ Report Details of Remuneration Key Management Personnel’s remuneration for the year:
Other TotalSalary &
FeesOther
servicesNon-
MonetarySuper-
annuationRetirement
BenefitsShares Options
$ $ $ $ $ $ $ $ $
Non-executive directors
2016 54,795 - - 5,205 - - - - 60,000 2015 43,993 - - 4,179 - - - - 48,172
2016 40,000 - - - - - - - 40,000 2015 40,000 - - - - - - - 40,000
2016 36,530 9,500 - 3,470 - - - - 49,500 2015 36,530 6,000 - 3,470 - - - - 46,000
2016 15,862 - - - - - - - 15,862 2015 - - - - - - - - -
2016 - - - - - - - - - 2015 27,397 - - 2,603 - - - - 30,000
2016 - - - - - - - - - 2015 29,243 - - 1,602 - - - - 30,845
2016 - - - - - - - - - 2015 30,000 - - - - - - - 30,000
Other executives
2016 - - - - - - - - - 2015 - - - - - - - - -
2016 - 42,000 - - - - - - 42,000 2015 - 23,000 - - - - - - 23,000
2016 - - - - - - - - - 2015 - 63,520 - - - - - - 63,520
2016 - - - - - - - - - 2015 - 18,669 - - - - - - 18,669
2016 147,187 51,500 - 8,675 - - - - 207,362 2015 207,163 111,189 - 11,854 - - - - 330,206
Total Remuneration
Gary Lyons
Chew Wai Chuen
Kong Leng (Jimmy) Lee
Teck Siong Wong (appointed 8 February 2016)
Craig Ferrier 3
Mark Pitts 1
David Grant Sanders (resigned 31 March 2015)
Paul Berndt (resigned 21 November 2014)
Patrick McManus (resigned 5 January 2015)
Short-term Post employment Share-based t
Robert Van der Laan 2
Elizabeth Hunt 1
Directors’ Report Details of Remuneration (continued) 1) Mining Corporate Pty Ltd, a company of which Elizabeth Hunt is a director, was engaged in the prior year to provide company
secretarial services to the Company. This agreement was terminated by mutual agreement on 12 December 2014. Endeavour Corporate Pty Ltd, a company of which Mark Pitts is a director, was engaged to provide company secretarial services to the Company from that date.
2) Horn Resources Pty Ltd, a company of which Robert Van der Laan is a director, was engaged to provide administration and
technical services during the prior financial year. Amounts recorded as paid to Mr Van der Laan represent amounts paid or payable to Horn Resources Pty Ltd for services fulfilled by him in the relevant period. This included an ex gratia payment of $50,000 paid to Horn Resources Pty Ltd on termination of the service contract.
3) On 1 August 2014 the Company entered into an agreement for the provision of executive, administration and technical servicesby GWR Group Ltd. Craig Ferrier was appointed Chief Executive Officer on the same date. Mr Ferrier is an employee of GWR Group Ltd and is remunerated by that entity and as such has received no remuneration from the Company.
Share and option based payments Under the Management Fee and Remuneration Sacrifice Share Plan (“Plan”), the eligible directors and senior management of the Company may elect to sacrifice part of their directors’ fees or consulting fees to acquire shares in the Company. Under the Plan, the relevant directors and senior management will receive the remainder of their directors’ fees or consulting fees in cash. As such, the shares will be issued for nil cash consideration and will be valued at fair market value. The Plan rules were approved by shareholders at the annual general meeting held in November 2013 for the purposes of ASX Listing Rules. During the 2016 and 2015 financial year no share based payments occurred under this Plan or under another plan. In the 2015 financial year the Company issued a total of 662,107 shares representing $34,562 sacrificed by eligible directors. The amount of income agreed by eligible directors to be sacrificed for shares was included in the amount of salary and fee remuneration for the 2014 financial year and disclosed in the table of KMP remuneration for that year. Service agreements There are no contracts in place with regard to the services provided by KMP unless otherwise stated. Agreements with Non-executive Directors Mr Gary Lyons was appointed as a Non-executive Director on 16 July 2014 and elected Chairman on 5 January 2015. Pursuant to an agreement dated 16 July 2014, his director’s fee was initially set at $40,000 per annum, inclusive of superannuation requirement. The level of directors fees payable to Mr Lyons were increased to $60,000 per annum, inclusive of superannuation from 5 January 2015. In the event of termination, there is no notice period required. Mr Kong Leng (Jimmy) Lee was appointed as a Non-executive Director on 2 April 2014. Pursuant to an agreement dated 2 April 2014, his director’s fee was set at $40,000 per annum, inclusive of superannuation requirement. In the event of termination, there is no notice period required. Mr Chew Wai Chuen was appointed as a Non-executive Director on 17 April 2014. Pursuant to an agreement dated 17 April 2014 his director’s fee was set at $40,000 per annum, inclusive of superannuation requirement. In the event of termination, there is no notice period required. Mr Teck Siong Wong was appointed as a Non-executive Director on 8 February 2016. Pursuant to an agreement dated 8 February 2016 his director’s fee was set at $40,000 per annum, inclusive of superannuation requirement. In the event of termination, there is no notice period required.
2016 Annual ReportPg 26

Directors’ Report Details of Remuneration Key Management Personnel’s remuneration for the year:
Other TotalSalary &
FeesOther
servicesNon-
MonetarySuper-
annuationRetirement
BenefitsShares Options
$ $ $ $ $ $ $ $ $
Non-executive directors
2016 54,795 - - 5,205 - - - - 60,000 2015 43,993 - - 4,179 - - - - 48,172
2016 40,000 - - - - - - - 40,000 2015 40,000 - - - - - - - 40,000
2016 36,530 9,500 - 3,470 - - - - 49,500 2015 36,530 6,000 - 3,470 - - - - 46,000
2016 15,862 - - - - - - - 15,862 2015 - - - - - - - - -
2016 - - - - - - - - - 2015 27,397 - - 2,603 - - - - 30,000
2016 - - - - - - - - - 2015 29,243 - - 1,602 - - - - 30,845
2016 - - - - - - - - - 2015 30,000 - - - - - - - 30,000
Other executives
2016 - - - - - - - - - 2015 - - - - - - - - -
2016 - 42,000 - - - - - - 42,000 2015 - 23,000 - - - - - - 23,000
2016 - - - - - - - - - 2015 - 63,520 - - - - - - 63,520
2016 - - - - - - - - - 2015 - 18,669 - - - - - - 18,669
2016 147,187 51,500 - 8,675 - - - - 207,362 2015 207,163 111,189 - 11,854 - - - - 330,206
Total Remuneration
Gary Lyons
Chew Wai Chuen
Kong Leng (Jimmy) Lee
Teck Siong Wong (appointed 8 February 2016)
Craig Ferrier 3
Mark Pitts 1
David Grant Sanders (resigned 31 March 2015)
Paul Berndt (resigned 21 November 2014)
Patrick McManus (resigned 5 January 2015)
Short-term Post employment Share-based t
Robert Van der Laan 2
Elizabeth Hunt 1
Directors’ Report Details of Remuneration (continued) 1) Mining Corporate Pty Ltd, a company of which Elizabeth Hunt is a director, was engaged in the prior year to provide company
secretarial services to the Company. This agreement was terminated by mutual agreement on 12 December 2014. Endeavour Corporate Pty Ltd, a company of which Mark Pitts is a director, was engaged to provide company secretarial services to the Company from that date.
2) Horn Resources Pty Ltd, a company of which Robert Van der Laan is a director, was engaged to provide administration and
technical services during the prior financial year. Amounts recorded as paid to Mr Van der Laan represent amounts paid or payable to Horn Resources Pty Ltd for services fulfilled by him in the relevant period. This included an ex gratia payment of $50,000 paid to Horn Resources Pty Ltd on termination of the service contract.
3) On 1 August 2014 the Company entered into an agreement for the provision of executive, administration and technical servicesby GWR Group Ltd. Craig Ferrier was appointed Chief Executive Officer on the same date. Mr Ferrier is an employee of GWR Group Ltd and is remunerated by that entity and as such has received no remuneration from the Company.
Share and option based payments Under the Management Fee and Remuneration Sacrifice Share Plan (“Plan”), the eligible directors and senior management of the Company may elect to sacrifice part of their directors’ fees or consulting fees to acquire shares in the Company. Under the Plan, the relevant directors and senior management will receive the remainder of their directors’ fees or consulting fees in cash. As such, the shares will be issued for nil cash consideration and will be valued at fair market value. The Plan rules were approved by shareholders at the annual general meeting held in November 2013 for the purposes of ASX Listing Rules. During the 2016 and 2015 financial year no share based payments occurred under this Plan or under another plan. In the 2015 financial year the Company issued a total of 662,107 shares representing $34,562 sacrificed by eligible directors. The amount of income agreed by eligible directors to be sacrificed for shares was included in the amount of salary and fee remuneration for the 2014 financial year and disclosed in the table of KMP remuneration for that year. Service agreements There are no contracts in place with regard to the services provided by KMP unless otherwise stated. Agreements with Non-executive Directors Mr Gary Lyons was appointed as a Non-executive Director on 16 July 2014 and elected Chairman on 5 January 2015. Pursuant to an agreement dated 16 July 2014, his director’s fee was initially set at $40,000 per annum, inclusive of superannuation requirement. The level of directors fees payable to Mr Lyons were increased to $60,000 per annum, inclusive of superannuation from 5 January 2015. In the event of termination, there is no notice period required. Mr Kong Leng (Jimmy) Lee was appointed as a Non-executive Director on 2 April 2014. Pursuant to an agreement dated 2 April 2014, his director’s fee was set at $40,000 per annum, inclusive of superannuation requirement. In the event of termination, there is no notice period required. Mr Chew Wai Chuen was appointed as a Non-executive Director on 17 April 2014. Pursuant to an agreement dated 17 April 2014 his director’s fee was set at $40,000 per annum, inclusive of superannuation requirement. In the event of termination, there is no notice period required. Mr Teck Siong Wong was appointed as a Non-executive Director on 8 February 2016. Pursuant to an agreement dated 8 February 2016 his director’s fee was set at $40,000 per annum, inclusive of superannuation requirement. In the event of termination, there is no notice period required.
2016 Annual Report Pg 27

Directors’ Report Service agreements (continued) OtherIn the 2015 financial year, the Company entered into an agreement for the provision of management and technical services to the Company by GWR Group Ltd. Mr Craig Ferrier was appointed Chief Executive Officer on the same date. Mr Ferrier is an employee of GWR Group Ltd and is remunerated by that entity and as such has received no remuneration from the Company. There is no amount payable or prescribed notice period required on termination of executive officer positions, fulfilled pursuant to the management agreement. The management agreement may be terminated by either party on three months written notice. Use of remuneration consultants The Group did not employ the services of any remuneration consultants during the year ended 30 June 2016. Share options Options granted to KMP There were no share options in the Company granted to KMP during the 2016 financial year. Option holdings of KMPThere were no holdings of share options in the Company held by KMP during the 2016 financial year. Shares
Share holdings for KMP
The number of ordinary shares in the Company held by KMP during the 2016 financial year is as follows:
Balance at beginning
of Year
Granted as remuneration
during the year
Issued on exercise of
options during the year
Other changes
during the year
Balance at end of year
or cessation of office
Non-executive directors Gary Lyons - - - - - Chew Wai Chuen 416,667 - - - 416,667 Kong Leng (Jimmy) Lee - - - - - Teck Siong Wong 1 - - - - - Other executives Craig Ferrier - - - - - Mark Pitts - - - - -
416,667 - - - 416,667
1) Mr Wong was appointed a director on 8 February 2016. End of Remuneration Report
Directors’ Report Auditor’s Independence Declaration A copy of the auditor’s independence declaration as required under Section 307C of the Corporations Act 2001 is set out on page 30 and forms part of this report. The report is made in accordance with a resolution of directors.
Gary Lyons Chairman Perth Dated 16 September 2016
2016 Annual ReportPg 28

Directors’ Report Service agreements (continued) OtherIn the 2015 financial year, the Company entered into an agreement for the provision of management and technical services to the Company by GWR Group Ltd. Mr Craig Ferrier was appointed Chief Executive Officer on the same date. Mr Ferrier is an employee of GWR Group Ltd and is remunerated by that entity and as such has received no remuneration from the Company. There is no amount payable or prescribed notice period required on termination of executive officer positions, fulfilled pursuant to the management agreement. The management agreement may be terminated by either party on three months written notice. Use of remuneration consultants The Group did not employ the services of any remuneration consultants during the year ended 30 June 2016. Share options Options granted to KMP There were no share options in the Company granted to KMP during the 2016 financial year. Option holdings of KMPThere were no holdings of share options in the Company held by KMP during the 2016 financial year. Shares
Share holdings for KMP
The number of ordinary shares in the Company held by KMP during the 2016 financial year is as follows:
Balance at beginning
of Year
Granted as remuneration
during the year
Issued on exercise of
options during the year
Other changes
during the year
Balance at end of year
or cessation of office
Non-executive directors Gary Lyons - - - - - Chew Wai Chuen 416,667 - - - 416,667 Kong Leng (Jimmy) Lee - - - - - Teck Siong Wong 1 - - - - - Other executives Craig Ferrier - - - - - Mark Pitts - - - - -
416,667 - - - 416,667
1) Mr Wong was appointed a director on 8 February 2016. End of Remuneration Report
Directors’ Report Auditor’s Independence Declaration A copy of the auditor’s independence declaration as required under Section 307C of the Corporations Act 2001 is set out on page 30 and forms part of this report. The report is made in accordance with a resolution of directors.
Gary Lyons Chairman Perth Dated 16 September 2016
2016 Annual Report Pg 29

2016 Annual ReportPg 30
PO Box 1908 West Perth WA 6872
Australia
Level 2, 1 Walker Avenue West Perth WA 6005
Australia
Tel: +61 8 9481 3188 Fax: +61 8 9321 1204
ABN: 84 144 581 519 www.stantons.com.au
Liability limited by a scheme approved under Professional Standards Legislation
Stantons International Audit and Consulting Pty Ltd trading as
Chartered Accountants and Consultants
16 September 2016 Board of Directors Tungsten Mining NL 97 Outram Street West Perth WA 6005 Dear Sirs RE: TUNGSTEN MINING NL In accordance with section 307C of the Corporations Act 2001, I am pleased to provide the following declaration of independence to the directors Tungsten Mining NL. As Audit Director for the audit of the financial statements of Tungsten Mining NL for the year ended 30 June 2016, I declare that to the best of my knowledge and belief, there have been no contraventions of: (i) the auditor independence requirements of the Corporations Act 2001 in relation to
the audit; and (ii) any applicable code of professional conduct in relation to the audit. Yours faithfully STANTONS INTERNATIONAL AUDIT AND CONSULTING PTY LTD (Trading as Stantons International) (An Authorised Audit Company)
Martin Michalik Director

FINANCIAL STATEMENTS

Consolidated Statement of Profit or Loss and Other Comprehensive Income For the year ended 30 June 2016 2016 2015 Note $ $
Revenue from continuing activities R&D tax offset 495,774 77,142 Interest 29,001 57,629 Fuel tax credit - 21,711 Total revenue 524,775 156,482 Expenses Administration (679,524) (438,242) Exploration (564,351) (2,768,136) Occupancy (48,000) (48,500) Remuneration (164,986) (298,344) Capitalised exploration and evaluation costs expensed 12 (100,000) - Impairment of assets 12 (510,079) - Loss on disposal of property, plant and equipment (13,783) - Loss from continuing operations before income tax (1,555,948) (3,396,740) Income tax benefit 4 - - Net loss for the year (1,555,948) (3,396,740) Other comprehensive income Items that will not be reclassified subsequently to profit or loss - - Items that may be reclassified subsequently to profit or loss - - Total comprehensive loss for the year (1,555,948) (3,396,740) Net loss attributable to members of the Parent (1,555,948) (3,396,740) Total comprehensive loss attributable to members of the Parent (1,555,948) (3,396,740) Basic and diluted loss per share (cents per share) 7 (0.66) (1.60)
The above Consolidated Statement of Profit or Loss and Other Comprehensive Income should be read in conjunction with the accompanying notes.
Consolidated Statement of Financial PositionAs at 30 June 2016 2016 2015 Note $ $ Current assets Cash and cash equivalents 8 1,558,657 775,535 Trade and other receivables 9 43,494 32,835 Other assets 10 - 8,178 Total current assets 1,602,151 816,548 Non current assets Plant and equipment 11 98,154 144,401 Exploration and evaluation 12 2,352,171 1,610,079 Total non current assets 2,450,325 1,754,480 Total assets 4,052,476 2,571,028 Current liabilities Trade and other payables 13 301,867 278,471 Interest bearing loan and borrowings 14 1,000,000 - Total current liabilities 1,301,867 278,471 Total liabilities 1,301,867 278,471 Net assets 2,750,609 2,292,557 Equity Issued capital 15 15,613,073 13,599,073 Reserves 16 235,080 235,080 Accumulated losses 17 (13,097,544) (11,541,596)
Total equity 2,750,609 2,292,557
The above Consolidated Statement of Financial Position should be read in conjunction with the accompanying notes.
2016 Annual ReportPg 32

Consolidated Statement of Profit or Loss and Other Comprehensive Income For the year ended 30 June 2016 2016 2015 Note $ $
Revenue from continuing activities R&D tax offset 495,774 77,142 Interest 29,001 57,629 Fuel tax credit - 21,711 Total revenue 524,775 156,482 Expenses Administration (679,524) (438,242) Exploration (564,351) (2,768,136) Occupancy (48,000) (48,500) Remuneration (164,986) (298,344) Capitalised exploration and evaluation costs expensed 12 (100,000) - Impairment of assets 12 (510,079) - Loss on disposal of property, plant and equipment (13,783) - Loss from continuing operations before income tax (1,555,948) (3,396,740) Income tax benefit 4 - - Net loss for the year (1,555,948) (3,396,740) Other comprehensive income Items that will not be reclassified subsequently to profit or loss - - Items that may be reclassified subsequently to profit or loss - - Total comprehensive loss for the year (1,555,948) (3,396,740) Net loss attributable to members of the Parent (1,555,948) (3,396,740) Total comprehensive loss attributable to members of the Parent (1,555,948) (3,396,740) Basic and diluted loss per share (cents per share) 7 (0.66) (1.60)
The above Consolidated Statement of Profit or Loss and Other Comprehensive Income should be read in conjunction with the accompanying notes.
Consolidated Statement of Financial PositionAs at 30 June 2016 2016 2015 Note $ $ Current assets Cash and cash equivalents 8 1,558,657 775,535 Trade and other receivables 9 43,494 32,835 Other assets 10 - 8,178 Total current assets 1,602,151 816,548 Non current assets Plant and equipment 11 98,154 144,401 Exploration and evaluation 12 2,352,171 1,610,079 Total non current assets 2,450,325 1,754,480 Total assets 4,052,476 2,571,028 Current liabilities Trade and other payables 13 301,867 278,471 Interest bearing loan and borrowings 14 1,000,000 - Total current liabilities 1,301,867 278,471 Total liabilities 1,301,867 278,471 Net assets 2,750,609 2,292,557 Equity Issued capital 15 15,613,073 13,599,073 Reserves 16 235,080 235,080 Accumulated losses 17 (13,097,544) (11,541,596)
Total equity 2,750,609 2,292,557
The above Consolidated Statement of Financial Position should be read in conjunction with the accompanying notes.
2016 Annual Report Pg 33

Consolidated Statement of Changes in EquityFor the year ended 30 June 2016
Issued Capital Reserves Accumulated Losses Total
$ $ $ $
At 1 July 2014 13,599,353 235,080 (8,144,856) 5,689,577 Loss for the year - - (3,396,740) (3,396,740) Other comprehensive loss (net of tax) - - - - Total comprehensive loss for the year (net of tax) - - (3,396,740) (3,396,740) Transactions with owners in their capacity as owners: Shares issued 34,562 - - 34,562 Share issue transaction costs (34,842) - - (34,842) At 30 June 2015 13,599,073 235,080 (11,541,596) 2,292,557 At 1 July 2015 13,599,073 235,080 (11,541,596) 2,292,557 Loss for the year - - (1,555,948) (1,555,948) Other comprehensive loss (net of tax) - - - - Total comprehensive loss for the year (net of tax) - - (1,555,948) (1,555,948) Transactions with owners in their capacity as owners: Shares issued 2,110,000 - - 2,110,000 Share issue transaction costs (96,000) - - (96,000) At 30 June 2016 15,613,073 235,080 (13,097,544) 2,750,609
The above Consolidated Statement of Changes in Equity should be read in conjunction with the accompanying notes.
Consolidated Statement of Cash Flows For the year ended 30 June 2016 2016 2015
Note $ $
Operating activities Payments to suppliers and employees (1,351,548) (3,444,058) R&D tax offset received 495,774 77,142 Interest received 23,900 53,914 Interest paid (60,164) - Net cash flows (used in) operating activities 21 (892,038) (3,313,002) Investing activities Purchase of property, plant and equipment (4,850) (60,488) Purchase of tenements and interests (1,162,171) - Proceeds from sale of property, plant and equipment 18,181 - Net cash flows (used in) investing activities (1,148,840) (60,488) Financing activities Share issue costs 15 (96,000) (45,836) Proceeds from issue of shares 15 1,920,000 - Proceeds from borrowings 14 1,000,000 - Net cash flows from/(used in) financing activities 2,824,000 (45,836) Net increase/(decrease) in cash and cash equivalents 783,122 (3,419,326) Cash and cash equivalents at the beginning of the year 775,535 4,194,861
Cash and cash equivalents at the end of the year 8 1,558,657 775,535
The above Consolidated Statement of Cash Flows should be read in conjunction with the accompanying notes.
2016 Annual ReportPg 34

Consolidated Statement of Changes in EquityFor the year ended 30 June 2016
Issued Capital Reserves Accumulated Losses Total
$ $ $ $
At 1 July 2014 13,599,353 235,080 (8,144,856) 5,689,577 Loss for the year - - (3,396,740) (3,396,740) Other comprehensive loss (net of tax) - - - - Total comprehensive loss for the year (net of tax) - - (3,396,740) (3,396,740) Transactions with owners in their capacity as owners: Shares issued 34,562 - - 34,562 Share issue transaction costs (34,842) - - (34,842) At 30 June 2015 13,599,073 235,080 (11,541,596) 2,292,557 At 1 July 2015 13,599,073 235,080 (11,541,596) 2,292,557 Loss for the year - - (1,555,948) (1,555,948) Other comprehensive loss (net of tax) - - - - Total comprehensive loss for the year (net of tax) - - (1,555,948) (1,555,948) Transactions with owners in their capacity as owners: Shares issued 2,110,000 - - 2,110,000 Share issue transaction costs (96,000) - - (96,000) At 30 June 2016 15,613,073 235,080 (13,097,544) 2,750,609
The above Consolidated Statement of Changes in Equity should be read in conjunction with the accompanying notes.
Consolidated Statement of Cash Flows For the year ended 30 June 2016 2016 2015
Note $ $
Operating activities Payments to suppliers and employees (1,351,548) (3,444,058) R&D tax offset received 495,774 77,142 Interest received 23,900 53,914 Interest paid (60,164) - Net cash flows (used in) operating activities 21 (892,038) (3,313,002) Investing activities Purchase of property, plant and equipment (4,850) (60,488) Purchase of tenements and interests (1,162,171) - Proceeds from sale of property, plant and equipment 18,181 - Net cash flows (used in) investing activities (1,148,840) (60,488) Financing activities Share issue costs 15 (96,000) (45,836) Proceeds from issue of shares 15 1,920,000 - Proceeds from borrowings 14 1,000,000 - Net cash flows from/(used in) financing activities 2,824,000 (45,836) Net increase/(decrease) in cash and cash equivalents 783,122 (3,419,326) Cash and cash equivalents at the beginning of the year 775,535 4,194,861
Cash and cash equivalents at the end of the year 8 1,558,657 775,535
The above Consolidated Statement of Cash Flows should be read in conjunction with the accompanying notes.
2016 Annual Report Pg 35

Notes to Financial Statements for the year ended 30 June 2016
Note 1: Corporate Information Tungsten Mining NL (“the Company”) is a public no liability company and was incorporated on 13 July 2011 in Australia. The consolidated financial report of the Company for the year ended 30 June 2016 comprises the Company and its subsidiaries (together referred to as the “Group”). The Group’s principal activities are mineral exploration, evaluation and development. The nature of operations and principal activities of the Group are described in the directors’ report. Note 2: Statement of significant accounting policies (a) Basis of preparation The consolidated financial report is a general purpose financial report, which has been prepared in accordance with the requirements of the Corporations Act 2001, Australian Accounting Standards and Interpretations, and other authoritative pronouncements of the Australian Accounting Standards Board. Compliance with Australian Accounting Standards ensures that the financial statements and notes also comply with International Financial Reporting Standards as issued by the IASB. The consolidated financial report has also been prepared on an accruals and historical cost basis. Cost is based on the fair values of the consideration given in exchange of assets. The consolidated financial report is presented in Australian dollars. The accounting policies detailed below have been consistently followed throughout the period presented unless otherwise stated. (b) New accounting standards and interpretations New and amended standards adopted The Group has considered the implications of new and amended Accounting Standards applicable for annual reporting periods beginning after 1 January 2015 and determined that their application to the financial statements is not relevant or material. Other standards not yet applicable A number of new standards, amendments to standards and interpretations issued by the AASB which are not yet mandatorily applicable to the Group have not been applied in preparing these consolidated financial statements. Those which may be relevant to the Group are set out below. The Group does not plan to adopt these standards early.
AASB 9 Financial Instruments and associated Amending Standards (applicable for annual reporting period commencing 1 January 2018) The Standard will be applicable retrospectively (subject to the comment on hedge accounting below) and includes revised requirements for the classification and measurement of financial instruments, revised recognition and derecognition requirements for financial instruments and simplified requirements for hedge accounting.
Key changes made to this standard that may affect the Group on initial application include certain simplifications to the classification of financial assets, simplifications to the accounting of embedded derivatives, and the irrevocable election to recognise gains and losses on investments in equity instruments that are not held for trading in other comprehensive income.
Although the directors anticipate that the adoption of AASB 9 may have an impact on the Group’s financial instruments it is impractical at this stage to provide a reasonable estimate of such impact.
Notes to Financial Statements for the year ended 30 June 2016
Note 2: Statement of significant accounting policies (continued)
(b) New accounting standards and interpretations (continued)
AASB 15: Revenue from Contracts with Customers (applicable to annual reporting periods commencing on
or after 1 January 2018)When effective, this Standard will replace the current accounting requirements applicable to revenue with a single, principles-based model. Except for a limited number of exceptions, including leases, the new revenue model in AASB 15 will apply to all contracts with customers as well as non-monetary exchanges between entities in the same line of business to facilitate sales to customers and potential customers.
The core principle of the Standard is that an entity will recognise revenue to depict the transfer of promised goods or services to customers in an amount that reflects the consideration to which the entity expects to be entitled in exchange for the goods or services. To achieve this objective, AASB 15 provides the following five-step process:
- identify the contract(s) with a customer; - identify the performance obligations in the contract(s); - determine the transaction price; - allocate the transaction price to the performance obligations in the contract(s); and - recognise revenue when (or as) the performance obligations are satisfied.
This Standard will require retrospective restatement, as well as enhanced disclosures regarding revenue. Although the directors anticipate that the adoption of AASB 15 may have an impact on the Group's financial statements, it is impracticable at this stage to provide a reasonable estimate of such impact.
AASB 16: Leases (applicable to annual reporting periods commencing on or after 1 January 2019)AASB 16 removes the classification of leases as either operating leases or finance leases for the lessee effectively treating all leases as finance leases. Short term leases (less than 12 months) and leases of a low value are exempt from the lease accounting requirements. Lessor accounting remains similar to current practice.
Although the directors anticipate that the adoption of AASB 16 may have an impact on the Group's financial statements, it is impracticable at this stage to provide a reasonable estimate of such impact.
AASB 2014-3: Amendments to Australian Accounting Standards – Accounting for Acquisitions of Interests in Joint Operations [AASB 1 & AASB 11]AASB 2014-3 amends AASB 11 Joint Arrangements to provide guidance on the accounting for acquisitions of interests in joint operations in which the activity constitutes a business. The amendments require:
(a) the acquirer of an interest in a joint operation in which the activity constitutes a business, as defined in AASB 3 Business Combinations, to apply all of the principles on business combinations accounting in AASB 3 and other Australian Accounting Standards except for those principles that conflict with the guidance in AASB 11
(b) the acquirer to disclose the information required by AASB 3 and other Australian Accounting Standards for business combinations. This Standard also makes an editorial correction to AASB 11.
AASB 2014-9: Amendments to Australian Accounting Standards – Equity Method in Separate Financial
Statements (AASB 2014-9 applies to annual reporting periods beginning on or after 1 January 2016. Early adoption permitted).AASB 2014-9 amends AASB 127 Separate Financial Statements, and consequentially amends AASB 1 First-time Adoption of Australian Accounting Standards and AASB 128 Investments in Associates and Joint Ventures, to allow entities to use the equity method of accounting for investments in subsidiaries, joint ventures and associates in their separate financial statements. AASB 2014-9 also makes editorial corrections to AASB 127.
Other standards not yet applicableThere are no other standards that are not yet effective and that would be expected to have a material impact on the entity in the current or future reporting periods and on foreseeable future transactions.
2016 Annual ReportPg 36

Notes to Financial Statements for the year ended 30 June 2016
Note 1: Corporate Information Tungsten Mining NL (“the Company”) is a public no liability company and was incorporated on 13 July 2011 in Australia. The consolidated financial report of the Company for the year ended 30 June 2016 comprises the Company and its subsidiaries (together referred to as the “Group”). The Group’s principal activities are mineral exploration, evaluation and development. The nature of operations and principal activities of the Group are described in the directors’ report. Note 2: Statement of significant accounting policies (a) Basis of preparation The consolidated financial report is a general purpose financial report, which has been prepared in accordance with the requirements of the Corporations Act 2001, Australian Accounting Standards and Interpretations, and other authoritative pronouncements of the Australian Accounting Standards Board. Compliance with Australian Accounting Standards ensures that the financial statements and notes also comply with International Financial Reporting Standards as issued by the IASB. The consolidated financial report has also been prepared on an accruals and historical cost basis. Cost is based on the fair values of the consideration given in exchange of assets. The consolidated financial report is presented in Australian dollars. The accounting policies detailed below have been consistently followed throughout the period presented unless otherwise stated. (b) New accounting standards and interpretations New and amended standards adopted The Group has considered the implications of new and amended Accounting Standards applicable for annual reporting periods beginning after 1 January 2015 and determined that their application to the financial statements is not relevant or material. Other standards not yet applicable A number of new standards, amendments to standards and interpretations issued by the AASB which are not yet mandatorily applicable to the Group have not been applied in preparing these consolidated financial statements. Those which may be relevant to the Group are set out below. The Group does not plan to adopt these standards early.
AASB 9 Financial Instruments and associated Amending Standards (applicable for annual reporting period commencing 1 January 2018) The Standard will be applicable retrospectively (subject to the comment on hedge accounting below) and includes revised requirements for the classification and measurement of financial instruments, revised recognition and derecognition requirements for financial instruments and simplified requirements for hedge accounting.
Key changes made to this standard that may affect the Group on initial application include certain simplifications to the classification of financial assets, simplifications to the accounting of embedded derivatives, and the irrevocable election to recognise gains and losses on investments in equity instruments that are not held for trading in other comprehensive income.
Although the directors anticipate that the adoption of AASB 9 may have an impact on the Group’s financial instruments it is impractical at this stage to provide a reasonable estimate of such impact.
Notes to Financial Statements for the year ended 30 June 2016
Note 2: Statement of significant accounting policies (continued)
(b) New accounting standards and interpretations (continued)
AASB 15: Revenue from Contracts with Customers (applicable to annual reporting periods commencing on
or after 1 January 2018)When effective, this Standard will replace the current accounting requirements applicable to revenue with a single, principles-based model. Except for a limited number of exceptions, including leases, the new revenue model in AASB 15 will apply to all contracts with customers as well as non-monetary exchanges between entities in the same line of business to facilitate sales to customers and potential customers.
The core principle of the Standard is that an entity will recognise revenue to depict the transfer of promised goods or services to customers in an amount that reflects the consideration to which the entity expects to be entitled in exchange for the goods or services. To achieve this objective, AASB 15 provides the following five-step process:
- identify the contract(s) with a customer; - identify the performance obligations in the contract(s); - determine the transaction price; - allocate the transaction price to the performance obligations in the contract(s); and - recognise revenue when (or as) the performance obligations are satisfied.
This Standard will require retrospective restatement, as well as enhanced disclosures regarding revenue. Although the directors anticipate that the adoption of AASB 15 may have an impact on the Group's financial statements, it is impracticable at this stage to provide a reasonable estimate of such impact.
AASB 16: Leases (applicable to annual reporting periods commencing on or after 1 January 2019)AASB 16 removes the classification of leases as either operating leases or finance leases for the lessee effectively treating all leases as finance leases. Short term leases (less than 12 months) and leases of a low value are exempt from the lease accounting requirements. Lessor accounting remains similar to current practice.
Although the directors anticipate that the adoption of AASB 16 may have an impact on the Group's financial statements, it is impracticable at this stage to provide a reasonable estimate of such impact.
AASB 2014-3: Amendments to Australian Accounting Standards – Accounting for Acquisitions of Interests in Joint Operations [AASB 1 & AASB 11]AASB 2014-3 amends AASB 11 Joint Arrangements to provide guidance on the accounting for acquisitions of interests in joint operations in which the activity constitutes a business. The amendments require:
(a) the acquirer of an interest in a joint operation in which the activity constitutes a business, as defined in AASB 3 Business Combinations, to apply all of the principles on business combinations accounting in AASB 3 and other Australian Accounting Standards except for those principles that conflict with the guidance in AASB 11
(b) the acquirer to disclose the information required by AASB 3 and other Australian Accounting Standards for business combinations. This Standard also makes an editorial correction to AASB 11.
AASB 2014-9: Amendments to Australian Accounting Standards – Equity Method in Separate Financial
Statements (AASB 2014-9 applies to annual reporting periods beginning on or after 1 January 2016. Early adoption permitted).AASB 2014-9 amends AASB 127 Separate Financial Statements, and consequentially amends AASB 1 First-time Adoption of Australian Accounting Standards and AASB 128 Investments in Associates and Joint Ventures, to allow entities to use the equity method of accounting for investments in subsidiaries, joint ventures and associates in their separate financial statements. AASB 2014-9 also makes editorial corrections to AASB 127.
Other standards not yet applicableThere are no other standards that are not yet effective and that would be expected to have a material impact on the entity in the current or future reporting periods and on foreseeable future transactions.
2016 Annual Report Pg 37

Notes to Financial Statements for the year ended 30 June 2016
Note 2: Statement of significant accounting policies (continued) (c) Critical accounting estimates and judgements The application of accounting policies requires the use of judgements, estimates and assumptions about carrying values of assets and liabilities that are not readily apparent from other sources. The estimates and associated assumptions are based on historical experience and other factors that are considered to be relevant. Actual results may differ from these estimates. The estimates and underlying assumptions are reviewed on an ongoing basis. Revisions are recognised in the period in which the estimate is revised if it affects only that period, or in the period of the revision and future periods if the revision affects both current and future periods.
Recovery of deferred tax assets Deferred tax assets are recognised for deductible temporary differences only when management considers that it is probable that sufficient future tax profits will be available to utilise those temporary differences. Significant management judgement is required to determine the amount of deferred tax assets that can be recognised, based upon the likely timing and the level of future taxable profits over the next two years together with future tax planning strategies. Mineral acquisition costs The Group capitalises and carries forward mineral acquisition costs that are expected to be recouped through sale or successful development and exploitation of the area of interest or where exploration and evaluation activities in the area of interest have not reached a stage that permits reasonable assessment of the existence of economically recoverable reserves. (d) Exploration and evaluation expenditure Exploration and evaluation costs are expensed in the period they are incurred apart from mineral acquisition costs, which are capitalised and carried forward where right to tenure of the area of interest is current and they are expected to be recouped through sale or successful development and exploitation of the area of interest, or where exploration and evaluation activities in the area of interest have not reached a stage that permits reasonable assessment of the existence of economically recoverable reserves. Where an area of interest is abandoned or the directors decide that it is not commercial, any accumulated mineral acquisition costs in respect of that area are written off in the financial period the decision is made. Each area of interest is also reviewed at the end of each accounting period and capitalised costs written off to the extent it is deemed that they will not be recoverable in the future. Amortisation is not charged on costs carried forward in respect of areas of interest in the development phase until production commences. (e) Plant & Equipment Plant and equipment is stated at historical cost less accumulated depreciation and any accumulated impaired in value. Depreciation is calculated on a straight-line basis over the estimated useful life of the asset as follows: Plant and equipment – over 3 to 25 years Impairment The carrying values of plant and equipment are reviewed for impairment when events or changes in circumstances indicate the carrying value may not be recoverable. For an asset that does not generate largely independent cash inflows, the recoverable amount is determined for the cash-generating unit to which the asset belongs. If any indication exists of impairment and where the carrying values exceed the estimated recoverable amount, the assets or cash-generating units are written down to their recoverable amount.
Notes to Financial Statements for the year ended 30 June 2016
Note 2: Statement of significant accounting policies (continued) (e) Plant & Equipment (continued) The recoverable amount of plant and equipment is the greater of fair value less costs to sell and value in use. In assessing value in use, the estimated future cash flows are discounted to their present value using a pre-tax discount rate that reflects current market assessments of the time value of money and the risks specific to the asset. Derecognition An item of plant and equipment is derecognised upon disposal or when no future economic benefits are expected to arise from the continued use of the asset. Any gain or loss arising on derecognition of the asset (calculated as the difference between the net disposal proceeds and the carrying amount of the item) is included in profit or loss in the period the item is derecognised. (f) Income tax Current tax assets and liabilities for the period is measured at amounts expected to be recovered from or paid to the taxation authorities based on the current year’s taxable income. The tax rates and tax laws used for computations are enacted or substantively enacted by the balance date. Deferred income tax is provided on all temporary differences at balance date between the tax bases of assets and liabilities and their carrying amounts for financial reporting purposes. Deferred income tax liabilities are recognised for all taxable temporary differences except where the deferred income tax liability arises from the initial recognition of goodwill of an asset or liability in a transaction that is not a business combination and, at the time of the transaction, affects neither the accounting profit nor taxable profit or loss. Deferred income tax assets are recognised for all deductible temporary differences, carry-forward of unused tax credits and unused tax losses, to the extent that it is probable that taxable profit will be available against which the deductible temporary differences, and the carry-forward of unused tax assets and unused tax losses can be utilised except where the deferred income tax asset relating to the deductible temporary difference arises from the initial recognition of an asset or liability in a transaction that is not a business combination and, at the time of the transaction, affects neither the accounting profit nor taxable profit or loss. The carrying amount of deferred income tax assets is reviewed at each balance date and reduced to the extent that it is no longer probable that sufficient taxable profit will be available to allow all or part of the deferred income tax asset to be utilised. Unrecognised deferred income tax assets are reassessed at each balance date and are recognised to the extent that it has become probable that future taxable profit will allow the deferred tax asset to be recovered. Deferred income tax assets and liabilities are measured at the tax rates that are expected to apply to the year when the asset is realised or the liability is settled, based on tax rates (and tax laws) that have been enacted or substantively enacted at the balance date. Income taxes relating to items recognised directly in equity are recognised in equity and not in the statement of comprehensive income. Deferred tax assets and deferred tax liabilities are offset only if a legally enforceable right exists to set off current tax assets against current tax liabilities and the deferred tax assets and liabilities relate to the same taxable entity and the same taxation authority.
2016 Annual ReportPg 38

Notes to Financial Statements for the year ended 30 June 2016
Note 2: Statement of significant accounting policies (continued) (c) Critical accounting estimates and judgements The application of accounting policies requires the use of judgements, estimates and assumptions about carrying values of assets and liabilities that are not readily apparent from other sources. The estimates and associated assumptions are based on historical experience and other factors that are considered to be relevant. Actual results may differ from these estimates. The estimates and underlying assumptions are reviewed on an ongoing basis. Revisions are recognised in the period in which the estimate is revised if it affects only that period, or in the period of the revision and future periods if the revision affects both current and future periods.
Recovery of deferred tax assets Deferred tax assets are recognised for deductible temporary differences only when management considers that it is probable that sufficient future tax profits will be available to utilise those temporary differences. Significant management judgement is required to determine the amount of deferred tax assets that can be recognised, based upon the likely timing and the level of future taxable profits over the next two years together with future tax planning strategies. Mineral acquisition costs The Group capitalises and carries forward mineral acquisition costs that are expected to be recouped through sale or successful development and exploitation of the area of interest or where exploration and evaluation activities in the area of interest have not reached a stage that permits reasonable assessment of the existence of economically recoverable reserves. (d) Exploration and evaluation expenditure Exploration and evaluation costs are expensed in the period they are incurred apart from mineral acquisition costs, which are capitalised and carried forward where right to tenure of the area of interest is current and they are expected to be recouped through sale or successful development and exploitation of the area of interest, or where exploration and evaluation activities in the area of interest have not reached a stage that permits reasonable assessment of the existence of economically recoverable reserves. Where an area of interest is abandoned or the directors decide that it is not commercial, any accumulated mineral acquisition costs in respect of that area are written off in the financial period the decision is made. Each area of interest is also reviewed at the end of each accounting period and capitalised costs written off to the extent it is deemed that they will not be recoverable in the future. Amortisation is not charged on costs carried forward in respect of areas of interest in the development phase until production commences. (e) Plant & Equipment Plant and equipment is stated at historical cost less accumulated depreciation and any accumulated impaired in value. Depreciation is calculated on a straight-line basis over the estimated useful life of the asset as follows: Plant and equipment – over 3 to 25 years Impairment The carrying values of plant and equipment are reviewed for impairment when events or changes in circumstances indicate the carrying value may not be recoverable. For an asset that does not generate largely independent cash inflows, the recoverable amount is determined for the cash-generating unit to which the asset belongs. If any indication exists of impairment and where the carrying values exceed the estimated recoverable amount, the assets or cash-generating units are written down to their recoverable amount.
Notes to Financial Statements for the year ended 30 June 2016
Note 2: Statement of significant accounting policies (continued) (e) Plant & Equipment (continued) The recoverable amount of plant and equipment is the greater of fair value less costs to sell and value in use. In assessing value in use, the estimated future cash flows are discounted to their present value using a pre-tax discount rate that reflects current market assessments of the time value of money and the risks specific to the asset. Derecognition An item of plant and equipment is derecognised upon disposal or when no future economic benefits are expected to arise from the continued use of the asset. Any gain or loss arising on derecognition of the asset (calculated as the difference between the net disposal proceeds and the carrying amount of the item) is included in profit or loss in the period the item is derecognised. (f) Income tax Current tax assets and liabilities for the period is measured at amounts expected to be recovered from or paid to the taxation authorities based on the current year’s taxable income. The tax rates and tax laws used for computations are enacted or substantively enacted by the balance date. Deferred income tax is provided on all temporary differences at balance date between the tax bases of assets and liabilities and their carrying amounts for financial reporting purposes. Deferred income tax liabilities are recognised for all taxable temporary differences except where the deferred income tax liability arises from the initial recognition of goodwill of an asset or liability in a transaction that is not a business combination and, at the time of the transaction, affects neither the accounting profit nor taxable profit or loss. Deferred income tax assets are recognised for all deductible temporary differences, carry-forward of unused tax credits and unused tax losses, to the extent that it is probable that taxable profit will be available against which the deductible temporary differences, and the carry-forward of unused tax assets and unused tax losses can be utilised except where the deferred income tax asset relating to the deductible temporary difference arises from the initial recognition of an asset or liability in a transaction that is not a business combination and, at the time of the transaction, affects neither the accounting profit nor taxable profit or loss. The carrying amount of deferred income tax assets is reviewed at each balance date and reduced to the extent that it is no longer probable that sufficient taxable profit will be available to allow all or part of the deferred income tax asset to be utilised. Unrecognised deferred income tax assets are reassessed at each balance date and are recognised to the extent that it has become probable that future taxable profit will allow the deferred tax asset to be recovered. Deferred income tax assets and liabilities are measured at the tax rates that are expected to apply to the year when the asset is realised or the liability is settled, based on tax rates (and tax laws) that have been enacted or substantively enacted at the balance date. Income taxes relating to items recognised directly in equity are recognised in equity and not in the statement of comprehensive income. Deferred tax assets and deferred tax liabilities are offset only if a legally enforceable right exists to set off current tax assets against current tax liabilities and the deferred tax assets and liabilities relate to the same taxable entity and the same taxation authority.
2016 Annual Report Pg 39

Notes to Financial Statements for the year ended 30 June 2016
Note 2: Statement of significant accounting policies (continued) (g) Goods and services tax Revenues, expenses and assets are recognised net of the amount of Goods and services tax (GST) except:
where the GST incurred on a purchase of goods and services is not recoverable from the taxation authority, in which case the GST is recognised as part of the cost of acquisition of the asset or as part of the expense item as applicable; and
receivables and payables are stated with the amount of GST included. The net amount of GST recoverable from, or payable to, the taxation authority is included as part of receivables or payables in the statement of financial position. Cash flows are included in the Statement of Cash Flows on a gross basis and the GST component of cash flows arising from investing and financing activities, which is recoverable from, or payable to, the taxation authority, are classified as operating cash flows. Commitments and contingencies are disclosed net of the amount of GST recoverable from, or payable to, the taxation authority. (h) Provisions and employee benefits Provisions are recognised when the Group has a present obligation (legal or constructive) as a result of a past event, it is probable that an outflow of resources embodying economic benefits will be required to settle the obligation and a reliable estimate can be made of the amount of the obligation. When the Group expects some or all of a provision to be reimbursed, for example under an insurance contract, the reimbursement is recognised as a separate asset but only when the reimbursement is virtually certain. The expense relating to any provision is presented in the statement of comprehensive income net of any reimbursement. Provisions are measured at the present value of management’s best estimate of the expenditure required to settle the present obligation at the balance date. If the effect of the time value of money is material, provisions are discounted using a current pre-tax rate that reflects the time value of money and the risks specific to the liability. The increase in the provision resulting from the passage of time is recognised in finance costs. Employee leave benefits
(i) Wages and salaries, annual leave and sick leave Liabilities for wages and salaries including non-monetary benefits, annual leave and accumulating sick leave due to be settled within 12 months of the reporting date are recognised in provisions in respect of employees’ services up to the reporting date and are measured at the amounts expected to be paid when the liabilities are settled. Liabilities for non-accumulating sick leave are recognised when the leave is taken and measured at the rates paid or payable.
(ii) Long service leave The liability for long service leave is recognised and measured as the present value of expected future payments to be made in respect of services provided by employees up to the reporting date using the projected unit credit method. Consideration is given to the expected future wage and salary levels, experience of employee departures and periods of service. Expected future payments are discounted using market yields at the reporting date on national government bonds with terms to maturity and currency that match, as closely as possible, the estimated future cash outflows. (i) Cash and cash equivalents Cash and cash equivalents in the statement of financial position comprise cash at bank and in hand and short-term deposits with an original maturity of three months or less. For the purposes of the Statement of Cash Flow, cash and cash equivalents consist of cash and cash equivalents as defined above, net of outstanding bank overdrafts.
Notes to Financial Statements for the year ended 30 June 2016 Note 2: Statement of significant accounting policies (continued) (j) Receivables Receivables, which generally have 30-90 day terms, are recognised initially at fair value and subsequently measured at amortised cost using the effective interest rate method, less an allowance for any uncollectible amounts. Collectability or receivables are reviewed on an ongoing basis. Debts that are known to be uncollectible are written off when identified. An allowance for doubtful debts is raised when there is objective evidence that the Group will not be able to collect the debt. (k) Revenue recognition Revenue is recognised and measured at the fair value of the consideration received or receivable to the extent that it is probable that the economic benefits will flow to the Group and the revenue can be reliably measured. R&D tax rebates are recognised when the receipts are deemed probable and the amounts can be measured reliably.
(l) Contributed equity Ordinary shares are classified as equity. Incremental costs directly attributable to the issue of new shares or options are shown in equity as a deduction, net of tax, from the proceeds. (m) Trade and other payables Trade payables and other payables are carried at amortised costs and represent liabilities for goods and services provided to the Group prior to the end of the financial year that are unpaid and arise when the Group becomes obliged to make future payments in respect of the purchase of these goods and services. (n) Earnings/(Loss) per share Basic earnings/(loss) per share is calculated as net profit/(loss) attributable to members of the Group adjusted to exclude any costs of servicing equity (other than dividends) divided by the weighted average number of ordinary shares, adjusted for any bonus element. Options that are considered to be dilutive are taken into consideration when calculating the diluted earnings per share. (o) Investments and other financial assets Financial assets in the scope of AASB 139 Financial Instruments: Recognition and Measurement are classified as either financial assets at fair value through profit or loss, loans and receivables, held-to-maturity investments, or available-for-sale financial assets. When financial assets are recognised initially, they are measured at fair value, plus, in the case of investments not at fair value through profit or loss, directly attributable transaction costs. The Company determines the classification of its financial assets after initial recognition and, when allowed and appropriate, re-evaluates this designation at each financial year-end.
2016 Annual ReportPg 40

Notes to Financial Statements for the year ended 30 June 2016
Note 2: Statement of significant accounting policies (continued) (g) Goods and services tax Revenues, expenses and assets are recognised net of the amount of Goods and services tax (GST) except:
where the GST incurred on a purchase of goods and services is not recoverable from the taxation authority, in which case the GST is recognised as part of the cost of acquisition of the asset or as part of the expense item as applicable; and
receivables and payables are stated with the amount of GST included. The net amount of GST recoverable from, or payable to, the taxation authority is included as part of receivables or payables in the statement of financial position. Cash flows are included in the Statement of Cash Flows on a gross basis and the GST component of cash flows arising from investing and financing activities, which is recoverable from, or payable to, the taxation authority, are classified as operating cash flows. Commitments and contingencies are disclosed net of the amount of GST recoverable from, or payable to, the taxation authority. (h) Provisions and employee benefits Provisions are recognised when the Group has a present obligation (legal or constructive) as a result of a past event, it is probable that an outflow of resources embodying economic benefits will be required to settle the obligation and a reliable estimate can be made of the amount of the obligation. When the Group expects some or all of a provision to be reimbursed, for example under an insurance contract, the reimbursement is recognised as a separate asset but only when the reimbursement is virtually certain. The expense relating to any provision is presented in the statement of comprehensive income net of any reimbursement. Provisions are measured at the present value of management’s best estimate of the expenditure required to settle the present obligation at the balance date. If the effect of the time value of money is material, provisions are discounted using a current pre-tax rate that reflects the time value of money and the risks specific to the liability. The increase in the provision resulting from the passage of time is recognised in finance costs. Employee leave benefits
(i) Wages and salaries, annual leave and sick leave Liabilities for wages and salaries including non-monetary benefits, annual leave and accumulating sick leave due to be settled within 12 months of the reporting date are recognised in provisions in respect of employees’ services up to the reporting date and are measured at the amounts expected to be paid when the liabilities are settled. Liabilities for non-accumulating sick leave are recognised when the leave is taken and measured at the rates paid or payable.
(ii) Long service leave The liability for long service leave is recognised and measured as the present value of expected future payments to be made in respect of services provided by employees up to the reporting date using the projected unit credit method. Consideration is given to the expected future wage and salary levels, experience of employee departures and periods of service. Expected future payments are discounted using market yields at the reporting date on national government bonds with terms to maturity and currency that match, as closely as possible, the estimated future cash outflows. (i) Cash and cash equivalents Cash and cash equivalents in the statement of financial position comprise cash at bank and in hand and short-term deposits with an original maturity of three months or less. For the purposes of the Statement of Cash Flow, cash and cash equivalents consist of cash and cash equivalents as defined above, net of outstanding bank overdrafts.
Notes to Financial Statements for the year ended 30 June 2016 Note 2: Statement of significant accounting policies (continued) (j) Receivables Receivables, which generally have 30-90 day terms, are recognised initially at fair value and subsequently measured at amortised cost using the effective interest rate method, less an allowance for any uncollectible amounts. Collectability or receivables are reviewed on an ongoing basis. Debts that are known to be uncollectible are written off when identified. An allowance for doubtful debts is raised when there is objective evidence that the Group will not be able to collect the debt. (k) Revenue recognition Revenue is recognised and measured at the fair value of the consideration received or receivable to the extent that it is probable that the economic benefits will flow to the Group and the revenue can be reliably measured. R&D tax rebates are recognised when the receipts are deemed probable and the amounts can be measured reliably.
(l) Contributed equity Ordinary shares are classified as equity. Incremental costs directly attributable to the issue of new shares or options are shown in equity as a deduction, net of tax, from the proceeds. (m) Trade and other payables Trade payables and other payables are carried at amortised costs and represent liabilities for goods and services provided to the Group prior to the end of the financial year that are unpaid and arise when the Group becomes obliged to make future payments in respect of the purchase of these goods and services. (n) Earnings/(Loss) per share Basic earnings/(loss) per share is calculated as net profit/(loss) attributable to members of the Group adjusted to exclude any costs of servicing equity (other than dividends) divided by the weighted average number of ordinary shares, adjusted for any bonus element. Options that are considered to be dilutive are taken into consideration when calculating the diluted earnings per share. (o) Investments and other financial assets Financial assets in the scope of AASB 139 Financial Instruments: Recognition and Measurement are classified as either financial assets at fair value through profit or loss, loans and receivables, held-to-maturity investments, or available-for-sale financial assets. When financial assets are recognised initially, they are measured at fair value, plus, in the case of investments not at fair value through profit or loss, directly attributable transaction costs. The Company determines the classification of its financial assets after initial recognition and, when allowed and appropriate, re-evaluates this designation at each financial year-end.
2016 Annual Report Pg 41

Notes to Financial Statements for the year ended 30 June 2016 Note 2: Statement of significant accounting policies (continued) (o) Investments and other financial assets (continued)
(i) Held-to-maturity investments Non-derivative financial assets with fixed or determinable payments and fixed maturity are classified as held-to-maturity when the Company has the positive intention and ability to hold to maturity. Investments intended to be held for an undefined period are not included in this classification. Investments that are intended to be held-to maturity, such as bonds, are subsequently measured at amortised cost. This cost is computed as the amount initially recognised minus principal repayments, plus or minus the cumulative amortisation using the effective interest method of any difference between the initially recognised amount and the maturity amount. This calculation includes all fees and points paid or received between parties to the contract that are an integral part of the effective interest rate, transaction costs and all other premiums and discounts. For investments carried at amortised cost, gains and losses are recognised in profit and loss when the investments are derecognised or impaired, as well as through the amortisation process. (ii) Loans and receivables Loans and receivables are non-derivative financial assets with fixed or determinable payments that are not quoted in an active market. Such assets are carried at amortised cost using the effective interest method. Gains and losses are recognised in profit and loss when the loans and receivables are derecognised or impaired, as well as through the amortisation process. (iii) Fair value hierarchy AASB 13 requires the disclosure of fair value information by level of the fair value hierarchy, which categorises fair value measurements into one of three possible levels based on the lowest level that an input that is significant to the measurement can be categorised into as follows: Level 1 Measurements based on quoted prices (unadjusted) in active markets for identical assets or liabilities that the entity can access at the measurement date. Level 2 Measurements based on inputs other than quoted prices included in Level 1 that are observable for the asset or liability, either directly or indirectly. Level 3 Measurements based on unobservable inputs for the asset or liability. The fair values of assets and liabilities that are not traded in an active market are determined using one or more valuation techniques. These valuation techniques maximise, to the extent possible, the use of observable market data. If all significant inputs required to measure fair value are observable, the asset or liability is included in Level 2. If one or more significant inputs are not based on observable market data, the asset or liability is included in Level 3. The Group would change the categorisation within the fair value hierarchy only in the following circumstances: if a market that was previously considered active (Level 1) became inactive (Level 2 or Level 3) or vice versa; or if significant inputs that were previously unobservable (Level 3) became observable (Level 2) or vice versa.
When a change in the categorisation occurs, the Group recognises transfers between levels of the fair value hierarchy (i.e. transfers into and out of each level of the fair value hierarchy) on the date the event or change in circumstances occurred.
Notes to Financial Statements for the year ended 30 June 2016 Note 2: Statement of significant accounting policies (continued) (p) Impairment of financial assets The Group assesses at each balance date whether a financial asset or group of financial assets is impaired. Available-for-sale investments If there is objective evidence that an available-for-sale investment is impaired, an amount comprising the difference between its cost and its current fair value, less any impairment loss previously recognised in profit and loss, is transferred from equity to the statement of profit or loss and other comprehensive income. Reversals of impairment losses for equity instruments classified as available-for-sale are not recognised in profit. Reversals of impairment losses for debt instruments are reversed through profit and loss if the increase in an instrument’s fair value can be objectively related to an event occurring after the impairment loss was recognised in profit or loss. (q) Leases Operating Lease payments are recognised as an operating expense in the statement of profit or loss and other comprehensive income on a straight-line basis over the lease term. Operating lease incentives are recognised as a liability when received and subsequently reduced by allocating lease payments between rental expense and the reduction of the liability. (r) Share Based Payments Under AASB 2 Share Based Payments, the Group must recognise the fair value of options granted to directors, employees and consultants as remuneration as an expense on a pro-rata basis over the vesting period in the statement of profit or loss and other comprehensive income with a corresponding adjustment to equity. The Group provides benefits to employees (including directors) of the Group in the form of share based payment transactions, whereby employees render services in exchange for shares or rights over shares (“equity-settled transactions”). The cost of these equity-settled transactions with employees (including directors) is measured by reference to fair value at the date they are granted. The fair value is determined using the Black Scholes option pricing model. (s) Going Concern The Group incurred an operating loss of $1,555,948 for the year ended 30 June 2016 (2015: $3,396,740) and a net cash outflow from operating activities amounting to $892,039 (2015: $3,313,002). The financial report has been prepared on the going concern basis, which contemplates continuity of normal business activities and the realisation of assets and settlements of liabilities in the ordinary course of business. The directors believe this is appropriate for the following reasons:
at balance date the Group had cash and cash equivalents of $1,558,657 (June 2015: $775,535) and a working capital surplus of $300,285 (June 2015: $538,077);
the Group has the ability to further reduce its cash outgoings given the status of work programs and the Group’s operating structure;
An amount of $1,000,000 is due for repayment to associated entity, GWR Group Ltd (GWR) on 11 December 2016. GWR have confirmed that they have no present intention of calling the loan and, as contemplated in the Funding Deed and otherwise described in note 14.
the Group during the year demonstrated the capacity to raise fresh equity to fund exploration and development activities; and
the Group remains confident it can raise new equity consistent with the funding requirements of planned exploration and development activities.
The Directors have prepared a cash flow forecast which indicates that the Group after a planned equity rising will have sufficient cash flow to meet all commitments and working capital requirements for the 12 months period from the date of signing this financial report.
2016 Annual ReportPg 42

Notes to Financial Statements for the year ended 30 June 2016 Note 2: Statement of significant accounting policies (continued) (o) Investments and other financial assets (continued)
(i) Held-to-maturity investments Non-derivative financial assets with fixed or determinable payments and fixed maturity are classified as held-to-maturity when the Company has the positive intention and ability to hold to maturity. Investments intended to be held for an undefined period are not included in this classification. Investments that are intended to be held-to maturity, such as bonds, are subsequently measured at amortised cost. This cost is computed as the amount initially recognised minus principal repayments, plus or minus the cumulative amortisation using the effective interest method of any difference between the initially recognised amount and the maturity amount. This calculation includes all fees and points paid or received between parties to the contract that are an integral part of the effective interest rate, transaction costs and all other premiums and discounts. For investments carried at amortised cost, gains and losses are recognised in profit and loss when the investments are derecognised or impaired, as well as through the amortisation process. (ii) Loans and receivables Loans and receivables are non-derivative financial assets with fixed or determinable payments that are not quoted in an active market. Such assets are carried at amortised cost using the effective interest method. Gains and losses are recognised in profit and loss when the loans and receivables are derecognised or impaired, as well as through the amortisation process. (iii) Fair value hierarchy AASB 13 requires the disclosure of fair value information by level of the fair value hierarchy, which categorises fair value measurements into one of three possible levels based on the lowest level that an input that is significant to the measurement can be categorised into as follows: Level 1 Measurements based on quoted prices (unadjusted) in active markets for identical assets or liabilities that the entity can access at the measurement date. Level 2 Measurements based on inputs other than quoted prices included in Level 1 that are observable for the asset or liability, either directly or indirectly. Level 3 Measurements based on unobservable inputs for the asset or liability. The fair values of assets and liabilities that are not traded in an active market are determined using one or more valuation techniques. These valuation techniques maximise, to the extent possible, the use of observable market data. If all significant inputs required to measure fair value are observable, the asset or liability is included in Level 2. If one or more significant inputs are not based on observable market data, the asset or liability is included in Level 3. The Group would change the categorisation within the fair value hierarchy only in the following circumstances: if a market that was previously considered active (Level 1) became inactive (Level 2 or Level 3) or vice versa; or if significant inputs that were previously unobservable (Level 3) became observable (Level 2) or vice versa.
When a change in the categorisation occurs, the Group recognises transfers between levels of the fair value hierarchy (i.e. transfers into and out of each level of the fair value hierarchy) on the date the event or change in circumstances occurred.
Notes to Financial Statements for the year ended 30 June 2016 Note 2: Statement of significant accounting policies (continued) (p) Impairment of financial assets The Group assesses at each balance date whether a financial asset or group of financial assets is impaired. Available-for-sale investments If there is objective evidence that an available-for-sale investment is impaired, an amount comprising the difference between its cost and its current fair value, less any impairment loss previously recognised in profit and loss, is transferred from equity to the statement of profit or loss and other comprehensive income. Reversals of impairment losses for equity instruments classified as available-for-sale are not recognised in profit. Reversals of impairment losses for debt instruments are reversed through profit and loss if the increase in an instrument’s fair value can be objectively related to an event occurring after the impairment loss was recognised in profit or loss. (q) Leases Operating Lease payments are recognised as an operating expense in the statement of profit or loss and other comprehensive income on a straight-line basis over the lease term. Operating lease incentives are recognised as a liability when received and subsequently reduced by allocating lease payments between rental expense and the reduction of the liability. (r) Share Based Payments Under AASB 2 Share Based Payments, the Group must recognise the fair value of options granted to directors, employees and consultants as remuneration as an expense on a pro-rata basis over the vesting period in the statement of profit or loss and other comprehensive income with a corresponding adjustment to equity. The Group provides benefits to employees (including directors) of the Group in the form of share based payment transactions, whereby employees render services in exchange for shares or rights over shares (“equity-settled transactions”). The cost of these equity-settled transactions with employees (including directors) is measured by reference to fair value at the date they are granted. The fair value is determined using the Black Scholes option pricing model. (s) Going Concern The Group incurred an operating loss of $1,555,948 for the year ended 30 June 2016 (2015: $3,396,740) and a net cash outflow from operating activities amounting to $892,039 (2015: $3,313,002). The financial report has been prepared on the going concern basis, which contemplates continuity of normal business activities and the realisation of assets and settlements of liabilities in the ordinary course of business. The directors believe this is appropriate for the following reasons:
at balance date the Group had cash and cash equivalents of $1,558,657 (June 2015: $775,535) and a working capital surplus of $300,285 (June 2015: $538,077);
the Group has the ability to further reduce its cash outgoings given the status of work programs and the Group’s operating structure;
An amount of $1,000,000 is due for repayment to associated entity, GWR Group Ltd (GWR) on 11 December 2016. GWR have confirmed that they have no present intention of calling the loan and, as contemplated in the Funding Deed and otherwise described in note 14.
the Group during the year demonstrated the capacity to raise fresh equity to fund exploration and development activities; and
the Group remains confident it can raise new equity consistent with the funding requirements of planned exploration and development activities.
The Directors have prepared a cash flow forecast which indicates that the Group after a planned equity rising will have sufficient cash flow to meet all commitments and working capital requirements for the 12 months period from the date of signing this financial report.
2016 Annual Report Pg 43

Notes to Financial Statements for the year ended 30 June 2016
Note 3: Segment information The Group has based its operating segment on the internal reports that are reviewed and used by the chief operators decision makers (The Board) in assessing performance and in determining the allocation of resources. The Group currently does not have production and is only involved in exploration. As a consequence, activities in the operating segment are identified by The Board based on the manner in which resources are allocated, the nature of the resources provided and the identity of the manager and country of expenditure. Information is reviewed on a whole of entity basis. Based on these criteria the Group has only one operating segment, being exploration, and evaluation and the segment operations and results are reported internally based on the accounting policies as described in note 2 for the computation of the controlled entity’s results presented in this set of financial statements.
Note 4: Income Tax
2016 2015 $ $
(a) Prima facie income tax benefit at 30% on loss from ordinary activities is reconciled to the income tax
provided in the financial statements Loss from continuing operations before income tax (1,555,948) (3,396,740) Prima facie tax benefit at the Australian tax rate of 30% (466,784) (1,019,022) Tax effect of: Expenses not allowed 38 226 Share and option based payment - 10,369 Adjustment to prior years tax losses 330,540 189,265 Capital raising (163,578) (157,548) Research and Development Tax Credit (148,732) (23,143) Tax losses & temporary differences not brought to account 448,516 999,853 Income tax expense/(benefit) - -
(b) Deferred tax assets Deferred tax assets that have not be recognised: Accrued expenses 7,560 6,491 Superannuation payable 651 651 s40-880 costs 128,171 261,598 Tax losses 4,092,695 3,633,807 4,229,077 3,902,547 Deferred tax asset not recognised (4,229,077) (3,902,547)
Notes to Financial Statements for the year ended 30 June 2016 Note 4: Income Tax (continued)
2016 2015 $ $
(c) Deferred tax liabilities Accrued interest 1,530 1,115 Mining tenements and rights 12,638 263 14,168 1,378 Deferred tax liability not brought to account (14,168) (1,378)
Potential deferred tax assets of $4,229,076 as at 30 June 2016 (2015: $3,902,807), arising from tax losses and temporary differences have not been recognised as an asset because recovery of these tax losses and temporary differences is not yet probable.
Note 5: Key Management Personnel’s remuneration
2016 2015 $ $
Short-term employee benefits 198,687 318,352 Post-employment benefits 8,675 11,854 Total KMP compensation 207,362 330,206 Refer to the remuneration report contained in the directors’ report for details of the remuneration paid or payable and ordinary share shareholdings to each member of the Group’s key management personnel (KMP) for the year ended 30 June 2016.
Note 6: Auditor’s remuneration
2016 2015 $ $
Remuneration of the auditor of the Group for: - auditing or reviewing the financial report 30,069 27,025 - over provision in prior year (69) (5,000) 30,000 22,025
2016 Annual ReportPg 44

Notes to Financial Statements for the year ended 30 June 2016
Note 3: Segment information The Group has based its operating segment on the internal reports that are reviewed and used by the chief operators decision makers (The Board) in assessing performance and in determining the allocation of resources. The Group currently does not have production and is only involved in exploration. As a consequence, activities in the operating segment are identified by The Board based on the manner in which resources are allocated, the nature of the resources provided and the identity of the manager and country of expenditure. Information is reviewed on a whole of entity basis. Based on these criteria the Group has only one operating segment, being exploration, and evaluation and the segment operations and results are reported internally based on the accounting policies as described in note 2 for the computation of the controlled entity’s results presented in this set of financial statements.
Note 4: Income Tax
2016 2015 $ $
(a) Prima facie income tax benefit at 30% on loss from ordinary activities is reconciled to the income tax
provided in the financial statements Loss from continuing operations before income tax (1,555,948) (3,396,740) Prima facie tax benefit at the Australian tax rate of 30% (466,784) (1,019,022) Tax effect of: Expenses not allowed 38 226 Share and option based payment - 10,369 Adjustment to prior years tax losses 330,540 189,265 Capital raising (163,578) (157,548) Research and Development Tax Credit (148,732) (23,143) Tax losses & temporary differences not brought to account 448,516 999,853 Income tax expense/(benefit) - -
(b) Deferred tax assets Deferred tax assets that have not be recognised: Accrued expenses 7,560 6,491 Superannuation payable 651 651 s40-880 costs 128,171 261,598 Tax losses 4,092,695 3,633,807 4,229,077 3,902,547 Deferred tax asset not recognised (4,229,077) (3,902,547)
Notes to Financial Statements for the year ended 30 June 2016 Note 4: Income Tax (continued)
2016 2015 $ $
(c) Deferred tax liabilities Accrued interest 1,530 1,115 Mining tenements and rights 12,638 263 14,168 1,378 Deferred tax liability not brought to account (14,168) (1,378)
Potential deferred tax assets of $4,229,076 as at 30 June 2016 (2015: $3,902,807), arising from tax losses and temporary differences have not been recognised as an asset because recovery of these tax losses and temporary differences is not yet probable.
Note 5: Key Management Personnel’s remuneration
2016 2015 $ $
Short-term employee benefits 198,687 318,352 Post-employment benefits 8,675 11,854 Total KMP compensation 207,362 330,206 Refer to the remuneration report contained in the directors’ report for details of the remuneration paid or payable and ordinary share shareholdings to each member of the Group’s key management personnel (KMP) for the year ended 30 June 2016.
Note 6: Auditor’s remuneration
2016 2015 $ $
Remuneration of the auditor of the Group for: - auditing or reviewing the financial report 30,069 27,025 - over provision in prior year (69) (5,000) 30,000 22,025
2016 Annual Report Pg 45

Notes to Financial Statements for the year ended 30 June 2016 Note 7: Loss per share
2016 2015 $ $
Basic loss per share (cents) (0.66) (1.60) Diluted loss per share (cents) (0.66) (1.60) Loss used in calculating basic and diluted loss per share (1,555,948) (3,396,740) Number Number
Weighted average number of ordinary shares used in the calculation of basic and diluted loss per share 236,666,407 212,645,452 During the 2016 financial year there were no options that were issued over ordinary share capital.
Note 8: Cash and cash equivalents
2016 2015 $ $
Cash at bank 308,657 56,146 Term deposits 1,250,000 719,389
1,558,657 775,535
Note 9: Trade and other receivables
2016 2015 $ $
Current GST receivable 38,393 22,712 Other receivables 5,101 10,123 43,494 32,835
Non-trade receivables are non-interest bearing and are generally on 30-90 days terms. The carrying amounts of these receivables represent fair value and are not considered to be impaired.
Notes to Financial Statements for the year ended 30 June 2016 Note 10: Other assets
2016 2015 $ $
Prepayments - 8,178
Note 11: Plant and equipment
Office
Equipment Plant and
Equipment Computer Software Total
$ $ $ $ 2016 Cost 17,289 97,515 24,671 139,475 Accumulated depreciation (10,461) (19,730) (11,130) (41,321) 6,828 77,785 13,541 98,154
Opening net carrying value 13,206 111,469 19,726 144,401 Additions - 4,850 - 4,850 Disposals (983) (30,981) - (31,964) Depreciation charge for the year (5,395) (7,553) (6,185) (19,133)
Closing net carrying value 6,828 77,785 13,541 98,154
Office
Equipment Plant and
Equipment Computer Software Total
$ $ $ $ 2015 Cost 26,408 133,185 24,671 184,264 Accumulated depreciation (13,202) (21,716) (4,945) (39,863) 13,206 111,469 19,726 144,401
Opening net carrying value 6,287 97,258 897 104,442 Additions 13,886 23,430 23,172 60,488 Depreciation charge for the year (6,967) (9,219) (4,343) (20,529) Closing net carrying value 13,206 111,469 19,726 144,401
2016 Annual ReportPg 46

Notes to Financial Statements for the year ended 30 June 2016 Note 7: Loss per share
2016 2015 $ $
Basic loss per share (cents) (0.66) (1.60) Diluted loss per share (cents) (0.66) (1.60) Loss used in calculating basic and diluted loss per share (1,555,948) (3,396,740) Number Number
Weighted average number of ordinary shares used in the calculation of basic and diluted loss per share 236,666,407 212,645,452 During the 2016 financial year there were no options that were issued over ordinary share capital.
Note 8: Cash and cash equivalents
2016 2015 $ $
Cash at bank 308,657 56,146 Term deposits 1,250,000 719,389
1,558,657 775,535
Note 9: Trade and other receivables
2016 2015 $ $
Current GST receivable 38,393 22,712 Other receivables 5,101 10,123 43,494 32,835
Non-trade receivables are non-interest bearing and are generally on 30-90 days terms. The carrying amounts of these receivables represent fair value and are not considered to be impaired.
Notes to Financial Statements for the year ended 30 June 2016 Note 10: Other assets
2016 2015 $ $
Prepayments - 8,178
Note 11: Plant and equipment
Office
Equipment Plant and
Equipment Computer Software Total
$ $ $ $ 2016 Cost 17,289 97,515 24,671 139,475 Accumulated depreciation (10,461) (19,730) (11,130) (41,321) 6,828 77,785 13,541 98,154
Opening net carrying value 13,206 111,469 19,726 144,401 Additions - 4,850 - 4,850 Disposals (983) (30,981) - (31,964) Depreciation charge for the year (5,395) (7,553) (6,185) (19,133)
Closing net carrying value 6,828 77,785 13,541 98,154
Office
Equipment Plant and
Equipment Computer Software Total
$ $ $ $ 2015 Cost 26,408 133,185 24,671 184,264 Accumulated depreciation (13,202) (21,716) (4,945) (39,863) 13,206 111,469 19,726 144,401
Opening net carrying value 6,287 97,258 897 104,442 Additions 13,886 23,430 23,172 60,488 Depreciation charge for the year (6,967) (9,219) (4,343) (20,529) Closing net carrying value 13,206 111,469 19,726 144,401
2016 Annual Report Pg 47

Notes to Financial Statements for the year ended 30 June 2016 Note 12: Exploration and evaluation
2016 2015 $ $
At 1 July 2015 1,610,079 1,610,079 Capitalised exploration and evaluation costs expensed (100,000) - Impairment (510,079) - Acquisition of Mt Mulgine and Big Hill tungsten projects 1,352,171 - As at 30 June 2016 2,352,171 1,610,079
Impairment The impairment charge of $510,079 was recognised following activities directed at rationalising the Group’s early stage exploration interests due to the prolonged down turn in commodity prices. This impairment charge included tenement and project interest acquisition costs for the Ashburton and Lake Seabrook-Koolyanobbing project that were acquired prior to the Company’s initial public offer.
Acquisition of Mt Mulgine and Big Hill Projects During the period the Group acquired the Australian tungsten exploration assets of ATC Alloys Limited (formerly named Hazelwood Resources Limited) comprising of the Mt Mulgine and Big Hill tungsten projects for $1,352,171. This acquisition cost includes vendor consideration of $1m in cash and 5,000,000 fully paid ordinary shares in the Company, government stamp duty and other transaction costs.
Mineral acquisition costs The Group capitalises the acquisition costs in accordance with its accounting policy for exploration and evaluation expenditure. The ultimate recoupment of acquisition costs carried forward in the exploration and evaluation phases are dependent on the successful development and commercial exploitation or sale of the respective areas.
Note 13: Trade and other payables
2016 2015 $ $
Current Trade payables 273,280 244,285 Accrued interest due to associated entity (note 20) 6,575 - Accrued expenses 22,012 34,186 301,867 278,471
Due to short term nature of these unsecured liabilities, their carrying value is assumed to approximate their fair value.
Notes to Financial Statements for the year ended 30 June 2016 Note 14: Interest bearing loan and borrowings
2016 2015 $ $ Borrowings from associated entity 1,000,000 -
Loan from GWR Group Limited On 11 December 2015 the Company and GWR Group Limited (“GWR”), an associated entity, entered into a Funding Deed (“Deed”). The Deed provided the terms by which GWR advanced the Principal amount of $1,000,000 by way of an unsecured loan (“Loan”). The Loan is repayable: out of proceeds of any future entitlements issue by the Company to the extent of GWR’s subscription to the
entitlements issue; by GWR subscribing to Convertible Notes in the Company subject to shareholder approval; or in cash for any amount remaining outstanding on the Maturity Date (11 December 2016).
In the event GWR subscribes for Convertible Notes to be issued the Convertible Notes will be on the following terms: a face value of $1,000,000 (less any amount of the Loan repaid prior to the issue of the Convertible Notes); Interest to apply at the rate of 12% pa payable quarterly in arrears (as is the case with the Loan); Repayable on the Maturity Date (11 December 2016); and Conversion into fully paid ordinary shares in TGN (“Shares”) at the election of GWR at any time prior to the
Maturity Date at a share price of the lesser of: o 4 cents per Share; o the 30 day VWAP for Shares immediately prior to receipt of a Conversion Notice; or o the most recent issue price of Shares to raise at least $1,000,000 prior to receipt of a Conversion Notice.
Under the Deed, the Loan shall become payable on demand if the Company does not obtain the requisite shareholder approval (for ASX Listing Rule and Corporations Act purposes) within 60 days of a request from GWR for the Company to seek such shareholder approval (see note 20).
Note 15: Issued capital
2016 2015 $ $
Ordinary shares fully paid 15,613,073 13,599,073
Capital Management When managing capital, the Board’s objective is to ensure the entity continues as a going concern as well as to maintain optimal returns to shareholders and benefits for other stakeholders. The Board also aims to maintain a capital structure that ensures the lowest cost of capital available to the entity. As the equity market is constantly changing the Board may issue new shares to provide for future exploration and development activity. The company is not subject to any externally imposed capital requirements.
2016 Annual ReportPg 48

Notes to Financial Statements for the year ended 30 June 2016 Note 12: Exploration and evaluation
2016 2015 $ $
At 1 July 2015 1,610,079 1,610,079 Capitalised exploration and evaluation costs expensed (100,000) - Impairment (510,079) - Acquisition of Mt Mulgine and Big Hill tungsten projects 1,352,171 - As at 30 June 2016 2,352,171 1,610,079
Impairment The impairment charge of $510,079 was recognised following activities directed at rationalising the Group’s early stage exploration interests due to the prolonged down turn in commodity prices. This impairment charge included tenement and project interest acquisition costs for the Ashburton and Lake Seabrook-Koolyanobbing project that were acquired prior to the Company’s initial public offer.
Acquisition of Mt Mulgine and Big Hill Projects During the period the Group acquired the Australian tungsten exploration assets of ATC Alloys Limited (formerly named Hazelwood Resources Limited) comprising of the Mt Mulgine and Big Hill tungsten projects for $1,352,171. This acquisition cost includes vendor consideration of $1m in cash and 5,000,000 fully paid ordinary shares in the Company, government stamp duty and other transaction costs.
Mineral acquisition costs The Group capitalises the acquisition costs in accordance with its accounting policy for exploration and evaluation expenditure. The ultimate recoupment of acquisition costs carried forward in the exploration and evaluation phases are dependent on the successful development and commercial exploitation or sale of the respective areas.
Note 13: Trade and other payables
2016 2015 $ $
Current Trade payables 273,280 244,285 Accrued interest due to associated entity (note 20) 6,575 - Accrued expenses 22,012 34,186 301,867 278,471
Due to short term nature of these unsecured liabilities, their carrying value is assumed to approximate their fair value.
Notes to Financial Statements for the year ended 30 June 2016 Note 14: Interest bearing loan and borrowings
2016 2015 $ $ Borrowings from associated entity 1,000,000 -
Loan from GWR Group Limited On 11 December 2015 the Company and GWR Group Limited (“GWR”), an associated entity, entered into a Funding Deed (“Deed”). The Deed provided the terms by which GWR advanced the Principal amount of $1,000,000 by way of an unsecured loan (“Loan”). The Loan is repayable: out of proceeds of any future entitlements issue by the Company to the extent of GWR’s subscription to the
entitlements issue; by GWR subscribing to Convertible Notes in the Company subject to shareholder approval; or in cash for any amount remaining outstanding on the Maturity Date (11 December 2016).
In the event GWR subscribes for Convertible Notes to be issued the Convertible Notes will be on the following terms: a face value of $1,000,000 (less any amount of the Loan repaid prior to the issue of the Convertible Notes); Interest to apply at the rate of 12% pa payable quarterly in arrears (as is the case with the Loan); Repayable on the Maturity Date (11 December 2016); and Conversion into fully paid ordinary shares in TGN (“Shares”) at the election of GWR at any time prior to the
Maturity Date at a share price of the lesser of: o 4 cents per Share; o the 30 day VWAP for Shares immediately prior to receipt of a Conversion Notice; or o the most recent issue price of Shares to raise at least $1,000,000 prior to receipt of a Conversion Notice.
Under the Deed, the Loan shall become payable on demand if the Company does not obtain the requisite shareholder approval (for ASX Listing Rule and Corporations Act purposes) within 60 days of a request from GWR for the Company to seek such shareholder approval (see note 20).
Note 15: Issued capital
2016 2015 $ $
Ordinary shares fully paid 15,613,073 13,599,073
Capital Management When managing capital, the Board’s objective is to ensure the entity continues as a going concern as well as to maintain optimal returns to shareholders and benefits for other stakeholders. The Board also aims to maintain a capital structure that ensures the lowest cost of capital available to the entity. As the equity market is constantly changing the Board may issue new shares to provide for future exploration and development activity. The company is not subject to any externally imposed capital requirements.
2016 Annual Report Pg 49

Notes to Financial Statements for the year ended 30 June 2016 Note 15: Issued capital (continued) Movements in ordinary shares on issue of the Company are:
2016 2015 2016 2015 $ $ Number Number At 1 July 2015 13,599,073 13,599,353 212,652,708 211,990,601
Ordinary Shares
Issue of shares to Hazelwood Resources Limited at a fair value of $0.038 per share for the acquisition of Mt Mulgine and Big Hill Projects. 190,000 - 5,000,000 -
The issue of shares to sophisticated investors at a fair value of $0.04 per share. 1,920,000 - 48,000,000 -
Buy back shares from Richmond Resources Pty Ltd at a fair value of Nil. - - (2,000,000) -
The issue of shares at a fair value of $0.0522 per share pursuant to the Director & Senior Management Fee & Remuneration Sacrifice Share Plan. - 34,562 - 662,107
Cost incurred in relation to issue of shares of raising equity (96,000) (34,842) - -
At 30 June 2016 15,613,073 13,599,073 263,652,708 212,652,708 Note 16: Reserves
Number $
Movement in share options
At 1 July 2014 16,800,000 235,080 At 30 June 2015 16,800,000 235,080 At 1 July 2015 16,800,000 235,080 Expired options (16,800,000) - At 30 June 2016 - 235,080
Details of unlisted share options expired during the year:
Grant date Expiry date Exercise price Number
11 Jul 2012 30 Jun 2016 $0.400 15,000,000 27 Dec 2013 4 Dec 2015 $0.250 1,800,000
16,800,000
Notes to Financial Statements for the year ended 30 June 2016 Note 17: Accumulated losses
2016 2015 $ $ Opening balance (11,541,596) (8,144,856) Net loss for the year (1,555,948) (3,396,740)
Accumulated losses at the end of the financial year (13,097,544) (11,541,596) Note 18: Commitments
Exploration
The Group based on the minimum annual commitments pursuant to the terms and conditions of exploration licences and mineral rights will have minimum annual commitment obligations of $704,420 (2015: $325,500) in the forthcoming year. These obligations are capable of being varied from time to time in order to maintain current rights of tenure to mining tenements.
Executive and administration services The Group has a minimum obligation of $102,000 (2015: $57,000) in the forthcoming year.
Note 19: Contingent liabilities
The Group is not aware of any significant contingencies that existed at balance date. Note 20: Related party transactions
(a) Associates
GWR Group Limited (GWR) GWR is a significant shareholder in the Group’s parent Tungsten Mining NL and holds significant influence over decision making of the Group. During the year the Group received certain services from GWR as detailed in the table below.
2016 2015 $ $
GWR Services Executive 270,000 218,182 Administration and recharges 62,855 40,000 Project related activities 84,866 289,402
417,721 547,584
At balance date $189,287 (2015: $213,608) remains outstanding in Payables to GWR. GWR Loan The Company and GWR entered into a Funding Deed (“Deed”) during the year. The Deed provided the terms by which GWR advanced the Company a 12% pa interest bearing unsecured $1,000,000 loan. During the year the Company paid and or accrued $66,739 of interest to GWR under the terms of this Deed. At balance date the $1,000,000 loan and accrued interest of $6,575 remains outstanding to GWR (see note 13 and 14).
2016 Annual ReportPg 50

Notes to Financial Statements for the year ended 30 June 2016 Note 15: Issued capital (continued) Movements in ordinary shares on issue of the Company are:
2016 2015 2016 2015 $ $ Number Number At 1 July 2015 13,599,073 13,599,353 212,652,708 211,990,601
Ordinary Shares
Issue of shares to Hazelwood Resources Limited at a fair value of $0.038 per share for the acquisition of Mt Mulgine and Big Hill Projects. 190,000 - 5,000,000 -
The issue of shares to sophisticated investors at a fair value of $0.04 per share. 1,920,000 - 48,000,000 -
Buy back shares from Richmond Resources Pty Ltd at a fair value of Nil. - - (2,000,000) -
The issue of shares at a fair value of $0.0522 per share pursuant to the Director & Senior Management Fee & Remuneration Sacrifice Share Plan. - 34,562 - 662,107
Cost incurred in relation to issue of shares of raising equity (96,000) (34,842) - -
At 30 June 2016 15,613,073 13,599,073 263,652,708 212,652,708 Note 16: Reserves
Number $
Movement in share options
At 1 July 2014 16,800,000 235,080 At 30 June 2015 16,800,000 235,080 At 1 July 2015 16,800,000 235,080 Expired options (16,800,000) - At 30 June 2016 - 235,080
Details of unlisted share options expired during the year:
Grant date Expiry date Exercise price Number
11 Jul 2012 30 Jun 2016 $0.400 15,000,000 27 Dec 2013 4 Dec 2015 $0.250 1,800,000
16,800,000
Notes to Financial Statements for the year ended 30 June 2016 Note 17: Accumulated losses
2016 2015 $ $ Opening balance (11,541,596) (8,144,856) Net loss for the year (1,555,948) (3,396,740)
Accumulated losses at the end of the financial year (13,097,544) (11,541,596) Note 18: Commitments
Exploration
The Group based on the minimum annual commitments pursuant to the terms and conditions of exploration licences and mineral rights will have minimum annual commitment obligations of $704,420 (2015: $325,500) in the forthcoming year. These obligations are capable of being varied from time to time in order to maintain current rights of tenure to mining tenements.
Executive and administration services The Group has a minimum obligation of $102,000 (2015: $57,000) in the forthcoming year.
Note 19: Contingent liabilities
The Group is not aware of any significant contingencies that existed at balance date. Note 20: Related party transactions
(a) Associates
GWR Group Limited (GWR) GWR is a significant shareholder in the Group’s parent Tungsten Mining NL and holds significant influence over decision making of the Group. During the year the Group received certain services from GWR as detailed in the table below.
2016 2015 $ $
GWR Services Executive 270,000 218,182 Administration and recharges 62,855 40,000 Project related activities 84,866 289,402
417,721 547,584
At balance date $189,287 (2015: $213,608) remains outstanding in Payables to GWR. GWR Loan The Company and GWR entered into a Funding Deed (“Deed”) during the year. The Deed provided the terms by which GWR advanced the Company a 12% pa interest bearing unsecured $1,000,000 loan. During the year the Company paid and or accrued $66,739 of interest to GWR under the terms of this Deed. At balance date the $1,000,000 loan and accrued interest of $6,575 remains outstanding to GWR (see note 13 and 14).
2016 Annual Report Pg 51

Notes to Financial Statements for the year ended 30 June 2016 Note 20: Related party transactions (continued)
(b) Transactions with related parties
Horn Resources (Horn) Horn is an entity controlled by the Robert Van Der Laan – Chief Financial Officer (resigned 17 September 2014). The Group in the prior year received certain administration and technical services from Horn as detailed in the table below.
2016 2015 $ $
Horn Resources Administration - 96,509 Exploration and evaluation related activities - 53,498
- 150,007
At balance date no amounts remained outstanding in Trade Payables to Horn. There are no other related party transactions during the year, other than those relating to key management personnel (see note 5).
Note 21: Cash flow information
2016 2015 $ $
(a) Reconciliation of cash flows from operations with loss
from ordinary activities after income tax
Loss from ordinary activities after income tax (1,555,948) (3,396,740) Add back: Depreciation 19,133 20,529 Impairment 510,079 - Loss on disposal of property, plant and equipment 13,783 - Capitalised exploration and evaluation costs expensed 100,000 -
Changes in assets and liabilities (Increase)/decrease in trade and other receivables (10,659) 23,335 (Increase)/decrease in other assets 8,178 (4,274) Increase in trade and other payables 23,396 44,148 Cash flows used in operations (892,038) (3,313,002) (b) Non cash financing and investing activities During the year, the Company issued 5,000,000 shares for the acquisition of the Mt Mulgine and Big Hill tungsten projects (see note 15).
Notes to Financial Statements for the year ended 30 June 2016 Note 22: Financial risk management objectives and policies
The Group’s principal financial instruments are cash and cash equivalents and borrowings. The main purpose of the financial instruments is to finance the Group’s operations. The Group’s also has other financial instruments such as trade debtors and creditors which arise directly from its operations. The main risks arising from the Group’s financial instruments are interest rate risk and credit risk. The board reviews and agrees policies for managing each of these risks and they are summarised below: (a) Interest Rate Risk Interest rate risk is the risk that a financial instrument’s value will fluctuate as a result of changes in market interest rates. The Group’s exposure to interest rate risk is detailed in the table below. The Group’s has not entered into any hedging activities to manage interest rate risk. In regard to its interest rate risk, the Group’s continuously analyses its exposure. Within this analysis consideration is given to potential renewals of existing positions, alternative investments and the mix of fixed and variable interest rates.
Weighted Average Effective Interest
Rate
Floating Interest
Rate
Fixed Interest
Rate
Non Interest Bearing
Total
Total Interest Bearing
% $ $ $ $ $
2016 Financial Assets Cash 0.95 283,676 - 283,676 24,981 308,657 Term Deposit 2.82 1,250,000 - 1,250,000 - 1,250,000 Receivables 0.00 - - - 43,494 43,494 1,533,676 - 1,533,676 68,475 1,602,151
Financial Liabilities Trade creditors 0.00 - - - 301,867 301,867 Borrowings 12.00 - 1,000,000 1,000,000 - 1,000,000 - 1,000,000 1,000,000 301,867 1,301,867
2015 Financial Assets Cash 1.50 3,855 - 3,855 52,291 56,146 Term Deposit 2.90 719,389 - 719,389 - 719,389 Receivables 0.00 - - - 32,835 32,835 723,244 - 723,244 85,126 808,370
Financial Liabilities Trade creditors - - - 278,471 278,471 - - - 278,471 278,471
2016 Annual ReportPg 52

Notes to Financial Statements for the year ended 30 June 2016 Note 20: Related party transactions (continued)
(b) Transactions with related parties
Horn Resources (Horn) Horn is an entity controlled by the Robert Van Der Laan – Chief Financial Officer (resigned 17 September 2014). The Group in the prior year received certain administration and technical services from Horn as detailed in the table below.
2016 2015 $ $
Horn Resources Administration - 96,509 Exploration and evaluation related activities - 53,498
- 150,007
At balance date no amounts remained outstanding in Trade Payables to Horn. There are no other related party transactions during the year, other than those relating to key management personnel (see note 5).
Note 21: Cash flow information
2016 2015 $ $
(a) Reconciliation of cash flows from operations with loss
from ordinary activities after income tax
Loss from ordinary activities after income tax (1,555,948) (3,396,740) Add back: Depreciation 19,133 20,529 Impairment 510,079 - Loss on disposal of property, plant and equipment 13,783 - Capitalised exploration and evaluation costs expensed 100,000 -
Changes in assets and liabilities (Increase)/decrease in trade and other receivables (10,659) 23,335 (Increase)/decrease in other assets 8,178 (4,274) Increase in trade and other payables 23,396 44,148 Cash flows used in operations (892,038) (3,313,002) (b) Non cash financing and investing activities During the year, the Company issued 5,000,000 shares for the acquisition of the Mt Mulgine and Big Hill tungsten projects (see note 15).
Notes to Financial Statements for the year ended 30 June 2016 Note 22: Financial risk management objectives and policies
The Group’s principal financial instruments are cash and cash equivalents and borrowings. The main purpose of the financial instruments is to finance the Group’s operations. The Group’s also has other financial instruments such as trade debtors and creditors which arise directly from its operations. The main risks arising from the Group’s financial instruments are interest rate risk and credit risk. The board reviews and agrees policies for managing each of these risks and they are summarised below: (a) Interest Rate Risk Interest rate risk is the risk that a financial instrument’s value will fluctuate as a result of changes in market interest rates. The Group’s exposure to interest rate risk is detailed in the table below. The Group’s has not entered into any hedging activities to manage interest rate risk. In regard to its interest rate risk, the Group’s continuously analyses its exposure. Within this analysis consideration is given to potential renewals of existing positions, alternative investments and the mix of fixed and variable interest rates.
Weighted Average Effective Interest
Rate
Floating Interest
Rate
Fixed Interest
Rate
Non Interest Bearing
Total
Total Interest Bearing
% $ $ $ $ $
2016 Financial Assets Cash 0.95 283,676 - 283,676 24,981 308,657 Term Deposit 2.82 1,250,000 - 1,250,000 - 1,250,000 Receivables 0.00 - - - 43,494 43,494 1,533,676 - 1,533,676 68,475 1,602,151
Financial Liabilities Trade creditors 0.00 - - - 301,867 301,867 Borrowings 12.00 - 1,000,000 1,000,000 - 1,000,000 - 1,000,000 1,000,000 301,867 1,301,867
2015 Financial Assets Cash 1.50 3,855 - 3,855 52,291 56,146 Term Deposit 2.90 719,389 - 719,389 - 719,389 Receivables 0.00 - - - 32,835 32,835 723,244 - 723,244 85,126 808,370
Financial Liabilities Trade creditors - - - 278,471 278,471 - - - 278,471 278,471
2016 Annual Report Pg 53

Notes to Financial Statements for the year ended 30 June 2016 Note 22: Financial risk management objectives and policies (continued)
A sensitivity of 10% has been selected as this is considered reasonable given the current level of both short term and long term Australian dollar interest rates. A -10% sensitivity would move term deposit interest rates at 30 June 2016 from around 2.82% to 2.54% (2015: 2.90% to 2.61%) representing a 28 (2015: 29) basis points downwards shift, which is 19.6 (2015: 20.3) basis points net of tax. A -10% sensitivity would move cash interest rates at 30 June 2016 from around 0.95% to 0.86% (2015: 1.50% to 1.35%) representing a 9 (2014: 15) basis points downwards shift, which is 6.3 (2014: 10.5) basis points net of tax. A -10% sensitivity would move borrowings interest rates at 30 June 2016 from 12% to 10.8% representing a 120 basis points downwards shift, which is 84 basis points net of tax. Based on the sensitivity analysis only interest revenue from variable rate deposits and cash balances is impacted resulting in a decrease or increase in overall income. Borrowings interest expense can be impacted however this is subject to an agreed change of terms between the Company and the counterparty GWR Group Limited. (b) Liquidity Risk The Group manages liquidity risk by maintaining sufficient cash reserves required to meet the current exploration and administration commitments, through the continuous monitoring of actual cash flows. All payables are due within 30 days. (c) Fair Values For financial assets and liabilities, the net fair value approximates their carrying value. No financial assets and financial liabilities are readily traded on organised markets in standardised form. (d) Credit Risk Credit risk arises in the event that counterparty will not meet its obligations under a financial instrument leading to financial losses. The Group is exposed to credit risk from its operating activities, financing activities including deposits with banks. The credit risk control procedures adopted by the Group is to assess the credit quality of the institution with whom funds are deposited or invested, taking into account its financial position and past experiences. The maximum exposure to credit risk on financial assets of the Group which have been recognised on the consolidated statement of financial position is generally limited to the carrying amount. Cash is maintained with National Australia Bank. (e) Foreign Currency Risk The Group is not exposed to any significant foreign currency risk.
Interest Rate Risk Sensitivity -10% 10%
Profit Equity Profit Equity $ $ $ $ 2016 Cash (189) (189) 189 189 Term Deposit (2,468) (2,468) 2,468 2,468 Borrowings 8,400 8,400 (8,400) (8,400) 2015 Cash (8) (8) 8 8 Term Deposit (1,460) (1,460) 1,460 1,460
Notes to Financial Statements for the year ended 30 June 2016 Note 23: Subsequent events There has not arisen in the interval between the end of the financial year and the date of this report any item, transaction or event of a material and unusual nature likely, in the opinion of the directors, to affect significantly the operations of the Group, the results of those operations, or the state of affairs of the Group in the future financial year. Note 24: Parent entity
Parent Parent 2016 2015 $ $
Assets Current assets 1,602,152 816,548 Non current assets 2,450,328 1,745,901 Total Assets 4,052,480 2,562,449
Liabilities Current liabilities 1,301,868 278,470 Total Liabilities 1,301,868 278,470
Net Assets 2,750,612 2,283,979
Equity Issued capital 15,613,073 13,599,073 Reserves 235,080 235,080 Accumulated losses (13,097,541) (11,550,174) Total Equity 2,750,612 2,283,979 Parent Parent 2016 2015 $ $
Loss for the year (1,547,367) (7,113,056) Other comprehensive income - - Total comprehensive loss for the financial year (1,547,367) (7,113,056)
2016 Annual ReportPg 54

Notes to Financial Statements for the year ended 30 June 2016 Note 22: Financial risk management objectives and policies (continued)
A sensitivity of 10% has been selected as this is considered reasonable given the current level of both short term and long term Australian dollar interest rates. A -10% sensitivity would move term deposit interest rates at 30 June 2016 from around 2.82% to 2.54% (2015: 2.90% to 2.61%) representing a 28 (2015: 29) basis points downwards shift, which is 19.6 (2015: 20.3) basis points net of tax. A -10% sensitivity would move cash interest rates at 30 June 2016 from around 0.95% to 0.86% (2015: 1.50% to 1.35%) representing a 9 (2014: 15) basis points downwards shift, which is 6.3 (2014: 10.5) basis points net of tax. A -10% sensitivity would move borrowings interest rates at 30 June 2016 from 12% to 10.8% representing a 120 basis points downwards shift, which is 84 basis points net of tax. Based on the sensitivity analysis only interest revenue from variable rate deposits and cash balances is impacted resulting in a decrease or increase in overall income. Borrowings interest expense can be impacted however this is subject to an agreed change of terms between the Company and the counterparty GWR Group Limited. (b) Liquidity Risk The Group manages liquidity risk by maintaining sufficient cash reserves required to meet the current exploration and administration commitments, through the continuous monitoring of actual cash flows. All payables are due within 30 days. (c) Fair Values For financial assets and liabilities, the net fair value approximates their carrying value. No financial assets and financial liabilities are readily traded on organised markets in standardised form. (d) Credit Risk Credit risk arises in the event that counterparty will not meet its obligations under a financial instrument leading to financial losses. The Group is exposed to credit risk from its operating activities, financing activities including deposits with banks. The credit risk control procedures adopted by the Group is to assess the credit quality of the institution with whom funds are deposited or invested, taking into account its financial position and past experiences. The maximum exposure to credit risk on financial assets of the Group which have been recognised on the consolidated statement of financial position is generally limited to the carrying amount. Cash is maintained with National Australia Bank. (e) Foreign Currency Risk The Group is not exposed to any significant foreign currency risk.
Interest Rate Risk Sensitivity -10% 10%
Profit Equity Profit Equity $ $ $ $ 2016 Cash (189) (189) 189 189 Term Deposit (2,468) (2,468) 2,468 2,468 Borrowings 8,400 8,400 (8,400) (8,400) 2015 Cash (8) (8) 8 8 Term Deposit (1,460) (1,460) 1,460 1,460
Notes to Financial Statements for the year ended 30 June 2016 Note 23: Subsequent events There has not arisen in the interval between the end of the financial year and the date of this report any item, transaction or event of a material and unusual nature likely, in the opinion of the directors, to affect significantly the operations of the Group, the results of those operations, or the state of affairs of the Group in the future financial year. Note 24: Parent entity
Parent Parent 2016 2015 $ $
Assets Current assets 1,602,152 816,548 Non current assets 2,450,328 1,745,901 Total Assets 4,052,480 2,562,449
Liabilities Current liabilities 1,301,868 278,470 Total Liabilities 1,301,868 278,470
Net Assets 2,750,612 2,283,979
Equity Issued capital 15,613,073 13,599,073 Reserves 235,080 235,080 Accumulated losses (13,097,541) (11,550,174) Total Equity 2,750,612 2,283,979 Parent Parent 2016 2015 $ $
Loss for the year (1,547,367) (7,113,056) Other comprehensive income - - Total comprehensive loss for the financial year (1,547,367) (7,113,056)
2016 Annual Report Pg 55

Notes to Financial Statements for the year ended 30 June 2016 Note 25: Controlled entities
Tungsten Mining NL is the ultimate parent entity of the Group. The following were controlled entities at balance date and have been included in the consolidated financial statements. All shares held are ordinary shares.
Company Name Country of Incorporation
Percentage Interest Held
Percentage Interest Held
Acquired/Incorporated
2016 2015 Date
Parent Entity: Tungsten Mining NL Australia - - 13/07/2011
Subsidiaries of Tungsten Mining NL: BRL Exploration Pty Ltd Australia 100% 100% 13/03/2012 SM3-W Pty Ltd Australia 100% 100% 13/12/2012 Pilbara Tungsten Pty Ltd Australia 100% 0% 13/11/2015 Mid-West Tungsten Pty Ltd Australia 100% 0% 13/11/2015
Directors’ Declaration
In the opinion of the directors of Tungsten Mining NL:
(a) the financial statements and notes set out on pages to 32 to 56 are in accordance with the Corporations Act 2001, including: (i) giving a true and fair view of the financial position of the Group as at 30 June 2016 and of its
performance for the year ended on that date; and (ii) complying with Australian Accounting Standards and the Corporations Regulations 2001;
(b) the financial statements and notes also comply with International Financial Reporting Standards as
disclosed in Note 2(a); and (c) there are reasonable grounds to believe that the Company will be able to pay its debts as and when they
become due and payable.
This declaration has been made after receiving the declarations required to be made to the directors in accordance with Section 295A of the Corporations Act 2001 for the year ended 30 June 2016. This declaration is made in accordance with a resolution of the directors.
Gary Lyons Chairman Perth Dated 16 September 2016
2016 Annual ReportPg 56

Notes to Financial Statements for the year ended 30 June 2016 Note 25: Controlled entities
Tungsten Mining NL is the ultimate parent entity of the Group. The following were controlled entities at balance date and have been included in the consolidated financial statements. All shares held are ordinary shares.
Company Name Country of Incorporation
Percentage Interest Held
Percentage Interest Held
Acquired/Incorporated
2016 2015 Date
Parent Entity: Tungsten Mining NL Australia - - 13/07/2011
Subsidiaries of Tungsten Mining NL: BRL Exploration Pty Ltd Australia 100% 100% 13/03/2012 SM3-W Pty Ltd Australia 100% 100% 13/12/2012 Pilbara Tungsten Pty Ltd Australia 100% 0% 13/11/2015 Mid-West Tungsten Pty Ltd Australia 100% 0% 13/11/2015
Directors’ Declaration
In the opinion of the directors of Tungsten Mining NL:
(a) the financial statements and notes set out on pages to 32 to 56 are in accordance with the Corporations Act 2001, including: (i) giving a true and fair view of the financial position of the Group as at 30 June 2016 and of its
performance for the year ended on that date; and (ii) complying with Australian Accounting Standards and the Corporations Regulations 2001;
(b) the financial statements and notes also comply with International Financial Reporting Standards as
disclosed in Note 2(a); and (c) there are reasonable grounds to believe that the Company will be able to pay its debts as and when they
become due and payable.
This declaration has been made after receiving the declarations required to be made to the directors in accordance with Section 295A of the Corporations Act 2001 for the year ended 30 June 2016. This declaration is made in accordance with a resolution of the directors.
Gary Lyons Chairman Perth Dated 16 September 2016
2016 Annual Report Pg 57

2016 Annual ReportPg 58
PO Box 1908 West Perth WA 6872
Australia
Level 2, 1 Walker Avenue West Perth WA 6005
Australia
Tel: +61 8 9481 3188 Fax: +61 8 9321 1204
ABN: 84 144 581 519 www.stantons.com.au
Liability limited by a scheme approved under Professional Standards Legislation
Stantons International Audit and Consulting Pty Ltd trading as
Chartered Accountants and Consultants
INDEPENDENT AUDITOR’S REPORT TO THE MEMBERS OF TUNGSTEN MINING NL
Report on the Financial Report We have audited the accompanying financial report of Tungsten Mining NL, which comprises the consolidated statement of financial position as at 30 June 2016, the consolidated statement of profit or loss and other comprehensive income, the consolidated statement of changes in equity and the consolidated statement of cash flows for the year then ended, notes comprising a summary of significant accounting policies and other explanatory information and the directors’ declaration of the consolidated entity comprising the company and the entities it controlled at the year’s end or from time to time during the financial year. Directors’ responsibility for the Financial Report The directors of the Company are responsible for the preparation of the financial report that gives a true and fair view in accordance with Australian Accounting Standards and the Corporations Act 2001 and for such internal control as the directors determine is necessary to enable the preparation of the financial report that gives a true and fair view and is free from material misstatement, whether due to fraud or error. In note 2(a), the directors also state, in accordance with Australian Accounting Standard AASB 101 Presentation of Financial Statements, that the financial statements comply with International Financial Reporting Standards. Auditor’s responsibility Our responsibility is to express an opinion on the financial report based on our audit. We conducted our audit in accordance with Australian Auditing Standards. Those standards require that we comply with relevant ethical requirements relating to audit engagements and plan and perform the audit to obtain reasonable assurance whether the financial report is free from material misstatement. An audit involves performing procedures to obtain audit evidence about the amounts and disclosures in the financial report. The procedures selected depend on the auditor’s judgement, including the assessment of the risks of material misstatement of the financial report, whether due to fraud or error. In making those risk assessments, the auditor considers internal control relevant to the company’s preparation of the financial report that gives a true and fair view in order to design audit procedures that are appropriate in the circumstances, but not for the purpose of expressing an opinion on the effectiveness of the company’s internal control.
An audit also includes evaluating the appropriateness
of accounting policies used and the reasonableness of accounting estimates made by the directors, as well as evaluating the overall presentation of the financial report. Our audit did not involve an analysis of the prudence of business decisions made by directors or management. We believe that the audit evidence we have obtained is sufficient and appropriate to provide a basis for our audit opinion. Independence In conducting our audit, we have complied with the independence requirements of the Corporations Act 2001.

2016 Annual Report Pg 59
Opinion In our opinion: (a) the financial report of Tungsten Mining NL is in accordance with the Corporations Act 2001,
including:
(i) giving a true and fair view of the consolidated entity’s financial position as at 30 June 2016 and of its performance for the year ended on that date; and
(ii) complying with Australian Accounting Standards and the Corporations Regulations 2001.
(b) the consolidated financial report also complies with International Financial Reporting Standards
as disclosed in note 2(a). Report on the Remuneration Report We have audited the remuneration report included in pages 25 to 28 of the directors’ report for the year ended 30 June 2016. The directors of the Company are responsible for the preparation and presentation of the remuneration report in accordance with section 300A of the Corporations Act 2001. Our responsibility is to express an opinion on the remuneration report, based on our audit conducted in accordance with Australian Auditing Standards. Opinion In our opinion the remuneration report of Tungsten Mining NL for the year ended 30 June 2016 complies with section 300A of the Corporations Act 2001. STANTONS INTERNATIONAL AUDIT AND CONSULTING PTY LTD (Trading as Stantons International) (An Authorised Audit Company)
Martin Michalik Director West Perth, Western Australia 16 September 2016

Additional Information
Security holder information as at 13 September 2016. Distribution schedule and number of holders of equity securities
Spread of Holdings No. Holders Shares
1-1,000 4 1,001-5,000 5 5,001-10,000 141 10,001-100,000 101 100,001 - and over 82
Total number of holders of securities 333 Total number of securities 263,652,708 There were 18 shareholders holding less than a marketable parcel of ordinary shares
Top twenty holders of quoted equity securities
Shareholder No. Shares Percentage
1 HSBC Custody Nominees Australia Ltd 35,262,142 13.37 2 GWR Group Limited 35,000,000 13.28 3 Citicorp Nominees Pty Ltd 33,645,575 12.76 4 Elmar Global Investments Limited 11,200,175 4.25 5 Reynaud International Ltd 11,006,100 4.17 6 Kresta Inv Ltd 10,500,000 3.98 7 Hilux Resources Pty Ltd 9,900,000 3.75 8 Wynnes Investment Holdings Limited 7,750,000 2.94 9 Yap Kim Foong 7,500,000 2.84 10 Woodwork Investments Ltd 5,000,000 1.90 11 Teoh Kong Tuck 5,000,000 1.90 12 Dato Chua Goon Eng 5,000,000 1.90 13 Hazelwood Resources Limited 5,000,000 1.90 14 Calford International Limited 4,500,000 1.71 15 Ocean State Enterprises Ltd 4,000,000 1.52 16 SM3 Resources Pty Ltd 3,552,000 1.34 17 Dynamic Partners Pty Ltd 3,500,000 1.33 18 Mission Resources Pty Ltd 3,500,000 1.33 19 Mr Paul Berndt 3,500,000 1.33 20 MD Mukhtar Hossain 3,000,000 1.13
207,315,992 78.63
Additional Information (continued)
Substantial shareholders
Shareholder No. of shares Percentage GWR Group Limited 35,000,000 16.46 Lavington International Limited 20,000,000 9.41 Wynnes Investment Holding Ltd 15,000,000 7.05 Yeo Siak Poh and Lim Moi Poh 12,500,000 5.88
Voting Rights The voting rights attached to each class of equity securities are set out below. (a) Ordinary shares On a show of hands every member present at a meeting in person or by proxy shall have one vote and upon a poll each share shall have one vote. Restricted Securities There are no restricted securities as at 13 September 2016. Unlisted options as at 30 June 2016 Unlisted options on issue expired in accordance with their terms during the year.
2016 Annual ReportPg 60

Additional Information
Security holder information as at 13 September 2016. Distribution schedule and number of holders of equity securities
Spread of Holdings No. Holders Shares
1-1,000 4 1,001-5,000 5 5,001-10,000 141 10,001-100,000 101 100,001 - and over 82
Total number of holders of securities 333 Total number of securities 263,652,708 There were 18 shareholders holding less than a marketable parcel of ordinary shares
Top twenty holders of quoted equity securities
Shareholder No. Shares Percentage
1 HSBC Custody Nominees Australia Ltd 35,262,142 13.37 2 GWR Group Limited 35,000,000 13.28 3 Citicorp Nominees Pty Ltd 33,645,575 12.76 4 Elmar Global Investments Limited 11,200,175 4.25 5 Reynaud International Ltd 11,006,100 4.17 6 Kresta Inv Ltd 10,500,000 3.98 7 Hilux Resources Pty Ltd 9,900,000 3.75 8 Wynnes Investment Holdings Limited 7,750,000 2.94 9 Yap Kim Foong 7,500,000 2.84 10 Woodwork Investments Ltd 5,000,000 1.90 11 Teoh Kong Tuck 5,000,000 1.90 12 Dato Chua Goon Eng 5,000,000 1.90 13 Hazelwood Resources Limited 5,000,000 1.90 14 Calford International Limited 4,500,000 1.71 15 Ocean State Enterprises Ltd 4,000,000 1.52 16 SM3 Resources Pty Ltd 3,552,000 1.34 17 Dynamic Partners Pty Ltd 3,500,000 1.33 18 Mission Resources Pty Ltd 3,500,000 1.33 19 Mr Paul Berndt 3,500,000 1.33 20 MD Mukhtar Hossain 3,000,000 1.13
207,315,992 78.63
Additional Information (continued)
Substantial shareholders
Shareholder No. of shares Percentage GWR Group Limited 35,000,000 16.46 Lavington International Limited 20,000,000 9.41 Wynnes Investment Holding Ltd 15,000,000 7.05 Yeo Siak Poh and Lim Moi Poh 12,500,000 5.88
Voting Rights The voting rights attached to each class of equity securities are set out below. (a) Ordinary shares On a show of hands every member present at a meeting in person or by proxy shall have one vote and upon a poll each share shall have one vote. Restricted Securities There are no restricted securities as at 13 September 2016. Unlisted options as at 30 June 2016 Unlisted options on issue expired in accordance with their terms during the year.
2016 Annual Report Pg 61

2016 Annual ReportPg 62
This page has been left blank intentionally
Notes

Board of Directors
Gary Lyons Non-executive Chairman
Kong Leng (Jimmy) Lee Non-executive Director
Chew Wai Chuen Non-executive Director
Teck Siong Wong Non-executive Director
Company Secretary
Mark Pitts
Chief Executive Officer
Craig Ferrier
Principal & Registered Office
97 Outram Street West Perth WA 6005 AUSTRALIA
Telephone +61 8 9486 8492 Facsimile +61 8 9322 2370 Email: [email protected] www.tungstenmining.com
ASX Code TGN
Auditor
Stantons International Level 2, 1 Walker Avenue West Perth WA 6005
Share Registry
Security Transfer Registrars 770 Canning Highway Applecross WA 6153 AUSTRALIA
Telephone +61 8 9315 2333 Facsimile +61 8 9315 2233
Investor and Media Relations
Cannings Purple Ph +61 8 6314 6300
Legal Advisors
Bennett + Co Ground Floor, BGC Centre 28 The Esplanade Perth WA 6000 AUSTRALIA
Bankers
National Australia Bank Ground Floor 100 St Georges Terrace Perth WA 6000 AUSTRALIA
ABN 67 152 084 403
Corporate Directory
Corporate Governance
The Company has adopted the 3rd Edition of the ASX Corporate Governance Recommendations. A summary statement which has been approved by the Board together with current policies and charters is available on the Company website at the following address www.tungstenmining.com/corporate-governance.

97 Outram StreetWest Perth 6005Western Australia
PO Box 517West Perth WA 6872
Phone +61 8 9486 8492Fax +61 8 9322 2370Email [email protected] tungstenmining.com