2016 bondholders report - finance.uw.edu · university as one of the nation’s premier research...
TRANSCRIPT

2016 BONDHOLDERS REPORT

TABLE OF CONTENTS
1 Introduction
2 2016 Financial Report
3 Supplemental Bondholder Information Endowment Resources Faculty and Other Data Future Debt Service Medical Centers
OfficialStatementDisclosures
Operating Funds Students & Enrollment
4 Supplemental Financial Reports Commuter Services Harborview Medical Center Housing and Food Services Intercollegiate Athletics Metropolitan Tract Student Facilities Fees—Seattle Campus Supplementary Information (General Revenues) UW Medicine Clinical Enterprise—UW Division
2016
BONDHOLDERS
REPORT

2016 BONDHOLDERS REPORT
ThisreportincludesfinancialandoperatinginformationontheUniversityofWashington (the “University”).
As a preface to reviewing the materials, we suggest starting with the University’s Financial Report, which highlights the accomplishments, opportunities and challenges facing the Universityasoneofthenation’spremierresearchuniversities.TheenclosedauditedfinancialstatementsareasofJune30,2016,theUniversity’sfiscalyearend.
TheSupplementalReportincludesadditionalfinancialandoperatinginformationprovidedforthebenefitoftheholdersandbeneficialownersoftheBonds.Thissectionincludessomeinformation that is also included in the University’s Financial Report. This information may contain adjustments resulting from changes in methodology or timing. The format of the supplemental information has been updated to provide year-over-year data, consistent with the University’s Financial Report.
If you have comments, questions or need additional information, please contact us using the contact information shown below.
University of Washington
The information presented in this report is not intended to cover all material information that may be relevant to the outstanding bondsoftheUniversityofWashington.TheinformationcontainedhereinhasbeenobtainedfromUniversityofficers,employees,records and other sources believed to reliable. The University is under no legal obligation to provide the bondholder report, nor should it be construed that the University will provide such information in whole or in part in the future.
4311 11th Avenue NE, Suite 600 Seattle, Washington 98105-4608 Phone: (206) 685-1822 Fax: (206) 543-3698
Kate StiversAnalyst(206) [email protected]
Bill StarkeySenior Associate Treasurer(206) [email protected]
Annette SommerAssociate Treasurer(206) [email protected]
Scott SelfridgeAssistant Treasurer(206) [email protected]
Alana Askew Associate Treasurer(206) 616-3673 [email protected]


2016FINANCIAL REPORT

1 INDEPENDENT AUDITORS’ REPORT 3 MANAGEMENT’S DISCUSSION AND ANALYSIS 14 FINANCIAL STATEMENTS 18 NOTES TO FINANCIAL STATEMENTS50 SCHEDULES OF REQUIRED SUPPLEMENTARY INFORMATION BOARD OF REGENTS AND ADMINISTRATIVE OFFICERSINSIDE
BACK COVER
1 Headcount2 Full time equivalents3 Includes Valley Medical Center (2016 only) and Northwest Hospital (2016 and 2011 only)4 Net of scholarship allowances of $144,543,000 in 2016, $91,403,000 in 2011 and $53,780,000 in 20065 Stated at fair value6 Gross square footage, all campuses
UNIVERSITY FACTS
TABLE OF CONTENTS
FISCAL YEAR 2016 Academic Year
2015–2016
FISCAL YEAR 2011 Academic Year
2010–2011
FISCAL YEAR 2006 Academic Year
2005–2006
STUDENTS
Autumn Enrollment 1 Undergraduate 40,163 35,615 31,086Graduate 13,595 12,389 10,540Professional 2,009 1,936 1,802TOTAL 55,767 49,940 43,428
Extension course and conference registrations 78,426 64,961 44,823
Number of Degrees Awarded Bachelor’s 10,589 9,325 8,296Master’s 4,072 3,524 2,866Doctoral 803 723 631Professional 518 528 496TOTAL 15,982 14,100 12,289
FACULTY 1 (Professorial, Instructional, Research) 4,703 4,235 3,650
FACULTY AND STAFF2 28,910 25,143 23,935
RESEARCH FUNDING – ALL SOURCES (in thousands of dollars) $ 1,367,366 $ 1,396,435 $ 967,456
SELECTED REVENUES (in thousands of dollars)
Patient Service and Other Medical-Related Revenues 3 $ 2,408,791 $ 1,362,594 $ 834,638Gifts, Grants and Contracts 1,409,443 1,401,584 1,094,023Tuition and Fees 4 948,751 594,915 358,130Auxiliary Enterprises and Other Revenues 623,438 393,850 237,808State Appropriations (Operating) 302,097 296,769 339,117Investment Income 44,877 394,670 294,305
SELECTED EXPENSES (in thousands of dollars)
Medical Related 3 $ 2,152,161 $ 1,160,595 $ 654,768Instruction, Academic Support and Student Services 1,617,202 1,233,770 956,517Research and Public Service 790,218 821,081 632,007Institutional Support and Physical Plant 506,015 325,980 260,926Auxiliary Enterprises 422,474 169,876 125,591
CONSOLIDATED ENDOWMENT FUND5 (in thousands of dollars) $ 2,968,000 $ 2,168,000 $ 1,700,000
SQUARE FOOTAGE6 (in thousands of square feet) 23,129 21,655 18,097

FINANCIAL REPORT 2016 / 1
The Board of Regents University of Washington:
We have audited the accompanying financial statements of the business-type activities and aggregate discretely presented component units of the University of Washington (the University), an agency of the state of Washington, which comprise the statements of net position as of June 30, 2016 and 2015, and the related statements of revenues, expenses, changes in net position, and cash flows for the years then ended, and the related notes to the financial statements, which collectively comprise the University’s basic financial statements.
Management’s Responsibility for the Financial StatementsManagement is responsible for the preparation and fair presentation of these financial statements in accordance with U.S. generally accepted accounting principles; this includes the design, implementation, and maintenance of internal control relevant to the preparation and fair presentation of financial statements that are free from material misstatement, whether due to fraud or error.
Auditors’ ResponsibilityOur responsibility is to express opinions on these financial statements based on our audits. We conducted our audits in accordance with auditing standards generally accepted in the United States of America. Those standards require that we plan and perform the audit to obtain reasonable assurance about whether the financial statements are free from material misstatement.
An audit involves performing procedures to obtain audit evidence about the amounts and disclosures in the financial statements. The procedures selected depend on the auditors’ judgment, including the assessment of the risks of material misstatement of the financial statements, whether due to fraud or error. In making those risk assessments, the auditor considers internal control relevant to the entity’s preparation and fair presentation of the financial statements in order to design audit procedures that are appropriate in the circumstances, but not for the purpose of expressing an opinion on the effectiveness of the entity’s internal control. Accordingly, we express no such opinion. An audit also includes evaluating the appropriateness of accounting policies used and the reasonableness of significant accounting estimates made by management, as well as evaluating the overall presentation of the financial statements.
We believe that the audit evidence we have obtained is sufficient and appropriate to provide a basis for our audit opinions.
OpinionsIn our opinion, the financial statements referred to above present fairly, in all material respects, the respective financial position of the business-type activities and the aggregate discretely presented component units of the University of Washington as of June 30, 2016 and 2015, and the respective changes in financial position and cash flows thereof for the years then ended, in accordance with U.S. generally accepted accounting principles.
INDEPENDENT AUDITORS’ REPORT
KPMG LLP Suite 2900 1918 Eighth Avenue Seattle, WA 98101
KPMG LLP is a Delaware limited liability partnership and the U.S. member firm of the KPMG network of independent member firms affiliated with KPMG International Cooperative (“KPMG International”), a Swiss entity.

Unaudited – see accompanying notes to financial statements
UNIVERSITY OF WASHINGTON / 2
Emphasis of MattersAs discussed in note 1, the financial statements of the University of Washington, an agency of the state of Washington, are intended to present the financial position, the changes in financial position, and where applicable, cash flows of only the respective portion of the governmental activities, the business-type activities, each major fund, and the aggregate remaining fund information of the state of Washington that are attributable to the transactions of the University of Washington and its discretely presented component units. They do not purport to, and do not, present fairly the financial position of the state of Washington as of June 30, 2016 and 2015, the changes in its financial position or, where applicable, its cash flows for the years then ended, in accordance with U.S. generally accepted accounting principles. Our opinions are not modified with respect to this matter.
As discussed in note 1 to the financial statements, on July 1, 2014, the University adopted new accounting guidance requiring governments providing defined benefit pensions to their employees to recognize their proportionate share of the pension plan’s net position liability or net pension asset, as well as recognizing most changes in the net position liability within pension expense. Our opinions are not modified with respect to this matter.
Other MattersRequired Supplementary InformationU.S. generally accepted accounting principles require that the management’s discussion and analysis on pages 3 through 12, and the schedules of required supplementary information on pages 50 through 51, be presented to supplement the basic financial statements. Such information, although not a part of the basic financial statements, is required by the Governmental Accounting Standards Board who considers it to be an essential part of financial reporting for placing the basic financial statements in an appropriate operational, economic, or historical context. We have applied certain limited procedures to the required supplementary information in accordance with auditing standards generally accepted in the United States of America, which consisted of inquiries of management about the methods of preparing the information and comparing the information for consistency with management’s responses to our inquiries, the basic financial statements, and other knowledge we obtained during our audit of the basic financial statements. We do not express an opinion or provide any assurance on the information because the limited procedures do not provide us with sufficient evidence to express an opinion or provide any assurance.
Other InformationOur audit was conducted for the purpose of forming opinions on the financial statements that collectively comprise the University’s basic financial statements. The accompanying information under the table of contents is presented for purposes of additional analysis and is not a required part of the basic financial statements. This information has not been subjected to the auditing procedures applied in the audit of the basic financial statements, and accordingly, we do not express an opinion or provide any assurance on it.
Seattle, Washington October 21, 2016
KPMG LLP is a Delaware limited liability partnership and the U.S. member firm of the KPMG network of independent member firms affiliated with KPMG International Cooperative (“KPMG International”), a Swiss entity.
FINANCIAL REPORT 2016 / 3
Unaudited – see accompanying notes to financial statements
MANAGEMENT’S DISCUSSION AND ANALYSIS
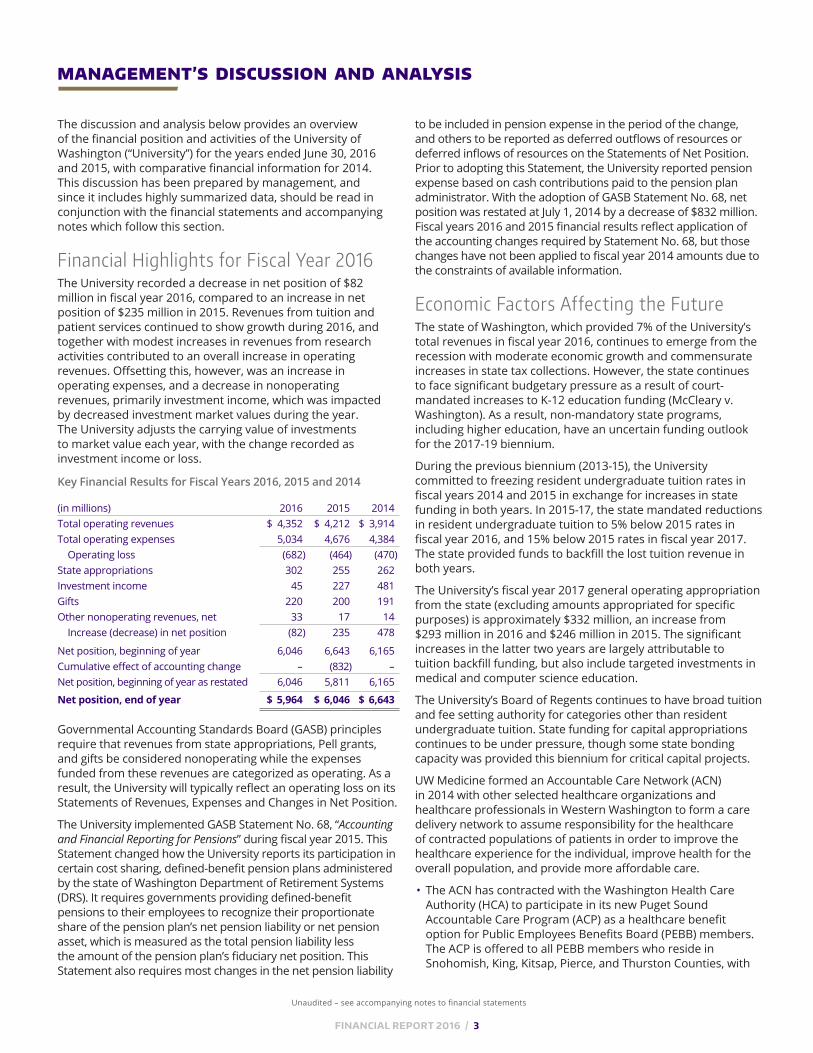
The discussion and analysis below provides an overview of the financial position and activities of the University of Washington (“University”) for the years ended June 30, 2016 and 2015, with comparative financial information for 2014. This discussion has been prepared by management, and since it includes highly summarized data, should be read in conjunction with the financial statements and accompanying notes which follow this section.
Financial Highlights for Fiscal Year 2016The University recorded a decrease in net position of $82 million in fiscal year 2016, compared to an increase in net position of $235 million in 2015. Revenues from tuition and patient services continued to show growth during 2016, and together with modest increases in revenues from research activities contributed to an overall increase in operating revenues. Offsetting this, however, was an increase in operating expenses, and a decrease in nonoperating revenues, primarily investment income, which was impacted by decreased investment market values during the year. The University adjusts the carrying value of investments to market value each year, with the change recorded as investment income or loss.
to be included in pension expense in the period of the change, and others to be reported as deferred outflows of resources or deferred inflows of resources on the Statements of Net Position. Prior to adopting this Statement, the University reported pension expense based on cash contributions paid to the pension plan administrator. With the adoption of GASB Statement No. 68, net position was restated at July 1, 2014 by a decrease of $832 million. Fiscal years 2016 and 2015 financial results reflect application of the accounting changes required by Statement No. 68, but those changes have not been applied to fiscal year 2014 amounts due to the constraints of available information.
Economic Factors Affecting the FutureThe state of Washington, which provided 7% of the University’s total revenues in fiscal year 2016, continues to emerge from the recession with moderate economic growth and commensurate increases in state tax collections. However, the state continues to face significant budgetary pressure as a result of court-mandated increases to K-12 education funding (McCleary v. Washington). As a result, non-mandatory state programs, including higher education, have an uncertain funding outlook for the 2017-19 biennium.
During the previous biennium (2013-15), the University committed to freezing resident undergraduate tuition rates in fiscal years 2014 and 2015 in exchange for increases in state funding in both years. In 2015-17, the state mandated reductions in resident undergraduate tuition to 5% below 2015 rates in fiscal year 2016, and 15% below 2015 rates in fiscal year 2017. The state provided funds to backfill the lost tuition revenue in both years.
The University’s fiscal year 2017 general operating appropriation from the state (excluding amounts appropriated for specific purposes) is approximately $332 million, an increase from $293 million in 2016 and $246 million in 2015. The significant increases in the latter two years are largely attributable to tuition backfill funding, but also include targeted investments in medical and computer science education.
The University’s Board of Regents continues to have broad tuition and fee setting authority for categories other than resident undergraduate tuition. State funding for capital appropriations continues to be under pressure, though some state bonding capacity was provided this biennium for critical capital projects.
UW Medicine formed an Accountable Care Network (ACN) in 2014 with other selected healthcare organizations and healthcare professionals in Western Washington to form a care delivery network to assume responsibility for the healthcare of contracted populations of patients in order to improve the healthcare experience for the individual, improve health for the overall population, and provide more affordable care.
• The ACN has contracted with the Washington Health Care Authority (HCA) to participate in its new Puget Sound Accountable Care Program (ACP) as a healthcare benefit option for Public Employees Benefits Board (PEBB) members. The ACP is offered to all PEBB members who reside in Snohomish, King, Kitsap, Pierce, and Thurston Counties, with
Key Financial Results for Fiscal Years 2016, 2015 and 2014
(in millions) 2016 2015 2014Total operating revenues $ 4,352 $ 4,212 $ 3,914Total operating expenses 5,034 4,676 4,384 Operating loss (682) (464) (470)State appropriations 302 255 262Investment income 45 227 481Gifts 220 200 191Other nonoperating revenues, net 33 17 14 Increase (decrease) in net position (82) 235 478
Net position, beginning of year 6,046 6,643 6,165Cumulative effect of accounting change – (832) –Net position, beginning of year as restated 6,046 5,811 6,165
Net position, end of year $ 5,964 $ 6,046 $ 6,643
Governmental Accounting Standards Board (GASB) principles require that revenues from state appropriations, Pell grants, and gifts be considered nonoperating while the expenses funded from these revenues are categorized as operating. As a result, the University will typically reflect an operating loss on its Statements of Revenues, Expenses and Changes in Net Position.
The University implemented GASB Statement No. 68, “Accounting and Financial Reporting for Pensions” during fiscal year 2015. This Statement changed how the University reports its participation in certain cost sharing, defined-benefit pension plans administered by the state of Washington Department of Retirement Systems (DRS). It requires governments providing defined-benefit pensions to their employees to recognize their proportionate share of the pension plan’s net pension liability or net pension asset, which is measured as the total pension liability less the amount of the pension plan’s fiduciary net position. This Statement also requires most changes in the net pension liability

UNIVERSITY OF WASHINGTON / 4
Unaudited – see accompanying notes to financial statements Unaudited – see accompanying notes to financial statements
MANAGEMENT’S DISCUSSION AND ANALYSIS (CONTINUED)
(in millions) 2016 2015 2014Current assets $ 1,539 $ 1,402 $ 1,537Noncurrent assets: Capital assets, net 4,353 4,172 4,045 Investments, net of current portion 4,108 4,297 3,959 Other 507 491 358Total assets 10,507 10,362 9,899Deferred outflows 179 111 14 Total assets and deferred outflows 10,686 10,473 9,913Current liabilities 1,060 998 872Noncurrent liabilities: Bonds payable 2,177 1,911 1,966 Other 1,363 1,249 432Total liabilities 4,600 4,158 3,270Deferred inflows 122 269 – Total liabilities and deferred Inflows 4,722 4,427 3,270Net position $ 5,964 $ 6,046 $ 6,643
possible expansion into a number of additional counties planned in 2017. This contract with HCA to cover PEBB members began January 1, 2016.
• A subset of the network members have also agreed to participate with the ACN in a contract with Premera as part of its new Accountable Health System (AHS) product. As an AHS, the UW Medicine ACN will share in accountability for the quality and cost of healthcare for Premera members who select this plan. This product was sold both on and off the Washington Health Exchange in select counties with coverage that began January 1, 2016 and must have 5,000 plan-wide members per product, per region to share in financial savings and risk.
• The UW Medicine ACN also entered into an agreement to provide healthcare services to non-union employees of a large local employer with coverage that began January 1, 2015.
These arrangements provide an opportunity for shared savings between the ACN and the contracted entity based on achieving quality and financial benchmarks. If certain financial benchmarks are not attained, UW Medicine, along with its network members, is at risk for reductions in payment levels from the contracted entity based on the agreement.
Rising benefit costs, particularly for pensions and healthcare, continue to impact the University. Employer pension funding rates for the Public Employees’ Retirement System (PERS) pension plans increased 21% during fiscal year 2016, from 9.21% to 11.18% of covered salary, and will be increasing to 12.52% of covered salary during fiscal year 2018. Likewise, the monthly employer base rate paid by the University for employee healthcare increased 27% during fiscal year 2016, from $662 to $840 per active employee, and will be increasing to $888 per active employee during fiscal year 2017. Both rates are likely to continue increasing over the next few years.
Using the Financial StatementsThe University’s financial statements are prepared in accordance with GASB principles, which establish standards for external financial reporting for public colleges and universities. GASB standards require that financial statements be presented on a consolidated basis in order to focus on the University as a whole. These financial statements include the following components:
• Independent Auditors’ Report presents an unmodified opinion prepared by our auditors, KPMG LLP, on the fairness in all material respects of our financial statements.
• Statements of Net Position present the assets and deferred outflows of resources, liabilities and deferred inflows of resources, and net position of the University at a point in time (June 30, 2016 and 2015). Their purpose is to present a financial snapshot of the University. This statement aids the reader in determining the assets available to continue the University’s operations, how much the University owes to employees and vendors, whether the University has any deferred outflows or inflows other than assets or liabilities, and a provides a picture of net position and its availability for expenditure by the University.
• Statements of Revenues, Expenses and Changes in Net Position present the total revenues earned and expenses incurred by the University for operating, nonoperating and other related activities, during a period of time (fiscal years ended June 30, 2016 and 2015). Their purpose is to assess the University’s operating and nonoperating activities.
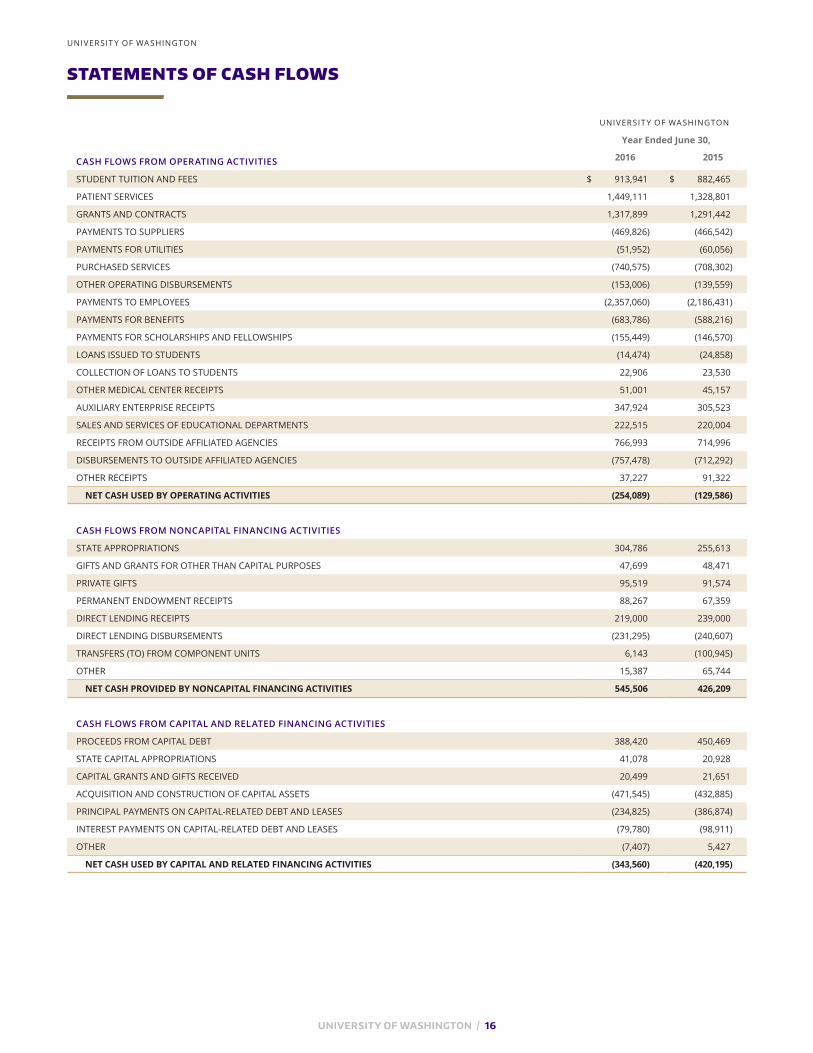
• Statements of Cash Flows present cash receipts and payments of the University during a period of time (the fiscal years ended June 30, 2016 and 2015). Their purpose is to assess the University’s ability to generate net cash flows and meet its obligations as they come due.
• Notes to the Financial Statements present additional information to support the financial statements. Their purpose is to clarify and expand on the information in the financial statements. Notes are referenced in this discussion to indicate where details of the financial highlights may be found.
The University has been affiliated with Northwest Hospital & Medical Center (Northwest Hospital) since 2010, and has had a strategic alliance with Valley Medical Center, a Washington public hospital district, since 2011. GASB standards require that these entities be presented as discrete component units of the University; therefore, their financial position at June 30, 2016 and 2015, and the results of their operations for the years ended June 30, 2016 and 2015, are reported in a separate column for financial statement presentation purposes (see Note 1 and Note 18 to the Financial Statements).
The analysis presented below includes the consolidated balances of the University of Washington and its blended component units (see Note 1), but excludes the financial position and results of operations of its discrete component units (Northwest Hospital and Valley Medical Center).
Financial HealthSTATEMENTS OF NET POSITIONA summarized comparison of the University’s assets, liabilities, deferrals and net position as of June 30, 2016, 2015 and 2014, follows:

FINANCIAL REPORT 2016 / 5
Unaudited – see accompanying notes to financial statements
bonds issued during the year, and an increase in the University’s net pension liability, offset by $112 million of commercial paper debt that was refunded by the new general revenue bonds. The net pension liability was recorded for the first time in 2015 as a result of implementing GASB Statement No.68, and represents the University’s proportionate share of the collective amounts reported by the DRS. This noncurrent liability increased $183 million during 2016, reflecting a corresponding increase in the state-wide amounts associated with these cost sharing, defined-benefit pension plans.
The difference between total assets and deferred outflows, and total liabilities and deferred inflows, is referred to as net position or “equity”. Over time, the change in net position is one indicator of the improvement or decline in the University’s overall financial health when considered with nonfinancial factors such as enrollment, research awards, patient levels, and the condition of facilities.
The University reports its “equity” in four categories:
• Net Investment in Capital Assets – This is the University’s total investment in capital assets, net of accumulated depreciation and amortization and outstanding debt obligations related to those capital assets.
• Restricted Net Position:
– Nonexpendable net position, primarily endowments, represents the historical cost (corpus) of gifts to the University’s permanent endowment funds. These are funds on which the donor or other external party has imposed the restriction that the corpus is not available for expenditure, but rather for investment purposes only in order to produce income that is to be expended for the purposes specified.
– Expendable net position consists of resources which the University is legally or contractually obligated to spend in accordance with time or purpose restrictions placed by donors and/or other external parties, and includes the net appreciation of permanent endowments.
• Unrestricted Net Position – This is all other funds available to the University for any purpose associated with its mission. Unrestricted net position is not subject to externally imposed stipulations, but often is internally designated for specific purposes.
The University’s net position at June 30, 2016, 2015 and 2014 is summarized as follows:
The University continues to maintain and protect its strong financial foundation. This financial health, as reflected in the Statements of Net Position, results from the prudent utilization of financial resources including careful cost controls, preservation of endowment funds, conservative utilization of debt and adherence to a long-range capital plan for the acquisition, maintenance and replacement of the physical plant.
Current assets include those that may be used to support current operations, and consist primarily of cash, short-term investments and accounts receivable. Current liabilities generally are due and payable over the course of the following fiscal year, and include accounts payable and other accrued liabilities, unearned revenues, and the current portion of long-term debt.
The excess of current assets over current liabilities of $479 million in 2016 and $404 million in 2015 reflects the continuing ability of the University to meet its short-term obligations. Current assets increased $137 million in 2016, partly due to an increase in accounts receivable of $107 million associated with pending sales of investments, and decreased $135 million in 2015, partly due to a decrease in the value of short-term investments of $106 million. Current liabilities increased $62 million in 2016, partly due to an increase in the liability for accrued annual leave of $11 million, together with an accrual for $16 million associated with the University’s portion of a settlement against the state of Washington in the Moore vs. HCA litigation. Current liabilities increased $126 million in 2015, primarily due to an increase in accounts payable of $102 million associated with pending purchases of investments.
Noncurrent assets were mostly unchanged in 2016, as an increase in capital assets of $181 million was offset by a decrease in long-term investments as a result of market value changes during the year for the University’s investments. Realized and unrealized losses in fiscal year 2016 totaled $54 million, compared to $151 million of net realized and unrealized gains in 2015. Noncurrent assets increased $598 million in 2015, primarily due to an increase in long-term investments.
Deferred outflows of resources and deferred inflows of resources primarily represent pension-related deferrals associated with the implementation of GASB Statement No. 68 in 2015. The increase in deferred outflows in 2016 primarily reflects the University’s proportionate share of an increase in the state-wide amounts reported by the DRS due to differences between expected and actual experience related to actuarial assumptions. In 2015, the University recorded $86 million of pension-related deferred outflows for the first time, primarily the deferral of pension contributions paid during the year. Similarly, the decrease in deferred inflows in 2016 reflects the University’s proportionate share of a decrease in the state-wide amounts due to differences between projected and actual investment earnings on pension plan assets. These deferred inflows were recorded for the first time in 2015.
Noncurrent liabilities increased $380 million in 2016, primarily due to $328 million of new general revenue and lease revenue
(in millions) 2016 2015 2014Net investment in capital assets $ 2,278 $ 2,156 $ 2,018Restricted: Nonexpendable 1,419 1,322 1,257 Expendable 1,591 1,699 1,629Unrestricted 676 869 1,739Total net position $ 5,964 $ 6,046 $ 6,643
UNIVERSITY OF WASHINGTON / 6
Unaudited – see accompanying notes to financial statements Unaudited – see accompanying notes to financial statements
MANAGEMENT’S DISCUSSION AND ANALYSIS (CONTINUED)
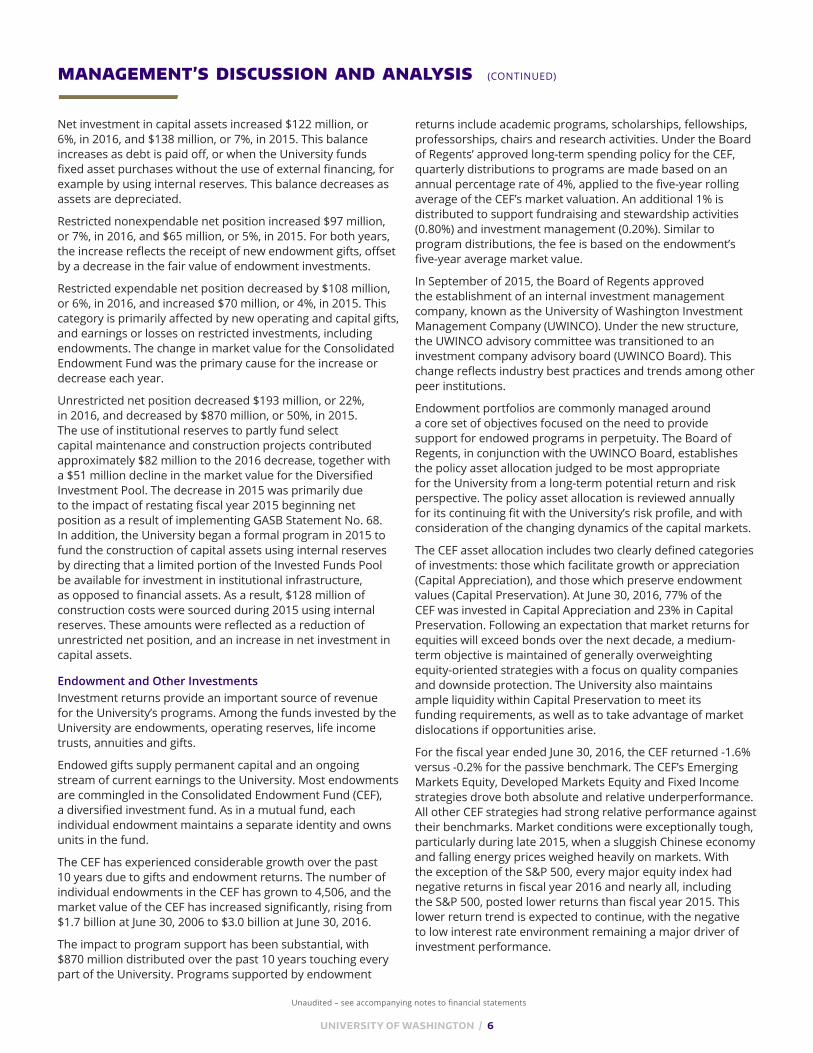
Net investment in capital assets increased $122 million, or 6%, in 2016, and $138 million, or 7%, in 2015. This balance increases as debt is paid off, or when the University funds fixed asset purchases without the use of external financing, for example by using internal reserves. This balance decreases as assets are depreciated.
Restricted nonexpendable net position increased $97 million, or 7%, in 2016, and $65 million, or 5%, in 2015. For both years, the increase reflects the receipt of new endowment gifts, offset by a decrease in the fair value of endowment investments.
Restricted expendable net position decreased by $108 million, or 6%, in 2016, and increased $70 million, or 4%, in 2015. This category is primarily affected by new operating and capital gifts, and earnings or losses on restricted investments, including endowments. The change in market value for the Consolidated Endowment Fund was the primary cause for the increase or decrease each year.
Unrestricted net position decreased $193 million, or 22%, in 2016, and decreased by $870 million, or 50%, in 2015. The use of institutional reserves to partly fund select capital maintenance and construction projects contributed approximately $82 million to the 2016 decrease, together with a $51 million decline in the market value for the Diversified Investment Pool. The decrease in 2015 was primarily due to the impact of restating fiscal year 2015 beginning net position as a result of implementing GASB Statement No. 68. In addition, the University began a formal program in 2015 to fund the construction of capital assets using internal reserves by directing that a limited portion of the Invested Funds Pool be available for investment in institutional infrastructure, as opposed to financial assets. As a result, $128 million of construction costs were sourced during 2015 using internal reserves. These amounts were reflected as a reduction of unrestricted net position, and an increase in net investment in capital assets.
Endowment and Other InvestmentsInvestment returns provide an important source of revenue for the University’s programs. Among the funds invested by the University are endowments, operating reserves, life income trusts, annuities and gifts.
Endowed gifts supply permanent capital and an ongoing stream of current earnings to the University. Most endowments are commingled in the Consolidated Endowment Fund (CEF), a diversified investment fund. As in a mutual fund, each individual endowment maintains a separate identity and owns units in the fund.
The CEF has experienced considerable growth over the past 10 years due to gifts and endowment returns. The number of individual endowments in the CEF has grown to 4,506, and the market value of the CEF has increased significantly, rising from $1.7 billion at June 30, 2006 to $3.0 billion at June 30, 2016.
The impact to program support has been substantial, with $870 million distributed over the past 10 years touching every part of the University. Programs supported by endowment
returns include academic programs, scholarships, fellowships, professorships, chairs and research activities. Under the Board of Regents’ approved long-term spending policy for the CEF, quarterly distributions to programs are made based on an annual percentage rate of 4%, applied to the five-year rolling average of the CEF’s market valuation. An additional 1% is distributed to support fundraising and stewardship activities (0.80%) and investment management (0.20%). Similar to program distributions, the fee is based on the endowment’s five-year average market value.
In September of 2015, the Board of Regents approved the establishment of an internal investment management company, known as the University of Washington Investment Management Company (UWINCO). Under the new structure, the UWINCO advisory committee was transitioned to an investment company advisory board (UWINCO Board). This change reflects industry best practices and trends among other peer institutions.
Endowment portfolios are commonly managed around a core set of objectives focused on the need to provide support for endowed programs in perpetuity. The Board of Regents, in conjunction with the UWINCO Board, establishes the policy asset allocation judged to be most appropriate for the University from a long-term potential return and risk perspective. The policy asset allocation is reviewed annually for its continuing fit with the University’s risk profile, and with consideration of the changing dynamics of the capital markets.
The CEF asset allocation includes two clearly defined categories of investments: those which facilitate growth or appreciation (Capital Appreciation), and those which preserve endowment values (Capital Preservation). At June 30, 2016, 77% of the CEF was invested in Capital Appreciation and 23% in Capital Preservation. Following an expectation that market returns for equities will exceed bonds over the next decade, a medium-term objective is maintained of generally overweighting equity-oriented strategies with a focus on quality companies and downside protection. The University also maintains ample liquidity within Capital Preservation to meet its funding requirements, as well as to take advantage of market dislocations if opportunities arise.
For the fiscal year ended June 30, 2016, the CEF returned -1.6% versus -0.2% for the passive benchmark. The CEF’s Emerging Markets Equity, Developed Markets Equity and Fixed Income strategies drove both absolute and relative underperformance. All other CEF strategies had strong relative performance against their benchmarks. Market conditions were exceptionally tough, particularly during late 2015, when a sluggish Chinese economy and falling energy prices weighed heavily on markets. With the exception of the S&P 500, every major equity index had negative returns in fiscal year 2016 and nearly all, including the S&P 500, posted lower returns than fiscal year 2015. This lower return trend is expected to continue, with the negative to low interest rate environment remaining a major driver of investment performance.

FINANCIAL REPORT 2016 / 7
Unaudited – see accompanying notes to financial statements
Consolidated Endowment Fund Market Value (in millions)
$3,300
$2,800
$2,300
$1,800
$1,300
$800
IN M
ILLI
ON
S
$2,098$2,161 $2,168
$1,649
$1,830
$2,111
$2,347
$2,833
$3,076$2,968
2007 2008 2009 2010 2011 2012 2013 2014 2015 2016
Moody’s Fiscal Year 2015 Public College and University Rating Distribution
(As of the July 2016 Moody’s Median Report)
NUMBER OF INSTITUTIONS
Aaa
Aa1
Aa2
Aa3
A1
A2
A3
Baa1
Baa2
Baa3
Ba1
Ba2
B1
Ca
0 10 20 30 40 50 60 70
4
4
1
8
8
23
40
68
53
38
15
UW
3
1
1
A portion of the University’s operating funds, the Diversified Investment Pool, are invested in the CEF. As of June 30, 2016, these funds comprise $731 million of the CEF market value.
Debt and Related Capital Improvements The University’s general revenue borrowing platform, established in 2003, has been used to fund buildings that support the educational, research and service missions of the institution. The University’s debt portfolio consists primarily of fixed rate debt in the form of General Revenue Bonds, Lease Revenue Bonds and state issued bonds, as well as variable rate debt such as commercial paper.
Credit ratings are a reflection of the University’s strength. During fiscal year 2016, the University was rated Aaa (Stable) (the highest rating) by Moody’s Investors Service and AA+ (Stable) by Standard & Poor’s. These strong ratings carry substantial advantages for the University: continued and wider access to capital markets when the University issues debt, lower interest rates on bonds and the ability to negotiate favorable bond terms.
The University takes its role of financial stewardship seriously and works hard to manage its financial resources effectively. Continued high debt ratings are important indicators of the University’s success in this area.
Longer-term, the CEF has consistently maintained solid absolute and relative performance. The CEF has outperformed both the passive benchmark, and public university peers with $1 billion to $5 billion of assets, for the 5, 10 and 20-year periods. The 20-year return for the CEF stands at +8.4%.

UNIVERSITY OF WASHINGTON / 8
Unaudited – see accompanying notes to financial statements Unaudited – see accompanying notes to financial statements
MANAGEMENT’S DISCUSSION AND ANALYSIS (CONTINUED)
In September 2015, the University issued $196 million of General Revenue Bonds with an average coupon of 4.03%. A portion of the proceeds was used to pay off $112 million of commercial paper. The balance was used to fund various projects such as renovation of Denny Hall, construction of Animal Care and Research Facilities, South West Campus Central Utility Plant and other projects.
In October 2015, the University, through Washington Biomedical Research Properties 3.2, issued $132 million in Lease Revenue Bonds with an average coupon of 4.42%. Proceeds were used to fund the design, construction, and equipping of a new biomedical research facility.
The University continues to expand its campuses and renovate existing facilities to meet the needs of its students, faculty and staff. Significant capital asset expenditures (greater than $20 million) during fiscal year 2016 included $65 million for the Animal Care and Research Facilities, $38 million for Phase 2 of the UW Medical Center expansion, $37 million for the Molecular Engineering & Sciences Building, $36 million for the renovation of Denny Hall, and $23 million for the South West Campus Central Utility Plant.
Key projects placed in service during 2016 include:
• Maple Hall and Terry Hall - $112 million. These new eight-story residential buildings include five wood-frame stories of housing consisting of two-bedroom suites, all with private bathrooms. The lower two floors of each building will be occupied by Housing and Food Services administration offices, common space for students, and some additional two-bedroom suites. A below-grade parking garage connected to the Lander Hall garage and the Lander Hall loading dock will extend below the new Maple and Terry residence halls. The two new buildings will total approximately 440,000 square feet, with a target bed count of 1,150 beds.
• UW Medical Center Expansion Phase 2 - $121 million. This project included a build-out of three inpatient bed floors, including the addition of intensive care and medical/surgical beds as well as new operating rooms.
• Montlake/Rainier Vista - $24 million. The scope of this project included lowering NE Pacific Place, and construction of the Rainier Vista Land Bridge to span over NE Pacific Place and connect the Montlake Triangle in a seamless pedestrian experience. Also included were landscaping, hard surfacing, lighting and other site improvements.
1.9
Moody’s Public Universities
(Aaa median 2015)
Moody’s Public Universities
(Aaa median 2015)
Moody’s Public Universities
(Aaa median 2015)
Moody’s Public Universities
(Aaa median 2015)
2016 20142015
Spendable Cash and Investments to Total Debt
1.6
9.5
2.7
3.0
2.5
2.0
1.5
1.0
0.5
0.0
1.7
0.9
YEA
RS
OF
CO
VER
AG
ER
AT
IOR
AT
IOR
AT
IO
2016 20142015
Spendable Cash and Investmentsto Operating Expenses
0.8
9.5
1.4
1.6
1.4
1.2
1.0
0.8
0.6
0.4
0.2
0.0
0.9
0.4
2016 20142015
Total Debt to Operating Revenue
0.5
9.5
0.5
0.6
0.5
0.4
0.3
0.2
0.1
0.0
0.5
3.3 3.1
2016 20142015
Annual Debt Service Coverage
2.2
9.5
4.04.0
3.0
2.0
1.0
0.0
0.5
The University uses three debt-related financial ratios as performance benchmarks to evaluate institutional debt capacity and financial health. Spendable Cash and Investments to Total Debt is a measure of all available resources to pay debt, Total Debt to Operating Revenue is a measure of financial leverage, and Annual Debt Service Coverage is a measure of cash flow available to pay debt obligations. Each ratio is defined by Moody’s Investors Service, and evaluated relative to the University’s debt policy and the appropriate peer group comparison.
This ratio shows that in 2016 the University had sufficient non-restricted cash and investments to pay its outstanding debt 1.6 times.
This ratio shows that in 2016 the University generated enough operating revenue to pay its total outstanding debt twice over.
This ratio shows that in 2016 the net operating income of the University was sufficient to pay the principal and interest payments on its outstanding debt 2.2 times.

FINANCIAL REPORT 2016 / 9
Unaudited – see accompanying notes to financial statements
(in millions) 2016 2015 2014Tuition and fees $ 949 $ 914 $ 839
Patient services 1,435 1,362 1,207
Grants and contracts 1,348 1,334 1,327
Sales and services of educational departments
225 223 213
Auxiliary enterprises 349 319 261
State funding for operations 302 255 262
Gifts 220 200 191
Investment income 45 227 481
State funding for capital projects 39 21 8
Other 112 136 164
Total revenue - all sources $ 5,024 $ 4,991 $ 4,953
(in millions) 2016 2015 2014Total operating revenues $ 4,352 $ 4,212 $ 3,914Total operating expenses 5,034 4,676 4,384 Operating loss (682) (464) (470)
Nonoperating revenues, net of expenses 450 590 859
Other revenues 150 109 89 Increase (decrease) in net position (82) 235 478
Net position, beginning of year 6,046 6,643 6,165Cumulative effect of accounting change – (832) –
Net position, beginning of year as restated 6,046 5,811 6,165
Net position, end of year $ 5,964 $ 6,046 $ 6,643
STATEMENTS OF REVENUES, EXPENSES AND CHANGES IN NET POSITIONThe Statements of Revenues, Expenses and Changes in Net Position present the University’s results of operations and nonoperating items that result in the changes in net position for the year. In accordance with GASB reporting principles, revenues and expenses are classified as either operating or nonoperating. A condensed comparison of the University’s revenues, expenses and changes in net position for the years ended June 30, 2016, 2015 and 2014 follows:
Sources of Funds
7% STATE FUNDING FOR OPERATIONS AND CAPITAL EXPENDITURES
2% OTHER
29% PATIENT SERVICES27% GRANTS ANDCONTRACTS
4% GIFTS
1% INVESTMENT INCOME
7% AUXILIARY ENTERPRISES
4% SALES AND SERVICES OFEDUCATIONAL DEPARTMENTS 19% TUITION AND FEES
23% INSTRUCTION
15% RESEARCH
8% ACADEMIC SUPPORT
3% SCHOLARSHIPS &FELLOWSHIPS
8% AUXILIARY
7% DEPRECIATION/AMORTIZATION
2% OTHER
5% OPERATION & MAINTENANCE OF PLANT
5% INSTITUTIONAL SUPPORT
24% MEDICAL RELATED
Uses of Funds
The University has a diversified revenue base. No single source generated more than 29% of the total fiscal year 2016 revenues of $5.0 billion.
The following table summarizes revenues from all sources for the years ended June 30, 2016, 2015 and 2014:
Grant RevenueOne of the largest sources of revenue (27%) continues to be grants and contracts. Total grants and contracts revenue increased $14 million, or 1%, in 2016, compared to an increase of $7 million, or 1%, in 2015.
While federal revenue saw an increase during fiscal year 2016 from several of the University’s top sponsors (National Science Foundation, Department of Defense, Department of Commerce), this increase was offset by a decrease in funding related to a significant federal flow-through relationship. During 2016, University researchers successfully completed the development and implementation of the Ocean Observatories Initiative’s Cabled Array, an underwater ocean observatory off the Pacific Northwest coast. In fiscal year 2015, the project generated $24.0 million in revenue, with a decline to $0.8 million as the project came to a close in fiscal year 2016.
Overall, consistent with fiscal year 2015, the slight decrease in federal grant and contract revenues was offset by increases in state and local, and nongovernmental, revenues. State and local revenues increased as a result of a boost in funding from the State Need Grant totaling $4.4 million. Nongovernmental revenue continued its five-year increasing trend, due to the cultivation of relationships with new sponsors and the addition of new grants and contracts related to the portfolios of long-standing sponsor relationships.
Grants and contracts provide the opportunity for graduate and undergraduate students to work with nationally recognized faculty in research as part of their educational experience.

UNIVERSITY OF WASHINGTON / 10
Unaudited – see accompanying notes to financial statements Unaudited – see accompanying notes to financial statements
MANAGEMENT’S DISCUSSION AND ANALYSIS (CONTINUED)
Tuition revenue increases were partially offset by an increase in scholarships and fellowships expense, and scholarship allowances of $12 million in 2016, $11 million in 2015, and $2 million in 2014.
Self-sustaining educational programs (fee-supported programs) include the following amounts for each of the fiscal years 2016, 2015 and 2014: UW Educational Outreach (the continuing education branch of the University) $108 million, $97 million and $96 million, respectively, summer quarter tuition $54 million, $59 million and $42 million, respectively, and for Business School and School of Medicine programs $50 million, $47 million and $45 million, respectively.
Patient Services–UW MedicineThe financial statements of the University include the operations of the School of Medicine, three hospitals, associated physician group and clinics, Airlift Northwest, and the University’s share of two joint ventures. These entities, together with Harborview Medical Center (not included in the University’s financial statements – see Note 13) comprise UW Medicine, an umbrella organization serving to coordinate these activities and promote quality healthcare in the Pacific Northwest and beyond, and to conduct cutting-edge medical research with worldwide benefit.
Patient care activities included in the University’s financial statements include:
UW Medical Center (UWMC) is a 529-bed hospital that provides comprehensive healthcare services to the Puget Sound community and patients from throughout the Pacific Northwest and beyond. UWMC also serves as the major clinical, teaching and research site for students and faculty in the Health Sciences at the University. Over 18,000 patients receive inpatient care at UWMC each year. Specialized inpatient care needs are met by the Cancer Center, the Regional Heart Center, the Neonatal Intensive Care Unit (NICU) and the Organ Transplantation program.
Valley Medical Center (VMC) is a 321-bed acute care hospital and network of clinics that treats over 17,000 inpatients per year, and is the oldest and largest public district hospital in the state of Washington. VMC joined UW Medicine in July, 2011. VMC’s Statements of Net Position and Statements of Revenues, Expenses and Changes in Net Position are presented in a discrete column together with NWH on the financial statements of the University.
Northwest Hospital & Medical Center (NWH) is a full-service medical facility with 281 beds, and treats approximately 10,000 inpatients per year. NWH joined UW Medicine in January, 2010. NWH’s Statements of Net Position and Statements of Revenues, Expenses and Changes in Net Position are presented in a discrete column together with VMC on the financial statements of the University.
Grant and contract revenue is earned when direct expenditures (such as researchers’ compensation or purchases of goods and services) are made; therefore, there is little effect on the University’s operating margin as a result of this direct expense reimbursement process.
Facility and administrative expenses necessary to support grants and contracts are reimbursed by sponsors, along with direct costs, by an indirect cost recovery. The current indirect cost recovery rate for research grants is approximately 29 cents on every direct expenditure dollar.
Primary Nongrant Funding SourcesThe University relies primarily on student tuition and fees and state appropriations as revenue sources to support its nongrant-funded educational operating expenses. State support for education has increased during the last few fiscal years, but is still significantly below historical levels.
Operating Support for Instruction(in millions) 2016 2015 2014
State operating appropriations $ 302 24% $ 255 22% $ 262 24%
Operating tuition and fees 661 53% 638
55% 594 54%
Fees for self-sustaining educational programs 288 23% 276
23% 245 22%
Total educational support $ 1,251 100% $ 1,169
100% $ 1,101
100%
Noncapital state appropriations are considered nonoperating revenue under GASB principles, and are reflected in the nonoperating section of the Statements of Revenues, Expenses and Changes in Net Position; however, they are used solely for operating purposes.
Total revenue from tuition and fees, net of scholarship allowances, increased to $949 million in fiscal year 2016, from $914 million in 2015 and $839 million in 2014. The 2016 increase was the result of enrollment growth, and moderate tuition and fee rate increases for most student groups. Full-time equivalent (FTE) enrollment in undergraduate tuition- and fee-based programs increased by 1.5% in the resident student category, and by 6.4% in the nonresident student category. FTE enrollment in graduate and professional tuition- and fee-based programs decreased by 1.7% in the resident student category and increased by 5.4% in the nonresident student category. Nonresident undergraduate tuition rates increased in 2016 by 2%, while graduate and professional tuition rate increases were generally in the 2-5% range, with variation by program and student residency. Rates for fee-based programs generally grew by 3-5%, with significant variation by program. These enrollment growth and tuition and fee rate increases were partially offset by a state legislatively mandated reduction in resident undergraduate tuition rates of 5% below the prior year.

FINANCIAL REPORT 2016 / 11
Unaudited – see accompanying notes to financial statements
Sources of Funds
7% STATE FUNDING FOR OPERATIONS AND CAPITAL EXPENDITURES
2% OTHER
29% PATIENT SERVICES27% GRANTS ANDCONTRACTS
4% GIFTS
1% INVESTMENT INCOME
7% AUXILIARY ENTERPRISES
4% SALES AND SERVICES OFEDUCATIONAL DEPARTMENTS 19% TUITION AND FEES
23% INSTRUCTION
15% RESEARCH
8% ACADEMIC SUPPORT
3% SCHOLARSHIPS &FELLOWSHIPS
8% AUXILIARY
7% DEPRECIATION/AMORTIZATION
2% OTHER
5% OPERATION & MAINTENANCE OF PLANT
5% INSTITUTIONAL SUPPORT
24% MEDICAL RELATED
Uses of Funds
UW Neighborhood Clinics (Neighborhood Clinics) is a network of clinics with 12 neighborhood locations throughout the greater Puget Sound area, providing primary, urgent and selected specialty care with a staff of 99 healthcare providers. The revenues, expenses, assets and liabilities of Neighborhood Clinics are included in the University’s financial statements.
UW Physicians (UWP) is the physician practice group for more than 1,800 faculty physicians and healthcare providers associated with UW Medicine. The revenues, expenses, assets and liabilities of UWP are included in the University’s financial statements.
Airlift Northwest is the preeminent provider of air medical transport services in the Pacific Northwest. The revenues, expenses, assets and liabilities of Airlift Northwest are included in the University’s financial statements.
The University is also a participant in two joint ventures: Seattle Cancer Care Alliance and Children’s University Medical Group. The University’s share of these activities is reflected in the University’s financial statements.
In combination, these organizations (not including VMC and NWH) contributed $1,435 million in patient services revenue in fiscal year 2016, $1,362 million in fiscal year 2015 and $1,207 million in fiscal year 2014. UWMC generated 75% of this revenue in 2016, 76% in 2015 and 77% in 2014. UWMC admissions exceeded 18,000 in 2016, a slight increase from 2015. Average patient length of stay was nearly 7.2 days, up from 7.0 days in 2015. The increase in patient services revenue during 2016 is partly due to higher capacity with the opening of three patient bed floors in the Montlake Tower, as well as strong case volumes in oncology, cardiology and neurosurgery.
Gifts, Endowments and Investment Revenues Net investment income for the years ended June 30, 2016, 2015 and 2014 consisted of the following:
(in millions) 2016 2015 2014
Interest and dividends $ 69 $ 66 $ 73
Metropolitan Tract net income 22 16 8
Seattle Cancer Care Alliance increase in equity
19 6 12
Net appreciation (depreciation) of fair value of investments
(54) 151 398
Investment expenses (11) (12) (10)
Net investment income $ 45 $ 227 $ 481
Net appreciation (depreciation) includes both realized and unrealized gains and losses. The unrealized gains, however, are not available until the underlying securities have been sold. Net investment income decreased by $182 million in 2016, compared to a decrease of $254 million in 2015. The change in realized and unrealized gains and losses was the major factor in the decrease for both years.
Donor support increased by $20 million, or 10%, to $220 million in 2016 from $200 million in 2015. Gifts are a key and necessary source of support for a variety of purposes including capital improvements, scholarships, research, and endowments for various academic and research positions.
ExpensesTwo primary functions of the University, instruction and research, comprised 38% of total operating expenses. These dollars provided instruction to nearly 56,000 students and funded over 5,000 research awards. Medical-related expenses, such as those related to patient care, also continue to be one of the largest individual components.

UNIVERSITY OF WASHINGTON / 12
Unaudited – see accompanying notes to financial statements Unaudited – see accompanying notes to financial statements
MANAGEMENT’S DISCUSSION AND ANALYSIS
(in millions) 2016 2015 2014Operating expenses: Educational and general instruction $ 1,172 $ 1,114 $ 1,037 Research 751 730 766 Public service 39 35 42 Academic support 398 337 297 Student services 47 43 43 Institutional support 267 223 224 Operation and maintenance of plant 239 241 201 Scholarships and fellowships 156 147 138 Auxiliary enterprises 422 302 286 Medical-related 1,218 1,193 1,042 Depreciation/amortization 325 311 308 Total operating expenses $ 5,034 $ 4,676 $ 4,384
A comparative summary of the University’s expenses by functional classification (purpose for which the costs are incurred) for the years ended June 30, 2016, 2015 and 2014 follows:
Overall, the University’s operating expenses increased by $358 million, or 8%, during 2016. Salaries expense increased $171 million, or 8%, due to employee merit increases and a modest increase in FTE’s. Expenses associated with employee benefits increased $99 million, or 15%, primarily due to higher costs paid by the University for employee healthcare ($70 million), together with an increase in pension-related expenses as calculated under GASB Statement No. 68 ($19 million).
In 2015, operating expenses increased by $292 million, or 7%, over the prior year. Salaries expense increased $166 million, or 8%, due to merit increases and a small increase in FTE’s. Despite an increase in the associated salaries, benefits expense decreased by $12 million, or 2%, due primarily to a reduction in pension expense as calculated under GASB Statement No. 68 when compared to the prior year, before implementation of the new accounting standard. Supplies and materials expense increased $44 million, or 11%, partly due to higher demand for medical supplies required by UWMC to support an increase in volumes related to patient care. Other operating expense increased by $35 million, or 34%, primarily due to increases in rental expense and costs associated with the University’s self-insurance program.
Operating LossThe University’s operating loss increased to $682 million in 2016, from $464 million in 2015. The 2015 operating loss was a slight decrease from $470 million in 2014. State appropriations are shown as nonoperating revenue, pursuant to GASB standards. If state appropriations were classified as operating revenue, the operating loss would have been $380 million in 2016, $209 million in 2015 and $208 million in 2014. The University continues to rely on nonoperating revenues such as gift revenues and investment income distributions, in addition to state appropriations, to fund its operations.
1.9
Moody’s Public Universities
(Aaa median 2015)
Moody’s Public Universities
(Aaa median 2015)
Moody’s Public Universities
(Aaa median 2015)
Moody’s Public Universities
(Aaa median 2015)
2016 20142015
Spendable Cash and Investments to Total Debt
1.6
9.5
2.7
3.0
2.5
2.0
1.5
1.0
0.5
0.0
1.7
0.9
YEA
RS
OF
CO
VER
AG
ER
AT
IOR
AT
IOR
AT
IO
2016 20142015
Spendable Cash and Investmentsto Operating Expenses
0.8
9.5
1.4
1.6
1.4
1.2
1.0
0.8
0.6
0.4
0.2
0.0
0.9
0.4
2016 20142015
Total Debt to Operating Revenue
0.5
9.5
0.5
0.6
0.5
0.4
0.3
0.2
0.1
0.0
0.5
3.3 3.1
2016 20142015
Annual Debt Service Coverage
2.2
9.5
4.04.0
3.0
2.0
1.0
0.0
0.5
The ratio of spendable cash and investments to operating expenses (as defined by Moody’s Investors Service) measures the strength of available resources to cover annual operating expenses. This ratio, illustrated in the chart below, shows that in 2016 the University had sufficient available resources to fund operations for a period of 9.6 months.

FINANCIAL REPORT 2016 / 13
Unaudited – see accompanying notes to financial statements

UNIVERSITY OF WASHINGTON / 14
STATEMENTS OF NET POSITION
UNIVERSIT Y OF WA SHINGTON
DISCRETE COMPONENT
UNITS 1
ASSETS AND DEFERRED OUTFLOWS OF RESOURCES
CURRENT ASSETS:CASH AND CASH EQUIVALENTS (NOTE 2) $ 93,485 $ 82,905 $ 63,998 $ 39,960
INVESTMENTS, CURRENT PORTION (NOTE 6) 700,821 679,505 16,460 24,477
ACCOUNTS RECEIVABLE (NET OF ALLOWANCE OF $58,643 AND $66,902) (NOTE 5) 687,248 596,453 120,361 110,297
OTHER CURRENT ASSETS 57,262 43,459 64,854 63,444
TOTAL CURRENT ASSETS 1,538,816 1,402,322 265,673 238,178
NONCURRENT ASSETS:DEPOSIT WITH STATE OF WASHINGTON (NOTE 3) 59,929 51,647 – –
INVESTMENTS, NET OF CURRENT PORTION (NOTE 6) 4,108,149 4,297,157 56,229 66,168
METROPOLITAN TRACT (NOTE 7) 133,525 121,146 – –
STUDENT LOANS RECEIVABLE (NET OF ALLOWANCE OF $6,209 AND $4,974) (NOTE 4) 71,721 73,384 – –
DUE FROM DISCRETE COMPONENT UNITS 84,946 93,240 – –
OTHER NONCURRENT ASSETS 156,726 150,323 129,118 110,753
CAPITAL ASSETS (NET OF ACCUMULATED DEPRECIATION OF $3,798,831 AND $3,566,289) (NOTE 8) 4,353,141 4,172,378 461,017 467,701
TOTAL NONCURRENT ASSETS 8,968,137 8,959,275 646,364 644,622
TOTAL ASSETS 10,506,953 10,361,597 912,037 882,800
DEFERRED OUTFLOWS OF RESOURCES: UNAMORTIZED LOSS ON BOND REFUNDING 23,465 25,813 6,066 6,435
PENSION-RELATED DEFERRED OUTFLOWS (NOTE 15) 155,890 85,602 – –
TOTAL DEFERRED OUTFLOWS OF RESOURCES 179,355 111,415 6,066 6,435
TOTAL ASSETS AND DEFERRED OUTFLOWS OF RESOURCES $ 10,686,308 $ 10,473,012 $ 918,103 $ 889,235
LIABILITIES AND DEFERRED INFLOWS OF RESOURCES
CURRENT LIABILITIES:ACCOUNTS PAYABLE AND ACCRUED LIABILITIES $ 652,471 $ 626,085 $ 136,970 $ 121,160
UNEARNED REVENUES 173,379 155,114 – –
OTHER CURRENT LIABILITIES 97,170 92,982 16,932 11,743
LONG-TERM LIABILITIES, CURRENT PORTION (NOTES 9-11) 137,036 124,137 13,619 9,001
TOTAL CURRENT LIABILITIES 1,060,056 998,318 167,521 141,904
NONCURRENT LIABILITIES:
U.S. GOVERNMENT GRANTS REFUNDABLE 58,754 51,985 – –
DUE TO PRIMARY GOVERNMENT – – 84,946 93,240
LONG-TERM LIABILITIES, NET OF CURRENT PORTION (NOTES 9-11) 2,676,019 2,484,522 307,901 320,232
NET PENSION LIABILITY (NOTE 15) 805,174 622,589 – –
TOTAL NONCURRENT LIABILITIES 3,539,947 3,159,096 392,847 413,472
TOTAL LIABILITIES 4,600,003 4,157,414 560,368 555,376
DEFERRED INFLOWS OF RESOURCES:PROPERTY TAXES – – 26,744 9,625
PENSION-RELATED DEFERRED INFLOWS (NOTE 15) 122,417 269,135 – –
TOTAL DEFERRED INFLOWS OF RESOURCES 122,417 269,135 26,744 9,625
TOTAL LIABILITIES AND DEFERRED INFLOWS OF RESOURCES 4,722,420 4,426,549 587,112 565,001
NET POSITION
NET INVESTMENT IN CAPITAL ASSETS 2,277,608 2,156,229 71,275 67,033
RESTRICTED:
NONEXPENDABLE 1,419,311 1,321,979 1,927 1,943
EXPENDABLE 1,591,440 1,699,135 8,788 8,471
UNRESTRICTED 675,529 869,120 249,001 246,787
TOTAL NET POSITION 5,963,888 6,046,463 330,991 324,234
TOTAL LIABILITIES, DEFERRED INFLOWS OF RESOURCES AND NET POSITION $ 10,686,308 $ 10,473,012 $ 918,103 $ 889,235
UNIVERSIT Y OF WA SHINGTON
1 See Note 18
See accompanying notes to financial statements.
Dollars in thousands
June 30, June 30, 2016 2015 2016 2015

FINANCIAL REPORT 2016 / 15
REVENUES
OPERATING REVENUES:
STUDENT TUITION AND FEES (NET OF SCHOLARSHIP ALLOWANCE OF $144,543 AND $142,685) $ 948,751 $ 914,419 $ – $ –
NET PATIENT SERVICE REVENUES (NET OF PROVISION FOR UNCOLLECTIBLE ACCOUNTS OF $17,219 AND $15,947) 1,434,696 1,362,279 877,461 822,421
FEDERAL GRANTS AND CONTRACTS 990,396 999,189 – –
STATE AND LOCAL GRANTS AND CONTRACTS 90,213 87,629 – –
NONGOVERNMENTAL GRANTS AND CONTRACTS 213,834 193,840 – –
SALES AND SERVICES OF EDUCATIONAL DEPARTMENTS 224,747 223,494 – –
AUXILIARY ENTERPRISES: –
HOUSING AND FOOD SERVICES 114,448 111,531 – –
SPORTS PROGRAMS (NET OF SCHOLARSHIP ALLOWANCE OF $8,231 AND $6,495) 62,690 67,727 – –
OTHER AUXILIARY ENTERPRISES 171,712 139,974 – –
OTHER MEDICAL-RELATED REVENUE 51,001 45,157 45,633 53,165
OTHER OPERATING REVENUE 49,841 66,340 – –
TOTAL OPERATING REVENUES 4,352,329 4,211,579 923,094 875,586
EXPENSES
OPERATING EXPENSES (NOTE 12):
SALARIES 2,363,848 2,192,781 422,294 384,254
BENEFITS 749,407 649,923 103,837 99,346
SCHOLARSHIPS AND FELLOWSHIPS 155,449 146,570 – –
UTILITIES 51,421 60,454 8,673 8,480
SUPPLIES AND MATERIALS 481,428 463,624 138,058 161,694
PURCHASED SERVICES 750,078 707,678 158,279 142,741
DEPRECIATION/AMORTIZATION 324,602 310,960 46,822 49,238
OTHER 157,932 144,087 55,993 20,048
TOTAL OPERATING EXPENSES 5,034,165 4,676,077 933,956 865,801
OPERATING INCOME (LOSS) (681,836) (464,498) (10,862) 9,785
NONOPERATING REVENUES (EXPENSES)
STATE APPROPRIATIONS 302,097 255,156 – –
GIFTS 115,000 115,636 297 342
INVESTMENT INCOME (NET OF INVESTMENT EXPENSE OF $10,871 AND $11,741) 44,877 227,404 7,182 4,385
INTEREST ON CAPITAL ASSET-RELATED DEBT (72,678) (79,259) (22,023) (23,004)
PELL GRANT REVENUE 47,699 48,471 – –
PROPERTY TAX REVENUE – – 19,902 18,132
OTHER NONOPERATING REVENUES 13,133 22,273 12,475 630
NET NONOPERATING REVENUES 450,128 589,681 17,833 485
INCOME (LOSS) BEFORE OTHER REVENUES (231,708) 125,183 6,971 10,270
CAPITAL APPROPRIATIONS 39,221 20,812 – –
CAPITAL GRANTS, GIFTS AND OTHER 21,645 21,986 (214) 2
GIFTS TO PERMANENT ENDOWMENTS 88,267 67,359 – 167
TOTAL OTHER REVENUES 149,133 110,157 (214) 169
INCREASE (DECREASE) IN NET POSITION (82,575) 235,340 6,757 10,439
NET POSITION
NET POSITION – BEGINNING OF YEAR (NOTE 1) 6,046,463 5,811,123 324,234 313,795
NET POSITION – END OF YEAR $ 5,963,888 $ 6,046,463 $ 330,991 $ 324,234
STATEMENTS OF REVENUES, EXPENSES AND CHANGES IN NET POSITION
UNIVERSIT Y OF WA SHINGTON
1 See Note 18
See accompanying notes to financial statements.
Dollars in thousands
DISCRETE COMPONENT
UNITS 1
UNIVERSIT Y OF WA SHINGTON
Year ended June 30, Year ended June 30,2016 2015 2016 2015
UNIVERSITY OF WASHINGTON / 16
STATEMENTS OF CASH FLOWS
UNIVERSIT Y OF WA SHINGTON
CASH FLOWS FROM OPERATING ACTIVITIES
STUDENT TUITION AND FEES $ 913,941 $ 882,465
PATIENT SERVICES 1,449,111 1,328,801
GRANTS AND CONTRACTS 1,317,899 1,291,442
PAYMENTS TO SUPPLIERS (469,826) (466,542)
PAYMENTS FOR UTILITIES (51,952) (60,056)
PURCHASED SERVICES (740,575) (708,302)
OTHER OPERATING DISBURSEMENTS (153,006) (139,559)
PAYMENTS TO EMPLOYEES (2,357,060) (2,186,431)
PAYMENTS FOR BENEFITS (683,786) (588,216)
PAYMENTS FOR SCHOLARSHIPS AND FELLOWSHIPS (155,449) (146,570)
LOANS ISSUED TO STUDENTS (14,474) (24,858)
COLLECTION OF LOANS TO STUDENTS 22,906 23,530
OTHER MEDICAL CENTER RECEIPTS 51,001 45,157
AUXILIARY ENTERPRISE RECEIPTS 347,924 305,523
SALES AND SERVICES OF EDUCATIONAL DEPARTMENTS 222,515 220,004
RECEIPTS FROM OUTSIDE AFFILIATED AGENCIES 766,993 714,996
DISBURSEMENTS TO OUTSIDE AFFILIATED AGENCIES (757,478) (712,292)
OTHER RECEIPTS 37,227 91,322
NET CASH USED BY OPERATING ACTIVITIES (254,089) (129,586)
CASH FLOWS FROM NONCAPITAL FINANCING ACTIVITIES
STATE APPROPRIATIONS 304,786 255,613
GIFTS AND GRANTS FOR OTHER THAN CAPITAL PURPOSES 47,699 48,471
PRIVATE GIFTS 95,519 91,574
PERMANENT ENDOWMENT RECEIPTS 88,267 67,359
DIRECT LENDING RECEIPTS 219,000 239,000
DIRECT LENDING DISBURSEMENTS (231,295) (240,607)
TRANSFERS (TO) FROM COMPONENT UNITS 6,143 (100,945)
OTHER 15,387 65,744
NET CASH PROVIDED BY NONCAPITAL FINANCING ACTIVITIES 545,506 426,209
CASH FLOWS FROM CAPITAL AND RELATED FINANCING ACTIVITIES
PROCEEDS FROM CAPITAL DEBT 388,420 450,469
STATE CAPITAL APPROPRIATIONS 41,078 20,928
CAPITAL GRANTS AND GIFTS RECEIVED 20,499 21,651
ACQUISITION AND CONSTRUCTION OF CAPITAL ASSETS (471,545) (432,885)
PRINCIPAL PAYMENTS ON CAPITAL-RELATED DEBT AND LEASES (234,825) (386,874)
INTEREST PAYMENTS ON CAPITAL-RELATED DEBT AND LEASES (79,780) (98,911)
OTHER (7,407) 5,427
NET CASH USED BY CAPITAL AND RELATED FINANCING ACTIVITIES (343,560) (420,195)
UNIVERSIT Y OF WA SHINGTON
Year Ended June 30,
2016 2015

FINANCIAL REPORT 2016 / 17
See accompanying notes to financial statements.
Dollars in thousands
CASH FLOWS FROM INVESTING ACTIVITIES
PROCEEDS FROM SALES OF INVESTMENTS 8,495,341 6,931,799
DISBURSEMENTS FOR PURCHASES OF INVESTMENTS (8,512,358) (6,874,325)
INVESTMENT INCOME 79,740 69,875
NET CASH PROVIDED BY INVESTING ACTIVITIES 62,723 127,349
NET INCREASE IN CASH AND CASH EQUIVALENTS 10,580 3,777
CASH AND CASH EQUIVALENTS-BEGINNING OF THE YEAR 82,905 79,128
CASH AND CASH EQUIVALENTS-END OF THE YEAR $ 93,485 $ 82,905
RECONCILIATION OF OPERATING LOSS TO NET CASH USED BY OPERATING ACTIVITIES
OPERATING LOSS $ (681,836) $ (464,498)
ADJUSTMENTS TO RECONCILE OPERATING LOSS TO NET CASH USED BY OPERATING ACTIVITIES:
DEPRECIATION/AMORTIZATION EXPENSE 324,602 310,960
CHANGES IN ASSETS AND LIABILITIES:
RECEIVABLES 10,625 (13,716)
OTHER ASSETS (17,749) (39,571)
PENSION-RELATED DEFERRED INFLOWS AND OUTFLOWS OF RESOURCES (217,007) 264,460
NET PENSION LIABILITY 182,585 (289,763)
ACCOUNTS PAYABLE AND ACCRUED LIABILITIES 66,750 24,763
UNEARNED REVENUE 18,265 (10,813)
OTHER LONG-TERM LIABILITIES 51,244 89,920
U.S. GOVERNMENTAL GRANTS REFUNDABLE 6,769 (442)
LOANS TO STUDENTS 1,663 (886)
NET CASH USED BY OPERATING ACTIVITIES $ (254,089) $ (129,586)
NONCASH INVESTING, CAPITAL AND FINANCING ACTIVITIES
STOCK GIFTS $ 19,481 $ 24,062
INCREASE IN INTEREST IN SEATTLE CANCER CARE ALLIANCE 18,932 6,319
NET UNREALIZED GAINS (LOSSES) (94,881) 79,724
TOTAL NONCASH INVESTING, CAPITAL AND FINANCING ACTIVITIES $ (56,468) $ 110,105
UNIVERSIT Y OF WA SHINGTON
Year Ended June 30,
2016 2015
NOTES TO FINANCIAL STATEMENTS
UNIVERSITY OF WASHINGTON / 18
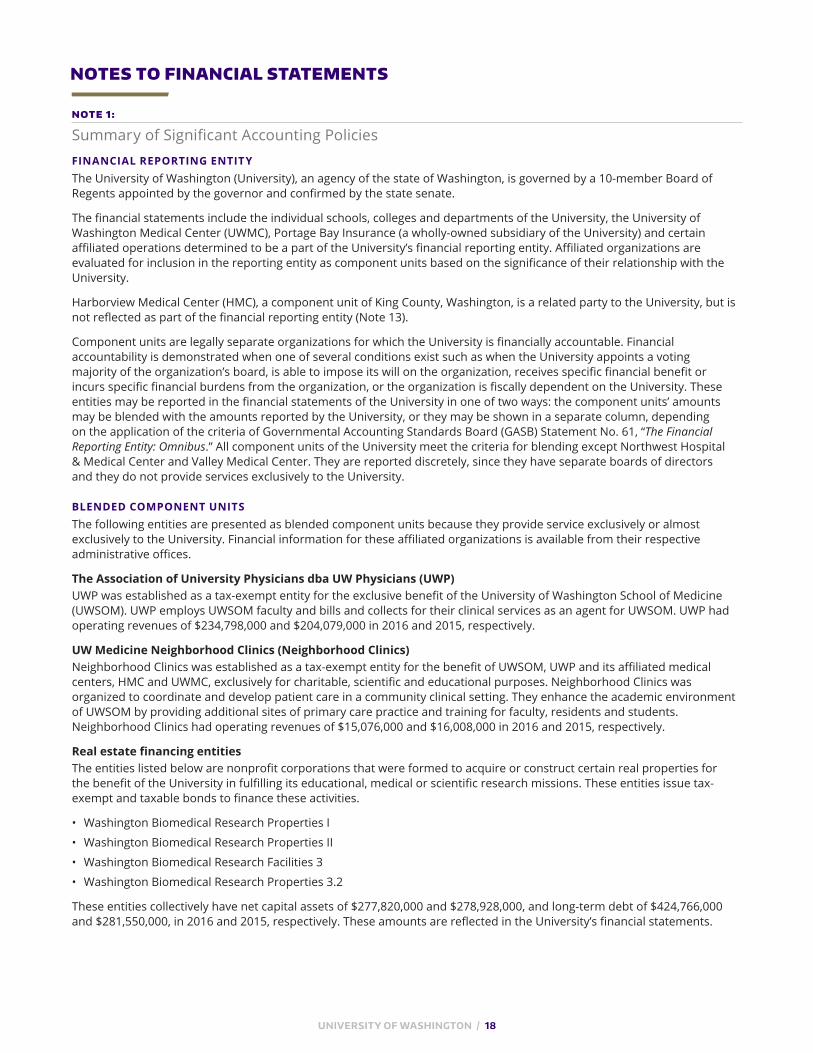
NOTE 1:
Summary of Significant Accounting PoliciesFINANCIAL REPORTING ENTITYThe University of Washington (University), an agency of the state of Washington, is governed by a 10-member Board of Regents appointed by the governor and confirmed by the state senate.
The financial statements include the individual schools, colleges and departments of the University, the University of Washington Medical Center (UWMC), Portage Bay Insurance (a wholly-owned subsidiary of the University) and certain affiliated operations determined to be a part of the University’s financial reporting entity. Affiliated organizations are evaluated for inclusion in the reporting entity as component units based on the significance of their relationship with the University.
Harborview Medical Center (HMC), a component unit of King County, Washington, is a related party to the University, but is not reflected as part of the financial reporting entity (Note 13).
Component units are legally separate organizations for which the University is financially accountable. Financial accountability is demonstrated when one of several conditions exist such as when the University appoints a voting majority of the organization’s board, is able to impose its will on the organization, receives specific financial benefit or incurs specific financial burdens from the organization, or the organization is fiscally dependent on the University. These entities may be reported in the financial statements of the University in one of two ways: the component units’ amounts may be blended with the amounts reported by the University, or they may be shown in a separate column, depending on the application of the criteria of Governmental Accounting Standards Board (GASB) Statement No. 61, “The Financial Reporting Entity: Omnibus.” All component units of the University meet the criteria for blending except Northwest Hospital & Medical Center and Valley Medical Center. They are reported discretely, since they have separate boards of directors and they do not provide services exclusively to the University.
BLENDED COMPONENT UNITSThe following entities are presented as blended component units because they provide service exclusively or almost exclusively to the University. Financial information for these affiliated organizations is available from their respective administrative offices.
The Association of University Physicians dba UW Physicians (UWP)UWP was established as a tax-exempt entity for the exclusive benefit of the University of Washington School of Medicine (UWSOM). UWP employs UWSOM faculty and bills and collects for their clinical services as an agent for UWSOM. UWP had operating revenues of $234,798,000 and $204,079,000 in 2016 and 2015, respectively.
UW Medicine Neighborhood Clinics (Neighborhood Clinics)Neighborhood Clinics was established as a tax-exempt entity for the benefit of UWSOM, UWP and its affiliated medical centers, HMC and UWMC, exclusively for charitable, scientific and educational purposes. Neighborhood Clinics was organized to coordinate and develop patient care in a community clinical setting. They enhance the academic environment of UWSOM by providing additional sites of primary care practice and training for faculty, residents and students. Neighborhood Clinics had operating revenues of $15,076,000 and $16,008,000 in 2016 and 2015, respectively.
Real estate financing entitiesThe entities listed below are nonprofit corporations that were formed to acquire or construct certain real properties for the benefit of the University in fulfilling its educational, medical or scientific research missions. These entities issue tax-exempt and taxable bonds to finance these activities.
• Washington Biomedical Research Properties I
• Washington Biomedical Research Properties II
• Washington Biomedical Research Facilities 3
• Washington Biomedical Research Properties 3.2
These entities collectively have net capital assets of $277,820,000 and $278,928,000, and long-term debt of $424,766,000 and $281,550,000, in 2016 and 2015, respectively. These amounts are reflected in the University’s financial statements.

FINANCIAL REPORT 2016 / 19
DISCRETELY PRESENTED COMPONENT UNITSNorthwest Hospital UW Medicine and Northwest Hospital & Medical Center (NWH), a 281-bed full-service acute care hospital, have been affiliated since January 1, 2010. The University is the sole corporate member of NWH. The audited financial statements of NWH are available by contacting Northwest Hospital & Medical Center at 1550 N. 115th Street, Seattle, Washington 98133-9733, Mailstop X-112.
Valley Medical Center UW Medicine and Public Hospital District No. 1 of King County, a Washington public hospital district dba Valley Medical Center (VMC), have had a strategic alliance since July 1, 2011. Valley Medical Center owns and operates a 321-bed full-service acute care hospital and 45 clinics located throughout southeast King County. The audited financial statements of VMC are available by contacting Valley Medical Center at 400 S. 43rd Street, Renton, Washington 98055 or online at the following address: www.valleymed.org/about-us/financial-information/.
JOINT VENTURES The University, together with Seattle Children’s Hospital and Fred Hutchinson Cancer Research Center, established the Seattle Cancer Care Alliance (SCCA). The SCCA integrates the cancer research, teaching and clinical cancer programs of all three institutions to provide state-of-the-art cancer care. Each member of the SCCA has a one-third interest. The University accounts for its interest in SCCA under the equity method and has recorded $126,636,000 and $107,704,000 in Other Assets, together with $18,932,000 and $6,319,000 in Investment Income, for its share of the joint venture in 2016 and 2015, respectively.
The University and Seattle Children’s Hospital established Children’s University Medical Group (CUMG) to assist the organizations in carrying out their pediatric patient care, charitable, educational, and scientific missions. CUMG employs UWSOM faculty physicians, and bills and collects for their services as an agent for UWSOM. The University records revenue from CUMG based on the income distribution plan effective December 31, 2008. The University’s patient services receivable (Note 5) includes amounts due from CUMG of $16,905,000 and $18,852,000 in 2016 and 2015, respectively.
CHANGES IN REPORTING ENTITY In fiscal year 2016, Washington Biomedical Research Properties 3.2 began operations and commenced construction of facilities that will be utilized by the University to fulfill its mission. Based on its relationship with the University, management has determined that it meets the criteria of a blended component unit for presentation in the University’s financial statements. As such, its financial activities are aggregated with those of the University and intra-entity transactions have been eliminated.
BASIS OF ACCOUNTINGThe financial statements of the University have been prepared in accordance with GASB Statement No. 34, “Basic Financial Statements — and Management’s Discussion and Analysis — for State and Local Governments,” as amended by GASB Statement No. 35, “Basic Financial Statements — and Management’s Discussion and Analysis — for Public Colleges and Universities.” The University is reporting as a special-purpose government engaged in business-type activities (BTA). In accordance with BTA reporting, the University presents Management’s Discussion and Analysis, Statements of Net Position, Statements of Revenues, Expenses and Changes in Net Position, Statements of Cash Flows and Notes to the Financial Statements. The financial statements are prepared using the economic resources measurement focus and the accrual basis of accounting.
Under the accrual basis of accounting, revenues are recognized when earned, and expenses are recorded when an obligation has been incurred. Significant intra-agency transactions have been eliminated. The University reports capital assets net of accumulated depreciation/amortization (as applicable), and reports depreciation/amortization expense in the Statements of Revenues, Expenses and Changes in Net Position.
On July 1, 2014, the University adopted GASB Statement No. 68, “Accounting and Financial Reporting for Pensions.” This Statement requires governments providing defined benefit pensions to their employees to recognize their proportionate share of the pension plan’s net pension liability or net pension asset, which is measured as the total pension liability less the amount of the pension plan’s fiduciary net position. The total pension liability is determined by discounting projected benefit payments based on the benefit terms and legal agreements existing at the pension plan’s fiscal year end. This Statement requires that most changes in the net pension liability be included in pension expense in the period of the change. Prior to adopting this Statement, the University reported pension expense based on cash contributions paid to

NOTES TO FINANCIAL STATEMENTS
UNIVERSITY OF WASHINGTON / 20
(CONTINUED)
the pension plan administrator. In addition to the reporting changes described above, implementation of this Statement resulted in the restatement of fiscal year 2015 beginning unrestricted net position, reducing it by $831,426,000. Below is a reconciliation of total net position as previously reported at June 30, 2014, to the restated net position.
(Dollars in thousands)
NET POSITION AT JUNE 30, 2014, AS PREVIOUSLY REPORTED $ 6,642,549ADOPTION OF GASB STATEMENT NO. 68 (831,426)
NET POSITION AT JULY 1, 2014, AS RESTATED $ 5,811,123
On July 1, 2014, the University adopted GASB Statement No. 69, “Government Combinations and Disposals of Government Operations.” This Statement requires disclosures to be made about government combinations and disposals of government operations, in order to enable financial statement users to evaluate the nature and financial effects of those transactions. There was no impact to the financial statements of the University as a result of implementing this Statement.
On July 1, 2014, the University adopted GASB Statement No. 71, “Pension Transition for Contributions Made Subsequent to the Measurement Date,” an amendment of GASB Statement No. 68, “Accounting and Financial Reporting for Pensions.” The purpose of this Statement is to address application of the transition provisions of GASB Statement No. 68, and to clarify guidance regarding contributions made by a state or local government employer, or nonemployer contributing entity, to a defined benefit pension plan after the measurement date of the government’s beginning net pension liability. Implementation of this Statement impacted the restatement of fiscal year 2015 beginning unrestricted net position required by GASB Statement No. 68, reducing it by $80,926,000.
On July 1, 2015, the University adopted GASB Statement No. 72 “Fair Value Measurement and Application”. This Statement provides guidance for determining a fair value measurement for financial reporting purposes. It also provides guidance for applying fair value to certain investments and disclosures related to all fair value measurements. The Statement establishes a three-level hierarchy of inputs to valuation techniques used to measure fair value and requires disclosures to be made about fair value measurements, the level of fair value hierarchy, and valuation techniques. There was no impact to the fair value measurements presented in the Statements of Net Position or Statements of Revenues, Expenses and Changes in Net Position of the University as a result of implementing this Statement. University disclosures related to fair value measurement, however, have been updated where necessary (Note 6).
On July 1, 2015, the University adopted the portion of the guidance in GASB Statement No. 73, “Accounting and Financial Reporting for Pensions and Related Assets That Are Not within the Scope of GASB Statement 68, and Amendments to Certain Provisions of GASB Statements 67 and 68” that pertains to amendments to Statement No. 68. There was no impact to the financial statements of the University as a result of implementing this portion of the Statement.
On July 1, 2015, the University adopted Statement No. 76, “The Hierarchy of Generally Accepted Accounting Principles for State and Local Governments”. This Statement reduces the GAAP hierarchy to two categories of authoritative GAAP and addresses the use of authoritative and nonauthoritative literature in the event that the accounting treatment for a transaction or other event is not specified within a source of authoritative GAAP. There was no impact to the financial statements of the University as a result of implementing this Statement.
On July 1, 2015, the University adopted GASB Statement No. 82, “Pension Issues—an amendment of GASB Statements No. 67, No. 68, and No. 73”. This Statement addresses issues regarding (1) the presentation of payroll-related measures in required supplementary information, (2) the selection of assumptions and the treatment of deviations from the guidance of Actuarial Standard of Practice for financial reporting purposes, and (3) the classification of payments made by employers to satisfy employee (plan member) contribution requirements. The University either already complies with, or is unaffected by, the topics addressed by this Statement, therefore, there was no impact to the University’s financial statements, note disclosures or required supplementary information as a result of implementation.
ACCOUNTING STANDARDS IMPACTING THE FUTURE In June 2015, the GASB issued Statement No. 73, “Accounting and Financial Reporting for Pensions and Related Assets That Are Not within the Scope of GASB Statement 68, and Amendments to Certain Provisions of GASB Statements 67 and 68”. The portion of this guidance pertaining to pension plans not within the scope of Statement No. 68 will be effective for the fiscal year ending June 30, 2017. The guidance is intended to improve the financial reporting of governments whose employees are provided with pensions that are not within the scope of Statement No. 68, and improve the usefulness of information associated with governments that hold assets accumulated for purposes of providing defined benefit pensions not within the scope of Statement No. 68. The University of Washington Supplemental Retirement Plan (UWSRP, Note 15) does not currently fall within the scope of GASB 68 since the assets set aside to pay retiree benefits have not been segregated and

FINANCIAL REPORT 2016 / 21
restricted in a trust or equivalent arrangement. Implementing this Statement will require that the University recognize the remaining unamortized pension plan liability for the UWSRP, together with any associated deferred inflows and deferred outflows of resources, and to restate net position for all periods presented.
In June 2015, the GASB issued Statement No. 75, “Accounting and Financial Reporting for Postemployment Benefits Other Than Pensions” (OPEB), which will be effective for the fiscal year ending June 30, 2018. This Statement establishes standards of accounting and financial reporting for defined benefit OPEB and defined contribution OPEB that are provided to the employees of state and local governmental employers through plans that are administered through trusts or equivalent arrangements. This Statement also establishes standards of accounting and financial reporting for OPEB plans that are not administered through trusts or equivalent arrangements. The University’s participation in OPEB is described in Note 14, and does not currently impact the University’s financial statements. As a result of implementing this Statement, the University will be required to recognize its proportionate share of the state’s actuarially determined OPEB liability, net of any assets segregated and restricted in a qualified trust, together with any associated deferred inflows and deferred outflows of resources, benefit expense related to the plan, and to restate net position for all periods presented.
In August 2015, the GASB issued Statement No. 77, “Tax Abatement Disclosures”, which will be effective for the fiscal year ending June 30, 2017. This Statement defines a tax abatement as resulting from an agreement between a government and an individual or entity in which the government promises to forgo tax revenues, and in exchange, the individual or entity promises to subsequently take a specific action that contributes to economic development or otherwise benefits the government or its citizens. This Statement requires governments that enter into tax abatement agreements to disclose information about these agreements. VMC, a discretely presented component unit of the University, is the only organization within the University’s financial reporting entity that receives tax revenues. VMC does not enter into tax abatement agreements, therefore, implementation of this Statement is not expected to have an impact on the financial statements of the University.
In January 2016, the GASB issued Statement No. 80, “Blending Requirements for Certain Component Units”, which will be effective for the fiscal year ending June 30, 2017. This Statement amends requirements for the financial statement presentation of component units of all state and local governments. New criteria will require presenting a component unit’s balances and activities blended with the primary government, and the elimination of intra-entity transactions, when the component unit is incorporated as a not-for-profit corporation and the primary government is the corporation’s sole corporate member. The University is the sole corporate member of NWH, which is currently presented as a discretely presented component unit. Implementation of this Statement will require that the University begin reflecting NWH as a blended component unit, beginning in the fiscal year ending June 30, 2017.
In March 2016, the GASB issued Statement No. 81, “Irrevocable Split-Interest Agreements”, which will be effective for the fiscal year ending June 30, 2018. Irrevocable split-interest agreements are a specific type of giving arrangement used by donors to provide resources to two or more beneficiaries, including governments. This Statement requires that a government that receives resources pursuant to an irrevocable split-interest agreement recognize assets, liabilities, and deferred inflows of resources at the inception of the agreement. Implementation of this Statement will require the University to report its beneficial interest in irrevocable split-interest agreements, including those held by an intermediary such as an outside trust. The University has lead income rights in many outside trusts. This Statement will require that the beneficial interest received be initially recorded at fair value as a deferred inflow of resources, and then revalued at the end of each financial reporting period with the change in fair value recognized as revenue. The University currently reports revenue based on income distributions received.
USE OF ESTIMATESThe preparation of financial statements in conformity with U.S. Generally Accepted Accounting Principles involves management estimates that affect the reported amounts of assets, liabilities, deferrals, revenues and expenses during the reporting period. Actual results could differ from those estimates; however, in each case, the University believes that allowances, reserves and estimates of expected liabilities are adequate.
The University estimates the pollution remediation liability (Note 9) by reviewing the current status of known polluted sites and developing estimates of cleanup costs. These estimates are subject to change due to improvements in technology, inflation, changes in the scope of work, and the pursuit of reimbursement from other responsible parties.
Allowances (Notes 4 and 5) are estimates based on the historical experience of the University and current economic circumstances with respect to the collectability of accounts and loans receivable.

NOTES TO FINANCIAL STATEMENTS
UNIVERSITY OF WASHINGTON / 22
(CONTINUED)
The University’s share of pension plan assets, liabilities, deferrals and expenses related to the plans administered by the Washington Department of Retirement Systems, and the liability and expense related to the UWSRP (Note 15), are based on actuarial valuations prepared by an external actuary. The results of an actuarial valuation are estimates based on historical data, actuarial assumptions, and the demographics of the employee population.
The self-insurance reserve (Note 16) is estimated through an externally prepared actuarial calculation using individual case-basis valuations and statistical analyses. Considerable variability is inherent in such estimates.
OTHER ACCOUNTING POLICIESInvestments. Investments are generally carried at fair value. The fair value of all debt and equity securities with a readily determinable fair value is based on quotations from major securities exchanges. Alternative investments, which are not readily marketable, are carried at the estimated fair values provided by the investment managers. The University reviews and evaluates the values provided by the investment managers and agrees with the valuation methods and assumptions used in determining the fair value of the alternative investments. Those estimated fair values may differ significantly from the values that would have been used had a ready market for these securities existed.Investments under long-term strategies are considered noncurrent. Short-term investments consist primarily of cash equivalents and fixed income vehicles which management has identified as available to meet the day-to-day obligations of the University.
Inventories. Inventories are carried at the lower of cost or market value and are reflected on the Statements of Net Position in Other Current Assets. Consumable inventories, consisting of expendable materials and supplies, are generally valued using the weighted-average method. Merchandise inventories are generally valued using the first-in, first-out method.
Capital Assets. Land, buildings, equipment, library books and intangibles are stated at cost or, if acquired by gift, at fair market value at the date of the gift. Additions, replacements, major repairs and renovations are capitalized. Depreciation and amortization are computed using the straight-line method over the estimated useful lives of the assets, generally 15 to 50 years for building components, 20 to 50 years for infrastructure and land improvements, 5 to 7 years for equipment, 15 years for library books, and 3 to 15 years for intangibles.
Capital assets which are financed by capital leases are depreciated in the same manner as other capital assets.
Interest incurred on capital asset-related debt was $85,856,000 and $86,931,000 during 2016 and 2015, respectively. The University capitalized $13,178,000 and $7,672,000 of this cost during 2016 and 2015, respectively.
Unearned Revenues. Unearned revenues occur when funds have been collected in advance of when the associated goods or services have been provided, such as advance ticket sales, summer quarter tuition and unspent cash advances on certain grants.
Cost-Sharing Pension Plans. The net pension asset or liability is measured as the University’s proportionate share of the collective total pension liability, less the fiduciary net position, of the cost-sharing pension plans in which the University participates. The total pension liability is determined by discounting projected benefit payments based on the benefit terms and legal agreements existing at the pension plan’s fiscal year-end. Projected benefit payments are required to be discounted using a single rate that reflects the expected rate of return on investments, to the extent that plan assets are available to pay benefits. The University’s proportionate share is determined based on the relationship of University contributions to total contributions to the plan by all participating employers. Pension expense is recognized for benefits earned during the period, interest on the unfunded liability and changes in benefit terms. Differences between expected and actual experience, and changes in assumptions about future economic or demographic factors, are reported as deferred inflows of resources or deferred outflows of resources, and are recognized over the average expected remaining service period for employees eligible for pension benefits. Differences between expected and actual investment returns are reported as deferred inflows of resources or deferred outflows of resources, and are recognized over five years. Contributions made to the plan subsequent to the measurement date and prior to the University’s fiscal year-end are reported as a deferred outflow of resources, and recognized in the subsequent fiscal year. The measurement date for the cost-sharing plans in which the University participates is June 30 of the prior fiscal year.
Split-Interest Agreements. Under such agreements, donors/beneficiaries receive income for their lifetime or for a stated term, with the University receiving the remaining principal. The University records an asset related to these agreements at fair market value at year-end. The University also records a liability related to the split-interest agreements equal to the present value of expected future distributions; the discount rates applied range from 3.4% to 7.5%.

FINANCIAL REPORT 2016 / 23
Compensated Absences. University employees accrue annual leave at rates based on length of service, and for sick leave at the rate of one day per month. Sick leave balances, which are unlimited, can be converted to monetary compensation annually at 25% of the employees’ normal compensation rate for any balance that exceeds 480 hours, or for any balance upon retirement or death. Annual leave accrued at June 30, 2016 and 2015 was $104,330,000 and $93,328,000, respectively, and is included in Accounts Payable and Accrued Liabilities. Sick leave accrued at June 30, 2016 and 2015 was $42,191,000 and $37,984,000, respectively, and is included in Long-Term Liabilities (Note 9).
Scholarship Allowances. Tuition and Fees are reported net of scholarship allowances that are applied to students’ accounts from external funds that have already been recognized as revenue by the University. Student aid paid directly to students is reported as scholarships and fellowships expense.
Net Patient Services Revenue. Patient services revenue is recorded at the estimated net realizable amounts from patients, third-party payors and others for services rendered, including estimated retroactive adjustments under reimbursement agreements with third-party payors. Retroactive adjustments are accrued on an estimated basis in the period the related services are rendered and adjusted in future periods as final settlements are determined. Revenue related to charity care provided to patients is excluded from net patient services revenue.
Third-party payor agreements with Medicare and Medicaid provide for payments at amounts different from established rates and are part of contractual adjustments to net patient services revenue. Medicare reimbursements are based on a tentative rate, with final settlement determined after submission of annual cost reports and audits thereof by the Medicare fiscal intermediary. The estimated final settlements for open years are based on preliminary cost findings after giving consideration to interim payments that have been received on behalf of patients covered under these programs.
For more information about Net Patient Services Revenue, see the audited financial statements of the UW Medicine Clinical Enterprise - UW Division, which are contained in the latest Bondholders Report at http://f2.washington.edu/treasury/policies-reports/reports/financing.
Charity Care. Charity care provides patient care without charge or at amounts less than established rates to patients who meet certain criteria under the charity care policy. Records are maintained to identify and monitor the level of charity care provided. These records include charges foregone for services and supplies furnished under the charity care policy to the uninsured and the underinsured. Collection of these amounts is not pursued and as such they are not reported as net patient service revenue. The cost of charity provided is calculated based on the aggregate relationship of costs to charges. The estimated cost of charity care provided for fiscal years ended June 30, 2016 and 2015 was $14,690,000 and $11,530,000, respectively.
State Appropriations. The state of Washington appropriates funds to the University on both annual and biennial bases. These revenues are reported as nonoperating revenues in the Statements of Revenues, Expenses and Changes in Net Position when underlying expenditures are made.
Operating Activities. The University’s policy for reporting operating activities in the Statements of Revenues, Expenses and Changes in Net Position is to include activities that generally result from exchange transactions. Examples of exchange transactions are payments received for tuition, patient services or grants under which services are performed, as well as payments made for the delivery of goods or services. Certain other significant revenue streams used for operations, such as state appropriations, Pell grants, gifts and investment income are recorded as nonoperating revenues, as prescribed by GASB Statement No. 35.
Net Position. The University’s net position is classified as follows: Net investment in capital assets: The University’s investments in capital assets, less accumulated depreciation/amortization, net of outstanding debt obligations related to capital assets;
Restricted net position – nonexpendable: Net position subject to externally-imposed requirements that it be maintained permanently by the University, including permanent endowment funds and annuity and life income trusts;
Restricted net position – expendable: Net position that the University is obligated to spend in accordance with restrictions imposed by external parties, generally for scholarships, research and departmental uses;
Unrestricted net position: Net position not subject to externally-imposed restrictions and which may be designated for specific purposes by management or the Board of Regents.
Tax Exemption. The University, as an agency of the state of Washington, is not subject to federal income tax pursuant to Section 115 of the Internal Revenue Code, except for tax on unrelated business income and certain federal excise taxes.
Reclassifications. Certain amounts in the 2015 financial statements have been reclassified for comparative purposes to conform to the presentation in the 2016 financial statements.

NOTES TO FINANCIAL STATEMENTS
UNIVERSITY OF WASHINGTON / 24
NOTE 2:
Cash and Cash EquivalentsCash includes cash on hand, petty cash and bank deposits. Cash equivalents includes treasury securities with maturities of less than 90 days and money market funds with remaining maturities of one year or less at the time of purchase. Most cash, except for cash held at the University and cash held in foreign banks, is covered by the Federal Deposit Insurance Corporation (FDIC), or if greater than FDIC limits, by collateral held in a multiple financial institution collateral pool administered by the Washington Public Deposit Protection Commission (PDPC).
At June 30, 2016 and 2015, bank balances not covered by FDIC or PDPC protection were $334,000 and $391,000, respectively.
NOTE 3:
Deposit with State of WashingtonState law requires the University to deposit certain funds with the state treasurer, who holds and invests the funds. These deposits include amounts held for the University’s permanent land grant funds, and the University of Washington building fee collected from students. The fair value of these funds approximates the carrying value.
NOTE 4:
Student Loans ReceivableNet student loans of $71,721,000 and $73,384,000 at June 30, 2016 and 2015, respectively, consist of $55,804,000 and $55,537,000 from federal programs, and $15,917,000 and $17,847,000 from University programs, at June 30, 2016 and 2015, respectively. Interest income from student loans for the years ended June 30, 2016 and 2015 was $1,881,000 and $1,690,000, respectively. These unsecured loans are made primarily to students who reside in the state of Washington.
NOTE 5:
Accounts ReceivableThe major components of accounts receivable as of June 30, 2016 and 2015 were:
(Dollars in thousands) 2016 2015 NET PATIENT SERVICES $ 303,109 $ 325,813GRANTS AND CONTRACTS 172,429 179,621INVESTMENTS 137,359 31,392DUE FROM OTHER AGENCIES 54,819 47,851SALES AND SERVICES 34,590 32,357TUITION 16,040 12,094ROYALTIES 3,234 4,893
STATE APPROPRIATIONS 1,384 5,930OTHER 22,927 23,404SUBTOTAL 745,891 663,355LESS: ALLOWANCE FOR DOUBTFUL ACCOUNTS (58,643) (66,902) TOTAL $ 687,248 $ 596,453

FINANCIAL REPORT 2016 / 25
NOTE 6:
InvestmentsINVESTMENTS - GENERALThe Board of Regents of the University of Washington is responsible for the management of the University’s investments. The Board of Regents establishes investment policy, which is carried out by the Chief Investment Officer. In 2016, the Board of Regents approved the establishment of the University of Washington Investment Management Company (“UWINCO”), an internal investment management company. The former investment management advisory committee was replaced with an investment management advisory board known as the University of Washington Investment Management Company Board (“UWINCO Board”).
The University holds significant amounts of investments that are measured at fair value on a recurring basis. Shown below is a tabular format for disclosing the levels within the fair value hierarchy. The three-tier hierarchy of inputs is summarized as follows:
• Level 1 Inputs – Quoted prices (unadjusted) in active markets for identical assets or liabilities that a government can access at the measurement date
• Level 2 Inputs – Inputs other than quoted prices included within Level 1 that are observable for an asset or liability, either directly or indirectly
• Level 3 Inputs – Unobservable inputs for an asset or liability
TABLE 1 – INVESTMENTS (Dollars in thousands)
INVESTMENTS BY FAIR VALUE LEVEL
Fair Value Measurement Inputs
2016
Quoted Prices in Active Markets for Identical
Assets (Level 1)
Significant Other Observable Inputs
(Level 2)
Significant Unobservable Inputs
(Level 3)
FIXED INCOME SECURITIES
U.S. TREASURY SECURITIES $ 640,448 $ 13,646 $ 626,802 $ –
U.S. GOVERNMENT AGENCY 535,750 – 535,750 –
MORTGAGE BACKED 172,199 – 172,199 –
ASSET BACKED 133,567 – 133,567 –
CORPORATE AND OTHER 141,644 21,243 120,401 –
TOTAL FIXED INCOME SECURITIES 1,623,608 34,889 1,588,719 –
EQUITY SECURITIES
GLOBAL EQUITY INVESTMENTS 626,622 573,552 52,025 1,045
PRIVATE EQUITY AND VENTURE CAPITAL FUNDS 11,291 6,160 – 5,131
REAL ESTATE 3,851 – – 3,851
OTHER 226 – – 226
TOTAL EQUITY SECURITIES 641,990 579,712 52,025 10,253
TOTAL INVESTMENTS BY FAIR VALUE LEVEL 2,265,598 $ 614,601 $ 1,640,744 $ 10,253
INVESTMENTS MEASURED USING NET ASSET VALUE (NAV)
GLOBAL EQUITY INVESTMENTS 1,055,272
ABSOLUTE RETURN STRATEGY FUNDS 463,366
PRIVATE EQUITY AND VENTURE CAPITAL FUNDS 329,719
REAL ASSETS FUNDS 183,481
OTHER 106,729
TOTAL INVESTMENTS MEASURED USING NAV 2,138,567
TOTAL INVESTMENTS MEASURED AT FAIR VALUE 4,404,165
CASH EQUIVALENTS AT AMORTIZED COST 404,805
TOTAL INVESTMENTS $ 4,808,970

NOTES TO FINANCIAL STATEMENTS
UNIVERSITY OF WASHINGTON / 26
(CONTINUED)
Fixed income and equity securities classified in Level 1 of the fair value hierarchy are valued using prices quoted in active markets for those securities. Fixed income and equity securities classified in Level 2 are valued using observable inputs including quoted prices for similar securities and interest rates. Private equity, real assets and other investments classified in Level 3 are valued using either discounted cash flow or market comparable techniques.
The University’s interests in certain non-readily marketable alternative investments, such as hedge funds and private equity limited partnerships, are stated at fair value based on net asset value (NAV) estimates used as a practical expedient reported to the University by investment fund managers.
TABLE 1 – INVESTMENTS continued (Dollars in thousands)
INVESTMENTS BY FAIR VALUE LEVEL
Fair Value Measurement Inputs
2015
Quoted Prices in Active Markets for Identical
Assets (Level 1)
Significant Other Observable Inputs
(Level 2)
Significant Unobservable Inputs
(Level 3)
FIXED INCOME SECURITIES
U.S. TREASURY SECURITIES $ 607,182 $ 3,484 $ 603,698 $ –
U.S. GOVERNMENT AGENCY 585,745 – 585,745 –
MORTGAGE BACKED 204,546 – 204,546 –
ASSET BACKED 227,077 – 227,077 –
CORPORATE AND OTHER 103,781 23,211 80,570 –
TOTAL FIXED INCOME SECURITIES 1,728,331 26,695 1,701,636 –
EQUITY SECURITIES
GLOBAL EQUITY INVESTMENTS 939,403 839,007 99,943 453
PRIVATE EQUITY AND VENTURE CAPITAL FUNDS 11,405 6,458 – 4,947
REAL ESTATE 7,829 – – 7,829
OTHER 514 – – 514
TOTAL EQUITY SECURITIES 959,151 845,465 99,943 13,743
TOTAL INVESTMENTS BY FAIR VALUE LEVEL 2,687,482 $ 872,160 $ 1,801,579 $ 13,743
INVESTMENTS MEASURED USING NET ASSET VALUE (NAV)
GLOBAL EQUITY INVESTMENTS 823,675
ABSOLUTE RETURN STRATEGY FUNDS 510,975
PRIVATE EQUITY AND VENTURE CAPITAL FUNDS 340,231
REAL ASSETS FUNDS 191,083
OTHER 137,496
TOTAL INVESTMENTS MEASURED USING NAV 2,003,460
TOTAL INVESTMENTS MEASURED AT FAIR VALUE 4,690,942
CASH EQUIVALENTS AT AMORTIZED COST 285,720
TOTAL INVESTMENTS $ 4,976,662

FINANCIAL REPORT 2016 / 27
The valuation method for investments measured using NAV per share (or its equivalent) is presented on the following table.
TABLE 2 – INVESTMENTS MEASURED USING NAV (Dollars in thousands)
2016 Fair ValueUnfunded
CommitmentsRedemption Frequency
(If Currently Eligible)Redemption
Notice Period
GLOBAL EQUITY INVESTMENTS $ 1,055,272 $ 23,846 MONTHLY TO ANNUALLY 30-60 DAYS
ABSOLUTE RETURN STRATEGY FUNDS 463,366 15,728 QUARTERLY TO ANNUALLY 30-60 DAYS
PRIVATE EQUITY AND VENTURE CAPITAL FUNDS 329,719 204,399 N/A –
REAL ASSETS FUNDS 183,481 55,503 N/A –
OTHER 106,729 850 QUARTERLY TO ANNUALLY 30-95 DAYS
TOTAL INVESTMENTS MEASURED USING NAV $ 2,138,567
2015 Fair ValueUnfunded
CommitmentsRedemption Frequency
(If Currently Eligible)Redemption
Notice Period
GLOBAL EQUITY INVESTMENTS $ 823,675 $ 16,798 MONTHLY TO ANNUALLY 30-60 DAYS
ABSOLUTE RETURN STRATEGY FUNDS 510,975 68,820 QUARTERLY TO ANNUALLY 30-60 DAYS
PRIVATE EQUITY AND VENTURE CAPITAL FUNDS 340,231 129,715 N/A –
REAL ASSETS FUNDS 191,083 90,883 N/A –
OTHER 137,496 23,685 QUARTERLY TO ANNUALLY 30-95 DAYS
TOTAL INVESTMENTS MEASURED USING NAV $ 2,003,460
1. Global Equity: This investment category includes public equity investments in separately managed accounts, long-only comingled funds, unconstrained limited partnerships, and passive market indices. Fair values have been determined using the NAV per share of the investments, except for the separately managed accounts. For 2016 and 2015, approximately 62% of the value of the investments in this category can be redeemed within 60 days, and 94% can be redeemed within one year. The remaining balance of these investments contain restrictions that do not allow for redemption within one year.
2. Absolute Return: This category includes investments in stable income and low-to-medium beta funds. Management of these funds seeks low correlation to broad equity markets by investing in assets that exhibit low volatility, deep discounts, and/or hedges against market downturns. Fair values have been determined using the NAV per share of the investments. Approximately 89% of the value of the investments in this category can be redeemed within one year. The remaining balance of these investments contain restrictions that do not allow for redemption within one year.
3. Private equity: This category includes buyout, venture, and special situations funds. Fair values have been determined using the NAV per share (or its equivalent) of the ownership interest in partners’ capital. These investments can never be redeemed with the funds. Distributions from each fund will be received as the underlying investments of the funds are liquidated. It is expected that the underlying assets of the funds will be liquidated over the next 7 to 10 years.
4. Real assets: This category includes real estate, natural resources, and other hard assets. Fair values have been determined using the NAV per share (or its equivalent) of the ownership interest in partners’ capital. These investments can never be redeemed with the funds. Distributions from each fund will be received as the underlying investments of the funds are liquidated. It is expected that the underlying assets of the funds will be liquidated over the next 7 to 10 years.
5. Other: This category consists of fixed income and opportunistic investments and includes various types of non-investment grade and non-rated credit plus nominal equity exposure. Fair values have been determined using the NAV per share (or its equivalent) of the ownership interest in partners’ capital. Approximately 45% of the value of the investments in this category can be redeemed or anticipate distribution within one year. The remaining balance of these investments contain restrictions on redemption within one year or will be distributed as underlying investments are liquidated. It is expected that the underlying assets of the funds will be liquidated over the next 10 years.

NOTES TO FINANCIAL STATEMENTS
UNIVERSITY OF WASHINGTON / 28
(CONTINUED)
TABLE 3 – INVESTMENT DERIVATIVES (Dollars in thousands)
Notational Amount as of June 30 Fair Value as of June 30 Change in Fair Value
DESCRIPTION 2016 2015 ASSET CLASSIFICATION 2016 2015 INCOME CLASSIFICATION 2016 2015
FUTURES CONTRACTS $ 64,428 $100,747 INVESTMENTS $ 65,218 $ 100,286 INVESTMENT INCOME $ 790 ($ 461)
INVESTMENT POOLSThe University combines most short-term cash balances into the Invested Funds Pool. At June 30, 2016 and 2015, the Invested Funds Pool totaled $1,491,692,000 and $1,526,380,000, respectively. The Invested Funds Pool also owns units in the Consolidated Endowment Fund (CEF) valued at $730,501,000 and $806,198,000 at June 30, 2016 and 2015, respectively. By University policy, departments with qualifying funds in the Invested Funds Pool receive distributions based on their average balances and on the type of balance. Campus depositors received 2% in fiscal years 2016 and 2015. Endowment operating and gift accounts received 3% in fiscal years 2016 and 2015. The difference between the actual earnings of the Invested Funds Pool and the calculated distributions is used to support activities benefiting all University departments.
The majority of the endowed funds are invested in the CEF, a pooled fund. Individual endowments purchase units in the pool on the basis of a per-unit valuation of the CEF at fair value on the last business day of the calendar quarter. Income is distributed based on the number of units held. RCW 24.55 of the Washington State Code and the Uniform Prudent Management of Institutional Funds Act allow for total return expenditure under comprehensive prudent standards.
Under the CEF spending policy approved by the Board of Regents, quarterly distributions to programs are based on an annual percentage rate of 4%, applied to the five-year rolling average of the CEF’s market valuation. Additionally, the policy allows for an administrative fee of 1% supporting campus-wide fundraising and stewardship activities (0.80%) and offsetting the internal cost of managing endowment assets (0.20%).
The University records its permanent endowments at the lower of original gift value or current market value in the Restricted Nonexpendable Net Position category. Of the endowments that are recorded at current market value, the net deficiency from the original gift value is $12,170,000 and $2,986,000 at June 30, 2016 and 2015, respectively.
Funds in irrevocable trusts managed by trustees other than the University are not reported in the financial statements. The fair value of these funds was $107,800,000 and $111,442,000 at June 30, 2016 and 2015, respectively. Income received from these trusts, which is included in Investment Income, was $4,487,000 and $6,162,000 for the fiscal years ended June 30, 2016 and 2015, respectively.
Net appreciation (depreciation) in the fair value of investments includes both realized and unrealized gains and losses on investments. The University realized net gains of $41,086,000 and $71,485,000 in fiscal years 2016 and 2015, respectively, from the sale of investments. The calculation of realized gains and losses is independent of the net appreciation of the fair value of investments. Realized gains and losses on investments that have been held in more than one fiscal year and are sold in the current year include the net appreciation (depreciation) of these investments reported in the prior year(s). The net appreciation (depreciation) in the fair value of investments during the years ended June 30, 2016 and 2015 were $(53,795,000) and $151,209,000, respectively.
FUNDING COMMITMENTSThe University enters into contracts with investment managers to fund alternative investments. As of June 30, 2016 and 2015, the University had outstanding commitments to fund alternative investments of $300,326,000 and $329,901,000, respectively. These commitments are expected to be called over a multi-year time frame. The University believes it has adequate liquidity and funding sources to meet these obligations.
DERIVATIVES The University’s investment policies allow investing in various derivative instruments, including futures, swaps and forwards, to manage exposures within or across the portfolio and to improve the portfolio’s risk/return profile. Futures are financial contracts obligating the buyer to purchase an asset at a predetermined future date and price. Total return swaps involve commitments to pay interest in exchange for a market-linked return, both based on notional amounts. Derivative instruments are recorded on the contract date and are carried at fair value using listed price quotations or amounts that approximate fair value. The fair value and notional amount of investment derivative instruments outstanding at June 30, 2016 and 2015, categorized by type, are as follows:

FINANCIAL REPORT 2016 / 29
Credit exposure represents exposure to counterparties relating to financial instruments, where gains exceed collateral held by the University or losses are less than the collateral posted by the University. There was no credit exposure as of June 30, 2016 or 2015. No derivative instruments have been reclassified from a hedging instrument to an investment instrument.
Details on foreign currency derivatives are disclosed under Foreign Exchange Risk.
INTEREST RATE RISKInterest rate risk is the risk that changes in interest rates will adversely affect the fair value of fixed income securities. The University manages interest rate risk through its investment policies and the investment guidelines established with each manager. Each fixed income manager is assigned a maximum boundary for duration as compared to the manager’s relevant benchmark index. The goal is to allow ample freedom for the manager to perform, while controlling the interest rate risk in the portfolio. Effective duration is a commonly used measure of interest rate risk. The longer the duration, the more sensitive the portfolio is to changes in interest rates. The weighted average effective duration of the University’s fixed income portfolio was 2.77 years and 2.28 years at June 30, 2016 and 2015, respectively.
CREDIT RISKFixed income securities are subject to credit risk, which is the risk that the issuer or other counterparty to a financial instrument will not fulfill its obligations, or that negative perceptions of the issuer’s ability to make these payments will cause prices to decline. Concentration of credit risk is the risk of loss attributed to the magnitude of a government’s investment in a single issuer. The University Investment Policies limit fixed income exposure to investment grade assets. The Investment Policy for the Invested Funds’ cash pool requires each manager to maintain an average quality rating of “AA” as issued by a nationally recognized rating organization. The Invested Funds’ liquidity pool requires each manager to maintain an average quality rating of “A” and to hold 25% of their portfolios in government and government agency issues. The Investment Policy for the CEF reflects its long-term nature by specifying average quality rating levels by individual manager, but still restricting investment to investment grade credits.
Duration is a calculation of the number of years required to recover the true cost of a bond. The duration measures presented in Table 4 below represent a broad average across all fixed income securities held in the CEF, the Invested Funds Pool (IF or operating funds) and debt service reserve funds. The CEF and IF portfolios are managed to have a duration below their policy benchmarks to protect principal and provide liquidity to the overall portfolio.
Duration and credit risk figures at June 30, 2016 and 2015 exclude $13,860,000 and $12,019,000, respectively, of fixed income securities held outside the CEF and the IF. These amounts make up 0.85% and 0.70%, respectively, of the University’s fixed income investments, and are not included in the duration figures detailed in Table 4.
The composition of fixed income securities at June 30, 2016 and 2015, along with credit quality and effective duration measures, is summarized as follows:
TABLE 4 – FIXED INCOME: CREDIT QUALITY AND EFFECTIVE DURATION (Dollars in thousands)
2016
Investments U.S. GovernmentInvestment
Grade*Non-Investment
Grade Not Rated TotalDuration (in years)
U.S. TREASURIES $ 636,485 $ – $ – $ – $ 636,485 3.24
U.S. GOVERNMENT AGENCY 531,795 – – – 531,795 2.54
MORTGAGE BACKED – 94,054 54,797 23,348 172,199 2.20
ASSET BACKED – 113,715 2,627 17,225 133,567 0.96
CORPORATE AND OTHER – 111,977 20,225 3,500 135,702 4.04
TOTAL $ 1,168,280 $ 319,746 $ 77,649 $ 44,073 $ 1,609,748 2.77
2015
Investments U.S. GovernmentInvestment
Grade*Non-Investment
Grade Not Rated TotalDuration (in years)
U.S. TREASURIES $ 603,698 $ – $ – $ – $ 603,698 2.00
U.S. GOVERNMENT AGENCY 582,472 – – – 582,472 2.72
MORTGAGE BACKED – 107,070 75,060 22,415 204,545 2.01
ASSET BACKED – 195,968 6,998 24,111 227,077 1.73
CORPORATE AND OTHER – 98,320 – 200 98,520 3.25
TOTAL $ 1,186,170 $ 401,358 $ 82,058 $ 46,726 $ 1,716,312 2.28
* Investment Grade securities are those that are rated BBB and higher by Standard and Poor’s or Baa and higher by Moody’s

NOTES TO FINANCIAL STATEMENTS
UNIVERSITY OF WASHINGTON / 30
(CONTINUED)
(Dollars in thousands) 2016 2015
EURO (EUR) $ 123,075 $ 174,487INDIAN RUPEE (INR) 122,738 112,679CHINESE RENMINBI (CNY) 109,170 211,184JAPANESE YEN (JPY) 79,512 110,617BRAZIL REAL (BRL) 74,582 54,225HONG KONG DOLLAR (HKD) 58,655 60,046SOUTH KOREAN WON (KRW) 53,278 56,835RUSSIAN RUBLE (RUB) 50,132 36,218BRITISH POUND (GBP) 44,802 54,880CANADIAN DOLLAR (CAD) 30,634 35,385SWISS FRANC (CHF) 28,931 39,061MEXICAN PESO (MXN) 28,693 23,898TAIWANESE DOLLAR (TWD) 27,573 27,055PHILIPPINE PESO (PHP) 25,265 29,100REMAINING CURRENCIES 152,562 169,400 TOTAL $ 1,009,602 $ 1,195,070
TABLE 5 – INVESTMENTS DENOMINATED IN FOREIGN CURRENCYFOREIGN EXCHANGE RISKForeign exchange risk is the risk that investments denominated in foreign currencies may lose value due to adverse fluctuations in the value of the U.S. dollar relative to foreign currencies. The University’s investment policies permit investments in international equity and other asset classes, which can include foreign currency exposure. The University also enters into foreign currency forward contracts, futures contracts, and options to manage the foreign currency exposure. The University held non-U.S. denominated securities at June 30, 2016 and 2015 of $1,009,602,000 and $1,195,070,000, respectively.
NOTE 7:
Metropolitan TractThe University of Washington Metropolitan Tract (“the Metropolitan Tract”), located in downtown Seattle, comprises approximately 11 acres of developed property, including office space, retail space, residential apartments, parking, and a luxury hotel. This land was the original site of the University from 1861 until 1895 when the University moved to its present location on Lake Washington. Since the early 1900s, the Metropolitan Tract has been leased by the University to entities responsible for developing and operating the property.
The balances as of June 30, 2016 and 2015 represent operating assets net of liabilities, and land, buildings and improvements stated at appraised value as of November 1, 1954. The balances also include subsequent capital additions and improvements at cost, less retirements and accumulated depreciation of $177,659,000 and $166,124,000, respectively, and are net of the outstanding balance of the associated long-term debt.
In March 2015, $8,500,000 of Metropolitan Tract commercial paper was refinanced and replaced by the issuance of University General Revenue and Refunding Bonds, 2015 A&B, as described in the refunding activity section of Note 11. The loan amount as of June 30, 2016 and 2015 was $5,710,000 and $8,535,000, respectively. In addition, $33,400,000 of bond proceeds were loaned to the Metropolitan Tract as part of the Cobb Building lease termination. The loan amount as of June 30, 2016 and 2015 was $32,890,000 and $33,564,000, respectively. Both loans are unsecured, but expected to be repaid through revenues generated by the Metropolitan Tract properties.
OFFICE PROPERTIESFrom July 18, 1953 to October 31, 2014, the University leased a significant portion of the 11 acre site to Unico Properties, LLC (“Unico”). Upon expiration of the Unico Lease, the following events occurred:
• The University entered into an agreement with Wright Runstad to undertake activities relating to the redevelopment of the site currently occupied by the Rainier Square (“Predevelopment Agreement”). The agreement commenced on November 1, 2014 and expires upon the completion of certain development milestones. An 80-year ground lease with Wright Runstad will commence upon fulfillment of the terms of the Predevelopment Agreement
• The University terminated the ground lease with Unico for the Cobb Building, and paid a termination price of $33,400,000

FINANCIAL REPORT 2016 / 31
• Ownership of the Palomar Garage property transferred to the University as agreed to in the Unico Lease
• In accordance with the Predevelopment Agreement, the University entered into an Interim Agreement for the Rainier Square development site that provides Wright Runstad with significant control over the management and operation of the Rainier Square Building in exchange for a fixed rent schedule for up to seven years
• In connection with the Interim Agreement for the Rainer Square site, the University entered into a property management agreement with Wright Runstad for the Rainier Tower Building
• The University hired Unico Properties, LLC to oversee leasing for all of the office buildings and property management for all of the office buildings except the Rainer Tower
HOTELOn January 18, 1980, the Board of Regents entered into a lease (“the Hotel Lease”) for the Olympic Hotel property, which expires in 2040. The hotel was operated as the Four Seasons Olympic Hotel until July 31, 2003. On August 1, 2003, the remaining lease term was assigned to LHCS Hotel Holding (2002), LLC. The hotel was renamed the Fairmont Olympic Hotel and managed by Fairmont Hotels and Resorts, Inc.
On June 1, 2015, the University consented to the assignment of the Hotel Lease from LHCS Hotel Holding (2002), LLC to IC/RCDP Seattle Hotel, an entity owned by affiliates of Rockwood IX REIT, Inc. and an affiliate of DiNapoli Capital Partners, LLC. The tenant under the Hotel Lease remained the same, and the management of the hotel by Fairmont Hotels and Resorts, Inc. did not change.
NOTE 8:
Capital AssetsCapital asset activity for the two-year period ended June 30, 2016 is summarized as follows:
(Dollars in thousands) Balance at
June 30, 2014 Additions/ Transfers Retirements
Balance at June 30, 2015
Additions/ Transfers
Retirements
Balance at June 30, 2016
LAND $ 126,795 $ 1,953 $ – $ 128,748 $ – $ – $ 128,748INFRASTRUCTURE 194,002 11,068 – 205,070 36,738 – 241,808BUILDINGS 5,244,985 70,936 2,575 5,313,346 307,470 9,142 5,611,674FURNITURE, FIXTURES AND EQUIPMENT 1,223,811 104,985 84,785 1,244,011 119,989 96,495 1,267,505LIBRARY MATERIALS 325,663 13,521 1,767 337,417 13,933 1,834 349,516CAPITALIZED COLLECTIONS 7,093 65 – 7,158 25 – 7,183INTANGIBLE ASSETS 105,319 25,484 6,946 123,857 16,538 1,240 139,155CONSTRUCTION IN PROGRESS 121,696 224,043 1,931 343,808 9,057 3,280 349,585INTANGIBLES IN PROCESS 25,412 17,615 7,775 35,252 22,669 1,123 56,798 TOTAL COST 7,374,776 469,670 105,779 7,738,667 526,419 113,114 8,151,972LESS ACCUMULATED DEPRECIATION/AMORTIZATION:INFRASTRUCTURE 95,351 4,921 – 100,272 6,281 – 106,553BUILDINGS 1,946,659 175,159 2,106 2,119,712 187,934 6,425 2,301,221FURNITURE, FIXTURES AND EQUIPMENT 982,794 101,464 71,228 1,013,030 104,453 84,248 1,033,235
LIBRARY MATERIALS 239,087 12,546 1,317 250,316 12,740 1,387 261,669
INTANGIBLE ASSETS 66,089 16,870 – 82,959 13,194 – 96,153 TOTAL ACCUMULATED DEPRECIATION/AMORTIZATION
3,329,980 310,960 74,651 3,566,289 324,602 92,060 3,798,831
CAPITAL ASSETS, NET $ 4,044,796 $ 158,710 $ 31,128 $ 4,172,378 $ 201,817 $ 21,054 $ 4,353,141

UNIVERSITY OF WASHINGTON / 32
NOTES TO FINANCIAL STATEMENTS (CONTINUED)
(Dollars in thousands)Balance at
June 30, 2014Additions/Transfers Reductions
Balance at June 30, 2015
Additions/Transfers Reductions
Balance at June 30, 2016
Current Portion 2015
Current Portion 2016
BONDS PAYABLE:
GENERAL OBLIGATION BONDS PAYABLE (NOTE 11) $ 165,044 $ 260 $ 15,740 $ 149,564 $ 30,145 $ 52,655 $ 127,054 $ 18,290 $ 17,230
REVENUE BONDS PAYABLE (NOTE 11) 1,764,855 291,750 347,540 1,709,065 327,580 43,700 1,992,945 41,055 47,555
UNAMORTIZED PREMIUM ON BONDS 101,456 39,709 15,978 125,187 28,980 17,025 137,142 13,416 14,974
TOTAL BONDS PAYABLE 2,031,355 331,719 379,258 1,983,816 386,705 113,380 2,257,141 72,761 79,759
NOTES PAYABLE AND CAPITAL LEASES:
NOTES PAYABLE & OTHER -CAPITAL ASSET RELATED (NOTE 11) 24,008 7,205 2,975 28,238 1,715 5,306 24,647 5,020 5,721
NOTES PAYABLE & OTHER – NONCAPITAL ASSET RELATED (NOTE 11) 1,822 – 65 1,757 1,000 1,441 1,316 1,546 1,318
CAPITAL LEASE OBLIGATIONS (NOTE 10) 20,457 – 4,641 15,816 – 4,594 11,222 3,479 2,676
TOTAL NOTES PAYABLE AND CAPITAL LEASES 46,287 7,205 7,681 45,811 2,715 11,341 37,185 10,045 9,715
OTHER LONG-TERM LIABILITIES:
OBLIGATIONS UNDER SPLIT-INTEREST AGREEMENTS 36,684 5,614 – 42,298 3,889 7,033 39,154 – 3,517
POLLUTION REMEDIATION LIABILITY (NOTE 1) 22,000 – – 22,000 – 1,000 21,000 4,000 3,000
UNEARNED REVENUE (NOTE 13) 16,366 11,760 5,500 22,626 43,215 38,231 27,610 8,500 10,400
SICK LEAVE (NOTE 1) 36,174 6,852 5,042 37,984 9,861 5,654 42,191 4,974 5,348
SELF-INSURANCE (NOTE 16) 67,450 29,495 14,744 82,201 24,778 27,826 79,153 20,459 21,285
COMMERCIAL PAPER – 111,545 – 111,545 – 111,545 – – –
UWSRP NET PENSION OBLIGATION (NOTE 15) 198,895 53,057 3,766 248,186 53,057 4,257 296,986 3,398 4,012
OTHER NONCURRENT LIABILITIES – 12,192 – 12,192 7,443 7,000 12,635 – –
TOTAL OTHER LONG-TERM LIABILITIES 377,569 230,515 29,052 579,032 142,243 202,546 518,729 41,331 47,562
TOTAL LONG-TERM LIABILITIES $ 2,455,211 $ 569,439 $ 415,991 $ 2,608,659 $ 531,663 $ 327,267 $ 2,813,055 $ 124,137 $ 137,036
NOTE 9:
Long-Term Liabilities UNIVERSITY OF WASHINGTONLong-term liability activity for the two-year period ended June 30, 2016 is summarized as follows:
(Dollars in thousands)Balance at
June 30, 2014Additions/Transfers Reductions
Balance at June 30, 2015
Additions/Transfers Reductions
Balance at June 30, 2016
Current Portion 2015
Current Portion 2016
VALLEY MEDICAL CENTER LIMITED TAX GENERAL OBLIGATION BONDS $ 243,503 $ – $ 6,271 $ 237,232 $ – $ 6,487 $ 230,745 $ 6,535 $ 6,780 REVENUE BONDS 18,858 – 1,376 17,482 – 1,523 15,959 1,650 1,720 BUILD AMERICA BONDS 61,155 – – 61,155 – – 61,155 – – NOTES PAYABLE & OTHER 1,407 – 513 894 – 291 603 291 259 TOTAL LONG-TERM LIABILITIES $ 324,923 $ – $ 8,160 $ 316,763 $ – $ 8,301 $ 308,462 $ 8,476 $ 8,759
NORTHWEST HOSPITAL REVENUE BONDS $ 73,400 $ – $ 73,400 $ – $ – $ – $ – $ – $ – NOTES PAYABLE & CAPITAL LEASES 13,645 – 1,175 12,470 1,520 932 13,058 525 4,860 TOTAL LONG-TERM LIABILITIES $ 87,045 $ – $ 74,575 $ 12,470 $ 1,520 $ 932 $ 13,058 $ 525 $ 4,860
DISCRETE COMPONENT UNITSLong-term liability activity for the two-year period ended June 30, 2016 is summarized as follows:

FINANCIAL REPORT 2016 / 33
Year (Dollars in Thousands) Future
Payments
2017 $ 84,387
2018 80,324
2019 77,774
2020 74,483
2021 57,991
2022 - 2026 136,722
2027 - 2031 54,132
2032 - 2036 52,538
2037 - 2041 55,882
2042 - 2046 31,621
2047 - 2051 21,661
2052 - 2056 25,011
2057 - 2061 28,884
2062 - 2066 12,336
TOTAL MINIMUM LEASE PAYMENTS $ 793,746
OPERATING LEASESThe University has certain lease agreements in effect that are considered operating leases, which are primarily for leased building space. During the years ended June 30, 2016 and 2015, the University recorded rent expense of $44,047,000 and $44,736,000, respectively, for these leases. Future lease payments of June 30, 2016 are as follows:
CAPITAL LEASES
Year (Dollars in thousands) Future
Payments
2017 $ 2,898
2018 1,580
2019 1,494
2020 1,494
2021 1,494
THEREAFTER 3,106
TOTAL MINIMUM LEASE PAYMENTS 12,066
LESS: AMOUNT REPRESENTING INTEREST COSTS 844
PRESENT VALUE OF MINIMUM PAYMENTS $ 11,222
NOTE 10:
Leases Future minimum lease payments under capital leases, and the present value of the net minimum lease payments, as of June 30, 2016, are as follows:

NOTES TO FINANCIAL STATEMENTS
UNIVERSITY OF WASHINGTON / 34
(CONTINUED)
BONDS AND NOTES PAYABLE (Dollars in thousands)
STATE OF WASHINGTON GENERAL OBLIGATION BONDS
UNIVERSITY OF WASHINGTON GENERAL REVENUE BONDS
NOTES PAYABLE AND OTHER
Year Principal Interest Principal Interest Principal Interest2017 $ 17,230 $ 6,132 $ 47,555 $ 84,791 $ 7,039 $ 8592018 13,890 5,256 74,585 83,197 4,762 6972019 13,920 4,520 54,135 80,895 3,261 5552020 10,385 3,905 55,380 78,735 3,178 4252021 10,890 3,374 58,650 76,418 3,108 2962022 - 2026 51,035 8,234 308,220 342,419 3,991 3972027 - 2031 9,704 424 345,185 269,845 232 962032 - 2036 – – 372,705 195,434 232 962037 - 2041 – – 384,030 103,037 160 772042 - 2046 – – 282,750 16,798 – –2047 - 2051 – – 9,750 589 – – TOTAL PAYMENTS $ 127,054 $ 31,845 $ 1,992,945 $ 1,332,158 $ 25,963 $ 3,498
NOTE 11:
Bonds and Notes PayableThe bonds and notes payable at June 30, 2016 consist of state of Washington General Obligation and Refunding Bonds, University Revenue Bonds, and Notes Payable. These obligations have fixed interest rates ranging from 0.61% to 6.40%. Debt service requirements at June 30, 2016 were as follows:
State law requires that the University reimburse the state for debt service payments relating to its portion of the state of Washington General Obligation and Refunding Bonds from Medical Center patient revenues, tuition, timber sales and other revenues.
ISSUANCE ACTIVITYOn September 9, 2015, the University issued $195,510,000 in General Revenue Bonds, 2015 C&D, at a premium of $13,279,000. The proceeds were used to fund various projects such as renovation of Denny Hall, construction of Animal Care and Research Facilities, South West Campus Central Utility Plant, and other projects. In addition, proceeds were used to pay off $111,545,000 in commercial paper. The 2015 C&D bonds have coupon rates ranging from 1.40% to 5.00% with an average coupon rate of 4.03%. The average life of the 2015 C&D General Revenue bonds is 15.60 years with final maturity on December 1, 2045.
On October 7, 2015, the Washington Biomedical Research Properties 3.2 issued $132,070,000 in Lease Revenue Bonds 2015 A&B, at a premium of $10,926,000. The 2015 A&B bonds have coupon rates ranging from 1.49% to 5.00% with an average coupon rate of 4.42%. The average life of the 2015 A&B Lease Revenue Bonds is 15.87 years with final maturity on January 1, 2048.
REFUNDING ACTIVITYOn August 21, 2014, the Washington Biomedical Research Properties II refunded Lease Revenue Bonds totaling $118,915,000 with new bond issuances totaling $115,660,000 and premium of $13,263,000. The refunded bonds had coupon rates ranging from 4.40% to 5.50% with an average interest rate of 5.03%; the new bonds have an average interest rate of 4.48%. The refunding decreased the total debt service payments to be made over the next 12.2 years by $15,026,000 and resulted in a total economic gain of $12,572,000. The average life of the Washington Economic Development Finance Authority Lease Revenue Refunding Bonds, 2014 is 11.95 years with final maturity on June 1, 2038.
On March 4, 2015, the University issued $218,270,000 in General Revenue & Refunding Bonds, 2015 A&B, at a premium of $26,315,000. A portion of the proceeds (new par of $176,090,000 plus premium of $26,396,000) was used to refund existing debt of $190,195,000. The refunded bonds had coupon rates ranging from 4.00% to 5.00% with an average interest rate of 4.98%; the new bonds have an average coupon of 4.22% with an average interest rate of 4.40%. The refunding decreased the total debt service payments to be made over the next 14.92 years by $74,997,000 and resulted in a total economic gain of $38,083,000. The remainder of the proceeds, issued at a slight discount, was used to pay off $42,500,000 in commercial paper. The average life of the 2015 A&B General Revenue bonds is 14.82 years with final maturity on December 1, 2044.

FINANCIAL REPORT 2016 / 35
On October 8, 2015, the state of Washington refunded General Obligation Bonds totaling $34,285,000 (UW portion) with new bond issuances totaling $30,145,000 and premium of $4,775,000. The refunded bonds had an average interest rate and coupon rate of 5.00%; the new bonds have an average coupon rate of 5.00%. The refunding decreased the total debt service payments to be made over the next 10 years by $5,621,000 and resulted in a total economic gain of $5,230,000.
COMMERCIAL PAPER PROGRAMThe University has a commercial paper program with a maximum borrowing limit of $250,000,000, payable from University general revenues. This short-term borrowing program is primarily used to fund capital expenditures. As of June 30, 2016 and 2015, there was $50,000,000 and $161,545,000, respectively, in outstanding commercial paper.
During fiscal year 2015, the University issued $111,545,000 and refunded $42,500,000 of commercial paper debt with General Revenue Bonds, 2015 A&B.
During fiscal year 2016, the University refunded $111,545,000 of commercial paper debt with General Revenue Bonds, 2015 C&D.
SUBSEQUENT DEBT ACTIVITYOn July 14, 2016, the state of Washington refunded General Obligation Bonds totaling $9,800,000 (UW portion) with new bond issuances totaling $9,100,000 and premium of $1,700,000. The refunded bonds had an average interest rate and coupon rate of 5.00%; the new bonds have an average coupon rate of 4.90%. The refunding decreased the total debt service payments to be made over the next seven years by $1,100,000 and resulted in a total economic gain of $961,000.
On July 20, 2016, the University issued of $45,000,000 of commercial paper debt. The proceeds will be used to fund various projects such as Phases 3 and 4a of the Housing Master Plan, Animal Research and Care Facilities and UWMC Expansion Phase 2.
On October 18, 2016, the University sold $205,160,000 in General Revenue & Refunding Bonds, 2016A&B, at a premium of $35,596,000. Part of the proceeds were used to refund existing debt, as well as retire $45,000,000 of commercial paper debt and pay cost of issuance. The amount refunded was $38,220,000; the new par was $35,020,000 (plus premium of $4,989,000). Proceeds are expected to fund various University projects. The closing date is November 9, 2016.
DEFEASED BONDSThe University defeased certain bonds by placing the proceeds of new bonds in an irrevocable trust to provide for all future debt service payments on the old bonds. The trust account assets and the liability for the defeased bonds are not included in the University’s financial statements. As of June 30, 2016 and 2015, $139,038,000 and $252,973,000, respectively, of bonds outstanding are considered defeased.
OPERATING EXPENSES (Dollars in thousands) 2016 2015
INSTRUCTION $ 1,171,803 $ 1,113,959
RESEARCH 751,262 729,608
PUBLIC SERVICE 38,956 35,428
ACADEMIC SUPPORT 398,286 336,747
STUDENT SERVICES 47,113 43,101
INSTITUTIONAL SUPPORT 267,070 223,217
OPERATION & MAINTENANCE OF PLANT 238,945 241,719
SCHOLARSHIPS & FELLOWSHIPS 155,449 146,570
AUXILIARY ENTERPRISES 422,474 301,543
MEDICAL-RELATED 1,218,205 1,193,225
DEPRECIATION/AMORTIZATION 324,602 310,960
TOTAL OPERATING EXPENSES $ 5,034,165 $ 4,676,077
NOTE 12:
Operating Expenses by Function Operating expenses by functional classification for the years ended June 30, 2016 and 2015 are summarized as follows:

NOTES TO FINANCIAL STATEMENTS
UNIVERSITY OF WASHINGTON / 36
(CONTINUED)
InstructionInstruction includes expenses for all activities that are part of an institution’s instruction program. Expenses for credit and noncredit courses; academic, vocational, and technical instruction; and tutorial instruction are included in this category. The University’s professional and continuing education programs are also included.
ResearchThe research category includes all expenses for activities specifically organized to produce research, which are funded by federal, state, and private institutions.
Public ServicePublic service includes activities conducted primarily to provide non-instructional services to individuals and groups other than the University and its students, such as community service programs, conferences, institutes and general advisory services.
The activities of the University’s public radio stations, Center for Educational Leadership and clinical trials are included in this category.
Academic Support Academic support includes expenses incurred to provide support services for the institution’s primary missions: instruction, research, and public service. The activities of the University’s academic administration, libraries, museums and galleries, and information technology support for academic activities are included in this category.
Student ServicesThe student services category includes the Offices of Admissions and the University Registrar. The activities of the Center for Undergraduate Advising, Diversity, and Student Success, and the operations of the Rubenstein Pharmacy in the student health center are also included in this category.
Institutional SupportThe institutional support category includes central activities that manage long-range planning for the institution, such as planning and programming operations, legal services, fiscal operations, space management, procurement and activities concerned with community and alumni relations. The University’s central administration departments and information technology support for non-academic activities are included in this category.
Operation and Maintenance of PlantThe operation and maintenance of plant category includes the administration, operation, maintenance, preservation, and protection of the institution’s physical plant.
Scholarships and Fellowships This category includes expenses for scholarships and fellowships and other financial aid not funded from existing University resources. Financial aid funded from existing University resources are considered scholarship allowances, which are reflected as an offset to tuition revenues. Expenditure of amounts received from the Washington State Need grant, Washington Higher Education grant, and Pell grants are reflected in this manner.
Auxiliary Enterprises Auxiliary enterprises furnish goods or services to students, faculty, staff or the general public. These units charge a fee directly related to the cost of the goods or services. A distinguishing characteristic of an auxiliary enterprise is that it operates as a self-supporting activity. The activities of the University’s Intercollegiate Athletics, Commuter Services and Housing and Food Services departments are included in this category.
Medical-related The medical-related category includes all expenses associated with patient-care operations, including nursing and other professional services, general services, administrative services, and fiscal services. The activities of UWMC, UWP, and Neighborhood Clinics are included in this category.
Depreciation/AmortizationDepreciation and amortization reflect a periodic expensing of the cost of capitalized assets such as buildings, equipment, software or other intangible assets, spread over their estimated useful lives.

FINANCIAL REPORT 2016 / 37
NOTE 13:
Related PartiesHarborview Medical Center (HMC), a hospital and Level I adult and pediatric trauma center located in Seattle, is a component unit of King County, Washington. It has been managed by the University under a management contract between King County and the University since 1967. In February 2016, the University and King County entered into a Hospital Services Agreement. The term of the agreement, including extensions, will expire on December 31, 2045.
Under the agreement, the HMC Board of Trustees determines major institutional policies and retains control of programs and fiscal matters, while King County retains ultimate control over capital programs and capital budgets. The University is responsible for the operations of HMC, including the provision of medical, dental and management services. All of the individuals employed at HMC, including physicians, are employees of the University. HMC expenses, including payroll, are reimbursed to the University from HMC fund sources.
HMC revenues and expenses are not recognized in the University’s financial statements. The University’s financial statements do, however, include accounts receivable from HMC of $32,322,000 as of June 30, 2016 and $25,923,000 as of June 30, 2015, as well as HMC investments of $3,256,000 and $3,467,000, current accrued liabilities of $20,394,000 and $19,363,000, and long-term liabilities of $27,610,000 and $22,626,000, as of June 30, 2016 and 2015, respectively.
Under an annual agreement, HMC provides strategic funding to Neighborhood Clinics. Funding from HMC to Neighborhood Clinics was $10,339,000 and $6,400,000 during fiscal years 2016 and 2015, respectively, and is presented as Other Nonoperating Revenue in the Statements of Revenues, Expenses and Changes in Net Position. Additionally, UWMC provided $6,926,000 and $3,444,000 to NWH for strategic funding of operations during fiscal years 2016 and 2015, respectively. These amounts are presented in the Statements of Revenues, Expenses and Changes in Net Position for the University as Other Nonoperating Expense and for NWH as Other Nonoperating Revenue.
UW Medicine information technology operates as a self-sustaining activity of the University (ITS department). The ITS department records enterprise-wide information technology capital assets that are purchased for use by UW Medicine entities. The Unearned Revenue reflected in long-term liabilities (Note 9) of $27,610,000 and $22,626,000 at June 30, 2016 and 2015, respectively, represents HMC’s funding of the enterprise-wide information technology capital assets which will be included in the recharge rates of the ITS department over the useful life of the assets.
The University of Washington Foundation (UWF) is a nonprofit organization that performs fundraising activities on behalf of the University. The UWF is not included in the University’s financial statements as a component unit because gifts and grants that are made to the UWF are immediately transferred to the University. In 2016 and 2015, the UWF transferred $113,464,000 and $82,502,000, respectively, to the University in gifts and grants received on its behalf; these are included in the financial statements of the University. The remaining amounts retained by the UWF are not significant to the University’s financial statements.
The University of Washington Alumni Association is a tax-exempt entity that was established to connect and celebrate alumni and to support the University’s mission. The Alumni Association received $3,393,000 and $2,818,000 from the University in support of its operations in fiscal years 2016 and 2015, respectively. These amounts were expensed by the University.
During fiscal year 2015, NWH entered into a long-term financing agreement with the University to obtain funds for the defeasance and advance refunding of Series 2007 Revenue Bonds. Under the terms of this agreement, NWH is required to maintain annual debt service coverage equal to at least 1.25 and days cash on hand equal to at least 50 days. As of June 30, 2016 and 2015, $68,609,000 and $71,306,000, respectively, is payable to the University as a result of this financing agreement. The portion which is due in the next fiscal year is reported by NWH as Other Current Liabilities, and by the University as Other Current Assets, on the Statements of Net Position. The remaining long-term portion is reported on the Statements of Net Position by NWH as Due to Primary Government and by the University as Due from Discrete Component Units.
In addition, as of June 30, 2016 and 2015, respectively, NWH has a payable to the University of $28,894,000 and $29,402,000 for services purchased from the University during the current and prior fiscal years. The current portion of the payable is reported by NWH as Other Current Liabilities, and by the University as Other Current Assets, on the Statements of Net Position as of June 30, 2016 and 2015. The remaining long-term portion is reported on the Statements of Net Position by NWH as Due to Primary Government, and by the University as Due from Discrete Component Units.

NOTES TO FINANCIAL STATEMENTS
UNIVERSITY OF WASHINGTON / 38
(CONTINUED)
NOTE 14:
Other Post Employment Benefits (OPEB)Healthcare and life insurance programs for employees of the state of Washington are administered by the Washington State Health Care Authority (HCA). The HCA calculates the premium amounts each year that are sufficient to fund the statewide health and life insurance programs on a pay-as-you-go basis. These costs are passed through to individual state agencies based upon active employee headcount; the agencies pay the premiums for active employees to the HCA. The agencies may also charge employees for certain higher cost options elected by the employee.
State of Washington retirees may elect coverage through state health and life insurance plans, for which they pay less than the full cost of the benefits, based on their age and other demographic factors. The healthcare premiums for active employees, which are paid by the agency during employees’ working careers, subsidize the “underpayments” of retirees.
An additional factor in the OPEB obligation is a payment that is required by the state legislature to reduce the premiums for retirees covered by Medicare (an “explicit” subsidy). For both calendar years 2016 and 2015, this amount was $150 per retiree eligible for parts A and B of Medicare. This is also passed through to state agencies through active employee rates charged to the agency.
There is no formal state or University plan that underlies the subsidy of retiree health and life insurance.
ACTUARIAL STUDYActuarial studies, performed every two years by the Washington Office of the State Actuary, calculated that the total OPEB obligation of the state of Washington at January 1, 2015 and 2013 was $5.3 billion and $3.7 billion, respectively. The annual required contribution was $498 million and $342 million for the state of Washington for 2015 and 2013, respectively. The actuary calculated the OPEB obligation based on individual state employee data, including age, retirement eligibility and length of service. The probability of an employee of a given age and length of service retiring and receiving OPEB benefits is based on statewide historical data.
The actuary’s allocation of the cumulative statewide liability related to the University and HMC (an unconsolidated related party), was estimated at approximately $997 million and $671 million for 2015 and 2013, respectively. These amounts are not included in the University’s financial statements.
The University paid $324 million and $248 million for healthcare expenses in fiscal years 2016 and 2015, respectively, which included its pay-as-you-go portion of the OPEB liability, calculated by the actuary at $7.9 million in both 2016 and 2015.
The State Actuary’s report is available at: osa.leg.wa.gov/Actuarial_Services/OPEB/OPEB.htm
NOTE 15:
Pension PlansThe University offers four contributory pension plans: 1) the Washington State Public Employees’ Retirement System (PERS) plan, 2) the Washington State Teachers’ Retirement System (TRS) plan, 3) the Law Enforcement Officers’ and Fire Fighters’ Retirement System (LEOFF) plan, and 4) the University of Washington Retirement Plan (UWRP). PERS, TRS, and LEOFF are cost sharing multiple-employer defined benefit pension plans administered by the Washington State Department of Retirement Systems (DRS). The University of Washington Retirement Plan (UWRP), a defined contribution plan, is administered by the University. The University of Washington Supplemental Retirement Plan, a noncontributory defined benefit pension plan which operates in tandem with the UWRP, is closed to new participants.
PLAN DESCRIPTIONS OF THE DRS PLANSPublic Employees’ Retirement SystemPERS retirement benefit provisions are contained in chapters 41.34 and 41.40 of the Revised Code of Washington (RCW). PERS is a cost-sharing multiple-employer retirement system comprised of three separate pension plans for membership purposes. PERS Plan 1 and PERS Plan 2 are defined benefit plans, and PERS Plan 3 is a defined benefit plan with a defined contribution component. PERS members include higher education employees not participating in other higher education retirement programs.

FINANCIAL REPORT 2016 / 39
For accounting purposes, PERS is reported as three separate plans. Plan 1 accounts for the defined benefits of Plan 1 members, Plan 2/3 accounts for the defined benefits of Plan 2 and Plan 3 members, and Plan 3 accounts for the defined contribution portion of Plan 3 members. The defined benefit portions of Plan 2 and Plan 3 are accounted for in the same pension trust fund, and all assets of Plan 2/3 may legally be used to pay the defined benefits of any of the Plan 2 or Plan 3 members or beneficiaries.
Teachers’ Retirement System TRS retirement benefit provisions are contained in chapters 41.32 and 41.34 of the RCW. TRS is a cost-sharing, multiple-employer retirement system, comprised of three separate pension plans for membership purposes; TRS Plan 1 and TRS Plan 2 are defined benefit plans and TRS Plan 3 is a defined benefit plan with a defined contribution component. TRS eligibility for membership requires service as a certificated public school employee working in an instructional, administrative or supervisory capacity.
For accounting purposes, similar to PERS, TRS is reported as three separate plans. Plan 1 accounts for the defined benefits of Plan 1 members, Plan 2/3 accounts for the defined benefits of Plan 2 and Plan 3 members, and Plan 3 accounts for the defined contribution portion of Plan 3 members. The defined benefit portions of Plan 2 and Plan 3 are accounted for in the same pension trust fund, and all assets of Plan 2/3 may legally be used to pay the defined benefits of any of the Plan 2 or Plan 3 members or beneficiaries.
Law Enforcement Officers’ and Fire Fighters’ Retirement System LEOFF retirement benefit provisions are contained in chapter 41.26 of the RCW. LEOFF is a cost-sharing multiple-employer retirement system comprised of two separate pension plans for both membership and accounting purposes. The University participates in LEOFF Plan 2, which is a defined benefit plan. LEOFF membership includes full-time, fully compensated, local law enforcement commissioned officers, firefighters, and as of July 24, 2005, emergency medical technicians.
VESTING AND BENEFITS PROVIDEDPERS Plan 1 and TRS Plan 1PERS Plan 1 and TRS Plan 1 provide retirement, disability and death benefits. Both plans are closed to new entrants. All members were vested after the completion of five years of eligible service. Retirement benefits are determined as two percent of the member’s average final compensation (AFC) times the member’s years of service. The AFC is the average of the member’s 24 highest-paid consecutive service months. The retirement benefit may not exceed 60% of the AFC.
Members are eligible for retirement from active status at any age with at least 30 years of service, at age 55 with at least 25 years of service, or at age 60 with at least five years of service. Members retiring from inactive status prior to the age of 65 may receive actuarially reduced benefits. Other benefits include duty and nonduty disability payments, an optional cost-of-living allowance, and a one-time duty-related death benefit, if the member is found eligible by the Washington State Department of Labor and Industries.
PERS Plan 2/3 and TRS Plan 2/3PERS Plan 2/3 and TRS Plan 2/3 provide retirement, disability and death benefits. PERS Plan 2 and TRS Plan 2 members are vested after completion of five years of eligible service. PERS Plan 3 and TRS Plan 3 members are vested in the defined benefit portion of their plan after 10 years of service, or after five years of service if 12 months are earned after age 44. Retirement benefits are determined as two percent of the member’s AFC times the member’s years of service for Plan 2, and one percent of AFC times the member’s years of service for Plan 3. The AFC is the average of the member’s 60 highest-paid consecutive service months. There is no cap on years of service credit.
Members are eligible for retirement with a full benefit at age 65 with at least five years of service credit. Retirement before age 65 is considered early retirement. Members are eligible for early retirement with a reduced benefit at age 55 with at least 20 years of service credit. The benefit is reduced by a factor that varies according to age, for each year before age 65. Members who are age 55 with at least 30 years of service credit can retire under one of two provisions, if hired prior to May 1, 2013:
• With a benefit that is reduced by three percent for each year before age 65; or
• With a benefit that has less, or no, reduction (depending on age) but imposes stricter return-to-work rules
If hired on or after May 1, 2013, members have the option to receive a benefit that is reduced by five percent for each year before age 65.

NOTES TO FINANCIAL STATEMENTS
UNIVERSITY OF WASHINGTON / 40
(CONTINUED)
Retirement benefits are actuarially reduced to reflect the choice of a survivor benefit. Other benefits include duty and non-duty disability payments, a cost- of-living allowance (based on the Consumer Price Index) capped at three percent annually, and a one-time duty-related death benefit, if the member is found eligible by the Washington State Department of Labor and Industries.
LEOFF Plan 2LEOFF Plan 2 provides retirement, disability and death benefits. Members are vested after completing five years of eligible service. Retirement benefits are determined as two percent of the final average salary (FAS) per year of service, based on the member’s 60 highest-paid consecutive service months. Members are eligible for retirement with a full benefit at age 53 with at least five years of service credit. Members who retire prior to age 53 receive reduced benefits. At age 50, members with at least 20 years of service credit can receive a benefit that is reduced by three percent for each year prior to age 53. LEOFF plan 2 retirement benefits are also actuarially reduced to reflect the choice of a survivor benefit.
Other benefits include duty and non-duty disability payments, a cost-of-living allowance (based on the Consumer Price Index), capped at three percent annually, and a one-time duty-related death benefit, if the member is found eligible by the Washington State Department of Labor and Industries.
FIDUCIARY NET POSITIONThe pension plans’ fiduciary net positions have been determined on the same basis as they are reported by the pension plans. DRS financial statements have been prepared in conformity with generally accepted accounting principles (GAAP). The retirement plans are accounted for in pension trust funds using the flow of economic resources measurement focus and the accrual basis of accounting. Member contributions are recognized as revenues in the period in which the contributions are earned. Employer contributions are recognized when due, and the employer has made a formal commitment to provide the contributions. Benefits and refunds are recognized when due and payable, in accordance with the terms of each plan.
The RCW (chapter 43.33 A) authorizes The Washington State Investment Board (WSIB) to have the investment management responsibility for the pension funds. Investments are reported at fair value, and unrealized gains and losses are included as investment income in the Statement of Changes in Fiduciary Net Position presented in the DRS Comprehensive Annual Financial Report. Purchases and sales of investments are recorded on a trade-date basis.
DRS publishes an annual report for retirement plans, which is available at: http://www.drs.wa.gov/administration/annualreport/.
ACTUARIAL ASSUMPTIONSAccounting requirements dictate the use of assumptions to best estimate the impact that pension obligations will have on the University. The professional judgments used in determining these assumptions are important, and can significantly impact the resulting actuarial estimates. Differences between actual results compared to these assumptions could have a significant effect on the University’s financial statements.
The total pension liability for each DRS plan was determined by an actuarial valuation, conducted by the Washington State Office of the State Actuary (OSA). The University’s 2016 pension liability is based on an OSA valuation performed as of June 30, 2014, with the results rolled forward to the measurement date of June 30, 2015. Likewise, the University’s 2015 pension liability is based on the valuation performed as of June 30, 2013, with the results rolled forward to the measurement date of June 30, 2014. The following actuarial assumptions have been applied to all prior periods included in the measurement:
INFLATION 3.0% TOTAL ECONOMIC INFLATION, 3.75% SALARY INFLATION
SALARY INCREASE EXPECTED TO GROW BY PROMOTIONS AND LONGEVITY IN ADDITION TO SALARY INFLATION ASSUMPTION
INVESTMENT RATE OF RETURN 7.50%
Mortality rates were based on the RP-2000 Combined Healthy Table and Combined Disabled Table published by the Society of Actuaries’ Retirement Plans Experience Committee (RPEC). As recommended by the RCEP, the OSA applied offsets to the base table and recognized future improvements in mortality by projecting the mortality rates using 100% Scale BB. Mortality rates are applied on a generational basis, meaning members are assumed to receive additional mortality improvements in each future year, throughout their lifetimes.

FINANCIAL REPORT 2016 / 41
The actuarial assumptions used in the June 30, 2014 and 2013 valuations were based on the results of OSA’s 2007-2012 Experience Study, which is a comprehensive review and update of prior actuarial assumptions. Additional assumptions for subsequent events and law changes are current as of the 2014 actuarial valuation report.
The long-term expected rate of return on pension plan investments was determined by the WSIB using a building block method in which a best estimate of expected future rates of return (expected returns, net of pension plan investment expense, but including inflation) are developed for each major asset class. Those expected returns make up one component of WSIB’s Capital Market Assumptions (CMAs). WSIB uses the CMAs and their target asset allocation to simulate future investment returns over various time horizons.
The long-term expected rate of return of 7.50% approximately equals the median of the simulated investment returns over a 50-year time horizon, adjusted to remove or damper any short term changes that are not expected over the entire 50-year measurement period.
Best estimates of arithmetic real rates of return for each major asset class included in the target asset allocation for each pension plan, as of the measurement dates of June 30, 2015 and 2014, are summarized in the following table:
2016 (Measurement Date 2015)
2015 (Measurement Date 2014)
Asset ClassTarget
Allocation
Long-Term Expected Arithmetic Real Rate of Return
Target Allocation
Long-Term Expected Arithmetic Real Rate of Return
FIXED INCOME 20.00% 1.70% 20.00% 0.80%
TANGIBLE ASSETS 5.00% 4.40% 5.00% 4.10%
REAL ESTATE 15.00% 5.80% 15.00% 5.30%
GLOBAL EQUITY 37.00% 6.60% 37.00% 6.05%
PRIVATE EQUITY 23.00% 9.60% 23.00% 9.05%
The inflation components used to create the above table are 2.20% and 2.70% the measurement dates as of June 30, 2015 and 2014 respectively, and represents WSIB’s most recent long-term estimate of broad economic inflation.
DISCOUNT RATE The discount rate used to measure the total pension liabilities as of June 30, 2016 and 2015 was 7.50%. The projection of cash flows used to determine the discount rate assumed that contributions from plan members will be made at contractually required rates, and that contributions from employers will be made at statutorily required rates, actuarially determined (including the component of PERS 2/3 and TRS 2/3 employer rates pertaining to the unfunded actuarial accrued liabilities for PERS 1 and TRS 1, respectively). Based on those assumptions, the fiduciary net position for each pension plan in which the University participates was projected to be sufficient to make all projected future benefit payments of the current plan members. Therefore, the long-term expected rate of return on pension plan investments was applied to all periods of projected benefit payments to determine the total pension liability.
Using the WSIB long-term expected rate of return, a 7.50% future investment rate of return on pension plan investments was assumed for the test. The expected return on plan assets is the estimated long-term rate of return that will be earned on the investments used to fund the pension obligation. Contributions from plan members and employers were assumed to continue to be made at contractually required rates (including the component of PERS 2/3 and TRS 2/3 employer rates pertaining to the unfunded actuarial accrued liabilities for PERS 1 and TRS 1, respectively, as provided for in chapter 41.45 of the RCW).

NOTES TO FINANCIAL STATEMENTS
UNIVERSITY OF WASHINGTON / 42
(CONTINUED)
SENSITIVITY OF THE NET PENSION LIABILITY (ASSET) TO CHANGES IN THE DISCOUNT RATE The following table presents the University’s net pension liability calculated using the discount rate of 7.50%, as well as what the net pension liability would be if it were calculated using a discount rate that is 1-percentage-point lower (6.50%) or 1-percentage-point higher (8.50%) than the current rate.
EMPLOYER CONTRIBUTION RATESEmployer contribution rates are developed in accordance with Chapter 41.45 of the RCW by the OSA, and include an administrative expense component that is currently set at 0.18%. The statute provides authority to the Pension Funding Council to adopt changes to economic assumptions and contribution rates. The contribution rates and required contributions for each DRS plan in which the University participates are shown in the table below.
Description (Dollars in Thousands) PERS 1 PERS 2/3a TRS 1 TRS 2/3a LEOFF 2
2016
CONTRIBUTION RATE 11.18% 11.18% 13.13% 13.13% 8.59%
CONTRIBUTIONS MADE $ 47,976 $ 59,820 $ 374 $ 606 $ 376
2015
CONTRIBUTION RATE 9.21% 9.21% 10.39% 10.39% 8.59%
CONTRIBUTIONS MADE $ 38,503 $ 45,896 $ 286 $ 307 $ 299 a Plan 2/3 employer rate includes a component to address the Plan 1 unfunded actuarial accrued liability
PROPORTIONATE SHARE (Dollars in thousands)
PERS 1 PERS 2/3 TRS 1 TRS 2/3 LEOFF 2
YEAR ENDED JUNE 30, 2016 8.33% 10.20% 0.13% 0.12% 0.20%
YEAR ENDED JUNE 30, 2015 8.28% 10.00% 0.10% 0.08% 0.21%
UNIVERSITY PROPORTIONATE SHARE Collective pension amounts are determined as of a measurement date, which can be no earlier than an employer’s prior fiscal year. The measurement date for the net pension liabilities recorded by the University as of June 30, 2016 was June 30, 2015. Employer contributions received and processed by the DRS during fiscal year ended June 30, 2015 have been used as the basis for determining each employer’s proportionate share of the collective pension amounts reported by the DRS in their June 30, 2015 Schedules of Employer and Nonemployer Allocations. Likewise, the measurement date for the net pension liabilities recorded by the University as of June 30, 2015 was June 30, 2014, with employer contributions received and processed by the DRS during fiscal year 2014 used as the basis for determining each employer’s proportionate share of the June 30, 2014 collective pension amounts. The University’s proportionate share for each DRS plan is shown in the table below.
DISCOUNT RATE SENSITIVITY – NET PENSION LIABILITY (ASSET) (Dollars in thousands)
2016 2015
Plan 1 % DecreaseCurrent
Discount Rate 1% Increase 1 % Decrease Current
Discount Rate 1% Increase
PERS 1 $ 530,652 $ 435,853 $ 354,335 $ 514,278 $ 417,231 $ 333,926
PERS 2/3 1,065,241 364,303 (172,379) 843,524 202,225 (287,608)
TRS 1 5,089 4,049 3,154 3,707 2,881 2,172
TRS 2/3 4,100 969 (1,359) 2,191 252 (1,189)
LEOFF 2 2,086 (2,083) (5,221) 1,217 (2,844) (5,891)
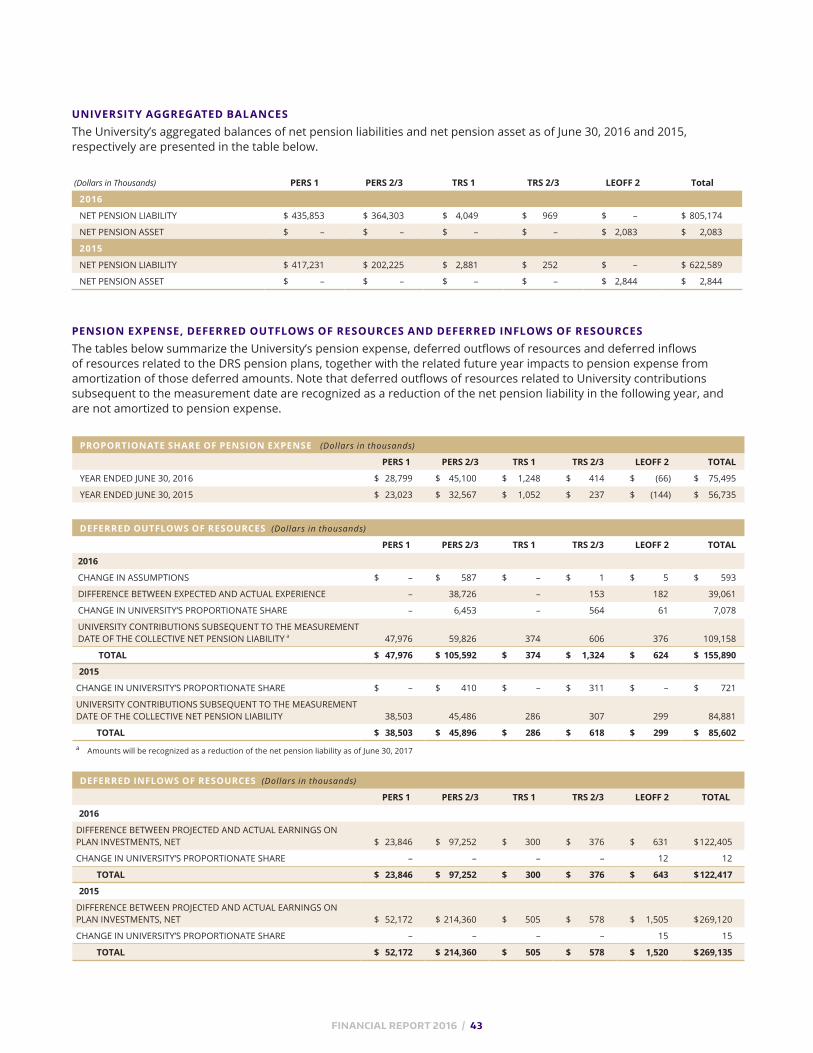
FINANCIAL REPORT 2016 / 43
(Dollars in Thousands) PERS 1 PERS 2/3 TRS 1 TRS 2/3 LEOFF 2 Total
2016
NET PENSION LIABILITY $ 435,853 $ 364,303 $ 4,049 $ 969 $ – $ 805,174
NET PENSION ASSET $ – $ – $ – $ – $ 2,083 $ 2,083
2015
NET PENSION LIABILITY $ 417,231 $ 202,225 $ 2,881 $ 252 $ – $ 622,589
NET PENSION ASSET $ – $ – $ – $ – $ 2,844 $ 2,844
UNIVERSITY AGGREGATED BALANCES The University’s aggregated balances of net pension liabilities and net pension asset as of June 30, 2016 and 2015, respectively are presented in the table below.
PENSION EXPENSE, DEFERRED OUTFLOWS OF RESOURCES AND DEFERRED INFLOWS OF RESOURCESThe tables below summarize the University’s pension expense, deferred outflows of resources and deferred inflows of resources related to the DRS pension plans, together with the related future year impacts to pension expense from amortization of those deferred amounts. Note that deferred outflows of resources related to University contributions subsequent to the measurement date are recognized as a reduction of the net pension liability in the following year, and are not amortized to pension expense.
PROPORTIONATE SHARE OF PENSION EXPENSE (Dollars in thousands)
PERS 1 PERS 2/3 TRS 1 TRS 2/3 LEOFF 2 TOTAL
YEAR ENDED JUNE 30, 2016 $ 28,799 $ 45,100 $ 1,248 $ 414 $ (66) $ 75,495
YEAR ENDED JUNE 30, 2015 $ 23,023 $ 32,567 $ 1,052 $ 237 $ (144) $ 56,735
DEFERRED OUTFLOWS OF RESOURCES (Dollars in thousands)
PERS 1 PERS 2/3 TRS 1 TRS 2/3 LEOFF 2 TOTAL
2016
CHANGE IN ASSUMPTIONS $ – $ 587 $ – $ 1 $ 5 $ 593
DIFFERENCE BETWEEN EXPECTED AND ACTUAL EXPERIENCE – 38,726 – 153 182 39,061
CHANGE IN UNIVERSITY’S PROPORTIONATE SHARE – 6,453 – 564 61 7,078
UNIVERSITY CONTRIBUTIONS SUBSEQUENT TO THE MEASUREMENT DATE OF THE COLLECTIVE NET PENSION LIABILITY a 47,976 59,826 374 606 376 109,158
TOTAL $ 47,976 $ 105,592 $ 374 $ 1,324 $ 624 $ 155,890
2015
CHANGE IN UNIVERSITY’S PROPORTIONATE SHARE $ – $ 410 $ – $ 311 $ – $ 721
UNIVERSITY CONTRIBUTIONS SUBSEQUENT TO THE MEASURE MENT DATE OF THE COLLECTIVE NET PENSION LIABILITY 38,503 45,486 286 307 299 84,881
TOTAL $ 38,503 $ 45,896 $ 286 $ 618 $ 299 $ 85,602a Amounts will be recognized as a reduction of the net pension liability as of June 30, 2017
DEFERRED INFLOWS OF RESOURCES (Dollars in thousands)
PERS 1 PERS 2/3 TRS 1 TRS 2/3 LEOFF 2 TOTAL
2016
DIFFERENCE BETWEEN PROJECTED AND ACTUAL EARNINGS ON PLAN INVESTMENTS, NET $ 23,846 $ 97,252 $ 300 $ 376 $ 631 $ 122,405
CHANGE IN UNIVERSITY’S PROPORTIONATE SHARE – – – – 12 12
TOTAL $ 23,846 $ 97,252 $ 300 $ 376 $ 643 $ 122,417
2015
DIFFERENCE BETWEEN PROJECTED AND ACTUAL EARNINGS ON PLAN INVESTMENTS, NET $ 52,172 $ 214,360 $ 505 $ 578 $ 1,505 $ 269,120
CHANGE IN UNIVERSITY’S PROPORTIONATE SHARE – – – – 15 15
TOTAL $ 52,172 $ 214,360 $ 505 $ 578 $ 1,520 $ 269,135

NOTES TO FINANCIAL STATEMENTS
UNIVERSITY OF WASHINGTON / 44
(CONTINUED)
University of Washington Retirement Plan (403(B))Faculty, librarians and professional staff are eligible to participate in the University of Washington Retirement Plan (UWRP), a 403(b) defined-contribution plan administered by the University.
403(b) Plan DescriptionContributions to the plan are invested by participants in annuity contracts or mutual fund accounts offered by one or more fund sponsors. Employees have at all times a 100% vested interest in their accumulations. Benefits from the plan are available upon separation or retirement at the member’s option. RCW 28B.10.400 et. seq. assigns the authority to the University of Washington Board of Regents to establish and amend benefit provisions.
The number of participants in the 403 (b) plan for the years ended June 30, 2016 and 2015 were 15,962 and 15,415, respectively.
403(b) Funding PolicyEmployee contribution rates, based on age, are 5%, 7.5% or 10% of salary. The University matches the contributions of employees. Within parameters established by the legislature, contribution requirements may be established or amended by the University of Washington Board of Regents. Employer contributions for the years ended June 30, 2016 and 2015 were $111,015,000 and $105,266,000, respectively.
(Dollars in thousands) 2015 2013 2011UAL $ 373,711 $ 292,535 $ 235,048
NORMAL COST $ 14,250 $ 9,529 $ 10,774 AMORTIZATION OF UAL, INCLUDING INTEREST 38,807 29,021 19,607 ARC $ 53,057 $ 38,550 $ 30,381
Actuarial Assumptions (Dollars in thousands) 2015 2013 2011PAYROLL COVERED BY PLAN $ 1,050,000 $ 1,047,000 $ 1,129,000 RATE OF RETURN ASSUMPTION 4.00% 4.25% 4.25%SALARY INCREASES FOR YEARS 1 AND 2 3.75% 3.00% 2.00%SALARY INCREASE FOR THIRD YEAR 3.75% 3.00% 4.00%SALARY INCREASES THEREAFTER 3.75% 3.00% 4.00%
The UAL and ARC were established using the entry age normal cost method.
AMORTIZATION OF DEFERRED INFLOWS AND DEFERRED OUTFLOWS OF RESOURCES (a) (Dollars in thousands)
YEAR PERS 1 PERS 2/3 TRS 1 TRS 2/3 LEOFF 2 TOTAL
2017 $ (9,242) $ (24,475) $ (116) $ 26 $ (202) $ (34,009)
2018 (9,242) (24,475) (116) 26 (202) (34,009)
2019 (9,242) (24,534) (116) 26 (202) (34,068)
2020 3,880 21,998 48 212 154 26,292
2021 – – – 52 46 98
THEREAFTER – – – – 11 11
TOTAL $ (23,846) $ (51,486) $ (300) $ 342 $ (395) $ (75,685)
(a) Negative amounts shown in the table above represent a reduction of expense
University of Washington Supplemental Retirement Plan (401(A))The University of Washington Supplemental Retirement Plan (UWSRP), a 401(a) defined-benefit retirement plan, operates in tandem with the 403(b) plan to supplement the expected defined contribution retirement savings accumulated under the UWRP. The UWSRP was closed to new participants effective March 1, 2011.
The Unfunded Actuarial Accrued Liability (UAL) and Annual Required Contribution (ARC) as of July 1 of the respective years were:
Amounts reported as deferred outflows of resources, exclusive of contributions made after the measurement date, and deferred inflows of resources will be recognized in pension expense as follows:

FINANCIAL REPORT 2016 / 45
(Dollars in thousands) 2016 2015 2014BALANCE AT BEGINNING OF FISCAL YEAR $ 248,186 $ 198,895 $ 163,372ARC 53,057 53,057 38,550PAYMENTS TO BENEFICIARIES (4,257) (3,766) (3,027) BALANCE AT END OF FISCAL YEAR $ 296,986 $ 248,186 $ 198,895
The following table reflects the activity in the UWSRP Net Pension Obligation for the years ended June 30, 2016, 2015 and 2014:
401(a) Plan DescriptionThis plan provides for a supplemental payment component, which guarantees a minimum retirement benefit based upon a one-time calculation at each eligible participant’s retirement date. The University makes direct payments to qualifying retirees when the retirement benefits provided by the 403(b) plan do not meet the benefit goals.
401(a) Plan FundingThe University received an actuarial valuation of the UWSRP with a valuation date of July 1, 2015. The previous evaluations were performed in 2013 and 2011. The University has set aside $198,831,000 and $188,881,000 as of June 30, 2016 and 2015, respectively, for this liability. These funds do not meet the GASB technical definition of “Plan Assets” since they have not been segregated and restricted in a trust or equivalent arrangement. The UAL shown in the table above, therefore, does not reflect a credit for these amounts.
NOTE 16:
Commitments and ContingenciesAuthorized expenditures for construction projects unexpended as of June 30, 2016 and 2015 were $245,773,000 and $157,034,000, respectively. These expenditures will be funded from institutional reserves, debt proceeds and state appropriations.
The University receives and expends substantial amounts under federal and state grants, contracts and programs. This funding is used for research, student aid, Medical Center operations and other programs, and is subject to audit by governmental granting agencies. Certain grant and contract costs billed to the federal government are subject to audit under 2 CFR 200 , “Uniform Administrative Requirements, Cost Principles, and Audit Requirements for Federal Awards.” The University is also involved in various other claims and legal actions arising in the ordinary course of business. University management believes that any liabilities arising from these matters will not have a material effect on the University’s financial statements.
The University is exposed to risk of loss related to tort liability, injuries to employees and loss of property. The University purchases insurance protection for workers’ compensation as well as marine, aviation and certain other risks. The University also purchases insurance protection for loss of property at self-sustaining units, bond-financed buildings and where otherwise required by contract; otherwise, the risk of property loss is retained, unfunded. For medical professional, general, employment practices, automobile liability, and information security and privacy protection, the University maintains a program of self-insurance reserves and excess insurance coverage. The self-insurance reserve represents the estimated ultimate cost of settling claims resulting from events that have occurred on or before the Statements of Net Position date. The reserve includes the undiscounted amounts that will be required for future payments of claims that have been reported, and claims related to events that have occurred but have not yet been reported.
The self-insurance reserve is estimated through an actuarial calculation and included in Long-Term Liabilities. Changes in the self-insurance reserve for the years ended June 30, 2016, 2015, and 2014 are noted below:
(Dollars in thousands) 2016 2015 2014
RESERVE AT BEGINNING OF FISCAL YEAR $ 82,201 $ 67,450 $ 79,708
INCURRED CLAIMS AND CHANGES IN ESTIMATES 24,778 29,495 13,917
CLAIM PAYMENTS (27,826) (14,744) (26,175)
RESERVE AT END OF FISCAL YEAR $ 79,153 $ 82,201 $ 67,450

NOTES TO FINANCIAL STATEMENTS
UNIVERSITY OF WASHINGTON / 46
(CONTINUED)
Condensed combining statements for the University and its blended component units are shown below:
(Dollars in thousands)Statements of Net Position – June 30, 2016
Combined Entities Eliminations
University of Washington
Total Blended Component
Units Medical Entities
Real Estate Entities
ASSETS TOTAL CURRENT ASSETS $ 1,538,816 $ (30,409) $ 1,369,221 $ 200,004 $ 65,627 $ 134,377NONCURRENT ASSETS: TOTAL OTHER ASSETS 4,614,996 – 4,498,009 116,987 99,473 17,514 CAPITAL ASSETS, NET 4,353,141 – 4,059,598 293,543 15,723 277,820 TOTAL ASSETS 10,506,953 (30,409) 9,926,828 610,534 180,823 429,711DEFERRED OUTFLOWS OF RESOURCES 179,355 – 179,355 – – – TOTAL ASSETS AND DEFERRED OUTFLOWS OF RESOURCES $ 10,686,308 $ (30,409) $ 10,106,183 $ 610,534 $ 180,823 $ 429,711
LIABILITIESTOTAL CURRENT LIABILITIES $ 1,060,056 $ (6,972) $ 964,331 $ 102,697 $ 77,832 $ 24,865TOTAL NONCURRENT LIABILITIES 3,539,947 (9,753) 3,124,372 425,328 – 425,328 TOTAL LIABILITIES 4,600,003 (16,725) 4,088,703 528,025 77,832 450,193DEFERRED INFLOWS OF RESOURCES 122,417 – 122,417 – – – TOTAL LIABILITIES AND DEFERRED INFLOWS OF RESOURCES 4,722,420 (16,725) 4,211,120 528,025 77,832 450,193
NET POSITIONNET INVESTMENT IN CAPITAL ASSETS 2,277,608 – 2,277,789 (181) 15,723 (15,904)RESTRICTED: NONEXPENDABLE 1,419,311 – 1,419,311 – – – EXPENDABLE 1,591,440 – 1,591,440 – – –UNRESTRICTED 675,529 (13,684) 606,523 82,690 87,268 (4,578) TOTAL NET POSITION 5,963,888 (13,684) 5,895,063 82,509 102,991 (20,482) TOTAL LIABILITIES, DEFERRED INFLOWS OF RESOURCES AND NET POSITION $ 10,686,308 $ (30,409) $ 10,106,183 $ 610,534 $ 180,823 $ 429,711
(Dollars in thousands)Statements of Net Position – June 30, 2015
Combined Entities Eliminations
University of Washington
Total Blended Component
Units Medical Entities
Real Estate Entities
ASSETS TOTAL CURRENT ASSETS $ 1,402,322 $ (22,327) $ 1,355,339 $ 69,310 $ 66,437 $ 2,873NONCURRENT ASSETS: TOTAL OTHER ASSETS 4,786,897 – 4,675,492 111,405 86,557 24,848 CAPITAL ASSETS, NET 4,172,378 – 3,878,199 294,179 15,251 278,928 TOTAL ASSETS 10,361,597 (22,327) 9,909,030 474,894 168,245 306,649DEFERRED OUTFLOWS OF RESOURCES 111,415 – 111,415 – – – TOTAL ASSETS AND DEFERRED OUTFLOWS OF RESOURCES $ 10,473,012 $ (22,327) $ 10,020,445 $ 474,894 $ 168,245 $ 306,649
LIABILITIESTOTAL CURRENT LIABILITIES $ 998,318 $ (31,313) $ 932,905 $ 96,726 $ 66,701 $ 30,025TOTAL NONCURRENT LIABILITIES 3,159,096 – 2,864,897 294,199 – 294,199 TOTAL LIABILITIES 4,157,414 (31,313) 3,797,802 390,925 66,701 324,224DEFERRED INFLOWS OF RESOURCES 269,135 – 269,135 – – – TOTAL LIABILITIES AND DEFERRED INFLOWS OF RESOURCES 4,426,549 (31,313) 4,066,937 390,925 66,701 324,224
NET POSITIONNET INVESTMENT IN CAPITAL ASSETS 2,156,229 – 2,155,933 296 15,251 (14,955)RESTRICTED: NONEXPENDABLE 1,321,979 – 1,321,979 – – – EXPENDABLE 1,699,135 – 1,699,135 – – –UNRESTRICTED 869,120 8,986 776,461 83,673 86,293 (2,620) TOTAL NET POSITION 6,046,463 8,986 5,953,508 83,969 101,544 (17,575) TOTAL LIABILITIES, DEFERRED INFLOWS OF RESOURCES AND NET POSITION $ 10,473,012 $ (22,327) $ 10,020,445 $ 474,894 $ 168,245 $ 306,649
NOTE 17:
Blended Component Units

FINANCIAL REPORT 2016 / 47
(Dollars in thousands)Statements of Revenues, Expenses and Changesin Net Position – Year ended June 30, 2016
Combined Entities Eliminations
University of Washington
Total Blended Component
UnitsMedical Entities
Real Estate Entities
REVENUESOPERATING REVENUES:STUDENT TUITION AND FEES $ 948,751 $ – $ 948,751 $ – $ – $ –PATIENT SERVICES 1,434,696 (20,475) 1,206,817 248,354 248,354 –GRANT REVENUE 1,294,443 – 1,294,443 – – –OTHER OPERATING REVENUE 674,439 (40,847) 660,223 55,063 1,520 53,543 TOTAL OPERATING REVENUE 4,352,329 (61,322) 4,110,234 303,417 249,874 53,543 EXPENSESOPERATING EXPENSES:OTHER OPERATING EXPENSES 4,709,563 (43,232) 4,434,370 318,425 289,864 28,561DEPRECIATION / AMORTIZATION 324,602 – 307,928 16,674 1,820 14,854 TOTAL OPERATING EXPENSES 5,034,165 (43,232) 4,742,298 335,099 291,684 43,415 OPERATING INCOME (LOSS) (681,836) (18,090) (632,064) (31,682) (41,810) 10,128 NONOPERATING REVENUES (EXPENSES)STATE APPROPRIATIONS 302,097 – 302,097 – – –GIFTS 115,000 – 115,000 – – –INVESTMENT INCOME 44,877 – 43,978 899 899 –OTHER NONOPERATING REVENUES (EXPENSES) (11,846) (4,580) (36,589) 29,323 42,358 (13,035) NET NONOPERATING REVENUES (EXPENSES) 450,128 (4,580) 424,486 30,222 43,257 (13,035) INCOME (LOSS) BEFORE OTHER REVENUES (231,708) (22,670) (207,578) (1,460) 1,447 (2,907)CAPITAL APPROPRIATIONS, GRANTS, GIFTS AND OTHER 60,866 – 60,866 – – –GIFTS TO PERMANENT ENDOWMENTS 88,267 – 88,267 – – – TOTAL OTHER REVENUES 149,133 – 149,133 – – – INCREASE (DECREASE) IN NET POSITION (82,575) (22,670) (58,445) (1,460) 1,447 (2,907)
NET POSITIONNET POSITION – BEGINNING OF YEAR 6,046,463 8,986 5,953,508 83,969 101,544 (17,575)NET POSITION – END OF YEAR $ 5,963,888 $ (13,684) $ 5,895,063 $ 82,509 $ 102,991 $ (20,482)
(Dollars in thousands)Statements of Revenues, Expenses and Changes in Net Position – Year ended June 30, 2015
Combined Entities Eliminations
University of Washington
Total Blended Component
UnitsMedical Entities
Real Estate Entities
REVENUESOPERATING REVENUES:STUDENT TUITION AND FEES $ 914,419 $ – $ 914,419 $ – $ – $ –NET PATIENT SERVICE REVENUES 1,362,279 (8,913) 1,151,404 219,788 219,788 –GRANT REVENUE 1,280,658 – 1,280,658 – – –OTHER OPERATING REVENUE 654,223 (25,677) 642,671 37,229 299 36,930 TOTAL OPERATING REVENUE 4,211,579 (34,590) 3,989,152 257,017 220,087 36,930 EXPENSESOPERATING EXPENSES:OTHER OPERATING EXPENSES 4,365,117 (33,911) 4,134,172 264,856 251,450 13,406DEPRECIATION / AMORTIZATION 310,960 – 293,441 17,519 1,666 15,853 TOTAL OPERATING EXPENSES 4,676,077 (33,911) 4,427,613 282,375 253,116 29,259 OPERATING INCOME (LOSS) (464,498) (679) (438,461) (25,358) (33,029) 7,671 NONOPERATING REVENUES (EXPENSES)STATE APPROPRIATIONS 255,156 – 255,156 – – –GIFTS 115,636 – 115,636 – – –INVESTMENT INCOME (LOSS) 227,404 – 231,471 (4,067) (4,067) –OTHER NONOPERATING REVENUES (EXPENSES) (8,515) 394 (20,913) 12,004 31,674 (19,670) NET NONOPERATING REVENUES (EXPENSES) 589,681 394 581,350 7,937 27,607 (19,670) INCOME (LOSS) BEFORE OTHER REVENUES 125,183 (285) 142,889 (17,421) (5,422) (11,999)CAPITAL APPROPRIATIONS, GRANTS, GIFTS AND OTHER 42,798 – 42,798 – – –GIFTS TO PERMANENT ENDOWMENTS 67,359 – 67,359 – – – TOTAL OTHER REVENUES 110,157 – 110,157 – – – INCREASE (DECREASE) IN NET POSITION 235,340 (285) 253,046 (17,421) (5,422) (11,999)
NET POSITIONNET POSITION – BEGINNING OF YEAR 5,811,123 9,271 5,700,462 101,390 106,966 (5,576)NET POSITION – END OF YEAR $ 6,046,463 $ 8,986 $ 5,953,508 $ 83,969 $ 101,544 $ (17,575)

NOTES TO FINANCIAL STATEMENTS
UNIVERSITY OF WASHINGTON / 48
(CONTINUED)
(Dollars in thousands)Statements of Cash Flows – Year ended June 30, 2016
Combined Entities Eliminations
University of Washington
Total Blended Component
UnitsMedical Entities
Real Estate Entities
NET CASH PROVIDED (USED) BY: OPERATING ACTIVITIES $ (254,089) $ – $ (270,971) $ 16,882 $ 4,432 $ 12,450 NONCAPITAL FINANCING ACTIVITIES 545,506 – 542,546 2,960 2,960 – CAPITAL AND RELATED FINANCING ACTIVITIES (343,560) – (472,234) 128,674 (102) 128,776 INVESTING ACTIVITIES 62,723 – 216,968 (154,245) (14,968) (139,277)NET INCREASE (DECREASE) IN CASH AND CASH EQUIVALENTS 10,580 – 16,309 (5,729) (7,678) 1,949
CASH AND CASH EQUIVALENTS – BEGINNING OF THE YEAR 82,905 (9,728) 73,573 19,060 18,034 1,026CASH AND CASH EQUIVALENTS – END OF THE YEAR $ 93,485 $ (9,728) $ 89,882 $ 13,331 $ 10,356 $ 2,975
(Dollars in thousands)Statements of Cash Flows – Year ended June 30, 2015
Combined Entities Eliminations
University of Washington
Total Blended Component
UnitsMedical Entities
Real Estate Entities
NET CASH PROVIDED (USED) BY: OPERATING ACTIVITIES $ (129,586) $ (9,728) $ (106,453) $ (13,405) $ (18,746) $ 5,341 NONCAPITAL FINANCING ACTIVITIES 426,209 – 403,128 23,081 23,081 – CAPITAL AND RELATED FINANCING ACTIVITIES (420,195) – (412,579) (7,616) (1,612) (6,004) INVESTING ACTIVITIES 127,349 – 129,076 (1,727) (1,727) –NET INCREASE (DECREASE) IN CASH AND CASH EQUIVALENTS 3,777 (9,728) 13,172 333 996 (663)
CASH AND CASH EQUIVALENTS – BEGINNING OF THE YEAR 79,128 – 60,401 18,727 17,038 1,689CASH AND CASH EQUIVALENTS – END OF THE YEAR $ 82,905 $ (9,728) $ 73,573 $ 19,060 $ 18,034 $ 1,026
NOTE 17 CONTINUED

FINANCIAL REPORT 2016 / 49
NOTE 18:
Discrete Component UnitsCondensed combining statements for the University’s discrete component units are shown below:
June 30, 2016 June 30, 2015
(Dollars in thousands)
Statements of Net Position
Total Discrete Component
Units Northwest
Hospital
Valley Medical Center
Total Discrete Component
Units Northwest
Hospital
Valley Medical Center
ASSETS AND DEFERRED OUTFLOWS OF RESOURCESTOTAL CURRENT ASSETS $ 265,673 $ 76,962 $ 188,711 $ 238,178 $ 78,426 $ 159,752NONCURRENT ASSETS: TOTAL OTHER ASSETS 185,347 51,315 134,032 176,921 48,895 128,026 CAPITAL ASSETS, NET 461,017 111,815 349,202 467,701 117,735 349,966TOTAL DEFERRED OUTFLOW OF RESOURCES 6,066 6,066 – 6,435 6,435 – TOTAL ASSETS AND DEFERRED OUTFLOWS OF RESOURCES
$ 918,103 $ 246,158 $ 671,945 $ 889,235 $ 251,491 $ 637,744
LIABILITIES AND DEFERRED INFLOWS OF RESOURCESTOTAL CURRENT LIABILITIES $ 167,521 $ 63,516 $ 104,005 $ 141,904 $ 52,083 $ 89,821TOTAL NONCURRENT LIABILITIES 392,847 93,144 299,703 413,472 105,185 308,287TOTAL DEFERRED INFLOWS OF RESOURCES 26,744 – 26,744 9,625 – 9,625 TOTAL LIABILITIES AND DEFERRED INFLOWS OF RESOURCES 587,112 156,660 430,452 565,001 157,268 407,733
NET POSITIONNET INVESTMENT IN CAPITAL ASSETS 71,275 30,674 40,601 67,033 33,864 33,169RESTRICTED: NONEXPENDABLE 1,927 1,927 – 1,943 1,943 – EXPENDABLE 8,788 754 8,034 8,471 459 8,012UNRESTRICTED 249,001 56,143 192,858 246,787 57,957 188,830 TOTAL NET POSITION 330,991 89,498 241,493 324,234 94,223 230,011 TOTAL LIABILITIES, DEFERRED INFLOWS OF RESOURCES AND NET POSITION $ 918,103 $ 246,158 $ 671,945 $ 889,235 $ 251,491 $ 637,744
Year Ended June 30, 2016 Year Ended June 30, 2015
(Dollars in thousands)Statements of Revenues, Expenses and Changes in Net Position
Total Discrete Component
Units Northwest
Hospital
Valley Medical Center
Total Discrete Component
Units Northwest
Hospital
Valley Medical Center
REVENUES OPERATING REVENUES:PATIENT SERVICES $ 877,461 $ 357,598 $ 519,863 $ 822,421 $ 341,405 $ 481,016OTHER OPERATING REVENUE 45,633 15,153 30,480 53,165 15,649 37,516 TOTAL OPERATING REVENUE 923,094 372,751 550,343 875,586 357,054 518,532
EXPENSESOPERATING EXPENSES:
OTHER OPERATING EXPENSES 887,134 373,426 513,708 816,563 352,124 464,439DEPRECIATION / AMORTIZATION 46,822 17,495 29,327 49,238 18,027 31,211 TOTAL OPERATING EXPENSES 933,956 390,921 543,035 865,801 370,151 495,650 OPERATING INCOME (LOSS) (10,862) (18,170) 7,308 9,785 (13,097) 22,882
NONOPERATING REVENUES (EXPENSES)PROPERTY TAX REVENUE 19,902 – 19,902 18,132 – 18,132INVESTMENT INCOME 7,182 2,516 4,666 4,385 981 3,404OTHER NONOPERATING EXPENSES (9,251) 11,143 (20,394) (22,032) 6,769 (28,801) NET NONOPERATING REVENUES (EXPENSES) 17,833 13,659 4,174 485 7,750 (7,265) INCOME (LOSS) BEFORE OTHER REVENUES 6,971 (4,511) 11,482 10,270 (5,347) 15,617CAPITAL GRANTS, GIFTS AND OTHER (214) (214) – 169 169 – INCREASE (DECREASE) IN NET POSITION 6,757 (4,725) 11,482 10,439 (5,178) 15,617
NET POSITIONNET POSITION – BEGINNING OF YEAR 324,234 94,223 230,011 313,795 99,401 214,394NET POSITION – END OF YEAR $ 330,991 $ 89,498 $ 241,493 $ 324,234 $ 94,223 $ 230,011

UNIVERSITY OF WASHINGTON / 50
SCHEDULES OF REQUIRED SUPPLEMENTARY INFORMATION
Schedule of Proportionate Share of the Net Pension Liability
PERS 1(Dollars in thousands) 2016 2015
UNIVERSITY’S PROPORTION OF THE NET PENSION LIABILITY 8.33% 8.28%
UNIVERSITY’S PROPORTIONATE SHARE OF THE NET PENSION LIABILITY $ 435,853 $ 417,231
UNIVERSITY’S COVERED-EMPLOYEE PAYROLL $ 22,341 $ 25,376
UNIVERSITY’S PROPORTIONATE SHARE OF THE NET PENSION LIABILITY AS A PERCENTAGE OF COVERED-EMPLOYEE PAYROLL 1950.91% 1644.20%
PLAN FIDUCIARY NET POSITION AS A PERCENTAGE OF THE TOTAL PENSION LIABILITY 59.10% 61.19%
Schedule of Contributions
PERS 1(Dollars in thousands) 2016 2015
CONTRACTUALLY REQUIRED CONTRIBUTION $ 2,155 $ 2,058
CONTRIBUTIONS IN RELATION TO THE CONTRACTUALLY REQUIRED CONTRIBUTION $ 2,155 $ 2,059
CONTRIBUTION DEFICIENCY (EXCESS) $ – $ (1)
UNIVERSITY’S COVERED-EMPLOYEE PAYROLL $ 19,450 $ 22,341
CONTRIBUTIONS AS A PERCENTAGE OF COVERED-EMPLOYEE PAYROLL 11.08% 9.21%
Schedule of Contributions
TRS 1(Dollars in thousands) 2016 2015
CONTRACTUALLY REQUIRED CONTRIBUTION $ 38 $ 44
CONTRIBUTIONS IN RELATION TO THE CONTRACTUALLY REQUIRED CONTRIBUTION $ 38 $ 42
CONTRIBUTION DEFICIENCY (EXCESS) $ – $ 2
UNIVERSITY’S COVERED-EMPLOYEE PAYROLL $ 306 $ 423
CONTRIBUTIONS AS A PERCENTAGE OF COVERED-EMPLOYEE PAYROLL 12.42% 10.40%
Schedule of Proportionate Share of the Net Pension Liability
PERS 2/3(Dollars in thousands) 2016 2015
UNIVERSITY’S PROPORTION OF THE NET PENSION LIABILITY 10.20% 10.00%
UNIVERSITY’S PROPORTIONATE SHARE OF THE NET PENSION LIABILITY $ 364,303 $ 202,225
UNIVERSITY’S COVERED-EMPLOYEE PAYROLL $ 904,661 $ 856,839
UNIVERSITY’S PROPORTIONATE SHARE OF THE NET PENSION LIABILITY AS A PERCENTAGE OF COVERED-EMPLOYEE PAYROLL 40.27% 23.60%
PLAN FIDUCIARY NET POSITION AS A PERCENTAGE OF THE TOTAL PENSION LIABILITY 89.20% 93.29%
Schedule of Proportionate Share of the Net Pension Liability
TRS 2/3(Dollars in thousands) 2016 2015
UNIVERSITY’S PROPORTION OF THE NET PENSION LIABILITY 0.12% 0.08%
UNIVERSITY’S PROPORTIONATE SHARE OF THE NET PENSION LIABILITY $ 969 $ 252
UNIVERSITY’S COVERED-EMPLOYEE PAYROLL $ 5,367 $ 3,391
UNIVERSITY’S PROPORTIONATE SHARE OF THE NET PENSION LIABILITY AS A PERCENTAGE OF COVERED-EMPLOYEE PAYROLL 18.05% 7.43%
PLAN FIDUCIARY NET POSITION AS A PERCENTAGE OF THE TOTAL PENSION LIABILITY 92.48% 96.81%
Schedule of Contributions
PERS 2/3(Dollars in thousands) 2016 2015
CONTRACTUALLY REQUIRED CONTRIBUTION $ 107,424 $ 83,323
CONTRIBUTIONS IN RELATION TO THE CONTRACTUALLY REQUIRED CONTRIBUTION $ 108,413 $ 83,342
CONTRIBUTION DEFICIENCY (EXCESS) $ (989) $ (19)
UNIVERSITY’S COVERED-EMPLOYEE PAYROLL $ 967,955 $ 904,661
CONTRIBUTIONS AS A PERCENTAGE OF COVERED-EMPLOYEE PAYROLL 11.10% 9.21%
Schedule of Contributions
TRS 2/3 (Dollars in thousands) 2016 2015
CONTRACTUALLY REQUIRED CONTRIBUTION $ 956 $ 558
CONTRIBUTIONS IN RELATION TO THE CONTRACTUALLY REQUIRED CONTRIBUTION $ 985 $ 555
CONTRIBUTION DEFICIENCY (EXCESS) $ (29) $ 3
UNIVERSITY’S COVERED-EMPLOYEE PAYROLL $ 7,507 $ 5,367
CONTRIBUTIONS AS A PERCENTAGE OF COVERED-EMPLOYEE PAYROLL 12.73% 10.40%
Schedule of Proportionate Share of the Net Pension Liability
TRS 1(Dollars in thousands) 2016 2015
UNIVERSITY’S PROPORTION OF THE NET PENSION LIABILITY 0.13% 0.10%
UNIVERSITY’S PROPORTIONATE SHARE OF THE NET PENSION LIABILITY $ 4,049 $ 2,881
UNIVERSITY’S COVERED-EMPLOYEE PAYROLL $ 423 $ 514
UNIVERSITY’S PROPORTIONATE SHARE OF THE NET PENSION LIABILITY AS A PERCENTAGE OF COVERED-EMPLOYEE PAYROLL 957.21% 560.51%
PLAN FIDUCIARY NET POSITION AS A PERCENTAGE OF THE TOTAL PENSION LIABILITY 65.70% 68.77%

FINANCIAL REPORT 2016 / 51
Schedule of Proportionate Share of the Net Pension Liability (Asset)
LEOFF 2(Dollars in thousands) 2016 2015
UNIVERSITY’S PROPORTION OF THE NET PENSION LIABILITY (ASSET) 0.20% 0.21%
UNIVERSITY’S PROPORTIONATE SHARE OF THE NET PENSION LIABILITY (ASSET) $ (2,083) $ (2,844)
UNIVERSITY’S COVERED-EMPLOYEE PAYROLL $ 3,534 $ 3,581
UNIVERSITY’S PROPORTIONATE SHARE OF THE NET PENSION LIABILITY (ASSET) AS A PERCENTAGE OF ITS COVERED-EMPLOYEE PAYROLL -58.94% -79.42%
PLAN FIDUCIARY NET POSITION AS A PERCENTAGE OF THE TOTAL PENSION LIABILITY 111.67% 116.75%
Schedule of Contributions
LEOFF 2(Dollars in thousands) 2016 2015
CONTRACTUALLY REQUIRED CONTRIBUTION $ 384 $ 303
CONTRIBUTIONS IN RELATION TO THE CONTRACTUALLY REQUIRED CONTRIBUTION $ 384 $ 300
CONTRIBUTION DEFICIENCY (EXCESS) $ – $ 3
UNIVERSITY’S COVERED-EMPLOYEE PAYROLL $ 4,474 $ 3,534
CONTRIBUTIONS AS A PERCENTAGE OF COVERED-EMPLOYEE PAYROLL 8.58% 8.57%
NOTES TO REQUIRED SUPPLEMENTARY INFORMATION FOR THE YEAR ENDED JUNE 30, 2016The Office of the State Actuary calculates the actuarially determined contributions (ADC) based on the results of an actuarial valuation consistent with the state’s funding policy defined in Chapter 41.45 RCW. Consistent with the state’s contribution-rate adoption process, the results of an actuarial valuation with an odd-numbered year valuation date determine the ADC for the biennium that ensues two years later. For example, the actuarial valuation with a June 30, 2013, valuation date, completed in the fall of 2014, determines the ADC for the period beginning July 1, 2015, and ending June 30, 2017.


This publication was prepared by Financial Management. Published December 2016.
The 2016 UW Financial Report and reports from previous years are available at annualreport.uw.edu.
For more information, contact Financial Accounting at 206.221.7845 or [email protected]
P H O T O G R A P H Y: Stephen Forbes, Katherine B. Turner
D E S I G N , P R O D U C T I O N , A N D P R I N T C O O R D I N A T I O N: UW Creative Communications
V I S I T O U R W E B S I T E : uw.edu
© 2016 University of Washington
Printed on recycled paper containing 30% post-consumer fiber
B O A R D O F R E G E N T S *
Patrick M. Shanahan, Chair
Jeremy Jaech, Vice Chair
William S. Ayer
Joel Benoliel
Kristianne Blake
Joanne R. Harrell
Constance W. Rice
Rogelio Riojas
Herb Simon
Austin Wright-Pettibone
* As of October 21, 2016
A D M I N I S T R A T I V E O F F I C E R S *
Ana Mari Cauce President
Gerald J. Baldasty Provost and Executive Vice President
Elizabeth Cherry Interim Vice President for Finance and Facilities
Rickey Hall Vice President for Minority Affairs and Diversity
Randy Hodgins Vice President for External Affairs
Vikram Jandhyala Vice President for Innovation Strategy
Mindy Kornberg Vice President for Human Resources
Connie Kravas Vice President for University Advancement
Paul G. Ramsey CEO, UW Medicine, Executive Vice President for Medical Affairs and Dean of the School of Medicine
Denzil Suite Vice President for Student Life
Kelli Trosvig Vice President for UW Information Technology and Chief Information Officer


SUPPLEMENTAL
BONDHOLDER INFORMATION

STUDENTS & ENROLLMENT
CENSUS DAY AUTUMN QUARTER
2015 2016UNDERGRADUATE
FreshmenApplied 41,257 48,471Accepted 23,183 23,776Percent Accepted to Applied 56% 49%Enrolled 7,943 (1) 7,802Percent Enrolled to Accepted 34% 33%
TransfersApplied 9,819 9,619Accepted 4,747 5,164Percent Accepted to Applied 48% 54%Enrolled 3,123 3,207Percent Enrolled to Accepted 66% 62%
Total Undergraduate FTEBothell 4,402 4,804Seattle 29,888 29,873Tacoma 3,685 3,996Total All Campuses 37,975 38,673
Totals Undergraduate HeadcountBothell 4,698 5,113Seattle 31,525 31,418Tacoma 3,940 4,301Total All Campuses 40,163 40,832
Additional Enrollment StatisticsPercent Non-resident Students (2) 32% 27%Percent Retention (Freshman to Sophomore) 92% 92%Mean GPA 3.70 3.70Median GPA 3.78 3.79Percent of Class Reporting GPA Data 100% 100%Mean Combined SAT Scores 1210 1200Median Combined SAT Scores 1230 1220Percent of Class Reporting SAT Data 81% 78%
GRADUATE
Applied 32,248 32,562Accepted 9,693 9,703Percent Accepted to Applied 30% 30%Enrolled 4,717 4,693Percent Enrolled to Accepted 49% 48%Graduate FTE 14,154 14,401Graduate Headcount 13,595 13,896
(1) Restatedtoincludeonlyfirsttime,firstyearfreshmen(2) Includes Graduate and Undergraduate Students
UnlessotherwisenotedallfiguresincludeSeattle,TacomaandBothellcampuses

STUDENTS & ENROLLMENT
CENSUS DAY AUTUMN QUARTER
2015 2016PROFESSIONAL
LawApplied 2,877 2,517Accepted 775 677Enrolled 170 156Law Headcount 474 482
PharmacyApplied 399 401Accepted 131 131Enrolled 92 106Pharmacy Headcount 378 386
Dentistry Applied 1,022 1,096Accepted 94 92Enrolled 63 63Dental Headcount 260 261
Medicine Applied 8,090 8,777Accepted 291 326Enrolled 245 270Medicine Headcount 897 952Total Professional FTE 3,834 3,900
Total Professional Headcount 2,009 2,081
Tuition and Fees (full academic year)Undergraduate Resident $ 11,839 (1) $10,752 (2)
Undergraduate Non-Resident $ 34,143 $ 34,791Graduate Resident $ 16,665 $ 16,653Graduate Non-Resident $ 28,908 $ 28,896BusinessMastersResident $ 31,200 $ 32,394BusinessMastersNon-Resident $ 45,450 $ 47,214Law Resident $ 31,962 $ 32,721Law Non-Resident $ 44,124 $ 44,112Pharmacy Resident $ 28,362 $ 29,577Pharmacy Non-Resident $ 50,286 $ 50,274Medical Resident $ 33,759 $ 34,728
Medical Non-Resident $ 64,194 $ 64,182Dentistry Resident $ 43,494 $ 46,875Dentistry Non-Resident $ 66,483 $ 71,703
University FTEUndergraduate 37,975 38,673Graduate 14,154 14,401Professional 3,834 3,900 TotalUniversityFTE 55,963 56,973
University HeadcountUndergraduate 40,163 40,832Graduate 13,595 13,896Professional 2,009 2,081
Total University Headcount 55,767 56,809
CONTINUED
UnlessotherwisenotedallfiguresincludeSeattle,TacomaandBothellcampuses
(1) Revision of previously reported total(2) The University reduced resident undergraduate tuition as part of an agreement with the Legislature that resulted in increased State appropriations

FACULTY & OTHER DATA
AUTUMN QUARTER
2015 2016FACULTY DATA
Number of faculty (1) 4,703 4,707 Tenure rate (%) 36% 36%Percent holding terminal degree (Ph.D., MD, DDS)
93% 93%
HOUSING AND DINING
RoomandBoard (2) $ 10,576 $ 11,036 Autumn Opening Occupancy 7,010 7,024 Occupancy (3) 112% 113%
(1) Facultyheadcountreflectscorefacultycomprisedofprofessional,instructional,andresearchcategories.Headcountassociatedwithtemporaryfacultycategories is excluded
(2) Room and board pricing is for the full academic year. The room portion of annual room and board pricing is the weighted average of all Residence Hall double rooms in inventory, and dining amount is for a representative meal plan
(3) Numbersreflectas-builtcapacityand10thdayoccupancy(occupancythatexceeds100%istheresultofhousingthreestudentsinaroomdesignedfortwo)

MEDICAL CENTERS (1)
Year Ending June 30,
2015 2016
UWMC, NORTHWEST AND VALLEY FINANCIAL INFORMATION (2)
UWMCTotal Operating Revenue $ 1,083,584 $ 1,135,626Net Income $ 26,745 $ (27,679)
ValleyTotal Operating Revenue $ 518,532 $ 550,343 Net Income $ 15,617 $ 11,481
NorthwestTotal Operating Revenue $ 357,054 $ 372,751 Net Income $ (5,283) $ (4,511)
CombinedTotal Operating Revenue $ 1,959,170 $ 2,058,720 Net Income $ 37,079 $ (20,709)
UWMC, NORTHWEST AND VALLEY PATIENT ACTIVITY STATISTICS
UWMCAdmissions 18,092 18,362Outpatient Visits 302,038 320,037Emergency Visits 26,465 26,555
ValleyDischarges 17,174 17,518Outpatient Visits 471,780 499,814Emergency Visits 81,250 83,067
NorthwestAdmissions 9,934 10,060Outpatient Visits 195,031 197,132Emergency Visits 36,159 35,068
CombinedAdmissions 45,200 45,940Outpatient Visits 968,849 1,016,983Emergency Visits 143,874 144,690
MEDICARE/MEDICAID PAYMENT
Percent of Total Clinical Revenue (3) 40% 40%
(1) Medical Centers include University of Washington Medical Center (UWMC), Northwest Hospital and Medical Center (Northwest) and Valley Medical Center (Valley)(2) Only UWMC revenues are included in General Revenues for the University(3) Percent of total clinical revenue. Medicare and Medicaid payments as a percentage of total clinical revenue. Includes Northwest and Valley

ENDOWMENT RESOURCES
Year Ending June 30,
PORTFOLIO 2015 2016
Endowment Market Value ($000) $ 3,076,226 $ 2,968,013
Portfolio BreakdownTotal Equity 84.0% 87.0%
Domestic 18.0% 16.0%International 37.0% 42.0%Absolute Return 18.0% 17.0%Private Equity 7.0% 8.0%Venture Capital 4.0% 4.0%
Real Assets 6.0% 6.0% Domestic 10.0% 7.0% International 0.0% 0.0%
Total Fixed Income 10.0% 7.0% Cash 0.0% 0.0% Total 100.0% 100.0%
RETURN & SPENDING
Annualized Rates of Return (1) One 6.8% -1.6% Three 11.9% 6.7% Five 10.0% 6.5%
Endowment Return & Spending (2)
Total Annual Return on Endowment ($000) $ 194,974 (3) $ (54,776)Amount Distributed ($000) $ 131,598 (3) $ 141,099Actual Annual Spending Rate 4.65% 4.60%
EXTERNALLY MANAGED FUNDS
Total Annuity and Life Income Funds $ 83,043 $ 75,647Externally Managed Endowments $ 111,442 $ 107,180
INVESTMENT POLICY CHANGE
In September of 2015 the UW Board of Regents approved the creation of the University of Washington InvestmentManagement Company (UWINCO), an internal investment management company. This results in the advisory committeebecoming an advisory board (UWINCO Board).
(1) Net of manager fees(2) Underthespendingpolicy,distributionstoendowedprogramsare4%oftheaveragemarketvalueoftheCEFforthepreviousfiveyears.Thereisan
additional 1% administrative fee bringing the total annual distribution to 5%. Total distribution shown(3) Revision of previously reported total

DURATION IN YEARS
Fund Allocation Range Actual Maximum
Cash Pool $ 569 24% 10% - 40% 0.8 3.0
Liquidity Pool $ 923 39% 25% - 60% 3.5 5.0
DiversifiedInvestmentPool (1) $ 731 31% 15% - 45% n/a n/a
Invested Funds Excluding Capital Assets Pool $ 2,222 95% n/a n/a n/a
Capital Assets Pool (2) $ 123 5% 0% - 15% n/a n/a
Total Operating Funds $ 2,345 100% n/a n/a n/a
OPERATING FUNDS
OPERATING FUNDS – MIX OF INVESTMENTS (Excluding the Capital Assets Pool)
For the quarter ending June 30, 2016
33%39%
19%
4%
5%
AssetBackedSecurities
Treasuries & AgenciesDiversified
Investment Pool
Mortgage Related
(1) DiversifiedInvestmentPoolconsistsofunitsintheUniversity’sendowment,whichareincludedintheendowment’smarketvalue(2) CapitalAssetsPoolconsistsofinternallyfinancedprojects
Note: Numbers may not sum due to rounding
ALLOCATION BY POOLFor the quarter ending June 30, 2016(in millions)
Cash Equivalents & Others

FISCAL YEAR ($000)
2017 2018 2019 2020 2021 2022-2051
TOTAL GENERAL REVENUE DEBT SERVICE
State General Obligation Bonds $ 23,362 $ 19,146 $ 18,440 $ 14,290 $ 14,264 $ 69,397
State Certificates of Participation $ 3,497 $ 3,270 $ 3,126 $ 2,955 $ 2,756 $ 2,163
Revenue BondsGeneralRevenueBonds(1) $ 111,852 $ 112,707 $ 110,363 $ 110,155 $ 111,074 $ 2,264,117LeaseRevenueBonds(2) $ 32,192 $ 56,571 $ 33,088 $ 32,204 $ 32,042 $ 483,199
Subtotal $ 170,903 $ 191,694 $ 165,018 $ 159,604 $ 160,135 $ 2,818,876
Interest on Commercial Paper (3) $ 271 $ – $ – $ – $ – $ –
Equipment Leases & Others (4) $ 5,982 $ 3,769 $ 2,183 $ 2,141 $ 2,142 $ 6,223
Total General Revenue Debt Service $ 177,157 $ 195,463 $ 167,201 $ 161,745 $ 162,277 $ 2,825,099
AFFILIATED ENTITIES
Total Affiliated Entities (5) $ 4,668 $ 709 $ 709 $ 709 $ 709 $ 7,855
Total Debt Service All Obligations (6) $ 181,825 $ 196,172 $ 167,909 $ 162,454 $ 162,986 $ 2,832,954
(1) GeneralRevenueBondsSeries2007,2008,2009,2009B,2010A&B,2011,2012AB&C,2013,2015ABC&D(includesdebtserviceassociatedwithMetropolitanTract)(2) Series2010BWBRP,2013WEDFA,2014WEDFA,and2015WBRP(3) Reflectsinteresttobepaidonoutstandingcommercialpaperthrough1/17/2017.TheUniversityhasauthoritytoissueupto$250millionincommercialpaper(4) Includes capital leases other than leases included as a Lease Revenue obligation(5) Includes Northwest debt service(6) Maynotmatchmostrecentofficialstatementfuturedebttableduetotimingdifferences
Note: Numbers may not sum due to rounding
FUTURE DEBT SERVICE
as of June 30, 2016

OS DISCLOSURE OBLIGATIONS LOCATION IN BONDHOLDERS REPORT
TheauditedfinancialstatementsoftheUniversityforthepriorfiscalyear,preparedinaccordancewith generally accepted accounting principles as promulgated to apply to governmental entities fromtimetotimebytheGovernmentalAccountingStandardsBoard.
Tab 2 (UW Financial Report)
TheamountofUniversityrevenueandotherdebtoutstandinginthatfiscalyear. Tab 2 (UW Financial Report - SRECNP) Tab 2 (UW Financial Report - SNP)
Studentenrollmentinformationforthatfiscalyear,ofthetypeprovidedinthetableentitled“Student and Enrollment” under the heading “UNIVERSITY OF WASHINGTON—Admissions, Student Enrollment and Faculty Information” and distribution of undergraduate enrollment among University campuses.
Tab3(SupplementalBondholderInformation)
Information regarding the number of faculty, tenure rate and percent holding terminal degrees forthatfiscalyear,ofthetypeprovidedinthetableentitled“FACULTYDATA”undertheheading“UNIVERSITY OF WASHINGTON—Admissions, Student Enrollment and Faculty Information.”
Tab3(SupplementalBondholderInformation)
Information regarding room and board fees, autumn opening occupancy and occupancy for that fiscalyear,ofthetypeprovidedinthetableentitled“HOUSINGANDDININGDATA”undertheheading “UNIVERSITY OF WASHINGTON—Admissions, Student Enrollment and Faculty Information.”
Tab3(SupplementalBondholderInformation)
GeneralRevenuesandGeneralRevenuecomponentsforthatfiscalyear,ofthetypeprovidedin the table entitled “GENERAL REVENUES” under the heading “UNIVERSITY OF WASHINGTON—General Revenues.”
Tab 4 (General Revenues)
Grantandcontractrevenuesforthatfiscalyear,andamountorpercentageofgrantandcontractrevenues from federal sources.
Tab 2 (UW Financial Report - SRECNP)
Information regarding the amount or percentage of revenues from Medicare or Medicaid payments inthatfiscalyear.
Tab3(SupplementalBondholderInformation)
Operatingexpensesbytypeofexpenditureinthatfiscalyear. Tab 2 (UW Financial Report - MD&A)
ExpendituresofStatecapitalandoperatingappropriationstotheUniversityforsuchfiscalyear,ofthe type provided in the table entitled “Expenditures of State Appropriations to the University by Type” under the heading “UNIVERSITY OF WASHINGTON—Other University Financial Information—State Funding.”
Tab 2 (UW Financial Report - SRECNP)
UWMedicalCenter,NorthwestandValleyfinancialinformationandpatientactivitystatisticsforsuchfiscalyear,generallyofthetypeprovidedinthetablesundertheheading“UWMedicine.”
Tab3(SupplementalBondholderInformation)
Value of investments, including operating fund investments (currently referred to as “Invested Funds”)andtheConsolidatedEndowmentFund(“CEF”),forthatfiscalyear.
Tab3(SupplementalBondholderInformation)
A narrative description of any material changes to the University’s investment policy or CEF distributionpolicyduringtheprecedingfiscalyear.
Tab3(SupplementalBondholderInformation)
Giftrevenueforthatfiscalyear. Tab 2 (UW Financial Report - SRECNP)
Universityrevenuebysourceforthatfiscalyear,ofthetypeprovidedinthechart“UniversityTotalRevenue by Source, Fiscal Year 2016” under the heading “UNIVERSITY OF WASHINGTON—Other University Financial Information—University Total Revenue by Source.”
Tab 2 (UW Financial Report - MD&A)
TotalUniversityexpendituresbycategoryforthatfiscalyear,ofthetypepresentedundertheheading “UNIVERSITY OF WASHINGTON—Other University Financial Information—University Operating Expenditures.”
Tab 2 (UW Financial Report - MD&A)
University total net assets and unrestricted net assets, of the type presented under the heading “UNIVERSITY OF WASHINGTON—Other University Financial Information—University Net Assets.”
Tab 2 (UW Financial Report - SNA)
A description of any material changes to the University’s obligations with respect to its pension plans, of the type presented under the heading “OTHER UNIVERSITY INFORMATION—Pension Plans.”
Tab 2 (UW Financial Report - Note 15)
A description of any material changes to the University’s obligations with respect to other post-employmentbenefits,ofthetypepresentedundertheheading“OTHERUNIVERSITYINFORMATION—OtherPost-EmploymentRetirementBenefits(“OPEB”).”
Tab 2 (UW Financial Report - Note 14)
Amount of the University’s self-insurance reserve, of the type presented under the heading “OTHER UNIVERSITY INFORMATION—Risk Management.”
Tab 2 (UW Financial Report - Note 16)
OFFICIAL STATEMENT DISCLOSURES

UNIVERSITY OF WASHINGTON COMMUTER SERVICES
(A Department of University of Washington) Financial Statements
June 30, 2016 and 2015 (With Independent Auditors Report Thereon)

UNIVERSITY OF WASHINGTON COMMUTER SERVICES
(A Department of University of Washington)
Table of Contents
PageIndependent Auditors Report 1 Management s Discussion and Analysis 3 Statements of Net Position 10 Statements of Revenues, Expenses, and Changes in Net Position 11 Statements of Cash Flows 12 Notes to Financial Statements 13 Required Supplementary Information 30

Independent Auditors Report
The Board of Regents University of Washington: We have audited the accompanying financial statements of the University of Washington Commuter Services (Unit or CS), a department of the University of Washington, as of and for the years ended June 30, 2016 and 2015, and the related notes to the financial statements, as listed in the table of contents. Management s Responsibility for the Financial Statements Management is responsible for the preparation and fair presentation of these financial statements in accordance with U.S. generally accepted accounting principles; this includes the design, implementation, and maintenance of internal control relevant to the preparation and fair presentation of financial statements that are free from material misstatement, whether due to fraud or error. Auditors Responsibility Our responsibility is to express an opinion on these financial statements based on our audits. We conducted our audits in accordance with auditing standards generally accepted in the United States of America. Those standards require that we plan and perform the audit to obtain reasonable assurance about whether the financial statements are free from material misstatement. An audit involves performing procedures to obtain audit evidence about the amounts and disclosures in the financial statements. The procedures selected depend on the auditors judgment, including the assessment of the risks of material misstatement of the financial statements, whether due to fraud or error. In making those risk assessments, the auditor considers internal control relevant to the entity s preparation and fair presentation of the financial statements in order to design audit procedures that are appropriate in the circumstances, but not for the purpose of expressing an opinion on the effectiveness of the entity s internal control. Accordingly, we express no such opinion. An audit also includes evaluating the appropriateness of accounting policies used and the reasonableness of significant accounting estimates made by management, as well as evaluating the overall presentation of the financial statements. We believe that the audit evidence we have obtained is sufficient and appropriate to provide a basis for our audit opinion. Opinion In our opinion, the financial statements referred to above present fairly, in all material respects, the financial position of the University of Washington Commuter Services as of June 30, 2016 and 2015, and the changes in its net position and its cash flows for the years then ended, in accordance with U.S. generally accepted accounting principles. Emphasis of Matters As discussed in note 1, the financial statements of the Unit, an auxiliary enterprise within the University of Washington (the University), are intended to present the financial position, the changes in financial position, and cash flows of only the respective portion of the business-type activities of the University that is attributable to the transactions of the Unit. They do not purport to, and do not, present fairly the financial position of the University

2
as of June 30, 2016 and 2015, the changes in its financial position or its cash flows for the years then ended, in conformity with U.S. generally accepted accounting principles. Our opinion is not modified with respect to this matter.As discussed in note 1, on July 1, 2014, the Unit adopted new accounting guidance requiring governments providing defined benefit pensions to their employees to recognize their proportionate share of the pension plan snet pension liability or net pension asset, as well as recognizing most changes in the net pension liability within pension expense. Our opinion is not modified with respect to this matter. Other Matter Required Supplemental Information U.S. nd analysis on pages 3through 9, and the schedules of required supplementary information on pages 30 through 32, be presented to supplement the basic financial statements. Such information, although not a part of the basic financial statements, is required by the Governmental Accounting Standards Board, who considers it to be an essential part of financial reporting for placing the basic financial statements in an appropriate operational, economic, or historical context. We have applied certain limited procedures to the required supplementary information in accordance with auditing standards generally accepted in the United States of America, which consisted of inquiries of management about the methods of preparing the information and comparing the information for consistency with during our audits of the basic financial statements. We do not express an opinion or provide any assurance on the information because the limited procedures do not provide us with sufficient evidence to express an opinion or provide any assurance.
Seattle, Washington December 16, 2016

UNIVERSITY OF WASHINGTON COMMUTER SERVICES
(A Department of University of Washington)
June 30, 2016 and 2015 (Unaudited
3 (Continued)
Discussion and Analysis Prepared by Management The following discussion and analysis provides an overview of the financial position and activities of the University of Washington Commuter Services (CS) as of and for the years ended June 30, 2016, 2015 and 2014. This discussion has been prepared by management and should be read in conjunction with the financial statements and accompanying notes, which follow this section. The financial statements present only the University of Washington Commuter Services and do not purport to, and do not, present fairly the financial position of the University of Washington, as of June 30, 2016 and 2015, the changes in its financial position, or its cash flows for the years then ended in accordance with U.S. generally accepted accounting principles. Using the Financial Statements CS s financial statements include the statements of net position, statements of revenues, expenses, and changes in net position, statements of cash flows, and notes to financial statements. These financial statements are prepared in accordance with Governmental Accounting Standards Board (GASB) principles, which establish standards for external financial reporting for public colleges and universities. Statements of Net Position Summary The statements of net position in the financial statements reflect the financial condition of CS at the end of the year and report the various categories of all assets, deferred outflows of resources, liabilities, and deferred inflows of resources. The following summary statements of net position show CS s total assets, total deferred outflows of resources, total liabilities, total deferred inflows of resources, and net position as of June 30, 2016, 2015 and 2014:
Statements of Net Position Summary2016 2015 2014
Current assets $ 9,822,943 4,736,773 4,194,862 Noncurrent assets:
Capital assets, net 49,486,919 45,544,554 48,989,956 Other noncurrent assets 6,920,440 14,257,092 11,839,214
Total assets 66,230,302 64,538,419 65,024,032 Pension deferred outflows of resources 537,000 263,995
Total assets and deferred outflowsof resources $ 66,767,302 64,802,414 65,024,032
Current liabilities $ 1,711,724 1,797,271 1,814,978 Noncurrent liabilities 10,608,056 14,206,468 13,205,602
Total liabilities 12,319,780 16,003,739 15,020,580

UNIVERSITY OF WASHINGTON COMMUTER SERVICES
(A Department of University of Washington)
June 30, 2016 and 2015 (Unaudited
4 (Continued)
Statements of Net Position Summary2016 2015 2014
Pension deferred inflows of resources $ 335,000 677,575 Net position 54,112,522 48,121,100 50,003,452
Total liabilities, deferred inflows ofresources, and net position $ 66,767,302 64,802,414 65,024,032
Following are comments about the changes highlighted by the summary statements of net position: Current assets consist of cash, accounts receivable, current portion of internal note receivable, and prepaid
expenses. Current assets were $8.1 million, $2.9 million, and $2.4 million greater than current liabilities at the end of fiscal years 2016, 2015, and 2014, respectively. The 2016 increase of $5.1 million, or 107%, was caused by an increase in cash resulting from increased Parking and citation revenue and the gain on the transfer of two garages from Housing and Food Services. The 2015 increase of $542 thousand, or 13%, was caused by a slight increase in parking volume and an increase in accounts receivable primarily due to payment in transit from Commute Options Active Transportation for the Burke Gilman Trail.
Noncurrent assets consist of due to University, internal note receivable, intangible assets, capital assets, and advances to University of Washington (the University) for capital projects. Noncurrent assets decreased by $3.4 million, or 6%, in 2016 and $1.0 million, or 2%, in 2015, respectively. The 2016 decrease was primarily due to $3.3 million prepayment on the internal note receivable and $3.3 million decrease in advances to the University for capital projects. The 2015 decrease was primarily because of a new internal note receivable of $6.6 million offset by $3.9 million decrease in advances to the University for capital projects. Additionally, an increase of $1.2 million of capital asset additions offset by $2.2 million of depreciation and $2.5 million of adjustments to construction in progress related to the transfer out of the Burke Gilman Trail project to Commute Options Active Transportation due to the timing of projects compared to 2014.
Deferred outflows were $537 thousand and $264 thousand at the end of the years 2016 and 2015, respectively, or a 103% and 100% increase, as a result of implementing GASB Statement No. 68, Accounting and Financial Reporting for Pensions in 2015.
Noncurrent liabilities decreased by $3.6 million, or 25%, in fiscal year 2016. The decrease was primarily due to a $3.8 million transfer of Internal Lending Program (ILP) debt from Commuter Services to the University for the University s acquisition of the Transportation Services office building offset by a $600 thousand increase in net pension liability. Noncurrent liabilities increased by $1.0 million or 8% in fiscal year 2015. The 2015 increase was due to $1.6 million for the net pension liability for GASB 68 implementation offset by the $602,000 moving into the current portion of ILP payable due to a 2016 principal payment.
Deferred inflows were $335 thousand and $678 thousand, respectively, for 2016 and 2015 as a result of implementing GASB 68 in 2015.

UNIVERSITY OF WASHINGTON COMMUTER SERVICES
(A Department of University of Washington)
June 30, 2016 and 2015 (Unaudited
5 (Continued)
The change in net position measures whether the overall financial condition has improved or deteriorated during the year. Total net position increased by $6.0 million and decreased by $1.9 million, respectively, or 12% and (4%), during fiscal years 2016 and 2015. The 2016 increase is mostly due to the transfer of debt from Commuter Services to the University for the University s acquisition of the Transportation Services office building and the gain on the transfer of two garages from Housing and Food Services. The 2015 decrease is mostly due to adjustments to construction in progress related to the transfer out of the Burke Gilman Trail project to Commute Options Active Transportation in 2015.
Net Position The following table is a summary of the net position for CS at June 30, 2016, 2015, and 2014:
Net Position Summary2016 2015 2014
Net investment in capital assets $ 40,621,215 32,060,848 35,207,103 Unrestricted 13,491,307 16,060,252 14,796,349
Total net position $ 54,112,522 48,121,100 50,003,452
The categories of net position listed in the table above are defined as follows: Net investment in capital assets is CS s total investment in property, plant, equipment and infrastructure
and unspent debt proceeds, net of accumulated depreciation, and any outstanding debt obligations related to those capital assets.
Unrestricted net position is all other funds available to CS for any purpose. Unrestricted net position is often internally designated for specific purposes.
Following are comments about the changes in CS s net position summary: Net investment in capital assets increased by $8.6 million, or 27%, in fiscal year 2016 to $40.6 million and
decreased by $3.1 million, or 9%, in fiscal year 2015 to a total of $32.1 million. The 2016 balance increased primarily due to two garage additions offset by a transfer of debt to the University for the Transportation Services office building acquisition. The 2015 balance decreased as paid down offset by increases in depreciation and adjustments for construction in progress.
Unrestricted net position decreased by $2.6 million, or 16%, in fiscal year 2016 and increased by $1.3 million, or 9%, in fiscal year 2015. The decrease in 2016 was caused primarily by $3.3 million prepayment on the internal note receivable and the 2015 increase was caused by the increase in operating revenue due to a slight increase in parking volume and a decrease in operating expenses.
Implementation of GASB 68 in 2015 resulted in the restatement of beginning fiscal year 2015 unrestricted net position reducing it by $2.1 million.

UNIVERSITY OF WASHINGTON COMMUTER SERVICES
(A Department of University of Washington)
June 30, 2016 and 2015 (Unaudited
6 (Continued)
Capital Improvements and Related Debt In fiscal year 2016, capital additions were $10.8 million, which primarily included $6.1 million for two garages
from Housing and Food Services and three parking lots E1, E12 and E18 for $3.3 million. In fiscal 2015, capital additions were $1.2 million, which included $2.1 million for Plant Services South parking lot offset by the refund of $1.1 million for the E12 Parking Study as actual costs were under budget.
Total debt decreased from $13.2 million of outstanding principal due at the end of fiscal year 2015 to $8.9 million at the end of fiscal year 2016 as a result of the transfer of debt to the University for the acquisition of the Transportation Services office building for $3.8 million and scheduled principal payments. Additional information on CS capital assets can be found in note 5 of the notes to the financial statements. Total debt decreased from $13.8 million of outstanding principal due at the end of fiscal year 2014 to $13.2 million at the end of fiscal year 2015 as a result of scheduled principal payments. Additional information on CS 7 of the notes to the financial statements.
Statements of Revenues, Expenses, and Changes in Net Position The statements of revenues, expenses, and changes in net position present how CS s operations and nonoperating items resulted in changes in net position. In accordance with GASB reporting principles, revenues, and expenses are classified as either operating or nonoperating. The following summary shows the revenues, expenses, and changes in net position for the years ended June 30, 2016, 2015 and 2014.
Revenues, Expenses, and Changes in Net Position Summary2016 2015 2014
Operating revenues $ 14,372,952 13,156,056 12,338,660 Operating expenses (12,794,482) (11,941,223) (12,613,132)
Operating income (loss) 1,578,470 1,214,833 (274,472) Nonoperating revenues (expenses) 3,729,229 (151,112) (363,130) Other revenues and (transfers) 683,723 (810,091) 1,769,775
Increase in net position 5,991,422 253,630 1,132,173 Net position, beginning of year, as originally
presented 48,121,100 50,003,452 48,871,279 Effect of accounting and reporting entity changes (2,135,982) Net position, end of year $ 54,112,522 48,121,100 50,003,452

UNIVERSITY OF WASHINGTON COMMUTER SERVICES
(A Department of University of Washington)
June 30, 2016 and 2015 (Unaudited
7 (Continued)
Revenues from All Sources The following table summarizes revenues from all sources for the years ended June 30, 2016, 2015 and 2014:
Summary Revenues from All Sources2016 2015 2014
Parking revenue $ 12,204,590 11,221,627 10,406,575 Fine revenue 1,120,875 869,448 814,225 Reimbursement for football-related expenses 138,304 149,028 166,464 Revenue from Triangle Garage 909,183 915,953 951,396 Interest income 446,291 476,640 289,534 Capital contribution 1,827,234 2,584,000 Transfer of ILP Debt to the University 3,798,490 Due from University 60,512
$ 20,444,967 13,693,208 15,212,194
Following are comments about the changes highlighted by the revenues from all sources summary: Parking revenue continues to be the largest source of revenue for CS. Parking revenue increased by
$983 thousand, or 9%, in 2016 primarily due to an increase in volume and an increase in rates for students, faculty, and staff. Parking revenue increased by $815 thousand, or 8%, in 2015 primarily due to an increase in volume.
Fine revenue increased $251 thousand, or 29%, and $55 thousand, or 7%, in 2016 and 2015, respectively, as a result of an increase in the number of citations issued and collected.
Interest income in 2016 decreased $30 thousand, or (6%), and was materially unchanged. In 2015, interest income increased $187 thousand or 65% due to an increase in the average cash balance and the addition of a new note receivable. A portion of interest income represents interest earned from cash and cash equivalents in the University s Invested Funds Pool and advances to the University for capital projects. The 2015 note receivable is with Commute Options Active Transportation for the construction of the Burke Gilman Trail project.
The 2016 capital contribution of $1.8 million net resulted from the transfer of the Terry/Maple and Lander garages from Housing and Food Services to Commuter Services offset by the transfer of the Transportation Services office building to the University. The transfer of debt to the University of $3.8 million in fiscal year 2016 was for the acquisition of the Transportation Services office building.

UNIVERSITY OF WASHINGTON COMMUTER SERVICES
(A Department of University of Washington)
June 30, 2016 and 2015 (Unaudited
8 (Continued)
Expenses and Expense Transfers The following table summarizes expenses and expense transfers for the years ended June 30, 2016, 2015 and 2014:
Summary Expenses and Expense Transfers2016 2015 2014
Salaries and wages $ 2,928,057 2,613,117 2,606,907 Employee benefits 975,954 630,535 807,154 Temporary services 259,887 234,886 61,386 Maintenance 963,694 1,806,857 3,150,651 Printing 92,425 90,407 63,613 Outside services 843,592 343,441 243,543 Utilities 357,200 326,392 267,973 Data processing 206,723 179,665 224,030 Motorpool 132,800 122,129 129,032 Garage rental 42,302 35,488 35,248 Insurance 26,301 23,435 23,401 Supplies and materials 559,521 437,602 416,660 Telephone 77,715 58,631 56,687 Campus services 1,600,641 1,511,221 1,443,423 Miscellaneous 106,139 285,859 95,144 University overhead 1,143,405 1,064,797 991,250 Depreciation 2,478,126 2,176,761 1,997,030 Interest 515,552 627,752 652,664
Total expenses 13,310,034 12,568,975 13,265,796 Transfer to the University for UPASS 1,120,875 869,448 814,225 Loss on disposal of equipment 22,636 1,155
Total expense transfers 1,143,511 870,603 814,225 Total expenses and expense
transfers $ 14,453,545 13,439,578 14,080,021

UNIVERSITY OF WASHINGTON COMMUTER SERVICES
(A Department of University of Washington)
June 30, 2016 and 2015 (Unaudited
9
Following are comments about the changes in expenses and expense transfers highlighted by the expenses and transfers summary: CS s expenses increased by $741 thousand, or 6%, and decreased by $697 thousand, or 5%, respectively,
in fiscal years 2016 and 2015. The increase in 2016 is primarily due to the increase in headcount in addition to increases in wage and benefit rates by $660 thousand. The 2015 decrease is primarily due to a $1.3 million decrease in maintenance expense offset by increases in temporary services, miscellaneous, and depreciation expenses discussed below.
CS s temporary services expense increased $25 thousand, or 11%, and $174 thousand, or 283%, respectively, in fiscal years 2016 and 2015. The increase in 2015 was due to a significant number of retirements and the addition of a second maintenance shift.
CS s maintenance expense decreased by $843 thousand, or 47%, and $1.3 million, or 43%, respectively, in fiscal years 2016 and 2015. The primary decrease in 2016 and 2015 was the result of less work performed on painting and paving garages and parking lots.
CS s outside services expense increased by $500 thousand, or 146%, and $100 thousand, or 41%, respectively, in fiscal years 2016 and 2015. The increase in 2016 and 2015 is the result of an increase in the use of an outside contractor for a new parking gate access system.
CS s miscellaneous expense decreased by $180 thousand or 63% and increased $191 thousand or 200%, respectively, in fiscal years 2016 and 2015. The decrease in 2016 and the increase in 2015 were due to consulting services for a condition assessment of parking lots and garages in 2015.
CS s depreciation expense increased by $301 thousand, or 14%, and $180 thousand, or 9%, respectively, in fiscal years 2016 and 2015, due to various capital asset additions in the fiscal year.
CS s transfer to the University for UPASS increased by $251 thousand, or 29%, and $55 thousand, or 7%, in fiscal 2016 and 2015, respectively. The fine revenue in 2016 and 2015 was used to support the UPASS program. The UPASS program is operated by the University s Commute Options Group and provides a package of flexible, low cost transportation choices for faculty, staff, and students. It includes unlimited access to public transit, and a parking management component that subsidizes carpool and vanpool parking rather than single occupant vehicles.

UNIVERSITY OF WASHINGTONCOMMUTER SERVICES
(A Department of University of Washington)Statements of Net PositionJune 30, 2016 and 2015
Assets and Deferred Outflows of Resources 2016 2015Current assets:
Cash in the University of Washington Invested Funds Pool(note 2) $ 9,581,745 3,985,880
Internal note receivable, current portion (note 4) 56,371 107,266 Accounts receivable 143,761 609,562 Prepaid expenses 41,066 34,065
Total current assets 9,822,943 4,736,773 Noncurrent assets:
Due (to) from University (3,000) 11,331 Internal note receivable, net of current portion (note 4) 3,261,620 6,629,581 Advances to University for capital projects 3,316,422 7,616,180 Intangible Assets 345,398 — Capital assets (less accumulated depreciation of $42,397,535 and $41,638,806,
respectively) (note 5) 49,486,919 45,544,554 Total noncurrent assets 56,407,359 59,801,646 Total assets 66,230,302 64,538,419
Pension deferred outflows of resources (note 9) 537,000 263,995 Total assets and deferred outflows of resources $ 66,767,302 64,802,414
Liabilities, Deferred Inflows of Resources, and Net PositionCurrent liabilities:
Accounts payable $ 590,366 575,866 Accrued salaries and vacation payable 383,680 403,827 Unearned revenue 241,030 215,327 Internal lending program payable, current portion (note 7) 496,648 602,251
Total current liabilities 1,711,724 1,797,271 Noncurrent liabilities:
Internal lending program payable, net of current portion (note 7) 8,369,056 12,603,351 Net Pension Liability (note 9) 2,239,000 1,603,117
Total noncurrent liabilities 10,608,056 14,206,468 Total liabilities 12,319,780 16,003,739
Pension deferred inflows of resources (note 9) 335,000 677,575 Net position:
Net investment in capital assets 40,621,215 32,060,848 Unrestricted 13,491,307 16,060,252
Total net position 54,112,522 48,121,100 Total liabilities, deferred inflows of resources, and net position $ 66,767,302 64,802,414
See accompanying notes to financial statements.
10
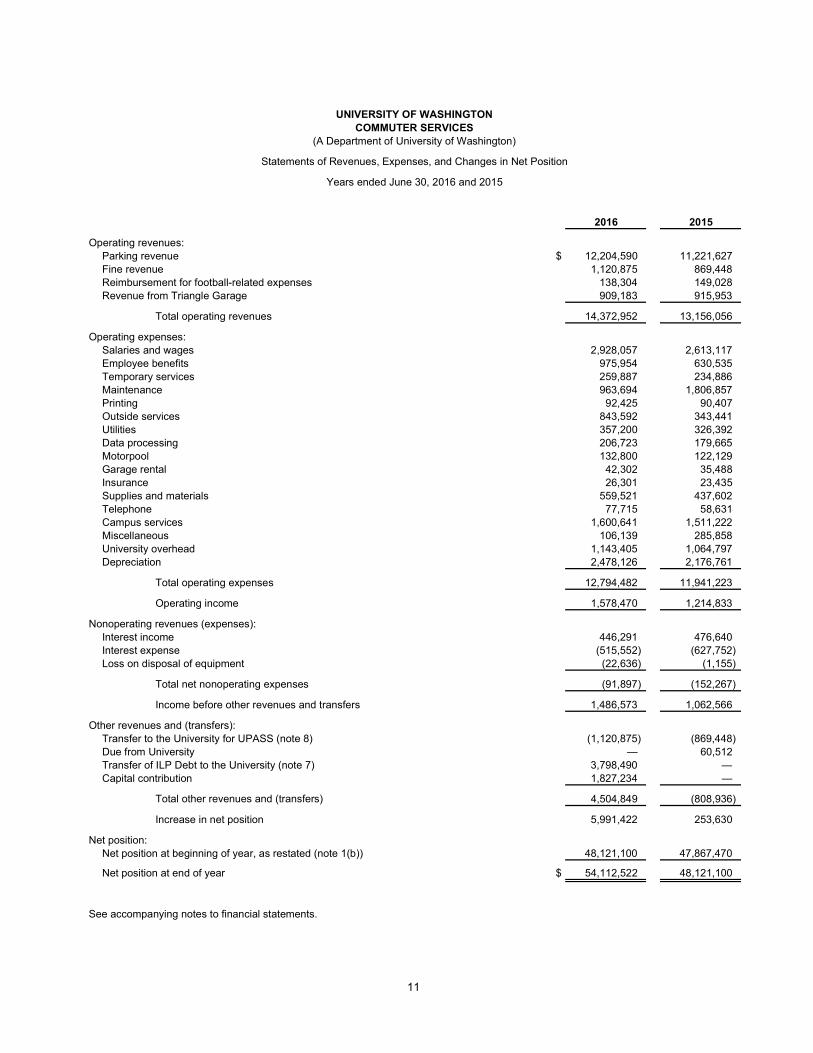
UNIVERSITY OF WASHINGTONCOMMUTER SERVICES
(A Department of University of Washington)Statements of Revenues, Expenses, and Changes in Net Position
Years ended June 30, 2016 and 2015
2016 2015Operating revenues:
Parking revenue $ 12,204,590 11,221,627 Fine revenue 1,120,875 869,448 Reimbursement for football-related expenses 138,304 149,028 Revenue from Triangle Garage 909,183 915,953
Total operating revenues 14,372,952 13,156,056 Operating expenses:
Salaries and wages 2,928,057 2,613,117 Employee benefits 975,954 630,535 Temporary services 259,887 234,886 Maintenance 963,694 1,806,857 Printing 92,425 90,407 Outside services 843,592 343,441 Utilities 357,200 326,392 Data processing 206,723 179,665 Motorpool 132,800 122,129 Garage rental 42,302 35,488 Insurance 26,301 23,435 Supplies and materials 559,521 437,602 Telephone 77,715 58,631 Campus services 1,600,641 1,511,222 Miscellaneous 106,139 285,858 University overhead 1,143,405 1,064,797 Depreciation 2,478,126 2,176,761
Total operating expenses 12,794,482 11,941,223 Operating income 1,578,470 1,214,833
Nonoperating revenues (expenses):Interest income 446,291 476,640 Interest expense (515,552) (627,752) Loss on disposal of equipment (22,636) (1,155)
Total net nonoperating expenses (91,897) (152,267) Income before other revenues and transfers 1,486,573 1,062,566
Other revenues and (transfers):Transfer to the University for UPASS (note 8) (1,120,875) (869,448) Due from University — 60,512 Transfer of ILP Debt to the University (note 7) 3,798,490 — Capital contribution 1,827,234 —
Total other revenues and (transfers) 4,504,849 (808,936) Increase in net position 5,991,422 253,630
Net position:Net position at beginning of year, as restated (note 1(b)) 48,121,100 47,867,470 Net position at end of year $ 54,112,522 48,121,100
See accompanying notes to financial statements.
11

UNIVERSITY OF WASHINGTONCOMMUTER SERVICES
(A Department of University of Washington)Statements of Cash Flows
Years ended June 30, 2016 and 2015
2016 2015Cash flows from operating activities:
Receipts from parking fees and fines $ 13,816,969 11,979,096 Receipts from reimbursement for football-related expenses 138,304 149,028 Receipts from Triangle Garage 909,183 915,953 Payments to suppliers (5,261,442) (5,515,300) Payments to employees (2,948,204) (2,614,163) Payments for benefits (941,320) (761,150) Payments to the University for overhead (1,143,405) (1,064,797)
Net cash provided by operating activities 4,570,085 3,088,667 Cash flows from noncapital financing activities:
Transfer to the University for UPASS (1,120,875) (869,448) Other Transfers from the University — 60,512
Net cash used in noncapital financing activities (1,120,875) (808,936) Cash flows from capital and related financing activities:
Payment from (to) University for capital assets 2,660,355 (1,298,085) Principal paid on bonds payable (541,408) (577,251) Interest paid (515,552) (627,752)
Net cash provided by (used in) capital and related financing activities 1,603,395 (2,503,088) Cash flows from investing activities:
Principal received on note receivable – internal 96,969 51,756 Interest income 446,291 476,640
Net cash provided by investing activities 543,260 528,396 Net increase in cash and cash equivalents 5,595,865 305,039
Cash and cash equivalents at beginning of year 3,985,880 3,680,841 Cash and cash equivalents at end of year $ 9,581,745 3,985,880 Reconciliation of operating income to net cash provided by operating activities:
Operating income $ 1,578,470 1,214,833 Adjustments to reconcile operating income to net cash provided by
operating activities:Depreciation expense 2,478,126 2,176,761 Changes in assets and liabilities:
Increase (decrease) in net pension liability 635,883 (738,887) (Decrease) increase in pension-related deferred outflows/inflows of resources (615,580) 619,603 Increase (decrease) in due from University 14,331 (11,331) Increase (decrease) in accounts receivable 465,801 (134,250) (Decrease) increase in prepaid expenses (7,002) 4,645 Increase (decrease) in accounts payable 14,500 (63,932) Decrease in accrued salaries and vacation payables (20,147) (1,046) Increase in unearned revenue 25,703 22,271
Net cash provided by operating activities $ 4,570,085 3,088,667 Noncash capital and related financing activities:
Transfer of ILP debt to University $ 3,798,490 —
See accompanying notes to financial statements.
12

UNIVERSITY OF WASHINGTON COMMUTER SERVICES
(A Department of University of Washington) Notes to Financial Statements
June 30, 2016 and 2015
13 (Continued)
(1) Organization and Summary of Significant Accounting Policies (a) Organization
The University of Washington Commuter Services (Unit or CS) is responsible for the operation of the parking facilities of the University of Washington (the University).
(b) Basis of Presentation The financial statements of the Unit have been prepared in accordance with the Governmental Accounting Standards Board (GASB) Statement No. 34, Basic Financial Statements and Management s Discussion and Analysis for State and Local Governments, as amended by GASB Statement No. 35, Basic Financial Statements and Management s Discussion and Analysis for Public Colleges and Universities. The Unit is reporting as a special-purpose government engaged in business-type activities (BTA). In accordance with BTA reporting, the Unit presents a management s discussion and analysis, statements of net position, statements of revenues, expenses, and changes in net position, statements of cash flows, and notes to the financial statements. The financial statements present only the University of Washington Commuter Services and do not purport to, and do not, present fairly the financial position of the University of Washington, as of June 30, 2016 and 2015, the changes in its financial position, or its cash flows for the years then ended in accordance with U.S. generally accepted accounting principles. The financial statements are prepared using the economic resources measurement focus and the accrual basis of accounting. Under the accrual basis, revenues are recognized when earned, and expenses are recorded when an obligation has been incurred. The Unit reports capital assets net of accumulated depreciation (as applicable), and reports depreciation expense in the statements of revenues, expenses, and changes in net position. On July 1, 2014, CS adopted GASB Statement No. 68, Accounting and Financial Reporting for Pensions. This statement requires governments providing defined-benefit pensions to their employees to recognize their long-term obligation for pension benefits as a liability for the first time, along with the associated assets, which have been set aside to fund the plan. Since the University participates in several cost sharing pension plans, which are administered by the state of Washington Department of Retirement Systems (DRS), this statement required the University to recognize its proportionate share of the statewide net pension liability for each of the plans in which it participates. The Statement also eliminates the method of amortizing the liability balances over several years, and instead requires full recognition of the net liability upon implementation. Implementation of this standard resulted in the restatement of beginning fiscal year 2015 unrestricted net position reducing it by $2,135,982. The Unproportionate share of the state s collective pension amounts are disclosed in note 9.

UNIVERSITY OF WASHINGTON COMMUTER SERVICES
(A Department of University of Washington) Notes to Financial Statements
June 30, 2016 and 2015
14 (Continued)
With the adoption of GASB Statement No. 68, net position was restated at July 1, 2014. Below is a reconciliation of the total net position as previously reported at June 30, 2014, to the restated net position: Net position at June 30, 2014, as previously reported $ 50,003,452 Effect of accounting change (2,135,982) Net position at July 1, 2014, as restated $ 47,867,470
(c) Internal Note Receivable
Internal Note Receivable represents the amount owed by Commute Options Active Transportation for the construction of the Burke Gilman Trail project. An Internal Note Receivable requires a signed agreement. The agreement is signed by the borrowing unit Assistant Director, the Administrative Services Group Assistant Director, and the Director of Transportation Services.
(d) Capital Assets Capital expenditures for facilities and equipment funded by the Unit are reflected as capital assets on the Unit s statements of net position. Buildings and equipment are stated at cost. Additions, replacements, major repairs, and renovations are capitalized. Depreciation is computed using the straight-line method over the estimated useful lives of the assets, generally 15 50 years for building components, 20 50 years for infrastructure and land improvements, and 5 7 years for equipment. Expenditures for equipment and repairs that represent normal replacement of such equipment and routine maintenance of the buildings are expensed as incurred. The intangible asset is the cost of new parking software, which is expected to have a useful life of 10 years.
(e) Advances to University for Capital Projects Advances to the University for capital projects represent the difference between the cash paid and the capital expenditures incurred by the University for various capital projects at year-end, which CS expects to use for capital expenditures or be refunded if not used in the future.
(f) Revenue Recognition Parking sales are recognized as revenue in the period when the parking is utilized. The University Department of Intercollegiate Athletics (ICA) and CS entered into a formal written agreement whereby CS operates the parking for Husky football home games for ICA. The University of Washington Medical Center (UWMC) and CS entered into a formal written agreement whereby UWMC operates the Triangle Garage for CS and pays the net operating revenue from the Triangle Garage to CS. The net operating revenue accrued per the Triangle Garage operating results is reported as CS s operating revenue.

UNIVERSITY OF WASHINGTON COMMUTER SERVICES
(A Department of University of Washington) Notes to Financial Statements
June 30, 2016 and 2015
15 (Continued)
(g) Unearned Revenues Funds received from the sale of permits to be utilized for periods subsequent to June 30 are reported as unearned. Permit sales are recognized as revenue in the period when the parking is utilized. At June 30, 2016 and 2015, unearned revenues were $241,030 and $215,327, respectively.
(h) Federal Income Taxes As a part of the University, the Commuter Services is exempt from federal income taxes, except to the extent of unrelated business taxable income. Commuter Services did not incur unrelated business income tax during fiscal years 2016 and 2015, and accordingly, the financial statements do not include a provision for federal income taxes.
(i) Use of Estimates The preparation of financial statements in conformity with accounting principles generally accepted in the United States requires management to make estimates and assumptions that affect the reported amounts of assets and liabilities at the date of the financial statements and the reported amounts of revenue and expenses during the reporting period. Actual results could differ from those estimates.
(2) Cash in the University of Washington Invested Funds Pool Pooled Investments held on behalf of Commuter Services by the University of Washington are recorded at Commuter Service s share of the carrying value of the University of Washington Cash and Liquidity Pools. These funds are available on demand without prior notice or penalty. The Cash and Liquidity Pools were invested as follows at June 30:
2016 2015Cash and cash equivalents 6.4 % 10.0 %Treasuries and agencies 73.0 67.0Mortgage related securities 8.6 9.0Asset-backed debt securities 7.0 12.0Corporate and other fixed income 5.0 2.0
Total 100.0 % 100.0 %
(3) Concentrations Financial instruments that subject Commuter Services to concentrations of credit risk consist of pooled investments held on behalf of Commuter Services at the University of Washington.
(4) Internal Note Receivable The Internal Note Receivable from Commute Options Active Transportation for the construction of the Burke Gilman Trail project bears an interest rate of 4.75% with interest and principal payments due at the end of each month over a 30-year period. The outstanding balance as of June 30, 2016 and 2015 was

UNIVERSITY OF WASHINGTON COMMUTER SERVICES
(A Department of University of Washington) Notes to Financial Statements
June 30, 2016 and 2015
16 (Continued)
$3,317,991 and $6,736,847, respectively, of which $56,371 and $107,266 was the current portion. The total interest income earned on the note in 2016 and 2015 was $287,901 and $160,720, respectively.
(5) Capital Assets Capitalized asset activity for the years ended June 30, 2016 and 2015 is summarized as follows:
Balance at Balance atJune 30, Additions/ Retirements/ June 30,
2015 (Transfers) Adjustments 2016Buildings $ 85,198,611 10,120,673 (5,754,934) 89,564,350 Furniture, fixtures, and
equipment 1,243,219 696,828 (253,702) 1,686,345 Construction in progress* 741,531 (107,772) 633,759
Total 87,183,361 10,817,501 (6,116,408) 91,884,454 Less accumulated depreciation:
Buildings 40,697,623 2,272,159 (1,488,332) 41,481,450 Furniture, fixtures, and
equipment 941,184 205,967 (231,066) 916,085 Total accumulated
depreciation 41,638,807 2,478,126 (1,719,398) 42,397,535 Capital assets, net $ 45,544,554 8,339,375 (4,397,010) 49,486,919
* Nondepreciable
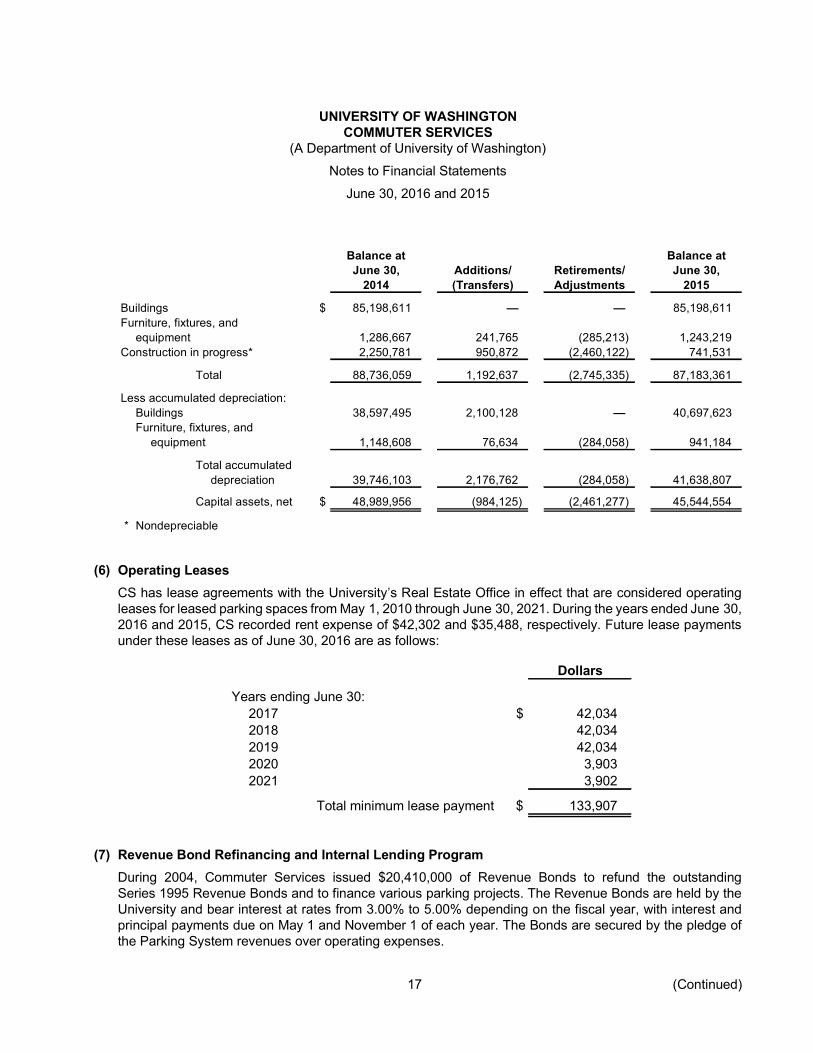
UNIVERSITY OF WASHINGTON COMMUTER SERVICES
(A Department of University of Washington) Notes to Financial Statements
June 30, 2016 and 2015
17 (Continued)
Balance at Balance atJune 30, Additions/ Retirements/ June 30,
2014 (Transfers) Adjustments 2015Buildings $ 85,198,611 85,198,611 Furniture, fixtures, and
equipment 1,286,667 241,765 (285,213) 1,243,219 Construction in progress* 2,250,781 950,872 (2,460,122) 741,531
Total 88,736,059 1,192,637 (2,745,335) 87,183,361 Less accumulated depreciation:
Buildings 38,597,495 2,100,128 40,697,623 Furniture, fixtures, and
equipment 1,148,608 76,634 (284,058) 941,184 Total accumulated
depreciation 39,746,103 2,176,762 (284,058) 41,638,807 Capital assets, net $ 48,989,956 (984,125) (2,461,277) 45,544,554
* Nondepreciable
(6) Operating Leases CS has lease agreements with the University s Real Estate Office in effect that are considered operating leases for leased parking spaces from May 1, 2010 through June 30, 2021. During the years ended June 30, 2016 and 2015, CS recorded rent expense of $42,302 and $35,488, respectively. Future lease payments under these leases as of June 30, 2016 are as follows:
DollarsYears ending June 30:
2017 $ 42,034 2018 42,034 2019 42,034 2020 3,903 2021 3,902
Total minimum lease payment $ 133,907
(7) Revenue Bond Refinancing and Internal Lending Program During 2004, Commuter Services issued $20,410,000 of Revenue Bonds to refund the outstanding Series 1995 Revenue Bonds and to finance various parking projects. The Revenue Bonds are held by the University and bear interest at rates from 3.00% to 5.00% depending on the fiscal year, with interest and principal payments due on May 1 and November 1 of each year. The Bonds are secured by the pledge of the Parking System revenues over operating expenses.

UNIVERSITY OF WASHINGTON COMMUTER SERVICES
(A Department of University of Washington) Notes to Financial Statements
June 30, 2016 and 2015
18 (Continued)
On February 1, 2016, CS transferred to the University the office space located in the West Campus parking garage. In compensation for this office space, the University assumed responsibility for the remaining debt on this space for the amount of $3,798,490. The purpose of the ILP is to lower the University s overall cost of capital and provide internal borrowing units with a stable and predictable borrowing rate. The ILP makes loans to internal borrowers at a uniform internal lending rate. These loans are funded through the issuance of University General Revenue bonds and notes. ILP program policies include a provision for a rate stabilization reserve and a provision for rate adjustments if necessary. Under the terms of the ILP, rate adjustments will apply to all outstanding debt obligations, including debt issued prior to the ILP implementation. The ILP lending rate will be reviewed annually and a preliminary indication of a rate adjustment will be announced to ILP participants 12 months in advance of the effective date. Final rate adjustments require approval by the Board of Regents. Future principal and interest payments due through maturity dates are as follows:
Principal InterestYears ending June 30:
2017 $ 496,648 388,796 2018 519,464 365,980 2019 543,328 342,116 2020 568,289 317,156 2021 594,396 291,049 Thereafter 6,143,579 1,235,127
$ 8,865,704 2,940,224
ILP activity for the years ended June 30, 2016 and 2015 is summarized as follows: Balance as of Balance as ofJune 30, 2015 Additions Reductions June 30, 2016
Internal lending programpayable $ 13,205,602 (4,339,898) 8,865,704
Balance as of Balance as ofJune 30, 2014 Additions Reductions June 30, 2015
Internal lending programpayable $ 13,782,853 (577,251) 13,205,602

UNIVERSITY OF WASHINGTON COMMUTER SERVICES
(A Department of University of Washington) Notes to Financial Statements
June 30, 2016 and 2015
19 (Continued)
(8) Related-Party Transactions The University provides support to Commuter Services by performing the following services: The University requires a discretionary transfer for overhead equal to 8.88% of certain Commuter
Services revenues in exchange for providing the following: Use of the University s buildings and equipment Administrative and accounting support Serving as the purchasing and disbursing agent Various other operational and support services
Commuter Services is covered by the University s liability self-insurance program and is allocated a portion of the program s costs annually. Commuter Services retains $0 per claim for automobile liability and $100,000 of indemnity costs only per claim for general liability coverage.
Additionally, transfers to and from the University are made at the discretion of the University and Commuter Services.
The UPASS program is operated by the University s Transportation Commute Options Department and provides a package of flexible, low cost transportation choices for faculty, staff, and students. It includes unlimited access to public transit, and a parking management component that subsidizes carpool and vanpool parking rather than single occupant vehicles. The University also offers several contributory pension plans administered by the Washington State Department of Retirement Systems: the Public Employees Retirement System plan, the Teachers Retirement System plan, and the Law Enforcement Officers and Fire Fighters Retirement System plan, which are defined benefit retirement plans. Additionally, the University offers the University of Washington Retirement plan, a defined contribution plan, and the University of Washington Supplemental Retirement plan, a defined benefit retirement plan.
(9) Pension Plan (a) Pension Plans
The University offers several contributory pension plans administered by the Washington State Department of Retirement Systems. Commuter Services has employees in the Public Employees Retirement System plan, which is a defined benefit retirement plan. The University of Washington Retirement Plan (UWRP), a defined contribution plan, is administered by the University. The University of Washington Supplemental Retirement Plan, a noncontributory defined benefit pension plan, which operates in tandem with the UWRP, is closed to new participants.

UNIVERSITY OF WASHINGTON COMMUTER SERVICES
(A Department of University of Washington) Notes to Financial Statements
June 30, 2016 and 2015
20 (Continued)
(b) Plan Descriptions of the DRS Plans (i) Public Employees Retirement System
PERS retirement benefit provisions are contained in chapters 41.34 and 41.40 of the Revised Code of Washington (RCW). PERS is a cost-sharing multiple-employer retirement system comprised of three separate pension plans for membership purposes. PERS Plan 1 and PERS Plan 2 are defined benefit plans, and PERS Plan 3 is a defined benefit plan with a defined contribution component. PERS members include higher education employees not participating in other higher education retirement programs. For accounting purposes, PERS is reported as three separate plans. Plan 1 accounts for the defined benefits of Plan 1 members, Plan 2/3 accounts for the defined benefits of Plan 2 and Plan 3 members, and Plan 3 accounts for the defined contribution portion of Plan 3 members. The defined benefit portions of Plan 2 and Plan 3 are accounted for in the same pension trust fund, and all assets of Plan 2/3 may legally be used to pay the defined benefits of any of the Plan 2 or Plan 3 members or beneficiaries.
(c) Vesting and Benefits Provided (i) PERS Plan 1
PERS Plan 1 provides retirement, disability and death benefits. The plan is closed to new entrants. All members were vested after the completion of five years of eligible service. Retirement benefits are determined as two percent of the member s average final compensation (AFC) times the member s years of service. The AFC is the average of the member s 24 highest-paid consecutive service months. The retirement benefit may not exceed 60% of the AFC. Members are eligible for retirement from active status at any age with at least 30 years of service, at age 55 with at least 25 years of service, or at age 60 with at least five years of service. Members retiring from inactive status prior to the age of 65 may receive actuarially reduced benefits. Other benefits include duty and nonduty disability payments, an optional cost-of living allowance (COLA), and a one-time duty-related death benefit, if the member is found eligible by the Washington State Department of Labor and Industries.
(ii) PERS Plan 2/3 PERS Plan 2/3 provides retirement, disability and death benefits. PERS Plan 2 members are vested after completion of five years of eligible service. PERS Plan 3 members are vested in the defined benefit portion of their plan after 10 years of service or after five years of service if 12 months are earned after age 44. Retirement benefits are determined as two percent of the member s AFC times the member s years of service for Plan 2, and one percent of AFC times the member s years of service for Plan 3. The AFC is the monthly average of the member s 60 highest-paid consecutive service months. There is no cap on years of service credit.
UNIVERSITY OF WASHINGTON COMMUTER SERVICES
(A Department of University of Washington) Notes to Financial Statements
June 30, 2016 and 2015
21 (Continued)
Members are eligible for retirement with a full benefit at age 65 with at least five years of service credit. Retirement before age 65 is considered early retirement. Members are eligible for early retirement with a reduced benefit at age 55 with at least 20 years of service credit. The benefit is reduced by a factor that varies according to age, for each year before age 65. Members who are age 55 with at least 30 years of service credit can retire under one of two provisions, if hired prior to May 1, 2013: With a benefit that is reduced by 3% for each year before age 65; or With a benefit that has less, or no, reduction (depending on age) but imposes stricter
return-to-work rules If hired on or after May 1, 2013, members have the option to receive a benefit that is reduced by 5% for each year before age 65. Retirement benefits are actuarially reduced to reflect the choice of a survivor benefit. Other benefits include duty and nonduty disability payments, a cost-of-living allowance (based on the Consumer Price Index) capped at three percent annually, and a one-time duty-related death benefit, if the member is found eligible by the Washington State Department of Labor and Industries.
(d) Fiduciary Net Position The pension plans fiduciary net positions have been determined on the same basis as they are reported by the pension plans. DRS financial statements have been prepared in conformity with generally accepted accounting principles (GAAP). The retirement plans are accounted for in pension trust funds using the flow of economic resources measurement focus and the accrual basis of accounting. Member contributions are recognized as revenue in the period in which the contributions are earned. Employer contributions are recognized when due, and the employer has made a formal commitment to provide the contributions. Benefits and refunds are recognized when due, and payable in accordance with the terms of each plan. The RCW (Chapter 43.33 A) authorizes the Washington State Investment Board (WSIB) to have the investment management responsibility for the pension funds. Investments are reported at fair value, and unrealized gains and losses are included as investment income in the Statement of Changes in Fiduciary Net Position presented in the DRS Comprehensive Annual Financial Report. Purchases and sales of investments are recorded on a trade-date basis. DRS publishes an annual report for retirement plans, which is available at: http://www.drs.wa.gov/administration/annualreport/.
(e) Actuarial Assumptions Accounting requirements dictate the use of assumptions to best estimate the impact that pension obligations will have on the Commuter Services. The professional judgments used in determining these assumptions are important, and can significantly impact the resulting actuarial estimates. Differences

UNIVERSITY OF WASHINGTON COMMUTER SERVICES
(A Department of University of Washington) Notes to Financial Statements
June 30, 2016 and 2015
22 (Continued)
between actual results compared to these assumptions could have a significant effect on the Commuter Services financial statements. The total pension liability for each DRS plan was determined by an actuarial valuation, conducted by the Washington State Office of the State Actuary (OSA). Commuter Services 2016 pension liability is based on an OSA valuation performed as of June 30, 2014, with the results rolled forward to the measurement date of June 30, 2015. Likewise, Commuter Services 2015 pension liability is based on the valuation performed as of June 30, 2013, with the results rolled forward to the measurement date of June 30, 2014. The following actuarial assumptions have been applied to all prior periods included in the measurement: Inflation 3.0% total economic inflation, 3.75% salary inflationSalary increase Expected to grow by promotions and longevity in addition to
salary inflation assumptionInvestment rate of return 7.50%
Mortality rates were based on the RP-2000 Combined Healthy Table and Combined Disabled Table published by the Society of Actuaries Retirement Plans Experience Committee (RPEC). And, as recommended by the RCEP, the OSA applied offsets to the base table and recognized future improvements in mortality by projecting the mortality rates using 100% Scale BB. Mortality rates are applied on a generational basis, meaning members are assumed to receive additional mortality improvements in each future year, throughout their lifetimes. The actuarial assumptions used in the June 30, 2014 and 2013 valuations were based on the results of OSA s 2007-2012 Experience Study, which is a comprehensive review and update of prior actuarial assumptions. Additional assumptions for subsequent events and law changes are current as of the 2014 actuarial valuation report. The long-term expected rate of return on pension plan investments was determined by the WSIB using a building block method in which a best estimate of expected future rates of return (expected returns, net of pension plan investment expense, but including inflation) are developed for each major asset class. Those expected returns make up one component of WSIB s Capital Market Assumptions (CMAs). WSIB uses the CMAs and their target asset allocation to simulate future investment returns over various time horizons. The long-term expected rate of return of 7.50% approximately equals the median of the simulated investment returns over a 50-year time horizon, adjusted to remove or damper any short-term changes that are not expected over the entire 50-year measurement period.

UNIVERSITY OF WASHINGTON COMMUTER SERVICES
(A Department of University of Washington) Notes to Financial Statements
June 30, 2016 and 2015
23 (Continued)
Best estimates of arithmetic real rates of return for each major asset class included in the target asset allocation for each pension plan, as of the measurement dates of June 30, 2015 and 2014, are summarized in the following table:
2015 2014% Long-term % Long-term
expected expectedreal rate of real rate of
Target return Target returnallocation arithmetic allocation arithmetic
Asset class:Fixed income 20.00% 1.70% 20.00% 0.80%Tangible assets 5.00 4.40 5.00 4.10Real estate 15.00 5.80 15.00 5.30Global equity 37.00 6.60 37.00 6.05Private equity 23.00 9.60 23.00 9.05
The inflation components used to create the above table are 2.20% and 2.70% for the measurement dates as of June 30, 2015 and 2014, respectively, and represents WSIB s most recent long-term estimate of broad economic inflation.
(f) Discount Rate The discount rate used to measure the total pension liabilities as of June 30, 2016 and 2015 was 7.50%. The projection of cash flows used to determine the discount rate assumed that contributions from plan members will be made at contractually required rates, and that contributions from employers will be made at statutorily required rates, actuarially determined (including the component of PERS 2/3 and TRS 2/3 employer rates pertaining to the unfunded actuarial accrued liabilities for PERS 1 and TRS 1, respectively). Based on those assumptions, the fiduciary net position for each pension plan in which the Commuter Services participates was projected to be sufficient to make all projected future benefit payments of the current plan members. Therefore, the long-term expected rate of return on pension plan investments was applied to all periods of projected benefit payments to determine the total pension liability. Using the WSIB long-term expected rate of return, a 7.50% future investment rate of return on pension plan investments was assumed for the test. The expected return on plan assets is the estimated long-term rate of return that will be earned on the investments used to fund the pension obligation. Contributions from plan members and employers were assumed to continue to be made at contractually required rates (including the component of PERS 2/3 and TRS 2/3 employer rates pertaining to the unfunded actuarial accrued liabilities for PERS 1 and TRS 1, respectively, as provided for in Chapter 41.45 of the RCW).

UNIVERSITY OF WASHINGTON COMMUTER SERVICES
(A Department of University of Washington) Notes to Financial Statements
June 30, 2016 and 2015
24 (Continued)
(g) Sensitivity of the Net Pension Liability (Asset) to Changes in the Discount Rate The following table presents the Commuter Services net pension liability calculated using the discount rate of 7.50%, as well as what the net pension liability would be if it were calculated using a discount rate that is 1-percentage-point lower (6.50%) or 1-percentage-point higher (8.50%) than the current rate.
(Dollars in thousands)2016 2015Current Current1% discount 1% 1% discount 1%Decrease rate Increase Decrease rate Increase
Plan:PERS 1 $ 1,509 1,240 1,008 1,347 1,093 875 PERS 2/3 2,920 999 (473) 2,129 510 (726)
(h) Employer Contribution Rates Employer contribution rates are developed in accordance with Chapter 41.45 of the RCW by the OSA, and include an administrative expense component that is currently set at 0.18%. The statute provides authority to the Pension Funding Council to adopt changes to economic assumptions and contribution rates. The contribution rates and required contributions for each DRS plan in which Commuter Services participates are shown in the table below.
Description PERS Plan 1 PERS Plan 2 /3i(Dollars in thousands)
Contributions as June 30, 2016:Contribution Rate 11.18% 11.18%Contributions made $ 158 174
Contributions as June 30, 2015:Contribution Rate 9.21% 9.21%Contributions made $ 127 143
i. Plan 2/3 employer rate includes a component to address the Plan 1 unfunded actuarial accrued
liability

UNIVERSITY OF WASHINGTON COMMUTER SERVICES
(A Department of University of Washington) Notes to Financial Statements
June 30, 2016 and 2015
25 (Continued)
(i) Commuter Services Proportionate Share Collective pension amounts are determined as of a measurement date, which can be no earlier than an employer s prior fiscal year. The measurement date for the net pension liabilities recorded by Commuter Services as of June 30, 2016 was June 30, 2015. Employer contributions received and processed by DRS during the fiscal year ended June 30, 2015 have been used as the basis for determining each employer s proportionate share of the collective pension amounts reported by DRS in their June 30, 2015 Schedules of Employer and nonemployer Allocations. Likewise, the measurement date for the net pension liabilities recorded by the Commuter Services as of June 30, 2015 was June 30, 2014, with employer contributions received and processed by the DRS during fiscal year 2014 used as the basis for determining each employer s proportionate share of the June 30, 2014 collective pension amounts. Commuter Services proportionate share for each DRS plan is shown in the table below.
Proportionate SharePERS 1 PERS 2/3
Plan:Year ended June 30, 2015 0.02% 0.03%Year ended June 30, 2016 0.02 0.03
(j) Commuter Services Aggregated Balances
Commuter Services aggregated balances of net pension liabilities and net pension asset as of June 30, 2016 and 2015, respectively, are presented in the table below.
Plan PERS 1 PERS 2/3 Total(Dollars in thousands)
June 30 , 2016:Net pension liability $ 1,240 999 2,239
June 30 , 2015:Net pension liability $ 1,093 510 1,603

UNIVERSITY OF WASHINGTON COMMUTER SERVICES
(A Department of University of Washington) Notes to Financial Statements
June 30, 2016 and 2015
26 (Continued)
(k) Pension Expense, Deferred Outflows of Resources, and Deferred Inflows of Resources The tables below summarize Commuter Services pension expense, deferred outflows of resources, and deferred inflows of resources related to the DRS pension plans, together with the related future year impacts to pension expense from amortization of those deferred amounts. Note that deferred outflows of resources related to Commuter Services contributions subsequent to the measurement date are recognized as a reduction of the net pension liability in the following year, and are not amortized to pension expense.
Proportionate share of pension expenseDescription PERS plan 1 PERS plan 2 /3 Total
(Dollars in thousands)As of June 30, 2016 $ 205 146 351 As of June 30, 2015 71 80 151
Deferred Outflows of Resources
Description PERS 1 PERS 2/3 Total(Dollars in thousands)
June 30, 2016:Change in assumptions $ 2 2 Difference between expected and
actual experience 106 106 Change in CS's proportionate share 97 97 CS contributions subsequent to the
measurement date of the collectivenet pension liabilitya 158 174 332
Total $ 158 379 537 June 30, 2015:
Change in CS's proportionate share $ (6) (6) CS contributions subsequent to the
measurement date of the collectivenet pension liability 127 143 270
Total $ 127 137 264 a. Amounts will be recognized as a reduction of the net pension liability as of June 30, 2017

UNIVERSITY OF WASHINGTON COMMUTER SERVICES
(A Department of University of Washington) Notes to Financial Statements
June 30, 2016 and 2015
27 (Continued)
Deferred Inflows of ResourcesDescription PERS 1 PERS 2 /3 Total
(Dollars in thousands)June 30, 2016:
Difference between projected andactual earnings on planinvestments, net $ 68 267 335
Total $ 68 267 335 June 30, 2015:
Difference between projected andactual earnings on planinvestments, net $ 137 541 678
Total $ 137 541 678
Description PERS Plan 1 PERS Plan 2/3 Total(Dollars in thousands)
Deferred outflows of resources relatedto CS contributions subsequent to the measurement date that will berecognized as a reduction of the netpension liability as of June 30, 2017 $ 158 174 332
Deferred outflows of resources relatedto CS contributions subsequent tothe measurement date that will berecognized as a reduction of the netpension liability as of June 30, 2016 $ 127 143 270

UNIVERSITY OF WASHINGTON COMMUTER SERVICES
(A Department of University of Washington) Notes to Financial Statements
June 30, 2016 and 2015
28 (Continued)
Amounts reported as deferred outflows of resources, as of June 30, 2016, exclusive of contributions made after the measurement date, and deferred inflows of resources will be recognized in pension expense as follows:
Amortization of deferred inflows and deferredoutflows of resources
Year PERS Plan 1 PERS Plan 2/3 Total(Dollars in thousands)
2017 $ (26) (44) (70) 2018 (26) (44) (70) 2019 (26) (44) (70) 2020 10 70 80
Total $ (68) (62) (130)
(l) University of Washington Retirement Plan (403(b)) Faculty, librarians and professional staff are eligible to participate in the University of Washington Retirement Plan, a 403(b) defined-contribution plan administered by the University. CS has staff participating in these plans. (i) 403(b) Plan Description
Contributions to the plan are invested by participants in annuity contracts or mutual fund accounts offered by one or more fund sponsors. Employees have at all times a 100% vested interest in their option. RCW 28B.10.400 et. seq. assigns the authority to the University of Washington Board of Regents to establish and amend benefit provisions.
(ii) 403(b) Funding Policy Employee contribution rates, based on age, are 5%, 7.5% or 10% of salary. The University matches the contributions of employees. Within parameters established by the legislature, contribution requirements may be established or amended by the University of Washington Board of Regents.
(m) University of Washington Supplemental Retirement Plan (401(a)) The University of Washington Supplemental Retirement Plan (UWSRP), a 401(a) defined benefit retirement plan, operates in tandem with the 403(b) plan to supplement the expected defined contribution retirement savings accumulated under the UWRP. The UWSRP was closed to new participants effective March 1, 2011. The University is ultimately responsible for the payment of the statements. CS has staff participating in this plan.

UNIVERSITY OF WASHINGTON COMMUTER SERVICES
(A Department of University of Washington) Notes to Financial Statements
June 30, 2016 and 2015
29
(10) Other Postemployment Benefits (OPEB) The University funds OPEB obligations at a university-wide level on a pay-as-you-go basis. Disclosure information, as required under GASB Statement No. 45 (GASB 45), Accounting and Financial Reporting by Employers for Postemployment Benefits Other than Pensions, does not exist at the Unit level, and as a result, the Actuarial Accrued Liability (AAL) is not available for auxiliary entities. The University is ultimately responsible for the payment of the obligation; therefore, the annual required contribution (ARC) is not recorded on the Unit s financial statements.
(11) Commitments and Contingencies The Unit is subject to various claims and lawsuits that are covered by the University s self-insurance fund in excess of $100,000.
(12) Subsequent Events The interest rate changed from 4.75% to 4.50% effective July 1, 2016 for the ILP.

UNIVERSITY OF WASHINGTON COMMUTER SERVICES
(A Department of University of Washington) Required Supplementary Information
June 30, 2016 and 2015 Unaudited see accompanying
30 (Continued)
Methods and Assumptions Used in Calculations of Actuarially Determined Contributions for PERS, SERS, TRS, LEOFF and WSPRS: The Office of the State Actuary (OSA) calculates the actuarially determined contributions (ADC) based on the results of an actuarial valuation consistent with the state s funding policy defined in Chapter 41.45 RCW.
s contribution-rate adoption process, the results of an actuarial valuation with an odd-numbered year valuation date determine the ADC for the biennium that ensues two years later. For example, the actuarial valuation with a June 30, 2013, valuation date, completed in the fall of 2014, determines the ADC for the period beginning July 1, 2015, and ending June 30, 2017.
Schedule of Proportionate Share of the Net Pension Liability(as of measurement date, the prior fiscal year end)
PERS 1(Dollar amounts in thousands)
2016 20150.02% 0.02%
liability $ 1,240 1,09364 66
liability as a percentage of covered-employee payroll 1,951.91% 1,644.20%Plan fiduciary net position as a percentage of the total
pension liability 59.10% 61.19%
See accompanying notes to schedules of required supplementary information.

UNIVERSITY OF WASHINGTON COMMUTER SERVICES
(A Department of University of Washington) Required Supplementary Information
June 30, 2016 and 2015 Unaudited see accompanying
31 (Continued)
Schedule of Contributions(as of current fiscal year end)
PERS 1(Dollar amounts in thousands)
2016 2015Contractually required contribution $ 7 6Contributions in relation to the contractually required
contribution 7 6Contribution deficiency (excess)
64 64Contributions as a percentage of covered-employee payroll 11.08% 9.21%
Schedule of Proportionate Share of the Net Pension Liability
(as of measurement date, the prior fiscal year end)PERS 2/3
(Dollar amounts in thousands)2016 2015
liability 0.03% 0.03%pension liability $ 999 510
2,480 2,162pension liability as a percentage of covered-employeepayroll 40.28% 23.59%
Plan fiduciary net position as a percentage of the totalpension liability 89.20% 93.29%
See accompanying notes to schedules of required supplementary information.

UNIVERSITY OF WASHINGTON COMMUTER SERVICES
(A Department of University of Washington) Required Supplementary Information
June 30, 2016 and 2015 Unaudited see accompanying
32
Schedule of Contributions(as of current fiscal year end)
PERS 2/3(Dollar amounts in thousands)
2016 2015Contractually required contribution $ 313 228Contributions in relation to the contractually required
contribution 316 228Contribution deficiency (excess) (3)
2,817 2,480Contributions as a percentage of covered-employee payroll 11.10% 9.21%
See accompanying notes to schedules of required supplementary information.

HARBORVIEW MEDICAL CENTER (A Component Unit of King County)
(Operated by the University of Washington) Financial Statements
June 30, 2016 and 2015 (With Independent Auditors Report Thereon)

HARBORVIEW MEDICAL CENTER (A Component Unit of King County)
(Operated by the University of Washington)
Table of Contents
Page Independent Auditors Report 1 Management s Discussion and Analysis (Unaudited) 3 Basic Financial Statements:
Statements of Net Position 14 Statements of Revenues, Expenses, and Changes in Net Position 15 Statements of Cash Flows 16
Notes to Financial Statements 17

Independent Auditors Report
The Board of Trustees Harborview Medical Center: We have audited the accompanying financial statements of the business-type activities of Harborview Medical Center, a discretely presented component unit of King County, as of and for the years ended June 30, 2016 and 2015, and the related notes to the financial statements, which collectively comprise Harborview Medical Center s basic financial statements as listed in the table of contents. Management s Responsibility for the Financial Statements Management is responsible for the preparation and fair presentation of these basic financial statements in accordance with U.S. generally accepted accounting principles; this includes the design, implementation, and maintenance of internal control relevant to the preparation and fair presentation of financial statements that are free from material misstatement, whether due to fraud or error. Auditors Responsibility Our responsibility is to express opinions on these financial statements based on our audits. We conducted our audits in accordance with auditing standards generally accepted in the United States of America. Those standards require that we plan and perform the audit to obtain reasonable assurance about whether the basic financial statements are free from material misstatement. An audit involves performing procedures to obtain audit evidence about the amounts and disclosures in the financial statements. The procedures selected depend on the auditors judgment, including the assessment of the risks of material misstatement of the financial statements, whether due to fraud or error. In making those risk assessments, the auditor considers internal control relevant to the entity s preparation and fair presentation of the financial statements in order to design audit procedures that are appropriate in the circumstances, but not for the purpose of expressing an opinion on the effectiveness of the entity s internal control. Accordingly, we express no such opinion. An audit also includes evaluating the appropriateness of accounting policies used and the reasonableness of significant accounting estimates made by management, as well as evaluating the overall presentation of the financial statements. We believe that the audit evidence we have obtained is sufficient and appropriate to provide a basis for our audit opinion. Opinion In our opinion, the financial statements referred to above present fairly, in all material respects, the financial position of the business-type activities of Harborview Medical Center as of June 30, 2016 and 2015, and the respective changes in net position and cash flows for the years then ended in accordance with U.S. generally accepted accounting principles.

2
Other Matters U.S. generally accepted accounting principles require that the Management s Discussion and Analysis on pages 3 and 13 be presented to supplement the basic financial statements. Such information, although not a part of the basic financial statements, is required by the Governmental Accounting Standards Board who considers it to be an essential part of financial reporting for placing the basic financial statements in an appropriate operational, economic, or historical context. We have applied certain limited procedures to the required supplementary information in accordance with U.S. generally accepted accounting principles, which consisted of inquiries of management about the methods of preparing the information and comparing the information for consistency with management s responses to our inquiries, the basic financial statements, and other knowledge we obtained during our audit of the basic financial statements. We do not express an opinion or provide any assurance on the information because the limited procedures do not provide us with sufficient evidence to express an opinion or provide any assurance.
Seattle, Washington October 14, 2016

HARBORVIEW MEDICAL CENTER (A Component Unit of King County)
(Operated by the University of Washington) cussion and Analysis (Unaudited)
June 30, 2016 and 2015
3
The following discussion and analysis provides an overview of the financial position and activities of Harborview Medical Center (Harborview), for the years ended June 30, 2016 and 2015. This discussion has been prepared by management and is designed to focus on current activities, resulting changes, and current known facts and should be read in conjunction with the financial statements and accompanying notes that follow this section. Harborview is owned by King County, governed by a county-appointed board of trustees and managed by the University of Washington (the University) through a Hospital Services Agreement. Harborview is part of UW Medicine, which also includes: University of Washington Medical Center (UW Medical Center), Northwest Hospital & Medical Center (Northwest Hospital), Valley Medical Center (VMC), UW Neighborhood Clinics (UWNC), UW Physicians (UWP), the UW School of Medicine (the School), and Airlift Northwest (Airlift). Using the Financial Statements Harborview s financial statements consist of three statements: statements of net position; statements of revenues, expenses, and changes in net position; and statements of cash flows. These financial statements and related notes provide information about the activities of Harborview, including resources held by Harborview, but restricted for specific purposes by contributors, grantors, or enabling legislation. The statements of net position includes all of Harborview s assets and liabilities, using the accrual basis of accounting, as well as an indication about which assets can be used for general purposes and, which are designated for a specific purpose. The statements of net position also include information to help compute the rate of return on investments, evaluate the capital structure of Harborview, and assess the liquidity and financial flexibility of Harborview. The statements of revenues, expenses, and changes in net position reports all of the revenues and expenses during the time period indicated. Net position, the difference between the sum of assets and the sum of liabilities, is one way to measure the financial health of Harborview and whether the organization has been able to recover all its costs through net patient service revenues and other revenue sources. The statements of cash flows reports the cash provided by Harborview s operating activities, as well as other cash sources such as investment income and cash payments for capital additions and improvements and funding to affiliates. These statements provide meaningful information on where Harborview s cash was generated and what it was used for. Results of Operations for Fiscal Year 2016 Harborview reported operating income of $49.3 million and an increase in net position of $21.4 million for the year ended June 30, 2016 compared to operating income of $61.2 million and increase in net position of $35.2 million for the year ended June 30, 2015. The positive net income in 2016 can primarily be attributed to higher inpatient acuity, trauma volume and increased outpatient volumes in the operating room, specialty clinics, and pharmacy. Other factors contributing to the positive financial results in both fiscal years 2016 and 2015 includes a focus on expenses and successful process improvement initiatives in the areas of revenue cycle and supply chain management.

HARBORVIEW MEDICAL CENTER (A Component Unit of King County)
(Operated by the University of Washington) cussion and Analysis (Unaudited)
June 30, 2016 and 2015
4
For the year ended June 30, 2015, Harborview reported operating income of $61.2 million and increase in net position of $35.2 million compared to the reported operating loss of $0.8 million and a decrease in net position of $6.8 million for the year ended June 30, 2014. The positive net income in 2015 can primarily be attributed to higher volume of inpatient surgical cases, outpatient pharmacy revenue, higher acuity, and additional reimbursement that resulted from previously uninsured patients being eligible for Medicaid under Medicaid expansion.
2016 2015 2014(In thousands)Total operating revenues $ 964,313 929,889 814,652 Total operating expenses 915,047 868,697 815,436
Income (loss) from operations 49,266 61,192 (784) Investment income, net 2,715 1,823 2,670 Other, net (35,029) (26,509) (9,016)
Nonoperating expenses (32,314) (24,686) (6,346) Income (loss) before capitalcontributions and other 16,952 36,506 (7,130)
Other changes in net position 4,451 (1,257) 328 Increase (decrease) in netposition 21,403 35,249 (6,802)
Net position, beginning of year 650,916 615,667 622,469 Net position, end of year $ 672,319 650,916 615,667 The following table presents Harborview s key performance indicators for June 30, 2016, 2015, and 2014:
2016 2015 2014Available beds 413 413 413 Admissions 16,969 17,362 17,176 Patient days 144,140 138,214 132,284 Average length of stay 8.5 8.0 7.7 Occupancy 96% 92% 88%Case mix index (CMI) 2.228 2.150 2.100 Surgery cases 16,291 16,280 15,938 Emergency room visits 59,776 62,217 64,512 Primary care clinic visits 84,374 81,968 83,148 Specialty care clinic visits 168,061 165,647 164,201 Full-time equivalents (FTEs) 4,401 4,476 4,475 Trauma cases 6,412 6,190 5,888
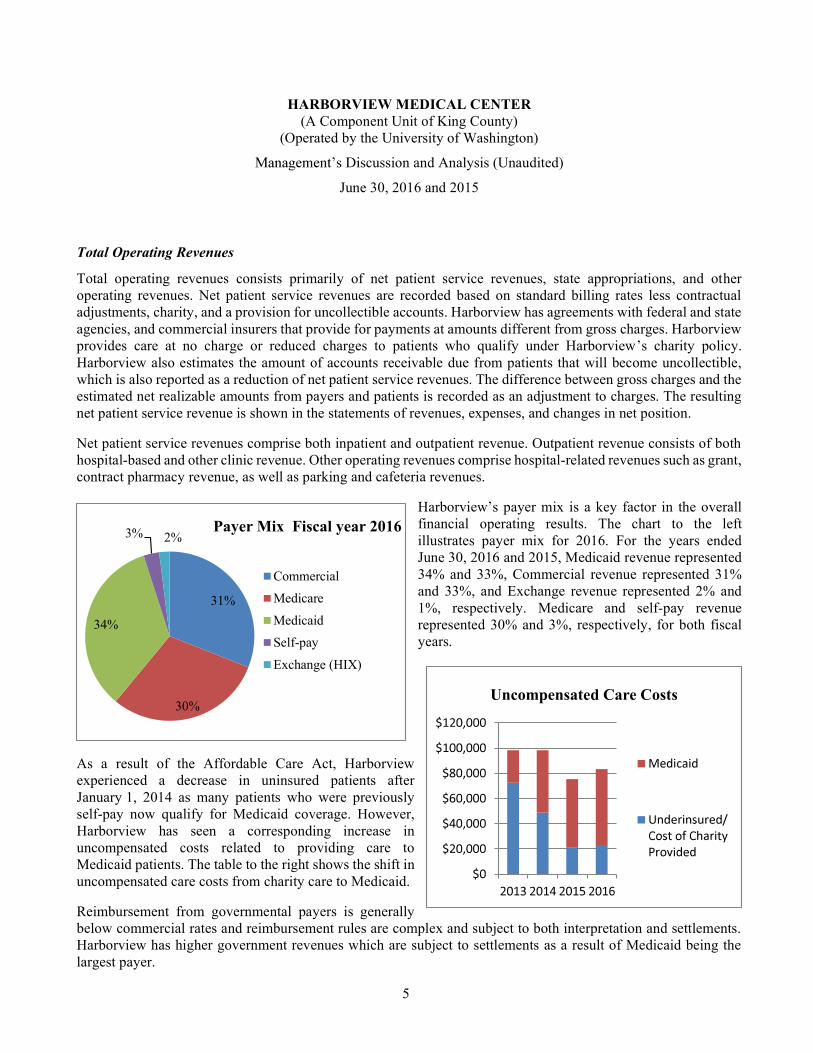
HARBORVIEW MEDICAL CENTER (A Component Unit of King County)
(Operated by the University of Washington) cussion and Analysis (Unaudited)
June 30, 2016 and 2015
5
Total Operating Revenues Total operating revenues consists primarily of net patient service revenues, state appropriations, and other operating revenues. Net patient service revenues are recorded based on standard billing rates less contractual adjustments, charity, and a provision for uncollectible accounts. Harborview has agreements with federal and state agencies, and commercial insurers that provide for payments at amounts different from gross charges. Harborview provides care at no charge or reduced charges to patients who qualify under Harborview s charity policy. Harborview also estimates the amount of accounts receivable due from patients that will become uncollectible, which is also reported as a reduction of net patient service revenues. The difference between gross charges and the estimated net realizable amounts from payers and patients is recorded as an adjustment to charges. The resulting net patient service revenue is shown in the statements of revenues, expenses, and changes in net position. Net patient service revenues comprise both inpatient and outpatient revenue. Outpatient revenue consists of both hospital-based and other clinic revenue. Other operating revenues comprise hospital-related revenues such as grant, contract pharmacy revenue, as well as parking and cafeteria revenues.
Harborview s payer mix is a key factor in the overall financial operating results. The chart to the left illustrates payer mix for 2016. For the years ended June 30, 2016 and 2015, Medicaid revenue represented 34% and 33%, Commercial revenue represented 31% and 33%, and Exchange revenue represented 2% and 1%, respectively. Medicare and self-pay revenue represented 30% and 3%, respectively, for both fiscal years.
As a result of the Affordable Care Act, Harborview experienced a decrease in uninsured patients after January 1, 2014 as many patients who were previously self-pay now qualify for Medicaid coverage. However, Harborview has seen a corresponding increase in uncompensated costs related to providing care to Medicaid patients. The table to the right shows the shift in uncompensated care costs from charity care to Medicaid. Reimbursement from governmental payers is generally below commercial rates and reimbursement rules are complex and subject to both interpretation and settlements. Harborview has higher government revenues which are subject to settlements as a result of Medicaid being the largest payer.
31%
30%
34%
3% 2% Payer Mix Fiscal year 2016
CommercialMedicareMedicaidSelf-payExchange (HIX)
Uncompensated Care Costs

HARBORVIEW MEDICAL CENTER (A Component Unit of King County)
(Operated by the University of Washington) cussion and Analysis (Unaudited)
June 30, 2016 and 2015
6
For the years ended June 30, 2016, 2015, and 2014, Harborview s total operating revenues were $964.3 million, $929.9 million, and $814.7 million, which was composed of $887.5 million, $858.8 million, and $747.9 million in net patient service revenues and $76.8 million, $71.0 million, and $66.8 million of other operating revenues, respectively. The increase in operating revenues for fiscal year 2016 was driven by higher case acuity, and an increase in contract pharmacy and safety net revenue. The increase in fiscal year 2015 was driven by an increase in net patient service revenues as a result of higher case acuity, greater volumes, and favorable payer mix.
Total Operating Expenses Total operating expenses were $915.0 million for fiscal year 2016 compared to $868.7 million for fiscal year 2015 and $815.4 million for fiscal year 2014. The composition of fiscal year 2016 operating expenses is illustrated in the chart to the left. Salaries and wages increased $6.6 million from $343.5 million in fiscal year 2015 to $350.1 million in fiscal year 2016. The increase in salaries and wages in the current year is primarily attributed to patient care labor associated with higher than anticipated occupancy and employee merit increases. Salaries and wages increased $16.4 million from
$327.1 million in fiscal year 2014 to $343.5 million in fiscal year 2015. The increase in salaries and wages in fiscal year 2015 is primarily attributed to patient care labor associated with higher than anticipated occupancy, employee merit increases, and compensated absence accruals. Employee benefits increased $19.1 million from $101.1 million in fiscal year 2015 to $120.2 million in fiscal year 2016 and decreased $2.1 million from $103.2 million in fiscal year 2014 to $101.1 million in fiscal year 2015. In 2016, the State of Washington (the State) increased the funding of employee healthcare and pension costs, which caused the University to increase the benefit load rate for classified employees and professional staff by 16.6% and 9.1%, respectively. Employee benefit expense decreased in fiscal year 2015 as a result of an overall decrease in the University benefit load rate. Purchased services, which consist of professional and consulting fees, increased $25.6 million from $175.7 million in fiscal year 2015 to $201.3 million in fiscal year 2016, and increased $7.1 million from $168.6 million in fiscal year 2014 to $175.7 million in fiscal year 2015. In 2016, UW Medicine adopted a purchase service model for shared services such as accounting, payroll, supply chain, and other shared service departments. The increase in purchased services between fiscal year 2016 and 2015 is attributed to the allocation of these shared service costs to Harborview which are recorded in purchased services. The increase in purchased services between fiscal year 2015 and 2014 was attributed to an increase in the allocation of IT expenses to Harborview as a result of an increase in salaries and wages at UW Medicine ITS. Supplies and other expense include medical and surgical supplies, pharmaceutical supplies, insurance, taxes, and other expenses. In total, these expenses increased $1.4 million from $208.5 million in fiscal year 2015 to
38%
13%22%
23%
4%Operating Expenses Fiscal year 2016
Salaries and wagesEmployee benefitsPurchased servicesSupplies and otherDepreciation

HARBORVIEW MEDICAL CENTER (A Component Unit of King County)
(Operated by the University of Washington) cussion and Analysis (Unaudited)
June 30, 2016 and 2015
7
$209.9 million in fiscal year 2016 and increased $34.9 million from $173.6 million in fiscal year 2014 to $208.5 million in fiscal year 2015. The increase in supplies and other between 2016 and 2015 is a result of higher medical supplies expense offset by favorable other expenses, including a reduction in rental expense at the Ninth & Jefferson building. The increase in supplies and other between 2015 and 2014 was due to Harborview dispensing a new and specialized pharmaceutical drug for the treatment of hepatitis C in their outpatient pharmacy. Depreciation expense decreased $6.4 million from $39.9 million in fiscal year 2015 to $33.5 million in fiscal year 2016 and decreased $3.1 million from $43.0 million in fiscal year 2014 to $39.9 million in fiscal year 2015. The decrease in fiscal years 2016 and 2015 was attributed to capital spending reductions and previously recorded IT assets recorded on Harborview s statements of net position becoming fully depreciated. Nonoperating Revenues (Expenses) Nonoperating revenues (expenses) consist primarily of investment income, net, interest expense, donations, intergovernmental transfer expense, strategic funding to UW Medicine entities, and mission support to King County. In 2016, net nonoperating expenses increased $7.6 million from $24.7 million for the year ended June 30, 2015 to $32.3 million at June 30, 2016. In 2016, nonoperating expenses increased as a result of strategic funding to affiliates, primarily UWNC and a $5.0 million mission support expense to King County as a result of new provision in the hospital services agreement. Net nonoperating expense increased $18.3 million from $6.4 million at June 30, 2014 to $24.7 million at June 30, 2015. The increase in net nonoperating expenses was primarily due to intergovernmental transfers related to Harborview s participation in Washington State Provider Access Payment (PAP) program and increased strategic funding to affiliates. Total Margin Total margin or excess margin is a ratio that defines the percentage of total revenue that has been realized in the form of net income (loss) and is a common measure of total hospital profitability. Total margin for the fiscal years 2016, 2015, and 2014 compared to industry median is illustrated in the chart to the right. 4.1%
1.8%4.0%
-0.9%-2%
0%
2%
4%
6%
2015Moody's
"Baa"2016 2015 2014
Total Margin

HARBORVIEW MEDICAL CENTER (A Component Unit of King County)
(Operated by the University of Washington) cussion and Analysis (Unaudited)
June 30, 2016 and 2015
8
Financial Analysis Net Position The table below is a presentation of certain condensed financial information derived from Harborview s net position as of the fiscal years ended June 30, 2016, 2015, and 2014:
2016 2015 2014(In thousands)Current assets $ 408,516 376,705 285,596 Noncurrent assets:Capital assets, net 300,364 307,259 331,359 Funds held by the University of Washington 600 600 600 Assets whose use is limited 107,462 121,677 113,103 Other assets 17,208 14,025 10,865
Total assets 834,150 820,266 741,523 Current liabilities 148,880 154,851 108,860 Noncurrent liabilities 12,951 14,499 16,996
Total liabilities 161,831 169,350 125,856 Net position 672,319 650,916 615,667 Total liabilities and net position $ 834,150 820,266 741,523
Total assets were $834.2 million at June 30, 2016 compared to $820.3 million at June 30, 2015, an increase of $13.9 million. Significant events within total assets during fiscal year 2016 include an increase in cash and cash equivalents due to positive cash flows from operating activities and patient accounts receivable, offset by a decrease in capital assets, and assets whose use is limited. Total assets were $820.3 million at June 30, 2015 compared to $741.5 million at June 30, 2014, an increase of $78.8 million. Significant events within total assets during fiscal year 2015 included an increase in cash and cash equivalents due to positive cash flows from operating activities.

HARBORVIEW MEDICAL CENTER (A Component Unit of King County)
(Operated by the University of Washington) cussion and Analysis (Unaudited)
June 30, 2016 and 2015
9
Current Assets Current assets consist of cash and cash equivalents, patient accounts receivable, and other current assets that are expected to be converted to cash within a year. Total current assets were $408.5 million, $376.7 million, and $285.6 million at fiscal years 2016, 2015, and 2014, respectively. Fiscal year 2016 composition of current assets is illustrated in the chart to the left.
Cash and cash equivalents represent amounts invested in the King County Investment Pool (KCIP) on behalf of Harborview. All amounts invested in the KCIP are available upon demand and, as such, are considered cash equivalents. Harborview s investment in the KCIP is split between cash and cash equivalents and assets whose use is limited in the statements of net position. Cash and cash equivalents increased $27.3 million in 2016 from $180.5 million at June 30, 2015 to $207.8 million at June 30, 2016 and $54.8 million in 2015 from $125.7 million at June 30, 2014 to $180.5 million at June 30, 2015. Days cash on hand is utilized to evaluate an organization s continuing ability to meet its short-term operating needs. Days cash on hand, include board- and management-designated assets, as of June 30, 2016, 2015, and 2014 and comparison to Moody s rating are illustrated in the graph to the right. Harborview s total days cash on hand decreased 1.8 days from 126.3 days at June 30, 2015 to 124.5 days at June 30, 2016 and increased 24.4 days from 101.9 days at June 30, 2014 to 126.3 days at June 30, 2015. The decrease of 1.8 days between 2016 and 2015 is due to increases in operating expenses and repayments of a CPE hold harmless estimate to the State. The increase in 2015 was driven by Medicaid expansion and positive cash flow from operating activities. In addition, days cash on hand increased due to receipt of CPE funds that will be settled and paid to the State in subsequent years.
51%36%
2% 5%
2% 1% 3% Current Assets Fiscal year 2016Cash and cash equivalentsPatient AROther receivablesDue from related partiesSupplies inventoryFunds held by the Universityof WashingtonOther Current Assets
161.0 124.5 126.3 101.9
-
50.0
100.0
150.0
200.0
2015Moody's
"Baa"2016 2015 2014
Days
Days Cash on Hand

HARBORVIEW MEDICAL CENTER (A Component Unit of King County)
(Operated by the University of Washington) cussion and Analysis (Unaudited)
June 30, 2016 and 2015
10
Net patient accounts receivable was $145.8 million as of June 30, 2016 compared to $144.9 million at June 30, 2015 and $123.2 million at June 30, 2014. Net patient accounts receivable increased $0.9 million and $21.7 million in fiscal year 2016 and 2015, respectively. In 2016, Harborview net patient accounts receivable increased as a result of delay in administrative days payments from payers. In June 2015, Harborview experienced high revenue month, which accounted for the increase in net patient accounts receivable.
Days receivable outstanding indicates an organization s ability to convert net patient service revenue to cash. Days receivable outstanding as of June 30, 2016, 2015, and 2014 and comparison to Moody s rating are provided in the graph included to the left. Harborview s net days receivable outstanding decreased 1.5 days from 61.6 days at June 30, 2015 to 60.1 days at June 30, 2016 and increased 1.5 days from 60.1 days at June 30, 2014 to 61.6 days at June 30, 2015. Net days receivable outstanding improved in 2016 as a result of Medicaid and Medicaid managed care plans paying more quickly than in fiscal year 2015. The increase in net days receivable outstanding during fiscal year 2015 is driven in part by the reduction of charity write-offs
and the shift to managed care Medicaid payer plans, which has historically paid slower. As of June 30, 2016 and 2015, 34% and 39% of the gross patient accounts receivable balance is due from commercial payers, 60% and 56% is due from governmental payers Medicare and Medicaid, 3% and 3% is due from self-pay patients, and 3% and 2% from the Washington Health Benefit Exchange, respectively. Due from related parties consists of amounts due for services provided by Harborview to UW Medicine entities, including the School. Due from related parties increased $3.0 million from $15.9 million at June 30, 2015 to $18.9 million at June 30, 2016 and increased $10.7 million from $5.2 million at June 30, 2014 to $15.9 million at June 30, 2015. The increase in 2016 relates to the timing of payments between Harborview and other UW Medicine entities. In 2015, the increase in due from related parties is the result of Provider Access Payment funding to the School which reduced the faculty funding requirement from Harborview. Noncurrent Assets Capital assets net of accumulated depreciation, decreased $6.9 million during fiscal year 2016 from $307.3 million at June 30, 2015 to $300.4 million at June 30, 2016 and decreased $24.1 million during fiscal year 2015 from $331.4 million at June 30, 2014 to $307.3 million at June 30, 2015. The decrease in both years was primarily due to continued depreciation of depreciable assets offset by moderate capital spending. Additional discussion regarding capital asset activity during the fiscal years can be found in the notes to the financial statements.
47.460.1 61.6 60.1
20.030.040.050.060.070.0
2015 Moody's"Baa"
2016 2015 2014
Days
Net Days Receivable Outstanding

HARBORVIEW MEDICAL CENTER (A Component Unit of King County)
(Operated by the University of Washington) cussion and Analysis (Unaudited)
June 30, 2016 and 2015
11
Assets whose use is limited (AWUL) includes board-designated, management-designated, and restricted investments. These investments include cash, long-term investments, and property held for future use and are used by Harborview to fund strategic initiatives, capital improvements, and to purchase equipment. At June 30, 2016, total assets whose use is limited was $107.5 million, compared to $121.7 million at June 30, 2015, a decrease of $14.2 million between years. The decrease in AWUL is due to an $11.2 million repayment of CPE hold harmless to the State in 2016. At June 30, 2015, assets whose use is limited is $121.7 million, compared to $113.1 million at June 30, 2014, an increase of $8.6 million, which was attributed to reduced capital expenditures and an increase in the funds set aside for the CPE hold harmless repayment to the State. Other assets consist of long-term prepaid expenses. The long-term prepaid expense reflected in other assets of $17.2 million, $14.0 million, and $10.9 million at June 30, 2016, 2015, and 2014, respectively, entitles Harborview access to the enterprise-wide IT software and services. The increase in the balance is a result of new IT capital projects.Current Liabilities Current liabilities consist of accounts payable and other accrued liabilities that are expected to be paid within a year. Total current liabilities were $148.9 million, $154.9 million, and $108.9 million at June 30, 2016, 2015, and 2014, respectively. Fiscal year 2016 composition of current liabilities is illustrated in the chart below. Accounts payable and accrued expenses decreased $10.4 million from $30.9 million at June 30, 2015 to $20.5 million at June 30, 2016 and increased $11.1 million from $19.8 million at June 30, 2014 to $30.9 million at June 30, 2015. Changes in accounts payable and accrued expenses are primarily driven by timing of payments to vendors. Accrued salaries, wages, and employee benefits decreased $0.6 million from $47.8 million at June 30, 2015 to $47.2 million at June 30, 2016 and increased $5.6 million from $42.2 million at June 30, 2014 to $47.8 million at June 30, 2015. Changes in accrued salaries, wages, and employee benefits are primarily driven by the number of employees, employee merit increases, and compensated absences accrual. Payable to contractual agencies consists of estimated reserves for Medicare cost reports and Medicaid CPE settlements. Payable to contractual agencies increased $0.1 million from $48.4 million at June 30, 2015 to $48.5 million at June 30, 2016 and increased $22.1 million from $26.4 million at June 30, 2014 to $48.5 million at June 30, 2015. The increase in fiscal year 2016 and 2015 was driven by the development in open Medicare cost reports and Medicaid CPE hold harmless estimates.
14%
31%32%
21%
1%Current Liabilities Fiscal year 2016
Accounts payable and accruedexpensesAccrued salaries, wages andemployee benefitsPayable to contractualagenciesDue to related parties
Other current liabilities

HARBORVIEW MEDICAL CENTER (A Component Unit of King County)
(Operated by the University of Washington) cussion and Analysis (Unaudited)
June 30, 2016 and 2015
12
Due to related parties consists of amounts due for services provided to Harborview from UW Medicine shared services, information technology support, the School, and strategic funding to affiliates. Amounts due to related parties increased $5.1 million from $26.3 million at June 30, 2015 to $31.4 million at June 30, 2016 and increased $7.3 million from $19.0 million at June 30, 2014 to $26.3 million at June 30, 2015. In 2016, as a result of a new provision in the hospital services agreement, Harborview recorded a payable to King County in the amount of $5.0 million related to mission support expense. The increase in 2015 was a result of timing in payments between Harborview, the University, and Northwest Hospital. Factors Affecting the Future UW Medicine Accountable Care Network In 2014, UW Medicine formed an Accountable Care Network (ACN) with other selected healthcare organizations and healthcare professionals in Western Washington to form a care delivery network to assume responsibility for the healthcare of contracted populations of patients to achieve the Triple Aim: improved healthcare experience for the individual, improved health of the population, and more affordable care.
The ACN has contracted with the Washington Health Care Authority (HCA) to participate in its new Puget Sound Accountable Care Program (ACP) as a healthcare benefit option for Public Employees Benefits Board (PEBB) members. The ACP is offered to all PEBB members who reside in Snohomish, King, Kitsap, Pierce, and Thurston Counties, with possible expansion into a number of additional counties planned in 2017. This contract with HCA to cover PEBB members began January 1, 2016. A subset of the network members have also agreed to participate with the ACN in a contract with Premera as part of its new Accountable Health System (AHS) product. As an AHS, the UW Medicine ACN will share in accountability for the quality and cost of healthcare for Premera members who select this plan. This product was sold both on and off the Washington Health Exchange in select counties with coverage that began January 1, 2016 and must have 5,000 planwide members per product, per region to share in financial savings and risk. The UW Medicine ACN also entered into an agreement to provide healthcare services to Nonunion employees of a large local employer with coverage that began January 1, 2015.
These arrangements provide an opportunity for shared savings between the ACN and the contracted entity based on achieving quality and financial benchmarks. If certain financial benchmarks are not attained, UW Medicine, along with its network members, are at risk for reductions in payment levels from the contracted entity based on the agreement. Employee Costs Rising benefit costs, particularly for pensions and healthcare, continue to impact the University and Harborview. Employer pension funding rates for the Public Employees Retirement System (PERS) pension plans increased 19.0% during fiscal year 2016, from 9.2% to 11.0% of covered salary, and will be increasing to 11.18% of covered salary for fiscal year 2017. Likewise, the monthly employer base rate paid by the University and Harborview for employee healthcare increased 27.0% during fiscal year 2016, from $662 to $840 per active employee, and will be

HARBORVIEW MEDICAL CENTER (A Component Unit of King County)
(Operated by the University of Washington) cussion and Analysis (Unaudited)
June 30, 2016 and 2015
13
increasing to $888 per active employee during fiscal year 2017. Both rates are likely to continue increasing over the next few years. Government Accounting Standards Board (GASB) issued Statement No. 68, Accounting and Financial Reporting for Pensions which requires governments providing defined benefit pensions to their employees to recognize the net pension liability for pension benefits on their statements of net position. Net pension liability is measured as total pension liability, less the amount of the s fiduciary net position. GASB Statement No. 68 is applicable to the University as well as to the UW Medicine entities that are part of the financial reporting entity of the University. Management evaluated the requirements of this statement and determined that the GASB Statement No. 68 is not applicable to Harborview as Harborvie s financial reporting entity and Harborview does not directly fund the employer contribution to the Department of Retirement System. Harborview funds its share of contribution expense through the University benefit load rate, Harborview does not record a net pension liability on its 30, 2016 that relates to University employees deployed at Harborview is approximately $233.0 million.

14
HARBORVIEW MEDICAL CENTER(A Component Unit of King County)(Operated by the University of Washington)Statements of Net Position
June 30, 2016 and 2015(Dollar amounts in thousands)
Assets 2016 2015Current assets:Cash and cash equivalents $ 207,818 180,469Funds held by the University of Washington 2,949 3,577Patient accounts receivable, less allowance for uncollectibleaccounts of $33,897 in 2016 and $30,777 in 2015 145,818 144,875Other receivables 9,829 12,459Due from related parties 18,876 15,928Supplies inventory 10,625 8,604Other current assets 12,601 10,793
Total current assets 408,516 376,705Noncurrent assets:Capital assets, net of accumulated depreciation 300,364 307,259Fund held by the University of Washington 600 600Assets whose use is limited 107,462 121,677Other assets 17,208 14,025
Total noncurrent assets 425,634 443,561Total assets $ 834,150 820,266
Liabilities and Net PositionCurrent liabilities:Accounts payable and accrued expenses $ 20,482 30,857Accrued salaries, wages, and employee benefits 47,163 47,754Due to related parties 31,350 26,277Payable to contractual agencies 48,544 48,454Current portion of unearned rent 686 704Current portion of long-term debt 655 805
Total current liabilities 148,880 154,851Noncurrent liabilities:Unearned rent and other 12,828 13,698Long-term debt, net of current portion 123 801
Total liabilities 161,831 169,350Net position:Net investment in capital assets 299,586 305,653Expendable, restricted 10,150 9,983Nonexpendable, restricted 2,534 2,527Unrestricted 360,049 332,753
Total net position 672,319 650,916Total liabilities and net position $ 834,150 820,266
See accompanying notes to basic financial statements.

15
HARBORVIEW MEDICAL CENTER(A Component Unit of King County)(Operated by the University of Washington)Statements of Revenues, Expenses, and Changes in Net Position
Years ended June 30, 2016 and 2015(Dollar amounts in thousands)
2016 2015Operating revenues:Net patient service revenues (net of provision for uncollectibleaccounts of $28,494 in 2016 and $26,741 in 2015) $ 887,533 858,845Other operating revenues 76,780 71,044
Total operating revenues 964,313 929,889Operating expenses:Salaries and wages 350,126 343,507Employee benefits 120,227 101,072Purchased services 201,313 175,669Supplies and other 209,860 208,523Depreciation 33,521 39,926
Total operating expenses 915,047 868,697Income from operations 49,266 61,192
Nonoperating revenues (expenses):Investment income, net 2,715 1,823Interest expense (56) (212) Donations 1,723 979Funding to affiliates (30,676) (26,473) Funding to King County (5,000) —Other, net (1,020) (803) Nonoperating expenses (32,314) (24,686) Income before capital contributions, additionsto permanent endowments, and other 16,952 36,506
Capital contributions, additions to permanent endowments, and other:Additions to permanent endowments 8 —Other transfers 4,443 (1,257) Total capital contributions, additions to permanentendowments, and other 4,451 (1,257) Increase in net position 21,403 35,249
Net position – beginning of year 650,916 615,667Net position – end of year $ 672,319 650,916
See accompanying notes to basic financial statements.

16
HARBORVIEW MEDICAL CENTER(A Component Unit of King County)(Operated by the University of Washington)Statements of Cash Flows
Years ended June 30, 2016 and 2015(Dollar amounts in thousands)
2016 2015Cash flows from operating activities:Cash received for patient service revenues and other $ 886,680 859,394Cash received for other services 80,037 71,010Cash paid to employees (466,574) (439,031) Cash paid to suppliers and others (434,003) (393,673)
Net cash provided by operating activities 66,140 97,700Cash flows from noncapital financing activities:Donations and other income received 1,723 979Funding to affiliates (29,733) (18,313) Additions to permanent endowments 8 —Other (692) (798)
Net cash used in noncapital financing activities (28,694) (18,132) Cash flows from capital and related financing activities:Principal payments on long-term debt (810) (1,460) Cash paid for interest (61) (215) Capital expenditures (26,229) (15,082)
Net cash used in capital and related financing activities (27,100) (16,757) Cash flows from investing activities:Net decrease (increase) in assets whose use is limited 14,683 (9,657) Investment income, net 2,320 1,649
Net cash provided by (used in) investing activities 17,003 (8,008) Increase in cash and cash equivalents 27,349 54,803
Cash and cash equivalents, beginning of year 180,469 125,666Cash and cash equivalents, end of year $ 207,818 180,469Reconciliation of income from operations to net cash provided by operatingactivities:Income from operations $ 49,266 61,192Adjustments to reconcile income from operations to net cash providedby operating activities:Depreciation 33,521 39,926Provision for uncollectible accounts 28,494 26,741Net increase in current and other assets (36,140) (66,207) Net (decrease) increase in current liabilities, except current portionof long-term debt (8,113) 37,019Decrease in unearned rent (888) (971)
Net cash provided by operating activities $ 66,140 97,700Supplemental disclosures of cash flow information:Increase in accounts payable for capital assets $ 738 762Donation gift in kind 3 245Loss on disposal of capital assets (341) (18)
See accompanying notes to basic financial statements.

HARBORVIEW MEDICAL CENTER (A Component Unit of King County)
(Operated by the University of Washington) Notes to Financial Statements
June 30, 2016 and 2015
17 (Continued)
(1) Organization Harborview Medical Center (Harborview) is a 413 licensed bed hospital operating in Seattle, Washington with extensive ambulatory services and is a discretely presented component unit of King County, Washington (the County). Harborview is managed and operated by UW Medicine under a Hospital Services Agreement between the County and the Board of Regents of the University of Washington (the University), in accordance with policies established by the Harborview Board of Trustees (the Trustees). Harborview is a Level 1 adult and pediatric trauma medical center that serves a four state region with centers of emphasis for areas of care. The first management contract for the University to operate and manage Harborview was effective on July 1, 1967, and was revised and extended several times. In January 2016, the County Council approved a new Hospital Services Agreement effective February 25, 2016. The Agreement has a ten-year term, and may be renewed by the parties for two successive ten-year terms. The Agreement recognizes the shared goal of UW Medicine and the County to provide the Harborview mission population with access to primary, secondary, tertiary, and quaternary services and UW Medicine s mission to improve the health of the public through its clinical, research, and teaching activities. The general conditions within the Hospital Services Agreement provide that the County retains title to all real and personal properties acquired for the County with Harborview capital or operating funds. However, Harborview retains the rights of ownership to these real and personal properties and records these assets on its books. The Trustees are accountable to the public and the County government for all financial aspects of Harborview s operation and agree to maintain a fiscal policy that keeps the essential operating program and expenditures within the limits of the operating income. The Trustees agree to adopt operational standards of patient care as developed and recommended by UW Medicine. All such standards must comply with the requirements of applicable agencies such as The Joint Commission. One significant provision under the new Agreement requires that for each year of the Agreement, the Trustees will allocate and disburse to the County $5.0 million from Harborview revenues or reserves to support Mission Population programs and services that are currently being provided by the County. The annual allocation and disbursement may be reduced by an amount agreed to by the parties based upon reductions in costs incurred by the County or new funding sources that would not otherwise be received by the County. UW Medicine staffs, manages, and provides all medical, dental, and other professional services to Harborview patients through University employees and University School of Medicine faculty. UW Medicine conducts research and teaching activities at Harborview, consistent with University policies. The University retains authority over all personnel and employment matters involving University employees who work at Harborview. UW Medicine continues to be responsible for management of the facilities, and development of the six-year Capital Improvement Plan for review and approval by the Trustees and King County. UW Medicine manages Harborview so as to retain its institutional identity in a manner which, to the extent of the funds available to Harborview, will achieve the aims of the Trustees to meet their community obligations and provide services to address the community s needs as identified in Harborview s mission statement.

HARBORVIEW MEDICAL CENTER (A Component Unit of King County)
(Operated by the University of Washington) Notes to Financial Statements
June 30, 2016 and 2015
18 (Continued)
A special account is maintained with the University to receive reimbursement payments from Harborview s operating account and to pay for the costs of all services and expenditures provided by the University. Harborview is owned by the County, governed by a county-appointed board of trustees and managed by the University of Washington. Harborview is an entity of UW Medicine which also includes: UW Medical Center, Northwest Hospital & Medical Center (Northwest Hospital), Valley Medical Center (VMC), UW Neighborhood Clinics (UWNC), UW Physicians (UWP), the UW School of Medicine (the School), and Airlift Northwest (Airlift).
(2) Summary of Significant Accounting Policies (a) Accounting Standards
The accompanying financial statements are prepared in accordance with accounting principles generally accepted in the United States of America using the accrual basis of accounting. Harborview s financial statements and note disclosures are based on all applicable Government Accounting Standards Board (GASB) pronouncements and interpretations. Harborview uses proprietary fund accounting.
(b) Basis of Accounting Harborview s financial statements have been prepared using the accrual basis of accounting with the economic resources measurement focus. Under this method of accounting, revenues are recognized when earned and expenses are recorded when liabilities are incurred without regard to receipt or disbursement of cash.
(c) Use of Estimates The preparation of financial statements, in conformity with U.S. generally accepted accounting principles, requires management to make estimates and assumptions that affect the reported amounts of assets and liabilities and disclosures of contingent assets and liabilities at the date of the financial statements and the reported amounts of revenues and expenses during the reporting period. Actual results could differ from those estimates. Significant estimates in Harborview s financial statements include patient accounts receivable allowances, receivable from contractual agencies, payable to contractual agencies, and the fair value of investments.
(d) Cash and Cash Equivalents Cash and cash equivalents primarily comprise investments held in an external investment pool managed for Harborview by the County. These investments consist of pooled investment funds of money markets, U.S. agency securities, U.S. agency mortgage-backed securities, U.S. Treasury securities, Corporate bonds, and repurchase agreements and are carried at fair value. The King County Investment Pool is not registered with the Securities and Exchange Commission (SEC) as an investment company. Oversight is provided by the King County Executive Finance Committee (EFC). All investments are subject to written policies and procedures adopted by the EFC.

HARBORVIEW MEDICAL CENTER (A Component Unit of King County)
(Operated by the University of Washington) Notes to Financial Statements
June 30, 2016 and 2015
19 (Continued)
The EFC reviews pool performance monthly. The King County Investment Pool was invested as follows at June 30:
2016Cash and cash equivalents 9.0%U.S. Treasuries and agencies 68.6Washington State Local GovernmentInvestment Pool 8.4Corporate and other fixed income 14.0
Total 100.0%
Concentrations of credit risk consist of pooled investments held on behalf of the Harborview at the County. The King County Investment Pool allocates participants shares using an amortized cost basis. Monthly income is distributed to participants based on their relative participation during the period. Income is calculated based on: (1) realized investment gains and losses; (2) interest income based on stated rates (both paid and accrued); and (3) the amortization of discounts and premiums on a straight-line basis. Income is reduced by the contractually agreed upon investment fee. Harborview has unrestricted access to these investments at its discretion and without limitation, and as such, these investments are considered cash equivalents. Harborview has cash equivalents of $207.8 million and $180.5 million as of June 30, 2016 and 2015, respectively.
(e) Assets Whose Use is Limited Assets whose use is limited include board and management designated unrestricted assets set aside for future capital and program purposes over which the Trustees and management retain control and may at their own discretion subsequently use for other purposes; investments restricted for use by creditors, grantors, or contributors external to Harborview; and investments restricted for capital purchases representing unspent bond proceeds, required capital funding by Harborview, and interest earnings thereon by the County. Investments are held in the King County Investment Pool, managed for Harborview by the County, and are carried at fair market value. Harborview has assets whose use is limited of $107.5 million and $121.7 million as of June 30, 2016 and 2015, respectively. Disclosure requirements related to investment risk, credit risk, interest rate risk, foreign currency risk, and deposit risk are applicable to the primary government, which, as it relates to Harborview, is the County.
(f) Inventories Inventories consist primarily of surgical, medical, and pharmaceutical supplies in organized stores at various locations across the Harborview. Inventories are recorded at the lower of cost first-in, first-out (FIFO) or market.

HARBORVIEW MEDICAL CENTER (A Component Unit of King County)
(Operated by the University of Washington) Notes to Financial Statements
June 30, 2016 and 2015
20 (Continued)
(g) Capital Assets Capital assets, defined as purchases with a per item cost of $2,000 or greater and a useful life of at least two years, are stated at cost at acquisition or if acquired by gift, at fair market value at the date of the gift. Additions, replacements, major repairs, and renovations are capitalized. Maintenance and repairs are expensed. The cost of the capital assets sold or retired and the related accumulated depreciation are removed from the accounts, and any resulting gain or loss is recorded. The provision for depreciation is determined by the straight-line method, which allocates the cost of tangible property ratably over its estimated useful life. The estimated useful lives used by Harborview are as follows:
Land improvements 25 yearsBuildings, renovations, and furnishingsFixed equipmentMovable equipmentLeasehold improvements The shorter of thelease term oruseful life
Interest is capitalized on construction projects as a cost of the related project beginning with commencement of construction and ceases when the construction period ends and the related asset is placed in service. No interest was capitalized during 2016 and 2015. For the year ended June 30, 2016 and 2015, supplies and other expense includes approximately $0 and $9.2 million for the write-off of certain capital assets and restricted investments for which management determined carrying amounts were not recoverable.
(h) Other Assets UW Medicine ITS (a department of the University) records enterprise-wide information technology (IT) capital assets that are purchased for use by UW Medicine entities. Harborview provides advance funding to UW Medicine ITS, which entitles Harborview access to the enterprise-wide IT software and services. The prepaid portion of this funding is reported within other current assets and other assets in the statements of net position. At June 30, 2016 and 2015, $10.4 million and $8.6 million, respectively, is recorded in other current assets and $17.2 and $14.0 million is recorded in other assets, respectively.
(i) Compensated Absences University employed staff at Harborview earn annual leave at rates based on length of service and sick leave at the rate of one day per month. Annual leave balances, which are limited to 240 hours, can be converted to monetary compensation upon employment termination. Sick leave balances, which are unlimited, can be converted to monetary compensation annually at 25% of the employees normal

HARBORVIEW MEDICAL CENTER (A Component Unit of King County)
(Operated by the University of Washington) Notes to Financial Statements
June 30, 2016 and 2015
21 (Continued)
compensation rate for any balance that exceeds 480 hours or for any balance upon retirement or death. Harborview recognizes annual and sick leave liabilities when earned. Annual leave accrued at June 30, 2016 and 2015 is $23.3 million and $23.8 million, respectively. Sick leave accrued as of June 30, 2016 and 2015 is $3.5 million and $4.6 million, respectively. Compensated absences are reported within the accrued salaries, wages, and employee benefits in the statements of net position.
(j) Payable to Contractual Agencies Harborview is reimbursed for Medicare inpatient, outpatient, psychiatric, and rehabilitation services, and for capital and medical education costs during the year either prospectively or at an interim rate. The difference between interim payments and the reimbursement computed based on the Medicare filed cost report results in an estimated receivable from or payable to Medicare at the end of each year. The Medicare program s administrative procedures preclude final determination of amounts receivable from or payable to Harborview until after the cost reports have been audited or otherwise reviewed and settled by Medicare. Public hospitals located in the state of Washington designated by the Washington State legislature are reimbursed at the full cost of Medicaid inpatient covered services under the public hospital Certified Public Expenditures (CPE) payment method. See note 3(a) for discussion regarding this program. The estimated settlement amounts for Medicare cost report and CPE payments that are not considered final are included in payable to contractual agencies in the accompanying statements of net position.
(k) Classification of Revenues and Expenses Harborview s statements of revenues, expenses, and changes in net position distinguish between operating and nonoperating revenues and expenses. Operating revenues, such as patient service revenue, result from exchange transactions associated with providing healthcare services Harborview s primary business. Exchange transactions are those in which each party to the transaction receives and gives up essentially equal values. Operating expenses are all expenses, other than financing costs, incurred by Harborview to provide healthcare services to patients. Nonoperating revenues and expenses are recorded for certain exchange and nonexchange transactions. This activity includes investment income, net, interest expense, intergovernmental transfer expense, funding to King County and strategic funding to affiliates of UW Medicine.
(l) Net Patient Service Revenues Harborview has agreements with third-party payers that provide for payments to Harborview at amounts different from its established rates. Payment arrangements include prospectively determined rates per discharge, reimbursed costs, discounted charges, and per diem payments. Net patient service revenues are reported at the estimated net realizable amounts from patients, third-party payers, and

HARBORVIEW MEDICAL CENTER (A Component Unit of King County)
(Operated by the University of Washington) Notes to Financial Statements
June 30, 2016 and 2015
22 (Continued)
others for services rendered, including estimated retroactive adjustments under reimbursement agreements with third-party payers. Retroactive adjustments are accrued on an estimated basis in the period the related services are rendered and adjusted in future periods as final settlements are determined. A summary of the payment arrangements with major third-party payers is as follows: Medicare Acute inpatient services rendered to Medicare program beneficiaries are paid at prospectively determined rates per discharge based on Medicare severity diagnosis-related groupings (MS-DRGs), as well as reimbursements related to capital costs. These rates vary according to a patient classification system that is based on clinical, diagnostic, and other factors. Payments for Medicare outpatient services are provided based upon a prospective payment system known as ambulatory payment classifications (APC). APC payments are prospectively established and may be greater than or less than the primary government s actual charges for its services. The Medicare program utilizes the prospective payment system known as case mix group (CMG) for rehabilitation services reimbursement. As with MS-DRGs, CMG payments are prospectively established and may be greater than or less than Harborview s actual charges for its services. Psychiatric services are also paid prospectively using a federal per diem payment rate adjusted for comorbidity and various adjustment factors. Third-party settlements are accrued on an estimated basis in the period the related services are rendered and adjusted in future periods as final settlements are determined. Medicaid Inpatient services rendered to Medicaid program beneficiaries are provided at prospectively determined rates per discharge. Outpatient services rendered are provided based upon the APC prospective payment system. See note 3(a) for discussion surrounding the Medicaid certified public expenditure program. Commercial Harborview also has entered into payment agreements with certain commercial insurance carriers and preferred provider organizations. The basis for payment to Harborview under these agreements includes prospectively determined rates per discharge, discounts from established charges, and prospectively determined daily rates. Exchange (HIX) Washington State health exchange (HIX) entered into agreements with certain commercial insurance plans to provide patients access to healthcare services. The basis for payment to Harborview under these agreements includes prospectively determined rates per discharge, discounts from established charges, and prospectively determined daily rates.

HARBORVIEW MEDICAL CENTER (A Component Unit of King County)
(Operated by the University of Washington) Notes to Financial Statements
June 30, 2016 and 2015
23 (Continued)
(m) Accountable Care Network UW Medicine has formed an accountable care network (ACN) with other healthcare organizations and healthcare professionals to share financial and clinical responsibility for the healthcare of particular populations of patients. Harborview, as part of UW Medicine is a network member of the UW Medicine ACN and as such shares in any risk contract surplus or deficits based on agreed-upon contractual terms. Since its inception, the ACN has entered into various contracts, which include provisions for shared risk as well as shared savings based on achieving certain quality and financial benchmarks. Harborview, as part of UW Medicine and the other network members share in the financial risk or savings. At June 30, 2016 and 2015, Harborview has recorded a liability of $667,000 and $109,000, respectively for its portion of the estimated liability related to these risk-sharing arrangements, which is reflected in due to related parties in the accompanying statements of net position.
(n) Charity Care Harborview provides care without charge or at amounts less than established rates to patients who meet certain criteria under its charity care policy. Harborview maintains records to identify and monitor the level of charity care it provides. These records include charges foregone for services and supplies furnished under its charity care policy to the uninsured and the underinsured. Because Harborview does not pursue collection of amounts determined to qualify as charity care, these are not reported as net patient service revenue. The charges associated with charity care provided by the Hospital are approximately $63.5 million and $60.0 million, respectively, for the years ended June 30, 2016 and 2015. Harborview estimates the cost of charity care using its Medicaid cost to charge ratio of 41% for the fiscal years ended June 30, 2016 and 2015. Applying Harborview s Medicaid cost to charge ratio of 41% to total charity of $63.5 million results in an estimated cost of charity care and uncompensated care of $26.0 million for the fiscal year ended June 30, 2016. Applying Harborview s Medicaid cost to charge ratio of 41.0% to total charity of $60.0 million results in an estimated cost of charity care and uncompensated care of $24.6 million for the fiscal year ended June 30, 2015.
(o) Federal Income Taxes Harborview, as a component of the State of Washington, is not subject to federal income taxes under Section 115 of the Internal Revenue Code.
(p) Recently Adopted and New Accounting Pronouncements In June 2012, GASB issued Statement No. 68, Accounting and Financial Reporting for Pensions, which is effective for the fiscal year beginning July 1, 2014. It requires governments providing defined benefit pensions to their employees to recognize the net pension liability for pension benefits on their statements of net position. Net position liability is measured as total pension liability, less the amount of the plan s fiduciary net position. Management evaluated the impact of this statement and determined that it is not applicable to Harborview as Harborview does not directly fund the employer contribution to the Department of Retirement System (DRS), which is funded by the University. Harborview is not

HARBORVIEW MEDICAL CENTER (A Component Unit of King County)
(Operated by the University of Washington) Notes to Financial Statements
June 30, 2016 and 2015
24 (Continued)
part of the financial reporting entity of the University, thus, Harborview does not record a net pension liability on its financial statements. In February 2015, the GASB issued Statement No. 72, Fair Value Measurement and Application, which is effective for the fiscal year ending June 30, 2016. This Statement provides guidance for determining a fair value measurement for financial reporting purposes. It also provides guidance for applying fair value to certain investments and disclosures related to all fair value measurements. This statement establishes a three level hierarchy of inputs to valuation techniques used to measure fair value and requires disclosures to be made about fair value measurements, the level of fair value hierarchy, and valuation techniques. As Harborview is part of an investment pool, this standard does not apply to its financial statements. In June 2015, the GASB issued Statement No. 73, Accounting and Financial Reporting for Pensions and Related Assets That Are Not within the Scope of GASB Statement 68, and Amendments to Certain Provisions of GASB Statements 67 and 68. The guidance for plans not within No. 68 s scope will be effective for the fiscal year ending June 30, 2017. This statement is intended to improve financial reporting of governments whose employees are provided pensions that are not within the scope of No. 68 and improve the usefulness of information associated with governments that hold assets accumulated for purposes of providing defined benefit pensions not within the scope of Statement No. 68. Harborview is currently analyzing the impact of this statement. In June 2015, the GASB issued Statement No. 75 Accounting and Financial Reporting for Postemployment Benefits Other Than Pensions, which is effective for the fiscal year ending June 30, 2018. This statement establishes standards of accounting and financial reporting for defined benefit OPEB and defined contribution OPEB that are provided to the employees of state and local governmental employers through OPEB plans that are administered through trusts or equivalent arrangements. This statement also establishes standards of accounting and financial reporting for OPEB plans that are not administered through trusts or equivalent arrangements. Harborview is currently analyzing the impact of this statement. In June 2015, the GASB issued Statement No. 76, The Hierarchy of Generally Accepted Accounting Principles for State and Local Governments, which is effective for the fiscal year ending June 30, 2016. The objective of this Statement is to identify the hierarchy of generally accepted accounting principles (GAAP). This Statement reduces the GAAP hierarchy to two categories of authoritative GAAP and addresses the use of authoritative and nonauthoritative literature in the event that the accounting treatment for a transaction or other event is not specified within a source of authoritative GAAP. There was no impact to the financial statements of Harborview as a result of implementing this statement.
(q) Reclassifications Certain reclassifications have been made to prior year amounts to conform to the current year presentation.

HARBORVIEW MEDICAL CENTER (A Component Unit of King County)
(Operated by the University of Washington) Notes to Financial Statements
June 30, 2016 and 2015
25 (Continued)
(3) Net Patient Service Revenues Net patient service revenue is reported at the estimated net realizable amounts from patients, third-party payers, and others for services rendered, including estimated retroactive adjustments under reimbursement agreements with third-party payers. Retroactive adjustments are accrued on an estimated basis in the period the related services are rendered and adjusted in future periods as final settlements are determined. In 2016 and 2015, net patient service revenue includes approximately $7.2 million and $7.8 million of revenue, respectively, relating to prior years net Medicare and Medicaid cost report settlements and revised estimates, including DSH reimbursement and the CPE Program. The following are the components of net patient service revenues for the year ended June 30 (in thousands):
2016 2015Gross patient service revenues $ 2,226,302 2,099,327 Less adjustments to patient service revenues:Charity care (63,479) (59,964) Contractual discounts (1,246,796) (1,153,777) Provision for uncollectible accounts (28,494) (26,741)
Total adjustments to patient service revenues (1,338,769) (1,240,482) Net patient service revenues $ 887,533 858,845

HARBORVIEW MEDICAL CENTER (A Component Unit of King County)
(Operated by the University of Washington) Notes to Financial Statements
June 30, 2016 and 2015
26 (Continued)
Harborview grants credit without collateral to its patients, most of whom are local residents and insured under third-party payer agreements. The mix of gross patient charges and receivables from significant third-party payers for the years ended June 30, 2016 and 2015 is as follows:
Patientservice Accountscharges receivable2016:Medicare 30% 22%Medicaid 34 38Commercial and other 31 34Self-pay 3 3Exchange (HIX) 2 3
Total 100% 100%2015:Medicare 30% 25%Medicaid 33 31Commercial and other 33 39Self-pay 3 3Exchange (HIX) 1 2
Total 100% 100%
(a) Medicaid Certified Public Expenditure Reimbursement Public hospitals located in the state of Washington designated by the Washington State legislature are reimbursed at the full cost of Medicaid inpatient covered services under the public hospital CPE payment method. Full cost payments are determined using the respective hospital s Medicaid ratio of cost to charges
to determine the cost for covered medically necessary services. The costs will be certified as actual expenditures by the hospital and the State claims federal match on the amount of the related certified public expenditures. Per the Centers for Medicare and Medicaid Services (CMS) approved Medicaid State Plan, participating hospitals receive only the federal match portion of the allowable costs. Harborview received $58.5 million and $71.1 million in claims payments under this program for the years ended June 30, 2016 and 2015, respectively. In addition, Harborview receives the federal match portion of Disproportionate Share (DSH) payments, which are the lesser of qualifying uncompensated care cost or the hospital s specific limit. Harborview received $40.0 million and $40.9 million in DSH funding under this program for the years ended June 30, 2016 and 2015, respectively.

HARBORVIEW MEDICAL CENTER (A Component Unit of King County)
(Operated by the University of Washington) Notes to Financial Statements
June 30, 2016 and 2015
27 (Continued)
Since the inception of the program, the Washington State Legislature (the State) has provided, through an annual budget proviso, a hold harmless provision for hospitals participating in the CPE program. Through this proviso, hospitals participating in the CPE program will receive no less in combined state and federal payments than they would have received under the previous payment methodology. In addition, the hold harmless provision ensures that participating hospitals receive DSH payments as specified in the legislation. In the event of a shortfall between CPE program payments and the amount determined under the hold harmless provision, the difference is paid to the hospitals as a grant from state-only funds. Harborview received $14.7 million and $13.5 million in state grants for the years ended June 30, 2016 and 2015, respectively. Claims payments, DSH payments, and state grant funds are included in net patient service revenues in the statements of revenues, expenses, and changes in net position. CPE payments are subject to retrospective determination of actual costs once Harborview s Medicare Cost Report is audited. CPE program payments are not considered final until retrospective cost reconciliation is complete, after Harborview receives its Medicare Notice of Program Reimbursements (NPR) for the corresponding cost reporting year. To date, the 2007 CPE program year has had a final settlement. Interim state grant payments are retrospectively reconciled to hold harmless after actual claims are repriced using the applicable DRG payment methodology. This process takes place approximately 12 months after the end of the fiscal year and results in either a payable to, or receivable from, the state Medicaid Program. Harborview has estimated the expected final settlement amounts based on the difference between CPE payments received and the estimated hold harmless amount. For the years ended June 30, 2016 and 2015, net patient service revenue includes approximately $2.7 million and $(0.3) million, respectively, of increases (decreases) relating to the prior year s estimate and settlements. As of June 30, 2016, for fiscal years 2008 2016, Harborview has an estimated payable of $44.2 million for the CPE program, which is included in payable to contractual agencies in the statements of net position. As of June 30, 2015, Harborview had an estimated payable of $42.1 million for the CPE program, which is included in payable to contractual agencies in the statements of net position.
(b) Professional Services Supplemental Payment (PSSP) and Provider Access Payment (PAP) Program The professional services supplemental payment (PSSP) and provider access payment (PAP) program are programs managed by the Washington State Health Care Authority (WSHCA) benefiting certain public hospitals. CMS approved the PAP program in August 2014 for services on and after July 1, 2014. Under the program, UW Medical Center, Harborview, VMC, UWP, and Children s University Medical Group (CUMG) receive supplemental Medicaid payments for the physician and other professional services for which they bill. These supplemental payments equal the difference between
HARBORVIEW MEDICAL CENTER (A Component Unit of King County)
(Operated by the University of Washington) Notes to Financial Statements
June 30, 2016 and 2015
28 (Continued)
the standard Medicaid reimbursement and the upper payment limit allowable by federal law. UW Medical Center and Harborview provide the nonfederal share of the supplemental payments that are used to obtain the matching federal funds. Harborview recorded $11.9 million for the years ended June 30, 2016 and 2015 in intergovernmental transfers (IGT) to WSHCA related to professional claims paid in those fiscal years, which is recorded as a nonoperating expense in the statements of revenue, expenses, and changes in net position. WSHCA uses the federal match funds to make professional services supplemental payments to UW Medicine entities for PSSP and through the Medicaid managed care plans for PAP. Harborview recognized $5.9 million and $2.0 million in supplemental payments for the years ended June 30, 2016 and 2015, respectively. These payments are included in net patient service revenues in the statements of revenue, expenses, and changes in net position. There is no requirement that UWP and CUMG PSSP and PAP payments be returned to Harborview and UW Medical Center as a condition for making the IGT s. PSSP and PAP funds are combined with other revenues used by the School for the central support of faculty costs. Thus, the School requires less funding from Harborview and UW Medical Center. The faculty support was reduced by $25.7 million and $20.7 million in fiscal years 2016 and 2015, respectively. This reduction is included as an offset to purchased services in the statements of revenue, expenses, and changes in net position.
(c) Hospital Safety Net Program The Hospital Safety Net Assessment Act (HSNA) uses local funds obtained through an assessment levied on Prospective Payment System (PPS) hospitals and federal matching funds to increase Medicaid payments to hospitals. Under this program, PPS program hospitals are assessed a fee on all non-Medicare patient days. Under the original HSNA program, HSNA funds were used to prevent the significant budget cuts proposed during the 2009 session of the state legislature. The original legislation expired on June 30, 2013. In its 2013 session, the Washington State legislature passed a new assessment program that was similar to the original program as it uses federal matching funds to increase Medicaid hospital payments. Under the new HSNA program, PPS hospitals receive supplemental Medicaid payments, Critical Access Hospitals receive disproportionate share payments, and CPE hospitals receive state grants. The safety net assessment was subject to approval by the Center for Medicare and Medicaid Services before it took effect. CMS approved this program in 2014. The program has an expiration date of June 30, 2017. Harborview is exempt from the assessment as the hospital is operated by an agency of the state government and also participates in the CPE program. Harborview recognized grant funding of $10.3 million and $7.6 million for the years ended June 30, 2016 and 2015, respectively, which is recorded in other operating revenues in the statements of revenues, expenses, and changes in net position.

HARBORVIEW MEDICAL CENTER (A Component Unit of King County)
(Operated by the University of Washington) Notes to Financial Statements
June 30, 2016 and 2015
29 (Continued)
(d) Meaningful Use Incentives The American Recovery and Reinvestment Act of 2009 (ARRA) established incentive payments to eligible professionals and hospitals participating in Medicare and Medicaid programs that adopt certified electronic health records, provided the technology is being used in a meaningful way that supports the ultimate goals of improving quality, safety, and efficiency of care. Meaningful use is defined with specific quality performance metrics for eligible healthcare professionals and hospitals and certain thresholds must be met and maintained to receive payment. Harborview recognized meaningful use incentives of $6.0 million for the years ended June 30, 2016 and 2015, which are included in other operating revenues in the statements of revenue, expenses, and changes in net position.
(e) Other Federal and State Funding As a regional trauma center, Harborview is eligible for additional State funding in both 2016 and 2015 through the Trauma Enhancement program. Participating hospitals receive a pro-rata share of the pool appropriated for this program based on their portion of total inpatient and outpatient Medicaid claims submitted. Harborview received $7.5 million and $8.5 million for the years ended June 30, 2016 and 2015, respectively. In addition to the funding received through the Trauma Enhancement program, Harborview received State sponsored trauma grants in the amount of $1.5 million and $1.7 million for the years ended June 30, 2016 and 2015, respectively. Funds from both programs are included in net patient service revenues in the statements of revenues, expenses, and changes in net position.
(4) State Appropriation An appropriation is made by the State to the University on a biennial basis, specifically designated by the state for training of future healthcare professionals and to upgrade the skills of current practitioners. Harborview is designated as a division of the major program hospitals included within the total appropriation. Due to the nature of the designation, these amounts are included in other operating revenues in the accompanying statements of revenues, expenses, and changes in net position. Harborview recognized $6.3 million and $6.2 million for the years ended June 30, 2016 and 2015, respectively.

HARBORVIEW MEDICAL CENTER (A Component Unit of King County)
(Operated by the University of Washington) Notes to Financial Statements
June 30, 2016 and 2015
30 (Continued)
(5) Capital Assets The activity in Harborview s capital asset and related accumulated depreciation accounts for the years ended June 30, 2016 and 2015 is set forth below (in thousands):
Balance BalanceJune 30, June 30,
2015 Additions Transfers Retirements 2016Capital assets, not being
depreciated:Land $ 1,586 846 2,432 Construction in process 12,653 17,189 (17,258) 12,584
Total capital assets,not beingdepreciated 14,239 18,035 (17,258) 15,016
Capital assets, being depreciated:Land improvements 5,584 14 5,598 Buildings, renovations, and
furnishings 413,590 6,110 419,700 Fixed equipment 143,893 86 (166) 143,813 Movable equipment 284,282 8,932 10,103 (8,864) 294,453 Leasehold improvements 9,555 945 10,500
Total capital assets,being depreciated 856,904 8,932 17,258 (9,030) 874,064
Total capital assetsat historical cost 871,143 26,967 (9,030) 889,080
Less accumulated depreciation for:Land improvements (2,628) (313) (2,941) Buildings, renovations, and
furnishings (188,400) (13,577) (201,977) Fixed equipment (124,727) (4,898) 163 (129,462) Movable equipment (243,963) (14,139) 8,526 (249,576) Leasehold improvements (4,166) (594) (4,760)
Total accumulateddepreciation (563,884) (33,521) 8,689 (588,716)
Total capital assets,net $ 307,259 (6,554) (341) 300,364

HARBORVIEW MEDICAL CENTER (A Component Unit of King County)
(Operated by the University of Washington) Notes to Financial Statements
June 30, 2016 and 2015
31 (Continued)
Balance BalanceJune 30, June 30,
2014 Additions Transfers Retirements 2015Capital assets, not being
depreciated:Land $ 1,586 1,586 Construction in process 14,860 7,440 (9,647) 12,653
Total capital assets,not beingdepreciated 16,446 7,440 (9,647) 14,239
Capital assets, being depreciated:Land improvements 5,519 65 5,584 Buildings, renovations, and
furnishings 407,089 6,501 413,590 Fixed equipment 143,351 542 143,893 Movable equipment 274,538 8,404 2,539 (1,199) 284,282 Leasehold improvements 9,555 9,555
Total capital assets,being depreciated 840,052 8,404 9,647 (1,199) 856,904
Total capital assetsat historical cost 856,498 15,844 (1,199) 871,143
Less accumulated depreciation for:Land improvements (2,312) (316) (2,628) Buildings, renovations, and
furnishings (174,899) (13,501) (188,400) Fixed equipment (119,588) (5,139) (124,727) Movable equipment (224,725) (20,419) 1,181 (243,963) Leasehold improvements (3,615) (551) (4,166)
Total accumulateddepreciation (525,139) (39,926) 1,181 (563,884)
Total capital assets,net $ 331,359 (24,082) (18) 307,259
Capital assets, net, include intangible assets, net of accumulated depreciation of $0.4 million and $0.7 million as of June 30, 2016 and 2015, respectively.
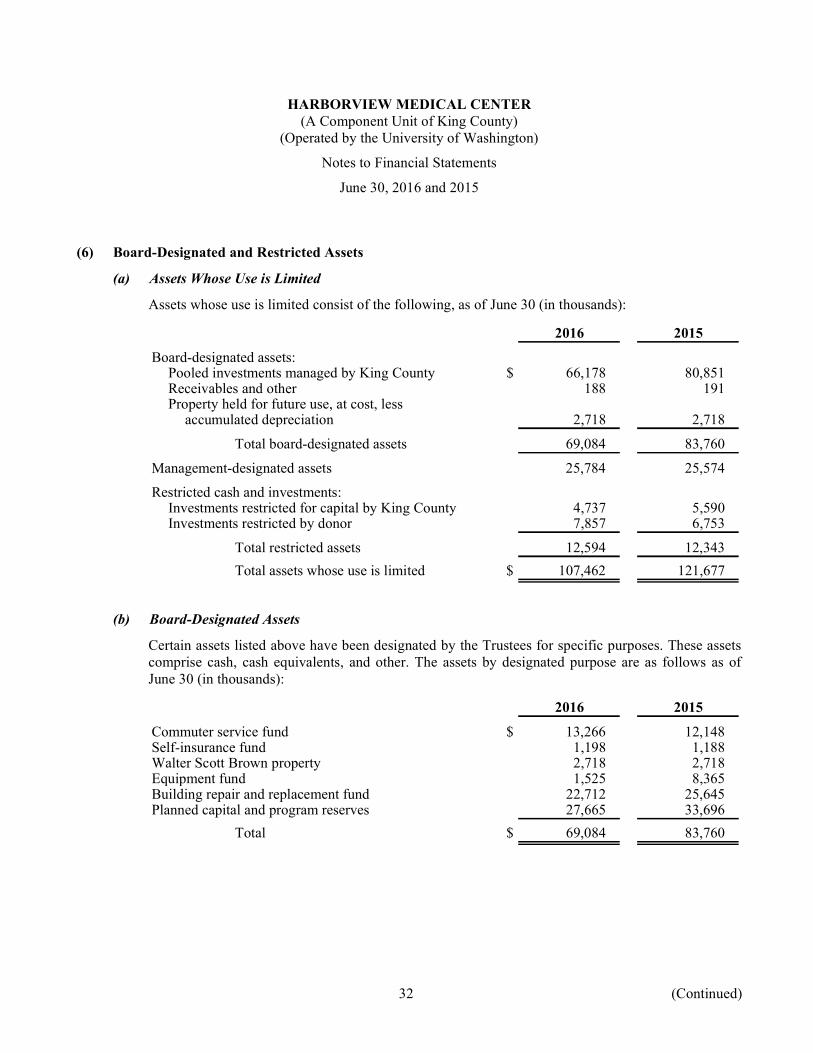
HARBORVIEW MEDICAL CENTER (A Component Unit of King County)
(Operated by the University of Washington) Notes to Financial Statements
June 30, 2016 and 2015
32 (Continued)
(6) Board-Designated and Restricted Assets (a) Assets Whose Use is Limited
Assets whose use is limited consist of the following, as of June 30 (in thousands): 2016 2015
Board-designated assets:Pooled investments managed by King County $ 66,178 80,851 Receivables and other 188 191 Property held for future use, at cost, lessaccumulated depreciation 2,718 2,718 Total board-designated assets 69,084 83,760
Management-designated assets 25,784 25,574 Restricted cash and investments:Investments restricted for capital by King County 4,737 5,590 Investments restricted by donor 7,857 6,753
Total restricted assets 12,594 12,343 Total assets whose use is limited $ 107,462 121,677
(b) Board-Designated Assets
Certain assets listed above have been designated by the Trustees for specific purposes. These assets comprise cash, cash equivalents, and other. The assets by designated purpose are as follows as of June 30 (in thousands):
2016 2015Commuter service fund $ 13,266 12,148 Self-insurance fund 1,198 1,188 Walter Scott Brown property 2,718 2,718 Equipment fund 1,525 8,365 Building repair and replacement fund 22,712 25,645 Planned capital and program reserves 27,665 33,696
Total $ 69,084 83,760

HARBORVIEW MEDICAL CENTER (A Component Unit of King County)
(Operated by the University of Washington) Notes to Financial Statements
June 30, 2016 and 2015
33 (Continued)
(c) Investments Restricted for Capital and by Donor Investments restricted for capital is comprised of investments held in the King County Investment Pool, managed for Harborview by the County and are $4.7 million and $5.6 million for the years ended June 30, 2016 and 2015, respectively. These investments represent unspent bond proceeds, required capital funding, and accumulated interest earnings. Use of these investments is restricted by the County for designated capital projects. Investments restricted by donor represent assets whose use is restricted by grantors or contributors external to Harborview and are $7.9 million and $6.8 million as of June 30, 2016 and 2015, respectively. These investments consist of pooled investment funds of money markets, U.S. agency securities, U.S. agency mortgage-backed securities, U.S. treasury, U.S. municipal, and collateralized mortgaged obligations, and are carried at market value.
(7) Unearned Rent and Other Changes in unearned rent and other during the fiscal years ended June 30, 2016 and 2015 are summarized below (in thousands):
Beginning Ending Due withinbalance Increases Decreases balance one year
Fiscal year ending:June 30, 2016 $ 14,402 (888) 13,514 686 June 30, 2015 15,373 (971) 14,402 704
(8) Risk Management
Harborview is exposed to risk of loss related to professional and general liability, property loss, and injuries to employees. Harborview participates in risk pools managed by the University to mitigate risk of loss related to these exposures. (a) Professional and General Liability
The University s professional liability program currently includes self-insured and commercial reinsurance coverage components. Harborview s annual funding to the professional liability program is determined by the University administration using information from an annual actuarial study. The actuary used a discount rate of 5.5% for both 2016 and 2015 in recognition of the expected earnings of the self-insurance fund and other factors. In addition to the University, the participants in the professional liability program include Harborview, UWP, CUMG, UWNC, School of Dentistry, Airlift, Northwest Hospital, and UW Medical Center. The various participants in the program contribute to the self-insurance fund and share in the expenses of the Health Sciences Risk Management Office.

HARBORVIEW MEDICAL CENTER (A Component Unit of King County)
(Operated by the University of Washington) Notes to Financial Statements
June 30, 2016 and 2015
34 (Continued)
Harborview s contribution to the professional liability program was $3.4 million in 2016 and 2015, recorded in supplies and other expense on the statements of revenues, expenses, and changes in net position.
(9) Benefit Costs Harborview personnel are employees of the University. Benefit costs are pooled centrally for all University employees. Annually the University reviews total employee benefit costs and prepares standard benefit load rates by employment classification. These benefit costs cover employee healthcare costs, workers compensation, employment taxes, and retirement plans. Departments, divisions, agencies, component units, and affiliated parties of the University that have University employees qualifying for employee benefit coverage are charged a cost allocation using the determined benefit load rate and budgeted salary dollars by employment classification. All funding of obligations are on a pay-as-you-go basis. At the end of the reporting period, the cost allocation is compared to actual benefit costs and differences between actual and budgeted costs are included as a component of the benefit load rates charged in the following year. Retirement and Other Postretirement Benefit Plans All employees of the University participate in the following state and University sponsored retirement and other postretirement benefit plans:
Washington Public Employees Retirement System (PERS) PERS is a cost sharing, multiple-employer, defined-benefit pension plan administered by the state of Washington Department of Retirement Systems. There are three separate plans covered under PERS. PERS Plan 1 provides retirement and disability benefits and minimum benefit increases beginning at age 66 to eligible nonacademic plan members hired prior to October 1, 1977. PERS Plans 2 and 3 provide retirement and disability benefits and a cost-of-living allowance to eligible nonacademic plan members hired on or after October 1, 1977. In addition, PERS Plan 3 has a defined-contribution component, which is fully funded by employee contributions. The authority to establish and amend benefit provisions resides with the legislature. The Department of Retirement Systems issues a publicly available financial report that includes financial statements and required supplementary information for PERS. The report may be obtained by writing to the Department of Retirement Systems, P.O. Box 48380, Olympia, WA 98504-8380, or visiting http://www.drs.wa.gov/administration/. The Office of the State Actuary, using funding methods prescribed by statute, determines actuarially required contribution rates for PERS. Funding obligations are measured at the University level and the University allocates expense to departments, divisions, agencies, and component units through the benefit load. Based on the University s benefit load apportionment, Harborview incurred and paid $28.9 million and $25.7 million in fiscal years 2016 and 2015, respectively, related to annual PERS funding, which is recorded in employee benefits on the statements of revenues, expenses, and changes in net position.

HARBORVIEW MEDICAL CENTER (A Component Unit of King County)
(Operated by the University of Washington) Notes to Financial Statements
June 30, 2016 and 2015
35 (Continued)
University of Washington Retirement Plan (UWRP) UWRP is a defined contribution plan administered by the University. All faculty and professional staff are eligible to participate in the plan. Contributions to UWRP are invested by participants in annuity contracts or mutual fund accounts offered by one or more fund sponsors. Employees have at all times a 100% vested interest in their accumulations. Benefits from fund sponsors are available upon separation or retirement at the member s option. RCW 28B.10.400 et. Seq. assigns the authority to the University of Washington Board of Regents to establish and amend benefit provisions. Funding is determined by employee age and ranges from 5% to 10% of employee salary. Funding obligations are calculated at the University level and the University allocates expense to department, divisions, agencies, and component units through the benefit load. Based on the University s benefit load apportionment, Harborview incurred and paid $4.6 million and $4.7 million in fiscal years 2016 and 2015, respectively, related to annual UWRP funding, which is recorded in employee benefits on the statements of revenues, expenses, and changes in net position.University of Washington Supplemental Retirement Plan (the 401(a) Plan) The 401(a) Plan provides for a supplemental payment component which guarantees a minimum retirement benefit based upon a one-time calculation at each eligible participant s retirement date. The University makes direct payment to qualifying retirees when the retirement benefits provided by UWRP do not meet the benefit goals. The University receives an independent actuarial valuation to determine funding needs for the supplemental payment component of UWRP. The funding obligation is determined at the University level and the University allocates expense to departments, divisions, agencies, and component units through the benefit load. This plan is closed to new participants. Based on the University s benefit load apportionment, Harborview incurred and paid $0.7 million and $0.8 million in fiscal years 2016 and 2015, respectively, related to annual 401(a) Plan funding, which is recorded in employee benefits on the statements of revenues, expenses, and changes in net position. Other Postemployment Benefits (OPEB) All University employees, including medical center employees, are eligible for participation in healthcare and life insurance programs administered by the WSHCA. Harborview retirees may elect coverage through state health and life insurance plans, for which they pay less than the full cost of the benefits based on their age and other demographic factors. The Office of the State Actuary determines total OPEB obligations at the State level using individual state employee data, including age, retirement eligibility, and length of service. Information to support actuarial calculations at the division, department, or component unit level is not available. The State is ultimately responsible for the obligation; therefore, the annual required contribution (ARC) is not recorded at the University or its departments, divisions, agencies, or component units.

HARBORVIEW MEDICAL CENTER (A Component Unit of King County)
(Operated by the University of Washington) Notes to Financial Statements
June 30, 2016 and 2015
36 (Continued)
(10) Related Parties Harborview has engaged in a number of transactions with related parties. When economic benefits are either provided or received by Harborview, these transactions are recorded as operating revenues or expenses, respectively, by Harborview. Harborview records cash transfers between Harborview and related parties that are not the result of economic benefits as nonoperating expenses within the statements of revenues, expenses, and changes in net position. (a) University of Washington
University divisions provide various levels of support to Harborview. The following is a summary of services purchased. UW School of Medicine Harborview purchases a variety of clinical and administrative services from the School. For example, Harborview purchases laboratory services from the School and Harborview pays a portion of residents and faculty salaries for clinical and administrative support at Harborview. Harborview also transfers a portion of its Medicare reimbursement for medical education to the School in support of teaching costs. The amounts paid for these services are shown below (see (d)). UW Medicine Central Budget Costs UW Medicine provides services to Harborview such as executive compensation, advancement, compliance, telemedicine, community relations staffing, medical staff oversight, marketing, and other administrative services related to UW Medicine. The amounts paid by Harborview for these services are shown below (see (d)). UW Physicians Network dba UW Neighborhood Clinics Under an annual agreement between the involved UW Medicine entities, Harborview provided strategic support of approximately 26.6% and 20% of the UWNC s annual operating loss for fiscal years 2016 and 2015, respectively and 20% of capital funding needs. Funding from Harborview to UWNC was $10.7 million and $6.4 million for fiscal years 2016 and 2015, respectively, and is recorded as funding to affiliates in the statements of revenues, expenses, and changes in net position. UW Medicine Shared Services UW Medicine Shared Services comprises a number of functions within the University, established for the purpose of providing scalable administrative and information technology support services for UW Medicine. These functions include UW Medicine IT Services, Revenue Cycle, UW Medicine Finance and Accounting, UW Medicine Supply Chain, UW Medicine Contracting, and UW Consolidated Laundry as well as a number of other functions. The amounts for these transactions are shown below (see (d)).

HARBORVIEW MEDICAL CENTER (A Component Unit of King County)
(Operated by the University of Washington) Notes to Financial Statements
June 30, 2016 and 2015
37 (Continued)
Other Divisions of the University In addition to the divisions and transactions identified above, Harborview purchases information technology services, general and professional liability insurance, printing, accounting, temporary staffing, and other administrative and operational services. The amounts for these transactions are shown below (see (d)).
(b) UW Medicine/Northwest dba Northwest Hospital and Medical Center Harborview provided strategic support to Northwest Hospital for operating purposes. Funding from Harborview to Northwest Hospital was $8.0 million and $8.2 million for the year ended June 30, 2016 and 2015, respectively and is recorded as funding to affiliates in the statements of revenues, expenses, and changes in net position. At June 30, 2015, Harborview had payable to Northwest in the amount of $7.1 million recorded in the statements of net position.
(c) King County The County holds all investment funds on behalf of Harborview. The County also processes all payments to vendors outside of the University divisions. Harborview has agreed to provide space and services on behalf of the County for certain grants and contracts, for which Harborview receives rental income and grant revenue from the County. Additional detail describing Harborview s position within the County is provided in note 1. Under the Hospital Services Agreement, the Harborview Board designates $5.0 million annually from Harborview s revenues and reserves for the support of County programs. The annual allocation may be reduce through joint efforts by UW Medicine and the County to obtain permanent reductions in cost or new sources of revenues to the County. At June 30, 2016, Harborview recorded a nonoperating expense of $5.0 million related to King County mission support on the statements of revenues, expenses, and changes in net position and a payable to King County, which is recorded in accounts payable and accrued expenses in the statements of net position.

HARBORVIEW MEDICAL CENTER (A Component Unit of King County)
(Operated by the University of Washington) Notes to Financial Statements
June 30, 2016 and 2015
38 (Continued)
(d) Summary of Related-Party Transactions for the years ended June 30 (in thousands): Revenue (expense) transactions 2016 2015
Services and supplies purchased from the Universityand its departments and affiliates:UW Medicine Shared Services $ (96,508) (71,274) The School (46,133) (54,390) Central Costs (11,518) (9,888) UW Medical Center (2,507) (2,696) UWP (1,646) (1,156) Other University divisions and departments (11,284) (11,957) Services provided to the University and its departmentsand affiliates:The School 7,754 8,103 UW Medicine Shared Services 4,784 3,215 UW Medical Center 2,275 2,423 UW Neighborhood Clinics 1,059 796 Services provided to King County 960 708
Harborview had net amounts (due to) due from related parties for various transactions, which are included in funds held by the University, patient accounts receivable, other receivables, other current assets, accrued salaries, wages and employee benefits, payable to the University, and long-term debt in the accompanying statements of net position. The net amounts (due to) due from related parties as of June 30, 2016 and 2015 are as follows (in thousands):
Net receivable (payable) 2016 2015The University and its departments and affiliates:The School $ 6,998 1,728 UW Medicine Shared Services (8,841) (6,351) UWP 1,589 1,553 UW Medical Center 1,205 937 Airlift 2,666 2,200 UW Medicine Central Budget (902) (205) Other University divisions and departments (30,041) (26,007) UW Neighborhood Clinics (590) 596 King County (2,868) 1,659 Northwest Hospital 64 (7,090)

HARBORVIEW MEDICAL CENTER (A Component Unit of King County)
(Operated by the University of Washington) Notes to Financial Statements
June 30, 2016 and 2015
39 (Continued)
(11) Commitments and Contingencies (a) Operating Leases
Harborview leases certain medical office space and equipment under operating lease arrangements. Total rental expense in years ended June 30, 2016 and 2015 for all operating leases was $14.4 million and $17.4 million, respectively, which is recorded in supplies and other expenses in the statement of revenues, expenses, and change in net position. The following schedule shows future minimum lease payments by fiscal year as of June 30, 2016 (in thousands):
2017 $ 542 2018 194 2019 47 20202021Thereafter$ 783
(b) Purchase Commitments
Harborview has current commitments at June 30, 2016 of $35.9 million related to various construction projects, and equipment purchases. Harborview intends to use its unrestricted funds for these commitments.
(c) Regulatory Environment The healthcare industry is subject to numerous laws and regulations of federal, state, and local governments. These laws and regulations include, but are not limited to, matters such as licensure, accreditation, governmental healthcare program participation requirements, reimbursement for patient services, and Medicare and Medicaid fraud and abuse. Government agencies are actively conducting investigations concerning possible violations of fraud and abuse statutes and regulations by healthcare providers. Violations of these laws and regulations could result in expulsion from government healthcare programs, together with the imposition of significant fines and penalties, as well as significant repayments for patient services previously billed. Management believes that Harborview is in compliance with the fraud and abuse regulations as well as other applicable government laws and regulations. Compliance with such laws and regulations can be subject to future government review and interpretation as well as regulatory actions known or unasserted at this time.
(d) Litigation Harborview is involved in litigation arising in the normal course of business. After consultation with legal counsel, management estimates that these matters will be resolved without material adverse effect to Harborview s future financial position or results of operations.

HARBORVIEW MEDICAL CENTER (A Component Unit of King County)
(Operated by the University of Washington) Notes to Financial Statements
June 30, 2016 and 2015
40
(e) Collective Bargaining Agreements Harborview has a total of approximately 4,401 employees. Of this total, approximately 77.8% and 78.2% are covered by collective bargaining agreements as of June 30, 2016 and 2015, respectively. Nurses are represented by the Service Employees International Union (SEIU) and other healthcare and support workers are represented by the SEIU and Washington Federation of State Employees (WFSE). All collective bargaining agreements expire on June 30, 2017.
(f) Patricia Bracelin Steel Building The Patricia Bracelin Steel building (PSB) is a five-story building containing 156,800 square feet of office space with related parking. The building is primarily occupied by Harborview. Prior to December 2012, the County leased PSB from Broadway Office Properties (BOP) and the lease agreement with BOP provided the County an option to terminate the lease agreement and purchase the building for total outstanding principal on monthly rent payments beginning on or after December 1, 2012. In December 2012, the County exercised its option to purchase the building from BOP. To fund the purchase of the building, the County issued Limited Tax General Obligation (LTGO) debt. The Agreement requires the Trustees to budget funds, annually, to cover the outstanding debt associated with PSB. As the financial obligations of the LTGO debt remain the responsibility of the County, Harborview accounts for these payments as rental expense. Rental expense was approximately $2.8 million for the years ended June 30, 2016 and 2015, respectively.
(g) Ninth and Jefferson Building The Ninth & Jefferson Building is a 14-story medical office building with approximately 440,000 square feet, and underground parking. The building is primarily occupied by Harborview. In 2006, the Trustees passed a resolution in support of the Ninth & Jefferson Building under the 63 20 financing model. The building owner and lessor is Ninth & Jefferson Building Properties; however, the land upon which the building is constructed is owned by the County and leased to Ninth & Jefferson Building Properties under a ground lease. The County has entered into a lease with Ninth & Jefferson Building Properties for the building with a 30-year term. The lease qualifies for capital lease treatment and as such, the building asset and related lease obligation are recorded by the County based upon the terms of the agreement. The Agreement requires the Trustees to budget funds, annually, to cover the monthly rent and outstanding debt associated with the Ninth and Jefferson building. As the financial obligations of the lease and outstanding debt remain the responsibility of the County, Harborview accounts for these rental payments as rental expense. In December 2015, the County refunded a portion of the NJB debt for the purpose of realizing debt service savings which reduced rent payments in 2016. Lease expense was approximately $10.4 million and $12.7 million for the years ended June 30, 2016 and 2015, respectively. If Harborview continues to occupy this space, annual lease expense will not differ significantly from the amount recognized in 2016.

UNIVERSITY OF WASHINGTON HOUSING AND FOOD SERVICES
(A Department of University of Washington) Financial Statements
June 30, 2016 and 2015 (With Independent Auditors Report Thereon)

UNIVERSITY OF WASHINGTON HOUSING AND FOOD SERVICES
(A Department of University of Washington)
Table of Contents
PageIndependent Auditors Report 1 Management s Discussion and Analysis (Unaudited) 3 Financial Statements:
Statements of Net Position 10 Statements of Revenue, Expenses, and Changes in Net Position 11 Statements of Cash Flows 12
Notes to Financial Statements 13 Schedules of Required Supplementary Information (Unaudited) 31

Independent Auditors Report
The Board of Regents University of Washington: We have audited the accompanying financial statements of the University of Washington Housing and Food Services, a department of the University of Washington, as of and for the years ended June 30, 2016 and 2015, and the related notes to the financial statements, as listed in the table of contents. Management s Responsibility for the Financial Statements Management is responsible for the preparation and fair presentation of these financial statements in accordance with U.S. generally accepted accounting principles; this includes the design, implementation, and maintenance of internal control relevant to the preparation and fair presentation of financial statements that are free from material misstatement, whether due to fraud or error. Auditors Responsibility Our responsibility is to express an opinion on these financial statements based on our audits. We conducted our audits in accordance with auditing standards generally accepted in the United States of America. Those standards require that we plan and perform the audit to obtain reasonable assurance about whether the financial statements are free from material misstatement. An audit involves performing procedures to obtain audit evidence about the amounts and disclosures in the financial statements. The procedures selected depend on the auditors judgment, including the assessment of the risks of material misstatement of the financial statements, whether due to fraud or error. In making those risk assessments, the auditor considers internal control relevant to the entity s preparation and fair presentation of the financial statements in order to design audit procedures that are appropriate in the circumstances, but not for the purpose of expressing an opinion on the effectiveness of the entity s internal control. Accordingly, we express no such opinion. An audit also includes evaluating the appropriateness of accounting policies used and the reasonableness of significant accounting estimates made by management, as well as evaluating the overall presentation of the financial statements. We believe that the audit evidence we have obtained is sufficient and appropriate to provide a basis for our audit opinion. Opinion In our opinion, the financial statements referred to above present fairly, in all material respects, the financial position of the University of Washington Housing and Food Services as of June 30, 2016 and 2015, and the changes in its financial position and its cash flows for the years then ended, in accordance with U.S. generally accepted accounting principles. Emphasis of Matters As discussed in note 1, the financial statements present only the University of Washington Housing and Food Services and do not purport to, and do not, present fairly the financial position of the University of Washington, as of June 30, 2016 and 2015, the changes in its financial position or its cash flows for the years then ended in

2
accordance with U.S. generally accepted accounting principles. Our opinion is not modified with respect to this matter. As discussed in note 1, on July 1, 2014, the University of Washington Housing and Food Services adopted new accounting guidance requiring governments providing defined benefit pensions to their employees to recognize
net pension liability or net pension asset, as well as recognizing most changes in the net pension liability within pension expense. Our opinion is not modified with respect to this matter. Other Matter U.S. generally accepted accounting principles require that the management s discussion and analysis on pages 3through 9, and the schedules of required supplementary information on pages 31 and 32, be presented to supplement the basic financial statements. Such information, although not a part of the basic financial statements, is required by the Governmental Accounting Standards Board, who considers it to be an essential part of financial reporting for placing the basic financial statements in an appropriate operational, economic, or historical context. We have applied certain limited procedures to the required supplementary information in accordance with auditing standards generally accepted in the United States of America, which consisted of inquiries of management about the methods of preparing the information and comparing the information for consistency with management s responses to our inquiries, the basic financial statements, and other knowledge we obtained during our audits of the basic financial statements. We do not express an opinion or provide any assurance on the information because the limited procedures do not provide us with sufficient evidence to express an opinion or provide any assurance.
Seattle, Washington October 28, 2016
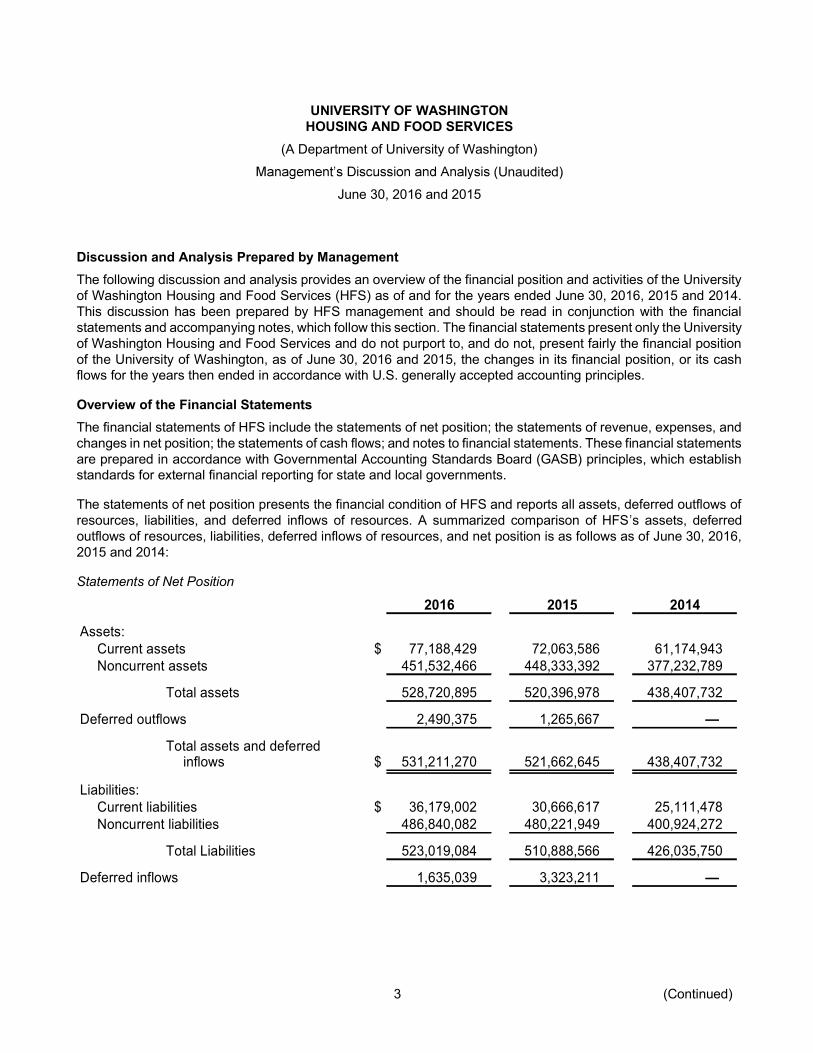
UNIVERSITY OF WASHINGTON HOUSING AND FOOD SERVICES
(A Department of University of Washington) (Unaudited)
June 30, 2016 and 2015
3 (Continued)
Discussion and Analysis Prepared by Management The following discussion and analysis provides an overview of the financial position and activities of the University of Washington Housing and Food Services (HFS) as of and for the years ended June 30, 2016, 2015 and 2014. This discussion has been prepared by HFS management and should be read in conjunction with the financial statements and accompanying notes, which follow this section. The financial statements present only the University of Washington Housing and Food Services and do not purport to, and do not, present fairly the financial position of the University of Washington, as of June 30, 2016 and 2015, the changes in its financial position, or its cash flows for the years then ended in accordance with U.S. generally accepted accounting principles. Overview of the Financial Statements The financial statements of HFS include the statements of net position; the statements of revenue, expenses, and changes in net position; the statements of cash flows; and notes to financial statements. These financial statements are prepared in accordance with Governmental Accounting Standards Board (GASB) principles, which establish standards for external financial reporting for state and local governments. The statements of net position presents the financial condition of HFS and reports all assets, deferred outflows of resources, liabilities, and deferred inflows of resources. A summarized comparison of HFS s assets, deferred outflows of resources, liabilities, deferred inflows of resources, and net position is as follows as of June 30, 2016, 2015 and 2014: Statements of Net Position
2016 2015 2014Assets:
Current assets $ 77,188,429 72,063,586 61,174,943 Noncurrent assets 451,532,466 448,333,392 377,232,789
Total assets 528,720,895 520,396,978 438,407,732 Deferred outflows 2,490,375 1,265,667
Total assets and deferredinflows $ 531,211,270 521,662,645 438,407,732 Liabilities:
Current liabilities $ 36,179,002 30,666,617 25,111,478 Noncurrent liabilities 486,840,082 480,221,949 400,924,272
Total Liabilities 523,019,084 510,888,566 426,035,750 Deferred inflows 1,635,039 3,323,211

UNIVERSITY OF WASHINGTON HOUSING AND FOOD SERVICES
(A Department of University of Washington) (Unaudited)
June 30, 2016 and 2015
4 (Continued)
2016 2015 2014Net position:
Net investment in capital assets $ (31,105,557) (27,484,410) (19,719,120) Unrestricted 37,662,704 34,935,278 32,091,102
Total net position 6,557,147 7,450,868 12,371,982 Total liabilities, deferred inflows
of resources, and net position $ 531,211,270 521,662,645 438,407,732
Current assets consist primarily of cash, accounts receivable, inventory, prepaid expenses, and receivables from other University departments. Current assets were $41.0 million and $41.4 million more than current liabilities at June 30, 2016 and 2015, respectively. Total current assets increased from $72.1 million at June 30, 2015 to a total of $77.2 million at June 30, 2016. The increase was caused by an increase in cash due to an overall increase in residence hall room rents, conference services, and related food services. Current assets increased from $61.2 million at June 30, 2014 to $72.1 million at June 30, 2015 for similar reasons. Noncurrent assets consist of capital assets of land, buildings, building improvements, equipment, construction in process, due from University Transportation Services, and prepayment of the payroll modernization project. Noncurrent assets were $3.2 million more at June 30, 2016, than at June 30, 2015, mainly due to the amount owed by Transportation Services under the Master Plan garage construction agreement. Noncurrent assets were $71.1 million more at June 30, 2015 than at June 30, 2014, mainly due to the construction of additional housing under the Housing Master Plan. Current liabilities consist primarily of accounts payable, accrued interest, accrued expenses, unearned revenue, deposits, due to other University departments, and the current portion of debt payments. Current liabilities increased by 18.0% to a total of $36.2 million at June 30, 2016, from $30.7 million at June 30, 2015, due to increases in due to University departments (Transportation Services), accounts payable and short-term portion of Internal Lending Program (ILP) debt, all related to the overall increase associated with the new residential housing. Current liabilities increased by 22.1% to a total of $30.7 million at June 30, 2015 from $25.1 million at June 30, 2014, due to similar reasons. Noncurrent liabilities consist of the long-term portion of ILP debt and net pension liability. Total long-term debt increased by 0.7% to a total of $476.1 million at June 30, 2016, from $472.6 million at June 30, 2015, and increased $71.7 million from June 30, 2014 to June 30, 2015, due primarily to additional debt incurred to finance the Housing Master Plan (the Master Plan). Net pension liability increased from $7.7 million at June 30, 2015 to $10.8 million at June 30, 2016, and decreased $3.1 million from June 30, 2014 to June 30, 2015, primarily impacted by investment returns in both years. The change in net position or equity measures whether the overall financial condition has improved or deteriorated during the past year. Total net position was lower by 12.0% to a total of $6.6 million at June 30, 2016 and decreased by 39.8% to a total of $7.5 million at June 30, 2015. Although the continued strong demand for campus housing resulted in a positive net operating income, HFS had higher debt interest payments, increased building depreciation and the implementation in 2015 of Governmental Accounting Standards Board

UNIVERSITY OF WASHINGTON HOUSING AND FOOD SERVICES
(A Department of University of Washington) (Unaudited)
June 30, 2016 and 2015
5 (Continued)
(GASB) Statement No. 68, Accounting and Financial Reporting for Pensions, which resulted in the recording of pension liabilities. Statements of Revenue, Expenses, and Changes in Net Position The changes in total net position, as presented on the statements of net position, are detailed in the activity presented in the statements of revenue, expenses, and changes in net position. This statement presents HFS s results of operations. In accordance with GASB reporting principles, revenue and expenses are classified as operating, nonoperating, or other. In general, operating revenue is revenue received for providing housing, food service, and related services to the students and conference guests. Operating revenue is also received in the form of educational sponsorship, and as vending commissions. Operating expenses are those expenses paid to provide the services and resources, mainly salaries and benefits, cost of food, building depreciation, and administrative overhead. Nonoperating revenue is that received for which goods and services were not provided. Under GASB reporting principles, investment income and expenses are classified as nonoperating activities. Also included as nonoperating are energy rebates, salary mitigation from the University, and loss on building disposal under the Master Plan. The following is a condensed view of the statements of revenue, expenses, and changes in net position for the fiscal years ended June 30, 2016, 2015 and 2014:
2016 2015 2014Operating revenue $ 121,375,651 108,966,444 100,298,527 Operating expenses (98,218,640) (87,025,494) (87,285,766)
Net operating income 23,157,011 21,940,950 13,012,761 Net nonoperating expense (21,198,035) (17,089,340) (21,946,780) Capital asset contribution (2,852,697) (2,584,000)
Change in net position (893,721) 4,851,610 (11,518,019) Net position, beginning of year 7,450,868 12,371,982 23,890,001 Effect of accounting and reporting
entity changes (9,772,724) Net position, end of year $ 6,557,147 7,450,868 12,371,982

UNIVERSITY OF WASHINGTON HOUSING AND FOOD SERVICES
(A Department of University of Washington) (Unaudited)
June 30, 2016 and 2015
6 (Continued)
Revenue from all Sources The following table summarizes revenue from all sources for the years ended June 30, 2016, 2015 and 2014:
Revenues from all sources summary2016 2015 2014
Residence halls and single-studentapartment rent $ 62,991,783 56,305,353 52,313,110
Residence halls and retail food services 42,935,073 39,740,009 36,832,222 Conferences and guest rent 6,159,709 4,947,456 3,600,051 Leases 3,587,121 2,621,369 2,813,768 Family housing rent 2,181,081 2,291,191 2,061,616 Forfeitures and miscellaneous fees 1,355,780 1,058,495 789,700 Educational sponsorship 949,000 857,000 806,611 Vending machines 660,162 646,003 625,143 Laundry 431,064 397,967 377,228 Microfridge commission 8,054 7,531 6,693 Energy rebates and refunds 1,009,650 1,729,868 1,472,952 Investment income 1,340,128 1,256,635 1,002,179 Other 116,824 94,070 72,385
$ 123,725,429 111,952,947 102,773,658
The largest revenue source is residence hall and single-student room rent and food services, which comprised 85.6% of total revenue in 2016, versus 85.8% in 2015. Residence hall and single-student rent increased by 11.9%, or $6.7 million, food services increased by 8.0% or $3.2 million, and conference services also increased by 24.5% or $1.2 million over the prior year. The new residential buildings brought in a net increase of 400 beds from prior year at a higher room rate. The number of conference groups on campus continued to grow. In 2015, residence hall and single-student rent increased by 7.6%, or $4.0 million and conference services increased by 37.4% or $1.3 million over the prior year. Aside from a 3.6% rent increase, the new residential buildings brought in a net increase of 207 bends from prior year. Similar to 2016, conference groups coming to campus continued to grow. Nonoperating revenue decreased in 2016, as energy rebates and refunds decreased by 41.6% due to a one-time soil remediation reimbursement received in fiscal year 2015 from Exxon offset slightly by a transfer for minimum wage mitigation from the University. Nonoperating revenue increased in 2015, primarily due to a 25.4% increase in investment income from increased cash and a 17.4% increase in energy rebates and refunds from the one-time soil remediation reimbursement received from Exxon.

UNIVERSITY OF WASHINGTON HOUSING AND FOOD SERVICES
(A Department of University of Washington) (Unaudited)
June 30, 2016 and 2015
7 (Continued)
Expenses and Expense Transfers The following table summarizes expenses and expense transfers for the years ended June 30, 2016, 2015 and 2014:
Expenses and expense transfers summary2016 2015 2014
Salaries and related benefits $ 29,916,642 25,704,043 24,274,588 Depreciation 20,103,177 16,137,829 16,074,790 Cost of food and merchandise 16,583,415 15,633,022 14,362,105 Indirect expenses 6,939,511 6,416,787 6,407,093 Utilities 6,998,727 6,474,086 6,587,079 Non capitalized equipment 5,316,676 5,061,325 8,500,845 Contract services 5,037,449 4,617,115 4,004,652 Supplies 3,126,689 2,938,944 2,921,768 Repairs and maintenance 2,645,639 2,345,640 2,454,095 Institutional overhead 1,338,635 1,351,618 1,349,043 Interest expense on capital asset-related debt 21,693,412 19,276,208 16,761,966 Loss on capital asset disposals and transfers 1,095,711 3,176 6,512,296 Financing cost 758,690 796,459 1,147,649 Capital asset contribution to other
University department 2,852,697 2,584,000 Other 212,080 345,085 349,708
Total expenses and expensetransfers $ 124,619,150 107,101,337 114,291,677
Salaries and benefits expense increased by 16.4%, or $4.2 million over the prior year mainly due to labor rate increases and to expanded housing and food operation with Maple and Terry halls for a full academic year in fiscal year 2016. Student and hourly staff minimum wage also increased from $10.10 to $11.00 per hour effective April 1, 2015 and another increase to $13.00 per hour on January 1, 2016. In 2015, salaries and benefits expense increased by $5.9%, or $1.4 million, over the prior year due mainly to rate increases and to increased housing and food operation with Lander Hall and Local Point food service operation for a full year in fiscal 2015. Cost of food and merchandise increased by 6.1%, or $1.0 million, over the prior year in relation to an increase in residence hall and retail food services revenue of a comparable 8.0%. Cost of food was 38.6% of total food service revenue for fiscal year 2016 and 39.3% for fiscal year 2015. In 2015, cost of food and merchandise increased by 8.8%, or $1.3 million, over the prior year due to an increase in residence hall and retail food services revenue of a comparable 7.9%. Nonoperating expenses increased in 2016 primarily due to a 12.5%, or $2.4 million, increase in interest expense as a result of increased debt service payments and a loss on disposal of the McCarty residence hall demolished under the Master plan of $1.1 million. Nonoperating expenses decreased in 2015 primarily due to the fact that there were no disposals of capital assets in 2015 as there were in 2014, which attributed to a decreased of

UNIVERSITY OF WASHINGTON HOUSING AND FOOD SERVICES
(A Department of University of Washington) (Unaudited)
June 30, 2016 and 2015
8 (Continued)
$6.5 million. This decrease was partially offset by a 15%, or $2.5 million, increase in interest expense due to increased debt service payments. Economic Factors and Significant Events System Wide Considerations Effective January 1, 2016, the University of Washington increased the minimum wage for hourly students and staff from $11.00 to $13.00. This increase was required per the City of Seattle s $15.00 minimum wage requirement phase-in timeline. Wages will be further increased to $15.00 per hour effective, January 1, 2017. Due to the timing of the University s decision to comply with the City s minimum wage requirements, HFS was not able to include the anticipated wage increase in the 2015-16 housing rate calculation. In an effort to bridge the increase in the cost of labor, the Provost has provided HFS with bridge funding totaling $538,177 for 2015-16. Housing Operation Autumn quarter 2016 will open at 111.0% occupancy of as-built capacity including 762 in expanded capacity spaces and approximately 79 students in temporary lounge space. There are 78 students projected to be on the wait list. Privately managed off-campus facilities coordinated through UW Real Estate are showing similar strength in demand. Updates to the Housing Master Plan HFS developed a Housing Master Plan to develop residence halls and single-student apartments in four phases. The development of these residence halls creates a richer on-campus community, alleviating the currently overcrowded conditions within student housing, and provide additional bed capacity (surge space) to support replacement of existing residence halls. This additional capacity permits HFS to replace existing facilities while continuing to meet current housing demand. As of June 30, 2016 and 2015, costs incurred related to the Housing Master Plan are approximately $464.0 million and $434.0 million, respectively. These costs were recorded in construction in process and completed building costs at June 30, 2016 and 2015. Total projected cost of the Housing Master Plan is $730.0 million, which will mainly be funded by borrowing under the ILP (see note 5). The Board of Regents has approved borrowing under the ILP of up to $761.0 million for all the four phases of the Housing Master Plan as of June 30, 2016. Phase 1, which consisted of four new buildings, was completed as of September 2012. Phase 2, which consisted of two properties, was completed in January 2014. Phase 3, which consisted of two halls, Maple and new Terry, was completed in July 2015 and opened to students the following autumn quarter. The completion of Phase 3 marks the end of the west campus development phase of the Housing Master Plan. As a result of this phase, net bed space has increased by approximately 400. The final phase of the Housing Master Plan will take place on north campus and be divided into two parts Phase 4a and 4b. Phase 4a was approved by the Board of Regents in January 2016 with a total project budget of $240.0 million. This phase includes the demolition of McCarty Hall and the development of three new halls,

UNIVERSITY OF WASHINGTON HOUSING AND FOOD SERVICES
(A Department of University of Washington) (Unaudited)
June 30, 2016 and 2015
9
Madrona, Willow and new McCarty, surrounding Denny Field. The halls are planned to open to students in Autumn of 2018 with system net bed space increasing by approximately 1,050. Phase 4b is currently in the early planning stages. The site, architect, and $10.0 million pre-construction budget was approved by the Board of Regents in July 2016. This phase will include the demolition of Haggett Hall as well as the construction of two new halls, Oak and new Haggett. It is planned that these halls will open to students in Autumn 2019 and Autumn 2020, increasing system net beds by 300. Debt service is being paid to the ILP for all Phase 1, 2 and 3 buildings. Debt service on Phase 4a is scheduled to begin in October 2018. The debt service ratio for fiscal year 2016 is 1.48. In July 2015, Treasury announced that it would be refinancing all non-ILP debt with interest rates above 4.75% into the ILP program, effective November 2015 resulting in $158,000 savings. Debt service for Phase 3 began in Autumn 2015. Residence Hall Dining Operation Local Point dining hall operated at full student capacity in 2015-16, exceeding their prior year revenue total by $1.2 million. This is due to the completion of Phase 3 of the Housing Master Plan which brought 1,100 additional students to west campus. The impact of closing McCarty Hall and removing 700 beds from north campus did not have the severe financial impact that was anticipated. Creative promotions by UW Dining kept students engaged in the dining program throughout the year. Due to increasing labor costs associated with minimum wage, residential food unit net operating income contributions are $600,000 less than prior year. Retail & Remote Dining Operation The first Starbucks Licensed Store under the University sponsorship agreement is located in the Husky Union Building (HUB) and opened in Autumn 2015. Suzzallo Library in Red Square, current home of Suzzallo Espresso & Market will be the site of the second Starbucks Licensed Store which is tentatively scheduled to open in Autumn 2017. Construction is scheduled to begin in late spring 2017. The addition of the Licensed Store in the HUB required an initial capital outlay of $432,300 in fiscal year 2014-15 and $427,200 in fiscal year 2015-16. The Suzzallo location is estimated to cost $2.5 million. Over the course of the ten year sponsorship agreement, the University will be opening an additional three Licensed Stores across the UW system. HFS received Starbucks and Coca-Cola sponsorship funds totaling $949,000 in fiscal year 2015-16. Due to increasing labor costs associated with minimum wage, retail and remote food unit net operating income contributions were $314,000 less than prior year.
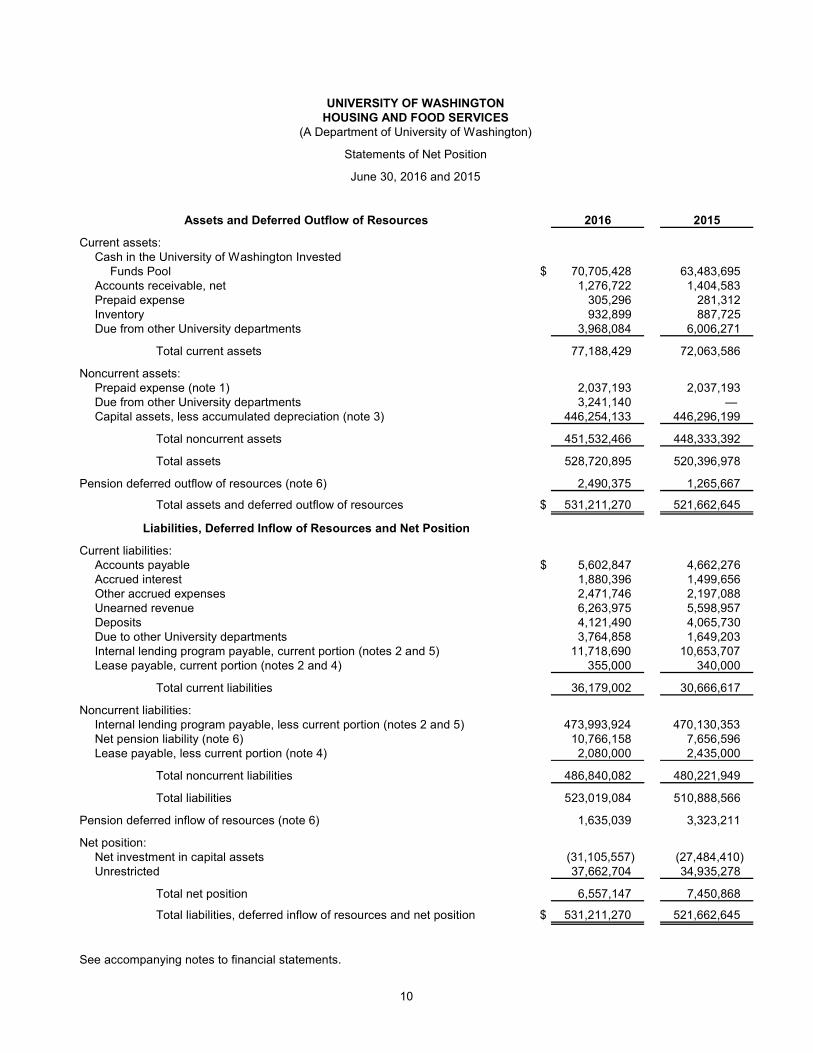
10
UNIVERSITY OF WASHINGTONHOUSING AND FOOD SERVICES
(A Department of University of Washington)Statements of Net PositionJune 30, 2016 and 2015
Assets and Deferred Outflow of Resources 2016 2015Current assets:
Cash in the University of Washington InvestedFunds Pool $ 70,705,428 63,483,695
Accounts receivable, net 1,276,722 1,404,583Prepaid expense 305,296 281,312Inventory 932,899 887,725Due from other University departments 3,968,084 6,006,271
Total current assets 77,188,429 72,063,586Noncurrent assets:
Prepaid expense (note 1) 2,037,193 2,037,193Due from other University departments 3,241,140 —Capital assets, less accumulated depreciation (note 3) 446,254,133 446,296,199
Total noncurrent assets 451,532,466 448,333,392Total assets 528,720,895 520,396,978
Pension deferred outflow of resources (note 6) 2,490,375 1,265,667Total assets and deferred outflow of resources $ 531,211,270 521,662,645
Liabilities, Deferred Inflow of Resources and Net PositionCurrent liabilities:
Accounts payable $ 5,602,847 4,662,276Accrued interest 1,880,396 1,499,656Other accrued expenses 2,471,746 2,197,088Unearned revenue 6,263,975 5,598,957Deposits 4,121,490 4,065,730Due to other University departments 3,764,858 1,649,203Internal lending program payable, current portion (notes 2 and 5) 11,718,690 10,653,707Lease payable, current portion (notes 2 and 4) 355,000 340,000
Total current liabilities 36,179,002 30,666,617Noncurrent liabilities:
Internal lending program payable, less current portion (notes 2 and 5) 473,993,924 470,130,353Net pension liability (note 6) 10,766,158 7,656,596Lease payable, less current portion (note 4) 2,080,000 2,435,000
Total noncurrent liabilities 486,840,082 480,221,949Total liabilities 523,019,084 510,888,566
Pension deferred inflow of resources (note 6) 1,635,039 3,323,211Net position:
Net investment in capital assets (31,105,557) (27,484,410) Unrestricted 37,662,704 34,935,278
Total net position 6,557,147 7,450,868Total liabilities, deferred inflow of resources and net position $ 531,211,270 521,662,645
See accompanying notes to financial statements.
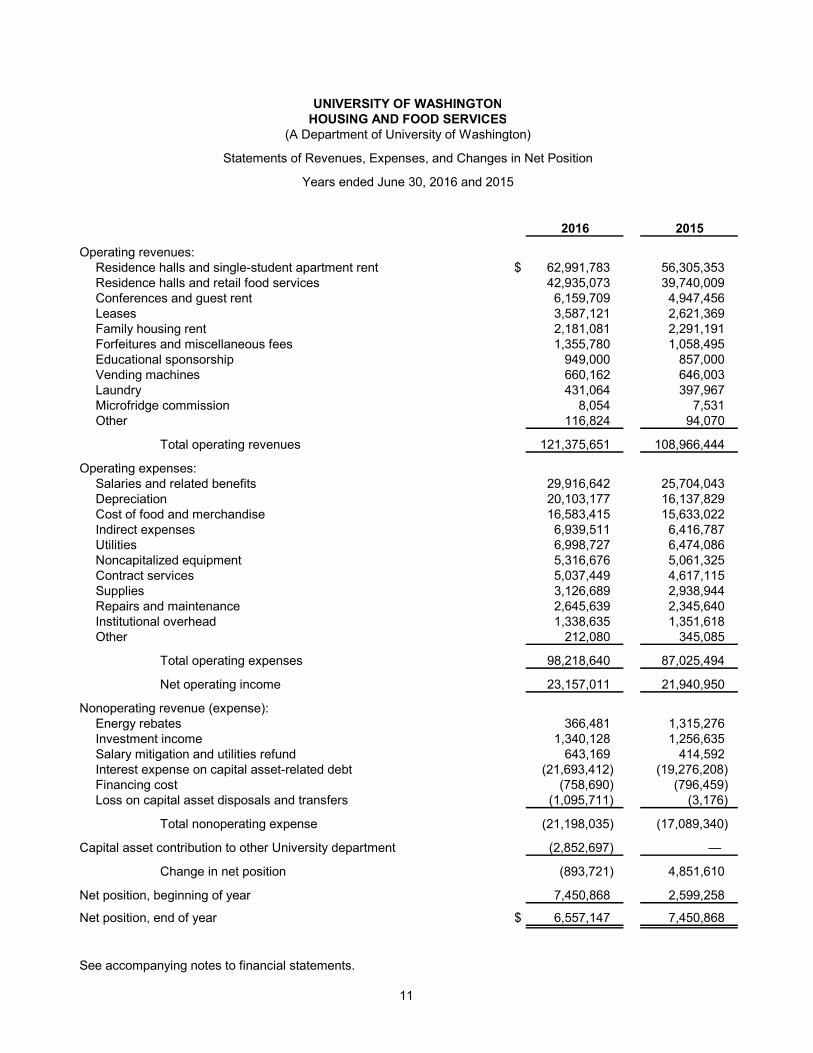
11
UNIVERSITY OF WASHINGTONHOUSING AND FOOD SERVICES
(A Department of University of Washington)Statements of Revenues, Expenses, and Changes in Net Position
Years ended June 30, 2016 and 2015
2016 2015Operating revenues:
Residence halls and single-student apartment rent $ 62,991,783 56,305,353Residence halls and retail food services 42,935,073 39,740,009Conferences and guest rent 6,159,709 4,947,456Leases 3,587,121 2,621,369Family housing rent 2,181,081 2,291,191Forfeitures and miscellaneous fees 1,355,780 1,058,495Educational sponsorship 949,000 857,000Vending machines 660,162 646,003Laundry 431,064 397,967Microfridge commission 8,054 7,531Other 116,824 94,070
Total operating revenues 121,375,651 108,966,444Operating expenses:
Salaries and related benefits 29,916,642 25,704,043Depreciation 20,103,177 16,137,829Cost of food and merchandise 16,583,415 15,633,022Indirect expenses 6,939,511 6,416,787Utilities 6,998,727 6,474,086Noncapitalized equipment 5,316,676 5,061,325Contract services 5,037,449 4,617,115Supplies 3,126,689 2,938,944Repairs and maintenance 2,645,639 2,345,640Institutional overhead 1,338,635 1,351,618Other 212,080 345,085
Total operating expenses 98,218,640 87,025,494Net operating income 23,157,011 21,940,950
Nonoperating revenue (expense):Energy rebates 366,481 1,315,276Investment income 1,340,128 1,256,635Salary mitigation and utilities refund 643,169 414,592Interest expense on capital asset-related debt (21,693,412) (19,276,208) Financing cost (758,690) (796,459) Loss on capital asset disposals and transfers (1,095,711) (3,176)
Total nonoperating expense (21,198,035) (17,089,340) Capital asset contribution to other University department (2,852,697) —
Change in net position (893,721) 4,851,610Net position, beginning of year 7,450,868 2,599,258Net position, end of year $ 6,557,147 7,450,868
See accompanying notes to financial statements.

12
UNIVERSITY OF WASHINGTONHOUSING AND FOOD SERVICES
(A Department of University of Washington)Statement of Cash Flows
Year ended June 30, 2016 and 2015
2016 2015Cash flows from operating activities:
Cash received from student housing fees $ 63,378,796 56,996,958Cash received from residence hall food services 42,842,215 39,813,608Cash received from conference services 6,877,797 4,907,056Cash received from leases 2,621,369 2,639,851Cash received from facility rentals 1,103,803 2,202,637Cash received from vending commissions 661,483 648,710Cash received from educational sponsorship 949,000 857,000Cash received from others 111,183 93,654Cash received for interfund and debit card activities 87,200 119,580Cash paid to suppliers (40,030,656) (38,425,353) Cash paid for employee salaries, wages, and benefits (26,987,298) (24,435,013) Cash paid for indirect expenses (8,377,020) (7,716,572)
Net cash flows provided by operating activities 43,237,872 37,702,116Cash flows from capital and related financing activities:
Purchases of capital assets (18,755,732) (79,604,170) Borrowing on internal lending program 15,593,975 82,839,526Interest paid on capital debt (22,498,129) (22,597,474) Principal payments on capital debt (10,937,691) (8,379,662) Financing cost paid on capital debt (758,690) (796,459)
Net cash flows used in capital and related financing activities (37,356,267) (28,538,239) Cash flow from investing activity:
Interest received 1,340,128 1,274,719Net change in cash and cash equivalents 7,221,733 10,438,596
Cash and cash equivalents, beginning of year 63,483,695 53,045,099Cash and cash equivalents, end of year $ 70,705,428 63,483,695Reconciliation of operating income to net cash flows from operating activities:
Operating income $ 23,157,011 21,940,950Adjustments to reconcile operating income to net cash flows provided by
operating activities:Depreciation 20,103,177 16,137,829Change in operating assets and liabilities:
Accounts receivable 127,861 (133,211) Prepaid expenses and other (23,984) (2,051,012) Inventory (45,174) 90,363Due to/from other University departments 134,917 (368,618) Accounts payable (1,408,054) 1,620,879Unearned revenue 665,018 321,945Accrued expenses 274,658 58,010Deposits 55,760 143,565Pension deferred resources and liability 196,682 (58,584)
Net cash flows provided by operating activities $ 43,237,872 37,702,116Supplemental disclosures for cash flow information:
Capitalized interest $ 1,117,624 3,373,960Amortization of deferred premium on refunded bonds 66,480 66,480Capital asset contribution to other University department 2,852,697 — Loss on disposal of capital asset 1,046,518 — Capital assets in accounts payable and due to other University departments 4,981,867 —
See accompanying notes to financial statements.

UNIVERSITY OF WASHINGTON HOUSING AND FOOD SERVICES
(A Department of University of Washington) Notes to Financial Statements
June 30, 2016 and 2015
13 (Continued)
(1) Organization and Significant Accounting Policies (a) Organization
The University of Washington Housing and Food Services (HFS) operates food services, residence halls, and apartment complexes both on and off the University of Washington (the University) campus. The operations of HFS as an auxiliary enterprise support the University s mission by providing safe, convenient, and affordable housing as well as programs that promote personal and academic development. In addition, HFS provides conference facilities and catering services to a variety of organizations. The University provides some administrative services to HFS.
(b) Basis of Accounting The financial statements have been prepared in accordance with generally accepted accounting principles. The statements are presented using the economic resources measurement focus and the accrual basis of accounting. Under the accrual basis, revenue is recognized when earned, and expenses are recorded when an obligation has been incurred. All internal activities have been eliminated. The financial statements present only the University of Washington Housing and Food Services and do not purport to, and do not, present fairly the financial position of the University of Washington, as of June 30, 2016 and 2015, the changes in its financial position, or its cash flows for the years then ended in accordance with U.S. generally accepted accounting principles. On July 1, 2014, HFS adopted GASB Statement No. 68, Accounting and Financial Reporting for Pensions. This Statement requires governments providing defined-benefit pensions to their employees to recognize their long-term obligation for pension benefits as a liability for the first time, along with the associated assets, which have been set aside to fund the plan. Since the University participates in several cost sharing pension plans, which are administered by the State of Washington Department of Retirement Systems (DRS), this Statement requires the University to recognize its proportionate share of the state-wide net pension liability for each of the plans in which it participates. HFS recorded their proportionate share of the net pension liability in its 2016 and 2015 financial statements, which had a material impact to its financial statements. The Statement also eliminates the method of amortizing the liability balances over several years, and instead requires full recognition of the net liability upon implementation. In addition to the reporting changes described above, implementation of this Statement resulted in the restatement of fiscal year 2015 beginning unrestricted net position, reducing it by $9,772,724. See note 6 for further discussion on the adoption of this standard. With the adoption of GASB Statement No. 68, net position was restated at July 1, 2014. Below is a reconciliation of total net position as previously reported at June 30, 2014, to the restated net position:
Net position at June 30, 2014, aspreviously reported $ 12,371,982
Adoption of GASB No. 68 (9,772,724) Net position at July 1, 2014, as restated $ 2,599,258

UNIVERSITY OF WASHINGTON HOUSING AND FOOD SERVICES
(A Department of University of Washington) Notes to Financial Statements
June 30, 2016 and 2015
14 (Continued)
(c) Cash in the University Invested Funds Pool Pooled Investments held on behalf of HFS by the University of Washington are recorded at HFS s share of the carrying value of the University of Washington Cash and Liquidity Pools. These funds are available on demand without prior notice or penalty. The Cash and Liquidity Pools were invested as follows at June 30:
2016 2015Cash and cash equivalents 6.4% 10.0%Treasuries and agencies 73.0 67.0Mortgage related securities 8.6 9.0Asset-backed debt securities 7.0 12.0Corporate and other fixed income 5.0 2.0
Total 100.0% 100.0%
Financial instruments that subject HFS to concentrations of credit risk consist of pooled investments held on behalf of HFS at the University of Washington.
(d) Accounts Receivable HFS has established an allowance for doubtful accounts to allow for those receivables, which are estimated to be uncollectible. The allowance is based on historical collection rates. Student accounts are considered past due if they are unpaid for 30 days after the due date. Other customer accounts are considered past due if they are unpaid for 60 days after the due date. When an account is deemed uncollectible, it is generally written off against the allowance. The balance of the allowance account was $60,327 and $67,640 at June 30, 2016 and 2015, respectively.
(e) Inventory Inventory, consisting primarily of food, is stated at the lower of cost (first-in, first-out method) or market.
(f) Prepaid Expense Prepaid expense, current, consists primarily of building insurance amortized over one year. Prepaid expense, noncurrent, represents implementation cost for the Human Resource and Payroll modernization project to be allocated to campus beginning July 1, 2017 that was prepaid by HFS to avail itself of the reduced cost versus incurring interest if paid over the long-term period.
(g) Due From Other University Departments Due from other University departments, current, consist mainly of lease revenue (see note 4) of $3,587,121 and $2,621,369 accrued as of fiscal year 2016 and 2015 respectively. An amount related to construction rebates and funds held by other University department of $2,530,862 in fiscal year 2015 was all used to fund construction in fiscal year 2016.

UNIVERSITY OF WASHINGTON HOUSING AND FOOD SERVICES
(A Department of University of Washington) Notes to Financial Statements
June 30, 2016 and 2015
15 (Continued)
Due from other University department, noncurrent, resulted from an agreement with the University Transportation Services to build extra parking stalls at the Terry/Maple Hall to be liquidated in year 2020 under the Master Plan for north campus housing. The amount owed by Transportation Services is $3,241,140 for fiscal year 2016.
(h) Capital Assets Buildings, building improvements, and equipment are stated at cost. Additions, replacements, major repairs, and renovations are capitalized. Depreciation is computed using the straight-line method over the estimated useful lives of the assets, generally 10 to 50 years for building components, 20 to 50 years for infrastructure and land improvements, and 4 to 13 years for equipment. Expenditures for noncapitalized equipment and repairs that represent normal replacement of such equipment and routine maintenance of the buildings are expensed as incurred, as are furniture, fixtures, or equipment for newly constructed buildings that individually do not meet the criteria described below. Building and improvements are capitalized if they result in additional asset services (i.e., expanded facilities), result in more valuable asset services (i.e., upgraded facilities), or extend normal service life. Expenditures are not capitalized if they are incurred to maintain assets in good operating condition, and/or do not meet the criteria for capitalization stated above. Equipment with a cost of $2,000 and above is generally capitalized if it benefits more than one operating cycle. Interest expense is capitalized during the time a project is under construction and begins upon the issuance of debt to finance the construction of a capital asset. Capitalized construction-related interest was $1.1 million and $3.4 million during 2016 and 2015, respectively.
(i) Unearned Revenue Unearned revenue consists of prepaid food sales, room rent, and conference revenue.
(j) Deposits Deposits consist of a required $500 per student housing damage deposit that is refundable when the student vacates (presuming no damage resulted during the student s tenure in the housing unit).
(k) Net Position Net position consists of the following components: Net investment in capital assets This component consists of capital assets, net of accumulated depreciation, reduced by the net outstanding debt balances related to capital assets, net of unamortized debt expenses. The negative balance at June 30, 2016 and 2015 is due to the inclusion of existing debt on the old Mercer, Lander, Terry and McCarty Halls, all of which were demolished as of fiscal year 2016 and prior years, while additional debt was incurred for the demolition and redevelopment. Unrestricted This component consists of assets and liabilities that do not meet the definition of net investment in capital assets.

UNIVERSITY OF WASHINGTON HOUSING AND FOOD SERVICES
(A Department of University of Washington) Notes to Financial Statements
June 30, 2016 and 2015
16 (Continued)
(l) Operating and Nonoperating Revenue and Expenses In general, operating revenue is revenue received for providing housing, dining, and related services to the customers of HFS, the majority of which consists of room and board services to students. Revenue is recognized as the food service is provided, the appropriate rental period occurs, or the conference takes place. Operating expenses are those expenses paid to provide the services and resources, mainly consisting of the cost of food, salaries and benefits, utilities, building maintenance, and administrative overhead expenses. Nonoperating revenue is recognized for receipts under the energy rebate program applied from the Master Plan constructions as well as investment income and other revenue sources that are not associated with HFS s primary operations. Nonoperating expense includes interest expense, loss on disposal of building asset, and financing cost incurred in borrowing for the construction of buildings under the Master Plan.
(m) Institutional Overhead The University allocates certain general and administrative charges to those departments for which services are performed. This institutional overhead charge, which is based on a percent of division revenue, amounted to $1,338,635 and $1,351,618 during the years ended June 30, 2016 and 2015, respectively.
(n) Indirect Expenses Administrative expenses such as salaries and benefits, contract services, and supplies are reported as indirect expense. These allocations to HFS amounted to $6,939,511 and $6,416,787 for the years ended June 30, 2016 and 2015, respectively.
(o) Capital Asset Contribution to Other University Department During fiscal year 2016, HFS made a capital asset contribution by transferring a parking garage located in Terry/Maple Hall to Transportation Services as mitigation for the lost parking lots for the new construction. The net book value of the capital asset contribution amounted to $2,852,697.
(p) Income Taxes As a part of the University, the operations of HFS are exempt from federal income taxes, except to the extent of unrelated business income. HFS did not incur unrelated business income tax during 2016 and 2015, and accordingly, the financial statements do not include a provision for federal income taxes.
(q) Use of Estimates The preparation of financial statements in conformity with accounting principles generally accepted in the United States requires management to make estimates and assumptions that affect the reported amounts of assets and liabilities and disclosure of contingent assets and liabilities at the date of the financial statements and the reported amounts of revenue and expenses during the reporting period. Actual results could differ from those estimates.

UNIVERSITY OF WASHINGTON HOUSING AND FOOD SERVICES
(A Department of University of Washington) Notes to Financial Statements
June 30, 2016 and 2015
17 (Continued)
(2) Noncurrent Liabilities Noncurrent liability activity for the years ended June 30, 2016 and 2015 is summarized as follows:
Balance at Balance at Balance atJune 30, 2014 Additions Reductions June 30, 2015 Additions Reductions June 30, 2016
Noncurrent liabilities:ILP payable $ 406,066,925 82,839,526 (8,122,391) 480,784,060 15,593,975 (10,665,421) 485,712,614 Net pension liability 10,768,232 (3,111,636) 7,656,596 3,109,562 10,766,158 Lease payable 3,100,000 (325,000) 2,775,000 (340,000) 2,435,000
Total noncurrentliabilities 419,935,157 $ 82,839,526 (11,559,027) 491,215,656 18,703,537 (11,005,421) 498,913,772
Current portion (8,242,653) (10,993,707) (12,073,690) Noncurrent portion $ 411,692,504 480,221,949 486,840,082
(3) Capital Assets Capital asset activity for the years ended June 30, 2016 and 2015 is summarized as follows:
Balance at Additions/ Retirements/ Balance at Additions/ Retirements/ Balance atJune 30, 2014 transfers transfers June 30, 2015 transfers transfers June 30, 2016
Capital assets, not being depreciated:Land $ 6,775,215 6,775,215 6,775,215 Construction in progress 24,872,830 84,690,995 (484,423) 109,079,402 26,412,103 (112,937,048) 22,554,457
Total capital assetsnot beingdepreciated 31,648,045 84,690,995 (484,423) 115,854,617 26,412,103 (112,937,048) 29,329,672
Capital assets, being depreciated:Building and building improvements 419,916,767 484,423 420,401,190 112,937,048 (12,175,088) 521,163,150 Equipment 5,631,108 513,420 (85,171) 6,059,357 838,556 (607,847) 6,290,066
Total capital assetsbeing depreciated 425,547,875 997,843 (85,171) 426,460,547 113,775,604 (12,782,935) 527,453,216
Less accumulated depreciation:Building and building improvements 76,139,825 15,489,260 91,629,085 19,510,173 (5,034,733) 106,104,525 Equipment 3,823,306 648,569 (81,995) 4,389,880 593,004 (558,654) 4,424,230
Total accumulateddepreciation 79,963,131 16,137,829 (81,995) 96,018,965 20,103,177 (5,593,387) 110,528,755
Capital assets, net $ 377,232,789 69,551,009 (487,599) 446,296,199 120,084,530 (120,126,596) 446,254,133

UNIVERSITY OF WASHINGTON HOUSING AND FOOD SERVICES
(A Department of University of Washington) Notes to Financial Statements
June 30, 2016 and 2015
18 (Continued)
(4) Leases Lease Payments In June 2001, the state of Washington, in conjunction with the Washington Finance Officers Association (a nonprofit corporation), issued Certificates of Participation (CoPs) to certain investors. The proceeds from the CoPs were used for improvements to food services at the HUB. The University has agreed to make certain payments (considered lease payments) as required by the CoPs and HFS has agreed to reimburse the University for these payments. At June 30, 2016 and 2015, the total principal amount of obligation under this agreement was $2,435,000 and $2,775,000, respectively. It is expected to be repaid in installments of approximately $480,000 (including imputed interest of approximately 5%) per year through 2022. Following is a summary of minimum payments under this agreement (principal and interest) for the years ending June 30:
Principal Interest Total2017 $ 355,000 126,284 481,284 2018 375,000 108,534 483,534 2019 395,000 89,315 484,315 2020 415,000 68,775 483,775 2021 435,000 46,988 481,988 2022 460,000 24,150 484,150
$ 2,435,000 464,046 2,899,046
Lease Revenue The University and Community Development Properties (CDP), a nonprofit organization, entered into a lease agreement whereby CDP issued bonds to undertake a comprehensive redevelopment of the Commodore Duchess, Radford Court, and Nordheim Court properties, mainly for student housing. In July 2011 and 2012, the University took over the Commodore Duchess, Radford Court, and Nordheim Court properties (the Apartments) and refunded the CDP bonds with loan proceeds from the Internal Lending Program (ILP). In accordance with the ILP financing agreement, HFS will be obligated to pay debt service on this loan only in the event that funds from the Apartments are insufficient. The Apartments have been self-sustaining in past years. The Apartments are owned by the University and are managed by University of Washington Real Estate (UWRE) with an outside property manager. As of June 30, 2016 and 2015, the outstanding debt under this agreement was $59,441,015 and $62,397,460, respectively. The University receives an annual payment from the Apartments, which it designates to HFS. Revenue from these properties was $3,587,121 and $2,621,369 for the years ended June 30, 2016 and 2015, respectively. As of July 1, 2016 Nordheim Court will be restructured to be the direct responsibility of the University of Washington Department of Housing and Foods Services (HFS). This was a mission-based decision made by HFS in order to offer university programs to the residents of Nordheim Court that could not be administered by a third-party property manager.

UNIVERSITY OF WASHINGTON HOUSING AND FOOD SERVICES
(A Department of University of Washington) Notes to Financial Statements
June 30, 2016 and 2015
19 (Continued)
(5) The Internal Lending Program Effective July 1, 2008, the University Board of Regents adopted the amended Debt Management Policy: Statement of Objectives and Policies to provide for the implementation of an ILP. The purpose of the ILP is to lower the University s overall cost of capital and provide internal borrowing units with a stable and predictable borrowing rate. The ILP will make loans to internal borrowers at a uniform internal lending rate. These loans will be funded through the issuance of University General Revenue bonds and notes. ILP program policies include a provision for a rate of stabilization reserve and a provision for rate adjustments, if necessary. On April 22, 2008, the University issued General Revenue Refunding Bonds (2008 Bonds) to refund certain outstanding bonds of the University. A portion of the proceeds from the sale of the 2008 Bonds was used for the purpose of refunding HFS s 1996 junior lien revenue bonds with a premium. HFS is obligated to the ILP in the amount of $12,495,000 and $14,229,167 as of June 30, 2016 and 2015, respectively. The final payment is due in the fiscal year ending 2022. The average interest rate is 3.75%. The balance of the premium was $317,120 and $369,980 as of June 30, 2016 and 2015, respectively. In December 2008, HFS drew funds from the ILP in a total amount of $6,348,067 for the purchase of a piece of property called the Cavalier Apartments for future housing development plans. The final payment is due in the fiscal year ending 2034. The interest rate is 4.75% and adjusted to 4.5% effective July 2016. HFS is obligated to the ILP in the amount of $5,247,390 and $5,434,064 as of June 30, 2016 and 2015, respectively.In October 2010, the University issued General Revenue & Refunding Bonds, 2010A & B. A portion of the proceeds was used to partially refund the 2002 Housing and Dining Revenue & Refunding Bonds with a premium. HFS is obligated to the ILP in the amount of $7,740,746 and $8,118,212 as of June 30, 2016 and 2015, respectively. The final payment is due in the fiscal year ending 2032. The interest rate was adjusted in November 2015 from 5.43% to 4.75% and again adjusted to 4.5% effective July 2016. The balance of the premium was $81,739 and $95,359 as of June 30, 2016 and 2015, respectively. In March 2012, the University issued General Revenue & Refunding Bonds, 2012A & B. A portion of the proceeds was used to fully refund the 2002 and 2004 Housing and Dining Revenue & Refunding Bonds. The amount refunded was $15,595,000 with no gain or loss. HFS is obligated to the ILP in the amount of $10,341,398 and $11,209,943 as of June 30, 2016 and 2015, respectively. The final payments are due in the fiscal years ending 2022 and 2029. The interest rate was adjusted in November 2015 from 5.43% to 4.75% and again adjusted to 4.5% effective July 2016 for the GRB 2012A. The interest rate for GRB 2012B remained at 4.06%. From May 2009 through January 2016, the Board of Regents approved borrowing for HFS under the ILP of up to $760.8 million for three of the four phases of the Housing Master Plan to build residence halls and single student apartments. The total draws to fund the project as of June 30, 2016 and 2015 has amounted to approximately $468 million and $452 million, respectively, and HFS has made principal payments beginning October 2011 for Phases 1 through 3. Principal payments for Phase 4 is projected to begin January 2019. HFS is obligated to the ILP in the amount of $449,489,221 and $441,327,335 as of June 30, 2016 and 2015, respectively. The final payments are due between the fiscal years ending 2042 and 2049. The interest rate is 4.75% and adjusted to 4.5% effective July 2016.

UNIVERSITY OF WASHINGTON HOUSING AND FOOD SERVICES
(A Department of University of Washington) Notes to Financial Statements
June 30, 2016 and 2015
20 (Continued)
The ILP agreements require HFS to maintain certain financial performance ratios. If these requirements were violated, future financing for the ILP can be ceased or minimized. As of June 30, 2016 and 2015, HFS met all these requirements. The following is a summary of future payments (principal and interest) to be paid to the University to cover the debt service payments for the years ending June 30. This reflects the adjusted rate of 4.5% effective July 2016:
Principal Interest Total2017 $ 11,718,690 21,233,524 32,952,214 2018 12,282,208 20,601,835 32,884,043 2019 12,916,755 20,290,264 33,207,019 2020 13,595,931 19,938,676 33,534,607 2021 14,233,492 19,305,930 33,539,422
68,849,298 87,149,238 155,998,536 80,617,751 70,501,263 151,119,014 93,963,837 50,901,263 144,865,100
115,876,468 27,524,114 143,400,582 61,259,325 4,410,731 65,670,056
485,313,755 $ 341,856,838 827,170,593 Add unamortized premium 398,859
$ 485,712,614
(6) Pension Plan The University offers several contributory pension plans administered by the Washington State Department of Retirement Systems. Housing and Food Services (HFS) has employees in the Public Employee s Retirement System plan, which is a defined-benefit retirement plan. The University of Washington Retirement Plan (UWRP), a defined contribution plan, is administered by the University. The University of Washington Supplemental Retirement Plan, a noncontributory defined benefit pension plan which operates in tandem with the UWRP, is closed to new participants. Plan Descriptions of the DRS Plans Public Employees Retirement System PERS retirement benefit provisions are contained in chapters 41.34 and 41.40 of the Revised Code of Washington (RCW). PERS is a cost-sharing multiple-employer retirement system comprised of three separate pension plans for membership purposes. PERS Plan 1 and PERS Plan 2 are defined benefit plans, and PERS Plan 3 is a defined benefit plan with a defined contribution component. PERS members include higher education employees not participating in other higher education retirement programs.

UNIVERSITY OF WASHINGTON HOUSING AND FOOD SERVICES
(A Department of University of Washington) Notes to Financial Statements
June 30, 2016 and 2015
21 (Continued)
For accounting purposes, PERS is reported as three separate plans. Plan 1 accounts for the defined benefits of Plan 1 members, Plan 2/3 accounts for the defined benefits of Plan 2 and Plan 3 members, and Plan 3 accounts for the defined contribution portion of Plan 3 members. The defined benefit portions of Plan 2 and Plan 3 are accounted for in the same pension trust fund, and all assets of Plan 2/3 may legally be used to pay the defined benefits of any of the Plan 2 or Plan 3 members or beneficiaries. Vesting and Benefits Provided PERS Plan 1 PERS Plan 1 provides retirement, disability and death benefits. The plan is closed to new entrants. All members were vested after the completion of five years of eligible service. Retirement benefits are determined as two percent of the member s average final compensation (AFC) times the member s years of service. The AFC is the average of the member s 24 highest-paid consecutive service months. The retirement benefit may not exceed 60% of the AFC. Members are eligible for retirement from active status at any age with at least 30 years of service, at age 55 with at least 25 years of service, or at age 60 with at least five years of service. Members retiring from inactive status prior to the age of 65 may receive actuarially reduced benefits. Other benefits include duty and nonduty disability payments, an optional cost-of living allowance (COLA), and a one-time duty-related death benefit, if the member is found eligible by the Washington State Department of Labor and Industries. PERS Plan 2/3 PERSPlan 2/3 provides retirement, disability and death benefits. PERS Plan 2 members are vested after completion of five years of eligible service. PERS Plan 3 members are vested in the defined benefit portion of their plan after 10 years of service, or after five years of service if 12 months are earned after age 44. Retirement benefits are determined as two percent of the member s AFC times the member s years of service for Plan 2, and one percent of AFC times the member s years of service for Plan 3. The AFC is the monthly average of the member s 60 highest-paid consecutive service months. There is no cap on years of service credit. Members are eligible for retirement with a full benefit at age 65 with at least five years of service credit. Retirement before age 65 is considered early retirement. Members are eligible for early retirement with a reduced benefit at age 55 with at least 20 years of service credit. The benefit is reduced by a factor that varies according to age, for each year before age 65. Members who are age 55 with at least 30 years of service credit can retire under one of two provisions, if hired prior to May 1, 2013: With a benefit that is reduced by 3% for each year before age 65; or With a benefit that has less, or no, reduction (depending on age) but imposes stricter return-to-work rules
If hired on or after May 1, 2013, members have the option to receive a benefit that is reduced by 5% for each year before age 65.

UNIVERSITY OF WASHINGTON HOUSING AND FOOD SERVICES
(A Department of University of Washington) Notes to Financial Statements
June 30, 2016 and 2015
22 (Continued)
Retirement benefits are actuarially reduced to reflect the choice of a survivor benefit. Other benefits include duty and nonduty disability payments, a cost-of-living allowance (based on the Consumer Price Index) capped at three percent annually, and a one-time duty-related death benefit, if the member is found eligible by the Washington State Department of Labor and Industries. Fiduciary Net Position The pension plans fiduciary net positions have been determined on the same basis as they are reported by the pension plans. DRS financial statements have been prepared in conformity with generally accepted accounting principles (GAAP). The retirement plans are accounted for in pension trust funds using the flow of economic resources measurement focus and the accrual basis of accounting. Member contributions are recognized as revenues in the period in which the contributions are earned. Employer contributions are recognized when due, and the employer has made a formal commitment to provide the contributions. Benefits and refunds are recognized when due, and payable in accordance with the terms of each plan. The RCW (Chapter 43.33 A) authorizes The Washington State Investment Board (WSIB) to have the investment management responsibility for the pension funds. Investments are reported at fair value, and unrealized gains and losses are included as investment income in the Statement of Changes in Fiduciary Net Position presented in the DRS Comprehensive Annual Financial Report. Purchases and sales of investments are recorded on a trade-date basis. DRS publishes an annual report for retirement plans, which is available at: http://www.drs.wa.gov/administration/annualreport/. Actuarial Assumptions Accounting requirements dictate the use of assumptions to best estimate the impact that pension obligations will have on HFS. The professional judgments used in determining these assumptions are important, and can significantly impact the resulting actuarial estimates. Differences between actual results compared to these assumptions could have a significant effect on HFS s financial statements. The total pension liability for each DRS plan was determined by an actuarial valuation, conducted by the eWashington State Office of the State Actuary (OSA). The University's 2016 pension liability is based on an OSA valuation performed as of June 30, 2014, with the results rolled forward to the measurement date of June 30, 2015. Likewise, the University's 2015 pension liability is based on the valuation performed as of June 30, 2013, with the results rolled forward to the measurement date of June 30, 2014. The following actuarial assumptions have been applied to all prior periods included in the measurement: Inflation 3.0% total economic inflation, 3.75% salary inflationSalary increase Expected to grow by promotions and longevity in addition to
salary inflation assumptionInvestment rate of return 7.50%

UNIVERSITY OF WASHINGTON HOUSING AND FOOD SERVICES
(A Department of University of Washington) Notes to Financial Statements
June 30, 2016 and 2015
23 (Continued)
Mortality rates were based on the RP-2000 Combined Healthy Table and Combined Disabled Table published by the Society of Actuaries Retirement Plans Experience Committee (RPEC). And, as recommended by the RCEP, the OSA applied offsets to the base table and recognized future improvements in mortality by projecting the mortality rates using 100% Scale BB. Mortality rates are applied on a generational basis, meaning members are assumed to receive additional mortality improvements in each future year, throughout their lifetimes. The actuarial assumptions used in the June 30, 2014 and 2013 valuations were based on the results of OSA's 2007-2012 Experience Study, which is a comprehensive review and update of prior actuarial assumptions. Additional assumptions for subsequent events and law changes are current as of the 2014 actuarial valuation report. The long-term expected rate of return on pension plan investments was determined by the WSIB using a building block method in which a best estimate of expected future rates of return (expected returns, net of pension plan investment expense, but including inflation) are developed for each major asset class. Those expected returns make up one component of WSIB s Capital Market Assumptions (CMAs). WSIB uses the CMAs and their target asset allocation to simulate future investment returns over various time horizons. The long-term expected rate of return of 7.50% approximately equals the median of the simulated investment returns over a 50-year time horizon, adjusted to remove or damper any short term changes that are not expected over the entire 50-year measurement period. Best estimates of arithmetic real rates of return for each major asset class included in the target asset allocation for each pension plan, as of the measurement dates of June 30, 2015 and 2014, are summarized in the following table:
2015 2014% Long-term % Long-term
expected expectedreal rate of real rate of
Target return Target returnallocation arithmetic allocation arithmetic
Asset class:Fixed income 20.00% 1.70% 20.00% 0.80%Tangible assets 5.00 4.40 5.00 4.10Real estate 15.00 5.80 15.00 5.30Global equity 37.00 6.60 37.00 6.05Private equity 23.00 9.60 23.00 9.05
The inflation components used to create the above table are 2.20% and 2.70% for the measurement dates as of June 30, 2015 and 2014, respectively, and represents WSIB's most recent long-term estimate of broad economic inflation.

UNIVERSITY OF WASHINGTON HOUSING AND FOOD SERVICES
(A Department of University of Washington) Notes to Financial Statements
June 30, 2016 and 2015
24 (Continued)
Discount Rate The discount rate used to measure the total pension liabilities as of June 30, 2016 and 2015 was 7.50%. The projection of cash flows used to determine the discount rate assumed that contributions from plan members will be made at contractually required rates, and that contributions from employers will be made at statutorily required rates, actuarially determined (including the component of PERS2/3 and TRS 2/3 employer rates pertaining to the unfunded actuarial accrued liabilities for PERS 1 and TRS 1, respectively). Based on those assumptions, the fiduciary net position for each pension plan in which the HFS participates was projected to be sufficient to make all projected future benefit payments of the current plan members. Therefore, the long-term expected rate of return on pension plan investments was applied to all periods of projected benefit payments to determine the total pension liability. Using the WSIB long-term expected rate of return, a 7.50% future investment rate of return on pension plan investments was assumed for the test. The expected return on plan assets is the estimated long-term rate of return that will be earned on the investments used to fund the pension obligation. Contributions from plan members and employers were assumed to continue to be made at contractually required rates (including the component of PERS2/3 and TRS 2/3 employer rates pertaining to the unfunded actuarial accrued liabilities for PERS 1 and TRS 1, respectively, as provided for in Chapter 41.45 of the RCW). Sensitivity of the Net Pension Liability (Asset) to Changes in the Discount Rate The following table presents the HFS s net pension liability calculated using the discount rate of 7.50%, as well as what the net pension liability would be if it were calculated using a discount rate that is 1-percentage-point lower (6.50%) or 1-percentage-point higher (8.50%) than the current rate.
(Dollars in thousands )2016 2015
Current Current1% Decrease discount rate 1% Increase 1% Decrease discount rate 1% Increase
Plan:PERS 1 $ 7,107 5,838 4,746 6,319 5,126 4,103 PERS 2/3 14,411 4,928 (2,332) 10,555 2,531 (3,599)

UNIVERSITY OF WASHINGTON HOUSING AND FOOD SERVICES
(A Department of University of Washington) Notes to Financial Statements
June 30, 2016 and 2015
25 (Continued)
Employer Contribution Rates Employer contribution rates are developed in accordance with Chapter 41.45 of the RCW by the OSA, and include an administrative expense component that is currently set at 0.18%. The statute provides authority to the Pension Funding Council to adopt changes to economic assumptions and contribution rates. The contribution rates and required contributions for each DRS plan in which HFS participates are shown in the table below.
PERSDescription Plan 1 Plan 2 /3i
(Dollars in thousands)Contributions as June 30, 2016:
Contribution rate 11.18% 11.18%Contributions made $ 639 807
Contributions as June 30, 2015:Contribution rate 9.21% 9.21%Contributions made $ 505 603
i Plan 2/3 employer rate includes a component to address the Plan 1 unfunded actuarial accrued liability HFS Proportionate Share Collective pension amounts are determined as of a measurement date, which can be no earlier than an employer's prior fiscal year. The measurement date for the net pension liabilities recorded by the University as of June 30, 2016 was June 30, 2015. Employer contributions received and processed by DRS during the fiscal year ended June 30, 2015 have been used as the basis for determining each employer's proportionate share of the collective pension amounts reported by DRS in their June 30, 2015 Schedules of Employer and nonemployer Allocations. Likewise, the measurement date for the net pension liabilities recorded by the University as of June 30, 2015 was June 30, 2014, with employer contributions received and processed by the DRS during fiscal year 2014 used as the basis for determining each employer's proportionate share of the June 30, 2014 collective pension amounts. The University's proportionate share for each DRS plan is shown in the table below.
Proportionate sharePERS 1 PERS 2/3
Year ended June 30, 2016 0.11160 0.13793Year ended June 30, 2015 0.10176 0.12518

UNIVERSITY OF WASHINGTON HOUSING AND FOOD SERVICES
(A Department of University of Washington) Notes to Financial Statements
June 30, 2016 and 2015
26 (Continued)
HFS Aggregated Balances HFS s aggregated balances of net pension liabilities and net pension asset as of June 30, 2016 and 2015, respectively are presented in the table below.
Plan PERS 1 PERS 2/3 Total(Dollars in thousands)
June 30, 2016:Net pension liability $ 5,838 4,928 10,766 Net pension asset
June 30, 2015:Net pension liability $ 5,126 2,531 7,657 Net pension asset
Pension Expense, Deferred Outflows of Resources and Deferred Inflows of Resources The tables below summarize HFS s pension expense, deferred outflows of resources and deferred inflows of resources related to the DRS pension plans, together with the related future year impacts to pension expense from amortization of those deferred amounts. Note that deferred outflows of resources related to HFS contributions subsequent to the measurement date are recognized as a reduction of the net pension liability in the following year, and are not amortized to pension expense.
Proportionate share of pension expenseDescription PERS plan 1 PERS plan 2 /3 Total
(Dollars in thousands)As of June 30, 2016 $ 895 747 1,642 As of June 30, 2015 598 451 1,049

UNIVERSITY OF WASHINGTON HOUSING AND FOOD SERVICES
(A Department of University of Washington) Notes to Financial Statements
June 30, 2016 and 2015
27 (Continued)
Deferred outflows of resourcesDescription PERS 1 PERS 2/3 Total
(Dollars in thousands)June 30, 2016:
Change in assumptions $ 8 8 Difference between expected and
actual experience 524 524 proportionate share 513 513 subsequent to the measurementdate of the collective netpension liabilitya 639 806 1,445
Total $ 639 1,851 2,490 June 30, 2015:
proportionate share $ 158 158 subsequent to the measurementdate of the collective netpension liability 505 603 1,108
Total $ 505 761 1,266 a. Recognized as a reduction of the net pension liability as of June 30, 2016

UNIVERSITY OF WASHINGTON HOUSING AND FOOD SERVICES
(A Department of University of Washington) Notes to Financial Statements
June 30, 2016 and 2015
28 (Continued)
Deferred inflows of resourcesDescription PERS 1 PERS 2/3 Total
(Dollars in thousands)June 30, 2016:
Difference between projected andactual earnings on planinvestments, net $ 319 1,316 1,635 share
Total $ 319 1,316 1,635 June 30, 2015:
Difference between projected andactual earnings on planinvestments, net $ 641 2,682 3,323 share
Total $ 641 2,682 3,323
Description PERS Plan 1 PERS Plan 2/3 Total(Dollars in thousands)
Deferred outflows of resources relatedto the measurement date that will berecognized as a reduction of the netpension liability as of June 30, 2017 $ 639 806 1,445
Deferred outflows of resources relatedto the measurement date that will berecognized as a reduction of the netpension liability as of June 30, 2016 505 603 1,108

UNIVERSITY OF WASHINGTON HOUSING AND FOOD SERVICES
(A Department of University of Washington) Notes to Financial Statements
June 30, 2016 and 2015
29 (Continued)
Amounts reported as deferred outflows of resources, exclusive of contributions made after the measurement date, and deferred inflows of resources will be recognized in pension expense as follows:
Amortization of deferred inflows anddeferred outflows of resources
Year PERS Plan 1 PERS Plan 2/3 Total(Dollars in thousands)
2017 $ (124) (194) (318) 2018 (124) (194) (318) 2019 (123) (217) (340) 2020 52 335 387 2021Thereafter
Total $ (319) (270) (589)
University of Washington Retirement Plan (403(b)) Faculty, librarians and professional staff are eligible to participate in the University of Washington Retirement Plan, a 403(b) defined-contribution plan administered by the University. HFS participates in this plan. 403(b) Plan Description Contributions to the plan are invested by participants in annuity contracts or mutual fund accounts offered by one or more fund sponsors. Employees have at all times a 100% vested interest in their accumulations. Benefits from the plan are available upon separation or retirement at the member s option. RCW 28B.10.400 et. seq. assigns the authority to the University of Washington Board of Regents to establish and amend benefit provisions. 403(b) Funding Policy Employee contribution rates, based on age, are 5%, 7.5% or 10% of salary. The University matches the contributions of employees. Within parameters established by the legislature, contribution requirements may be established or amended by the University of Washington Board of Regents. University of Washington Supplemental Retirement Plan (401(b)) The University of Washington Supplemental Retirement Plan (UWSRP), a 401(a) defined-benefit retirement plan, operates in tandem with the 403(b) plan to supplement the expected defined contribution retirement savings accumulated under the UWRP. HFS also participates in this plan. The UWSRP was closed to new participants effective March 1, 2011. The University is ultimately responsible for the payment of the obligation; therefore, the annual required contribution (ARC) is not recorded in HFS s financial statements. 401(a) Plan Description This plan provides for a supplemental payment component, which guarantees a minimum retirement benefit based upon a one-time calculation at each eligible participant s retirement date. The University makes direct

UNIVERSITY OF WASHINGTON HOUSING AND FOOD SERVICES
(A Department of University of Washington) Notes to Financial Statements
June 30, 2016 and 2015
30
payments to qualifying retirees when the retirement benefits provided by the 403(b) plan do not meet the benefit goals.
(7) Other Postemployment Benefits (OPEB) The University funds OPEB obligations at a university-wide level on a pay-as-you-go basis. Disclosure information, as required under GASB Statement No. 45 (GASB 45), Accounting and Financial Reporting by Employers for Postemployment Benefits Other Than Pensions, does not exist at the Department level, and as a result, the Actuarial Accrued Liability (AAL) is not available for auxiliary entities. The University is ultimately responsible for the obligation; therefore, the (ARC) is not recorded on the Department s financial statements.
(8) Subsequent Events The interest rate changed from 4.75% to 4.50% effective July 1, 2016 for the ILP.

UNIVERSITY OF WASHINGTON HOUSING AND FOOD SERVICES
(A Department of University of Washington) Schedules of Required Supplementary Information (Unaudited)
June 30, 2016
31 (Continued)
SCHEDULE OF HFS SHARE OF THE NET PENSION LIABILITY(as of measurement date, the prior fiscal year end)
PERS 1(Dollar amounts in thousands)
2016 2015
liability 0.11% 0.10%pension liability $ 5,838 5,126
299 312 pension liability as a percentage of covered-employee payroll 1,950.91% 1,644.20%
Plan fiduciary net position as a percentage of the total pensionliability 59.10 61.19
SCHEDULE OF CONTRIBUTIONS
(as of current fiscal year end)PERS 1
(Dollar amounts in thousands)
2016 2015Contractually required contribution $ 29 28 Contributions in relation to the contractually required contribution 29 28 Contribution deficiency (excess)
259 299 Contributions as a percentage of covered-employee payroll 11.08% 9.21%
See accompa report.

UNIVERSITY OF WASHINGTON HOUSING AND FOOD SERVICES
(A Department of University of Washington) Schedules of Required Supplementary Information (Unaudited)
June 30, 2016
32
SCHEDULE OF HFS SHARE OF THE NET PENSION LIABILITY(as of measurement date, the prior fiscal year end)
PERS 2/3(Dollar amounts in thousands)
2016 2015
liability 0.14% 0.13%pension liability $ 4,928 2,531
12,239 10,721 pension liability as a percentage of covered-employee payroll 40.27% 23.60%
Plan fiduciary net position as a percentage of the total pensionliability 89.20% 93.29%
SCHEDULE OF CONTRIBUTIONS
(as of current fiscal year end)PERS 2/3
(Dollar amounts in thousands)
2016 2015Contractually required contribution $ 1,448 1,127 Contributions in relation to the contractually required contribution 1,462 1,127 Contribution deficiency (excess) (14)
13,051 12,239 Contributions as a percentage of covered-employee payroll 11.10% 9.21%
See accompanying independent auditors' report

UNIVERSITY OF WASHINGTON HOUSING AND FOOD SERVICES
(A Department of University of Washington) Schedules of Required Supplementary Information (Unaudited)
June 30, 2016
33
Notes to Schedules of Required Supplementary Information (Unaudited) for the Year Ended June 30, 2016 The Office of the State Actuary (OSA) calculates the actuarially determined contributions (ADC) based on the results of an actuarial valuation consistent with the state s funding policy defined in Chapter 41.45 RCW. Consistent with the state s contribution-rate adoption process, the results of an actuarial valuation with an odd-numbered year valuation date determine the ADC for the biennium that ensues two years later. For example, the actuarial valuation with a June 30, 2013, valuation date, completed in the fall of 2014, determines the ADC for the period beginning July 1, 2015, and ending June 30, 2017. See ac report.

UNIVERSITY OF WASHINGTON DEPARTMENT OF INTERCOLLEGIATE ATHLETICS
Financial Statements and Schedules June 30, 2016 and 2015
(With Independent Auditors Report Thereon)

UNIVERSITY OF WASHINGTON DEPARTMENT OF INTERCOLLEGIATE ATHLETICS
Table of Contents
PageIndependent Auditors Report 1 Management s Discussion and Analysis 3 Statement of Net Position 13 Statement of Revenue, Expenses, and Changes in Net Position 14 Statement of Cash Flows 15 Notes to Financial Statements 16 Schedules 1. Schedules of Required Supplementary Information 34 2. Operating and Other Revenue by Specific Function 37 3. Operating Expenses and Other Deductions by Specific Function 38

Independent Auditors Report
The Board of Regents University of Washington: We have audited the accompanying financial statements of the University of Washington Department of Intercollegiate Athletics (the Department), as of and for the years ended June 30, 2016 and 2015, and the related notes to the financial statements, as listed in the table of contents. Management s Responsibility for the Financial Statements Management is responsible for the preparation and fair presentation of these financial statements in accordance with U.S. generally accepted accounting principles; this includes the design, implementation, and maintenance of internal control relevant to the preparation and fair presentation of financial statements that are free from material misstatement, whether due to fraud or error. Auditors Responsibility Our responsibility is to express an opinion on these financial statements based on our audits. We conducted our audits in accordance with auditing standards generally accepted in the United States of America. Those standards require that we plan and perform the audit to obtain reasonable assurance about whether the financial statements are free from material misstatement. An audit involves performing procedures to obtain audit evidence about the amounts and disclosures in the financial statements. The procedures selected depend on the auditors judgment, including the assessment of the risks of material misstatement of the financial statements, whether due to fraud or error. In making those risk assessments, the auditor considers internal control relevant to the entity s preparation and fair presentation of the financial statements in order to design audit procedures that are appropriate in the circumstances, but not for the purpose of expressing an opinion on the effectiveness of the entity s internal control. Accordingly, we express no such opinion. An audit also includes evaluating the appropriateness of accounting policies used and the reasonableness of significant accounting estimates made by management, as well as evaluating the overall presentation of the financial statements. We believe that the audit evidence we have obtained is sufficient and appropriate to provide a basis for our audit opinion. Opinion In our opinion, the financial statements referred to above present fairly, in all material respects, the financial position of the University of Washington Department of Intercollegiate Athletics as of June 30, 2016 and 2015, and the changes in its net position and its cash flows for the years then ended, in accordance with U.S. generally accepted accounting principles.

2
Emphasis of Matters As discussed in note 1 to the financial statements, on July 1, 2014, the Department adopted new accounting guidance requiring governments providing defined benefit pensions to their employees to recognize their changes in the net pension liability within pension expense. Our opinion is not modified with respect to this matter. As discussed in note 1, the financial statements of the University of Washington Department of Intercollegiate Athletics are intended to present the financial position, the changes in financial position and cash flows of only that portion of the University of Washington that is attributable to the transactions of the Department. They do not purport to, and do not, present fairly the financial position of the University of Washington as of June 30, 2016 and 2015, the changes in its financial position or its cash flows for the years then ended in accordance with accounting principles generally accepted in the United States of America. Our opinion is not modified with respect to this matter. Other Matters Required Supplementary Information U.S. generally accepted accounting principles require that the management s discussion and analysis on pages 3 through 12, and the schedules of required supplementary information on pages 34 through 36, be presented to supplement the basic financial statements. Such information, although not part of the basic financial statements, is required by the Governmental Accounting Standards Board who considers it to be an essential part of the financial reporting for placing the basic financial statements in an appropriate operational, economic, or historical context. We have applied certain limited procedures to the required supplementary information in accordance with auditing standards generally accepted in the United States of America, which consisted of inquiries with management about the methods of preparing the information and comparing the information for consistency with management s responses to our inquiries, the basic financial statements, and other knowledge we obtained during our audits of the basic financial statements. We do not express an opinion or provide any assurance on the information because the limited procedures do not provide us with sufficient evidence to express an opinion or provide any assurance. Supplementary and Other Information Our audits were conducted for the purpose of forming an opinion on the financial statements as a whole. The supplementary information included on pages 37 and 38 is presented for purposes of additional analysis and is not a required part of the basic financial statements. Such information is the responsibility of management and was derived from and relates directly to the underlying accounting and other records used to prepare the basic financial statements. The information has been subjected to the auditing procedures applied in the audit of the basic financial statements and certain additional procedures, including comparing and reconciling such information directly to the underlying accounting and other records used to prepare the basic financial statements or to the basic financial statements themselves, and other additional procedures in accordance with auditing standards generally accepted in the United States of America. In our opinion, the information is fairly stated in all material respects in relation to the basic financial statements as a whole.
Seattle, Washington November 30, 2016

UNIVERSITY OF WASHINGTON DEPARTMENT OF INTERCOLLEGIATE ATHLETICS
June 30, 2016 and 2015
Unaudited
3 (Continued)
Discussion and Analysis Prepared by Management The following discussion and analysis provides an overview of the financial position and activities of the University of Washington Department of Intercollegiate Athletics (ICA) as of and for the years ended June 30, 2016, 2015, and 2014. This discussion has been prepared by management and should be read in conjunction with the financial statements and accompanying notes, which follow this section. The financial statements present only the University of Washington Department of Intercollegiate Athletics and do not purport to, and do not, present fairly the financial position of the University of Washington, as of June 30, 2016 and 2015, the changes in its financial position, or its cash flows for the years then ended in accordance with U.S. generally accepted accounting principles. Using the Financial Statements ICA s financial statements include the statements of net position, statements of revenues, expenses, and changes in net position, statements of cash flows, and notes to financial statements. These financial statements are prepared in accordance with Governmental Accounting Standards Board (GASB) principles, which establish standards for external financial reporting for public colleges and universities. The financial health of ICA can be measured by reviewing the summaries and explanations that follow. Statements of Net Position Summary The statements of net position in the financial statements reflect the financial conditions of ICA at the end of the last two years and report the various categories of all assets and liabilities. The following statements of net position summary shows ICA s total assets, total pension deferred outflows of resources, total liabilities, total pension deferred inflows of resources, and net position as of June 30, 2016, 2015 and 2014:
Statements of net position summary2016 2015 2014(In thousands)
Current assets $ 14,322 17,642 19,071Noncurrent assets:
Capital assets, net 348,384 364,066 378,330Other 80,743 88,766 82,614
Total assets 443,449 470,474 480,015Pension deferred outflows of resources 974 727
Total assets and pensiondeferred outflows of resources $ 444,423 471,201 480,015
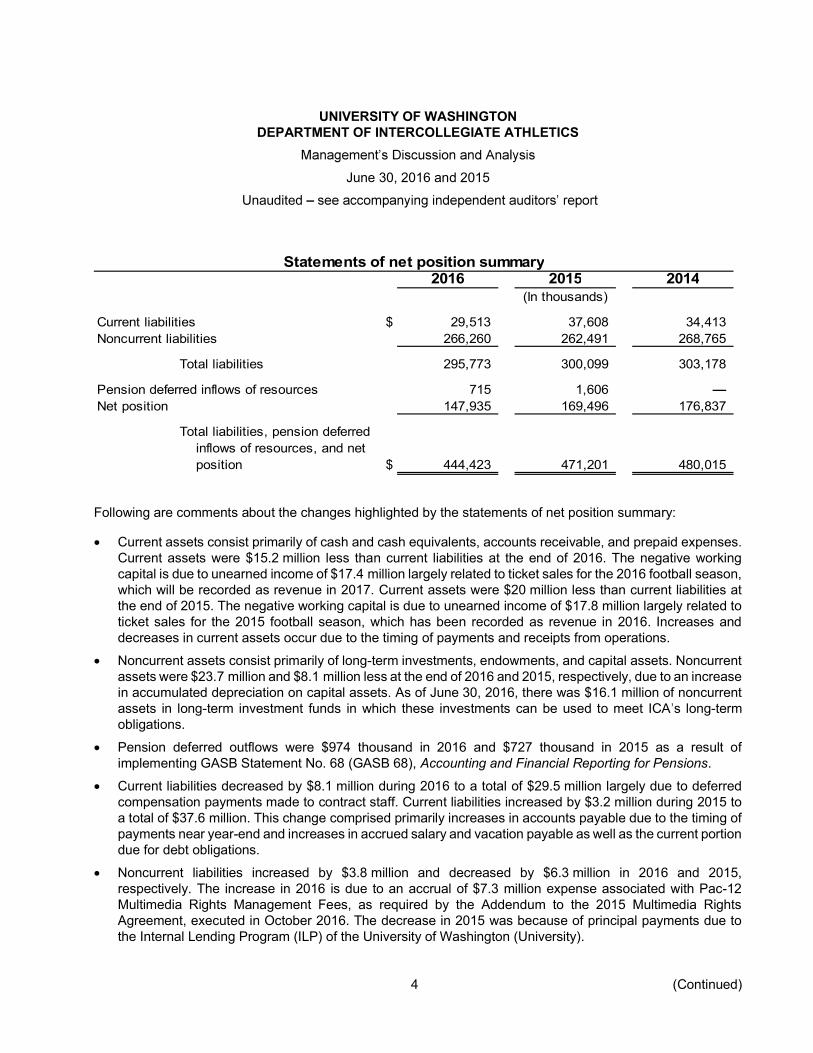
UNIVERSITY OF WASHINGTON DEPARTMENT OF INTERCOLLEGIATE ATHLETICS
June 30, 2016 and 2015
Unaudited
4 (Continued)
Statements of net position summary2016 2015 2014(In thousands)
Current liabilities $ 29,513 37,608 34,413Noncurrent liabilities 266,260 262,491 268,765
Total liabilities 295,773 300,099 303,178Pension deferred inflows of resources 715 1,606Net position 147,935 169,496 176,837
Total liabilities, pension deferredinflows of resources, and netposition $ 444,423 471,201 480,015
Following are comments about the changes highlighted by the statements of net position summary: Current assets consist primarily of cash and cash equivalents, accounts receivable, and prepaid expenses.
Current assets were $15.2 million less than current liabilities at the end of 2016. The negative working capital is due to unearned income of $17.4 million largely related to ticket sales for the 2016 football season, which will be recorded as revenue in 2017. Current assets were $20 million less than current liabilities at the end of 2015. The negative working capital is due to unearned income of $17.8 million largely related to ticket sales for the 2015 football season, which has been recorded as revenue in 2016. Increases and decreases in current assets occur due to the timing of payments and receipts from operations.
Noncurrent assets consist primarily of long-term investments, endowments, and capital assets. Noncurrent assets were $23.7 million and $8.1 million less at the end of 2016 and 2015, respectively, due to an increase in accumulated depreciation on capital assets. As of June 30, 2016, there was $16.1 million of noncurrent assets in long-term investment funds in which these investments can be used to meet ICA s long-term obligations.
Pension deferred outflows were $974 thousand in 2016 and $727 thousand in 2015 as a result of implementing GASB Statement No. 68 (GASB 68), Accounting and Financial Reporting for Pensions.
Current liabilities decreased by $8.1 million during 2016 to a total of $29.5 million largely due to deferred compensation payments made to contract staff. Current liabilities increased by $3.2 million during 2015 to a total of $37.6 million. This change comprised primarily increases in accounts payable due to the timing of payments near year-end and increases in accrued salary and vacation payable as well as the current portion due for debt obligations.
Noncurrent liabilities increased by $3.8 million and decreased by $6.3 million in 2016 and 2015, respectively. The increase in 2016 is due to an accrual of $7.3 million expense associated with Pac-12 Multimedia Rights Management Fees, as required by the Addendum to the 2015 Multimedia Rights Agreement, executed in October 2016. The decrease in 2015 was because of principal payments due to the Internal Lending Program (ILP) of the University of Washington (University).

UNIVERSITY OF WASHINGTON DEPARTMENT OF INTERCOLLEGIATE ATHLETICS
June 30, 2016 and 2015
Unaudited
5 (Continued)
Pension deferred inflows were $715 thousand in 2016 and $1.6 million in 2015 as a result of implementing GASB 68.
The change in net position or equity measures whether the overall financial condition has improved or deteriorated during the year. The total of net position decreased by $21.6 million and $2.9 million during 2016 and 2015, respectively due to the combination of a decrease in gate revenue and related contributions, a lower return on market value of long-term investments and endowments, in 2016, an expense of Pac-12 multimedia rights management fees, and in 2015, the implementation of GASB statement No. 68, Accounting and Financial Reporting for Pensions, which resulted in recording pension liabilities for the first time.
ICA s Net Position or Equity The following table is a summary of the net position or equity for ICA at June 30, 2016, 2015 and 2014:
2016 2015 2014(In thousands)
Net investment in capital assets $ 89,441 99,679 104,976Restricted:
Nonexpendable 52,928 47,586 43,832Expendable 11,019 12,885 15,897
Unrestricted (5,453) 9,346 12,132Total net position $ 147,935 169,496 176,837
The categories of net position or equity listed in the table above are defined as follows: Net investment in capital assets is ICA s total investment in property, plant, equipment, and infrastructure,
net of accumulated depreciation and any outstanding debt obligations related to those capital assets. Restricted nonexpendable net position consists of funds for which the donor has made the restriction that
the principal is not available for expenditures, but investment earnings can be used for specific purposes. Restricted expendable net position is resources that ICA is obligated to spend in accordance with the
restrictions placed by donors and/or external parties. Unrestricted net position is all other funds available to ICA for any purpose. Unrestricted assets are often
internally designated for specific purposes.

UNIVERSITY OF WASHINGTON DEPARTMENT OF INTERCOLLEGIATE ATHLETICS
June 30, 2016 and 2015
Unaudited
6 (Continued)
Following are comments about the changes highlighted in the net position or equity summary: Net investment in capital assets decreased by $10.2 million in 2016 to a total of $89.4 million. Net
investment in capital assets decreased by $5.3 million in 2015 to a total of $99.7 million. This balance increases as debt is paid off or when ICA funds fixed asset purchases without financing. The balance decreases as assets are depreciated.
Restricted nonexpendable net position increased by $5.3 million and $3.8 million in 2016 and 2015, respectively. The increases in 2016 and 2015 were mainly due to an increase in contributed endowments of $7.5 million and $3.4 million to ICA, respectively.
Restricted expendable net position decreased by $1.9 million in 2016 and $3.0 million in 2016 and 2015, respectively. The decreases in 2016 and 2015 were mainly due to contributions received offset by expenditures for the Husky Stadium renovation project made in accordance with the donors stipulations.
Unrestricted net position decreased by $14.8 million and $2.8 million in 2016 and 2015, respectively. In fiscal year 2016, ICA recorded a $7.3 million expense related to Pac-12 multimedia rights management fees in addition to the $5.1 million loss on investments. On July 1, 2014, ICA adopted GASB Statement No. 68, Accounting and Financial Reporting for Pensions. Implementation of this standard resulted in the restatement of beginning fiscal year 2015 unrestricted net position reducing it by $4.4 million. This was partially offset by the recording of financing cost expenses for the ILP debt for Husky Stadium and Husky Ballpark in fiscal year 2015.
Endowments and Other Investments The fair market value of ICA s endowments was $63.5 million and $59.9 million at June 30, 2016 and 2015,
respectively. The increases in 2016 and 2015 are due to additional endowment contributions of $7.5 million and $3.4 million, respectively.
ICA had $16.1 million and $27.6 million of long-term investments, not including endowments, in the Consolidated Endowment Fund (CEF) at June 30, 2016 and 2015, respectively. In fiscal year 2016, ICA withdrew $10.0 million from the CEF to fund the operating cash deficit and also had a market related loss on investments.
Short-term investments in the Invested Funds Pool used as operating funds for ICA yielded returns of 2.0% in both 2016 and 2015.
Capital Improvements and Related Debt In 2016 and 2015, there was a net decrease of $15.7 million and $14.3 million in capital assets, primarily
related to the depreciation of capital assets exceeding the acquisition of capital assets, respectively. Total noncurrent liabilities at the end of 2016 and 2015 was $266.3 million and $262.5 million, respectively.
The increase in 2016 was primarily due the addition of the Pac-12 multimedia rights management fees payable. The decrease in 2015 was due the settlement of the payable to the University for construction in progress and retainage for Husky Stadium.

UNIVERSITY OF WASHINGTON DEPARTMENT OF INTERCOLLEGIATE ATHLETICS
June 30, 2016 and 2015
Unaudited
7 (Continued)
Statements of Revenues, Expenses, and Changes in Net Position The statements of revenues, expenses, and changes in net position present how ICA s operating and nonoperating items resulted in changes in net position. In accordance with GASB reporting principles, revenues and expenses are classified as either operating or nonoperating. The following summary shows the revenues, expenses, and changes in net position for the years ended June 30, 2016, 2015 and 2014:
Revenues, expenses, and changes in net position summary2016 2015 2014
(In thousands)Operating revenues $ 79,180 79,818 70,777Operating expenses (120,091) (110,127) (112,180)
Operating loss (40,911) (30,309) (41,403)Nonoperating revenues, net 10,381 17,233 25,386Other revenues 8,969 10,167 16,826
(Decrease) increase in netposition (21,561) (2,909) 809
Net position, beginning of year 169,496 176,837 176,028Effect of accounting change (4,432)Net position, end of year $ 147,935 169,496 176,837
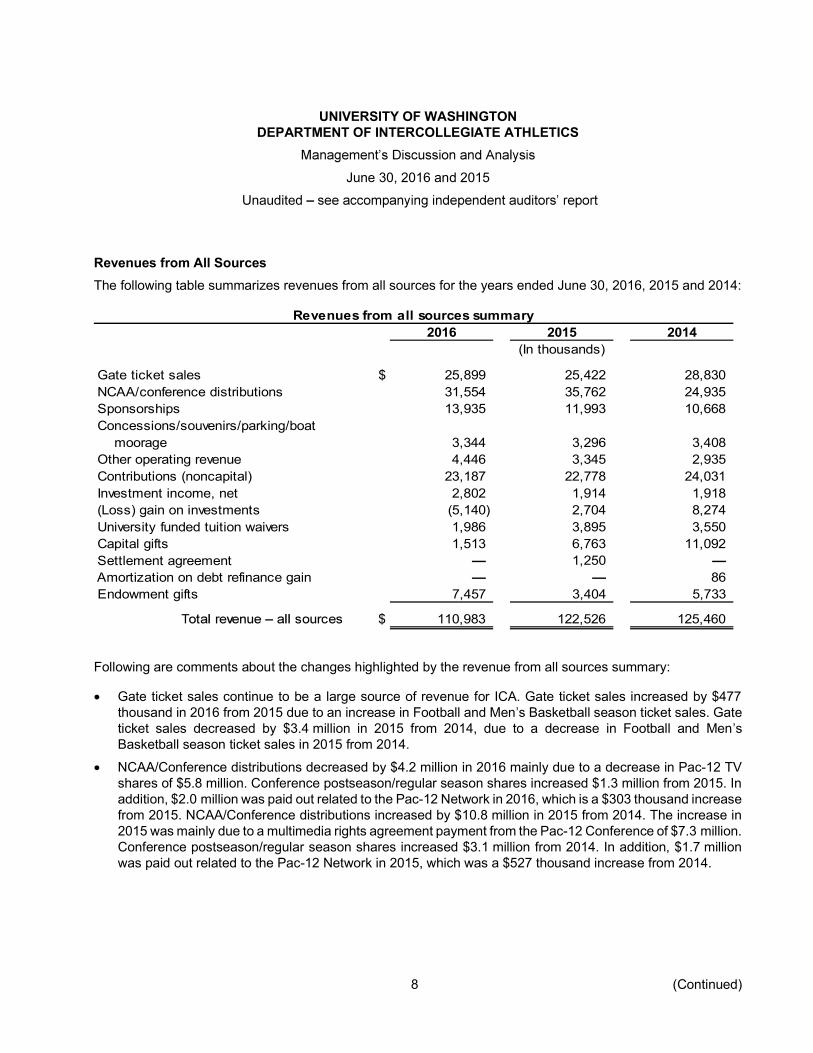
UNIVERSITY OF WASHINGTON DEPARTMENT OF INTERCOLLEGIATE ATHLETICS
June 30, 2016 and 2015
Unaudited
8 (Continued)
Revenues from All Sources The following table summarizes revenues from all sources for the years ended June 30, 2016, 2015 and 2014:
Revenues from all sources summary2016 2015 2014
(In thousands)Gate ticket sales $ 25,899 25,422 28,830NCAA/conference distributions 31,554 35,762 24,935Sponsorships 13,935 11,993 10,668Concessions/souvenirs/parking/boat
moorage 3,344 3,296 3,408Other operating revenue 4,446 3,345 2,935Contributions (noncapital) 23,187 22,778 24,031Investment income, net 2,802 1,914 1,918(Loss) gain on investments (5,140) 2,704 8,274University funded tuition waivers 1,986 3,895 3,550Capital gifts 1,513 6,763 11,092Settlement agreement 1,250Amortization on debt refinance gain 86Endowment gifts 7,457 3,404 5,733
$ 110,983 122,526 125,460
Following are comments about the changes highlighted by the revenue from all sources summary: Gate ticket sales continue to be a large source of revenue for ICA. Gate ticket sales increased by $477
thousand in 2016 from 2015 due to an increase in Football and Men s Basketball season ticket sales. Gate ticket sales decreased by $3.4 million in 2015 from 2014, due to a decrease in Football and Men s Basketball season ticket sales in 2015 from 2014.
NCAA/Conference distributions decreased by $4.2 million in 2016 mainly due to a decrease in Pac-12 TV shares of $5.8 million. Conference postseason/regular season shares increased $1.3 million from 2015. In addition, $2.0 million was paid out related to the Pac-12 Network in 2016, which is a $303 thousand increase from 2015. NCAA/Conference distributions increased by $10.8 million in 2015 from 2014. The increase in 2015 was mainly due to a multimedia rights agreement payment from the Pac-12 Conference of $7.3 million. Conference postseason/regular season shares increased $3.1 million from 2014. In addition, $1.7 million was paid out related to the Pac-12 Network in 2015, which was a $527 thousand increase from 2014.
UNIVERSITY OF WASHINGTON DEPARTMENT OF INTERCOLLEGIATE ATHLETICS
June 30, 2016 and 2015
Unaudited
9 (Continued)
Sponsorship revenue increased by $1.9 million in 2016 from 2015 due to the field naming rights agreement with Alaska Airlines and $950 thousand additional in donated advertising. Sponsorship revenue increased by $1.3 million in 2015 from 2014. The increase in 2015 was mainly due to an increase in donated advertising related to the new radio contract with KOMO radio.
Other operating revenue increased by $1.1 million in 2016 from 2015 due to a settlement from Sound Transit for the Link light rail station at Husky Stadium. Other operating revenue increased $410 thousand from 2014 to 2015 mostly due to increased revenue from fundraising from the sport teams.
Contributions related to noncapital gifts increased by $409 thousand in 2016 from 2015 due to higher seat related contributions associated with the earlier sale of Men s Basketball season tickets. Contributions related to noncapital gifts decreased by $1.3 million in 2015 from 2014. The majority of the decrease was due to lower seat related contributions due to lower football and men s basketball season ticket sales.
Investment income increased by $888 thousand in 2016. Investment income is earned on two categories including investments in the CEF and short-term investments with the activity described as follows:
Investment income in the CEF increased by $873 thousand and $250 thousand in 2016 and 2015, respectively, mainly due to an increase in the balance held in the CEF during these periods. Short-term investments received 2.0% distributions in both 2016 and 2015. Since the returns were the same for each year, the change in the average investment balances accounted for any change in investment income.
In 2016 and 2015, there was a decrease in gain on investments of $7.8 million and $5.6 million due to the decreased value of long-term investments and endowment funds, respectively.
University funded tuition waivers decreased by $1.9 million in 2016. Previous financial projections suggested ICA could withstand funding 50% of waivers. University funded tuition waivers decreased by $345 thousand in 2015 due to the impact of decreasing tuition rates for in-state students.
Capital gifts were $1.5 million in 2016 and $6.8 million in 2015, respectively. The decrease in both years was due to a decrease in the remaining pledges due for the stadium.
In 2015, there was a settlement agreement reached with a former coach, which resulted in $1.3 million in settlement agreement revenue.
Endowment gifts increased by $4.1 million in 2016 to a total of $7.5 million. Endowment gifts decreased by $2.3 million in 2015 to a total of $3.4 million.

UNIVERSITY OF WASHINGTON DEPARTMENT OF INTERCOLLEGIATE ATHLETICS
June 30, 2016 and 2015
Unaudited
10 (Continued)
Expenses and Losses The following table summarizes expenses and losses for the years ended June 30, 2016, 2015 and 2014:
Expenses and losses summary2016 2015 2014
(In thousands)Salaries and wages $ 29,459 29,089 26,786Payroll taxes and employee benefits 7,611 6,585 7,155Athletic student aid 13,026 11,959 11,806Guarantees paid to visiting teams 2,113 2,113 1,593Team travel 5,077 6,008 5,595Day of game 7,536 6,749 7,156Direct facilities, maintenance, and utilities 3,786 4,039 4,455Advertising 2,680 1,728 531Uniforms and supplies 6,211 6,205 6,046Training table 2,861 2,558 1,643Department relations 469 774 887Banquets and special events 466 639 566Depreciation 17,570 17,270 17,598Noncapitalized equipment and repairs 1,695 2,546 8,485Institutional overhead 1,859 1,748 2,454Pac-12 Management Fee 7,300Other operating expenses 10,371 10,116 9,424
Total operating expenses 120,090 110,126 112,180Financing costs 2,566Loss on disposal of capital assets 71 34 5Interest expense 12,383 12,709 12,467
Total nonoperating expensesand losses 12,454 15,309 12,472
Total $ 132,544 125,435 124,652

UNIVERSITY OF WASHINGTON DEPARTMENT OF INTERCOLLEGIATE ATHLETICS
June 30, 2016 and 2015
Unaudited
11 (Continued)
Following are comments about the changes in expenses highlighted by the expenses and losses summary: Salaries and wages increased by $370 thousand in 2016 from 2015 due to severance payments made to
former staff and merit increases for professional and classified staff. Salaries and wages increased by $2.3 million in 2015 from 2014 due to an increase in fixed extra guaranteed compensation per employment contracts.
Payroll taxes and employee benefits increased by $1.0 million in 2016 from 2015 primarily due to the payout of deferred compensation to contract staff. Since payroll taxes and employee benefits are a percentage of salaries and wages, the changes detailed above in salaries and wages for 2016 directly impact the changes in payroll taxes and employee benefits. Payroll taxes and employee benefits decreased by $570 thousand in 2015 from 2014 since the impact from increases in salaries and wages was more than offset by decreases in the percentages charged. The percentages charged to ICA on professional and contract staff salaries went from 30.9% in 2014 to 27.7% in 2015 to 30.5% in 2016. The percentages for classified staff salaries went from 35.3% in 2014 to 33.8% in 2015 to 39.4% in 2016. The smaller amount spent on classified staff salaries compared to professional and contract staff salaries only has a small impact on increasing the total amount of payroll taxes and employee benefits paid. The percentages charged on hourly staff, overtime, and additional compensation for contract staff increased from 15.2% in 2014 to 17.0% in 2015 to 18.8% in 2016.
Athletic student aid increased by $1.1 million in 2016 from 2015 due to a higher proportion of out of state students and an increase in summer school attendance. Athletic student aid increased by $153 thousand in 2015 from 2014 due to rate increases for out of state tuition and increases for room and board. In-state tuition rates were reduced by 5% in 2016 and kept at the same level in 2015 and 2014. Out-of-state tuition increased by 2% in 2016 and 5% in 2015.
Guarantees paid to visiting teams fluctuate due to the difference in the nonconference football game schedule.
Team travel decreased by $931 thousand in 2016 from 2015 due to an increase in NCAA reimbursement of travel costs as well as cost-saving measures taken in airfare and meal purchases. Team travel increased by $413 thousand in 2015 from 2014, due to increase costs for airfare and meals in 2015.
Day of game increased by $787 thousand in 2016 from 2015 due to having a weekday football game, which increases fan bus transportation costs as an additional bus transportation vendor is required for weekday games, and hosting the Pac-12 Track & Field Championships. Day of game decreased by $407 thousand in 2015 from 2014 mostly due to not having a weekday football game.
Advertising increased by $952 thousand in 2016 and $1.2 million in 2015 due to increases in value of the radio contract. The radio contract with IMG changed from KJR to KOMO in 2015.
Training table increased by $303 thousand in 2016 and by $915 thousand in 2015 due mostly to deregulation of NCAA food policies. This change allowed more opportunities for university to provide meals and snacks for student athletes.

UNIVERSITY OF WASHINGTON DEPARTMENT OF INTERCOLLEGIATE ATHLETICS
June 30, 2016 and 2015
Unaudited
12
Noncapitalized equipment and repairs decreased by $851 thousand and $5.9 million in 2016 and 2015, respectively, primarily due to not having additional equipment and maintenance costs related to the Husky Stadium renovation and Husky Ballpark projects. In 2016, there were less noncapitalized projects than in 2015.
In 2016, ICA recorded an $7.3 million expense for Pac-12 management fee expenses related to a multimedia rights agreement.
Other expenses increased $255 thousand in 2016 from 2015 and $692 thousand in 2015 from 2014, respectively, due to additional costs for the Pac-12 Conference Office assessment.
Financing costs were $74 in 2016 and $2.6 million in 2015, respectively. The financing costs for the Husky Stadium renovation were fully recognized in 2015 and a small addition of financing costs for the Husky Ballpark project was recognized in 2016.
Operating Loss There was an operating loss of approximately $40.9 million and $30.3 million in 2016 and 2015, respectively. There were not sufficient nonoperating revenues from contributions, investment income, and University funded tuition waivers to cover the operating losses for 2016 and 2015. Economic Factors Affecting the Future The greatest factor that determines the amount of gate revenues and contributions for Intercollegiate Athletics is having winning seasons for the football team. Football revenue supports the operations of all 22 Intercollegiate Athletic programs. Additionally, an economic downturn would have a negative financial impact on Athletic programs.

UNIVERSITY OF WASHINGTONDEPARTMENT OF INTERCOLLEGIATE ATHLETICS
Statements of Net PositionJune 30, 2016 and 2015
Assets and Deferred Outflows of Resources 2016 2015Current assets:
Cash in the University of Washington Invested Funds Pool (note 2) $ 5,259,499 8,736,190 Accounts receivable 7,685,489 7,648,464 Prepaid expenses 1,376,904 1,257,251
Total current assets 14,321,892 17,641,905 Noncurrent assets:
Investments:University of Washington Consolidated Endowment Fund (note 3) 16,136,373 27,602,270 Endowments (note 3) 63,486,687 59,889,483
Advances to University for capital projects 1,119,171 1,274,955 Capital assets, net (note 4) 348,384,377 364,065,727
Total noncurrent assets 429,126,608 452,832,435 Total assets 443,448,500 470,474,340
Pension deferred outflows of resources (note 8) 974,000 726,871 Total assets and deferred outflows of resources 444,422,500 471,201,211
Liabilities, Deferred Inflows of Resources, and Net PositionCurrent liabilities:
Accounts payable 1,585,715 5,660,647 Accrued salaries and vacation payable 4,570,236 7,505,571 Admission taxes payable 1,006,086 988,756 Accrued interest payable 144,598 1,377 Unearned income 17,442,125 17,794,055 Capitalized equipment lease payable, current portion (note 6) 1,455,512 1,475,797 Internal lending program payable, current portion (note 5) 3,308,198 4,181,483
Total current liabilities 29,512,470 37,607,686 Noncurrent liabilities:
Capitalized equipment lease payable, net of current portion (note 6) 5,658,252 7,113,764 Internal lending program payable, net of current portion (note 5) 248,521,539 251,615,939 Net pension liability (note 8) 4,780,000 3,761,644 Pac-12 Management Fee Payable 7,300,000 —
Total noncurrent liabilities 266,259,791 262,491,347 Total liabilities 295,772,261 300,099,033
Pension deferred inflows of resources (note 8) 715,000 1,606,167 Net position:
Net investment in capital assets 89,440,876 99,678,744 Restricted:
Nonexpendable (note 3) 52,927,941 47,586,520 Expendable:
Expendable endowment principal (note 3) 995,099 1,062,325 Expendable endowment gains 9,563,647 11,240,638 Other expendable 460,309 582,137
Unrestricted (5,452,633) 9,345,647 Total net position 147,935,239 169,496,011 Total liabilities, deferred inflows of resources, and net position $ 444,422,500 471,201,211
See accompanying notes to financial statements.
13

UNIVERSITY OF WASHINGTONDEPARTMENT OF INTERCOLLEGIATE ATHLETICS
Statements of Revenue, Expenses, and Changes in Net PositionYears ended June 30, 2016 and 2015
2016 2015Operating revenue:
Gate ticket sales $ 25,899,191 25,422,152 NCAA/conference distributions 31,554,435 35,761,948 Sponsorships 13,934,982 11,993,208 Concessions, souvenirs, parking, and boat moorage 3,344,261 3,295,618 Trademarks and licensing 725,565 713,588 Facility income 1,954,689 1,771,156 Other 1,766,316 860,145
Total operating revenue 79,179,439 79,817,815 Operating expenses:
Salaries and wages 29,459,271 29,088,904 Payroll taxes and employee benefits 7,610,727 6,584,886 Athletic student aid 13,026,272 11,959,293 Guarantees paid to visiting teams 2,112,940 2,113,355 Team travel 5,076,549 6,008,183 Day of game expenses 7,536,286 6,749,070 Direct facilities, maintenance, and utilities 3,786,253 4,039,305 Advertising 2,680,090 1,728,355 Uniforms and supplies 6,211,463 6,204,882 Training table 2,861,425 2,558,318 Department relations 469,388 773,928 Banquets and special events 465,936 638,761 Depreciation 17,570,036 17,270,117 Noncapitalized equipment and repairs 1,695,413 2,545,820 Institutional overhead 1,858,774 1,747,945 Medical expenses 1,154,558 1,312,222 Fund-raising, marketing, and promotions 359,879 415,488 Recruiting 480,826 449,753 Equipment 456 3,845 Pac-12 Management Fee 7,300,000 — Other 8,374,208 7,934,182
Total operating expenses 120,090,750 110,126,612 Operating loss (40,911,311) (30,308,797)
Nonoperating revenues (expenses):Contributions 23,186,969 22,777,825 Investment expense on Invested Funds (94,981) (110,683) Investment income on Consolidated Endowment Fund (CEF) 2,896,718 2,024,433 (Loss) gain on investments (5,140,339) 2,704,298 Loss on disposal of capital assets (70,555) (34,046) University funded tuition waivers 1,986,414 3,895,000 Settlement agreement — 1,250,000 Financing Cost on Stadium and Ballpark (74) (2,565,509) Interest expense (12,382,682) (12,708,645)
Total nonoperating revenues 10,381,470 17,232,673 Loss before other revenues (30,529,841) (13,076,124)
Other revenues:Capital gifts 1,512,508 6,762,971 Gifts to permanent endowments 7,456,561 3,404,439
Total other revenues 8,969,069 10,167,410 Decrease in net position (21,560,772) (2,908,714)
Net position:Net position at beginning of year, as restated (note1(b)) 169,496,011 172,404,725 Net position at end of year $ 147,935,239 169,496,011
See accompanying notes to financial statements.
14

UNIVERSITY OF WASHINGTONDEPARTMENT OF INTERCOLLEGIATE ATHLETICS
Statements of Cash FlowsYears ended June 30, 2016 and 2015
2016 2015Cash flows from operating activities:
Gate ticket sales $ 25,837,851 24,430,570 NCAA/conference distributions 31,040,356 36,624,498 Sponsorships 8,532,083 7,571,283 Concessions and souvenirs 3,318,369 3,316,675 Trademarks and licensing 747,551 752,512 Facility income 1,747,210 1,721,865 Other 1,803,692 917,840 Payments to suppliers (43,283,831) (39,780,312) Payments to employees (32,454,119) (27,599,729) Payments for benefits (8,366,811) (6,923,213) Payments for scholarships (13,055,217) (11,961,836)
Net cash used in operating activities (24,132,866) (10,929,847) Cash flows from noncapital financing activities:
Contributions, excluding permanent endowments and capital 23,186,969 22,777,825 Contributions to permanent endowments 7,456,561 3,404,439 Settlement agreement 468,750 781,250 University funded tuition waivers 1,986,414 3,895,000
Net cash provided by noncapital financing activities 33,098,694 30,858,514 Cash flows from capital and related financing activities:
Capital gifts received 1,512,508 6,762,971 Proceeds from Internal Lending Program 7,512 4,176,075 Acquisition and construction of capital assets (1,803,457) (11,047,673) Financing cost paid on capital debt (74) (2,565,509) Principal paid on capital debt (5,450,995) (4,767,981) Interest paid on capital debt (12,239,461) (12,707,284)
Net cash used in capital and related financing activities (17,973,967) (20,149,401) Cash flows from investing activities:
Purchases of investments (7,891,465) (3,816,314) Sale of investments 10,619,819 — Investment income 2,803,094 1,912,392
Net cash provided by (used in) investing activities 5,531,448 (1,903,922) Net decrease in cash and cash equivalents (3,476,691) (2,124,656)
Cash and cash equivalents at beginning of year 8,736,190 10,860,846 Cash and cash equivalents at end of year $ 5,259,499 8,736,190 Reconciliation of operating loss to net cash used in operating activities:
Operating loss $ (40,911,311) (30,308,797) Adjustments to reconcile operating loss to net cash used in operating activities:
Depreciation expense 17,570,036 17,270,117 Pac-12 management fee payable increase 7,300,000 — Other changes in assets and liabilities:
Increase in accounts receivable (507,132) (261,006) (Increase) decrease in prepaid expenses (119,653) 35,445 (Decrease) increase in accounts payable (4,966,098) 3,173,822 Decrease in unearned income (351,930) (1,074,073) (Decrease) increase in accrued salaries and vacation payable (2,935,335) 1,486,387 Increase (decrease) in pension liability 771,227 (1,397,377) Increase in admissions taxes payable 17,330 145,635
Net cash used in operating activities $ (24,132,866) (10,929,847) Supplemental disclosure of noncash activities:
Donated supplies $ 2,700,000 2,623,669 Pac-12 Management Fee and Interest 7,444,598 —
See accompanying notes to financial statements.
15

UNIVERSITY OF WASHINGTON DEPARTMENT OF INTERCOLLEGIATE ATHLETICS
Notes to Financial Statements June 30, 2016 and 2015
16 (Continued)
(1) Organization and Summary of Significant Accounting Policies (a) Organization
The University of Washington Department of Intercollegiate Athletics (Department or ICA) is an auxiliary enterprise within the University of Washington (the University). The records of the Department are maintained as part of the general records of the University.
(b) Basis of Presentation The financial statements of the Department have been prepared in accordance with the Governmental Accounting Standards Board (GASB) Statement No. 34, Basic Financial Statements and Management s Discussion and Analysis for State and Local Governments, as amended by GASB Statement No. 35, Basic Financial Statements and Management s Discussion and Analysis for Public Colleges and Universities. The Department is reporting as a special purpose government engaged in business-type activities (BTA). In accordance with BTA reporting, the Department presents a management s discussion and analysis, statements of net position, statements of revenues, expenses, and changes in net position, statements of cash flows, and notes to the financial statements. The financial statements present only the University of Washington ICA and do not purport to, and do not, present fairly the financial position of the University of Washington, as of June 30, 2016 and 2015, the changes in its financial position, or its cash flows for the years then ended in accordance with U.S. generally accepted accounting principles. The financial statements are prepared using the economic resources measurement focus and the accrual basis of accounting. Under the accrual basis, revenues are recognized when earned, and expenses are recorded when an obligation has been incurred. The Department reports capital assets net of accumulated depreciation (as applicable) and reports depreciation expense in the statements of revenues, expenses, and changes in net position. On July 1, 2014, ICA adopted GASB Statement No. 68, Accounting and Financial Reporting for Pensions. This Statement requires governments providing defined benefit pensions to their employees to recognize their long-term obligation for pension benefits as a liability for the first time, along with the associated assets, which have been set aside to fund the plan. Since the University participates in several cost sharing pension plans, which are administered by the state of Washington Department of Retirement Systems (DRS), this statement will require the University to recognize its proportionate share of the statewide net pension liability or net pension asset for each of the plans in which it participates. The Statement also eliminates the method of amortizing the liability balances over several years and instead requires full recognition of the net liability upon implementation. Implementation of this standard resulted in the restatement of beginning fiscal year 2015 unrestricted net position reducing it by $4,432,149. The proportionate share of the state s collective pension amounts are disclosed in note 8.

UNIVERSITY OF WASHINGTON DEPARTMENT OF INTERCOLLEGIATE ATHLETICS
Notes to Financial Statements June 30, 2016 and 2015
17 (Continued)
With the adoption of GASB Statement No. 68, net position was restated at July 1, 2014. Below is a reconciliation of the total net position as previously reported at June 30, 2014, to the restated net position. Net position at June 30, 2014, as previously reported $ 176,836,874Effect of accounting change (4,432,149)Net position at July 1, 2014, as restated $ 172,404,725
(c) Capital Assets Expenditures for equipment and repairs that represent normal replacement of such equipment and routine maintenance of the buildings are expensed as incurred. Capital expenditures for facilities and equipment funded by the Department are reflected as capital assets on the Department s statements of net position. Buildings and equipment are stated at cost, or if acquired by gift, at fair market value at the date of the gift. Additions, replacements, major repairs, and renovations are capitalized. Depreciation is computed using the straight-line method over the estimated useful lives of the assets, generally 15 50 years for building components, 20 50 years for infrastructure and land improvements, and 5 7 years for equipment.
(d) Advances to University for Capital Projects Advances to University for capital projects represent the difference between the cash paid and the expenditures incurred by the University for various capital projects that are in process at year-end, which ICA expects to expense or capitalize in the next fiscal year.
(e) Unearned Income Funds received from the sale of tickets (which could be shared with visiting teams) for games to be played subsequent to June 30, 2016 and 2015 are unearned. The Department s share of such receipts is recognized as income in the period in which the games are played, less any amount owed to visiting teams. At June 30, 2016 and 2015, unearned income consist of the following:
2016 2015Advance sales of football tickets $ 15,769,650 16,431,360
1,006,994 296,390Other unearned income 665,481 1,066,305
$ 17,442,125 17,794,055
(f) Operating Activities The Department defines operating activities, as reported on the Statement of Revenues, Expenses and Changes in Net Position, as those that generally result from exchange transactions, such as payments received for providing goods and services and payments made for goods and services received. Certain

UNIVERSITY OF WASHINGTON DEPARTMENT OF INTERCOLLEGIATE ATHLETICS
Notes to Financial Statements June 30, 2016 and 2015
18 (Continued)
other revenues used for operations, such as contributions, University funded tuition waivers and investment income, are recorded as nonoperating revenues.
(g) Contributions Contributions are recorded as income when all conditions have been met.
(h) Sponsorships Sponsorships revenue for donated advertising and supplies is recognized as an exchange transaction and is recorded in income when the related advertising or supplies are received. The Department recorded $5.4 million and $4.3 million in sponsorship revenue for these transactions in the years ended June 30, 2016 and 2015, respectively.
(i) Income Taxes As a part of the University, the Department is exempt from federal income taxes, except to the extent of unrelated business taxable income. Unrelated business tax was not significant to the financial statements taken as a whole at June 30, 2016 and 2015.
(j) Use of Estimates The preparation of financial statements in conformity with accounting principles generally accepted in the United States requires management to make estimates and assumptions that affect the reported amounts of assets and liabilities and disclosure of contingent assets and liabilities at the date of the financial statements and the reported amounts of revenue and expenses during the reporting period. Actual results could differ from those estimates.
(2) Cash in the University of Washington Invested Funds Pool The Department s cash and investments are managed by the University through the Treasurer of the Board of Regents. Pooled Investments held on behalf of ICA by the University of Washington are recorded at ICA s share of the carrying value of the University of Washington Cash and Liquidity Pools. The Cash and Liquidity Pools were invested as follows at June 30:
2016 2015Cash and cash equivalents 6.4% 10.0%Treasuries and agencies 73.0 67.0Mortgage related securities 8.6 9.0Asset-backed debt securities 7.0 12.0Corporate and other fixed income 5.0 2.0
Total 100.0% 100.0%

UNIVERSITY OF WASHINGTON DEPARTMENT OF INTERCOLLEGIATE ATHLETICS
Notes to Financial Statements June 30, 2016 and 2015
19 (Continued)
Financial instruments that subject ICA to concentrations of credit risk consist of pooled investments held on behalf of ICA at the University of Washington.
(3) Investments The Department purchases or sells units in the University s Consolidated Endowment Fund (CEF) on the basis of a per unit valuation of the CEF at fair value on the last business day of the calendar quarter. Income is distributed by the University based on the number of units held. The Department records its permanent endowments at fair value. Net appreciation/depreciation in the fair value is recorded as gain or loss on investments in the statements of revenue, expenses, and changes in net assets. For the investment portion of the CEF funds, the principal balance can be withdrawn at the end of each quarter. The Department earned investment income on these investment funds based on the performance of the University s CEF funds net of investment management and University administrative fees. The total return on the investments portion of the CEF funds for the years ended June 30, 2016 and 2015 was approximately 1.6% and 6.8%, respectively. During fiscal year 2011, the Board of Regents adopted a long-term spending policy for the CEF replacing the interim spending policy, which was effective in fiscal year 2010. Under the current policy, quarterly distributions to programs are based on an annual percentage rate of 4.0%, applied to the five-year rolling average of the CEF s market valuation. The current policy became effective with the December 2010 quarterly distributions with the five-year averaging period implemented incrementally. The administrative fee of 1.0% supporting campuswide fund-raising and stewardship activities (0.8%) and offsetting the internal cost of managing endowment assets (0.2%) continues, but is now based on a five-year average value similar to program distributions. The Department s endowments represent 2.7% and 2.8% of the CEF balance as of June 30, 2016 and 2015, respectively. At June 30, 2016 and 2015, the fund balance of the Endowment and Expendable Endowment funds stated at fair value comprised the following:
2016 2015Expendable endowments:
Graham* $ 402,717 429,923Spence* 592,382 632,402
Endowments (including expendable gains) 62,491,588 58,827,158Total $ 63,486,687 59,889,483
* Expenditure of principal is permitted under certain circumstances.
The Department received $7,456,561 and $3,404,439 in endowment gifts in 2016 and 2015, respectively, which is invested in the CEF.

UNIVERSITY OF WASHINGTON DEPARTMENT OF INTERCOLLEGIATE ATHLETICS
Notes to Financial Statements June 30, 2016 and 2015
20 (Continued)
(4) Capital Assets Capitalized asset activity for the years ended June 30, 2016 and 2015 is summarized as follows:
Balance at Balance atJune 30, Additions/ June 30,
2015 (transfers) Retirements 2016Buildings $ 449,735,331 1,925,896 451,661,227Furniture, fixtures, and
equipment 14,031,250 1,254,349 (867,929) 14,417,670Construction in progress* 1,695,602 (1,221,004) 474,598
Total 465,462,183 1,959,241 (867,929) 466,553,495Less accumulated depreciation:
Buildings 91,810,818 14,797,584 106,608,402Furniture, fixtures and
equipment 9,585,638 2,772,452 (797,374) 11,560,716Total accumulated
depreciation 101,396,456 17,570,036 (797,374) 118,169,118Capital assets, net $ 364,065,727 (15,610,795) (70,555) 348,384,377
* Nondepreciable
Balance at Balance atJune 30, Additions/ June 30,
2014 (transfers) Retirements 2015Buildings $ 447,756,688 1,978,643 449,735,331Furniture, fixtures, and
equipment 13,338,433 969,804 (276,987) 14,031,250Construction in progress* 1,604,339 91,263 1,695,602
Total 462,699,460 3,039,710 (276,987) 465,462,183Less accumulated depreciation:
Buildings 77,120,405 14,690,413 91,810,818Furniture, fixtures and
equipment 7,248,875 2,579,704 (242,941) 9,585,638Total accumulated
depreciation 84,369,280 17,270,117 (242,941) 101,396,456Capital assets, net $ 378,330,180 (14,230,407) (34,046) 364,065,727
* Nondepreciable

UNIVERSITY OF WASHINGTON DEPARTMENT OF INTERCOLLEGIATE ATHLETICS
Notes to Financial Statements June 30, 2016 and 2015
21 (Continued)
(5) Internal Lending Program In February 2012, ICA began drawing money from the ILP for the costs related to renovating Husky Stadium. The Board of Regents at their November 18, 2010 meeting approved ICA to use the ILP for up to $250 million in project and capitalized interest costs for the renovation of Husky Stadium. On November 11, 2011, the Board of Regents approved to increase ICA s use of the ILP to $261.5 million for the costs of renovating Husky Stadium and adding a Sports Medicine and Sport Performance Center. Any amounts drawn from the ILP greater than $261.5 million will be funded by the Department. At the end of June 2016, ICA has a remaining principal balance of $251.8 million payable to the ILP relating to the construction of the Husky Stadium renovation and Husky Ballpark. The purpose of the ILP is to lower the University s overall cost of capital and provide internal borrowing units with a stable and predictable borrowing rate. The ILP will make loans to internal borrowers at a uniform internal lending rate. These loans will be funded through the issuance of University General Revenue bonds and notes. ILP program policies include a provision for a rate stabilization reserve and a provision for rate adjustments if necessary. Under the terms of the ILP, rate adjustments will apply to all outstanding debt obligations, including debt issued prior to the ILP implementation. The ILP lending rate will be reviewed annually, and a preliminary indication of a rate adjustment will be announced to ILP participants 12 months in advance of the effective date. Final rate adjustments require approval by the Board of Regents. Future principal and interest payments due through maturity dates are as follows:
Principal InterestYears ending June 30:
2017 $ 3,308,198 11,317,6522018 4,055,285 11,098,9222019 4,321,143 10,912,5812020 4,519,655 10,714,0692021 4,727,287 10,506,435Thereafter 230,898,169 141,786,714
$ 251,829,737 196,336,373

UNIVERSITY OF WASHINGTON DEPARTMENT OF INTERCOLLEGIATE ATHLETICS
Notes to Financial Statements June 30, 2016 and 2015
22 (Continued)
Internal Lending Program activity for the years ended June 30, 2016 and 2015 is summarized as follows: Balance as of June 30, 2015 $ 255,797,422
Additions 7,512Reductions (3,975,197)
Balance as of June 30, 2016 $ 251,829,737
Balance as of June 30, 2014 $ 254,940,379Additions 4,176,075Reductions (3,319,032)
Balance as of June 30, 2015 $ 255,797,422
(6) Capital Lease Future minimum lease payments under capital lease and the present value of the net minimum lease payments as of June 30, 2016 are as follows:
Futurepayments
Years ending June 30:2017 $ 1,605,8082018 1,077,4492019 997,9342020 997,9342021 997,934Thereafter 1,995,866
Total minimum leasepayments 7,672,925
Less amount representing interest cost 559,161Present value of minimum
payments $ 7,113,764
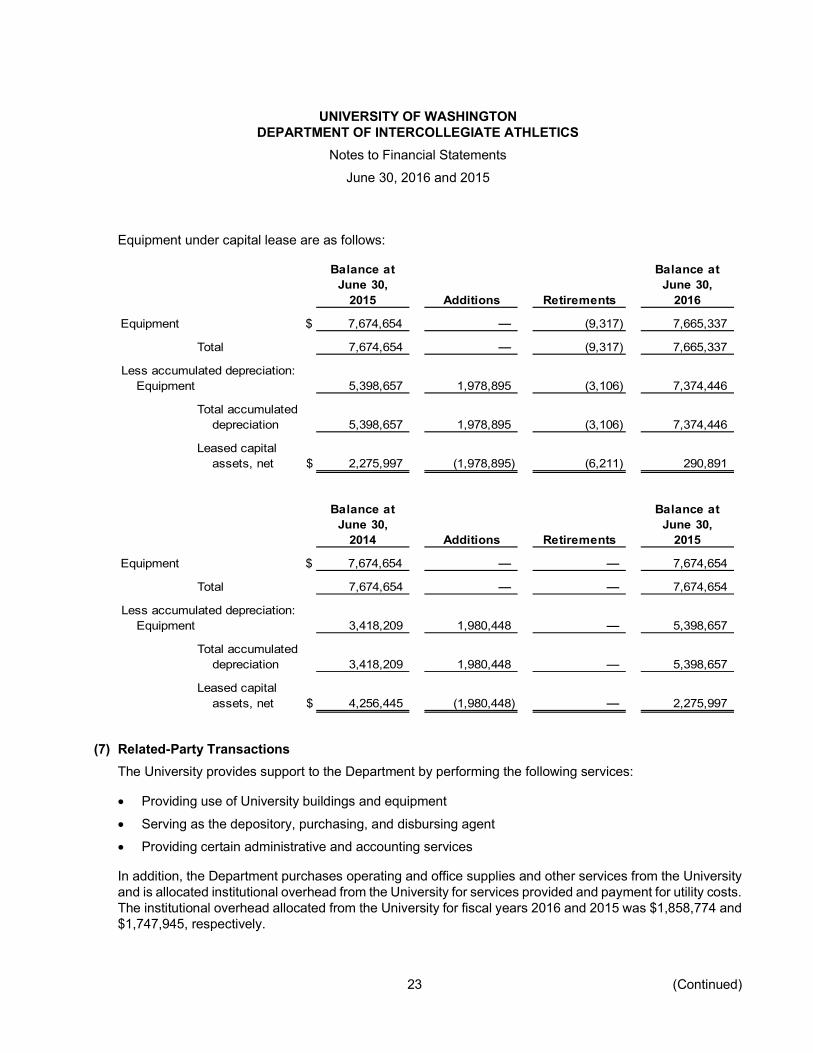
UNIVERSITY OF WASHINGTON DEPARTMENT OF INTERCOLLEGIATE ATHLETICS
Notes to Financial Statements June 30, 2016 and 2015
23 (Continued)
Equipment under capital lease are as follows: Balance at Balance at
June 30, June 30,2015 Additions Retirements 2016
Equipment $ 7,674,654 (9,317) 7,665,337Total 7,674,654 (9,317) 7,665,337
Less accumulated depreciation:Equipment 5,398,657 1,978,895 (3,106) 7,374,446
Total accumulateddepreciation 5,398,657 1,978,895 (3,106) 7,374,446
Leased capitalassets, net $ 2,275,997 (1,978,895) (6,211) 290,891
Balance at Balance atJune 30, June 30,
2014 Additions Retirements 2015Equipment $ 7,674,654 7,674,654
Total 7,674,654 7,674,654Less accumulated depreciation:
Equipment 3,418,209 1,980,448 5,398,657Total accumulated
depreciation 3,418,209 1,980,448 5,398,657Leased capital
assets, net $ 4,256,445 (1,980,448) 2,275,997
(7) Related-Party Transactions The University provides support to the Department by performing the following services: Providing use of University buildings and equipment Serving as the depository, purchasing, and disbursing agent Providing certain administrative and accounting services
In addition, the Department purchases operating and office supplies and other services from the University and is allocated institutional overhead from the University for services provided and payment for utility costs. The institutional overhead allocated from the University for fiscal years 2016 and 2015 was $1,858,774 and $1,747,945, respectively.

UNIVERSITY OF WASHINGTON DEPARTMENT OF INTERCOLLEGIATE ATHLETICS
Notes to Financial Statements June 30, 2016 and 2015
24 (Continued)
The Department is covered by the University s self-insurance program and is responsible for the first $100,000 of costs in general, automobile, and employment practices liability claims. Payments over $100,000 are covered by the University s self-insurance program and excess carriers, except that in claims related to coaches contracts or the acts of trainers and non-University physicians to the athletes medical services program, all costs are the exclusive responsibility of the Department.
(8) Pension Plans (a) Pension Plans
The University offers several contributory pension plans administered by the Washington State Department of Retirement Systems. ICA has employees in the Public Employee s Retirement System plan, which is a defined-benefit retirement plan. The University of Washington Retirement Plan (UWRP), a defined contribution plan, is administered by the University. The University of Washington Supplemental Retirement Plan, a noncontributory defined benefit pension plan, which operates in tandem with the UWRP, is closed to new participants.
(b) Plan Descriptions of the DRS Plans Public Employees Retirement System PERS retirement benefit provisions are contained in chapters 41.34 and 41.40 of the Revised Code of Washington (RCW). PERS is a cost-sharing multiple-employer retirement system comprised of three separate pension plans for membership purposes. PERS Plan 1 and PERS Plan 2 are defined benefit plans, and PERS Plan 3 is a defined benefit plan with a defined contribution component. PERS members include higher education employees not participating in other higher education retirement programs. For accounting purposes, PERS is reported as three separate plans. Plan 1 accounts for the defined benefits of Plan 1 members, Plan 2/3 accounts for the defined benefits of Plan 2 and Plan 3 members, and Plan 3 accounts for the defined contribution portion of Plan 3 members. The defined benefit portions of Plan 2 and Plan 3 are accounted for in the same pension trust fund, and all assets of Plan 2/3 may legally be used to pay the defined benefits of any of the Plan 2 or Plan 3 members or beneficiaries.
(c) Vesting and Benefits Provided PERS Plan 1 PERS Plan 1 provides retirement, disability and death benefits. The plan is closed to new entrants. All members were vested after the completion of five years of eligible service. Retirement benefits are determined as two percent of the member s average final compensation (AFC) times the member s years of service. The AFC is the average of the member s 24 highest-paid consecutive service months. The retirement benefit may not exceed 60% of the AFC.
UNIVERSITY OF WASHINGTON DEPARTMENT OF INTERCOLLEGIATE ATHLETICS
Notes to Financial Statements June 30, 2016 and 2015
25 (Continued)
Members are eligible for retirement from active status at any age with at least 30 years of service, at age 55 with at least 25 years of service, or at age 60 with at least five years of service. Members retiring from inactive status prior to the age of 65 may receive actuarially reduced benefits. Other benefits include duty and nonduty disability payments, an optional cost-of living allowance (COLA), and a one-time duty-related death benefit, if the member is found eligible by the Washington State Department of Labor and Industries. PERS Plan 2/3 PERS Plan 2/3 provides retirement, disability and death benefits. PERS Plan 2 members are vested after completion of five years of eligible service. PERS Plan 3 members are vested in the defined benefit portion of their plan after 10 years of service, or after five years of service if 12 months are earned after age 44. Retirement benefits are determined as two percent of the member s AFC times the member s years of service for Plan 2, and one percent of AFC times the member s years of service for Plan 3. The AFC is the monthly average of the member s 60 highest-paid consecutive service months. There is no cap on years of service credit. Members are eligible for retirement with a full benefit at age 65 with at least five years of service credit. Retirement before age 65 is considered early retirement. Members are eligible for early retirement with a reduced benefit at age 55 with at least 20 years of service credit. The benefit is reduced by a factor that varies according to age, for each year before age 65. Members who are age 55 with at least 30 years of service credit can retire under one of two provisions, if hired prior to May 1, 2013: With a benefit that is reduced by 3% for each year before age 65; or With a benefit that has less, or no, reduction (depending on age) but imposes stricter return-to-work
rules If hired on or after May 1, 2013, members have the option to receive a benefit that is reduced by 5% for each year before age 65. Retirement benefits are actuarially reduced to reflect the choice of a survivor benefit. Other benefits include duty and nonduty disability payments, a cost-of-living allowance (based on the Consumer Price Index) capped at three percent annually, and a one-time duty-related death benefit, if the member is found eligible by the Washington State Department of Labor and Industries.

UNIVERSITY OF WASHINGTON DEPARTMENT OF INTERCOLLEGIATE ATHLETICS
Notes to Financial Statements June 30, 2016 and 2015
26 (Continued)
(d) Fiduciary Net Position The pension plans fiduciary net positions have been determined on the same basis as they are reported by the pension plans. DRS financial statements have been prepared in conformity with generally accepted accounting principles (GAAP). The retirement plans are accounted for in pension trust funds using the flow of economic resources measurement focus and the accrual basis of accounting. Member contributions are recognized as revenues in the period in which the contributions are earned. Employer contributions are recognized when due, and the employer has made a formal commitment to provide the contributions. Benefits and refunds are recognized when due, and payable in accordance with the terms of each plan. The RCW (Chapter 43.33 A) authorizes the Washington State Investment Board (WSIB) to have the investment management responsibility for the pension funds. Investments are reported at fair value, and unrealized gains and losses are included as investment income in the Statement of Changes in Fiduciary Net Position presented in the DRS Comprehensive Annual Financial Report. Purchases and sales of investments are recorded on a trade-date basis. DRS publishes an annual report for retirement plans, which is available at: http://www.drs.wa.gov/administration/annual-report/.
(e) Actuarial Assumptions Accounting requirements dictate the use of assumptions to best estimate the impact that pension obligations will have on ICA. The professional judgments used in determining these assumptions are important, and can significantly impact the resulting actuarial estimates. Differences between actual results compared to these assumptions could have a significant effect on the ICA s financial statements. The total pension liability for each DRS plan was determined by an actuarial valuation, conducted by the Washington State Office of the State Actuary (OSA). ICA s 2016 pension liability is based on an OSA valuation performed as of June 30, 2014, with the results rolled forward to the measurement date of June 30, 2015. Likewise, ICA s 2015 pension liability is based on the valuation performed as of June 30, 2013, with results rolled forward to the measurement date of June 30, 2014. The following actuarial assumptions have been applied to all prior periods included in the measurement: Inflation 3.0% total economic inflation, 3.75% salary inflationSalary increase Expected to grow by promotions and longevity in addition to
salary inflation assumptionInvestment rate of return 7.50%
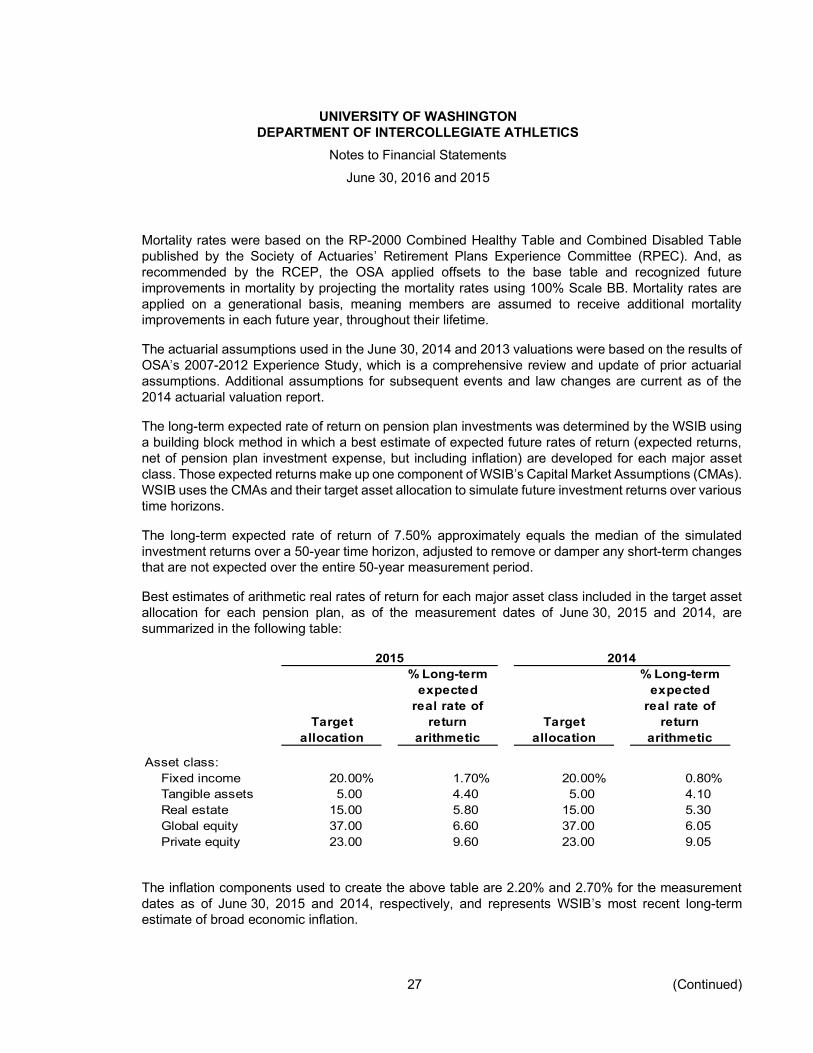
UNIVERSITY OF WASHINGTON DEPARTMENT OF INTERCOLLEGIATE ATHLETICS
Notes to Financial Statements June 30, 2016 and 2015
27 (Continued)
Mortality rates were based on the RP-2000 Combined Healthy Table and Combined Disabled Table published by the Society of Actuaries Retirement Plans Experience Committee (RPEC). And, as recommended by the RCEP, the OSA applied offsets to the base table and recognized future improvements in mortality by projecting the mortality rates using 100% Scale BB. Mortality rates are applied on a generational basis, meaning members are assumed to receive additional mortality improvements in each future year, throughout their lifetime. The actuarial assumptions used in the June 30, 2014 and 2013 valuations were based on the results of OSA s 2007-2012 Experience Study, which is a comprehensive review and update of prior actuarial assumptions. Additional assumptions for subsequent events and law changes are current as of the 2014 actuarial valuation report. The long-term expected rate of return on pension plan investments was determined by the WSIB using a building block method in which a best estimate of expected future rates of return (expected returns, net of pension plan investment expense, but including inflation) are developed for each major asset class. Those expected returns make up one component of WSIB s Capital Market Assumptions (CMAs). WSIB uses the CMAs and their target asset allocation to simulate future investment returns over various time horizons. The long-term expected rate of return of 7.50% approximately equals the median of the simulated investment returns over a 50-year time horizon, adjusted to remove or damper any short-term changes that are not expected over the entire 50-year measurement period. Best estimates of arithmetic real rates of return for each major asset class included in the target asset allocation for each pension plan, as of the measurement dates of June 30, 2015 and 2014, are summarized in the following table:
2015 2014% Long-term % Long-term
expected expectedreal rate of real rate of
Target return Target returnallocation arithmetic allocation arithmetic
Asset class:Fixed income 20.00% 1.70% 20.00% 0.80%Tangible assets 5.00 4.40 5.00 4.10Real estate 15.00 5.80 15.00 5.30Global equity 37.00 6.60 37.00 6.05Private equity 23.00 9.60 23.00 9.05
The inflation components used to create the above table are 2.20% and 2.70% for the measurement dates as of June 30, 2015 and 2014, respectively, and represents WSIB s most recent long-term estimate of broad economic inflation.

UNIVERSITY OF WASHINGTON DEPARTMENT OF INTERCOLLEGIATE ATHLETICS
Notes to Financial Statements June 30, 2016 and 2015
28 (Continued)
(f) Discount Rate The discount rate used to measure the total pension liabilities as of June 30, 2016 and 2015 was 7.50%. The projection of cash flows used to determine the discount rate assumed that contributions from plan members will be made at contractually required rates, and that contributions from employers will be made at statutorily required rates, actuarially determined (including the component of PERS 2/3 and TRS 2/3 employer rates pertaining to the unfunded actuarial accrued liabilities for PERS 1 and TRS 1, respectively). Based on those assumptions, the fiduciary net position for each pension plan in which ICA participates was projected to be sufficient to make all projected future benefit payments of the current plan members. Therefore, the long-term expected rate of return on pension plan investments was applied to all periods of projected benefit payments to determine the total pension liability. Using the WSIB long-term expected rate of return, a 7.50% future investment rate of return on pension plan investments was assumed for the test. The expected return on plan assets is the estimated long-term rate of return that will be earned on the investments used to fund the pension obligation. Contributions from plan members and employers were assumed to continue to be made at contractually required rates (including the component of PERS 2/3 and TRS 2/3 employer rates pertaining to the unfunded actuarial accrued liabilities for PERS 1 and TRS 1, respectively, as provided for in Chapter 41.45 of the RCW).
(g) Sensitivity of the Net Pension Liability (Asset) to Changes in the Discount Rate The following table presents the ICA s net pension liability calculated using the discount rate of 7.50%, as well as what the net pension liability would be if it were calculated using a discount rate that is 1-percentage-point lower (6.50%) or 1-percentage-point higher (8.50%) than the current rate.
(Dollars in thousands)2016 2015
Current Current1% Decrease discount rate 1% Increase 1% Decrease discount rate 1% Increase
Plan:PERS 1 $ 3,220 2,645 2,150 3,139 2,547 2,038PERS 2/3 6,243 2,135 (1,010) 5,067 1,215 (1,728)

UNIVERSITY OF WASHINGTON DEPARTMENT OF INTERCOLLEGIATE ATHLETICS
Notes to Financial Statements June 30, 2016 and 2015
29 (Continued)
(h) Employer Contribution Rates Employer contribution rates are developed in accordance with Chapter 41.45 of the RCW by the OSA, and include an administrative expense component that is currently set at 0.18%. The statute provides authority to the Pension Funding Council to adopt changes to economic assumptions and contribution rates. The contribution rates and required contributions for each DRS plan in which ICA participates are shown in the table below.
Description PERS Plan 1 PERS Plan 2 /3i(Dollars in thousands)
Contributions as June 30, 2016:Contribution Rate 11.18% 11.18%Contributions made $ 264 327
Contributions as June 30, 2015:Contribution Rate 9.21% 9.21%Contributions made $ 231 263
i. Plan 2/3 employer rate includes a component to address the Plan 1 unfunded actuarial accrued
liability (i) ICA Proportionate Share
Collective pension amounts are determined as of a measurement date, which can be no earlier than an employer s prior fiscal year. The measurement date for the net pension liabilities recorded by ICA as of June 30, 2016 was June 30, 2015. Employer contributions received and processed by DRS during the fiscal year ended June 30, 2015 have been used as the basis for determining each employer s proportionate share of the collective pension amounts reported by DRS in their June 30, 2015 Schedules of Employer and Nonemployer Allocations. Likewise, the measurement date for the net pension liabilities recorded by ICA as of June 30, 2015 was June 30, 2014, with employer contributions received and processed by DRS during fiscal year 2014 used as the basis for determining each employer s proportionate share of the June 30, 2014 collective pension amounts. ICA s proportionate share for each DRS plan is shown in the table below.
Proportionate SharePERS 1 PERS 2/3
Plan:Year ended June 30, 2015 0.051% 0.060%Year ended June 30, 2016 0.051 0.060

UNIVERSITY OF WASHINGTON DEPARTMENT OF INTERCOLLEGIATE ATHLETICS
Notes to Financial Statements June 30, 2016 and 2015
30 (Continued)
(j) ICA Aggregated Balances ICA s aggregated balances of net pension liabilities and net pension asset as of June 30, 2016 and 2015, respectively, are presented in the table below.
Plan PERS 1 PERS 2/3 Total(Dollars in thousands)
June 30 , 2016:Net pension liability $ 2,645 2,135 4,780
June 30 , 2015:Net pension liability 2,547 1,215 3,762
(k) Pension Expense, Deferred Outflows of Resources and Deferred Inflows of Resources
The tables below summarize ICA s pension expense, deferred outflows of resources and deferred inflows of resources related to the DRS pension plans, together with the related future year impacts to pension expense from amortization of those deferred amounts. Note that deferred outflows of resources related to ICA s contributions subsequent to the measurement date are recognized as a reduction of the net pension liability in the following year, and are not amortized to pension expense.
Proportionate share of pension expenseDescription PERS plan 1 PERS plan 2 /3 Total
(Dollars in thousands)As of June 30, 2016 $ 155 316 471As of June 30, 2015 441 262 703

UNIVERSITY OF WASHINGTON DEPARTMENT OF INTERCOLLEGIATE ATHLETICS
Notes to Financial Statements June 30, 2016 and 2015
31 (Continued)
Deferred Outflows of ResourcesDescription PERS 1 PERS 2/3 Total
(Dollars in thousands)June 30, 2016:
Change in assumptions $ 3 3Difference between expected and
actual experience 227 227proportionate share 153 153
ICA contributionssubsequent to the measurementdate of the collective netpension liabilitya 264 327 591
Total $ 264 710 974June 30, 2015:
proportionate share $ 233 233ICA contributions
subsequent to the measurementdate of the collective netpension liability 231 263 494
Total $ 231 496 727a. Amounts will be recognized as a reduction of the net position liability as of June 30, 2017

UNIVERSITY OF WASHINGTON DEPARTMENT OF INTERCOLLEGIATE ATHLETICS
Notes to Financial Statements June 30, 2016 and 2015
32 (Continued)
Deferred Inflows of ResourcesDescription PERS 1 PERS 2 /3 Total
(Dollars in thousands)June 30, 2016:
Difference between projected andactual earnings on planinvestments, net $ 145 570 715
Total $ 145 570 715June 30, 2015:
Difference between projected andactual earnings on planinvestments, net $ 318 1,288 1,606
Total $ 318 1,288 1,606 Description PERS Plan 1 PERS Plan 2/3 Total
(Dollars in thousands)Deferred outflows of resources related
to the measurement date that will berecognized as a reduction of the netpension liability as of June 30, 2017 $ 264 327 591
Deferred outflows of resources relatedto the measurement date that will berecognized as a reduction of the netpension liability as of June 30, 2016 $ 231 263 494

UNIVERSITY OF WASHINGTON DEPARTMENT OF INTERCOLLEGIATE ATHLETICS
Notes to Financial Statements June 30, 2016 and 2015
33
Amounts reported as deferred outflows of resources, as of June 30, 2016, exclusive of contributions made after the measurement date, and deferred inflows of resources will be recognized in pension expense as follows:
Amortization of deferred inflows anddeferred outflows of resources
Year PERS Plan 1 PERS Plan 2/3 Total(Dollars in thousands)
2017 $ (56) (92) (148)2018 (56) (92) (148)2019 (56) (126) (182)2020 23 123 146
Total $ (145) (187) (332)
(l) University of Washington Retirement Plan (403b) Faculty, librarians and professional staff are eligible to participate in the University of Washington Retirement Plan, a 403(b) defined-contribution plan administered by the University. The Department has staff participating in these plans. 403(b) Plan Description Contributions to the plan are invested by participants in annuity contracts or mutual fund accounts offered by one or more fund sponsors. Employees have at all times a 100% vested interest in their accumulations. Benefits from the plan are available upon separation or retirement at the member’s option. RCW 28B.10.400 et. seq. assigns the authority to the University of Washington Board of Regents to establish and amend benefit provisions. 403(b) Funding Policy Employee contribution rates, based on age, are 5%, 7.5% or 10% of salary. The University matches the contributions of employees. Within parameters established by the legislature, contribution requirements may be established or amended by the University of Washington Board of Regents
(m) University of Washington Supplemental Retirement Plan (401a) The University of Washington Supplemental Retirement Plan (UWSRP), a 401(a) defined-benefit retirement plan, operates in tandem with the 403(b) plan to supplement the expected defined contribution retirement savings accumulated under the UWRP. The UWSRP was closed to new participants effective March 1, 2011. The Department has staff participating in this plan.
(9) Commitments and Contingencies The Department is subject to various claims and lawsuits that are covered by the University’s self-insurance fund, subject to a deductible of $100,000 per occurrence.
(10) Subsequent Events The interest rate changed from 4.75% to 4.50% effective July 1, 2016 for the ILP.

Schedule 1 UNIVERSITY OF WASHINGTON
DEPARTMENT OF INTERCOLLEGIATE ATHLETICS Schedules of Required Supplementary Information
June 30, 2016 Unaudited
34 (Continued)
Schedule of Proportionate Share of the Net Pension Liability(as of measurement date, the prior fiscal year end)
PERS 1(Dollar amounts in thousands)
2015 2016
pension liability 0.051% 0.051%net pension liability $ 2,547 2,645
155 136net pension liability as a percentage of covered-employeepayroll 1,644.30% 1,950.99%
Plan fiduciary net position as a percentage of the totalpension liability 61.19% 59.10%
Schedule of Contributions
(as of current fiscal year end)PERS 1
(Dollar amounts in thousands)2015 2016
Contractually required contribution $ 12 12Contributions in relation to the contractually required
contribution 12 12Contribution deficiency (excess)
136 107Contributions as a percentage of covered-employee payroll 9.21% 11.08%
See accompanying notes to schedules of required supplementary information.

Schedule 1 UNIVERSITY OF WASHINGTON
DEPARTMENT OF INTERCOLLEGIATE ATHLETICS Schedules of Required Supplementary Information
June 30, 2016 Unaudited
35
Schedule of Proportionate Share of the Net Pension Liability(as of measurement date, the prior fiscal year end)
PERS 2/3(Dollar amounts in thousands)
2015 2016
pension liability 0.060% 0.060%net pension liability $ 1,215 2,135
5,147 5,302net pension liability as a percentage of covered-employeepayroll 23.60% 40.27%
Plan fiduciary net position as a percentage of the totalpension liability 93.29% 89.20%
Schedule of Contributions
(as of current fiscal year end)PERS 2/3
(Dollar amounts in thousands)2015 2016
Contractually required contribution $ 488 588Contributions in relation to the contractually required
contribution 488 593Contribution deficiency (excess) (5)
5,302 5,295Contributions as a percentage of covered-employee payroll 9.21% 11.10%
See accompanying notes to schedules of required supplementary information.
s

UNIVERSITY OF WASHINGTON DEPARTMENT OF INTERCOLLEGIATE ATHLETICS
Notes to Schedules of Required Supplementary Information June 30, 2016
Unaudited
36
Notes to Schedules of Required Supplementary Information (Unaudited) for the Year Ended June 30, 2016 The Office of the State Actuary (OSA) calculates the actuarially determined contributions (ADC) based on the results of an actuarial 41.45 RCW.
-rate adoption process, the results of an actuarial valuation with an odd-numbered year valuation date determine the ADC for the biennium that ensues two years later. For example, the actuarial valuation with a June 30, 2013, valuation date, completed in the fall of 2014, determines the ADC for the period beginning July 1, 2015, and ending June 30, 2017.

Sche
dule 2
UNIVE
RSITY
OF W
ASHIN
GTON
DEPA
RTME
NT OF
INTE
RCOL
LEGIA
TE AT
HLET
ICSOp
erating
and O
ther R
evenue
by Sp
ecific
Funct
ionYe
ar end
ed Jun
e 30, 2
016
Men’s
Men’s
Wome
n’sOth
er sp
orts
Admi
nistra
tion
footba
llba
sketba
llba
sketba
llMe
n’sWo
men’s
and o
ther
Total
Gate t
icket s
ales re
venue:
Ticket
sales
for ho
me ev
ents
$22,
487,65
0 2,6
64,698
218
,342
240,62
2 670
,098
—
26,281
,410
Admis
sion ta
xes(1,
071,16
5) (12
6,792)
(10
,441)
(11,48
1) (31
,951)
—
(1,251
,830)
Ticket
-proce
ssing
fees
277,89
4 44,
342
3,233
4,0
41
22,101
—
351
,611
21,694
,379
2,582,
248
211,13
4 233
,182
660,24
8 —
25,
381,19
1 Un
iversit
y’s sh
are of
gate r
evenue
for aw
ay gam
es350
,000
150,00
0 —
13,
760
4,240
—
518
,000
Total
gate ti
cket sa
les re
venue
22,044
,379
2,732,
248
211,13
4 246
,942
664,48
8 —
25,
899,19
1 NC
AA/co
nferen
ce dis
tributio
ns:PA
C-12 te
levisio
n shar
e16,
156,55
9 2,6
88,275
—
—
—
—
18,
844,83
4 PA
C-12 r
ose/oth
er bow
l share
s6,6
51,209
—
—
—
—
—
6,6
51,209
Bo
wl Pa
rticipa
tion867
,000
—
—
—
—
—
867,00
0 NC
AA MB
B tour
nament
—
1,163,
833
—
—
—
—
1,163,
833
Footb
all Pa
c-12 C
hampio
nship G
ame
231,08
3 —
—
—
—
—
231
,083
MBB P
AC-12
tourna
ment
—
(27,49
9) —
—
—
—
(27
,499)
Pac-1
2 Netw
ork Sh
are1,6
83,213
297
,037
—
—
—
—
1,980,
250
Other
—
—
—
—
—
1,843,
725
1,843,
725
Total
NCAA
/confe
rence
distrib
utions
25,589
,064
4,121,
646
—
—
—
1,843,
725
31,554
,435
Royal
ties, ad
vertise
ments
, and s
ponsor
ships:
Spons
orship
s5,0
00
—
10,000
36,
161
79,931
8,4
23,800
8,5
54,892
Do
nated
advert
ising
—
—
—
—
—
2,680,
090
2,680,
090
Tradem
arks a
nd lice
nsing
—
—
—
—
—
725,56
5 725
,565
Donat
ed sup
plies
878,20
0 176
,000
168,00
0 574
,540
750,26
0 153
,000
2,700,
000
Total
royalti
es, ad
vertise
ments
, and s
ponsor
ships
883,20
0 176
,000
178,00
0 610
,701
830,19
1 11,
982,45
5 14,
660,54
7 Co
ntribu
tions
17,334
,735
3,299,
147
102,62
0 665
,334
633,57
7 1,1
51,556
23,
186,96
9 Ca
pital gi
fts—
—
—
—
—
1,5
12,508
1,5
12,508
Gif
ts to p
ermane
nt endo
wment
s—
—
—
—
—
7,4
56,561
7,4
56,561
Los
s on in
vestme
nts—
—
—
—
—
(5,
140,33
9) (5,
140,33
9) Inv
estme
nt inco
me, ne
t—
—
—
—
—
2,8
01,737
2,8
01,737
Un
iversit
y funde
d tuitio
n waiv
ers—
—
—
—
—
1,9
86,414
1,9
86,414
Co
ncessi
ons, so
uvenirs
, parkin
g, and
boat m
oorage
2,536,
600
123,16
0 25,
600
14,961
34,
930
609,01
0 3,3
44,261
Fa
cility i
ncome
—
—
—
—
—
1,954,
689
1,954,
689
Other
58,098
—
—
320
,507
324,92
3 1,0
62,788
1,7
66,316
To
tal rev
enue
$68,
446,07
6 10,
452,20
1 517
,354
1,858,
445
2,488,
109
27,221
,104
110,98
3,289
See a
ccomp
anying
indepe
ndent a
uditor
s’ repo
rt.
37

Sche
dule 3
UNIVE
RSITY
OF W
ASHIN
GTON
DEPA
RTME
NT OF
INTE
RCOL
LEGIA
TE AT
HLET
ICSOp
erating
Expen
ses an
d Othe
r Dedu
ctions
by Sp
ecific
Funct
ionYe
ar end
ed Jun
e 30, 2
016
Facili
ties
Depa
rtmen
tma
inten
ance
relati
ons
Men’s
Men’s
Wome
n’sOth
er sp
orts
Posts
eason
and e
vent
and v
isiting
footba
llba
sketba
llba
sketba
llMe
n’sWo
men’s
activit
yAd
minis
tratio
nma
nage
ment
recrui
tsTo
talOp
erating
expen
ses:
Salari
es and
wages
$8,5
19,083
2,1
18,817
1,0
64,797
2,2
17,726
3,0
76,873
155
,430
10,442
,996
1,857,
291
6,258
29,
459,27
1 Pa
yroll ta
xes an
d emp
loyee
benefit
s1,8
49,116
1,0
86,744
294
,816
614,50
3 833
,399
23,355
2,2
82,409
623
,565
2,820
7,6
10,727
Ath
letic s
tudent
aid3,8
54,883
556
,227
470,46
8 2,4
27,573
4,5
45,138
—
974
,124
—
197,85
9 13,
026,27
2 Gu
arante
es pai
d to vis
iting te
ams
1,450,
000
538,91
2 55,
000
11,260
57,
768
—
—
—
—
2,112,
940
Team
travel
929,08
0 423
,554
239,11
8 787
,411
1,249,
964
1,237,
590
141,83
1 —
68,
001
5,076,
549
Day o
f game
expen
ses1,6
44,386
322
,111
199,57
5 210
,739
316,00
8 71,
265
637,35
5 776
,980
3,357,
867
7,536,
286
Direct
faciliti
es, ma
intenan
ce, an
d utilit
ies139
,097
—
—
46,167
70,
729
—
2,601,
424
928,83
6 —
3,7
86,253
Do
nated
advert
ising
—
—
—
—
—
—
2,680,
090
—
—
2,680,
090
Unifor
ms an
d supp
lies1,1
83,173
79,
482
42,104
396
,818
547,03
5 113
,975
877,05
1 255
,031
16,794
3,5
11,463
Do
nated
supplie
s878
,200
176,00
0 168
,000
574,54
0 750
,260
—
153,00
0 —
—
2,7
00,000
Ins
titution
al over
head
—
—
—
—
—
—
1,858,
774
—
—
1,858,
774
Medic
al expe
nses
24,225
4,9
29
—
24,900
30,
610
—
1,059,
067
—
10,827
1,1
54,558
Fu
nd-rais
ing, m
arketin
g, and
promo
tions
—
—
—
—
13,255
—
346
,624
—
—
359,87
9 Re
cruitin
g—
—
—
—
—
—
—
—
480
,826
480,82
6 Eq
uipme
nt—
—
—
—
—
—
—
456
—
456
Tra
ining ta
ble1,0
16,892
40,
799
19,496
171
,737
252,83
5 57,
670
199,74
3 —
1,1
02,253
2,8
61,425
De
partme
nt rela
tions
52,735
1,3
31
3,959
42,
969
46,737
369
34,
657
267
286,36
4 469
,388
Banqu
ets an
d spec
ial eve
nts21,
902
9,020
1,6
64
65,819
51,
892
—
151,65
0 —
163
,989
465,93
6 De
precia
tion—
—
—
—
—
—
17,
570,03
6 —
—
17,
570,03
6 No
ncapita
lized e
quipm
ent an
d repa
irs—
—
—
—
—
—
—
1,6
95,413
—
1,6
95,413
Pa
c-12 M
anagem
ent Fe
e—
—
—
—
—
—
7,3
00,000
—
—
7,3
00,000
Oth
er594
,145
165,76
4 174
,694
585,34
0 497
,442
144,03
7 4,9
81,826
71,
441
1,159,
519
8,374,
208
Total
operat
ing ex
penses
22,156
,917
5,523,
690
2,733,
691
8,177,
502
12,339
,945
1,803,
691
54,292
,657
6,209,
280
6,853,
377
120,09
0,750
Other
deduct
ions:
Loss o
n disp
osal of
capita
l asset
s—
—
—
—
—
—
—
70,
555
—
70,555
Fin
ancing
Cost
—
—
—
—
—
—
74
—
—
74
Interes
t expen
se—
—
—
—
—
—
12,
382,68
2 —
—
12,
382,68
2 To
tal oth
er ded
uction
s—
—
—
—
—
—
12,
382,75
6 70,
555
—
12,453
,311
Total
operat
ing ex
penses
and o
ther d
eductio
ns$
22,156
,917
5,523,
690
2,733,
691
8,177,
502
12,339
,945
1,803,
691
66,675
,413
6,279,
835
6,853,
377
132,54
4,061
See a
ccomp
anying
indepe
ndent a
uditor
s’ repo
rt.
38


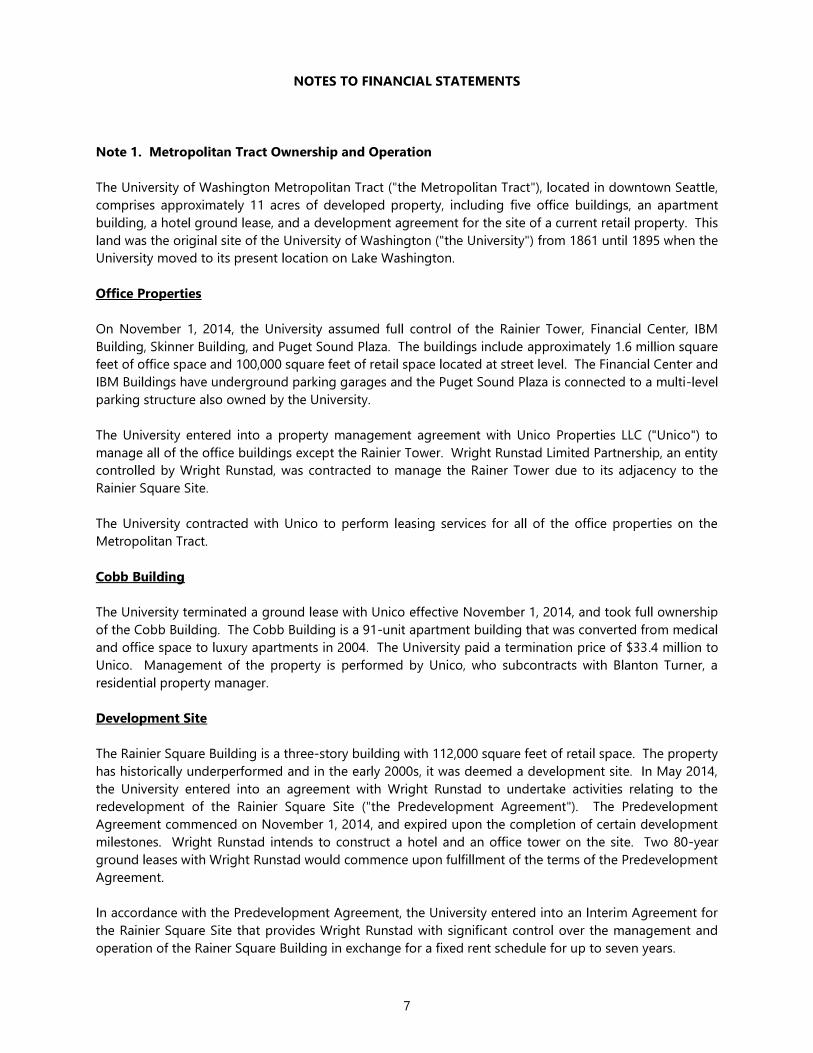


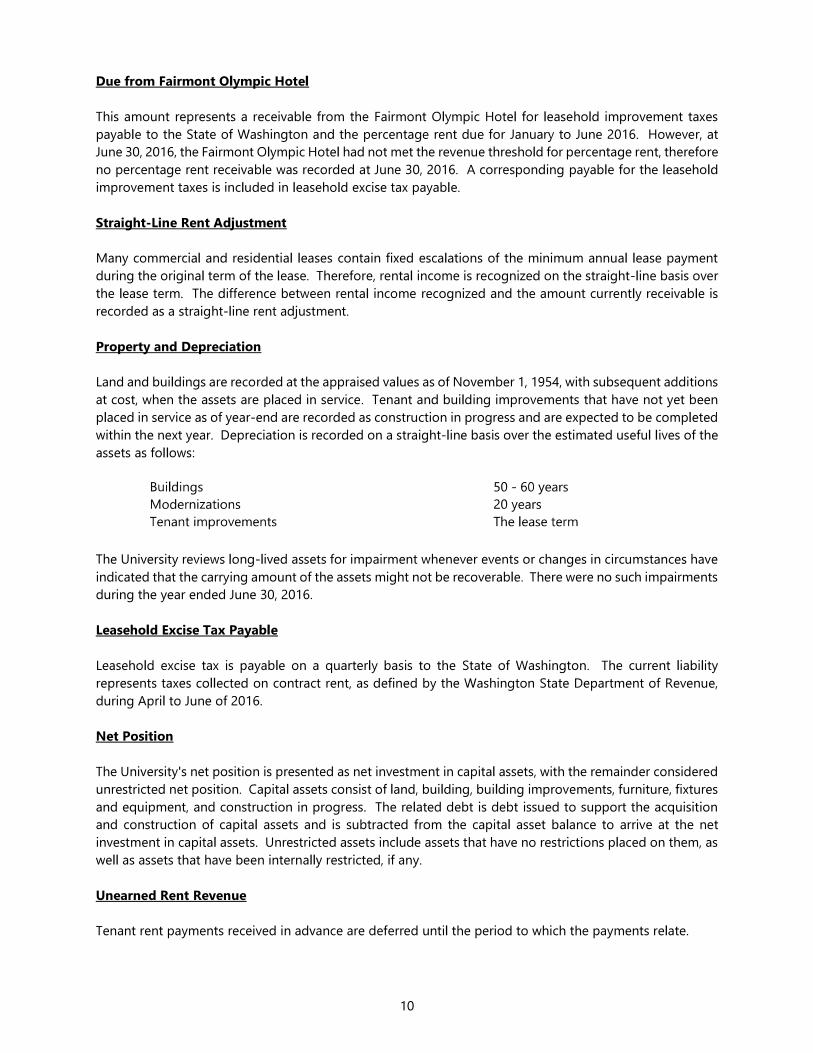


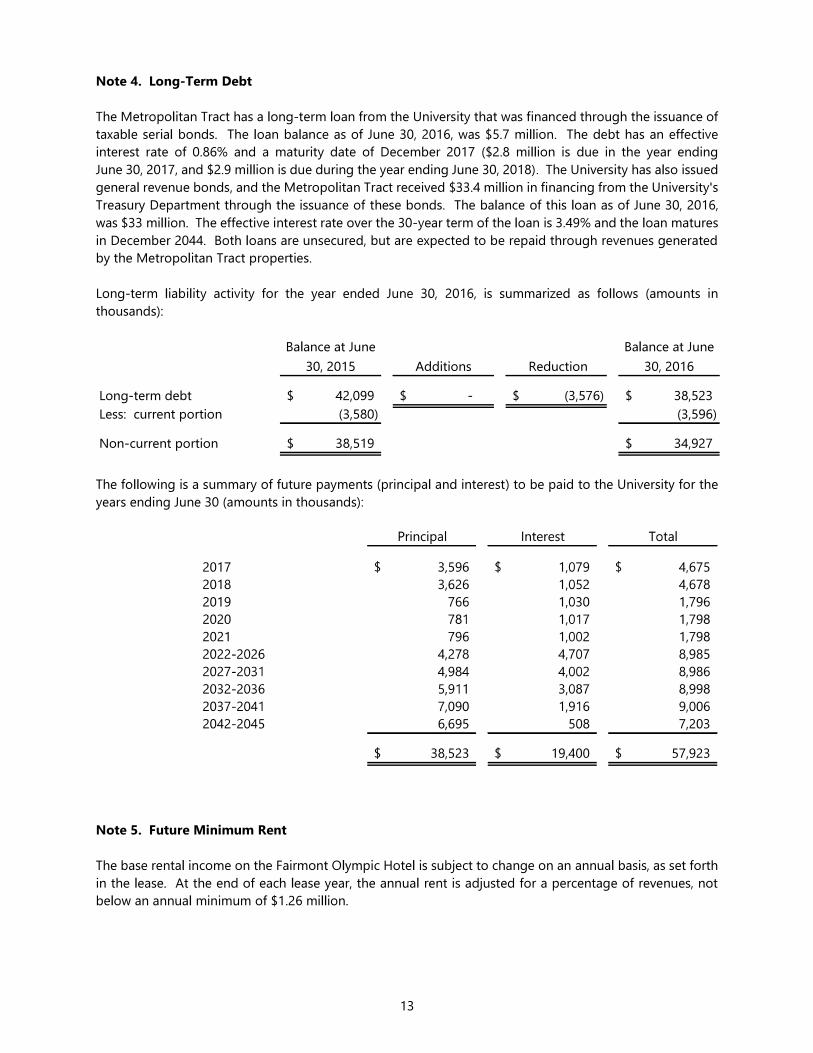


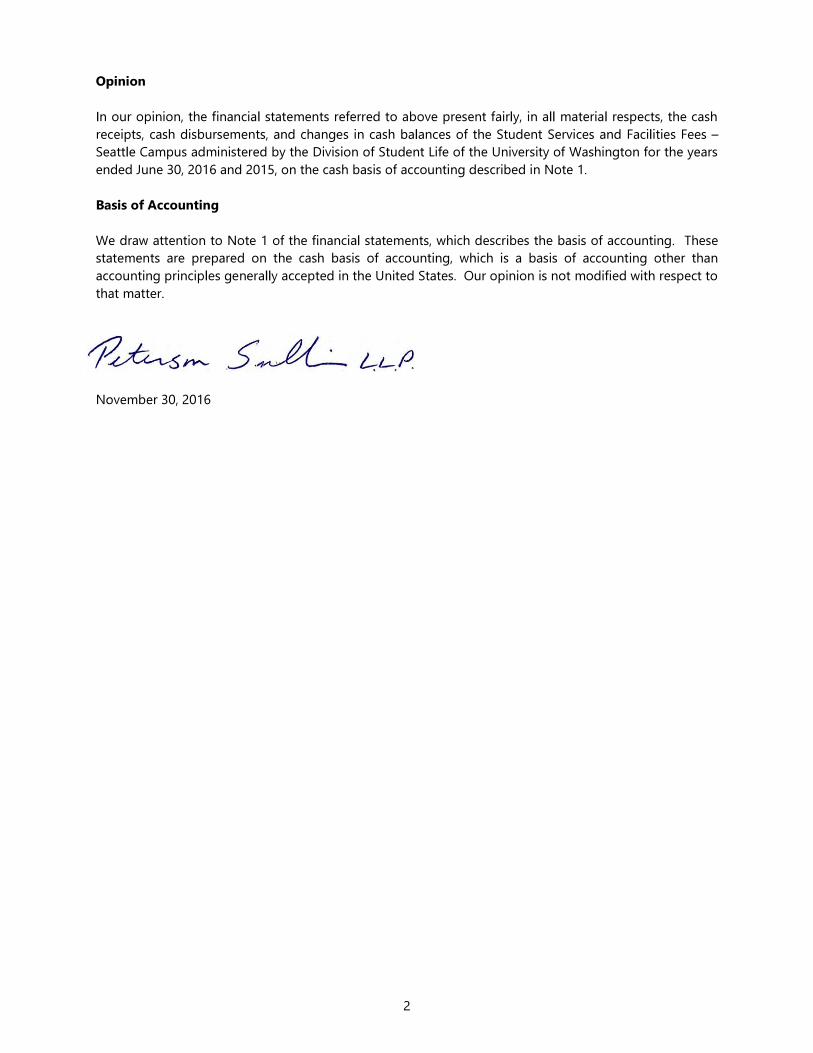
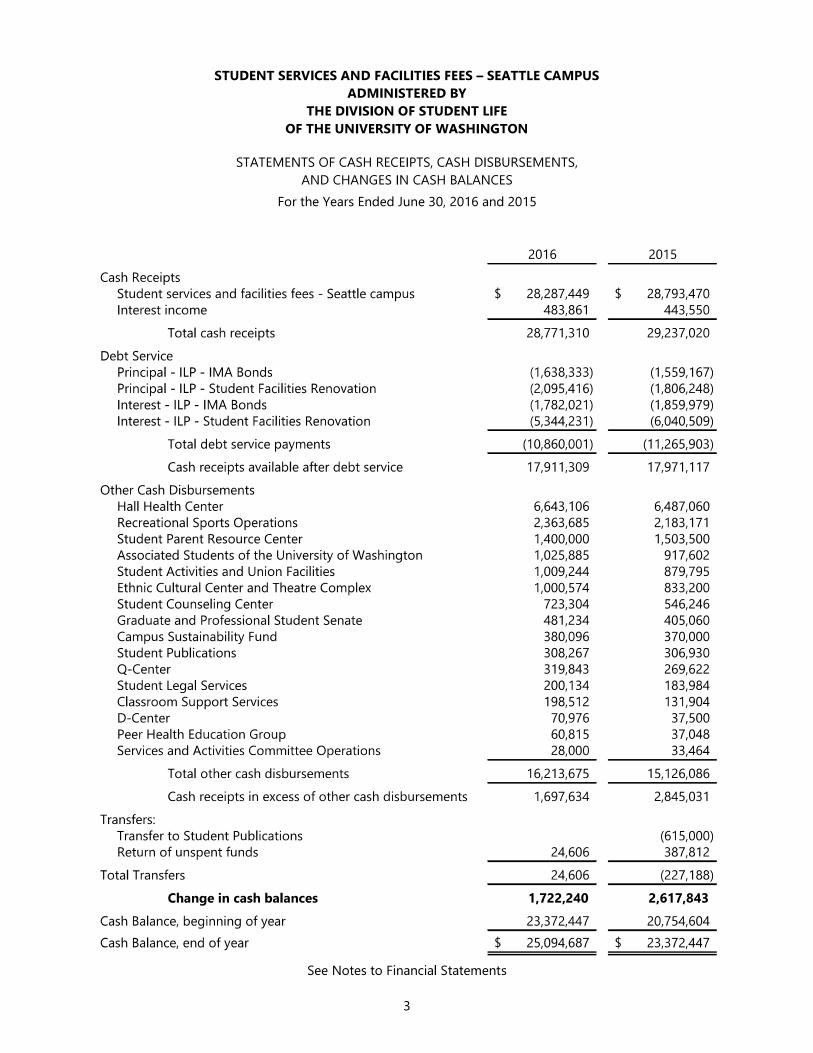


UNIVERSITY OF WASHINGTON Supplementary Information
June 30, 2016 and 2015 (With Independent Auditors Report Thereon)

Independent Auditors Report on Supplementary Information
The Board of Regents University of Washington: We have audited the financial statements of the business-type activities and aggregate discretely presented component units of the University of Washington (the University), an agency of the state of Washington, as of and for the years ended June 30, 2016 and 2015, and have issued our report thereon dated October 21, 2016,which contained unmodified opinions on those financial statements basic financial statements. Our audit was performed for the purpose of forming opinions on the financial statements. We have not performed any procedures with respect to the audited financial statements subsequent to October 21, 2016. The supplementary information included on pages 2 through 4 is presented for the purposes of additional analysis and is not a required part of the basic financial statements. Such information is the responsibility of management and was derived from and relates directly to the underlying accounting and other records used to prepare the basic financial statements. The information has been subjected to the auditing procedures applied in the audit of the basic financial statements and certain additional procedures, including comparing and reconciling such information directly to the underlying accounting and other records used to prepare the basic financial statements or to the basic financial statements themselves, and other additional procedures in accordance with auditing standards generally accepted in the United States of America. In our opinion, the information is fairly stated in all material respects in relation to the basic financial statements as a whole. This report is intended solely for the information and use of the Board of Regents and management of the University of Washington and rating agencies and bondholders who have previously received the financial statements of the University of Washington as of and for the years ended June 30, 2016 and 2015, and our unmodified opinions thereon, for use in evaluating those financial statements, and is not intended to be, and should not be used for any other purpose.
November 16, 2016

UNIVERSITY OF WASHINGTONReconciliation of Total University Revenue to General Revenue
Years ended June 30, 2016 and 2015(Dollars in thousands)
2016 2015General revenue:
Total revenue $ 5,024,269 4,982,564 Less:
State appropriations 302,097 255,156 Grant and contract direct costs 1,093,865 1,082,452 Gifts 115,000 115,636 Revenues of component units 276,946 211,174 Student activities fees and U-Pass fees 43,134 44,080 Student technology fees, student building fees, and student
loan funds 79,066 76,297 Trust and endowment income, net unrealized (losses) gains
on noninvested funds investments, Metropolitan Tract netoperating income, component unit investment income,and other restricted investment income (19,050) 187,599
Capital appropriations 39,221 20,812 Capital grants, gifts and other 21,645 21,986 Other nonoperating revenues 13,133 9,042 Gifts to permanent endowments 88,267 67,359
Total general revenue $ 2,970,945 2,890,971 General revenue components:
Student tuition and fees (less student activities fees, U-Passfees, technology fees, building fees, and loan funds) $ 837,677 804,391
Grant and contract indirect costs 248,276 246,677 Invested funds distribution and net invested funds unrealized
gains and losses (note 2) 63,927 39,805 Sales and services of educational departments 224,747 223,494 Auxiliary systems and patient services 1,547,997 1,505,444 Other operating revenues 48,321 71,160
Total general revenue $ 2,970,945 2,890,971
See accompanying notes to supplementary information.
2

UNIVERSITY OF WASHINGTONReconciliation of Total University of Washington Unrestricted Net Position
to General Net PositionJune 30, 2016 and 2015(Dollars in thousands)
2016 2015Total University unrestricted net position per financial statements $ 675,529 869,120 Less:
Student and activities fees 24,015 21,655 Net position (deficit) of component units:
Association of University Physicians 87,762 84,987 UW Neighborhood Clinics (494) 10,276 Real estate entities (4,578) (2,620)
Total to be excluded, net 106,705 114,298 General net position $ 568,824 754,822
See accompanying notes to supplementary information.
3

UNIVERSITY OF WASHINGTON Notes to Supplementary Information
June 30, 2016 and 2015
4
(1) Basis of Presentation The General Revenue schedule presents the general income of the University of Washington (University) that is not restricted in its use by law, regulation, or contract. General Revenues, as defined in the bond agreements, are revenues pledged to bondholders under the University s General Revenue Bond platform. The supplementary information included herein reconciles total University revenue to General Revenue pledged to bondholders. For example, the following items are restricted and, therefore, excluded from General Revenues: a. Appropriations to the University by the state of Washington (state) from the state s General Fund; b. Revenues from gifts or grants restricted by the terms of the gift or grant either in writing or otherwise by
the donor; c. Fees imposed upon students as a condition of enrollment at the University, including but not limited to
services and activities fees, building fees, and technology fees; and d. Revenues and receipts attributable to the Metropolitan Tract Revenue, which are appropriated to the
University by the state. Unrestricted fund balances, to the extent that they were accumulated from money that was received as General Revenues, also are included and available to pay obligations secured by General Revenues. Any interest subsidy received from the federal government with respect to General Revenue Bonds is included and available to pay obligations secured by General Revenues.
(2) Invested Funds Distributions and Net Invested Funds Unrealized Gains and Losses These amounts represent the net interest, dividends, and realized gains or losses earned on the Invested Funds that are distributed to departments for operations, in addition to or offset by any unrealized gains and losses on the portfolio.
UW MEDICINE CLINICAL ENTERPRISE UW DIVISION Financial Statements
June 30, 2016 (With Independent Auditors Report Thereon)

UW MEDICINE CLINICAL ENTERPRISE UW DIVISION
Table of Contents
Page Independent Auditors Report 1 Management s Discussion and Analysis (Unaudited) 3 Basic Financial Statements:
Statement of Net Position 14 Statement of Revenues, Expenses, and Changes in Net Position 15 Statement of Cash Flows 16
Notes to Financial Statements 17 Schedules of Required Supplementary Information 51 Schedules of Supplementary Information 52

Independent Auditors Report
The University of Washington UW Medicine Board: We have audited the accompanying financial statements of UW Medicine Clinical Enterprise UW Division (the Group), as of and for the year ended June 30, 2016, and the related notes to the financial
listed in the table of contents. Management s Responsibility for the Financial Statements Management is responsible for the preparation and fair presentation of these financial statements in accordance with U.S. generally accepted accounting principles; this includes the design, implementation, and maintenance of internal control relevant to the preparation and fair presentation of financial statements that are free from material misstatement, whether due to fraud or error. Auditors Responsibility Our responsibility is to express an opinion on these financial statements based on our audit. We conducted our audit in accordance with auditing standards generally accepted in the United States of America. Those standards require that we plan and perform the audit to obtain reasonable assurance about whether the financial statements are free from material misstatement. An audit involves performing procedures to obtain audit evidence about the amounts and disclosures in the financial statements. The procedures selected depend on the auditors judgment, including the assessment of the risks of material misstatement of the financial statements, whether due to fraud or error. In making those risk assessments, the auditors consider internal control relevant to the entity s preparation and fair presentation of the financial statements in order to design audit procedures that are appropriate in the circumstances, but not for the purpose of expressing an opinion on the effectiveness of the entity s internal control. Accordingly, we express no such opinion. An audit also includes evaluating the appropriateness of accounting policies used and the reasonableness of significant accounting estimates made by management, as well as evaluating the overall presentation of the financial statements. We believe that the audit evidence we have obtained is sufficient and appropriate to provide a basis for our audit opinion. Emphasis of Matter As discussed in note 1, the financial statements of the Group, divisions, departments and component units of the University of Washington (the University), are intended to present the net position, the changes in net position, and the cash flows of only that portion of the business-type activities of the University that are attributable to the transactions of the Group. They do not purport to, and do not, present fairly the net position of the University as of June 30, 2016, the change in its net position, or its cash flows for the year ended, in accordance with U.S. generally accepted accounting principles. Our opinion is not modified with respect to this matter. As discussed in note 2 to the financial statements, on July 1, 2014, the Group adopted new accounting guidance requiring governments providing defined benefit pensions to their employees to recognize their

2
most changes in the net pension liability within pension expense. Our opinion is not modified with respect to this matter. Opinion In our opinion, the financial statements referred to above present fairly in all material respects, the financial position of the Group as of June 30, 2016, and the respective changes in financial position and, where applicable, cash flow thereof for the year then ended in accordance with U.S. generally accepted accounting principles. Other Matters Required Supplementary InformationU.S. generally accepted accounting principles require that the Management s Discussion and Analysis on pages 3 through 13, and the schedules of required supplementary information on page 55, be presented to supplement the basic financial statements. Such information, although not a part of the basic financial statements, is required by the Governmental Accounting Standards Board who considers it to be an essential part of financial reporting for placing the basic financial statements in an appropriate operational, economic, or historical context. We have applied certain limited procedures to the required supplementary information in accordance with auditing standards generally accepted in the United States of America, which consisted of inquiries of management about the methods of preparing the information and comparing the information for consistency with management s responses to our inquiries, the basic financial statements, and other knowledge we obtained during our audit of the basic financial statements. We do not express an opinion or provide any assurance on the information because the limited procedures do not provide us with sufficient evidence to express an opinion or provide any assurance. Supplementary and Other Information Our audit was conducted for the purpose of forming opinions on the financial statements that collectively
ents. The combining financial statements included on pages 52 53 are presented for purposes of additional analysis and are not a required part of the basic financial
statements. The combining financial statements are the responsibility of management and were derived from and relates directly to the underlying accounting and other records used to prepare the basic financial statements. Such information has been subjected to the auditing procedures applied in the audit of the basic financial statements and certain additional procedures, including comparing and reconciling such information directly to the underlying accounting and other records used to prepare the basic financial statements or to the basic financial statements themselves, and other additional procedures in accordance with auditing standards generally accepted in the United States of America. In our opinion, the combining financial statements are fairly stated, in all material respects, in relation to the basic financial statements as a whole. The combining financial statements have not been subjected to the auditing procedures applied in the audit of the basic financial statements, and accordingly, we do not express an opinion or provide any assurance on it.
Seattle, Washington October 19, 2016

UW MEDICINE CLINICAL ENTERPRISE UW DIVISION
June 30, 2016 and 2015 (Dollars in thousands)
3
The following discussion and analysis provide an overview of the financial position and activities of the UW Medicine Clinical Enterprise - UW Division (the Group), for the years ended June 30, 2016 and 2015. This discussion has been prepared by management and is designed to focus on current activities, resulting changes, and current known facts and should be read in conjunction with the audited financial statements and accompanying notes that follow this section. The Group consists of divisions, departments, and component units of the University of Washington (the University) and includes: University of Washington Medical Center (UW Medical Center), UW Medicine/Northwest dba Northwest Hospital & Medical Center (Northwest Hospital), UW Physicians Network dba UW Neighborhood Clinics (Neighborhood Clinics), The Association of University Physicians dba UW Physicians (UWP), Airlift Northwest (Airlift) and shared service departments that support the entire UW Medicine enterprise. Also part of UW Medicine, but not included in these financial statements are Harborview Medical Center (Harborview) as operated and managed by the University under the Hospital Services Agreement between King County and the University, Public Hospital District No. 1 of King County, Washington dba Valley Medical Center (VMC), and the University of Washington School of the Medicine (School). Using the Financial Statements
financial statements consist of three statements: statement of net position; statement of revenues, expenses, and changes in net position; and statement of cash flows. These financial statements and related notes provide information about the activities of the Group, including resources held by the Group but restricted for specific purposes by contributors, grantors, or enabling legislation. The statement of net position includes all of assets and liabilities, using the accrual basis of accounting. The statement also provides an indication about which assets can be used for general purposes and which are designated for a specific purpose and includes information to help compute the rate of return on investments, evaluate the capital structure of the Group, and assess the liquidity and financial flexibility of the organization. The statement of revenues, expenses, and changes in net position reports all revenues, expenses, and other activity affecting net position during the time period indicated. Net position, the difference between assets and liabilities, is one way to measure the financial health of the Group and whether the organization has been able to recover all costs through net patient service revenue and other revenue sources. The statement of cash flows reports the cash provided by operating activities, as well as other cash sources such as investment income, cash payments for capital additions and improvements, and payments for debt service, interest payments funding to affiliates. The statement provides meaningful information on how the
cash was generated and what it was used for.

UW MEDICINE CLINICAL ENTERPRISE UW DIVISION
June 30, 2016 and 2015 (Dollars in thousands)
4
Financial Highlights for Fiscal Year 2016 The Group reported a loss from operations of $51,130 and a decrease in net position of $34,095 for the year ended June 30, 2016 compared to operating income of $27,598 and an increase in net position of $30,008 for the year ended June 30, 2015. The decrease in operating income is a result of higher expenses associated with the opening of three patient floors at the UW Medical Center Montlake Tower, EPIC billing system implementation at Northwest Hospital and two new Neighborhood Clinics, and an increase in FTEs which led to an increase in salaries and benefits expense.
2016 2015Total operating revenues $ 1,886,206 1,765,866 Total operating expenses 1,937,336 1,738,268
(Loss) income from operations (51,130) 27,598 Investment income, net 7,190 6,162 Interest expense (15,905) (15,892) Other, net 28,701 11,726
Nonoperating revenues 19,986 1,996 (Loss) income before capital contributions and other (31,144) 29,594
Capital contributions and transfers (2,951) 414 (Decrease) increase in net position (34,095) 30,008
Net position, beginning of year 595,996 823,099 Cumulative effect of accounting change (257,111) Net position, beginning of year, as adjusted 595,996 565,988 Net position, end of year $ 561,901 595,996

UW MEDICINE CLINICAL ENTERPRISE UW DIVISION
June 30, 2016 and 2015 (Dollars in thousands)
5
The following chart represents the key statistics of the Group: 2016 2015
Available Beds 810 713 Admissions 28,422 28,026 Patient days 181,021 173,382 Average length of stay 6.37 6.19 Case mix index (CMI) - UW Medical Center 2.242 2.126 Case mix index (CMI) - Northwest Hospital 1.502 1.455 Surgery cases 25,802 24,894 Emergency room visits 61,623 62,624 Primary & Urgent care clinic visits 380,627 345,877 Specialty care clinic visits 437,341 421,584 Full-time equivalents (FTEs) 8,595 7,983 Births 4,044 4,343 Solid Organ Transplants 326 321 RVU Volume - UWP 6,534,336 6,037,203 Flights 3,379 3,168
Total Operating Revenues Total operating revenues consists primarily of net patient service revenues, UWP billing revenues, net and other revenues. Net patient service revenues are recorded based on standard billing rates less contractual adjustments, charity, and a provision for uncollectible accounts. The Group has agreements with federal and state agencies, and commercial insurers that provide for payments at amounts different from gross charges. The Group provides care at no charge or reduced charges to patients who qualify under charity policy. The Group also estimates the amount of patient responsibility accounts receivable that will become uncollectible, which is reported as a reduction of net patient service revenue. The difference between gross charges and the estimated net realizable amounts from payers and patients is recorded as an adjustment to charges. The resulting net patient service revenue is shown in the statements of revenues, expenses, and changes in net position. Net patient service revenues are comprised of total inpatient, outpatient and flight revenue. Outpatient revenue consists of hospital-based and ambulatory revenue. UWP billing revenues, net consist of professional fee revenue as UWP is entitled to revenue that is limited to its operating expenses based on the operating agreement between the University and UWP. Other revenue comprises revenues such as contract pharmacy, parking and cafeteria sales.
payer mix is a key factor in the overall financial operating performance. The chart to the right illustrates payer mix for 2016. For the years ended
43%
37%
18%
1% 1% Payer Mix - Fiscal year 2016
CommercialMedicareMedicaidSelf-payExchange (HIX)

UW MEDICINE CLINICAL ENTERPRISE UW DIVISION
June 30, 2016 and 2015 (Dollars in thousands)
6
42%
12%19%
18%
5% 4%
Operating Expenses - Fiscal year 2016Salaries and wagesEmployee benefitsPurchased servicesSuppliesOtherDepreciation andamortization
June 30, 2016 and 2015, commercial revenue represented 43% and 43%, Medicare revenue represented 37% and 37%, Medicaid revenue represented 18% and 18%, and self-pay revenue represented 1% and 1%, and exchange revenue represented 1% and 1%, respectively. As a result of the Affordable Care Act, the Group experienced a decrease in uninsured patients after January 1, 2014 as many patients who were previously self-pay now qualify for Medicaid coverage. However, the Group has seen a corresponding increase in uncompensated care costs related to providing care to Medicaid patients as illustrated in the table to the right. Reimbursement from governmental payers is generally below commercial rates and reimbursement rules are complex and subject to both interpretation and settlements. For the years ended June 30, 2016 and 2015, the G total operating revenues were $1,886,206 and $1,765,866 comprised of $1,483,561 and $1,420,584 in net patient service revenues, $230,641 and $201,253 in UWP billing revenues, net, and $172,004 and $144,029 in other revenues, respectively. The increase in operating revenues between fiscal years 2016 and 2015 was driven by greater volumes and case acuity which increased net patient service revenue, an increase in relative value units (RVUs) which increased UWP billing revenues, net, as well as contract pharmacy revenues, which positively impacted other revenues. Total Operating Expenses
Total operating expenses were $1,937,336 for the fiscal year 2016 compared to $1,738,268 for the fiscal year 2015. The composition of fiscal year 2016 operating expenses is illustrated in the chart to the left. Salaries and wages expense increased $87,298 from $721,875 in fiscal year 2015 to $809,173 in fiscal year 2016. The increase in salaries and wages expense in fiscal year 2016 was primarily driven by an increase in FTEs and employee merit increases.
$0$10,000$20,000$30,000$40,000$50,000$60,000$70,000
2013 2014 2015 2016
Uncompensated Care Costs (in thousands)
Medicaid
Underinsured/Cost of CharityProvided

UW MEDICINE CLINICAL ENTERPRISE UW DIVISION
June 30, 2016 and 2015 (Dollars in thousands)
7
6.7%
-1.6%1.7%
-2%0%2%4%6%8%
2015 Moody's"A" Rated
2016 2015
Total Margin
Employee benefits expense increased $53,181 from $175,874 in fiscal year 2015 to $229,055 in fiscal year 2016. Employee benefit expense increased as a result of an and a higher benefit load rate. In 2016, the State of Washington (the State) increased the funding of employee healthcare and pension costs which caused the University to increase the benefit load rate for classified employees and professional staff by 16.6% and 9.1%, respectively for the University employees within the Group. Purchased services expense consisting of professional, consulting fees, and School faculty funding, increased $21,541 from $346,953 in fiscal year 2015 to $368,494 in fiscal year 2016. The increase in purchased services expense between fiscal year 2016 and 2015 is attributed to an increase in the School faculty funding expense and physician fees paid to physicians providing services to the Group but not employed by the Group. Supplies expense includes medical and surgical supplies, pharmaceutical supplies, and non-medical supplies. In total, these expenses increased $32,371 from $313,927 in fiscal year 2015 to $346,298 in fiscal year 2016. The increase was driven by higher costs for pharmaceuticals, prosthesis, surgical supplies, and other expenses as a result of the higher acuity and length of stay. Depreciation expense increased $3,772 from $83,004 in fiscal year 2015 to $86,776 in fiscal year 2016. The increase in depreciation expense is driven by the capitalization of the Montlake Tower construction and costs related to the implementation of Epic billing system at Northwest Hospital during 2016. Nonoperating Revenues (Expenses) Nonoperating revenues (expenses) consist primarily of investment income, interest expense, intergovernmental transfer expenses and strategic funding to and from other UW Medicine entities. In 2016, net nonoperating revenues increased $17,990 from $1,996 in fiscal year 2015 to $19,986 in fiscal year 2016. The increase in net nonoperating revenues is attributable to an increase in equity earnings from Seattle Cancer Care Alliance (SCCA) and strategic funding from other UW Medicine entities. Total Margin Total margin or excess margin is a ratio that defines the percentage of total revenue that has been realized in the form of net income (loss before capital contributions and other transfers) and is a common measure of total hospital profitability. Total margin for the fiscal years 2016 and 2015 compared to s median is illustrated in the chart to the right.

UW MEDICINE CLINICAL ENTERPRISE UW DIVISION
June 30, 2016 and 2015 (Dollars in thousands)
8
Financial Analysis Statements of Net Position The table below is a presentation of certain condensed financial information derived from statements of net position as of June 30, 2016 and 2015:
2016 2015Current assets $ 367,143 384,988 Noncurrent assets:Capital assets, at cost, net of accumulated depreciation 742,593 719,032 Funds held by the University of Washington 243,917 235,614 Investments, net of current portion 142,913 127,819 Investment in Seattle Cancer Care Alliance 126,636 107,704 Other assets 10,692 12,105
Total assets 1,633,894 1,587,262 Deferred outflow of resources 66,826 37,130
Total assets and deferred outflow of resources 1,700,720 1,624,392 Current liabilities 406,813 345,474 Noncurrent liabilities 417,518 399,945 Net pension liability 272,867 197,060
Total liabilities 1,097,198 942,479 Deferred inflow of resources 41,621 85,917
Net position 561,901 595,996 Total liabilities and net position $ 1,700,720 1,624,392
Total assets and deferred outflow of resources are $1,700,720 at June 30, 2016 compared to $1,624,392 at June 30, 2015, an increase of $76,328. Significant events occurring within total assets during fiscal year 2016 include an increase in capital assets as a result of the Montlake Tower construction and IT projects, an increase in the investment in Seattle Cancer Care Alliance as a result of our proportionate share of their earnings, and an increase in deferred outflow of resources driven by change in actuarial assumptions related to net pension liability. Current Assets Current assets consist of cash and cash equivalents, and other current assets that are expected to be converted to cash within a year. Current assets also include net patient accounts receivable valued at the estimated net realizable amount due from patients and insurers.

UW MEDICINE CLINICAL ENTERPRISE UW DIVISION
June 30, 2016 and 2015 (Dollars in thousands)
9
Fiscal year 2016 composition of current assets is illustrated in the chart to the left. Cash and Cash Equivalents represent cash and short-term investments, as well as funds held by the University on behalf of the Group that are considered cash equivalents. Cash and cash equivalents increased $7,277 from $78,215 at June 30, 2015 to $85,492 at June 30, 2016. The increases in cash and cash equivalents are primarily due to cash provided by operating activities during the respective period. Days unrestricted cash on hand is utilized to evaluate an organization s continuing ability to
meet its short-term operating needs. Days unrestricted cash on hand (including noncurrent funds) as of June 30 for fiscal years 2016 and 2015 as compared median rating are illustrated in the chart to the right.
total days unrestricted cash on hand, decreased from 96.5 days at June 30, 2015 to 92.6 days at June 30, 2016. The decrease in 2016 was driven by the
higher operating expenses as a result of opening new patient floors at the UW Medical Center Montlake Tower and two new primary care clinics opened by the Neighborhood Clinics.
Net patient accounts receivable was $203,187 as of June 30, 2016, compared to $208,501 as of June 30, 2015. The decrease of $5,314 was driven by a focus on billing and collection activities within the Group. Net days patient accounts receivable outstanding illustrates an organization s ability to convert net patient service revenue to cash. Net days patient accounts receivable outstanding as of June 30 for
23%
55%
5%7%
7%3% Current Assets - Fiscal year 2016
Cash and cash equivalentsPatient accounts receivable,netOther receivablesDue from related partiesSupplies inventoryOther current assets
227.5
92.6 96.5
- 50.0
100.0 150.0 200.0 250.0
2015 Moody's"A" Rated
2016 2015
Days Unrestricted Cash on Hand
48.6 50.1 53.6
20.0
30.0
40.0
50.0
60.0
2015 Moody's "A"Rated
2016 2015
Net Days Patient Accounts Receivable Outstanding

UW MEDICINE CLINICAL ENTERPRISE UW DIVISION
June 30, 2016 and 2015 (Dollars in thousands)
10
fiscal years 2016 and 2015 as compared are illustrated in the chart above. total net days patient accounts receivable outstanding decreased 3.5 days from 53.6 days at June 30,
2015 to 50.1 days at June 30, 2016. The decrease during fiscal year 2016 was driven by focus on revenue cycle initiatives that improved billing and collection activities. As of June 30, 2016 and 2015, 42% and 42% of the gross patient accounts receivable balance is due from commercial payers, 51% and 50% is due from governmental payers Medicare and Medicaid, and 5% and 6% from self-pay patients and 2% and 2% from exchange payers, respectively. Other receivables consist of amounts due from external parties for supplies and services. Other receivables decreased $16,172 from $33,496 at June 30, 2015 to $17,324 at June 30, 2016. In fiscal year 2016, the decrease in other receivables was driven by improved timing for payments by SCCA to the Group as a result of supplies and services provided by the Group. Due from related parties consists of amounts due for services provided to Harborview, VMC, and the School. Due from related parties decreased $5,159 from $29,758 at June 30, 2015 to $24,599 at June 30, 2016. The decrease in 2016 relates to the timing of payments between the Group, Harborview and the School. Noncurrent Assets Capital assets, at cost, net of accumulated depreciation increased $23,561 during fiscal year 2016 from $719,032 at June 30, 2015 to $742,593 at June 30, 2016. The increase in fiscal year 2016 was due to continued construction of the Montlake Tower, for which a portion of the construction went into service in 2016, and information technology projects such as the Epic billing system implementation at Northwest Hospital. Additional discussion regarding capital asset activity during the fiscal years can be found in the notes to the financial statements. Funds held by the University represent funds invested with the University. Through the investment program, the Group receives a rate of return representative of a portion of fund performance. For fiscal year 2016 and 2015, the program generated a rate of return of 2% on assets. Noncurrent funds held by the University increased by $8,303 in fiscal year 2016 as a result of cash generated from operations. Investments, net of current portion represents investments held by the Group for capital improvements and replacements, restricted for certain other purposes and investments held for the benefit of the School. Investments, net of current portion increased $15,094 from $127,819 at June 30, 2015 to $142,913 at June 30, 2016. In 2016, the increase in investments was driven by an increase in receipts of patient collections offset by a decrease in distributions to the School. Investment in SCCA represents UW Medical Center s interest in SCCA, in which UW Medical Center is a 33.3% owner. UW Medical Center accounts for its interest in the SCCA using the equity method of accounting. Investment in SCCA increased $18,932 from $107,704 at June 30, 2015 to $126,636 at June 30, 2016. Changes in the investment value reflect UW Medical Center s proportionate interest in the change in net assets of SCCA. The increase in 2016 was attributable to positive results in operational and investment performance.

UW MEDICINE CLINICAL ENTERPRISE UW DIVISION
June 30, 2016 and 2015 (Dollars in thousands)
11
Current Liabilities Current liabilities consist of accounts payable and other accrued liabilities that are expected to be paid within a
year. Total current liabilities were $406,813 at June 30, 2016 compared to $345,474 at June 30, 2015. Fiscal year 2016 composition of current liabilities is illustrated in the chart to the left.Accounts payable and accrued expenses decreased $2,192 from $70,885 at June 30, 2015 to $68,693 at June 30, 2016. Changes in accounts payable and accrued expenses are primarily driven by timing of payments to vendors. Accrued salaries, wages, and employee benefits increased $13,161 from $88,404 at June 30, 2015 to $101,565 at June 30, 2016. Changes in accrued salaries, wages, and employee benefits are primarily driven by the number of employees, employee merit increases, and an increase in the University benefit
load rate as a result of increases in healthcare and pension costs. Due to related parties consists of amounts due for services provided to the Group by the School, the University, and other affiliates. Due to related parties increased $36,472 from $36,737 at June 30, 2015 to $73,209 at June 30, 2016. The increase in 2016 was driven by timing of payments between related parties. Physician distribution, clinical medicine fund and departmental payables consist of receipts collected by UWP that are allocated and distributed to the physicians and the clinical medicine fund and departmental payables for the benefit of the School. The payable increased $5,255 from $92,161 at June 30, 2016 to $97,416 at June 30, 2016. The increase in the payables relates to lower distributions made to the School in comparison to net cash collections received.Noncurrent Liabilities Noncurrent liabilities consist primarily of the noncurrent portion of long-term debt, net pension liability and other noncurrent liabilities. Long-term debt increased $20,355 from $346,551 at June 30, 2015 to $366,906 at June 30, 2016. The increase in long-term debt was driven by the construction of the Montlake Tower which was financed through the in long-term debt is offset by the Group principal
17%
25%
8%18%
5%
3%
24%
Current Liabilities - Fiscal year 2016Accounts payable &accrued expensesAccrued salaries, wages, &employee benefitsPayable to contractualagenciesDue to related parties
Current portion of long-term debtOther current liabilities
Physician distribution,clinical medicine fund anddepartmental payables
32.840.9 37.7
10.0
20.0
30.0
40.0
50.0
2015 Moody's "A"Rated
2016 2015
Long-term Debt to Capitalization Ratio

UW MEDICINE CLINICAL ENTERPRISE UW DIVISION
June 30, 2016 and 2015 (Dollars in thousands)
12
payments made in accordance with debt repayment schedules. Long-term debt to capitalization is a ratio used to assess the capital structure of healthcare organizations. The chart above shows the long-term debt to capitalization ratio as of June 30 for 2016 and 2015 as compared to
Additional discussion regarding long-term debt activity during the fiscal years can be found in the notes to the financial statements. Net Pension Liability The University has a financial responsibility for pension benefits associated with the PERS defined-benefit plans (as described in note 10(b)), which includes those University employees deployed within the Group. Net pension liability and the respective deferred outflow and inflow of resources are determined by the State of Washington Department of Retirement Systems (DRS) actuarial report. Net pension liability, deferred outflow and deferred inflow of resources are allocated to the Group based on its proportionate share of employer contributions for the fiscal year. At June 30, 2016 and 2015, respectively, net pension liability of $272,867 and $197,060, deferred outflow of resources of $60,760 and $30,695 and deferred inflow of resources of $41,621 and $85,917 were recorded on the statement of net position. Additional discussion regarding net pension liability can be found in the notes to the financial statements. Factors Affecting the Future UW Medicine Accountable Care Network In 2014, UW Medicine formed an Accountable Care Network (ACN) with other selected healthcare organizations and healthcare professionals in Western Washington to form a care delivery network to assume responsibility for the healthcare of contracted populations of patients to achieve the Triple Aim: improved healthcare experience for the individual, improved health of the population, and more affordable care.
The ACN has contracted with the Washington Health Care Authority (HCA) to participate in its new Puget Sound Accountable Care Program (ACP) as a healthcare benefit option for Public Employees Benefits Board (PEBB) members. The ACP is offered to all PEBB members who reside in Snohomish, King, Kitsap, Pierce, and Thurston Counties, with possible expansion into a number of additional counties planned in 2017. This contract with HCA to cover PEBB members began January 1, 2016.
A subset of the network members have also agreed to participate with the ACN in a contract with Premera as part of its new Accountable Health System (AHS) product. As an AHS, the UW Medicine ACN will share in accountability for the quality and cost of healthcare for Premera members who select this plan. This product was sold both on and off the Washington Health Exchange in select counties with coverage that began January 1, 2016 and must have 5,000 plan-wide members per product, per region to share in financial savings and risk.
The UW Medicine ACN also entered into an agreement to provide health care services to non-union employees of a large local employer with coverage that began January 1, 2015.
These arrangements provide an opportunity for shared savings between the ACN and the contracted entity based on achieving quality and financial benchmarks. If certain financial benchmarks are not attained, UW Medicine,

UW MEDICINE CLINICAL ENTERPRISE UW DIVISION
June 30, 2016 and 2015 (Dollars in thousands)
13
along with its network members, is at risk for reductions in payment levels from the contracted entity based on the agreement. Employee Costs Rising benefit costs, particularly for pensions and healthcare, continue to impact the University and the Group as a result of University employees deployed at certain entities within the Group. Employer pension funding rates for the PERS pension plans increased 19.0% during fiscal year 2016, from 9.21% to 11.18% of covered salary, and will be increasing to 12.52% of covered salary for fiscal year 2017. Likewise, the monthly employer base rate paid by the University and the Group for employee healthcare increased 27% during fiscal year 2016, from $662 to $840 per active employee, and will be increasing to $888 per active employee during fiscal year 2017. Both rates are likely to continue increasing over the next few years. Montlake Tower Expansion Project In February 2008, the University of Washington Board of Regents granted approval to proceed with phase one of a multiphase inpatient expansion known as the Montlake Tower. The scope of phase one included the vertical shell for the entire eight-floor expansion, as well as, a new neonatal intensive care unit, an adult oncology and blood and bone marrow transplant unit, additional diagnostic imaging capacity, and future operating room capacity. In July 2012, phase one was substantially completed and operational components of phase one began servicing patients in October 2012. Total cost of phase one was $210,400, which was primarily funded through borrowings from the University ILP. In November 2012, the University of Washington Board of Regents granted approval to proceed with phase two of the Montlake Tower project. The scope of phase two will complete three inpatient floors including the addition of intensive care and medical/surgical beds as well as additional operating rooms. The estimated cost of phase two was initially projected and approved at $186,300. New projection costs of phase two is $198,000. As part of the approval, the Board of Regents authorized funding from the University ILP up to $136,100, with the remaining $50,200 of anticipated cost to be funded through hospital operations and/or cash reserves. The project has been separated into phases that give management the flexibility to evaluate each phase prior to commencing in order to mitigate overruns. Construction on the remaining phase two project began in 2016 and is expected to be completed by April 2018. In fiscal year 2016, project costs associated with phase two of the Montlake Tower project were $43,500, which includes equipment and construction. Several components of the Montlake Tower expansion project became operational in fiscal year 2016, including the opening of three inpatient floors that increase the number of available beds and new operating rooms. The next phase of the project includes build out of the patient preparation, hold, and recovery areas, and the addition of four operating rooms.

14
UW MEDICINE CLINICAL ENTERPRISE - UW DIVISIONStatement of Net Position
June 30, 2016(In thousands)
AssetsCurrent assets:Cash and cash equivalents $ 34,636Funds held by the University of Washington 50,078Short-term investments 778Patient accounts receivable, less allowance for uncollectible accounts of $20,464 203,187Other receivables 17,324Due from related parties 24,599Supplies inventory 25,106Restricted investments 1,290Other current assets 10,145
Total current assets 367,143Noncurrent assets:Capital assets, at cost, net of accumulated depreciation 742,593Funds held by the University of Washington 243,917Investments 142,913Donor restricted assets 3,941Investment in Seattle Cancer Care Alliance 126,636Other assets 6,751
Total noncurrent assets 1,266,751Total assets 1,633,894
Deferred outflow of resources:Deferred outflow of resources related to pension 60,760Deferred loss on refinancing 6,066Total assets and deferred outflow of resources $ 1,700,720
LiabilitiesCurrent liabilities:Accounts payable and accrued expenses $ 68,693Accrued salaries, wages, and employee benefits 101,565Payable to contractual agencies 33,259Due to related parties 73,209Current portion of long-term debt 18,816Other current liabilities 13,855Physician distribution, clinical medicine fund and departmental payables 97,416
Total current liabilities 406,813Noncurrent liabilities:Long-term debt, net of current portion 366,906Net pension liability 272,867Due to related parties - long-term 19,453Other non-current liabilities 31,159
Total liabilities 1,097,198Deferred inflow of resources:Difference between projected and actual earnings on pension plan investments, net 41,621Net position:Net investment in capital assets 354,334Nonexpendable, restricted 1,927Expendable, restricted 2,772Unrestricted 202,868
Total net position 561,901Total liabilities, deferred inflow of resources, and net position $ 1,700,720
See accompanying notes to financial statements.

15
UW MEDICINE CLINICAL ENTERPRISE - UW DIVISONStatement of Revenues, Expenses, and Changes in Net Position
Year ended June 30, 2016(In thousands)
Operating revenues:Net patient service revenues (net of provision for uncollectible accounts of $23,535) $ 1,483,561UWP billing revenues, net 230,641Other revenue 172,004Total operating revenues 1,886,206
Operating expenses:Salaries and wages 809,173Employee benefits 229,055Purchased services 368,494Supplies 346,298Other 97,540Depreciation 86,776Total operating expenses 1,937,336Loss from operations (51,130)
Nonoperating revenues (expenses):Investment income 7,190Interest expense (15,905) Funding to affiliates (11,575) Funding from affiliates 20,503Other, net 19,773Nonoperating revenues 19,986Loss before capital contributions and transfers (31,144)
Capital contributions and other transfers (2,951) Decrease in net position (34,095)
Net position - beginning of year 595,996Net position – end of year $ 561,901
See accompanying notes to financial statements.

16
UW MEDICINE CLINICAL ENTERPRISE - UW DIVISIONStatement of Cash FlowsYear ended June 30, 2016
(In thousands)
Cash flows from operating activities:Cash received for patient care $ 1,486,617Cash received for UWP billing revenues 232,037Cash received for other services 188,853Cash paid to employees (1,026,277) Cash paid to suppliers and others (775,588) Net cash provided by operating activities 105,642
Cash flows from noncapital financing activities:Funding from affiliates 15,816Additions to CMF and departmental payables 2,960Other, net 385Net cash provided by noncapital financing activities 19,161
Cash flows from capital and related financing activities:Proceeds from borrowings 39,756Purchases of capital assets (115,834) Principal payments on long-term debt (12,602) Interest payments on long-term debt, net of amounts capitalized (15,367) Capital contributions 1,239Funding from affiliates for capital purchases 386Net cash used in capital and related financing activities (102,422)
Cash flows from investing activities:Proceeds from investments 52,120Purchases of Investments (68,270) Change in funds held by the University and donor restricted assets (8,278) Investment income 9,272Distributions from joint ventures 354
Net cash used in investing activities (14,802) Increase in cash and cash equivalents 7,579
Cash and cash equivalents, beginning of year 77,135Cash and cash equivalents, end of year $ 84,714Reconciliation of income from operations to net cash provided by operating activities:Income from operations $ (51,130) Adjustments to reconcile income from operations to net cash provided byoperating activities:Depreciation 86,776Provision for uncollectible accounts 23,535Loss on disposal of capital assets 605Investment income (899) Net increase/(decrease) in operating activities:Patient accounts receivable (18,221) Other receivables 15,979Other current assets and other assets (1,618) Pension related deferred inflows, deferred outflows, and net pension liability 3,165Accounts payable and accrued expenses 2,957Accrued salaries, wages, and employee benefits 8,786Due to related parties 29,106Payable to contractual agencies and other current liabilities 1,675Physician distribution payable 2,295Noncurrent liabilities 2,631
Net cash provided by operating activities $ 105,642Supplemental disclosure of noncash investing, capital, and financing activities:Change in capital assets included in accounts payable $ (5,149) Capital contributions 13Other transfers 4,375
See accompanying notes to financial statements.

UW MEDICINE CLINICAL ENTERPRISE UW DIVISION Notes to the Financial Statements
June 30, 2016 (Dollars in thousands)
17
(1) Organization The UW Medicine Clinical Enterprise UW Division (the Group) is comprised of UW Medicine clinical entities which are divisions, departments and component units of the University of Washington (a agency of the State of Washington) (the University). The Group includes the University of Washington Medical Center (UW Medical Center), UW Medicine/Northwest dba Northwest Hospital & Medical Center (Northwest Hospital), UW Physicians Network dba UW Neighborhood Clinics (Neighborhood Clinics), The Association of University Physicians dba UW Physicians (UWP), Airlift Northwest (Airlift) and UW Medicine Shared Services. UW Medicine is governed and administered as an enterprise of the University whose mission is to improve the health of the public. UW Medicine also strives to facilitate the education of physicians and other health care providers, support research activities in collaboration with the University School of Medicine (the
which is to improved healthcare experience for the individual, improved health of the population, and more affordable care. The UW Medicine Board consists of community leaders appointed by the University of Washington Board of Regents. The UW Medicine Board advises and assists the chief executive officer and the dean of the School of Medicine in strategic planning and oversight of programs across the entities including Harborview Medical Center, the School, UW Medical Center, the Neighborhood Clinics, UWP, Northwest Hospital, Valley Medical Center and Airlift, collectively, UW Medicine. Harborview Medical Center (Harborview), a component unit of King County, Washington and a related party to the University, and is not reflected as part of the Group financial reporting entity. Valley Medical Center (VMC), a Washington public hospital district, is a discretely presented component unit of the University, and is not reflected as part of the Group financial reporting entity. The School is a public medical school affiliated with the University, but is not reflected as part of the Group financial reporting entity. UW Medical Center UW Medical Center is a 529 licensed-bed hospital and is a division of the University. Authority for specified governance functions of UW Medical Center has been delegated by the Board of Regents (the Regents) to the UW Medicine Board (the adopted by the Regents in 1976 and amended in February 2000. UW Medical Center is under the direction Officer for the management of UW Medical Center. Northwest Hospital Northwest Hospital is a Washington not-for-profit corporation, incorporated in 1949 whose sole corporate member is the University. Northwest Hospital is a 281-licensed bed, full-service medical facility primarily serving the healthcare needs of the residents of the King and Snohomish counties in Washington. Authority Board of Trustees (the Board). Northwest Hospital is under the direction of the Executive Director, who is

UW MEDICINE CLINICAL ENTERPRISE UW DIVISION Notes to the Financial Statements
June 30, 2016 (Dollars in thousands)
18
Northwest Hospital. UWP UWP, a Washington not-for-profit corporation and component unit of the University, was formed on August 30, 1983, for the exclusive benefit of the School. UWP employs the School faculty and bills and collects for their clinical services as an agent for the School. All revenues after payment of operating expenses and physician salaries are held for the benefit of the School under the Operating Agreement between UWP and the University (see Note 8). Airlift Airlift provides rapid emergency air transport services through one owned and eleven leased aircraft to critically ill or injured patients throughout Washington, Alaska, Montana, and Idaho. Airlift has been a division of the University since 2010. Airlift is under the direction of the Executive Director, who is
Neighborhood Clinics The Neighborhood Clinics, a Washington not-for-profit corporation and component unit of the University was formed in 1996. The Neighborhood Clinics were established for the benefit of the School, UWP, and its affiliated medical centers, exclusively for charitable, scientific, and educational purposes. The Neighborhood Clinics were organized to coordinate and develop patient care in a community clinical setting to enhance the academic environment of the School by providing additional sites of primary care practice and training for faculty, residents, and students. UW Medicine Shared Services UW Medicine Shared Services is comprised of a number of functions within the University, established for the purpose of providing scalable administrative and information technology support services for UW Medicine. These functions include UW Medicine IT Services, Revenue Cycle, UW Medicine Finance and Accounting, UW Medicine Supply Chain, UW Medicine Contracting and University of Washington Consolidated Laundry.
(2) Summary of Significant Accounting Principles (a) Accounting Standards
The accompanying financial statements are prepared in accordance with accounting principles generally accepted in the United States of America. financial statements and note disclosures are based on all applicable Government Accounting Standards Board (GASB) pronouncements and interpretations. The Group uses proprietary fund accounting.
(b) Basis of Accounting financial statements have been prepared using the accrual basis of accounting with the
economic resources measurement focus. Under this method of accounting, revenues are recognized

UW MEDICINE CLINICAL ENTERPRISE UW DIVISION Notes to the Financial Statements
June 30, 2016 (Dollars in thousands)
19
when earned and expenses are recorded when liabilities are incurred without regard to receipt or disbursement of cash.
(c) Use of Estimates The preparation of financial statements, in conformity with U.S. generally accepted accounting principles, requires management to make estimates and assumptions that affect the reported amounts of assets and liabilities and disclosures of contingent assets and liabilities at the date of the financial statements and the reported amounts of revenues and expenses during the reporting period. Actual results could differ from those estimates. Significant estimates in t financial statements include patient accounts receivable allowances and third-party payer settlements.
(d) Cash and Cash Equivalents Cash and cash equivalents include certain investments in highly liquid instruments with original maturities of three months or less at the date of purchase, excluding amounts whose use is limited by board designation. As of June 30, 2016 approximately $22,448 was held in cash and $12,188 was held in cash equivalents. Cash deposits of up to $250 are fully insured by the Federal Depository Insurance Corporation (FDIC).
(e) Funds Held by the University of Washington Operating and capital funds for certain entities within the Group are invested directly with the University. All balances are available on demand and are stated at fair value. In exchange, the University offers a stipulated rate of return determined at the end of the reporting period by the University based on pooled investment performance and the University s reserve fund goals. For fiscal year 2016, the rate used was 2%. Amounts classified as current assets are considered cash and cash equivalents for presentation in the statement of cash flows. Pooled iof the carrying value of the University Cash and Liquidity Pools. The Cash and Liquidity Pools were invested as follows at June 30:
2016Cash and cash equivalents 6.4 %Treasuries and agencies 73.0Mortgage related securities 8.6Asset-backed debt securities 7.0Corporate and other fixed income 5.0
Total 100.0 %
Concentrations of credit risk consist of pooled investments held on behalf of the Group at the University.

UW MEDICINE CLINICAL ENTERPRISE UW DIVISION Notes to the Financial Statements
June 30, 2016 (Dollars in thousands)
20
(f) Investments The Group holds investments in the form of equity securities, fixed-income securities, government obligations, and alternative investments. Fair value is determined based on quoted market prices. Alternative investments are reported at cost. Investment income, including realized and unrealized gains or losses, is reported as nonoperating revenue or expense. For UWP, investment income (including realized and unrealized gains and losses on investments) is a component of revenues as presented in note 2(r).
(g) Inventories Inventories consist primarily of surgical, medical, and pharmaceutical supplies in organized stores at various locations across the Group. Inventories are recorded at the lower of cost (first-in, first-out (FIFO)) or market.
(h) Capital Assets Capital assets, are stated at cost at acquisition or if acquired by gift, at fair value at the date of the gift. Additions, replacements, major repairs, and renovations are capitalized. Maintenance and repairs are expensed. The cost of the capital assets sold or retired and the related accumulated depreciation are removed from the accounts, and any resulting gain or loss is recorded in other expense in the statement of revenues, expenses, and changes in net position. Depreciation is calculated using the straight-line method over its estimated useful lives of the assets, generally 5 to 25 years for land improvements, 10 to 40 years for buildings, renovations, and furnishings, 5 to 25 years for fixed equipment, 3 to 20 years for movable equipment, and 3 to 5 years for software. Equipment under capital lease is amortized on the straight-line method over the shorter of the lease term or the estimated useful life of the equipment. Such amortization is included in depreciation in the statement of revenues, expenses, and changes in net position. Interest is capitalized on construction projects as a cost of the related project beginning with commencement of construction and ceases when the construction period ends and the related asset is placed in service. Interest capitalized during 2016 was $2,300 and is recorded in capital assets.
(i) UW Medicine IT Services Harborview provides advance funding to UW Medicine IT Services which entitles Harborview access to the enterprise-wide IT software and services. UW Medicine ITS records the funding as unearned revenue. The unearned revenue is reported within other current liabilities and other noncurrent liabilities on the statement of net position. At June 30, 2016, $10,400 is recorded in other current liabilities and $17,209 is recorded in other non-current liabilities.
(j) Compensated Absences Compensated absences represent the liability for employees with accumulated leave balances earned through various leave programs. These amounts would be payable if an employee terminated employment. Employees earn leave at varying rates depending upon their years of service and the

UW MEDICINE CLINICAL ENTERPRISE UW DIVISION Notes to the Financial Statements
June 30, 2016 (Dollars in thousands)
21
leave plan in which they participate. Annual and sick leave accrued at June 30, 2016 is $53,499. Compensated absences are reported within the accrued salaries, wages, and employee benefits on the statement of net position.
(k) Aviation Expenses Airlift contracts with two independent vendors to meet certain aviation service needs, including aircraft, pilots, flight planning, and maintenance. Flight costs include monthly fixed fees and variable fees based on hours flown and are expensed as incurred. Aviation expenses are reported in purchased services within the statement of revenues, expenses and changes in net position.
(l) Payable to Contractual Agencies The Group is reimbursed for Medicare inpatient, outpatient, psychiatric and rehabilitation services, and for capital and medical education costs during the year either prospectively or at an interim rate. The difference between interim payments and the reimbursement computed based on the Medicare filed cost report results in an estimated receivable from or payable to Medicare at the end of each year. The Medicare program s administrative procedures preclude final determination of amounts receivable from or payable to the Group until after the cost reports have been audited or otherwise reviewed and settled by Medicare. The estimated settlement amounts for Medicare cost reports and Certified Public Expenditures (CPE) payments that are not considered final are included in other receivables and payable to contractual agencies in the accompanying statement of net position.
(m) Classification of Revenues and Expenses statement of revenues, expenses, and changes in net position distinguish between
operating and nonoperating revenues and expenses. Operating revenues, such as patient service revenue and UWP billing revenues, net, result from exchange transactions associated with providing healthcare services - the primary business. Exchange transactions are those in which each party to the transaction receives and gives up essentially equal values. Operating expenses include all expenses, other than financing costs, incurred by the Group to provide healthcare services to t patients. Nonoperating revenues and expenses are recorded for certain exchange and nonexchange transactions. This includes investment income, donation income, interest expense, intergovernmental transfer expense, strategic funding to and from affiliates of UW Medicine, and equity earnings generated through investment in the Seattle Cancer Care Alliance (SCCA).
UW MEDICINE CLINICAL ENTERPRISE UW DIVISION Notes to the Financial Statements
June 30, 2016 (Dollars in thousands)
22
(n) Net Patient Service Revenues The Group has agreements with third-party payers that provide for payments to the Group at amounts different from its established rates. Payment arrangements include prospectively determined rates per discharge, reimbursed costs, discounted charges, and per diem payments. A summary of the payment arrangements with major third-party payers is as follows: Medicare Acute inpatient services rendered to Medicare program beneficiaries are paid at prospectively determined rates per discharge based on Medicare severity diagnosis-related groupings (MS-DRGs), as well as reimbursements related to capital costs. These rates vary according to a patient classification system that is based on clinical, diagnostic, and other factors. Payments for Medicare outpatient services are provided based upon a prospective payment system known as ambulatory payment classifications (APC s). APC payments are prospectively established and may be greater than or less than the actual charges for its services. The Medicare program utilizes the prospective payment system known as case mix group (CMGs) for rehabilitation services reimbursement. As with MS-DRGs, CMG payments are prospectively established and may be greater than or less than t actual charges for its services. Geropsychiatric services are also paid prospectively using a federal per diem payment rate adjusted for comorbidity and various adjustment factors. Third-party settlements are accrued on an estimated basis in the period the related services are rendered and adjusted in future periods as final settlements are determined. Medicaid Inpatient services rendered to Medicaid program beneficiaries are paid at approximate cost or hold harmless estimates and settled at prospectively determined rates per discharge. Outpatient services rendered are provided based upon the APC prospective payment system. Commercial The Group also has entered into payment agreements with certain commercial insurance carriers and preferred provider organizations. The basis for payment to the Group under these agreements includes prospectively determined rates per discharge, discounts from established charges, and prospectively determined daily rates. Exchange (HIX) Washington State health exchange entered into agreements with certain commercial insurance plans to provide patients access to healthcare services. The basis for payment to the Group under these agreements includes prospectively determined rates per discharge, discounts from established charges, and prospectively determined daily rates.
(o) Accountable Care Network UW Medicine has formed an accountable care network (ACN) with other health care organizations and healthcare professionals to share financial and clinical responsibility for the healthcare of particular populations of patients. The Group, as part of UW Medicine is a network member of the UW Medicine ACN and as such shares in any risk contract surplus or deficit based on agreed upon

UW MEDICINE CLINICAL ENTERPRISE UW DIVISION Notes to the Financial Statements
June 30, 2016 (Dollars in thousands)
23
contractual terms. Since its inception, the ACN has entered into various contracts which include provisions for shared risk as well as shared savings based on achieving certain quality and financial benchmarks. The Group, as part of UW Medicine and the other network members share in the financial risk or savings. At June 30, 2016, the Group has recorded a liability of $2,571 for its portion of the estimated liability related to these risk-sharing arrangements. The liability is reflected in due to related parties in the accompanying statement of net position.
(p) Charity Care The Group provides care without charge or at amounts less than established rates to patients who meet certain criteria under its charity care policy. Records are maintained to identify and monitor the level of charity care provided. These records include charges foregone for services and supplies furnished under its charity care policy to the uninsured and the underinsured. Because the Group does not pursue collection of amounts determined to qualify as charity care, these are not reported as net patient service revenue. aggregate relationship of costs to charges. The estimated cost of charity care provided for fiscal year ended June 30, 2016 was $17,216.
(q) UWP Accounting for Billing and Collection Services As billing agent, UWP bills and collects patient accounts for the benefit of the School. Amounts billed are reflected as part of revenues processed and amounts due to the Clinical Medicine Fund (CMF) and departments. As described in note 2(r), revenue, by agreement, is limited to operating expenses incurred. Accounts receivable from patients, net of allowances for discounts, contractual adjustments and collection losses, are assets of the School. The following represents the estimated net patient accounts receivable for which UWP will pursue collection on behalf of the School as of June 30, and which are not reflected in the accompanying financial statements:
2016Accounts receivable (net of credit balances of
$2,323) $ 79,720 Estimated allowances for discounts, contractual
adjustments, and collection losses (46,838) $ 32,882
The amounts above exclude receivables related to services performed by certain nonmember physicians that are billed and collected by UWP as a billing agent. Cash collected on these accounts is remitted monthly to affiliates, net of billing service fees.
(r) UWP Billing Activity As discussed in note 2(q), UWP acts as a billing agent for the School and as such collects cash for the benefit of the School. revenue, by agreement, is limited to the operating expenses

UW MEDICINE CLINICAL ENTERPRISE UW DIVISION Notes to the Financial Statements
June 30, 2016 (Dollars in thousands)
24
incurred. A reconciliation of the net billing activity processed for the benefit of the School and investment income to revenue recognized by UWP is as follows:
2016Net billings processed on behalf of the School:Professional fee revenue, net $ 291,301 Professional services supplemental payment (PSSP) and Provider access payment (PAP) program 38,674 Meaningful use incentive payments 9,068 Billing reimbursement 2,412
341,455 Investment income 899 Total net billings processed and investment income 342,354 Less:Amounts paid or due to affiliates (3,167) Amounts due to Clinical Medicine Fund and departments (108,546)
UWP Billing Revenues, net $ 230,641
(s) Federal Income Taxes UW Medical Center, Airlift, and UW Medicine Shared Services are divisions and/or departments of the University, and are not subject to federal income tax under Section 115 of the Internal Revenue Code (IRC), except for unrelated business income tax. There are no significant tax obligations at June 30, 2016. Northwest Hospital, UWP, and Neighborhood Clinics are exempt from federal income tax under section 501(c)(3) of the IRC, except for unrelated business income tax. There are no significant tax obligations at June 30, 2016.
(t) New Accounting Pronouncements In February 2015, the GASB issued Statement No. 72 Fair Value Measurement and Application, which is effective for the fiscal year ending June 30, 2016. This statement provides guidance for determining the fair value measurement for financial reporting purposes. It also provides guidance for applying fair value to certain investments and disclosures related to all fair value measurements. This statement establishes a three-level hierarchy of inputs to valuation techniques used to measure fair value and requires disclosures to be made about fair value measurements, the level of fair value hierarchy and valuation techniques. The Group adopted this standard during the fiscal year ending June 30, 2016. In June 2015, the GASB issued Statement No. 73, Accounting and Financial Reporting for Pensions and Related Assets That Are Not within the Scope of GASB Statement No. 68, and Amendments to Certain Provisions of GASB Statements No. 67 and No. 68. The guidance for plans not within the scope of Statement No. 68 will be effective for the fiscal year ending June 30, 2017. This statement

UW MEDICINE CLINICAL ENTERPRISE UW DIVISION Notes to the Financial Statements
June 30, 2016 (Dollars in thousands)
25
is intended to improve financial reporting of governments whose employees are provided with pensions that are not within the scope of No. 68 and improve the usefulness of information associated with governments that hold assets accumulated for purposes of providing defined benefit pensions not within the scope of Statement No. 68, and to clarify the application of certain provisions of statements No. 67 and 68. The Group is currently analyzing the impact of this statement. In June 2015, the GASB issued Statement No. 75 Accounting and Financial Reporting for Postemployment Benefits Other Than Pensions (OPEB), which is effective for the fiscal year ending June 30, 2018. This statement establishes standards of accounting and financial reporting for defined benefit OPEB and defined contribution OPEB that are provided to the employees of state and local governmental employers through OPEB plans that are administered through trusts or equivalent arrangements. This statement also establishes standards of accounting and financial reporting for OPEB plans that are not administered through trusts or equivalent arrangements. The Group is currently analyzing the impact of this statement. In June 2015, the GASB issued Statement No. 76, The Hierarchy of Generally Accepted Accounting Principles for State and Local Governments, which is effective for the fiscal year ending June 30, 2016. The objective of this statement is to identify the hierarchy of generally accepted accounting principles (GAAP). This Statement reduces the GAAP hierarchy to two categories of authoritative GAAP and addresses the use of authoritative and nonauthoritative literature in the event that the accounting treatment for a transaction or other event is not specified within a source of authoritative GAAP. There was no impact to the financial statements of the Group as a result of implementing this statement.
(3) Net Patient Service Revenues Net patient service revenue is reported at the estimated net realizable amounts from patients, third-party payers, and others for services rendered, including estimated retroactive adjustments under reimbursement agreements with third-party payers. Retroactive adjustments are accrued on an estimated basis in the period the related services are rendered and adjusted in future periods as final settlements are determined. In 2016, net patient service revenue includes approximately $5,373 relating to prior years net Medicare and Medicaid cost report settlements and revised estimates, including disproportionate share reimbursement and the CPE program at UW Medical Center and Northwest Hospital. The following are the components of net patient service revenues for the year ended June 30, 2016: Patient service revenues $ 3,658,837 Less adjustments to patient service revenues:Contractual discounts (2,117,985) Charity care (33,756) Provision for uncollectible accounts (23,535)
Total adjustments to patient service revenues (2,175,276) Net patient service revenues $ 1,483,561

UW MEDICINE CLINICAL ENTERPRISE UW DIVISION Notes to the Financial Statements
June 30, 2016 (Dollars in thousands)
26
The Group grants credit without collateral to its patients, most of whom are insured under third-party payer agreements. The mix of gross patient charges and gross receivables from significant third-party payers at June 30, 2016 was as follows:
Patientservice Accountscharges receivableMedicare 37% 31%Medicaid 18% 20%Commercial and other 43% 42%Exchange (HIX) 1% 2%Self-pay 1% 5%
Total 100% 100%
(a) Medicaid Certified Public Expenditure (CPE) Reimbursement UW Medical Center is reimbursed at the full cost of Medicaid inpatient covered services under the public hospital CPE payment method. Full cost payments are determined using the respective hospital s Medicaid ratio of cost to charges to determine the cost for covered medically necessary services. The costs will be certified as actual expenditures by the hospital and the State claims federal match on the amount of the related certified public expenditures. According to the Centers for Medicare and Medicaid Services (CMS) approved Medicaid State Plan, participating hospitals receive only the federal match portion of the allowable costs. UW Medical Center received $23,450 in claims payments under this program for the year ended June 30, 2016. In addition, UW Medical Center receives the federal match portion of Disproportionate Share (DSH) payments, which is the lesser of qualifying uncompensated care cost or the hospital s specific limit. UW Medical Center received $24,363 in DSH funding under this program for the year ended June 30, 2016. Since the inception of the program, the Washington State Legislature (the State) has provided, through an annual budget proviso, a hold harmless provision for hospitals participating in the CPE program. Through this proviso, hospitals participating in the CPE program, will receive no less in combined state and federal payments than they would have received under the previous payment methodology. In addition, the hold harmless provision ensures that participating hospitals receive DSH payments as specified in the legislation. In the event of a shortfall between CPE program payments and the amount determined under the hold harmless provision, the difference is paid to the hospitals as a grant from state only funds. UW Medical Center received $0 in state grants for the year ended June 30, 2016. Claims payments, DSH payments, and state grant funds are included in net patient service revenues in the statement of revenues, expenses, and changes in net position.

UW MEDICINE CLINICAL ENTERPRISE UW DIVISION Notes to the Financial Statements
June 30, 2016 (Dollars in thousands)
27
CPE payments are subject to retrospective determination of actual costs once UW Medical Center s Medicare Cost Report is audited. CPE program payments are not considered final until retrospective cost reconciliation is complete, after UW Medical Center receives its Medicare Notice of Program Reimbursements (NPR) for the corresponding cost reporting year. To date, only the 2007 CPE program year has had a final settlement. Interim state grant payments are retrospectively reconciled to hold harmless after actual claims are repriced using the applicable DRG payment methodology. This process takes place approximately 12 months after the end of the fiscal year and results in either a payable to, or receivable from, the state Medicaid Program. UW Medical Center has estimated the expected final settlement amounts based on the difference between CPE payments received and the estimated hold harmless amount. As of June 30, 2016, for fiscal years 2008 through 2016, UW Medical Center has an estimated payable for the CPE program of $22,100, which is recorded as a payable to contractual agencies in the accompanying statement of net position.
(b) Professional Services Supplemental Payment (PSSP) Program and Provider Access Payment (PAP) The professional services supplemental payment (PSSP) and provider access payment (PAP) are programs managed by the Washington State Healthcare Authority (HCA) benefiting certain public hospitals. Under the program, UW Medical Center, Harborview, Northwest Hospital, VMC, UWP, and Children s University Medical Group (CUMG) receive supplemental Medicaid payments for the physician and other professional services for which they bill. These supplemental payments equal the difference between the standard Medicaid reimbursement and the upper payment limit allowable by federal law. UW Medical Center, Harborview and VMC provide the nonfederal share of the supplemental payments that are used to obtain matching federal funds. UW Medical Center recorded $9,682 for the year ended June 30, 2016, in intergovernmental transfers (IGTs) to HCA related to professional claims paid in those fiscal years. This is included in funding to affiliates in the statement of revenues, expenses, and changes in net position. HCA used the federal match funds to make professional services supplemental payments for PSSP and through Medicaid managed care plans for PAP to UW Medicine entities. UW Medical Center and Northwest Hospital recognized $5,923 in supplemental payments for the year ended June 30, 2016. The supplemental payments are recorded in net patient service revenues in the statement of revenues, expenses, and changes in net position. UWP recognized $38,674 in supplemental payments for the year ended June 30, 2016 for the benefit of the School and are reflected as part of revenues processed and amounts due to the Clinical Medicine Fund (CMF) as shown in note 2(r). PSSP and PAP funds received through the CMF are combined with other revenues used by the School for the central support of faculty costs. As a result, the School requires less funding from UW Medical Center. The faculty support was reduced by $21,010 in fiscal year 2016. This reduction is included as an offset to purchased services in the statement of revenues, expenses, and changes in net position.

UW MEDICINE CLINICAL ENTERPRISE UW DIVISION Notes to the Financial Statements
June 30, 2016 (Dollars in thousands)
28
(c) Hospital Safety Net Program The Hospital Safety Net Assessment Act (HSNA) uses local funds obtained through an assessment levied on Prospective Payment System (PPS) hospitals and federal matching funds to increase Medicaid payments to hospitals. Under this program, PPS program hospitals are assessed a fee on all non-Medicare patient days. Under the original HSNA program, HSNA funds were used to prevent the significant budget cuts proposed during the 2009 session of the state legislature. The original legislation expired on June 30, 2013. In its 2013 session, the Washington State legislature passed a new assessment program that was similar to the original program in that the State will use federal matching funds to increase Medicaid hospital payments. Under the new HSNA program, PPS hospitals receive supplemental Medicaid payments, Critical Access Hospitals receive disproportionate share payments, and CPE hospitals receive state grants. The safety net assessment was subject to approval by the Center for Medicare and Medicaid Services before it took effect. CMS approved this program in 2014. The program has an expiration date of June 30, 2017. UW Medical Center is exempt from the assessment as the hospital is operated by an agency of the state government and also participates in the CPE program. UW Medical Center recognized grant funding of $4,455 for the year ended June 30, 2016, which is recorded in other revenue in the statement of revenues, expenses, and changes in net position. During the year ended June 30, 2016, Northwest Hospital recorded $6,121 related to assessment fee expense that is recorded in other expense on the statement of revenue, expenses, and changes in net position. At June 30, 2016, Northwest Hospital recorded a payable relating to the safety net assessment of $1,517. Northwest Hospital recognized increased reimbursements of $7,502 under this program for the year ended June 30, 2016 which are included in net patient service revenue in the statement of revenue, expenses, and changes in net position. At June 30, 2016, Northwest Hospital recorded a receivable relating to increased reimbursements of $1,053.
(d) Meaningful Use Incentives The American Recovery and Reinvestment Act of 2009 (ARRA) established incentive payments to eligible professionals and hospitals participating in Medicare and Medicaid programs that adopt certified electronic health records (EHRs) but only if the technology is being used in a meaningful way that supports the ultimate goals of improving quality, safety, and efficiency of care. Meaningful use is defined with specific quality performance metrics for eligible healthcare
professionals and hospitals. Certain thresholds must be met and maintained to receive payment. These amounts may be subject to future audits. The Group recognized meaningful use of $6,914 for the year ended June 30, 2016 which is included in other revenues in the statement of revenues, expenses, and changes in net position. UWP recognized $9,068 in supplemental payments for the year ended June 30, 2016 for the benefit of the School, which is reflected as part of revenues processed and amounts due to the CMF as shown in note 2(r).

UW MEDICINE CLINICAL ENTERPRISE UW DIVISION Notes to the Financial Statements
June 30, 2016 (Dollars in thousands)
29
(4) State Appropriation An appropriation is made by the State to the University on a biennial basis, specifically designated by the State for the training of future healthcare professionals and to upgrade the skills of current practitioners. UW Medical Center is designated as a division of the major program hospitals included within the total appropriation. Due to the nature of the designation, these amounts are included in other revenue in the accompanying statement of revenues, expenses, and changes in net position. UW Medical Center recognized $6,854 for the fiscal year ended June 30, 2016.
(5) Capital Assets The activity in t capital asset and related accumulated depreciation accounts for the year ended June 30, 2016 are set forth below:
June 30, June 30,2015 Additions Transfers Retirements 2016
Capital assets, not beingdepreciated:
Land $ 13,766 13,766 Art 1,420 12 1,432 Construction in process 138,034 107,050 (183,481) (378) 61,225
Total capitalassets, notbeing depreciated 153,220 107,062 (183,481) (378) 76,423
Capital assets, being depreciated:Land improvements 16,173 58 16,231 Buildings, renovations, and
furnishings 748,144 843 129,606 (20) 878,573 Fixed equipment 158,707 336 9,233 168,276 Movable equipment 613,357 2,576 44,663 (5,989) 654,607
Total capital assets,being depreciated 1,536,381 3,755 183,560 (6,009) 1,717,687
Total capital assetsat historical cost 1,689,601 110,817 79 (6,387) 1,794,110
Less accumulated depreciation for:Land improvements (8,743) (616) (9,359) Buildings, renovations, and
furnishings (350,905) (30,991) 313 7 (381,576) Fixed equipment (131,533) (3,800) 245 (135,088) Movable equipment (479,389) (51,369) (511) 5,775 (525,494)
Total accumulateddepreciation (970,570) (86,776) 47 5,782 (1,051,517)
Total capital assets,net $ 719,031 24,041 126 (605) 742,593

UW MEDICINE CLINICAL ENTERPRISE UW DIVISION Notes to the Financial Statements
June 30, 2016 (Dollars in thousands)
30
Capital assets, net include intangible assets, net of accumulated amortization of $33,344 as of June 30, 2016.
(6) Investments The majority of investments correspond to assets designated by the Board for future capital improvements and replacements, assets designated for restricted purposes, and investments held for the benefit of the School. The respective boards of the Group are responsible for the management of investments by establishing investment policies that are carried out by external investment managers approved by the boards. There are many factors that can affect the value of investments. Some, such as custodial risk, concentration of credit risk, and foreign currency risk may affect both equity and fixed income securities. Equity securities respond to factors such as economic conditions, individual company earnings performance, and market liquidity, while fixed income securities are particularly sensitive to credit risks and changes in interest rates. The composition of the carrying amounts of investments, by type, at June 30, 2016 is as follows:
2016Nonalternative investments, at fair value:Money market $ 2,740 Mutual funds 104,357 Corporate bonds 6,042 US governmental agency securities 4,054 US Treasury securities 3,765 Other 1,290
Total nonalternative investments 122,248 Alternative investments, at cost:Limited liability partnership 7,193 Limited liability corporation 1,200 Common commingled trust funds 14,340
Total alternative investments 22,733 Total investments $ 144,981
Alternative investments, which are reported at cost, have estimated fair value of approximately $23,424 as of June
(a) Credit Risk Fixed income securities are subject to credit risk, which is the risk that the issuer or other counterparty to a financial instrument will not fulfill its obligations, or negative perceptions of the
ment in a single issuer.

UW MEDICINE CLINICAL ENTERPRISE UW DIVISION Notes to the Financial Statements
June 30, 2016 (Dollars in thousands)
31
Investments subject to credit risk (as determined through a nationally recognized rating agency Standard & Poor s) are presented in the table below:
U.S. Investment Not Investment DurationInvestments Government Grade* Grade Not Rated Total (In Years)U.S. Treasury notes 3,765$ -$ -$ -$ 3,765$ 7.46 Domestic corporate bonds 3,931 264 1,847 6,042 6.33 Other agency securities 112 3,942 4,054 2.70 Total 3,765$ 4,043$ 264$ 5,789$ 13,861$ 5.50
*Investment grade securities are those that are rated BBB and higher by Standard and Poor's. Investments in securities of the following issuers represent 5% or more of total investments, at carrying value, at June 30, 2016. Investments issued or explicitly guaranteed by the U.S. government and investments in mutual funds, external investment pools, and other pooled investments are excluded.
2016 PercentageCarrying of totalvalue investmentsMarathon-London International Investment Trust I $ 9,176 6%
(b) Interest Rate Risk
The Group manages interest rate risk through construction of a broadly diversified portfolio that seeks to assume only the interest rate risk necessary to achieve the long-term goals in terms of
-product of risk/return targets, rather than the inverse.
(c) Fair Value Hierarchy The following table sets forth, by level, within the fair value hierarchy, the investments carried at fair value as of June 30, 2016:
Level I Level 2 Level 3 TotalMoney market mutual funds $ 2,740 - - 2,740 Mutual Funds 104,357 - - 104,357 Corporate bonds - 6,042 - 6,042 Other US governmental agency securities - 4,054 - 4,054 US Treasury securities 3,765 - - 3,765 Other 1,290 - - 1,290 Total Investments at Fair Value $ 112,152 10,096 - 122,248

UW MEDICINE CLINICAL ENTERPRISE UW DIVISION Notes to the Financial Statements
June 30, 2016 (Dollars in thousands)
32
(d) Investment Income Net appreciation in the fair value of nonalternative investments includes both realized and unrealized gains and losses on investments. The calculation of realized gains and losses is independent of the net appreciation of the fair value of investments. Realized gains and losses on investments that have been held longer than the current reporting period and are sold in the current period include the net appreciation of these investments reported in the prior periods. UWP investment income is recorded in UWP billing revenues, net as presented in note 2(r), however, investment income is presented below. Investment income comprises the following at June 30:
2016Dividend and interest income $ 9,080 Net realized (losses) gains (2,450) Net unrealized gains (losses) 1,459
Total investment income $ 8,089
(7) Long-Term Debt and Capital Leases Long-term debt, reported as a part of noncurrent liabilities, consists of the following as of June 30, 2016:UW Medical Center Internal Lending Program Debt:Expansion Project, 4.75% interest rate, through 2046 $ 255,966 All other debts, 3.5% to 5.0% interest rates 47,690 Northwest Hospital note payable to the University, at 4.75% annual debt service including interest of $5,928 through 2032,secured by an interest in Northwest Hospital's gross receivables and certainproperty and equipment 68,608 Northwest Hospital note payable at 4.65%, monthly installments including interest of $59 through July 2032; secured by a medical office building 8,017 Northwest Hospital note payable at 4.60%, monthly installments including interest of $30 through July 2016 and final payment of approximately $3,929 due August 2016 secured by a medical office building 3,928 Capital leases for medical office building and equipment 1,513
Total long-term debt 385,722 Less current portion (18,816)
Total long-term debt, net of current portion $ 366,906
(a) Long-term Debt Overview UW Medical Center Under the Debt Management Policy: Statement of Objectives and Policies UW Medical Center obtains capital financing through the University s Internal Lending Program (ILP). The ILP is an internal financing pool intended to lower the University s overall cost of capital and provide a

UW MEDICINE CLINICAL ENTERPRISE UW DIVISION Notes to the Financial Statements
June 30, 2016 (Dollars in thousands)
33
predictable borrowing rate for borrowers within the University. These loans are funded through the issuance of General Revenue bonds and notes. The ILP program policies include a provision for a rate stabilization reserve and a provision for rate adjustments if necessary. Effective, April 1, 2015, the University Board of Regents reduced the ILP fixed interest rate 75 basis points from 5.5% to 4.75% and effective July 1, 2016, the ILP interest rate was reduced 25 basis points to 4.50%. UW Medical Center signed an ILP financing agreement to fund the Montlake Tower expansion project (Expansion Project) in fiscal year 2009. As part of this financing agreement with the ILP, UW Medical Center has agreed to maintain a debt service coverage ratio of 1.25 and days cash on hand of 75 days. Management believes it was in compliance with these financial ratios at June 30, 2016. All other debts borrowed from ILP have interest rates ranging from 3.5% to 5.5% and have annual maturities between fiscal years 2016 and 2028. Northwest Hospital In 2015, the University provided Northwest Hospital funds that were combined with the balance of held by the Washington Healthcare Facilities Authority (WHCFA) bond trustee. The funds deposited were sufficient to prepay amounts due to the WHCFA to legally defease and advance refund the Series 2007 Revenue Bonds. Northwest Hospital entered into a financing agreement with the University to obtain funds for the defeasance and advance refunding of the Series 2007 Revenue Bonds. The total amount financed was $71,306. Under the terms of this agreement, Northwest Hospital shall maintain annual debt service coverage equal to at least 1.25 and days cash on hand equal to at least 50 days. Management believes it was in compliance with these financial ratios at June 30, 2016. As a result of the above transaction, Northwest Hospital incurred a $6,435 loss on refinancing, which was recorded as a deferred outflow of resources on the statement of position in 2015. The loss will be amortized to interest expense using the effective interest method over the remaining term of the note. The unamortized loss on refinancing at June 30, 2016 is $6,066.

UW MEDICINE CLINICAL ENTERPRISE UW DIVISION Notes to the Financial Statements
June 30, 2016 (Dollars in thousands)
34
(b) Long-Term Debt Maturities The following schedule shows debt service requirements, for the next five years and thereafter, as of June 30, 2016, using the interest rates, for both principal and interest:
Principal Interest Total2017 $ 18,816 17,323 36,139 2018 14,947 16,538 31,485 2019 15,496 15,834 31,330 2020 16,186 15,100 31,286 2021 16,748 14,335 31,083 86,728 59,275 146,003 81,358 40,148 121,506 75,779 21,653 97,432 29,468 9,725 39,193 Thereafter 30,196 3,581 33,777
Total payments $ 385,722 213,512 599,234
(c) Changes in Long-term Debt and Capital Leases Changes in long-term debt and capital leases during the fiscal year ended June 30, 2016 are summarized below (in thousands):
Balance Balance DueJune 30, June 30, within
2015 Increases Decreases 2016 one yearUW Medical Center ILP Debt:
Expansion Project $ 221,737 38,312 (4,083) 255,966 6,180 All other debts 52,246 (4,556) 47,690 4,622
71,306 (2,698) 68,608 2,816 Other note payables 12,446 (501) 11,945 4,272 Capital leases 757 1,520 (764) 1,513 926
Total noncurrentliabilities $ 358,492 39,832 (12,602) 385,722 18,816
(8) Physician Distributions, Clinical Medicine Fund, and Departmental Payables
Receipts collected by UWP are allocated and dis Income Distribution CMF, and departmental payables are recorded in the amounts due to the respective payable accounts.

UW MEDICINE CLINICAL ENTERPRISE UW DIVISION Notes to the Financial Statements
June 30, 2016 (Dollars in thousands)
35
The payables are comprised of the following at June 30: 2016
Physician Distributions $ 18,694 Clinical Medicine Fund payable 33,151 Departmental payables 45,571
Total physician distribution, clinical medicinefund and departmental payables $ 97,416
(9) Risk Management The Group is exposed to risk of loss related to professional and general liability, property loss and injuries to employees. UW Medical Center and Airlift participates in risk pools managed by the University to mitigate risk of loss related to these exposures. The other members of the Group mitigate risk of loss through a combination of participating in the risk pool managed by the University and commercial insurance products. All of the entities participate in the professional liability program managed by the University. The University s professional liability program currently includes self-insured and commercial reinsurance coverage components. annual funding to the professional liability program is determined by the University administration using information from an annual actuarial study. The actuary used a discount rate of 5.5% for 2016 in recognition of the expected earnings of the self-insurance fund and other factors. In addition to the University, the participants in the professional liability program include the Group, , School of Dentistry, the School, and Harborview. The various participants in the program contribute to the self-insurance fund and share in the expenses of the Health Sciences Risk Management Office.
contribution to the professional liability program was $10,843 in fiscal year 2016 and recorded in other expense on the statement of revenues, expenses, and changes in net position.
(10) Benefit Costs Benefit costs are pooled centrally for all University employees, which for the Group includes University employees deployed at UW Medical Center, Airlift, and UW Medicine Shared Services. Annually, the University reviews total employee benefit costs and prepares standard benefit load rates by employment classification. These benefit costs cover employee healthcare expense, woremployment taxes and retirement plans. Departments, divisions, agencies, component units, and related parties of the University that have University employees qualifying for employee benefit coverage are charged a cost allocation using the determined benefit load rate and budgeted salary dollars by employment classification. All funding of obligations are on a pay-as-you-go basis. At the end of the reporting period, the cost allocation is compared to actual benefit costs and differences between actual and budgeted costs are included as a component of the benefit load rates charged in the following year.

UW MEDICINE CLINICAL ENTERPRISE UW DIVISION Notes to the Financial Statements
June 30, 2016 (Dollars in thousands)
36
(a) Retirement and Other Postretirement Benefit Plans University employees can participate in the following state and University sponsored retirement and other postretirement benefit plans: University of Washington Retirement Plan (UWRP) (the 403(b)) UWRP is a defined-contribution plan administered by the University. All faculty and professional staff are eligible to participate in the plan. Contributions to UWRP are invested by participants in annuity contracts or mutual fund accounts offered by one or more fund sponsors. Employees have at all times a 100% vested interest in their accumulations. Benefits from fund sponsors are available upon separation or retirement at the member s option. Revised Code of Washington (RCW) 28B.10.400 et. seq. assigns the authority to the University Board of Regents to establish and amend benefit provisions. Funding is determined by employee age and ranges from 5% to 10% of employee salary. Funding obligations are calculated at the University level and the University allocates expense to department, divisions, agencies, and component units through the benefit load. Based on the University s benefit load apportionment, the Group incurred and paid $9,156 in fiscal year 2016 related to annual UWRP funding, which is recorded in employee benefits expense on the statement of revenues, expenses, and changes in net position. University of Washington Supplemental Retirement Plan (the 401(a) Plan) The 401(a) Plan provides for a supplemental payment component, which guarantees a minimum retirement benefit based upon a one-time calculation at each eligible participant s retirement date. The University makes direct payment to qualifying retirees when the retirement benefits provided by UWRP do not meet the benefit goals. The University receives an independent actuarial valuation to determine funding needs for the supplemental payment component of UWRP. The funding obligation is determined at the University level and the University allocates expense to departments, divisions, agencies, and component units through the benefit load. This plan is closed to new participants. Based on the University s benefit load apportionment, the Group incurred and paid $1,496 in fiscal year 2016, related to annual 401(a) Plan funding, which is recorded in employee benefits expense on the statement of revenues, expenses, and changes in net position. Other Post-Employment Benefits (OPEB) All University employees are eligible for participation in healthcare and life insurance programs administered by the HCA. University retirees may elect coverage through state health and life insurance plans, for which they pay less than the full cost of the benefits based on their age and other demographic factors. The Office of the State Actuary determines total OPEB obligations at the State level using individual state employee data, including age, retirement eligibility, and length of service. Information to support actuarial calculations at the division, department, or component unit level is not available. The State is ultimately responsible for the obligation; therefore, the annual required contribution (ARC) is not recorded at the University or its departments, divisions, agencies, or component units.

UW MEDICINE CLINICAL ENTERPRISE UW DIVISION Notes to the Financial Statements
June 30, 2016 (Dollars in thousands)
37
(b) The University offers several contributory pension plans administered by the Washington State Department of Retirement Systems (DRS)Retirement System plan which is a defined-benefit retirement plan. Plan Descriptions of the DRS Plans
(PERS) PERS retirement benefit provisions are contained in chapters 41.34 and 41.40 RCW. PERS is a cost-sharing multiple-employer retirement system comprised of three separate pension plans for membership purposes. PERS Plan 1 and PERS Plan 2 are defined benefit plans, and PERS Plan 3 is a defined benefit plan with a defined contribution component. PERS members include higher education employees not participating in other higher education retirement programs. For accounting purposes, PERS is reported as three separate plans. Plan 1 accounts for the defined benefits of Plan 1 members, Plan 2/3 accounts for the defined benefits of Plan 2 and Plan 3 members, and Plan 3 accounts for the defined contribution portion of Plan 3 members. The defined benefit portions of Plan 2 and Plan 3 are accounted for in the same pension trust fund, and all assets of Plan 2/3 may legally be used to pay the defined benefits of any of the Plan 2 or Plan 3 members or beneficiaries. Vesting and Benefits Provided PERS Plan 1 PERS Plan 1 provides retirement, disability and death benefits. The plan is closed to new entrants. All members were vested after the completion of five years of eligible service. Retirement benefits are determined as two
-paid consecutive service months. The retirement benefit may not exceed 60% of the AFC. Members are eligible for retirement from active status at any age with at least 30 years of service, at age 55 with at least 25 years of service, or at age 60 with at least five years of service. Members retiring from inactive status prior to the age of 65 may receive actuarially reduced benefits. Other benefits include duty and nonduty disability payments, an optional cost-of living allowance (COLA), and a one-time duty-related death benefit, if the member is found eligible by the Washington State Department of Labor and Industries. PERS Plan 2/3 PERS Plan 2/3 provides retirement, disability and death benefits. PERS Plan 2 members are vested after completion of five years of eligible service. PERS Plan 3 members are vested in the defined benefit portion of their plan after 10 years of service or after five years of service if 12 months are earned after age 44. Retirement benefits are determined as two years of service for Plan 2, and one

UW MEDICINE CLINICAL ENTERPRISE UW DIVISION Notes to the Financial Statements
June 30, 2016 (Dollars in thousands)
38
-paid consecutive service months. There is no cap on years of service credit. Members are eligible for retirement with a full benefit at age 65 with at least five years of service credit. Retirement before age 65 is considered early retirement. Members are eligible for early retirement with a reduced benefit at age 55 with at least 20 years of service credit. The benefit is reduced by a factor that varies according to age, for each year before age 65. Members who are age 55 with at least 30 years of service credit can retire under one of two provisions, if hired prior to May 1, 2013: With a benefit that is reduced by 3% for each year before age 65; or With a benefit that has less, or no, reduction (depending on age) but imposes stricter
return-to-work rules If hired on or after May 1, 2013, members have the option to receive a benefit that is reduced by 5% for each year before age 65. Retirement benefits are actuarially reduced to reflect the choice of a survivor benefit. Other benefits include duty and non-duty disability payments, a cost-of-living allowance (based on the Consumer Price Index) capped at three percent annually, and a one-time duty-related death benefit, if the member is found eligible by the Washington State Department of Labor and Industries. Fiduciary Net Position The pension reported by the pension plans. DRS financial statements have been prepared in conformity with generally accepted accounting principles (GAAP). The retirement plans are accounted for in pension trust funds using the flow of economic resources measurement focus and the accrual basis of accounting. Member contributions are recognized as revenues in the period in which the contributions are earned. Employer contributions are recognized when due, and the employer has made a formal commitment to provide the contributions. Benefits and refunds are recognized when due, and payable in accordance with the terms of each plan. RCW (Chapter 43.33 A) authorizes The Washington State Investment Board (WSIB) to have the investment management responsibility for the pension funds. Investments are reported at fair value, and unrealized gains and losses are included as investment income in the Statement of Changes in Fiduciary Net Position presented in the DRS Comprehensive Annual Financial Report. Purchases and sales of investments are recorded on a trade-date basis. DRS publishes an annual report for retirement plans, which is available at: http://www.drs.wa.gov/administration/annualreport/.

UW MEDICINE CLINICAL ENTERPRISE UW DIVISION Notes to the Financial Statements
June 30, 2016 (Dollars in thousands)
39
Actuarial Assumptions Accounting requirements dictate the use of assumptions to best estimate the impact that pension obligations will have on the Group. The professional judgments used in determining these assumptions are important, and can significantly impact the resulting actuarial estimates. Differences financial statements. The total pension liability for each DRS plan was determined by an actuarial valuation, conducted by the Washington State Office of the State Actuary (OSA). on an OSA valuation performed as of June 30, 2014, with the results roll forward to the measurement date of June 30, 2015. The following actuarial assumptions have been applied to all prior periods included in the measurement: Inflation 3.0% total economic inflation, 3.75% salary inflationSalary increase Expected to grow by promotions and longevity in addition to
salary inflation assumptionInvestment rate of return 7.50%
Mortality rates were based on the RP-2000 Combined Healthy Table and Combined Disabled Table recommended by the RCEP, the OSA applied offsets to the base table and recognized future improvements in mortality by projecting the mortality rates using 100% Scale BB. Mortality rates are applied on a generational basis, meaning members are assumed to receive additional mortality improvements in each future year, throughout their lifetime. The actuarial assumptions used in the June 30, 2014 valuation was 2007-2012 Experience Study, which is a comprehensive review and update of prior actuarial assumptions. Additional assumptions for subsequent events and law changes are current as of the 2014 actuarial valuation report. The long-term expected rate of return on pension plan investments was determined by the Washington State Investment Board (WSIB) using a building block method in which a best estimate of expected future rates of return (expected returns, net of pension plan investment expense, but including inflation) are developed for each major asset class. Those expected returns make up one asset allocation to simulate future investment returns over various time horizons. The long-term expected rate of return of 7.50% approximately equals the median of the simulated investment returns over a 50-year time horizon, adjusted to remove or damper any short term changes that are not expected over the entire 50-year measurement period.

UW MEDICINE CLINICAL ENTERPRISE UW DIVISION Notes to the Financial Statements
June 30, 2016 (Dollars in thousands)
40
Best estimates of arithmetic real rates of return for each major asset class included in the target asset allocation for each pension plan, as of the measurement dates of June 30, 2015 are summarized in the following table:
2015% Long-termexpectedreal rate ofTarget returnallocation arithmeticAsset class:Fixed income 20.00% 1.70%Tangible assets 5.00 4.40Real estate 15.00 5.80Global equity 37.00 6.60Private equity 23.00 9.60
The inflation components used to create the above table are 2.20% for the measurement date as of June -term estimate of broad economic inflation. Discount Rate The discount rate used to measure the total University employee pension liabilities as of June 30, 2016 was 7.50%. The projection of cash flows used to determine the discount rate assumed that contributions from plan members will be made at contractually required rates, and that contributions from employers will be made at statutorily required rates, actuarially determined (including the component of PERS 2/3 employer rates pertaining to the unfunded actuarial accrued liabilities for PERS 1). Based on those assumptions, the fiduciary net position for each pension plan in which the Group participates was projected to be sufficient to make all projected future benefit payments of the current plan members. Therefore, the long-term expected rate of return on pension plan investments was applied to all periods of projected benefit payments to determine the total pension liability. Using the WSIB long-term expected rate of return, a 7.50% future investment rate of return on pension plan investments was assumed for the test. The expected return on plan assets is the estimated long-term rate of return that will be earned on the investments used to fund the pension obligation. Contributions from plan members and employers were assumed to continue to be made at contractually required rates (including the component of PERS 2/3 employer rates pertaining to the unfunded actuarial accrued liabilities for PERS 1 as provided for in Chapter 41.45 of the RCW).

UW MEDICINE CLINICAL ENTERPRISE UW DIVISION Notes to the Financial Statements
June 30, 2016 (Dollars in thousands)
41
Sensitivity of the Net Pension Liability (Asset) to Changes in the Discount Rate
7.50%, as well as what the net pension liability would be if it were calculated using a discount rate that is 1-percentage-point lower (6.50%) or 1-percentage-point higher (8.50%) than the current rate.
2016Current
1% Decrease discount rate 1% IncreasePlan:
PERS 1 $ 179,102 147,106 119,592 PERS 2/3 367,731 125,761 (59,508)
Employer Contribution Rates Employer contribution rates are developed in accordance with Chapter 41.45 of the RCW by the OSA, and include an administrative expense component that is currently set at 0.18%. The statute provides authority to the Pension Funding Council to adopt changes to economic assumptions and contribution rates. The contribution rates and required contributions for each PERS plan in which the University participates are shown in the table below.
Description PERS Plan 1 PERS Plan 2 /3i
Contributions as June 30, 2016:Contribution Rate 11.18% 11.18%Contributions made $ 16,157 20,642
1. Plan 2/3 employer rate includes a component to address the Plan 1 unfunded actuarial accrued liability
Collective pension amounts are determined as of a measurement date, which can be no earlier than Group as of June 30, 2016 was June 30, 2015. Employer contributions received and processed by DRS during the fiscal year ended June 30, 2015 have been used as the basis for determining each
30, 2015 Schedules of Employer and Nonemployer each DRS plan for the year ended June 30, 2016 is shown in the table below.
Proportionate SharePERS 1 PERS 2/3
2.81% 3.52%
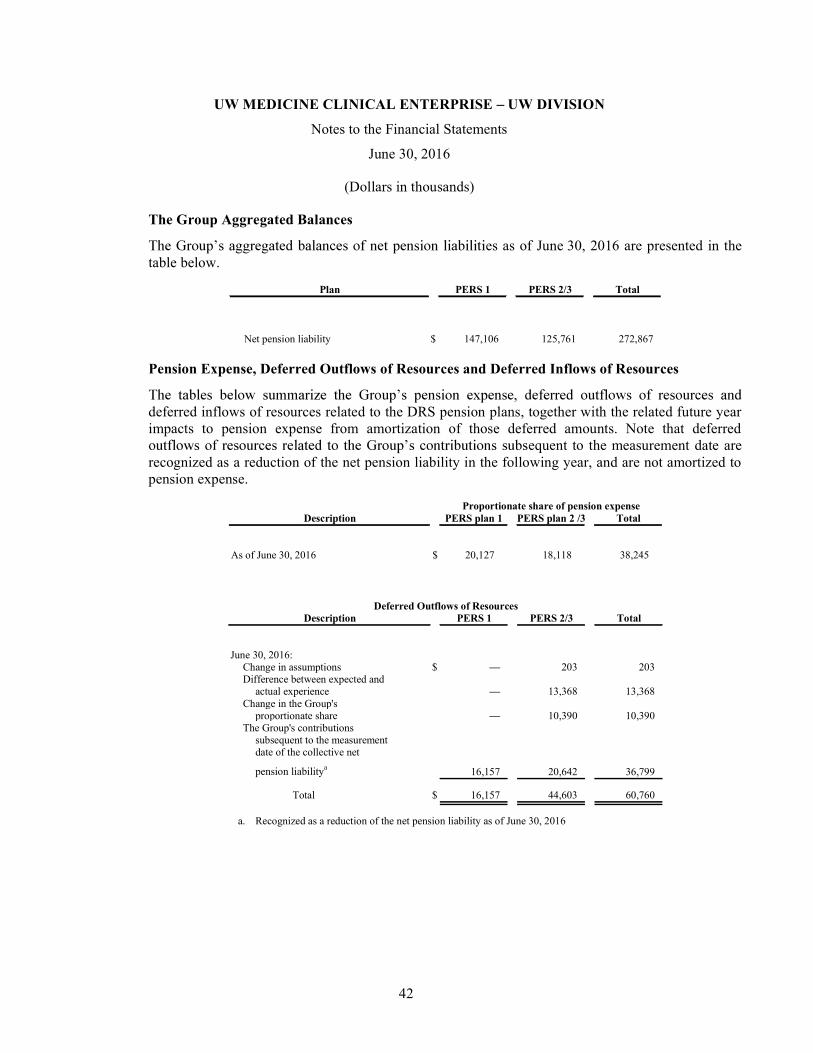
UW MEDICINE CLINICAL ENTERPRISE UW DIVISION Notes to the Financial Statements
June 30, 2016 (Dollars in thousands)
42
The Group Aggregated Balances es as of June 30, 2016 are presented in the
table below. Plan PERS 1 PERS 2/3 Total
Net pension liability $ 147,106 125,761 272,867 Pension Expense, Deferred Outflows of Resources and Deferred Inflows of Resources
deferred inflows of resources related to the DRS pension plans, together with the related future year impacts to pension expense from amortization of those deferred amounts. Note that deferred
equent to the measurement date are recognized as a reduction of the net pension liability in the following year, and are not amortized to pension expense.
Proportionate share of pension expenseDescription PERS plan 1 PERS plan 2 /3 Total
As of June 30, 2016 $ 20,127 18,118 38,245
Deferred Outflows of ResourcesDescription PERS 1 PERS 2/3 Total
June 30, 2016:Change in assumptions $ 203 203 Difference between expected and
actual experience 13,368 13,368 Change in the Group's
proportionate share 10,390 10,390 The Group's contributions
subsequent to the measurementdate of the collective netpension liabilitya 16,157 20,642 36,799
Total $ 16,157 44,603 60,760 a. Recognized as a reduction of the net pension liability as of June 30, 2016

UW MEDICINE CLINICAL ENTERPRISE UW DIVISION Notes to the Financial Statements
June 30, 2016 (Dollars in thousands)
43
Deferred Inflows of ResourcesDescription PERS 1 PERS 2 /3 Total
June 30, 2016:Difference between projected and
actual earnings on planinvestments, net $ 8,049 33,572 41,621
Change in the Group'sproportionate share
Total $ 8,049 33,572 41,621
Description PERS Plan 1 PERS Plan 2/3 TotalDeferred outflows of resources related
to the Group contributions subsequentto the measurement date that will berecognized as a reduction of the netpension liability as of June 30, 2017 $ 16,157 20,642 36,799
Deferred outflows of resources relatedto the Group contributions subsequentto the measurement date that will berecognized as a reduction of the netpension liability as of June 30, 2016 $ 12,940 15,652 28,592
Amortization of deferred inflows and
deferred outflows of resourcesYear PERS Plan 1 PERS Plan 2/3 Total
2016 $ (3,119) (5,900) (9,019) 2017 (3,119) (5,900) (9,019) 2018 (3,119) (5,900) (9,019) 2019 1,309 10,258 11,567 2020Thereafter
Total $ (8,048) (7,442) (15,490)
(11) Other Retirement Plans (a) Northwest Hospital Retirement Plans
401(k) Profit Sharing Plan All employees of Northwest Hospital are covered by the Northwest Hospital & Medical Center 401(k) Profit Sharing Plan (the 401(k) Plan), a defined-contribution plan. Northwest Hospital, as Plan Sponsor, contributes based on a defined formula, with participants immediately vesting in all employer and employee contributions. Employee contribution rates can vary from 1% to 80% of gross compensation, as defined by the Plan, subject to certain limitations under the Internal Revenue Code. The 401(k) Plan provides for employer matching contributions for each participant who makes 401(k) tax-deferred contributions to this Plan and for each highly compensated employee of Northwest Hospital who makes salary reduction contributions to the 403(b) salary

UW MEDICINE CLINICAL ENTERPRISE UW DIVISION Notes to the Financial Statements
June 30, 2016 (Dollars in thousands)
44
employer contributions to the 401(k) Plan during the fiscal year ended June 30, 2016 are approximately $8,189 and $4,440, respectively. 403(b) Retirement Plan Highly compensated employees who are not employed by a taxable affiliate of Northwest Hospital and who are not participating in the 401(k) Plan are eligible to participate in the Northwest Hospital & Medical Center 403(b) Retirement Plan (the 403(b) Plan). The 403(b) Plan is a defined-contribution plan, which includes a qualified cash or deferred arrangement. Employee contribution rates can vary from 1% to 80% of gross compensation, as defined by the Plan, subject to certain limitations under the IRC. The Plan does not provide employer contributions. The employee contributions to the 403(b) Plan during the fiscal year ended June 30, 2016 are approximately $2,159.
(b) UWP Pension Plan UWP has a mandatory, noncontributory defined-contribution pension plan, The Association of University Physicians Pension Plan (the Plan). The Plan covers all employees meeting service requirements and employed on a regular, permanent basis. The Association contributes an amount equal to 9% of eligible compensation for each participant under age 50 and 10% for each participant age 50 and older. Eligible compensation includes the Association annual salary, plus amounts paid under the Income Distribution Plan, bonuses, and administrative overtime pay. On termination of service due to death, disability, or retirement, a participant or beneficiary may elect to receive either a lump-sum distribution or an annuity to be paid in monthly installments over a fixed reasonable period of time, not exceeding life expectancy of the participant or designated beneficiary. For termination of service due to other reasons, a participant may elect the value of the vested interest in his or her account as a lump-sum distribution. If a participant reaches normal retirement age (65), dies or becomes disabled while employed by the UWP, vesting is 100%. Additionally, under circumstances, individuals who transfer employment at UWP to employment by the University also are immediately vested. In the event of termination of employment for reasons other than retirement, death, disability or University transfer, participants shall be entitled to benefits, which starts with 25% vested after two years of service, 50% vested after three years of service, 75% vested after four years of service and 100% vested after five years of service. Total pension expense was approximately $13,638, net of forfeitures of $284 in fiscal year 2016 and is recorded in benefits expense within the statement of revenues, expenses, and changes in net position. The Association had no liability outstanding for pension contributions at June 30, 2016.
(c) Neighborhood Clinics 401(k) Retirement Plan The Neighborhood Clinics offer a 401(k) plan covering substantially all employees meeting certain age and service requirements, administered by the clinics. The Neighborhood Clinics make annual contributions of 6% of compensation, which starts with 25% vested after two years of service, 50% vested after three years of service, 75% vested after four years of service, and 100% vested after

UW MEDICINE CLINICAL ENTERPRISE UW DIVISION Notes to the Financial Statements
June 30, 2016 (Dollars in thousands)
45
five years of service. Employer contributions were approximately $942 for the year ended June 30, 2016 and forfeitures were approximately $94. In addition, the 401(k) plan includes an employee self elected deferral plan.
(12) Related Parties The Group has engaged in a number of transactions with related parties. These transactions are recorded by the Group as either revenue or expense transactions because economic benefits are either provided or received by the Group. The Group records cash transfers from related parties that are not the result of economic benefits and are presented as nonoperating revenue on the statements of revenues, expenses, and changes in net position. (a) University of Washington
University divisions provide various levels of support to the Group. The following is a summary of services purchased. The School The Group purchases a variety of clinical and administrative services from the School, which includes laboratory services and resident and faculty support. The Group also transfers a portion of its Medicare reimbursement for medical education to the School in support of teaching costs. The amounts for these services are shown below (see (h)). UW Medicine Central Costs UW Medicine Central Costs represents services provided to the Group such as executive leadership, advancement, compliance, telemedicine, community relations staffing, medical staff oversight, marketing, and other administrative services related to UW Medicine. The amounts paid by the Group for these services are shown below (see (h)). Other Divisions of the University In addition to the divisions and transactions identified above, the Group purchases information technology services, general and professional liability insurance, printing, internal audit, accounting, temporary staffing, and other administrative and operational services from other divisions of the University. The amounts for these transactions are shown below (see (h)).
(b) UW Neighborhood Clinics Under an annual agreement, the UW Medicine hospitals provided strategic funding to the Neighborhood Clinics for operations and capital purposes. For the year ended June 30, 2016, total funding from the UW Medicine hospitals to the Neighborhood Clinics was $43,726. Approximately $31,398 was provided from entities within the Group and was eliminated from these financial statements. The remaining portion is recorded as funding from affiliates in the statement of revenues, expenses, and changes in net position.

UW MEDICINE CLINICAL ENTERPRISE UW DIVISION Notes to the Financial Statements
June 30, 2016 (Dollars in thousands)
46
(c) Northwest Hospital For the year ended June 30, 2016, Harborview and UW Medical Center provided strategic funding to Northwest Hospital in the amount of $14,965. Funding from UW Medical Center is eliminated within these financial statements. The remaining portion of strategic funding is recorded as funding from affiliates in the statement of revenues, expenses, and changes in net position.
(d) Seattle Cancer Care Alliance UW Medical Center is a one-third owner in the SCCA and accounts for its interest under the equity method of accounting. Equity earnings from SCCA of $18,932 was recorded in fiscal year 2016 and is included in other nonoperating revenues in the statements of revenues, expenses, and changes in net position. The following is a summary of the SCCA s financial results for the year ended June 30, 2016: Assets $ 556,565 Liabilities $ 163,085 Unrestricted net assets 388,045 Temporarily restricted net assets 2,239 Permanently restricted 3,196
Total liabilities and net assets $ 556,565 Revenues $ 525,214 Expenses 473,690 Nonoperating expense 3,497
Excess of revenues over expenses 55,021 Other changes in unrestricted net assets
Increase in unrestricted net assets $ 55,021
SCCA operates a 20-bed unit located within UW Medical Center in which its adult inpatients receive care. The 20-bed unit qualifies as a hospital within a hospital for Medicare reimbursement purposes. SCCA provides medical oversight and management of the inpatient unit. Under agreements, UW Medical Center provides and bills for inpatient care services to the SCCA including necessary personnel, equipment, and ancillary services and UW Medical Center purchases administrative and program support services from the SCCA. Payments due to UW Medical Center for services provided to the SCCA inpatients are included in net patient service revenues. UW Medical Center also provides various services to the SCCA s outpatient facility, including certain pharmacy, laboratory, and pathology services as well as purchasing, and other administrative services. Fees for such services and supplies provided by UW Medical Center are included in other revenue. The amounts for these transactions are shown below (see (h)).

UW MEDICINE CLINICAL ENTERPRISE UW DIVISION Notes to the Financial Statements
June 30, 2016 (Dollars in thousands)
47
(e) Fred Hutchinson Cancer Research Center (Fred Hutch) The SCCA partnership agreement provides that UW Medical Center will make various payments to Fred Hutch related to research and development support, data collection and analysis, physician assistance services, consulting services, and license rights to use the Fred Hutch name in connection with the inpatient oncology services program. These fees are included in the tables below (see (h)).
(f) UWP provides various administrative services to CUMG), and billing support services when CUMG physicians provide clinical care to patients in UW Medicine facilities. CUMG also reimburses UWP for its share of legal services provided through the centralized legal office for support of the nonprofit entities UWP, Northwest Hospital, the Neighborhood Clinics and CUMG. UWP bills CUMG for these services on a monthly basis. Likewise, CUMG provides billing support services to UWP for UWP physicians providing clinical care to
(g) Northwest Hospital At June 30, 2016, Northwest Hospital has a payable of $29,232 to the University. Of this total, $24,453 pertains to goods and services received from the University prior to June 30, 2015. This portion is subject to repayment in annual installments over future years, with the first installment of $5,000 made during the year ended June 30, 2016. On the statement of net position, the current portion of $5,000 is included in due to related parties and the remaining $19,453 is included in due to related parties long term.

UW MEDICINE CLINICAL ENTERPRISE UW DIVISION Notes to the Financial Statements
June 30, 2016 (Dollars in thousands)
48
(h) Summary of Related-Party Transactions The following table summarizes the related party revenue and expense transactions for the year ended June 30, 2016:
Revenue (expense) transactionsServices and supplies purchased from the University and its departmentsand affiliates:The School $ (128,521) UW Medicine Central Costs (15,978) Other University departments (62,937) Services and supplies purchased from Harborview (9,024) Services and supplies purchased from VMC (733) Services and supplies purchased from SCCA (11,934) Services and supplies purchased from Fred Hutch (15,423) Services and supplies provided to the University and its departmentsand affiliates:The School $ 7,380 Other University departments 2,318 Services and supplies provided to Harborview 94,632 Services and supplies provided to SCCA 61,580 Services and supplies provided to VMC 2,996 Services and supplies provided to CUMG 2,477
Related party receivable and payable amounts are recorded in due from and due to related parties on the statement of net position. As of June 30, 2016, the Group had net amounts due from or (due to) related parties, other receivables, and accounts payable and accrued expenses for certain significant transactions, which are as follows:
Net receivable (payable)University of Washington and its departments andaffiliates:The School $ (16,974) UW Medicine Central Costs (2,295) Other University departments (49,717) SCCA 2,838 Harborview 3,975 VMC 875 Fred Hutch (3,710)

UW MEDICINE CLINICAL ENTERPRISE UW DIVISION Notes to the Financial Statements
June 30, 2016 (Dollars in thousands)
49
(13) Commitments and Contingencies (a) Operating Leases
The Group leases medical office space, aircraft hangar space, and equipment under operating lease arrangements. Total rental expense for fiscal year ended June 30, 2016 for all operating leases was $47,342, which is recorded in other expense. The following schedule shows future minimum lease payments for the Group by fiscal years as of June 30:
2017 37,654 2018 35,358 2019 31,901 2020 30,871 2021 23,357 48,523 9,967 5,779 5,979 Thereafter 2,591 Total $ 231,980
Airlift has entered into contractual arrangements for fixed-wing and rotary-wing aviation services covering eight primary and three back-up aircraft. The fixed-wing contract expires on April 30, 2022 and the rotary wing contract expires on September 30, 2020, both of which are included in the future minimum lease payments table above.
(b) Purchase Commitments The Group has current commitments at June 30, 2016 of approximately $33,880 related to various construction projects and other.
(c) Regulatory Environment The healthcare industry is subject to numerous laws and regulations of federal, state, and local governments. These laws and regulations include, but are not limited to, matters such as licensure, accreditation, governmental healthcare program participation requirements, reimbursement for patient services, and Medicare and Medicaid fraud and abuse. Government agencies are actively conducting investigations concerning possible violations of fraud and abuse statutes and regulations by healthcare providers. Violations of these laws and regulations could result in expulsion from government healthcare programs, together with the imposition of significant fines and penalties, as well as significant repayments for patient services previously billed. Management believes that the Group is in compliance with the fraud and abuse regulations as well as other applicable government laws and regulations. Compliance with such laws and regulations can be subject to future government review and interpretation as well as regulatory actions known or unasserted at this time.
UW MEDICINE CLINICAL ENTERPRISE UW DIVISION Notes to the Financial Statements
June 30, 2016 (Dollars in thousands)
50
(d) Litigation Management is aware of certain asserted and unasserted legal claims and regulatory matters arising in the course of business. After consultation with legal counsel, management estimates that these matters will be resolved without material adverse effect on the financial statements.
(e) Collective Bargaining Agreements UW Medical Center has a total of approximately 4,368 employees. Of this total, approximately 80% are covered by collective bargaining agreements as of June 30, 2016. Nurses are represented by Washington State Nurses Association (WSNA) and the Service Employees International Union (SEIU) and other healthcare and support workers are represented by the SEIU and Washington Federation of State Employees (WSFE). Current contracts pertaining to these collective bargaining units expire on June 30, 2017. Northwest Hospital employs approximately 1,930 full time equivalent employees at June 30, 2016. At a given time, approximately 60-70% of the employees are covered under collective bargaining agreements. Nurses are represented by WSNA and other healthcare and support workers are represented by SEIU. The current collective bargaining agreement with SEIU expires on June 30, 2019. The WSNA agreement expired May 15, 2016 and is currently in negotiations. UWP employs approximately 270 full-time equivalent administrative employees at June 30, 2016. Of this total, approximately, 60% are covered under a collective bargaining agreement represented by the Service Employees International Union (SEIU). The current agreement expires on June 30, 2018. UWP also employs approximately 1,950 faculty physicians and other healthcare professionals who provide clinical services to patients. The majority of these healthcare professionals are also employed by the School.

51
UW MEDICINE CLINICAL ENTERPRISE - UW DIVISIONSchedules of Required Supplementary Information
June 30, 2016
Enterprise - UW Division.
PERS 1 Pension Plan(Dollar amounts in thousands)
The Group's proportion of the net pension liability 2.81%The Group's proportionate share of the net pension liability $ 147,106The Group's covered-employee payroll 7,540The Group's proportionate share of the net pension liability as apercentage of its covered-employee payroll 1951%Plan fiduciary net position as a percentage of the total pension liability 59.10%Schedule of the Group's ContributionsPERS 1 Pension Plan
(Dollar amounts in thousands)Contractually required contribution $ 727Contributions in relation to the contractually required contribution 727Contribution deficiency (excess) —The Group's covered-employee payroll 6,564Contributions as a percentage of covered-employee payroll 11.08%
Schedule of the Group's Proportionate Share of the Net Pension LiabilityPERS 2/3 Pension Plan(Dollar amounts in thousands)
The Group's proportion of the net pension liability 3.52%The Group's proportionate share of the net pension liability $ 125,761The Group's covered-employee payroll 312,289The Group's proportionate share of the net pension liability as apercentage of its covered-employee payroll 40.00%Plan fiduciary net position as a percentage of the total pension liability 89.20%Schedule of the University’s ContributionsPERS 2/3 Pension Plan
(Dollar amounts in thousands)Contractually required contribution $ 37,083Contributions in relation to the contractually required contribution 37,424Contribution deficiency (excess) (341) University’s covered-employee payroll 334,138Contributions as a percentage of covered-employee payroll 11.10%Notes to required supplementary information for the year ended June 30, 2016Changes of Benefit Terms : Amounts reported in 2016 reflect no change in benefit terms.
The Schedules of Required Supplementary Information below reflect information for UW Medicine Clinical
Schedule of the UW Medicine Clinical Enterprise - UW Division (the Group) Proportionate Share of the Net Pension Liability

