2016 earned brand australia
TRANSCRIPT
EDELMAN AUSTRALIA

ADVOCATE DEFENDBUY

Sharing EconomyNew Business
Models
Changing distribution
channels

How does a stronger
relationship lead to
better business results?
How can brands
strengthen the
relationship?
How strong is the
consumer-brand
relationship?

Methodology
Timing
April 7 – April 25, 2016
13 countries
Online survey in Australia,
Brazil, Canada, China, France,
Germany, India, Japan, Mexico,
The Netherlands, Singapore,
U.K., and U.S.
13,000 respondents
1,000 per country, nationally
representative of age, gender,
and region based on most
recent country census data.
Social listening
In China, Germany, India, the U.K., and
U.S., we listened to consumer
conversations on social media to assess
the impact of 15 recent cause-related
brand campaigns or actions.
Unless otherwise specified, all data is from the Earned Brand 2016 study. The full text of the questions referenced in the report appear in the endnotes. Full
explanations of the Brand Relationship Index and other analyses performed appear in the methodology section of the Appendix.
A Global Survey

18 brand categories
Travel
Mobile carriers
Social media
Automobile
Personal care
Beer, wine, and spirits
Luxury goods
Prescription medicines
Credit cards
Utilities
Grocery stores
Retailers
Financial services
Food and beverage
Home energy management
Fashion
OTC medicines
Household products

What is your favourite brand
– one you already buy –
in this category?

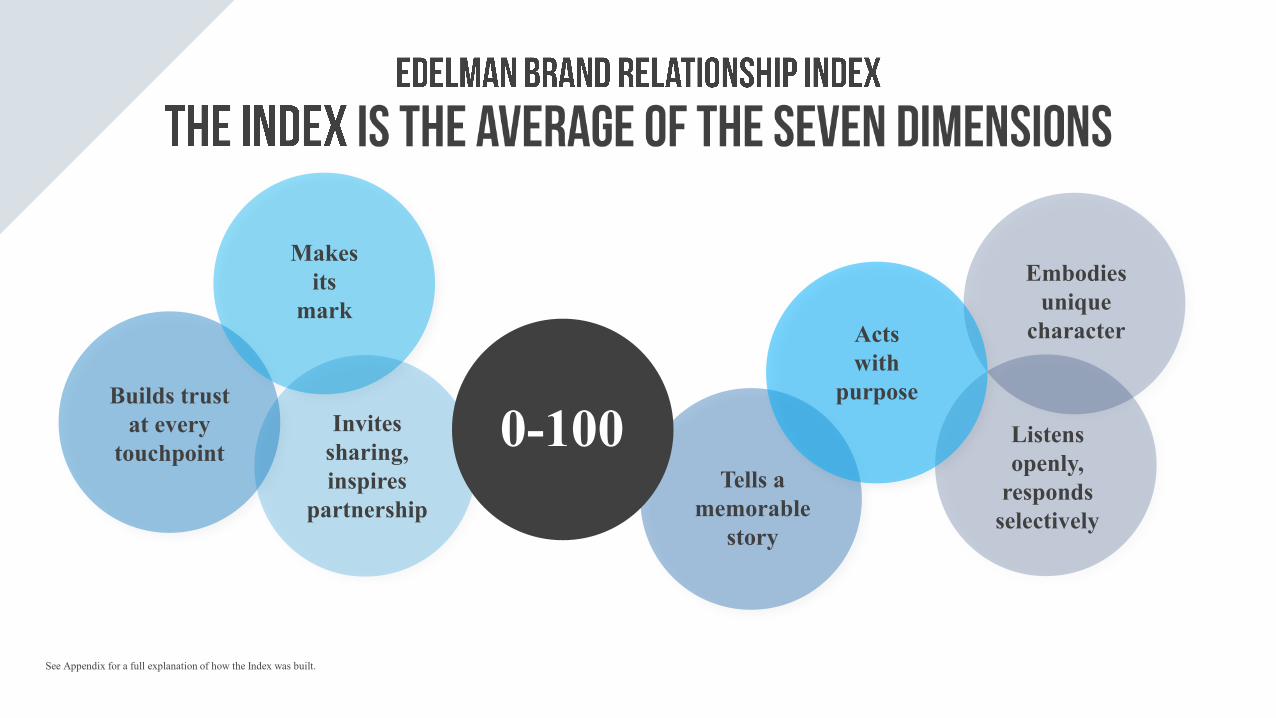
Builds trust
at every
touchpoint
Makes
its
mark
Invites
sharing,
inspires
partnership
Embodies
unique
character
Tells a
memorable
story
Listens
openly,
responds
appropriatelyActs
with
purpose
See Appendix for a full explanation of the seven dimensions of the consumer-brand relationship.
Builds trust
at every
touchpoint
Makes
its
mark
Invites
sharing,
inspires
partnership
Embodies
unique
character
Listens
openly,
responds
selectively
Tells a
memorable
story
Acts
with
purpose
0-100
See Appendix for a full explanation of how the Index was built.

At five points, the data shows meaningful shifts in consumer attitudes and behaviours toward brands
Strength of relationship with the
favourite brand they buy in a category
I may buy/use your
product, but I don’t
really put much
thought into it.
I know a little
about you, beyond your
product
I am making an
educated choice.
Given a choice,
I would pick your
brand. I appreciate
what you stand for.
We share common
values and see
the world in a
similar way.
We do things
together and for
each other.
We share a past
and a future.
Indifferent
0-6
Interested
7-26
Involved
27-43
Invested
44-69
Committed
70-100

Relationship strength
0 10020 40 60 80
32
See Appendix for a full explanation of how the Index was built.
Global Average38
The Edelman
Brand Relationship Index
Australia Average
Indifferent
0-6
Interested
7-26
Involved
27-43
Invested
44-69
Committed
70-100

39
43
40
3233
30
32
32
53
34
52
39
Canada
U.S.
Mexico
Brazil
Lowest
The NetherlandsU.K.
France
Germany
32
China
Singapore
Australia
Highest
See Appendix for a full explanation of how the Index was built.
Japan
India

See Appendix for a full explanation of how
the Index was built.
2016 Edelman Brand Relationship Index
Generation Gender
40 40 32 26 25 32 32

2016 Edelman Brand Relationship Index by category
See Appendix for a full explanation of how
the Index was built.
33 32 31 30 29 28 27 27 26
39 38 38 36 36 36 35 34 33

Percent of relationships in category that are committed
Committed
16%
4%
1%
13%13%
Financial
servicesFashion
9%
Credit
cardsTravelPersonal
care
Retailers Food
and
beverage
6%
Grocery
storesUtilities
Mobile
carriers
7%
Beer,
wine, and
spirits
Prescription
medicines
Household
products
“Committed” is the last stage on the Earned Brand Relationship Index.
See Appendix for a full explanation of how the five relationship stages were built.
11%
Automobile
Social
media
Home
energy
managementOTC
medicines
9% 9% 9% 9%
7% 7% 7%
6%

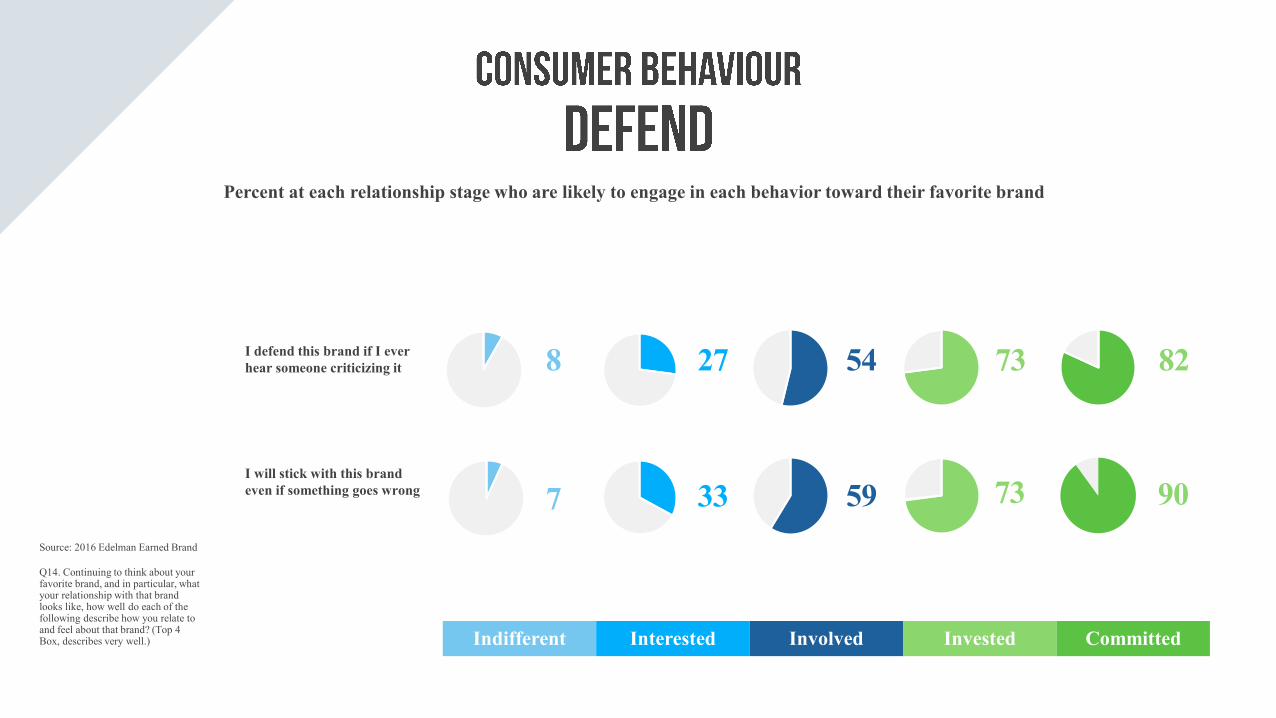
ADVOCATE DEFENDBUY

I am happy to pay more for this
brand’s products/services
Source: 2016 Edelman Earned Brand
Q14. Continuing to think about your favorite brand, and in particular, what your relationship with that brand looks like, how well do each of the following describe how you relate to and feel about that brand? (Top 4 Box, describes very well.)
Percent at each relationship stage who are likely to engage in each behavior toward their favorite brand
Indifferent Interested Involved Invested Committed
83
87
13
6
33
21
67
59
51
40
I am one of the first to try
the brand’s new products

65
65
56
56
57
61
82
83
89
90
84
87
16
14
11
9
8
9
… is getting better reviewsI will stick with this
brand even if a
competitor…
41
32
37
35
26
35
76
72
74
69
66
76Source: 2016 Edelman Earned Brand
Q14. Continuing to think about your favorite brand, and in particular, what your relationship with that brand looks like, how well do each of the following describe how you relate to and feel about that brand? (Top 4 Box, describes very well.)
Percent at each relationship stage who are likely to engage in each behavior toward their favorite brand
… is more innovative
… is greener
… treats workers better
I am happy to share personal
data with this brand
When I buy products in this
category, it has to be this brand
Indifferent Interested Involved Invested Committed

66
51
42
32
86
88
83
83
14
6
5
4
I always recommend this
brand if someone ask47
21
14
10
82
70
58
48Source: 2016 Edelman Earned Brand
Q14. Continuing to think about your favorite brand, and in particular, what your relationship with that brand looks like, how well do each of the following describe how you relate to and feel about that brand? (Top 4 Box, describes very well.)
Percent at each relationship stage who are likely to engage in each behavior toward their favourite brand
Indifferent Interested Involved Invested Committed
I advocate for this brand
even when I am not asked
I like/rate what the brand
is saying on social media
I participate in creating the
brand’s content
54
59
82
90
8
7
27
33
73
73
Source: 2016 Edelman Earned Brand
Q14. Continuing to think about your favorite brand, and in particular, what your relationship with that brand looks like, how well do each of the following describe how you relate to and feel about that brand? (Top 4 Box, describes very well.)
Percent at each relationship stage who are likely to engage in each behavior toward their favorite brand
Indifferent Interested Involved Invested Committed
I defend this brand if I ever
hear someone criticizing it
I will stick with this brand
even if something goes wrong


Advertising is primary point
of engagement
Q15 (Paid is a net of 4 items, Peer is a net of 7 items, and Owned is a net of 6 items) by relationship level.
See Appendix for a full explanation for how the 5 relationship stages were built.
Percent who have
used each type of
media to engage with
their favourite brand
in the last 90 days
Interested Involved Invested CommittedIndifferent
29%
23%
24%
Paid
Peer
Owned

51%
50%
45%
Paid
Peer
Owned
29%
23%
24%
Paid
Peer
Owned
+26
+20
0
Q15 (Paid is a net of 4 items, Peer is a net of 7 items, and Owned is a net of 6 items) by relationship level.
See Appendix for a full explanation for how the 5 relationship stages were built.
Percent who have
used each type of
media to engage with
their favourite brand
in the last 90 days
Interested Involved Invested CommittedIndifferent
39%
Paid
Peer
Owned
43%
40%
Paid
43%
65%
60%
Peer
Owned

How respondents describe different sources of information about brands and products
Q28 (Definitions for Earned, Paid, Peer and Owned can be found in the end notes)
Earned Paid Peer Owned
Most likely to get my
attention
Most informative &
reassuring
Most used for new
product introduction
Most emotionally
compelling
Most truthful &
trusted
Most likely to get me to
purchase a new brand
or change my opinion
Most entertaining Most accessible

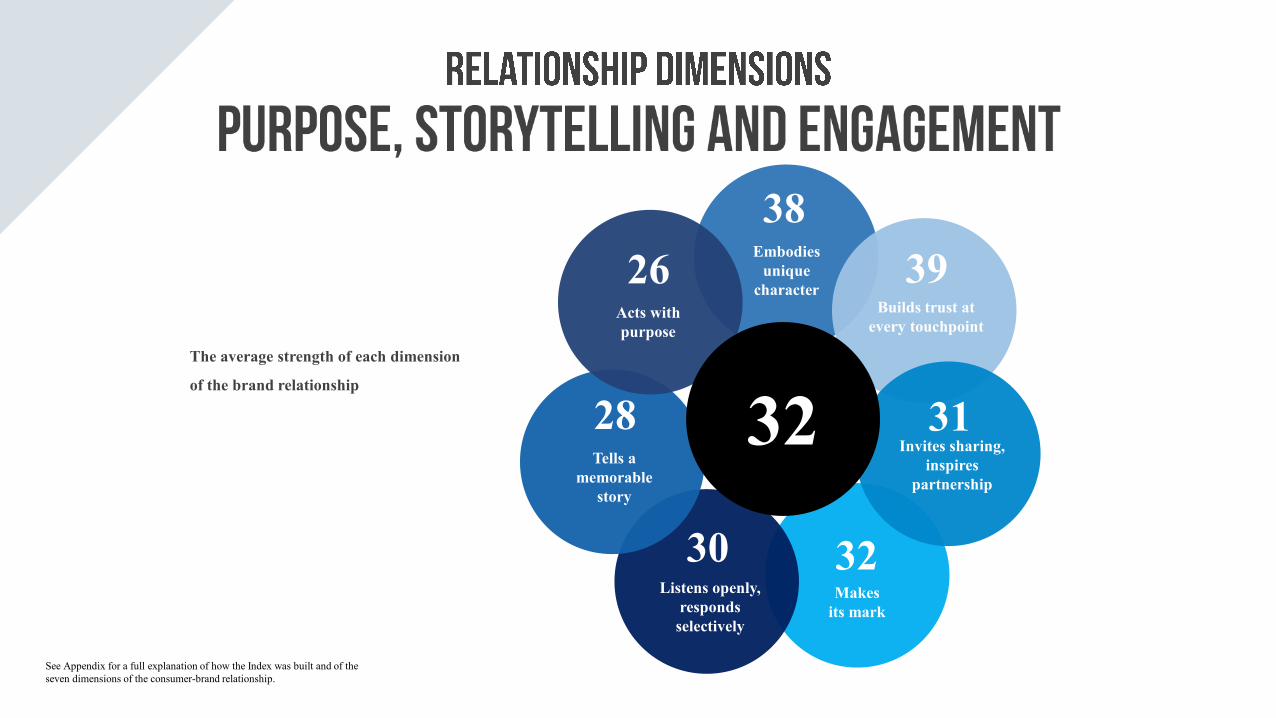
The average strength of each dimension
of the brand relationship
38Embodies
unique
character39
Builds trust at
every touchpoint
26Acts with
purpose
31Invites sharing,
inspires
partnership
28Tells a
memorable
story
32Makes
its mark
30Listens openly,
responds
selectively
32
See Appendix for a full explanation of how the Index was built and of the
seven dimensions of the consumer-brand relationship.

Incremental increase in importance of a brand’s actions, comparing a Committed to an Involved relationship.
Q13 (Top 4 Box, “Describes me”.) Behaviors that had the greatest percentage point increase from the Involved to the Committed
relationship levels. See Appendix for a full explanation of how the five relationship stages were built.
Highest incremental impact bottom 10 of 35 attributes
1. Part of my social media landscape
2. Enhances the bonds I have with my friends
3. Maintains ongoing conversation with me
4. Invites me to play part in its innovation process
5. Significant source of enjoyment in my life
6. There for me at a tough time in my life
7. Helps me express myself
8. It provides a connection platform
9. I get a lot of respect for owning & using it
10. It seems to really understand me
Involved Committed

1.
Disruption has changed brand relationships
2.
Current Australian brand relationships are ‘involved’
3.
Committed relationships drive loyalty, purchase, advocacy, defence and
price premiums
4.
When it comes to channels you need to earn
commitment but you also need to own it
5.
Purpose based activity is the most impactful driver
