2016 external sector report; imf policy paper; july 27, 2016 · pdf file2016 external sector...
TRANSCRIPT

© 2016 International Monetary Fund
2016 EXTERNAL SECTOR REPORT
IMF staff regularly produces papers covering multilateral issues and cross country analyses. The following document has been released and is included in this package:
The 2016 External Sector Report prepared by IMF staff and completed on
June 30, 2016 for the Executive Board’s consideration on July 18, 2016.
Informal Session to Engage:
The Executive Board met in an informal session, and no decisions were taken at this meeting. The views expressed in this paper are those of the IMF staff and do not necessarily represent the views of the IMF's Executive Board.
The document listed below will be separately released. 2016 External Sector Report—Individual Economy Assessments.
The IMF’s transparency policy allows for the deletion of market-sensitive information and premature disclosure of the authorities’ policy intentions in published staff reports and other documents.
Electronic copies of IMF Policy Papers are available to the public from
http://www.imf.org/external/pp/ppindex.aspx
International Monetary Fund Washington, D.C.
July 27, 2016

2016 EXTERNAL SECTOR REPORT
KEY POINTS After narrowing in the aftermath of the global financial crisis and remaining broadly unchanged in recent years, global imbalances increased moderately in 2015, amid a reconfiguration of current accounts and exchange rates. Shifts in 2015 were driven primarily by the uneven strength of the recovery in advanced economies, the redistributive effects of the sharp fall in commodity prices, and tighter external financing conditions for emerging markets (EMs). A relatively stronger U.S. outlook led to a further appreciation of the USD and a depreciation of the yen and the euro. The sharp decline in commodity prices, reflecting both supply shocks and concerns about rebalancing and growth in China, brought about a significant redistribution of income from commodity exporters to importers, and a weakening of commodity exporters’ currencies. Meanwhile, heightened global risk aversion, contributed to softer capital inflows and depreciation pressures in many EMs.
This moderate widening of current account imbalances was largely driven by systemic economies. Surpluses in Japan, the euro area and China grew, supported by improved terms of trade and currency depreciation, while the current account deficit in the U.S. widened amid the steep appreciation of the USD. These widening imbalances were only partially offset by narrowing surpluses in large oil exporters and smaller deficits in vulnerable EMs and some euro area debtor countries.
Similarly, excess imbalances expanded in 2015. External positions in the U.S. and Japan moved from being broadly in line with fundamentals to being “moderately weaker” and “moderately stronger”, respectively. This was partly offset by a further narrowing of excess deficits in vulnerable EMs and euro area debtor countries. Meanwhile, excess surpluses persisted among the larger surplus countries, some of which remain “substantially stronger” than fundamentals (Germany, Korea).
Currency movements since end-2015 helped to partially reverse the trends observed last year, although market volatility following the result of the U.K. referendum to leave the European Union have led to a strengthening of the USD and yen along with a weakening of the sterling, euro, and EM currencies. The implications for external assessments going forward, especially for the U.K. and the euro area, remains uncertain and will likely depend on how the transition is managed and on what new arrangements are adopted.
With output below potential in most countries, and limited policy space in many, balancing internal and external objectives will require careful policy calibration. In general, a more balanced policy mix that avoids excessive reliance on policies with significant demand-diverting effects is necessary, with greater emphasis on demand-supportive measures and structural reforms. Surplus countries with fiscal space have a greater role to play in supporting global demand while reducing external imbalances. Global collective policy action, especially if downside risks materialize, would also help address global demand weakness while mitigating its effects on external imbalances.
June 30, 2016

2016 EXTERNAL SECTOR REPORT
2 INTERNATIONAL MONETARY FUND
The IMF’s Fifth External Sector Report presents a multilaterally consistent assessment of the largest economies’ external sector positions and policies. This report, along with the companion Individual Economy Assessments paper, integrates analysis from the Fund’s bilateral and multilateral surveillance to provide a consistent assessment of exchange rates, current accounts, reserves, capital flows, and external balance sheets. Together with the World Economic Outlook and Article IV consultations (both with their heightened focus on spillovers), this Report is part of a continuous effort to ensure the Fund is in a good position to address the possible effects of spillovers from members’ policies on global stability and monitor the stability of members’ external sectors in a comprehensive manner. The report and associated external assessments are based on data and IMF staff projections as of June 22, 2016.
Prepared by the External Sector Coordinating Group comprising: Luis Cubeddu (Chair), David Robinson (AFR), Kalpana Kochhar and Alison Stuart (APD), Jörg Decressin (EUR), Abdelhak Senhadji (FAD), Aasim Husain (MCD), Miguel Savastano (MCM), Jonathan Ostry (RES), Martin Kaufman (SPR), Natalia Ivanyk (STA), and Nigel Chalk (WHD).
Coordinated by Gustavo Adler. The report draws on inputs from JaeBin Ahn, Mai Dao, Mitali Das, Clara Galeazzi, Nakul Kapoor, Emmanouil Kitsios, Ruy Lama, Nan Li, Jair Rodriguez, and Tao Wang (RES); as well as from country teams.
CONTENTS OVERVIEW ________________________________________________________________________________________ 4
EVOLUTION OF GLOBAL EXTERNAL IMBALANCES AND EXCHANGE RATES __________________ 4
DRIVERS OF GLOBAL IMBALANCES IN 2015 ____________________________________________________ 6 Asymmetric Recoveries in Systemic Economies ____________________________________________________ 6 The Commodity Price Decline ______________________________________________________________________ 8 Tighter External Financing Conditions for Emerging Markets ____________________________________ 10 Global External Adjustment ______________________________________________________________________ 12
EVOLUTION OF STOCK IMBALANCES _________________________________________________________ 13
NORMATIVE ASSESSMENT OF EXTERNAL POSITIONS _______________________________________ 17
OUTLOOK AND POLICIES _______________________________________________________________________ 24
REFERENCES __________________________________________________________________________________________ 31
BOXES 1. Key ESR Concepts _____________________________________________________________________________________ 4 2. External Adjustment in the Euro Area _________________________________________________________________ 6 3. Exchange Rates and Trade: Disconnected? ____________________________________________________________ 7 4. China’s Domestic Rebalancing and External Imbalances ____________________________________________ 11 5. External Adjustment and FX Exposure _______________________________________________________________ 14 6. External Adjustments in Oil Exporting Countries ____________________________________________________ 15 7. Treatment of Commodity Shocks in the EBA ________________________________________________________ 18 8. The Plaza Accord: How Different Are External Conditions Today? __________________________________ 27

2016 EXTERNAL SECTOR REPORT
INTERNATIONAL MONETARY FUND 3
FIGURES 1. Evolution and Reconfiguration of Global Current Account Balances, 2001-15 ________________________ 5 2. Selected Economies: Real and Nominal Exchange Rates, 2001-16 ____________________________________ 5 3. Selected Systemic Economies: Long-Term View of the Real Effective Exchange Rate, Jan. 1980-May 2016 ___________________________________________________________________________________ 8 4. Terms-of-trade Income Windfalls, and Global Imbalances, 2015 _____________________________________ 9 5. Selected Economies: Terms-of-trade Income Shock, REER Changes and External Adjustment, 2015 _____________________________________________________________________________________ 9 6. Selected EMs: Capital Inflows, Current Account and Cost of External Financing, 2014-15 __________ 10 7. Selected Economies: Gross International Reserves, 2005Q1-2016Q1 _______________________________ 12 8. External Adjustment in Commodity Exporters and Importers, 2015 ________________________________ 13 9. Selected Economies: Stock Imbalances and Current Accounts, 2010-15 ____________________________ 13 10. Selected Economies: Drivers of NFA Changes, 2010-15 ___________________________________________ 16 11. Selected Economies: NFA Changes around Large Exchange Rate Depreciations __________________ 16 12. ESR Economies: Cyclically-adjusted Current Accounts. Actual vs. Staff-Assessed Norm, 2015 ____ 17 13. ESR Economies: Staff-Assessed Current Account Gaps, 2014-15 __________________________________ 20 14. ESR Economies: Staff-Assessed REER and Current Account Gaps, 2015 ___________________________ 21 15. ESR Economies: Staff-Assessed vs. EBA Estimated Current Account and REER Gaps, 2015 ________ 21 16. ESR Economies: Contributions of Policy Gaps to the 2015 Staff-Assessed Current Account Gap _ 22 17. Selected Economies: Foreign Exchange Intervention and Reserve Adequacy, 2014-15 ___________ 23 18. ESR Economies: Evolution of External Assessments, 2012-15 ______________________________________ 24 19. ESR Economies: Current Account Balance, 2015 and 2020 Projection _____________________________ 25 20. Selected Large Economies: Actual 2010-15 and Projected 2016-20 Net Foreign Asset Position __ 26 21. ESR Economies: External and Internal Imbalances, 2015-16 _______________________________________ 29 22. ESR Economies: Policy Space, 2015-16 _____________________________________________________________ 30
TABLES 1. Selected Economies: Current Account Balance, 2012-15 ____________________________________________ 34 2. Summary of Staff-Assessed Current Account and REER Gaps, 2015 ________________________________ 34 3. Selected ESR Countries: Current Account Regression Policy Gap Contributions, 2015 _____________ 35
APPENDICES I. Decomposing Current Account Variations ___________________________________________________________ 36 II. Decomposing Changes in Net Foreign Asset Positions _____________________________________________ 37

2016 EXTERNAL SECTOR REPORT
4 INTERNATIONAL MONETARY FUND
OVERVIEW 1. The 2016 External Sector Report (ESR) documents the evolution of global external
imbalances and provides an updated assessment of the external positions of 29 economies for 2015. Like past years, this Overview Paper summarizes the assessments detailed in the Individual Economy Assessments paper, while identifying cross-country patterns and policies that should be considered beyond the country level. A more thematic approach is taken, with a deeper exploration of the drivers of external imbalances and a discussion of the policy trade-offs arising from the persistence of both domestic and external gaps. The paper is organized as follows. Section II documents shifts in global external imbalances and exchange rates, with Section III discussing the role played by the different drivers of imbalances during 2015. Section IV assesses the evolution of stock imbalances, including the role of valuation effects. Section V provides a normative assessment of external positions (Box 1), and Section VI discusses the outlook and policy challenges, including tradeoffs between internal and external objectives and the role of global policy coordination.
EVOLUTION OF GLOBAL EXTERNAL IMBALANCES AND EXCHANGE RATES 2. After narrowing sharply in the aftermath of the global financial crisis (GFC) and remaining broadly unchanged in recent years, global current account imbalances increased moderately in 2015 (Figure 1 and Table 1). The widening of imbalances was led by systemic economies, with growing current account surpluses in Japan, the euro area and China, and increasing deficits in the United States. Surpluses also grew in many commodity-importing advanced economies (Korea, Sweden, Switzerland, Singapore, Hong Kong), and deficits increased in some commodity exporting advanced economies (Australia, Canada). This widening was partly offset by reduced surpluses of large oil exporting countries (most noticeably Saudi Arabia and Norway, with the former shifting into a large deficit) as well as narrowing deficits in key EMs (Brazil, Indonesia, South Africa, Turkey). Current accounts in euro area
Box 1. Key ESR Concepts Current account imbalance refers to any current account balance different from zero; i.e., surpluses or deficits, and may be appropriate or inappropriate. Current account gap, or excess imbalance, is the difference between actual imbalance and that assessed by staff to be consistent with fundamentals and desirable policies (or “norm”). It reflects distortions and other factors and strips cyclical effects as well as temporary effects from terms-of-trade variations. A current account balance deemed to be “stronger” (“weaker”) than implied by fundamentals and desired policies implies a positive (negative) gap. Eventual elimination of such gap is desirable, though there may be good reasons for a gradual adjustment. REER gap corresponds to underlying CA gap; adjustment of an excess imbalance would involve a change in expenditure (domestic demand) as well as a change in REER. A positive (negative) REER gap implies an overvalued (undervalued) exchange rate. REER gaps are not necessarily related to expected future exchange rates, and may occur in any economy, including those with floating exchange rates. Multilateral consistency of the assessments means that too-high current accounts of some economies are matched by the too-low current accounts of others. External sector position refers to the overall assessment based on multiple indicators used in this Report, namely current account balances (and the counterpart financial account balance), international investment positions and exchange rates. External Balance Assessment (EBA) methodology Quantitative methods developed by IMF staff to inform, but not solely determine, assessments (http://www.imf.org/external/pubs/ft/wp/2013/wp13272.pdf).

2016 EXTERNAL SECTOR REPORT
INTERNATIONAL MONETARY FUND 5
improved in most countries, and especially in debtor countries which either moved further into positive territory (e.g. Italy, Portugal, Spain) or closed most of their previously large deficits (Box 2). Meanwhile, the current account statistical discrepancy fell sharply, likely reflecting the drop in the value of global trade (see Oct. 2009 WEO).
Figure 1. Evolution and Reconfiguration of Global Current Account Balances, 2001-15
3. Sharp real exchanges rate movements accompanied the reconfiguration of current accounts. In varying degrees, most countries depreciated in nominal terms vis-à-vis the U.S. dollar during 2015, leading to a sharp appreciation of the latter in real effective terms, as well as of currencies closely linked to it (Figure 2). Closely tied to the USD, China’s currency also appreciated sharply in real terms. The euro and the yen depreciated significantly both in nominal and real terms, as well as currencies of many commodity-exporting economies (e.g. Australia, Brazil, Canada, Russia). These sharp currency movements during 2015 occurred on the back of large shifts already in train from previous years, and contributed in different degrees to recent current account dynamics (Box 3).
Figure 2. Selected Economies: Real and Nominal Exchange Rates, 2001-16
Sources: IMF International Financial Statistics; World Economic Outlook Database, Global Statistics Database.1/ GDP-weighted average of ESR countries.
75
85
95
105
115
125
135
REER of Systemic Economies, 2001-16(Index, average 2001-15=100)
U.S. China EuroArea
Japan U.K. OtherEMEs 1/
Other AMs 1/
U.S. China EuroArea
Japan U.K. OtherEMEs 1/
Other AMs 1/
2001
2015
May 2016
SAU
AUS
TUR ZAF
GBR
BRA
CAN
USA
MEX
IDN
IND
POLFRA
BELESP
ITA
MYS
HKG
CHN
EA
JPN
RUS
SWE
CHE
THAKOR
DEUNLD
SGP
-20
-15
-10
-5
0
5
10
15
-60 -50 -40 -30 -20 -10 0 10
REER
(+
=ap
prec
iati
on)
Nominal Exchange Rate (vis-a-vis USD, +=depreciation)
Nominal and Real Exchange Rate Variations, 2015(percent)
2016 EXTERNAL SECTOR REPORT
6 INTERNATIONAL MONETARY FUND
DRIVERS OF GLOBAL IMBALANCES IN 20151 4. The evolution of external balances and exchange rates during 2015 was driven by a confluence of related factors. Key drivers included the asymmetric recovery and associated monetary policies in systemic advanced economies, the sharp drop in commodity prices (especially oil), and tightening external financial conditions for EMs, in part reflecting concerns related to China’s rebalancing process and prospects of monetary policy normalization in the U.S. The importance of these factors varied during the course of 2015. The U.S. dollar appreciated sharply throughout the year reflecting the relatively strong outlook of the U.S. economy and expectations of monetary policy lift-off, while China-related uncertainties gained prominence during the second half of 2015, accompanied by a further weakening of commodity prices. This section explores the role of each of these factors in the evolution of external current accounts.
Asymmetric Recoveries in Systemic Economies
5. Uneven recoveries and expectations about monetary policies led to marked exchange rate movements across systemic currencies, supporting the widening of their external imbalances.
1 The analysis in this section is based on a broad country coverage to allow for a clearer overview of the evolution of imbalances. As in previous years, however, the normative assessments focus only on ESR (29) economies.
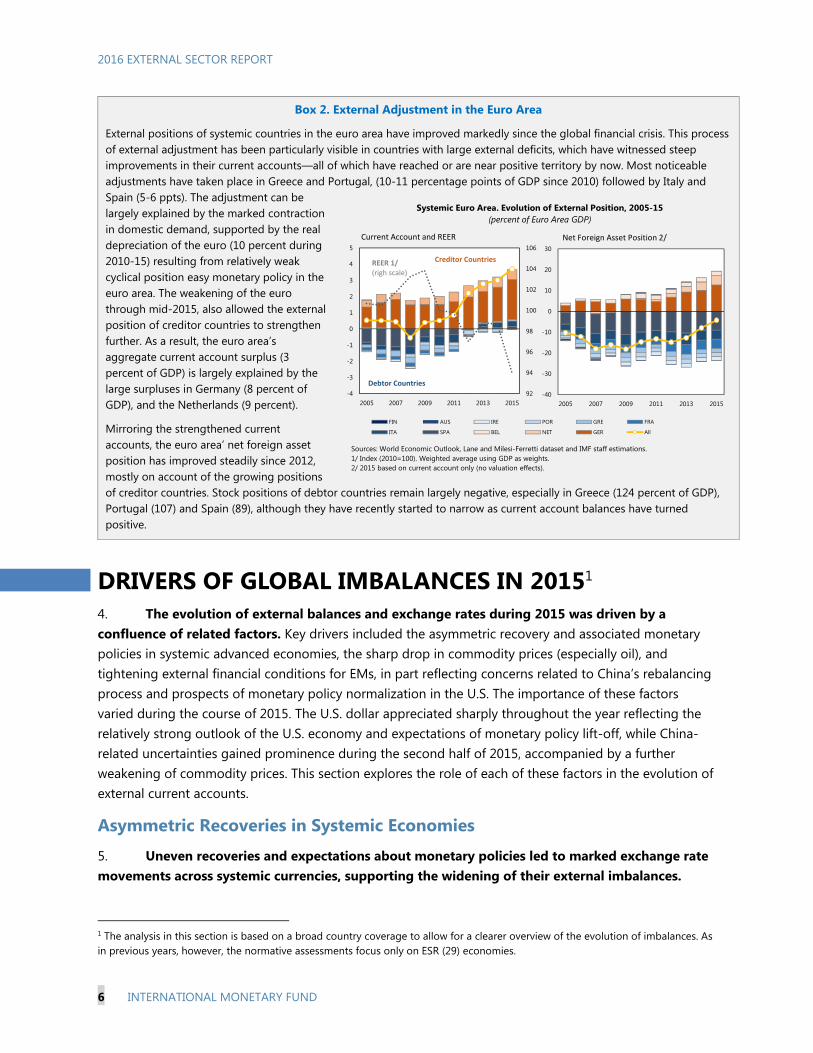
Box 2. External Adjustment in the Euro Area
External positions of systemic countries in the euro area have improved markedly since the global financial crisis. This process of external adjustment has been particularly visible in countries with large external deficits, which have witnessed steep improvements in their current accounts—all of which have reached or are near positive territory by now. Most noticeable adjustments have taken place in Greece and Portugal, (10-11 percentage points of GDP since 2010) followed by Italy and Spain (5-6 ppts). The adjustment can be largely explained by the marked contraction in domestic demand, supported by the real depreciation of the euro (10 percent during 2010-15) resulting from relatively weak cyclical position easy monetary policy in the euro area. The weakening of the euro through mid-2015, also allowed the external position of creditor countries to strengthen further. As a result, the euro area’s aggregate current account surplus (3 percent of GDP) is largely explained by the large surpluses in Germany (8 percent of GDP), and the Netherlands (9 percent).
Mirroring the strengthened current accounts, the euro area’ net foreign asset position has improved steadily since 2012, mostly on account of the growing positions of creditor countries. Stock positions of debtor countries remain largely negative, especially in Greece (124 percent of GDP), Portugal (107) and Spain (89), although they have recently started to narrow as current account balances have turned positive.
-40
-30
-20
-10
0
10
20
30
2005 2007 2009 2011 2013 2015
FIN AUS IRE POR GRE FRA
ITA SPA BEL NET GER All
Current Account and REER Net Foreign Asset Position 2/
Systemic Euro Area. Evolution of External Position, 2005-15(percent of Euro Area GDP)
Sources: World Economic Outlook, Lane and Milesi-Ferretti dataset and IMF staff estimations.1/ Index (2010=100). Weighted average using GDP as weights.2/ 2015 based on current account only (no valuation effects).
92
94
96
98
100
102
104
106
-4
-3
-2
-1
0
1
2
3
4
5
2005 2007 2009 2011 2013 2015
Creditor Countries
Debtor Countries
REER 1/(righ scale)

2016 EXTERNAL SECTOR REPORT
INTERNATIONAL MONETARY FUND 7
Box 3. Exchange Rates and Trade: Disconnected?1
Recent exchange rate movements have been unusually large, triggering a debate on their effects on trade and countries’ external positions.2 Some new studies suggest that the increasing role of global value chains (GVCs) has reduced the relevance of exchange rate movements for trade flows.3 This is not the first time conventional wisdom regarding exchange rate elasticities has been questioned.4 A key question is whether this time is different, possibly reflecting the changing structure of world trade (e.g., rise of GVCs, trade liberalization, increased international competition, inflation moderation, etc.) or whether, once lags have played out, the apparent disconnect between exchange rates and trade will once again dissipate.
To answer this question, a recent study (IMF, 2015a) explores the link between exchange rate and trade, estimating four elasticities (exchange rate-to-price and price-to-volume, both for exports and imports) at the individual-economy level using annual data for 60 economies over the period 1980-2014. Results (Table 1) indicate that exchange rate movements typically have substantial effects on relative trade prices, with the estimates of long-term pass-through elasticities in the 0–1 interval. On average, a 10 percent real effective currency depreciation increases import prices by 6.1 percent, reduces export prices in foreign currency by 5.5 percent relative to competitors’ prices, and is associated with a rise in real net exports of about 1.5 percent of GDP. Most of the effects take place in the first year.
A variant of this approach is undertaken to investigate possible changes in the relationship over time via structural breaks or rolling regressions. The results suggest that, possibly with the exception of Japan, exchange rates have not generally become disconnected from trade (Table 2).
Overall, these findings indicate that, while changes in the structure of trade (especially the rise of global value chains) may have weakened the relationship between exchange rates and trade in some specific countries, there is limited evidence of a general disconnect between exchange rates and trade. The role of flexible exchange rates in facilitating the resolution of trade imbalances remains key.
——————————— 1 Prepared by Daniel Leigh, Weicheng Lian, Marcos Poplawski-Ribeiro and Viktor Tsyrennikov. See further details in Fall 2015 World Economic Outlook and Leigh and others (forthcoming). 2 Japan’s recent experience of a sharp real depreciation but little near term trade responses had an important bearing in the debate. 3 See, for example, Ollivaud, Rusticelli, and Schwellnus (2015) or Ahmed, Appendino, and Ruta, (2015). 4 In the late 1980s, the U.S. dollar depreciated, and the yen appreciated sharply after the 1985 Plaza Accord, but trade volumes were slow to adjust, leading some commentators to suggest a disconnect between exchange rates and trade. By the early 1990s, however, U.S. and Japanese trade balances had adjusted, after some lags, largely in line with the predictions of conventional models. See Krugman (1991).
Export Import Exports Imports
Based on Producer Prices
Long-Term 0.552 –0.605 –0.321 –0.298 Yes
One-Year Effect 0.625 –0.580 –0.260 –0.258 Yes
Based on Consumer Prices
Long-Term 0.457 –0.608 –0.328 –0.333 Yes
One-Year Effect 0.599 –0.546 –0.200 –0.200 Yes
Memorandum
Non–Commodity Exporters
Long-Term Elasticity 0.571 –0.582 –0.461 –0.272 Yes
Table 1. Exchange Rate Pass-Through and Price Elasticities 1/
Price Elasticity of Volumes
Marshall-Lerner
Condition Satisfied?
Source: IMF staff estimates.
Table reports simple average of individual economy estimates for 60 economies during 1980–2014.
1 See details in Fall 2015 World Economic Outlook and Leigh and others (forthcoming).
Exchange Rate Pass-Through to Prices
Full 1990–2001 2002–14
All Countries 0.569*** 0.557*** 0.457***
By Integration into GVCCountries with Larger Increase 0.572*** 0.560*** 0.548***
Countries with Smaller Increase 0.684*** 0.608*** 0.609***
All Countries -0.612*** -0.549*** -0.632***
By Integration into GVCCountries with Larger Increase -0.621*** -0.545*** -0.618***
Countries with Smaller Increase -0.650*** -0.511*** -0.720***
All Countries -0.207*** -0.147*** -0.255***
By Integration into GVCCountries with Larger Increase -0.305*** -0.343** -0.373***
Countries with Smaller Increase -0.402*** -0.225 -0.566***
All Countries -0.433*** -0.452*** -0.335***
By Integration into GVCCountries with Larger Increase -0.521*** -0.658*** -0.271**
Countries with Smaller Increase -0.467*** -0.455*** -0.420***
1 *p < 0.1; **p < 0.05; ***p < 0.01.
Table 2. Trade Elasticities over Time
1. Pass-Through into Export Prices
2. Pass-Through into Import Prices
3. Price Elasticities of Exports
4. Price Elasticities of Imports
Source: Authors' estimates.
2016 EXTERNAL SECTOR REPORT
8 INTERNATIONAL MONETARY FUND
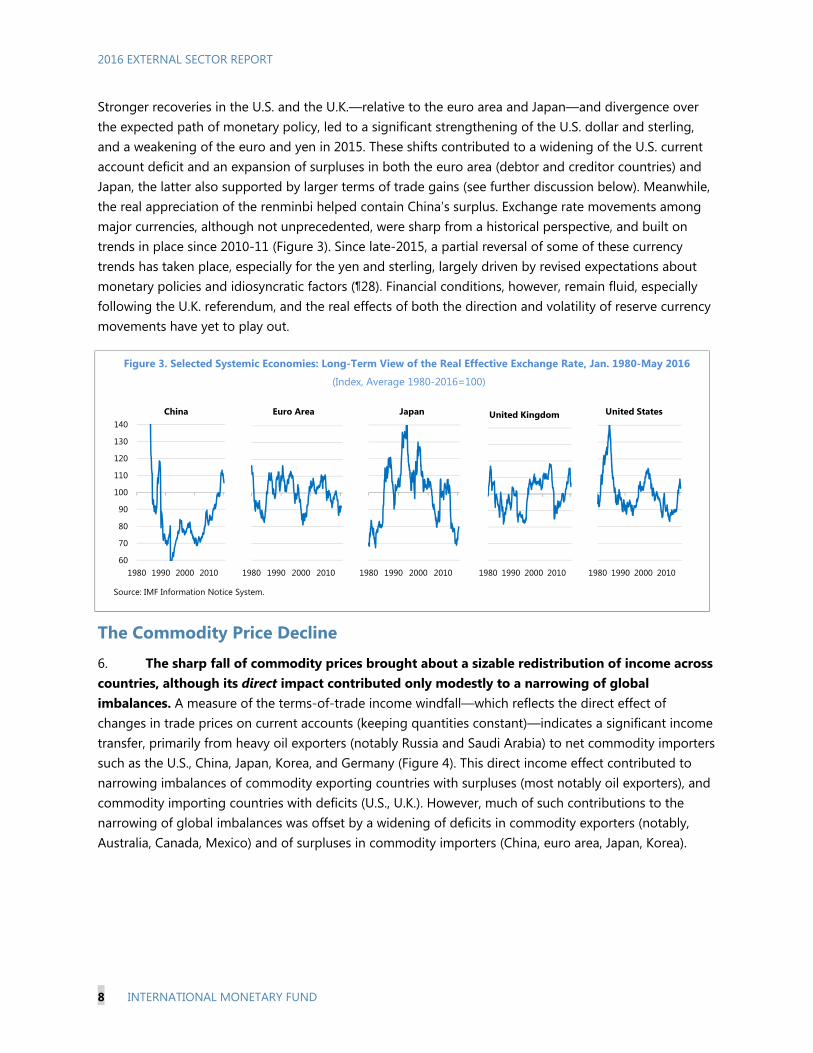
Stronger recoveries in the U.S. and the U.K.—relative to the euro area and Japan—and divergence over the expected path of monetary policy, led to a significant strengthening of the U.S. dollar and sterling, and a weakening of the euro and yen in 2015. These shifts contributed to a widening of the U.S. current account deficit and an expansion of surpluses in both the euro area (debtor and creditor countries) and Japan, the latter also supported by larger terms of trade gains (see further discussion below). Meanwhile, the real appreciation of the renminbi helped contain China’s surplus. Exchange rate movements among major currencies, although not unprecedented, were sharp from a historical perspective, and built on trends in place since 2010-11 (Figure 3). Since late-2015, a partial reversal of some of these currency trends has taken place, especially for the yen and sterling, largely driven by revised expectations about monetary policies and idiosyncratic factors (¶28). Financial conditions, however, remain fluid, especially following the U.K. referendum, and the real effects of both the direction and volatility of reserve currency movements have yet to play out.
Figure 3. Selected Systemic Economies: Long-Term View of the Real Effective Exchange Rate, Jan. 1980-May 2016
(Index, Average 1980-2016=100)
The Commodity Price Decline
6. The sharp fall of commodity prices brought about a sizable redistribution of income across countries, although its direct impact contributed only modestly to a narrowing of global imbalances. A measure of the terms-of-trade income windfall—which reflects the direct effect of changes in trade prices on current accounts (keeping quantities constant)—indicates a significant income transfer, primarily from heavy oil exporters (notably Russia and Saudi Arabia) to net commodity importers such as the U.S., China, Japan, Korea, and Germany (Figure 4). This direct income effect contributed to narrowing imbalances of commodity exporting countries with surpluses (most notably oil exporters), and commodity importing countries with deficits (U.S., U.K.). However, much of such contributions to the narrowing of global imbalances was offset by a widening of deficits in commodity exporters (notably, Australia, Canada, Mexico) and of surpluses in commodity importers (China, euro area, Japan, Korea).
60
70
80
90
100
110
120
130
140
1980 1990 2000 2010
Euro Area
60
70
80
90
100
110
120
130
140
1980 1990 2000 2010
Japan
60
70
80
90
100
110
120
130
140
1980 1990 2000 2010
China
Source: IMF Information Notice System.
60
70
80
90
100
110
120
130
140
1980 1990 2000 2010
United Kingdom
60
70
80
90
100
110
120
130
140
1980 1990 2000 2010
United States

2016 EXTERNAL SECTOR REPORT
INTERNATIONAL MONETARY FUND 9
Figure 4. Terms-of-trade Income Windfalls, and Global Imbalances, 2015 1/
7. Exchange rates generally moved with the terms-of-trade shock, although other factors also played an important role in commodity importing countries (see also April 2016 WEO). For the most part, exchange rates responded as expected to the terms-of-trade shock and helped support external adjustment in both commodity exporters and importers, as countries with depreciating currencies observed a stronger response of net export volumes (Figure 5). With the notable exception of Saudi Arabia and other smaller but heavy oil exporting countries with pegs, most commodity exporters observed an important weakening of their currencies, Meanwhile, commodity importers’ currencies tended to appreciate (or depreciate less), with the notable exceptions of the euro area and Japan. The movement of the latter currencies, however, were dominated by other factors, including the relative strength of demand and the associated outlook for monetary policies.
Figure 5. Selected Economies: Terms-of-trade Income Shock, REER Changes and External Adjustment, 2015 1/
AUS
BEL
BRA
CAN
CHN
EAFRA
DEU
HKG
IND
IDN
ITAJPN
KORMYS
MEX
NLD
POL
RUS
SGP
ZAFESP
SWE
CHE
THATUR
GBR
USA
SAU
-4
-2
0
2
4
6
8
10
12
-20 -15 -10 -5 0 5 10 15 20
Real
Exp
orts
REER
REER and Export Volumes(annual percentage change)
NZLAUS
LKA
MEX
MAR
COL
PAK
EGY
PERCHL
BRA
ARG
MYSNOR CAN
ZAF
SAU
RUS
IND
USA
GBR
CZE
TUR
THA
POL
IDNHUNPHL KOR
ISRURY
CHN
CHE
SWE
HKG
JPN
SGP
EA
-30
-20
-10
0
10
20
30
-7 -5 -3 -1 1 3 5
REER
(per
cent
age
chan
ge)
Terms of trade Income Shock(percent of GDP)
Terms-of-trade Shocks and Real Exchange Rate Changes
CommodityExporters
CommodityImporters
(-18, 12)
Sources: World Economic Outlook and IMF staff calculations.1/ Bubbles are proportional to the economy's size (US$ GDP).
-10%
-6%
-2%
2%
6%
10%
-0.20%
-0.10%
0.00%
0.10%
0.20%SA
UR
US
BRA
CAN
AU
SM
EXN
OR
COL
EGY
CHL
AR
GH
KG
BEL
POL
SGP
ESP
ISR
GB
RTU
RIR
LIT
ATH
AFR
AIN
DK
OR
DEU JPN
USA
CHN
In percent of World GDP
In percent of own GDP (right scale)
Terms-of-trade Income Windfall. Largest Gains and Losses(in percent of GDP)
SAU (-18)
Sources: IMF International Financial Statistics, WEO, and IMF staff calculations.1/ Methodological details are provided in Appendix I. Countries with small ToT income shocks (less than 0.01% of world GDP) are excluded. 2/ Classification into commodity exporter/importer based on the direction of the terms-of-trade movement in 2015.
-1.0%
-0.8%
-0.6%
-0.4%
-0.2%
0.0%
0.2%
0.4%
0.6%
-1.0% -0.5% 0.0% 0.5% 1.0% 1.5%
ToT Windfall. Direct Effect on Global Imbalances 2/(in percent of World GDP)
2014 Current Account
2015
Term
s of
Tra
de In
com
e W
indf
all Surplus Commodity
Importers(widening surpluses)
Surplus Commodity Exporters(narrowing surpluses)
Deficit Commodity Importers
(narrowing deficits)
Deficit Commodity Exporters(widening deficits)

2016 EXTERNAL SECTOR REPORT
10 INTERNATIONAL MONETARY FUND
Tighter External Financing Conditions for Emerging Markets
8. In the case of EMs, current account balances and exchange rates also reflected a tightening in external financial conditions. Concerns over the rebalancing process in China and prospects of rising interest rates in the U.S. led to increased financial volatility, lower commodity prices, and higher borrowing costs for many EMs, especially for commodity exporters and economies with close trade links with China (see April 2016 WEO). The slowdown in inflows was not uniform, however, with differences reflecting also shifts in the demand for external financing (mainly related to the terms-of-trade shock) and country-specific factors (Figure 6).
Many EM commodity exporters observed a sharp increase in external financing costs yet only a minor slowdown in net inflows, reflecting the combination of tighter supply of external funding and greater financing needs to cover the direct impact of the negative terms of trade shock. Reserve use among this group was generally limited, with the key exception of Saudi Arabia (and other peggers) who drew on their foreign asset holdings to finance rising current account deficits and private capital outflows. In Russia, the sharp downward demand adjustment and a slowdown in private outflows prevented further decline in official reserves.
Meanwhile, many EM commodity importers saw a steeper reduction in net private inflows and only a moderate increase in spreads, suggesting the reduced demand for financing on account of the positive income shock played a larger role. A key exception was China, where, despite a higher surplus, the intensification of private outflows (both from foreign and domestic sources), led to sizable reduction in official foreign assets and a tighter enforcement of capital flow management measures (Box 4).
Figure 6. Selected EMs: Capital Inflows, Current Account and Cost of External Financing, 2014-15 (Excludes China, Russia and Saudi Arabia, in percent of GDP, 4-quarter moving average)
-100
-50
0
50
100
150
200
0.0
1.0
2.0
3.0
4.0
5.0
2014Q1 2014Q3 2015Q1 2015Q3
Commodity Importing EMEs 1/
Rising reserves
-100
-50
0
50
100
150
200
0.0
1.0
2.0
3.0
4.0
5.0
2014Q1 2014Q3 2015Q1 2015Q3
Net Non-Reserve Capital Inflows
Current Account Deficit
EMBI Spread (RHS) 2/
Commodity Exporting EMEs 1/
Sources: Haver Analytics; Bloomberg; IMF, World Economic Outlook; IMF, Balance of Payment Statistics; and IMF staff calculations.1/ Commodity exporters include Argentina, Brazil, Chile, Colombia, Egypt, Malaysia, Mexico, Morocco, Peru, South Africa, Sri Lanka. Commodity importers include Costa Rica, Guatemala,Hungary, India, Indonesia, Pakistan, Philippines, Poland, Thailand, Turkey, Uruguay. GDP weighted averages are reported. Other countries not reported due to data limitations. Russia is excluded as 2014-15 dynamics mostly reflect idiosyncratic geopolitical factors.2/ EMBI sovereign spreads relative to January 2014 level.

2016 EXTERNAL SECTOR REPORT
INTERNATIONAL MONETARY FUND 11
9. In most cases, the use of foreign exchange intervention to mitigate the effect of tighter financial conditions and the commodity price shock was limited. Although there is some evidence of balance sheet effects still constraining their buffering role (Box 5), exchange rates moved sharply in most EMs, consistent with a commodity price decline perceived as mostly permanent—and against a backdrop of economic slack and lack of inflationary pressures. Aside from Saudi Arabia and China who drew down their reserves, foreign exchange intervention was limited and deployed in a few cases (Malaysia, Mexico, Thailand, and Turkey) where reserves were used to stem very rapid currency depreciation and associated volatile conditions (see further discussion in paragraph 21).2 Reflecting these net FX sales—partially offset by purchases in India, Switzerland, and Hong Kong—official holdings of reserves assets fell moderately in 2015 (by about US$220 billion, or 1.9 percent of the stock of official reserves of EBA/ESR countries). The decline in the USD value of global reserves also reflected valuation effects, mainly due to the appreciation of the USD via-a-vis other reserve currencies (Figure 7).
2 In some cases (Korea, Poland), while intervention was limited for the year as a whole, intra-year dynamics showed foreign exchange purchases in the first half of the year largely offset by sales in the second part of the year.
Box 4. China’s Domestic Rebalancing and External Imbalances
After peaking at nearly 10 percent of GDP in 2007, China’s current account surpluses narrowed significantly in subsequent years, plateauing in the 1¾–2¾ percent of GDP range since 2011. This narrowing was driven by a sharp increase in investment in the years following the GFC, a decline in the national savings rate, and weakness in advanced economies.
Since 2011, investment has gradually come down, as China began rebalancing its economy towards domestic consumption, supported by a sharp (33 percent) real appreciation of its currency. In 2015, however, subdued exports, worries over China’s growth outlook, a shift in expectations about relative returns on RMB assets, and general uncertainties over the direction of policies led to record capital outflows and balance of payments pressure. These net capital outflows (6 percent of GDP in 2015) more than offset the current account surplus, resulting in a sizable decline in reserves (3 percent of GDP), the first in two decades.
Over the medium term, as the economy rotates further toward private consumption and away from external demand, the trade surplus is expected to narrow and the services deficit to rise with healthy outbound tourism. The volume of capital outflows is expected to be broadly steady with the dominant force being the continued secular trend in residents’ portfolio rebalancing toward foreign assets amid the gradual opening of the capital account. Pressure on FX reserves is projected to remain manageable under the baseline.
60
80
100
120
140
-10
-5
0
5
10
15
2002 2005 2008 2011 2014
Non-Reserve FlowsCurrent AccountReserve Accum.REER (right scale, 2010=100)
30
35
40
45
50
55
2002 2005 2008 2011 2014
National Saving National Investment
Balance of Payments and REER, 2002-15(percent of GDP)
Saving and Investment, 2002-15(percent of GDP)
Sources: WEO and IMF Staff estimates.1/ Non-Reserve flows include errors and omissions.

2016 EXTERNAL SECTOR REPORT
12 INTERNATIONAL MONETARY FUND
Figure 7. Selected Economies: Gross International Reserves, 2005Q1-2016Q1 (In billions of U.S. dollars)
Global External Adjustment 10. The confluence of these factors shaped current account and exchange rate adjustments, resulting in a moderate widening of global external imbalances. While the commodity price shock and the uneven recovery in advanced economies had first order effects, the tightening of financial conditions in EM appears to have had more localized impact.
Among commodity exporters, the dominant factor was the sharp decline in commodity prices, which resulted in weakening current accounts, despite significant (net export volume) adjustments (Figure 8). Consistent with mitigating external imbalances, deficit commodity exporters offset a sizably larger share of the income loss, in comparison to surplus commodity exporters. With a few exceptions, exchange rate flexibility played a key role in cushioning the negative terms-of-trade shock, including by reducing the need for large fiscal adjustment (where currency depreciations contained the loss of commodity revenues measured in local currency). Imports contracted in these economies, reflecting shrinking domestic demand, and especially investment (most notably in the energy sector), which also responded to tighter financing conditions. Generally, countries with larger policy buffers were in a better position to smooth the income loss (Box 6), although sizable cuts in government spending were still necessary in the largest oil exporters (Saudi Arabia and Russia).
Among commodity importers, terms-of-trade income gains were accompanied by weakening net trade volumes, with visible disparities between deficit and surplus countries. On aggregate, deficit commodity importers spent a large share of the income gains, while surplus importers saved most of the windfall. This pattern, leading to a widening of global imbalances, reflected the stronger recovery and currencies of large deficit countries (U.S. and U.K.), in comparison to the large surplus economies, especially Japan and the euro area. The latter two registered a widening of their surpluses, supported by weaker currencies. In Japan domestic demand growth was flat, amid a slight pickup in output; while in the euro area a welcomed pickup in demand outpaced output growth although not enough to offset the income gains from improved terms-of-trade. On aggregate, fiscal policy played a more limited role in the evolution of imbalances, as the pace of consolidation was relatively small and more evenly distributed across deficit and surplus countries.3 An important exception was China, where a
3 This stands in contrast with the 2010-13 period, where large fiscal consolidations in deficit countries (e.g. France, Italy, Spain, U.K. and the U.S.) contributed to the sharp narrowing of imbalances following the GFC.
0
1000
2000
3000
4000
5000
2005 2007 2009 2011 2013 2015
ChinaIndiaOther EMEs
Commodity Importing EMEs
0
1000
2000
3000
4000
5000
2005 2007 2009 2011 2013 2015
Saudi ArabiaRussiaBrazilMalaysiaSouth AfricaMexico
Commodity Exporting EMEs
0
1000
2000
3000
4000
5000
2005 2007 2009 2011 2013 2015
Hong Kong SAR and Singapore
Japan
Switzerland
Korea
Other AEs
Advanced Economies
Source: IMF International Financial Statistics. Last observation corresponds to March 2016.
2016 EXTERNAL SECTOR REPORT
INTERNATIONAL MONETARY FUND 13
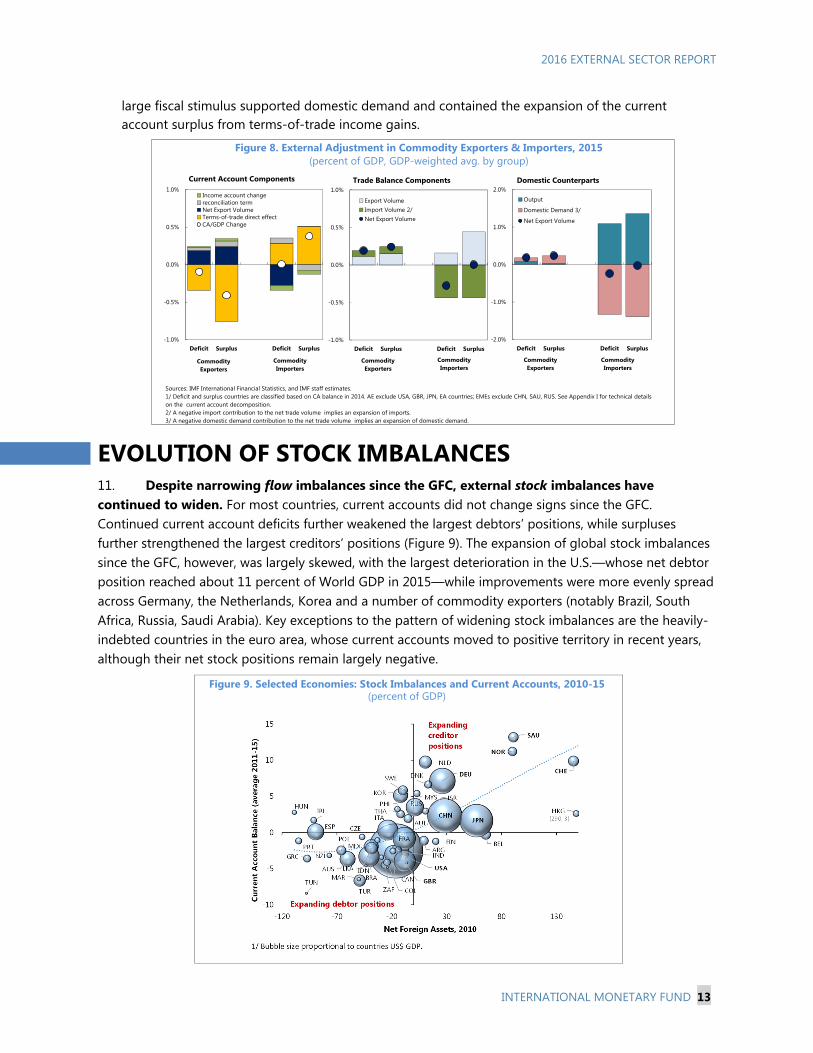
large fiscal stimulus supported domestic demand and contained the expansion of the current account surplus from terms-of-trade income gains.
Figure 8. External Adjustment in Commodity Exporters & Importers, 2015 (percent of GDP, GDP-weighted avg. by group)
EVOLUTION OF STOCK IMBALANCES 11. Despite narrowing flow imbalances since the GFC, external stock imbalances have continued to widen. For most countries, current accounts did not change signs since the GFC. Continued current account deficits further weakened the largest debtors’ positions, while surpluses further strengthened the largest creditors’ positions (Figure 9). The expansion of global stock imbalances since the GFC, however, was largely skewed, with the largest deterioration in the U.S.—whose net debtor position reached about 11 percent of World GDP in 2015—while improvements were more evenly spread across Germany, the Netherlands, Korea and a number of commodity exporters (notably Brazil, South Africa, Russia, Saudi Arabia). Key exceptions to the pattern of widening stock imbalances are the heavily-indebted countries in the euro area, whose current accounts moved to positive territory in recent years, although their net stock positions remain largely negative.
Figure 9. Selected Economies: Stock Imbalances and Current Accounts, 2010-15 (percent of GDP)
Current Account Components
Sources: IMF International Financial Statistics, and IMF staff estimates. 1/ Deficit and surplus countries are classified based on CA balance in 2014. AE exclude USA, GBR, JPN, EA countries; EMEs exclude CHN, SAU, RUS. See Appendix I for technical details on the current account decomposition.2/ A negative import contribution to the net trade volume implies an expansion of imports.3/ A negative domestic demand contribution to the net trade volume implies an expansion of domestic demand.
-1.0%
-0.5%
0.0%
0.5%
1.0%
Deficit Surplus Deficit Surplus
Export VolumeImport Volume 2/Net Export Volume
Commodity Exporters
Commodity Importers
-1.0%
-0.5%
0.0%
0.5%
1.0%
Deficit Surplus Deficit Surplus
Income account changereconciliation termNet Export VolumeTerms-of-trade direct effectCA/GDP Change
Commodity Exporters
Commodity Importers
-2.0%
-1.0%
0.0%
1.0%
2.0%
Deficit Surplus Deficit Surplus
Output
Domestic Demand 3/
Net Export Volume
Commodity Exporters
Commodity Importers
Trade Balance Components Domestic Counterparts

2016 EXTERNAL SECTOR REPORT
14 INTERNATIONAL MONETARY FUND
Box 5. External Adjustment and FX Exposure*
Although most EMs allowed their exchange rate to play a buffering role in the face of external and domestic shocks during 2015, the extent of exchange rate flexibility differed across countries. This box explores the role balance sheet dollarization may have played in explaining these cross-country differences, following earlier work, most notably by Calvo and Reinhart (2002).
While currency mismatches fell across EMs over the last decade (see April 2016 WEO Chapter 2), large differences across countries remain. Moreover, improvements in the net foreign asset position do not fully capture underlying vulnerabilities, especially since gross liabilities have also grown (and FX exposure has rotated from the public to the private sector, where incomplete hedging is more likely, see Chapter 3 in October 2015 GFSR). A simple look at the data suggests that countries with larger FX debt positions experienced smaller depreciations in 2015, with differences in FX exposure explaining roughly 20 percent of the variation in currency movements in major EMs.
The role of liability dollarization in constraining exchange rate depreciation is also assessed in a panel regression involving 15 non-pegged EMs during periods of USD appreciation and negative terms of trade shocks.1 The change in the nominal exchange rate ( % itUSDER ) is regressed against the change in commodity terms of trade (∆CToTi ), the change in USD exchange rate vis-à-vis the systemic currencies (% 3 tUSDS ) controlling for the country’s gross FX liabilities to GDP.2
%∆ %∆ %∆ 3 %∆ 3
Country fixed effects are used to control for time-invariant factors that can drive both the degree of dollarization and the extent to which shocks affect the currency. The estimation amounts to a difference-in-difference approach where the interaction term captures the differential response (within-country across-years) to movements in the USD, depending on the average degree of each country’s liability dollarization.
Results suggest that FX exposure dampens the degree of exchange rate flexibility (see Table). A USD appreciation against other systemic currencies similar in magnitude to that observed in 2015 is associated with a depreciation of 22 percent for countries in lower dollarization quartile and 14 percent in the upper quartile. This difference of 8 ppts is large and amounts to 2 standard deviations of exchange rate movements in the sample. Similar results are obtained when looking at the response to terms of trade shocks (column 2) and the results carry through to the response of the real, rather than the nominal exchange rate (columns 3-4). Similar results hold when using FX intervention as a dependent variable.
While limiting exchange rate flexibility may be appropriate where FX exposure is large, this does not resolve the underlying problem. Coherent macro policies coupled with measures targeted to address balance sheet exposures are necessary to avoid a more disorderly adjustment process, including the negative confidence effects associated with a rapid pace of reserve loss.
———————————— * Prepared by Mai Dao. 1 Include are Brazil, Chile, Colombia, India, Indonesia, Korea, Malaysia, Mexico, Peru, Philippines, Russia, South Africa, 3 The systematic difference in the propensity to intervene during depreciations is also confirmed when estimating a reserve reaction function at monthly frequency for the 2 groups of countries.
(1) (2) (3) (4)
Years of USDS3
appreciation:Country-year
with ∆CToT<0
Years of USDS3
appreciation:Country-year
with ∆CToT<0
% ∆USD-S3 -1.727*** -0.788**(0.313) (0.339)
% ∆USD-S3*FXDEBT 4.550** 3.636*(1.984) (1.980)
% ∆CToT -0.4128*** -0.652*** -0.250*** -0.325**(0.070) (0.183) (0.048) (0.144)
% ∆CToT*FXDEBT 1.652*** 1.364**(0.420) (0.567)
Constant -0.0474*** 0.132*** -0.00355 0.048(0.0116) (0.0289) (0.0207) (0.034)
Country FE Y Y Y YYear FE Y Y
Observations 60 110 60 110R-squared 0.592 0.479 0.461 0.315Number of ifs 15 15 15 15Robust standard errors in parentheses*** p<0.01, ** p<0.05, * p<0.1
FX-denominated debt and exchange rate response to negative shocks
Dep. variable: % ∆USDER Dep. variable: % ∆REER
2016 EXTERNAL SECTOR REPORT
INTERNATIONAL MONETARY FUND 15
12. Valuation effects played varying roles across economies, exacerbating stock imbalances in some systemic economies but mitigating in others, especially EMs.
Since the GFC, and in contrast to the crisis’ run-up period, valuation effects worked to widen stock imbalances in some systemic economies. The U.S.’s net foreign asset (NFA) position weakened by close to 25 percentage points of GDP since 2010, with negative valuation effects contributing over two-thirds of the total, and reflecting an increase in the value of liabilities due partly to the post-crisis recovery in equity prices, and the recent appreciation of the USD (Figure 10). For the UK, the marked NFA weakening during 2010-14 (14 percentage points of GDP), reversed entirely in 2015 (19 percentage points) on account of valuation effects. Similarly, in Japan positive valuation effects—resulting in part from gains associated with the weakening of the yen—were largely responsible for the close to 15 percentage points of GDP improvement in its NFA position. Valuation effects were less important in most euro area countries.
In contrast, valuation effects and relatively strong output growth worked to reduce stock imbalances (relative to income) in China and some key EMs. Despite persistent, albeit smaller, current account surpluses, China’s NFA position fell somewhat since the GFC mainly on account of the renminbi’s strengthening and continued high output growth rates. Valuation effects played a key role in helping
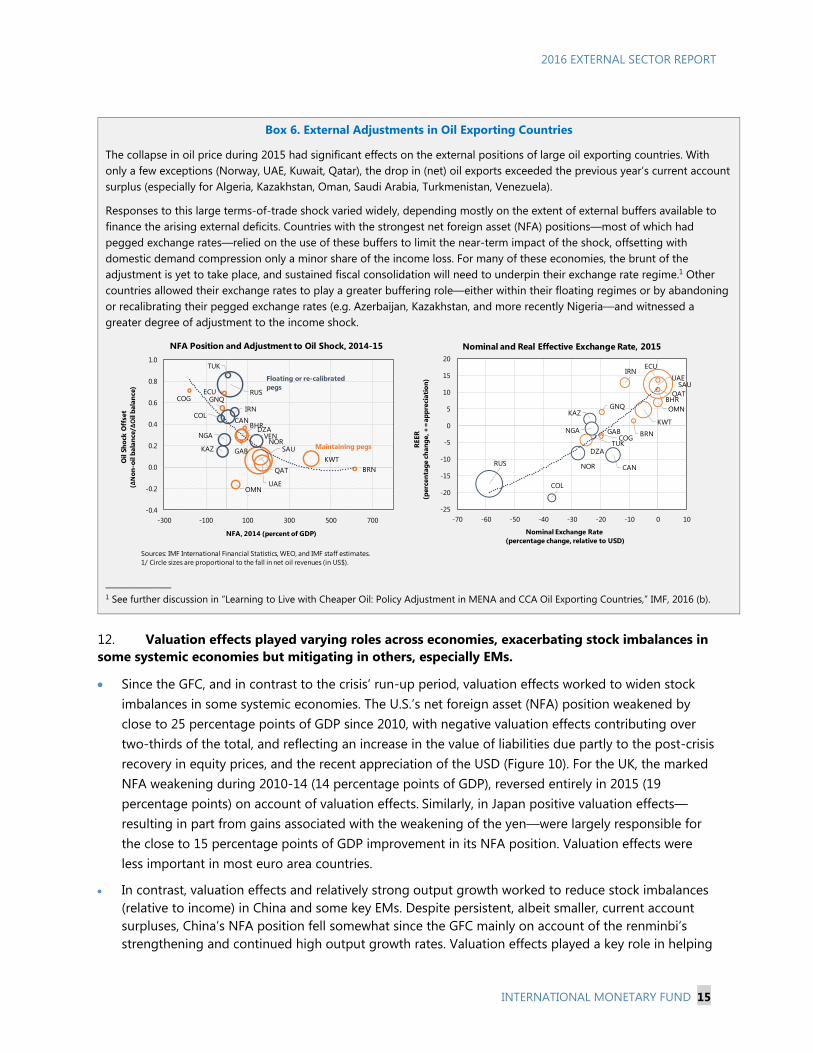
Box 6. External Adjustments in Oil Exporting Countries
The collapse in oil price during 2015 had significant effects on the external positions of large oil exporting countries. With only a few exceptions (Norway, UAE, Kuwait, Qatar), the drop in (net) oil exports exceeded the previous year’s current account surplus (especially for Algeria, Kazakhstan, Oman, Saudi Arabia, Turkmenistan, Venezuela).
Responses to this large terms-of-trade shock varied widely, depending mostly on the extent of external buffers available to finance the arising external deficits. Countries with the strongest net foreign asset (NFA) positions—most of which had pegged exchange rates—relied on the use of these buffers to limit the near-term impact of the shock, offsetting with domestic demand compression only a minor share of the income loss. For many of these economies, the brunt of the adjustment is yet to take place, and sustained fiscal consolidation will need to underpin their exchange rate regime.1 Other countries allowed their exchange rates to play a greater buffering role—either within their floating regimes or by abandoning or recalibrating their pegged exchange rates (e.g. Azerbaijan, Kazakhstan, and more recently Nigeria—and witnessed a greater degree of adjustment to the income shock.
______________ 1 See further discussion in “Learning to Live with Cheaper Oil: Policy Adjustment in MENA and CCA Oil Exporting Countries,” IMF, 2016 (b).
GNQ
KWT
COG
BRNQAT
OMN
SAUGAB
TUK
VEN
UAE
KAZ
DZABHR
NOR
RUS
IRN
NGA
ECU
COLCAN
-0.4
-0.2
0.0
0.2
0.4
0.6
0.8
1.0
-300 -100 100 300 500 700
NFA, 2014 (percent of GDP)
Oil
Shoc
k O
ffse
t (Δ
Non
-oil
bala
nce/
ΔO
il ba
lanc
e)
Maintaining pegs
Floating or re-calibrated pegs
Sources: IMF International Financial Statistics, WEO, and IMF staff estimates.1/ Circle sizes are proportional to the fall in net oil revenues (in US$).
GNQ
KWT
COG BRN
QAT
OMN
SAU
GAB
TUK
UAE
KAZ
DZA
BHR
NORRUS
IRN
NGA
ECU
COL
CAN
-25
-20
-15
-10
-5
0
5
10
15
20
-70 -60 -50 -40 -30 -20 -10 0 10
Nominal Exchange Rate(percentage change, relative to USD)
REER
(per
cent
age
chan
ge, +
=ap
prec
iati
on)
Nominal and Real Effective Exchange Rate, 2015NFA Position and Adjustment to Oil Shock, 2014-15

2016 EXTERNAL SECTOR REPORT
16 INTERNATIONAL MONETARY FUND
to contain (and in some cases reduce) stock imbalances in many EMs, especially those with large USD asset positions and a sizable share of their liabilities in equity and local currency (Brazil, South Africa, Russia).
Figure 10. Selected Economies: Drivers of NFA Changes, 2010-15 (percent of GDP)
13. Unlike earlier episodes of tightening in external conditions, valuation effects have played a supporting role in many EMs (Figure 11). Efforts to build official and private foreign assets, and to improve the composition of liabilities (by increasing the share of equity and local currency liabilities) have changed the (valuation) impact of exchange rate movements on EM’s external positions. Unlike past episodes of balance of payment pressures, the widespread depreciations during 2015 have been accompanied by improvements in the NFA positions in many EMs, highlighting their increased resilience to external shocks.
Figure 11. Selected Economies: NFA Changes around Large Exchange Rate Depreciations
TUR
ZAF
BRA
MEX
SAU IND
IDN
MYSTHA
RUS
CHN
POL
-30
-20
-10
0
10
20
30
40
-20 0 20 40 60 80
Chan
ge in
NFA
(p
erce
nt o
f GD
P)
Exchange Rate Depreciation(vis-a-vis USD, percentage change)
2015
Sources: External Wealth of Nations Mark II data set (Lane and Milesi-Ferretti 2007); IMF World Economic Outlook database; Lane and Milesi-Ferretti 2012;
TUR
ZAF BRA
MEX
SAU
IND
IDN
MYS
THA
RUS
CHN
POLTUR
ZAF
BRA
MEX
SAU
IND
MYSCHN
POL
-30
-20
-10
0
10
20
30
40
-20 0 20 40 60 80
Exchange Rate Depreciation(vis-a-vis USD, percentage change)
Period 1998-99Period 1997-98
Asian and Russia Crises (1997-98 and 1998-99)
Sources: External Wealth of Nations Mark II data set (Lane and Milesi-Ferretti 2007); IMF, World Economic Outlook database; Lane and Milesi-
Sources: External Wealth of Nations Mark II data set (Lane and Milesi-Ferretti 2007); Haver Analytics; IMF, International Financial Statistics; IMF, World Economic Outlook database; Lane and Milesi-Ferretti 2012; and IMF staff calculations.
-15.0
U.S. China
Capital Account plus Errors and OmissionsCurrent AccountGrowth AdjustmentValuation EffectsChange in NFA
-50
-40
-30
-20
-10
0
10
20
30
40
50
OtherDebtors
U.K. Euro-AreaDebtors
U.S. Euro-AreaCreditors
Japan OtherCreditors
China
Main Contributions
Debtors Creditors Debtors Creditors
-10.0-5.00.05.010.0Currency Valuation Effects
Price Valuation Effects
Valuation Effects
-40
-30
-20
-10
0
10
20
30
40
OtherDebtors
U.K. Euro-AreaDebtors
U.S. Japan Euro-AreaCreditors
China OtherCreditors
Valuation Effects
Sources: Haver Analytics; IMF, International Financial Statistics (IFS) database; IMF, Financial Flows Analytics database; IMF, World Economic Outlook database; Bénétrix, Lane and Shambaugh 2015; and IMF staff calculations.See Technical Appendix for more details.

2016 EXTERNAL SECTOR REPORT
INTERNATIONAL MONETARY FUND 17
NORMATIVE ASSESSMENT OF EXTERNAL POSITIONS 14. This section summarizes the staff assessments of countries’ external positions, included in the companion paper. Current accounts and real exchange rate assessments for 2015 are compared to previous ones as well as the results from the EBA regressions, which are the main methodological tools for a multilaterally consistent evaluation of external positions and are based on data and IMF staff projections prior to the U.K. referendum (Box 1). The section also discusses the key drivers behind the assessments, including the role of domestic policies.
15. Differences in current accounts and real exchange rates across countries are generally explained by staff-assessed norms (i.e., fundamentals). Countries with persistently large current account surpluses (deficits) continue having correspondingly large (small) current account norms (Figure 12). Differences in staff-assessed norms largely reflect relative differences in income and institutional development levels, growth prospects, demographics, and NFA position, as well as other idiosyncratic variables related to a country’s non-renewable resource wealth, and reserve currency and financial center status.4 To control for temporary and cyclical factors, adjustments to the current account are made to abstract from the economy’s cyclical position and temporary changes in its terms of trade (Box 7). Given difficulties and uncertainties in their assessment, staff-assessed norms are presented in ranges.
Figure 12. ESR Economies: Cyclically-adjusted Current Accounts. Actual vs. Staff-Assessed Norm, 2015
4 See IMF Working Paper 13/272 for a conceptual discussion on the role of these variables in driving current accounts and real exchange rates, and the quantification of their effects by the EBA models.
-8
-4
0
4
8
12
16
-8
-4
0
4
8
12
16
EA JPN
CHN
GBR
USA
NLD
DEU ITA
ESP
BEL
FRA
CHE
SWE
KOR
CAN
AU
S
RUS
THA
MYS
BRA
POL
TUR
IND
IDN
ZAF
MEX
Cyclically-adjusted CA 1/ESR Staff-assessed Norm
Source: IMF Staff estimates.1/ Adjusted for both the relative output gap and terms of trade gap. Sorted by mid-point of the CA norm.
Systemic 5 Euro Area Other AEs Other EMEs

2016 EXTERNAL SECTOR REPORT
18 INTERNATIONAL MONETARY FUND
Box 7. Treatment of Commodity Shocks in the EBA1
The treatment of commodity terms of trade (TOT) differs for the current account (CA) and real effective exchange rate (REER) regressions depending on the duration of the shock. A permanent TOT gain that boosts real income and wealth is expected to appreciate the REER, but to have limited impact on the CA level, as permanent real income and spending would move in tandem. On the other hand, a temporary change in the TOT would affect the CA via the consumption-smoothing channel and the inter-temporal substitution channel, although the overall impact is ambiguous as these work in opposite directions (Ostry, 1988). Given these conceptual priors, the country-specific commodity TOT index enters the EBA CA and REER regressions as follows:2
CA regression: The commodity TOT index is measured as a cyclical deviation from its trend, in order to capture only the temporary component of the shocks. This is estimated first by extending the time series into the medium term (using WEO-projected commodity prices) and then by using an HP filter for each country to obtain a country-specific series of the cyclical component. This measure is then interacted with trade openness (the ratio of exports plus imports of goods and services to GDP). The coefficient suggests that a temporary 1-ppt fall in the TOT is associated with a 0.25 percent of GDP fall in the CA in a country with an average level of trade openness. Recent TOT changes are estimated to explain about 1.2 and 0.6 percent of GDP of the CA deterioration for oil and nonoil exporters, respectively. Given that the actual CA balance deteriorated by much less the underlying CA improved.
REER regression: The commodity TOT index enters the regression without any adjustments in this case, to capture the effect of both temporary and permanent shocks. The estimated coefficient suggests that a 10 percent decline in commodity TOT leads to a 1 percent depreciation of the REER. This is somewhat lower that the coefficients in the literature based on data through mid-2000s. While REERs for oil and non-oil exporters depreciated by an average of 12and 3 percent, respectively, in 2015, the TOT coefficient contributed only a minor portion of this movement (1.3 and 0.3 percent for oil and non-oil, respectively).
For net oil and gas exporters, the CA regression also includes a measure of resource exhaustibility. This is necessary to capture energy exporters’ need to save a large portion of its income in recognition of inter-generational considerations related to the non-renewable nature of their commodity resources. CAs are positively related to the size of the energy trade balance, adjusted to the degree of “temporariness”, which is measured as the ratio of production to the stock of proven reserves (relative to Norway 2010 for multilateral consistency purposes). The estimated coefficient indicates that a 1-ppt of GDP increase in “temporariness” increase the CA norm by 0.6 ppts. The recent declines in oil prices led to a 0.4 percent of GDP decline in temporariness, raising the CA norm by 0.2-0.3 percent.
TOT shocks can also enter indirectly through its impact on medium-term growth estimates. A one percent decline in the 5-year ahead growth forecast is associated with (i) a 0.5 ppt of GDP increase in the CA balance; and (ii) a 2.5 percent weakening of the REER. Recent downward revisions in the medium-term growth forecast for commodity exporters (0.1 and 0.4 percent for oil and nonoil, respectively) are responsible for a slightly higher CA norm.
——————————— 1 See: The External Balance Assessment (EBA) Methodology, 2013, IMF Working Paper 13-272; and Ostry, J. 1988, “The Balance of Trade, the Terms of Trade, and the Real Exchange Rate: An Intertemporal Optimizing Framework,” IMF Staff Papers, Vol. 35, No. 4. 2 Commodity price indices are measured against manufacturing goods prices of advanced economies.
Oil Nonoil Oil Nonoil Oil Nonoil
Actual CA balance 0.7 -3.4 1.1 -3.5 -0.4 0.1
TOT gap -0.7 -0.4 0.5 0.2 -1.2 -0.6
Output gap -0.4 -0.3 -0.5 -0.3 0.2 0.0
Cycl Adj. Actual CA 1.8 -2.7 1.2 -3.3 0.6 0.6
Cycl Adj. CA Norm 2.9 -2.1 2.0 -2.1 0.9 0.0
"Temporariness" 2.5 … 2.3 … 0.2 …
Expected GDP 0.0 -0.1 -0.1 -0.3 0.0 0.2
Source: Staff Estimated CA regression.
20142015 Diff (2015-14)
EBA CA Regression: Commodity Exporters
1/ Simple average across groups. Oil exporters include: Canada, Colombia, Malaysia, Mexico, and Russia. Non-oil exporters include: Australia, Brazil, Chile, Indonesia, New Zealand, Peru, and South Africa. Figures correspond to coefficient* contribution.

2016 EXTERNAL SECTOR REPORT
INTERNATIONAL MONETARY FUND 19
16. The reconfiguration of external imbalances during 2015, however, led to some shifts in staff-assessed excess imbalances (Figure 13 and Table 2). Changes in excess current account imbalances were concentrated in a few countries and driven in part by the confluence of factors discussed earlier.
External gaps widened among key systemic countries. The deterioration in the underlying U.S. current account deficit (after controlling for cyclical factors), supported by the sharp USD appreciation, led staff to shift its external assessment from “broadly consistent” with fundamentals and desired policies in 2014 to “moderately weaker” in 2015. In contrast, the improvement in Japan’s underlying current account moved its external assessment to “moderately stronger”. The euro area’s current account gap turned more positive, yet not enough to change the qualitative “broadly consistent” assessment. Staff-assessed external positions were broadly unchanged for China (“moderately stronger”) and the U.K. (“weaker”), even though both currencies strengthened in real terms between 2014 and 2015.
Within the euro area, external balances improved in most countries, although individual assessments continued to vary widely. Amid slightly larger excess surpluses, Germany and the Netherland’s external position remained “substantially stronger” and “stronger”, respectively. In France and Spain, excess deficits narrowed, although Spain’s external position remained “substantially weaker” given its still large negative NIIP. Belgium’s underlying current account deteriorated (shifting to become “moderately weaker”) although partly reflecting data revisions.
External gaps remained large and positive in many of the other surplus economies. Current accounts remained “substantially stronger” in Korea and Singapore, and “stronger” in Malaysia and Sweden, as their underlying current accounts were broadly unchanged.
The external position deteriorated in some of the large oil exporters, as buffers or external financing were used to mitigate the near-term demand impact of the commodity price shock. Canada and Saudi Arabia moved from “broadly in line” in both cases to “moderately weaker” and “substantially weaker”, respectively. The marked change in Saudi Arabia’s assessment highlights the additional adjustment (fiscal and structural) necessary over the medium term to achieve external balance.
Excess deficits continued to narrow in key EMs (Brazil, Indonesia, Russia, South Africa, Turkey), reflecting significant domestic demand adjustments since 2013 in the context of tighter external financing conditions, currency depreciation, and domestic uncertainties.

2016 EXTERNAL SECTOR REPORT
20 INTERNATIONAL MONETARY FUND
Figure 13. ESR Economies: Staff-Assessed Current Account Gaps, 2014-15 (percent of GDP)
17. This reconfiguration implied a widening in excess imbalances of ESR economies as a group. A simple indicator of aggregate current account gaps—given by the weighted average of the absolute value of staff-assessed current account gaps for ESR economies—reached 1.6 percent of world GDP in 2015, well above the levels estimated for 2013–14 (0.5–0.6 percent of GDP). Contributions to the excess surpluses were concentrated in China (mainly reflecting the size of its economy and despite no change in the assessed gap) and Germany, followed at a distance by Japan and Korea. Meanwhile, contributions to the excess deficits were dominated by the U.S., followed by the U.K., Saudi Arabia, Brazil, Canada and a few euro area countries (Belgium, France, and Spain). The increase in excess imbalances in the U.S., the euro area and Japan were largely responsible for the widening of gaps at the global scale, which more than offset the narrowing of gaps in vulnerable EMs and some euro area countries.
18. Current account and currency assessments point in the same direction, with differences in implied magnitudes in a few cases mainly reflecting lagged exchange rate effects (Figure 14). Consistent with 2015 current account gap assessments, the USD and pound sterling were considered overvalued; the yen undervalued; and the euro broadly in line (although slightly weaker than last year). China’s renminbi moved to become broadly in line with fundamentals (from moderately undervalued), despite its current account being stronger than fundamentals and desired policies, although its current account gap is projected to narrow with the delayed effects of the real appreciation and further progress in rebalancing. Meanwhile, currencies of most commodity exporters moved to become less overvalued than in 2014. The notable exception was Saudi Arabia, whose currency appreciated sharply in real terms, despite sharply lower oil prices, because of being pegged to the USD.
CHN
JPNEA
GBR
USA
DEU
NLDESP
ITA
BEL
FRA
SGP
KOR
SWE
CHE
HKG
AUS
CAN
MYS
RUS
POL
IND
IDN
MEX
TUR
BRA
ZAF
-2
-1
0
1
2
-4 -2 0 2 4 6
Staff Assessed CA GAP 2014
Chan
ge in
Sta
ff-a
sses
sed
CAG
AP,
201
5-14
SAU
Source: IMF Staff assessments.1/ Mid-points of staff assessments. For some countries, changes in the gap could reflect new adjustments to the norm or actual current account (e.g. Korea's income balance).
wideninggaps
wideninggaps
THA

2016 EXTERNAL SECTOR REPORT
INTERNATIONAL MONETARY FUND 21
Figure 14. ESR Economies: Staff-Assessed REER and Current Account Gaps, 2015
19. The staff-assessed external norms were broadly consistent with EBA regression results (Figure 15). All three EBA models5 were used to assess countries’ external positions, although the current account model tended to carry a heavier weight in most assessments. Departures of staff assessments from the current account EBA results mainly centered on countries with large offshore financial centers and/or large income and service balances (Sweden, Switzerland, and to a lesser extent Korea) for which REER and CA EBA-models sometimes pointed in different directions. As in past years, staff carried out minor country-specific adjustments not captured by the EBA model. These adjustments are detailed and discussed in the companion paper. Meanwhile, REER regressions had a poorer fit for commodity
Figure 15. ESR Economies: Staff-Assessed vs. EBA Estimated Current Account and REER Gaps, 2015
5 The EBA methodology includes three different models: one for the current account, one for the real effective exchange rate measured as an index, and one for the real exchange rate measured in absolute levels. See also Annex of the 2015 ESR.
CHN
JPN
EA
GBR
USA
DEU
NLD
ESPITA
BELFRA
SGP
KOR
SWE
CHE
HKG
AUS
CAN
MYSTHA
RUS
POL
INDIDNMEX
TUR
BRAZAF
-4
-3
-2
-1
0
1
2
3
4
5
6
-15 -10 -5 0 5 10 15
Staff-assessed REER GAP, 2015 (in percent)
Staf
f-as
sess
ed C
A G
AP,
201
5 (in
% o
f GD
P)
Source: IMF Staff assessments.1/ Midpoints of REER and CA Gaps. Shaded area represents range for "broadly in line" assessment.
OvervaluedUndervalued
Wea
ker
Stro
nger

2016 EXTERNAL SECTOR REPORT
22 INTERNATIONAL MONETARY FUND
exporters, partly reflecting the low estimated elasticities to terms-of-trade changes (Box 7). For countries with large negative NIIP (e.g. Spain, Turkey), the external sustainability approach carried a heavier weight in the final assessment of the external gap. 20. The factors explaining staff-assessed gaps vary significantly across countries (Figure 16). Contributions to the gap are derived from the EBA estimated policy gaps (fiscal, credit, reserves, health spending, capital controls), as well as other policies and distortions that are not captured by the model, the details of which are discussed in the country pages (Table 3). These “identified” policy gaps are estimated relative to the future desired level (when the economy is at full employment and not relative to the current conjuncture), and their overall contribution depends on how large the gap is relative to other countries.6
External gaps and policies. Fiscal policy gaps are generally the largest contributors to overall “identified” policy gaps in most countries. Positive fiscal gaps (stronger-than-desirable fiscal stance) can explain a significant part of the excess surplus of some countries (e.g. Germany, Korea and Thailand), while negative fiscal gaps (weaker-than-desirable) are key contributors to the excess deficits in others (Belgium, Brazil, France, Spain, U.K.). While not part of EBA, Saudi Arabia’s large external gaps is assessed to be largely explained by the fiscal gap. In some cases (e.g. China, Japan, U.S.), estimated policy gaps cannot explain the staff-assessed external gap, suggesting that other policies or structural factors not captured by the model are playing a role. This does not imply, however, that the identified policy gaps are not individually important, since the contribution of different policy gaps could offset each other.
Role of changes in policy gaps. Key systemic economies (China, Japan, U.S. and U.K) registered improvements in their overall policy gaps during 2015, with fiscal consolidation playing a role in Japan, the U.S. and the U.K. However, these reduced policy gaps did not translate into a narrowing of external imbalances in all cases, highlighting the role of other underlying impediments (not identified by the model) to external adjustment. In a few cases (France, Spain), however, reduced policy gaps (mainly fiscal) contributed to the narrowing of external imbalances.
Figure 16. ESR Economies: Contributions of Policy Gaps to the 2015 Staff-Assessed Current Account Gap
(percent of GDP)
6 To achieve multilateral consistency, the estimated domestic policy gaps were adjusted down by about 0.8 percent of GDP in 2015.
GBR
TURZAF
BRA
USA
CAN
BELFRA
AUS
CHE
ITA
ESP RUS
EAMEX
IDN
IND
POL
JPN
SWE
CHNNLD
THA
MYS
KORDEU
-3
-2
-1
0
1
2
-4 -3 -2 -1 0 1 2 3 4 5Staff-Assessed CA Gap, 2015
EBA
Ove
rall
Polic
y G
aps,
201
5 1/
Source: IMF staff estimates and assessments.1/ Policy gaps after multilateral consistency adjustment.
GBR
TURZAF
BRA
USA
CANBEL
FRAAUS
CHEITAESP
RUS
EAMEX
IDN
INDPOL
JPNSWE
CHN
NLD
THAMYS KOR
DEU
-3
-2
-1
0
1
2
-3 -2 -1 0 1 2
Overall Policy Gap, 2014
Chan
ge in
Pol
icy
Gap
s, 2
015-
14 1/
2016 EXTERNAL SECTOR REPORT
INTERNATIONAL MONETARY FUND 23
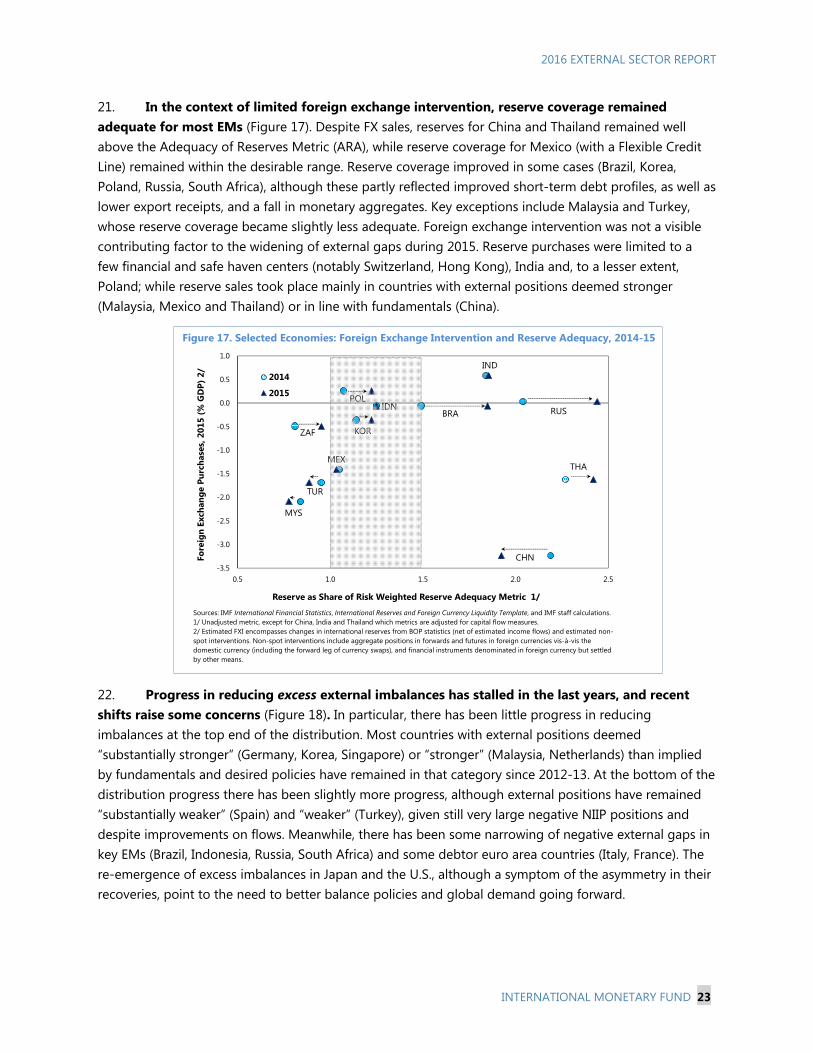
21. In the context of limited foreign exchange intervention, reserve coverage remained adequate for most EMs (Figure 17). Despite FX sales, reserves for China and Thailand remained well above the Adequacy of Reserves Metric (ARA), while reserve coverage for Mexico (with a Flexible Credit Line) remained within the desirable range. Reserve coverage improved in some cases (Brazil, Korea, Poland, Russia, South Africa), although these partly reflected improved short-term debt profiles, as well as lower export receipts, and a fall in monetary aggregates. Key exceptions include Malaysia and Turkey, whose reserve coverage became slightly less adequate. Foreign exchange intervention was not a visible contributing factor to the widening of external gaps during 2015. Reserve purchases were limited to a few financial and safe haven centers (notably Switzerland, Hong Kong), India and, to a lesser extent, Poland; while reserve sales took place mainly in countries with external positions deemed stronger (Malaysia, Mexico and Thailand) or in line with fundamentals (China).
Figure 17. Selected Economies: Foreign Exchange Intervention and Reserve Adequacy, 2014-15
22. Progress in reducing excess external imbalances has stalled in the last years, and recent shifts raise some concerns (Figure 18). In particular, there has been little progress in reducing imbalances at the top end of the distribution. Most countries with external positions deemed “substantially stronger” (Germany, Korea, Singapore) or “stronger” (Malaysia, Netherlands) than implied by fundamentals and desired policies have remained in that category since 2012-13. At the bottom of the distribution progress there has been slightly more progress, although external positions have remained “substantially weaker” (Spain) and “weaker” (Turkey), given still very large negative NIIP positions and despite improvements on flows. Meanwhile, there has been some narrowing of negative external gaps in key EMs (Brazil, Indonesia, Russia, South Africa) and some debtor euro area countries (Italy, France). The re-emergence of excess imbalances in Japan and the U.S., although a symptom of the asymmetry in their recoveries, point to the need to better balance policies and global demand going forward.
BRA
CHN
IND
IDN
KOR
MYS
MEX
POLRUS
ZAF
THA
TUR
-3.5
-3.0
-2.5
-2.0
-1.5
-1.0
-0.5
0.0
0.5
1.0
0.5 1.0 1.5 2.0 2.5
Fore
ign
Exch
ange
Pur
chas
es, 2
015
(% G
DP)
2/
Reserve as Share of Risk Weighted Reserve Adequacy Metric 1/
2014
2015
Sources: IMF International Financial Statistics, International Reserves and Foreign Currency Liquidity Template, and IMF staff calculations.1/ Unadjusted metric, except for China, India and Thailand which metrics are adjusted for capital flow measures.2/ Estimated FXI encompasses changes in international reserves from BOP statistics (net of estimated income flows) and estimated non-spot interventions. Non-spot interventions include aggregate positions in forwards and futures in foreign currencies vis-à-vis the domestic currency (including the forward leg of currency swaps), and financial instruments denominated in foreign currency but settled by other means.

2016 EXTERNAL SECTOR REPORT
24 INTERNATIONAL MONETARY FUND
Figure 18. ESR Economies: Evolution of External Assessments, 2012-15
OUTLOOK AND POLICIES 23. Since 2015, currencies have been subject to large fluctuations—including following the U.K. referendum.7
Particularly noteworthy has been the appreciation of yen, which after weakening since late 2011 (35 percent in real terms), strengthened sharply (about 15 percent through June 2016) relative to the 2015 average, reflecting revised market perceptions about monetary policy in Japan vis-a-vis other reserve currencies as well as safe have flows. This suggests the yen has moved towards a level consistent with medium-term fundamentals, although this rapid appreciation may undermine efforts to lower deflation risks.8 The USD, after some weakening earlier this year, strengthened recently in response to increased global risk aversion, and remains broadly unchanged relative to 2015 (suggesting a similar degree of overvaluation).
7 The average REER for June is compared to the 2015 average, which is used in the 2015 external assessments. The June REER value captures only part of the currency movements since the U.K. referendum, the persistence of which remains uncertain.
8 While the yen strengthened further in the days following the U.K. referendum, market conditions remain volatile.
2012 2013 2014 2015
Stronger than Implied by Fundamentals 1/
Germany 1 1 1 1 Moderately Substantially
Korea 2 1 1 1 Stronger 3 2 1
Singapore 2 1 1 1 Broadly in line 4 4 4
Malaysia 2 2 2 2 Weaker 5 6 7
Netherlands 2 2 2 2
Sweden 2 3 3 2
China 3 3 3 3Broadly in Line with Fundamentals
Thailand 4 4 4 2
Japan 3 4 4 3
Switzerland 3 4 4 5
Euro Area 4 4 4 4
Hong Kong SAR 4 4 4 4
India 4 4 4 4
Mexico 4 4 4 4
Poland 4 4 4 4
Italy 5 4 4 4
United States 5 4 4 5
Saudi Arabia 4 4 4 7
Weaker than Implied by Fundamentals 1/
Indonesia 5 5 5 4
Russia 4 6 5 4
Canada 6 5 4 5
Belgium 5 6 4 5
Australia 6 5 5 5
Brazil 5 5 6 5
France 5 6 6 5
South Africa 6 6 6 5
Turkey 6 5 6 6
United Kingdom 5 6 6 6
Spain 7 7 7 7
1/ Stronger (weaker) implies 'undervaluation' ('overvaluation'). Grouping is based on countries' prevailing assessment during 2012-15.

2016 EXTERNAL SECTOR REPORT
INTERNATIONAL MONETARY FUND 25
The sterling weakened moderately in the months preceding the referendum (about 5 percent in real terms relative to the 2015 average) and steeply afterwards. Meanwhile, the euro, after strengthening earlier in the year, weakened more recently and remains broadly unchanged in real terms relative to 2015. The overall implications of the referendum and subsequent market reactions for external assessments of both the U.K. and the euro area remain uncertain and will depend in part on how the transition is managed and on what new arrangements are adopted.
The renminbi weakened through June (about 5 percent in real terms), and while this movement keeps it broadly in line with medium-term fundamentals the assessment is subject to a high degree of uncertainty. Other emerging market currencies have been especially volatile, fluctuating with commodity prices and global risk aversion. While on aggregate they remain broadly unchanged in real terms relative to 2015, there is large cross country heterogeneity, likely reflecting the strength of policy frameworks, market liquidity, commodity dependence and other idiosyncratic factors. While in some cases (South Africa) the recent depreciation appears consistent with a narrowing of external gaps, in others (Korea, Malaysia, Thailand) the currency weakening suggests a movement in the opposite direction.
24. Under the configuration of policies and exchange rates prevailing before the U.K. referendum, current accounts are projected to remain largely unaltered over the medium term (Figure 19). Surpluses in Japan and the euro area would continue, while surpluses in other advanced economies would narrow only marginally. China’s current account surpluses are forecast to further narrow as structural reforms currently in train support domestic rebalancing. The U.S. current account deficit, on the other hand, is projected to widen gradually as the economic recovery strengthens.
Figure 19. ESR Economies: Current Account Balance, 2015 and 2020 Projection (percent of GDP)
25. These trends would lead to a further widening of stock imbalances (Figure 20). Large debtor positions in the U.S. and U.K. would continue to grow, reaching -50 and -25 percent of GDP, respectively, by 2020. Large creditor positions of Japan, Germany and the Netherlands would also expand, exceeding
-8
-4
0
4
8
12
-8
-4
0
4
8
12
Uni
ted
King
dom
Uni
ted
Stat
esCh
ina
Euro
Are
aJa
pan
Fran
ceBe
lgiu
mSp
ain
Italy
Ger
man
yN
ethe
rland
s
Aust
ralia
Cana
daH
ong
Kong
Swed
enKo
rea
Switz
erla
ndSi
ngap
ore
Saud
i Ara
bia
Turk
eySo
uth
Afric
aBr
azil
Mex
ico
Indo
nesia
Indi
aPo
land
Mal
aysi
aRu
ssia
Thai
land
Systemic 5 Euro Area Other Advanced Economies
Emerging Markets
2015
2020
Singapore2015: 19.7; 2020: 18.6
Sources: World Economic Outlook. and IMF staff calculations.1/ Projections entail a reduction of the global CA discrepancy.
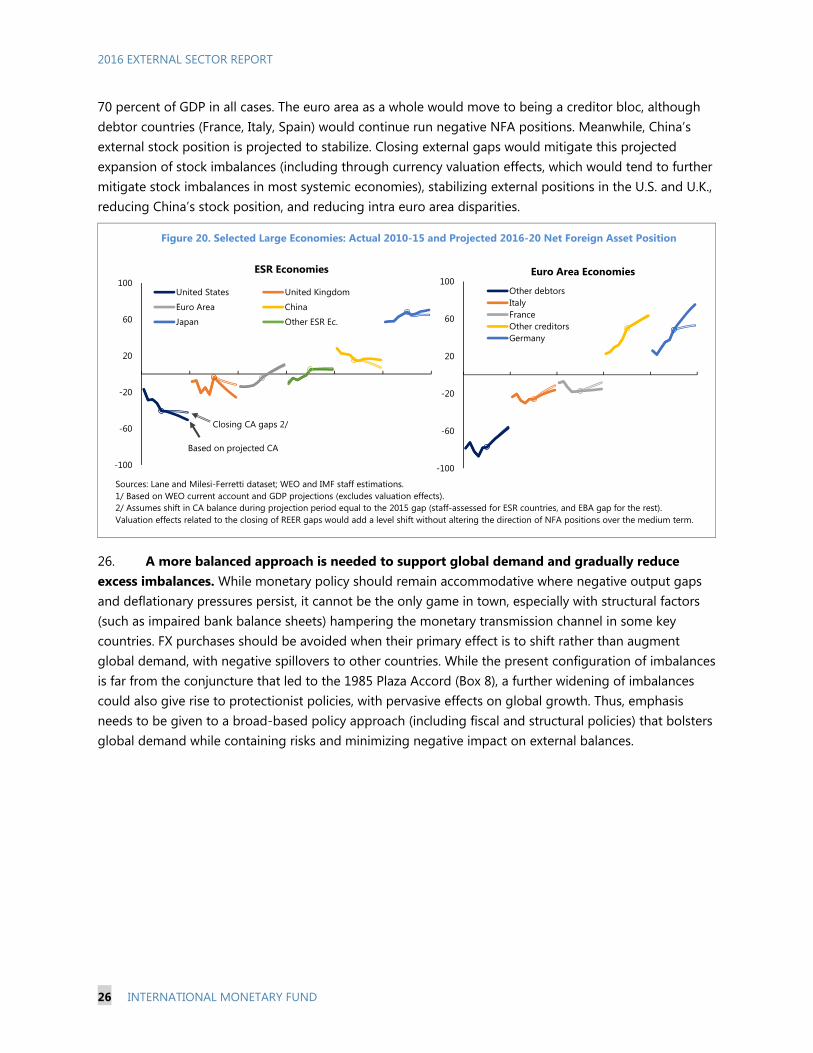
2016 EXTERNAL SECTOR REPORT
26 INTERNATIONAL MONETARY FUND
70 percent of GDP in all cases. The euro area as a whole would move to being a creditor bloc, although debtor countries (France, Italy, Spain) would continue run negative NFA positions. Meanwhile, China’s external stock position is projected to stabilize. Closing external gaps would mitigate this projected expansion of stock imbalances (including through currency valuation effects, which would tend to further mitigate stock imbalances in most systemic economies), stabilizing external positions in the U.S. and U.K., reducing China’s stock position, and reducing intra euro area disparities.
Figure 20. Selected Large Economies: Actual 2010-15 and Projected 2016-20 Net Foreign Asset Position
26. A more balanced approach is needed to support global demand and gradually reduce excess imbalances. While monetary policy should remain accommodative where negative output gaps and deflationary pressures persist, it cannot be the only game in town, especially with structural factors (such as impaired bank balance sheets) hampering the monetary transmission channel in some key countries. FX purchases should be avoided when their primary effect is to shift rather than augment global demand, with negative spillovers to other countries. While the present configuration of imbalances is far from the conjuncture that led to the 1985 Plaza Accord (Box 8), a further widening of imbalances could also give rise to protectionist policies, with pervasive effects on global growth. Thus, emphasis needs to be given to a broad-based policy approach (including fiscal and structural policies) that bolsters global demand while containing risks and minimizing negative impact on external balances.
-100
-60
-20
20
60
100ESR Economies
United States United Kingdom
Euro Area China
Japan Other ESR Ec.
Closing CA gaps 2/
Based on projected CA
-100
-60
-20
20
60
100Euro Area Economies
Other debtorsItalyFranceOther creditorsGermany
Sources: Lane and Milesi-Ferretti dataset; WEO and IMF staff estimations. 1/ Based on WEO current account and GDP projections (excludes valuation effects).2/ Assumes shift in CA balance during projection period equal to the 2015 gap (staff-assessed for ESR countries, and EBA gap for the rest).Valuation effects related to the closing of REER gaps would add a level shift without altering the direction of NFA positions over the medium term.

2016 EXTERNAL SECTOR REPORT
INTERNATIONAL MONETARY FUND 27
Box 8. The Plaza Accord: How Different Are External Conditions Today? 1/
1980-85: Currencies and external positions of key systemic economies registered important shifts in the years leading up to the Plaza Accord (Figure). The USD appreciated sharply (by 42 percent in real effective terms) over the previous five years, the U.S. current account (CA) balance deteriorated steeply (from 0.1 to -2.7 percent of GDP), and the country moved to become a net debtor. Meanwhile, Germany and Japan saw a marked improvement in their CA balances, despite some currency appreciation in the case of Japan. These large shifts raised protectionist concerns and set the stage for the 1985 Accord.2 Under the agreement, the G-5 economies at the time (U.S., U.K., Germany, Japan, and France) coordinated a massive intervention (US$10 billion or 1.3 percent of global reserves) in the FX market, aimed primarily at depreciating the USD in real effective terms. Over the following five years, the USD weakened (30 percent in real terms), the yen and European currencies strengthened (by 17 and 25 percent, respectively) and CA imbalances narrowed markedly in most of these economies.
Current situation: Concerns about global imbalances, and especially currency movements, have resurfaced recently, as unconventional policies and uneven recoveries across systemic economies have been accompanied by widening external imbalances (surpluses in Japan, the euro area and China, and deficits in the U.S. and U.K.). A simple comparison, however, indicates that current conditions different from those prevailing in 1985.
While in 2015, CA balances in the U.S. and Japan reached similar levels relative to GDP of those observed in 1985, current levels are significantly smaller relative to the degree of openness of these economies and far less concentrated. For instance, current external imbalances represent a much smaller share of total trade, indicating that smaller adjustments would be necessary to close the external imbalances. Moreover, the U.S. (Japan) CA balance as a share of global imbalances stands at 38 (9) percent in 2015, compared to 59 (39) percent in 1985.
While not fully comparable, estimates of the equilibrium real exchange rate at the time of the Plaza Accord (Frankel, 1985) indicated that the extent of USD overvaluation at the time (30 percent) was much larger than that currently assessed by staff (mid-point of 15 percent).
Assessment: Today’s smaller and less concentrated external imbalances, and moderate misalignment among systemic currencies, point to a very different landscape from the one prevailing in 1985 and a less compelling case for proactive and coordinated actions on currencies. With output below potential in most systemic economies, multilateral initiatives have mainly focused on the need for policies and reforms with positive international spillovers to stimulate investment and consumption in surplus countries, and improve productivity and competitiveness in deficit countries.
______________________
1/ Prepared by Ruy Lama.
2/ Cooper (1985) argued that while part of the widening of the U.S. CA deficit was attributed to stronger U.S. growth relative to its main trading partners, the USD appreciation affected competitiveness in the manufacturing sector. By 1984 annual manufacturing output growth fell to under 2 percent, while manufactured imports rose to 10-15 percent.
Figure. External Position of Systemic Economies: 1985 and 2015 1/(t=0 in 1985 & 2015)
Sources: WEO and IMF staff calculations. 1/ For the period 1980-90, CA calculations correspond to the aggregate of current euro area members. China is excluded, given its relatively small trade and financial links with other systemic economies during the 1980s.
-4
-2
0
2
-5 -4 -3 -2 -1 0 1 2 3 4 5
1980-1990
2010-2015
US : Current Account(Percent of GDP)
Plaza Accord Agreement
-2
0
2
4
6
-5 -4 -3 -2 -1 0 1 2 3 4 5
Japan: Current Account(Percent of GDP)
-4
-2
0
2
4
-5 -4 -3 -2 -1 0 1 2 3 4 5
Euro Area: Current Account(Percent of GDP)
-6
-4
-2
0
2
4
-5 -4 -3 -2 -1 0 1 2 3 4 5
UK: Current Account(Percent of GDP)
60
80
100
120
140
160
-5 -4 -3 -2 -1 0 1 2 3 4 5
US: Real Effective Exchange Rate(Index, 100=1980,2010)
60
80
100
120
140
160
-5 -4 -3 -2 -1 0 1 2 3 4 5
Japan: Real Effective Exchange Rate(Index, 100=1980,2010)
60
80
100
120
140
160
-5 -4 -3 -2 -1 0 1 2 3 4 5
Euro Area: Real Effective Exchange Rate(Index, 100=1980,2010)
60
80
100
120
140
160
-5 -4 -3 -2 -1 0 1 2 3 4 5
UK: Real Effective Exchange Rate(Index, 100=1980,2010)

2016 EXTERNAL SECTOR REPORT
28 INTERNATIONAL MONETARY FUND
27. Tackling persistent excess imbalances will require addressing structural impediments to external adjustment, especially where currency arrangements impose limits on external rebalancing. While reforms need to be tailored to country circumstances (see country pages), they should be carefully designed and sequenced to avoid undermining near-term demand (see April 2016 WEO).
Excess surplus countries should adopt reforms to encourage domestic demand (lower saving and higher investment) and relative price adjustments. These include reforms aimed at: (i) streamlining of service and product sector regulations (China, Japan, Germany); (ii) strengthening social safety nets (China, Korea, Singapore, Thailand) and reforming pensions to raise the retirement age (Germany); (iii) facilitating balance sheet repair (China, euro area, Korea) and enterprise reform (China); and (iv) mobilizing corporate investment (Japan, Korea).
Excess deficit countries should adopt policies that boost saving, productivity and competitiveness, including by: (i) increasing labor market flexibility (France, Spain, South Africa); (ii) addressing infrastructure bottlenecks; (iii) strengthening financial and pension systems (Brazil, Indonesia, Turkey); (iv) eliminating export barriers; and (v) facilitating diversification and growth by the non-commodity sector (Brazil, Canada, Saudi Arabia, South Africa).
28. Near term policies will require careful calibration to balance external and domestic objectives. The current configuration of output gaps (output below potential in most large economies) and external gaps pose near-term tradeoffs between domestic and external objectives (Figure 21). These challenges are compounded by the lack of fiscal and monetary policy space in many countries (Figure 22 illustrates in a simple manner these two dimensions of policy space).9 Against this backdrop, in some cases external rebalancing objectives may temporarily take a back seat to internal rebalancing goals, provided policy spillovers are positive and there is a credible plan to address external gaps.
Countries facing stronger-than-warranted external positions and negative output gaps (Figure 20, lower right quadrant) should primarily rely on fiscal policy to help close both domestic and external gaps, although the stimulus should be geared to support structural reform objectives. However, reliance on fiscal support depends very much on the availability of buffers. Korea, Sweden, Thailand, and the Netherlands appear to have room to ease in relative terms.10 Other countries, like Japan, where current fiscal space is more limited, will need to coordinate carefully the use of monetary and fiscal space with structural and income policies (¶26). Meanwhile, in the few cases where positive external gaps are paired with near zero or positive output gaps (Malaysia, Germany), monetary policy, if available as an independent instrument, should play a larger role (Malaysia). Those economies without independent monetary policy but with fiscal policy space (Germany), should use that space to finance growth-friendly policies that would support external rebalancing (including through an internal appreciation) with only a temporary and limited effect on the output gap. Plans for 2016 suggest that after consolidating in previous years, many of these excess surplus economies are either
9 Ongoing Fund work on fiscal space focuses on a richer set of indicators, including dynamic and forward-looking considerations. 10 According to the European Commission, the Netherlands has limited fiscal space under the Stability and Growth Pact.

2016 EXTERNAL SECTOR REPORT
INTERNATIONAL MONETARY FUND 29
easing fiscal policy (Germany, Korea, Sweden, Thailand, the Netherlands) or moving towards a more neutral position (Japan) in 2016. This should help to address both external and domestic gaps. 11
In contrast, countries with weak external positions and domestic slack (Figure 21, lower left quadrant), should maintain an accommodative monetary stance to address both objectives. Since in most countries inflation expectations are well below target, there is the space to further ease monetary policy stance. For the U.S., this means that monetary policy normalization should proceed only gradually, and in line with the pace of the recovery. In some countries (Brazil, Russia, and Turkey), however, monetary policy space is more limited as inflation expectations are less well anchored. While monetary policy would be desirable for achieving domestic and external objectives in the economies of this quadrant, countries with fiscal buffers could support demand in the near term through fiscal policy if accompanied by structural reforms that boost competitiveness.12 For euro area countries with excess external deficits and limited fiscal space, structural reforms to boost competitiveness could be complemented by centrally-financed investment schemes at the regional level could provide demand support in the near term.
Figure 21. ESR Economies: External and Internal Imbalances, 2015-16
11 The German authorities are planning a discretionary fiscal expansion in 2016, to be partially unwound in the medium term.
12 A temporary and small fiscal stimulus is projected for the U.S., after years of fiscal consolidation. Canada is projected to further ease fiscal policy in 2016 to support demand in the context of the oil price shock.
BEL
ITA
JPN
USAAUS
CHN
IDN
KOR
MYS
MEX
POL
RUS
ZAF
SWECHE
THA
TUR
BRA
CAN
FRA
DEUIND
NLD
ESP
GBR
-4%
-3%
-2%
-1%
0%
1%
-4% -3% -2% -1% 0% 1% 2% 3% 4% 5%
Out
put G
ap, 2
015
(% o
f pot
enti
al G
DP)
CA Gap, 2015 (% of GDP)Source: World Economic Outlook and Fund Staff Estimations.1/ Area of bubble is proportional to the country's NFA level in percent of GDP. Blue (white) bubbles denote creditor (debtor) position.

2016 EXTERNAL SECTOR REPORT
30 INTERNATIONAL MONETARY FUND
Figure 22. ESR Economies: Policy Space, 2015-16
29. Large and growing disparities stock imbalances will require increased vigilance. Countries with large negative NIIP positions (e.g., Spain, Turkey) should continue strengthening their current account balances to guard against financing risks. In many EMs, further efforts are necessary to improve the composition of gross liabilities to limit maturity and currency mismatches, and reduce reliance on debt financing, especially among corporates. This would allow these countries to better deal with the risks of financial and commodity price volatility, as well as the possibility of a further and prolonged strengthening of the USD. Meanwhile, creditor countries need to be mindful of the tradeoffs of ever-increasing creditor positions, given valuation and default risks of holding assets from increasingly indebted countries and the likely fall in rates of return on large asset positions. Large gross (asset and liability) positions also entail risks, as sizable exchange rate and asset price fluctuations can lead to steep valuation effects.
30. Global collective policy action remains desirable, especially if global demand slows further. With most countries operating below potential and a configuration of external gaps that constrains the set of desirable policy actions, a collective effort among systemic economies to deploy fiscal stimulus would help address demand weakness while mitigating the effects on external imbalances, (and concerns about debt sustainability). Collective fiscal measures would be most effective if accompanied by synchronized structural reform (for example, implementation of the remaining Brisbane commitments).
AUS
BRA
CAN
CHN
EA
IND
IDN
JAP
KOR MYSMEX
POL
RUS
ZAF
SWECHE
THA
TUR
GBR
USA
-3
-1
1
3
5
7
9
11
13
15
-2 -1 0 1 2Inflation expectations minus target 1/ (%)
Dis
tanc
eto
ZLB
1/
(%)
More space
BEL
FRA
DEU
ITLNDL
ESP
AUS
BRA
CAN
CHN
IND
IDN
JAP
KOR
MYS
MEX
POLRUS
ZAF
SWECHE
THA
TUR
GBR
USA
-12
-10
-8
-6
-4
-2
0
2
0 50 100 1502015 Public Debt (% GDP)
2015
Ove
rall
Bal
ance
(%
GD
P)
More space (248, -5)
Fiscal Policy Space Monetary Policy Space
Sources: World Economic Outlook, Haver, Consensus Forecast and IMF staff calculations. 1/ As of March 2016. For comparability, target is defined as the mid-point of the inflation target band. For Switzerland a 2 percent target is assumed (although the SNB aims at inflation 'below 2 percent'. Bubbles are proportional to the size of the economy (US$ GDP).
2016 EXTERNAL SECTOR REPORT
INTERNATIONAL MONETARY FUND 31
References
Ahmed, Swarnali, Maximiliano Appendino, and Michele Ruta, 2015, “Depreciations without Exports? Global Value Chains and the Exchange Rate Elasticity of Exports,” World Bank Policy Research Working Paper 7390 (Washington: World Bank).
Bénétrix, Agustin S., Jay C. Shambaugh, and Philip R. Lane, 2015, “International Currency Exposures, Valuation Effects and the Global Financial Crisis,” Journal of International Economics, Vol. 96, No. 1: pp. 98–109.
Calvo, Guillermo, and Carmen Reinhart, 2002, “Fear of Floating,” The Quarterly Journal of Economics, Vol. CXVII, Issue 2.
Cooper, Richard, 1985, "The U.S. payments deficit and the strong dollar: Policy options." The U.S. Dollar-Recent Developments, Outlook, and Policy Options,” Federal Bank of Kansas City.
Frankel, Jeffrey, 1985, "The Dazzling Dollar," Brookings Papers on Economic Activity: 1, pp. 199–217 (Washington: Brookings Institution).
IMF, 2009, “From Deficit to Surplus: Recent Shifts in Global Current Accounts,” in World Economic Outlook: Sustaining the Recovery, October, pp. 35–9.
IMF, 2013, “The External Balance Assessment (EBA) Methodology,” IMF Working Paper 13/272 (Washington: International Monetary Fund).
IMF, 2013, “Staff Guidance Note for Public Debt Sustainability Analysis in Market-Access Countries,” (Washington: International Monetary Fund).
IMF, 2015(a), “Exchange Rates and Trade Flows: Disconnected?“ in World Economic Outlook: Adjusting to Lower Commodity Prices, October, pp. 105–42.
IMF, 2015(b), “Corporate Leverage in Emerging Markets—A Concern?” in Global Financial Stability Report, October 2015, pp. 83–114.
IMF, 2016(a), “Recent Developments and Prospects,“ in World Economic Outlook: Too Slow for Too Long, April, pp 1–41.
IMF, 2016(b), “Learning to Live with Cheaper Oil: Policy Adjustment in MENA and CCA Oil Exporting Countries,” (Washington: International Monetary Fund).
Krugman, Paul, 1991, “Has the Adjustment Process Worked? Policy Analyses in International Economics,” (Washington: Institute for International Economics).
Leigh, D., Weicheng Lian, Marcos Poplawski-Ribeiro and Viktor Tsyrennikov, (forthcoming), “Exchange Rates and Trade: Disconnected?”

2016 EXTERNAL SECTOR REPORT
32 INTERNATIONAL MONETARY FUND
Lane, Philip R., and Gian Maria Milesi-Ferretti, 2007, “The External Wealth of Nations Mark II: Revised and Extended Estimates of Foreign Assets and Liabilities, 1970–2004,” Journal of International Economics, Vol. 73, No. 2, pp. 223–50.
———, 2012, “External Adjustment and the Global Crisis,” Journal of International Economics, Vol. 88, No. 2, pp. 252–65.
Marquez, J. and Workman, L., 2001, “Modeling the IMF’s Statistical Discrepancy in the Global Current Account, IMF Staff Papers, Vol. 48, No. 3.
Ollivaud, Patrice, Elena Rusticelli, and Cyrille Schwellnus, 2015, “The Changing Role of the Exchange Rate for Macroeconomic Adjustment,” OECD Working Paper No. 1190 (Paris: Organization for Economic Cooperation and Development).
Ostry, Jonathan D., 1988, “The Balance of Trade, the Terms of Trade, and the Real Exchange Rate: An Intertemporal Optimizing Framework,” IMF Staff Papers, Vol. 35, No. 4.

2012 2013 2014 2015 2012 2013 2014 2015 2012 2013 2014 2015
Top 15 Surplus Economies in 2015China 215.4 148.2 277.4 330.6 0.3 0.2 0.4 0.5 2.5 1.6 2.7 3.0Germany 248.9 252.9 282.9 285.4 0.3 0.3 0.4 0.4 7.0 6.8 7.3 8.5Japan 59.7 45.9 36.4 135.6 0.1 0.1 0.0 0.2 1.0 0.9 0.8 3.3Korea 50.8 81.1 84.4 105.9 0.1 0.1 0.1 0.1 4.2 6.2 6.0 7.7Netherlands 89.5 87.3 83.5 68.8 0.1 0.1 0.1 0.1 10.8 10.1 9.5 9.1Taiwan Province of China 49.0 55.3 65.4 76.2 0.1 0.1 0.1 0.1 9.9 10.8 12.3 14.5Switzerland 68.6 76.4 61.9 75.8 0.1 0.1 0.1 0.1 10.3 11.1 8.8 11.4Russia 71.3 34.1 59.5 65.8 0.1 0.0 0.1 0.1 3.3 1.5 2.9 5.0Singapore 49.8 54.1 53.2 57.6 0.1 0.1 0.1 0.1 17.2 17.9 17.4 19.7Italy -7.5 20.2 41.1 39.9 0.0 0.0 0.1 0.1 -0.4 0.9 1.9 2.2Norway 63.4 53.5 59.8 35.0 0.1 0.1 0.1 0.0 12.4 10.2 11.9 9.0Thailand -1.5 -5.2 15.4 31.8 0.0 0.0 0.0 0.0 -0.4 -1.2 3.8 8.0Sweden 32.0 34.9 30.6 28.5 0.0 0.0 0.0 0.0 5.9 6.0 5.4 5.8Denmark 18.5 24.2 26.7 20.3 0.0 0.0 0.0 0.0 5.7 7.1 7.7 6.9Spain -3.1 20.7 13.6 16.8 0.0 0.0 0.0 0.0 -0.2 1.5 1.0 1.4
Top 15 Deficit Economies in 2015United States -446.5 -366.4 -392.1 -463.0 -0.6 -0.5 -0.5 -0.6 -2.8 -2.2 -2.3 -2.6United Kingdom -86.7 -121.8 -152.2 -147.1 -0.1 -0.2 -0.2 -0.2 -3.3 -4.5 -5.1 -5.2Brazil -74.2 -74.8 -104.2 -58.9 -0.1 -0.1 -0.1 -0.1 -3.0 -3.0 -4.3 -3.3Australia -66.3 -51.5 -43.5 -58.6 -0.1 -0.1 -0.1 -0.1 -4.3 -3.4 -3.0 -4.8Canada -65.7 -57.9 -40.6 -49.0 -0.1 -0.1 -0.1 -0.1 -3.6 -3.2 -2.3 -3.2Saudi Arabia 164.8 135.4 73.8 -53.5 0.2 0.2 0.1 -0.1 22.4 18.2 9.8 -8.3Mexico -16.6 -30.3 -24.8 -32.4 0.0 0.0 0.0 0.0 -1.4 -2.4 -1.9 -2.8Turkey -48.0 -63.6 -43.6 -32.1 -0.1 -0.1 -0.1 0.0 -6.1 -7.7 -5.5 -4.5Algeria 12.3 0.8 -9.4 -27.0 0.0 0.0 0.0 0.0 5.9 0.4 -4.4 -15.7India2 -88.2 -32.4 -26.7 -22.1 -0.1 0.0 0.0 0.0 -4.8 -1.7 -1.3 -1.1Colombia -11.1 -12.3 -19.6 -18.9 0.0 0.0 0.0 0.0 -3.0 -3.2 -5.2 -6.5Venezuela 2.6 4.6 3.6 -18.2 0.0 0.0 0.0 0.0 0.8 2.0 1.4 -7.6Indonesia -24.4 -29.1 -27.5 -17.7 0.0 0.0 0.0 0.0 -2.7 -3.2 -3.1 -2.1Libya 23.8 8.9 -12.4 -16.7 0.0 0.0 0.0 0.0 29.1 13.5 -27.8 -43.6Argentina -1.3 -4.6 -7.4 -16.1 0.0 0.0 0.0 0.0 -0.2 -0.7 -1.4 -2.8
Memorandum item:Euro Area 165.2 285.8 334.0 365.7 0.2 0.4 0.4 0.5 1.3 2.2 2.5 3.2Statistical discrepancy 365.7 399.1 413.5 224.8 0.5 0.5 0.5 0.3 … … … …
Surpluses (world) 1,612.8 1,517.4 1,563.4 1,506.4 2.2 2.0 2.0 2.1 … … … …Deficits (world) -1,247.2 -1,118.3 -1,149.9 -1,281.6 -1.7 -1.5 -1.5 -1.8 … … … …
Source: World Economic Outlook and Fund Staff calculations.1/ Sorted by size (in USD) of surplus and deficit in 2015.2/ For India, data are presented on a fiscal year basis.
In percent of GDP
Table 1. Selected Economies: Current Account Balance, 2012-15 1/
In billions of USD In percent of World GDP
INTERN
ATION
AL MO
NETARY FU
ND
33
2016 EXTERNAL SECTO
R REPORT

Country Overall Assessment Actual Cycl Adj. Midpoint Low High Midpoint Low High Net Liabilities Assets
Australia Moderately Weaker -4.8 -4.2 -1.0 -2.0 0.0 7.5 0.0 15.0 -56 184 128Belgium Moderately Weaker 0.0 -0.1 -1.5 -2.5 -0.5 6.0 2.0 10.0 61 412 472Brazil Moderately Weaker -3.3 -2.8 -2.0 -2.9 -1.1 10.0 5.0 15.0 -27 70 44Canada Moderately Weaker -3.2 -2.6 -1.5 -2.0 -1.0 2.5 0.0 5.0 22 167 189China Moderately Stronger 3.0 3.0 2.0 1.0 3.0 0.0 -10.0 10.0 15 42 57Euro Area Broadly Consistent 3.2 2.7 0.5 -0.5 1.5 -5.0 -10.0 0.0 -4 229 225France Moderately Weaker -0.2 -0.8 -1.5 -2.5 -0.5 6.0 3.0 9.0 -17 306 289Germany Substantially Stronger 8.5 8.7 4.8 3.3 6.3 -15.0 -20.0 -10.0 48 208 256Hong Kong SAR Broadly Consistent 3.0 … 0.0 -2.0 2.0 0.0 -7.0 7.0 316 1076 1392India Broadly Consistent -1.1 -1.2 0.5 -0.5 1.5 2.5 -5.0 10.0 -17 43 25Indonesia Broadly Consistent -2.1 -1.4 0.5 -0.5 1.5 -2.5 -7.5 2.5 -44 69 25Italy Broadly Consistent 2.2 1.1 -1.0 -2.0 0.0 5.0 0.0 10.0 -24 169 144Japan Moderately Stronger 3.3 2.8 1.1 0.4 1.7 -11.0 -18.0 -4.0 70 122 192Korea Substantially Stronger 7.7 7.0 3.0 1.8 4.3 -8.0 -12.0 -4.0 14 68 83Malaysia Stronger 3.0 4.2 2.3 1.3 3.3 -8.0 -13.0 -3.0 8 123 131Mexico Broadly Consistent -2.8 -2.2 0.5 0.0 1.0 -5.0 -10.0 0.0 -36 84 48Netherlands Stronger 9.1 8.3 2.0 1.0 3.0 -6.0 -10.0 -2.0 67 1032 1099Poland Broadly Consistent -0.2 0.0 1.0 0.0 2.0 -5.0 -10.0 0.0 -60 108 49Russia Broadly Consistent 5.0 6.4 0.0 -2.0 2.0 0.0 -7.0 7.0 24 63 86Saudi Arabia Substantially Weaker -6.3 … -9.4 -12.3 -6.5 … … … 108 44 152Singapore Substantially Stronger 19.7 … 6.0 3.0 9.0 -12.0 -18.0 -6.0 204 799 1003South Africa Moderately Weaker -4.3 -3.9 -2.0 -2.5 -1.5 5.0 0.0 10.0 15 114 129Spain Substantially Weaker 1.4 0.3 -0.8 -1.5 0.0 7.5 5.0 10.0 -89 238 149Sweden Moderately Stronger 5.8 5.9 1.5 0.0 3.0 -6.0 -12.0 0.0 -2 288 287Switzerland Moderately Weaker 11.4 11.4 -1.0 -4.0 2.0 10.0 -5.0 25.0 92 554 646Thailand Stronger 8.0 7.6 2.5 1.5 3.5 -4.3 -6.0 -2.5 -11 96 85Turkey Weaker -4.5 -4.4 -2.5 -4.0 -1.0 10.0 5.0 15.0 -50 80 30United Kingdom Weaker -5.2 -4.8 -3.0 -4.5 -1.5 12.5 5.0 20.0 -3 519 515United States Moderately Weaker -2.6 -2.6 -1.8 -2.0 -1.5 15.0 10.0 20.0 -41 170 129
Sources: IMF Staff Assessments and IMF International Financial Statistics (IFS).
CA Gap (% GDP) REER Gap (Percent) Int'l Investment Position (% GDP)Current Account (% GDP)
Table 2. Summary of Staff-Assessed Current Account and REER Gaps, 2015
INTERN
ATION
AL MO
NETARY FU
ND
33
2016 EXTERNAL SECTO
R REPORT
34 IN
TERNATIO
NAL M
ON
ETARY FUN
D
2016 EXTERNAL SECTO
R REPORT

EBACA Gap Total 1/ Dom. Total 1/ Dom2/ Coeff P P* Total 1/ Dom2/ Coeff P P* Total 1/ Dom2/ Coeff P P* Total 1/ Dom2/ Coeff P P*
Australia -3.4% 0.0% -0.7% -0.3% -1.1% 0.47 -2.3% 0.1% 0.2% 0.4% -0.50 6.0% 6.8% 0.1% 0.0% 0.45 -0.3% -0.1% 0.1% 0.0% -0.021 51.2% 51.2%Belgium -3.1% -0.6% -1.4% -0.5% -1.4% 0.47 -2.2% 0.8% -0.2% 0.0% -0.50 8.2% 8.2% 0.1% 0.0% 0.45 -0.1% -0.3% 0.1% 0.0% -0.021 25.6% 25.6%Brazil -0.1% -2.4% -3.2% -2.5% -3.3% 0.47 -10.1% -3.0% -0.2% 0.0% -0.50 4.7% 4.7% 0.1% 0.0% 0.45 -0.4% 0.0% 0.1% 0.0% -0.021 26.7% 26.7%Canada -3.3% 0.4% -0.4% 0.4% -0.4% 0.47 -0.9% 0.0% -0.2% 0.0% -0.50 7.6% 7.6% 0.1% 0.0% 0.45 0.3% 0.0% 0.1% 0.0% -0.021 47.3% 47.3%China 2.3% -0.3% -1.1% -0.2% -1.1% 0.47 -2.4% -0.2% 0.7% 0.9% -0.50 1.6% 3.3% -0.6% -0.8% 0.45 -4.7% 0.0% -0.5% -0.6% -0.021 48.8% 22.7%Euro Area -0.3% 0.2% -0.6% 0.5% -0.4% 0.47 -1.0% -0.2% -0.3% -0.1% -0.50 8.2% 7.9% 0.1% 0.0% 0.45 0.0% 0.0% 0.1% 0.0% -0.021 26.4% 24.2%France -1.9% -0.4% -1.2% -0.3% -1.2% 0.47 -2.5% 0.0% -0.2% 0.0% -0.50 8.9% 8.9% 0.1% 0.0% 0.45 0.2% 0.0% 0.1% 0.0% -0.021 24.1% 24.4%Germany 3.7% 1.4% 0.6% 1.4% 0.6% 0.47 0.7% -0.5% -0.2% 0.0% -0.50 8.7% 8.7% 0.1% 0.0% 0.45 -0.1% 0.0% 0.1% 0.0% -0.021 -9.5% -9.5%India 3.1% 1.1% 0.3% 0.0% -0.9% 0.47 -6.9% -5.0% -0.2% 0.0% -0.50 1.5% 1.5% 0.5% 0.3% 0.45 1.5% 0.0% 0.0% -0.1% -0.021 17.6% 15.0%Indonesia 0.2% 1.7% 0.9% 0.9% 0.0% 0.47 -2.5% -2.5% 0.3% 0.5% -0.50 1.4% 2.4% 0.0% -0.1% 0.45 -0.6% 0.0% 0.1% 0.0% -0.021 1.6% 2.9%Italy -1.8% 0.4% -0.4% 0.5% -0.4% 0.47 -0.9% 0.0% -0.2% 0.0% -0.50 7.1% 7.1% 0.1% 0.0% 0.45 0.0% 0.0% 0.1% 0.0% -0.021 45.0% 45.0%Japan -0.6% -1.6% -2.3% -1.5% -2.3% 0.47 -4.9% 0.1% -0.2% 0.0% -0.50 8.4% 8.4% 0.1% 0.0% 0.45 -0.6% 0.3% 0.1% 0.0% -0.021 -0.1% -0.1%Korea 5.6% 1.7% 0.9% 1.2% 0.3% 0.47 0.6% -0.1% 0.4% 0.6% -0.50 4.1% 5.2% 0.1% 0.0% 0.45 0.3% 0.2% 0.1% 0.0% -0.021 25.9% 25.9%Malaysia 3.6% 0.1% -0.7% 0.2% -0.7% 0.47 -3.4% -2.0% 1.1% 1.3% -0.50 1.7% 4.3% -1.4% -1.5% 0.45 -7.0% 5.0% 0.1% 0.0% -0.021 9.0% 8.0%Mexico 0.0% 0.6% -0.2% 0.2% -0.7% 0.47 -3.9% -2.5% 0.3% 0.5% -0.50 3.1% 4.1% -0.1% -0.3% 0.45 -1.5% 0.0% 0.1% 0.0% -0.021 12.1% 12.1%Netherlands 2.4% 0.0% -0.8% 0.7% -0.2% 0.47 -0.4% 0.0% -1.2% -1.0% -0.50 9.4% 7.5% 0.1% 0.0% 0.45 -0.3% 0.1% 0.4% 0.3% -0.021 88.1% 102.8%Poland 0.8% -0.1% -0.9% 0.1% -0.7% 0.47 -2.6% -1.0% 0.1% 0.3% -0.50 4.7% 5.2% 0.0% -0.1% 0.45 -1.1% 0.1% -0.2% -0.3% -0.021 28.7% 13.1%Russia 0.1% -1.2% -2.0% -1.7% -2.6% 0.47 -3.0% 2.5% 0.4% 0.6% -0.50 4.1% 5.3% 0.1% 0.0% 0.45 -1.5% -0.7% 0.1% 0.0% -0.021 10.1% 10.1%South Africa -2.6% 0.5% -0.3% 0.6% -0.3% 0.47 -3.2% -2.5% -0.2% 0.0% -0.50 4.0% 4.0% 0.0% -0.2% 0.45 -0.8% 1.5% 0.1% 0.0% -0.021 33.2% 33.2%Spain -0.4% -1.3% -2.1% -0.6% -1.5% 0.47 -3.2% 0.0% -0.2% 0.0% -0.50 7.2% 7.1% 0.1% 0.0% 0.45 0.4% 0.0% -0.5% -0.6% -0.021 60.1% 32.0%Sweden 7.8% 0.9% 0.1% 1.0% 0.1% 0.47 0.3% 0.0% -0.1% 0.1% -0.50 7.9% 8.0% 0.1% 0.0% 0.45 -0.8% 0.0% 0.0% -0.1% -0.021 72.7% 67.7%Switzerland 5.0% 0.6% -0.2% 0.9% 0.0% 0.47 0.0% 0.0% -0.2% 0.0% -0.50 7.5% 7.5% 0.1% 0.0% 0.45 9.3% 3.5% -0.1% -0.2% -0.021 31.9% 24.0%Thailand 6.3% 1.5% 0.7% 1.3% 0.4% 0.47 0.7% -0.2% -0.1% 0.1% -0.50 3.0% 3.3% 0.1% 0.0% 0.45 0.0% 0.0% 0.1% 0.0% -0.021 36.5% 36.5%Turkey -3.9% 0.5% -0.3% 0.8% -0.1% 0.47 -1.0% -0.8% -0.2% 0.0% -0.50 4.1% 4.1% -0.1% -0.3% 0.45 -1.9% 0.6% 0.0% -0.1% -0.021 45.1% 41.9%United Kingdom -4.3% -1.1% -1.9% -1.0% -1.9% 0.47 -4.0% 0.0% -0.2% 0.0% -0.50 7.8% 7.8% 0.1% 0.0% 0.45 0.8% 1.2% 0.1% 0.0% -0.021 22.2% 22.2%United States -1.7% 0.3% -0.5% 0.4% -0.5% 0.47 -3.0% -2.0% -0.2% 0.0% -0.50 7.3% 7.3% 0.1% 0.0% 0.45 -0.1% 0.0% 0.1% 0.0% -0.021 29.2% 29.2%
Source: IMF staff estimates.
1/ Total contribution after adjusting for multilateral consistency.2/ Total domestic contribution is equivalent to coefficient*(P-P*)
Change in FX Reserves+Cap ControlsDomestic
Other/Private Credit GapDomestic
Table 3. Selected ESR Countries: Current Account Regression Policy Gap Contributions, 2015
Fiscal GapDomestic
Public Healh Exp GapDomesticTotal Policy Gap
(in percent of GDP)
INTERN
ATION
AL MO
NETARY FU
ND
35
2016 EXTERNAL SECTO
R REPORT
INTERN
ATION
AL MO
NETARY FU
ND
35

2016 EXTERNAL SECTOR REPORT
36 INTERNATIONAL MONETARY FUND
Appendix I. Decomposing Current Account Variations
The current account balance is composed of trade balance and income account balance:
,
(1)
where nominal exports and nominal imports in trade balance can be expressed as price and volume separately:
(2)
Accordingly, the change in CA/GDP can be broken down into the change in the trade balance and the income balance as:
∆ ∆ , (3)
and subsequently into three parts—volume effect, price effect (also called ‘terms-of-trade income windfall’), income account and a reconciliation term13:
∆
∆ .
(4)
Similarly, from the national accounting identity in real terms, the contributions to the change of the (real) trade balance can be expressed as:
∆ ∆ ∆ ∆ ∆, (5)
where every component is measured in real terms.14
13 Export and import prices, and , are taken from national account and expressed in local currency. The reconciliation term is
then given by:
14 Changing the base year for real GDP to t-j, the volume effect term that can be rewritten as:
,
becomes identical to the contribution of net export to growth expression that can be in turn rewritten as:

2016 EXTERNAL SECTOR REPORT—DRAFT
INTERNATIONAL MONETARY FUND 37
Appendix II. Decomposing Changes in Net Foreign Asset Positions The change in a country’s net foreign asset (NFA) position is defined as follows:
≡ , (1)
where the current account; capital transfers; errors and omissions, and net capital gains (losses if negative) from shifts in exchange rates and asset prices.
The relationship between external flows and stocks can be rewritten as follows:
≡ , (2)
where is the financial account balance, or and is the valuation effect.
To calculate the cumulative valuation effects between t-q and t, one can use the following equation:
∑ ∑ . (3)
These variables are in levels and denominated in local currency. Recursive iteration and substitution in equation (1) above yield two of the main components of changes in the NFA position between t-q and t,—the cumulative current account and the cumulative valuation effect:
∑ ∑ ∑ (4)
An alternative decomposition of changes in the ratio of the NFA position to GDP is given by:
∑ ∑ ∑
,
,, (5)
where lowercase letters denote variables as a ratio to GDP. The final term on the right hand side captures the nominal output growth adjustment.
The cumulative valuation effects for foreign assets, A, and liabilities, L, between t-q and t are given respectively by:
∑ ∑ (6)
and
∑ ∑ (7)
where BFA is the net acquisition of assets and BFL is net incurrence of liabilities.
We further decompose valuation effects for each position into currency and price valuation effects using currency weights provided by Bénétrix, Lane and Shambaugh (2015). Currency weights—wA,i and wL,i—

2016 EXTERNAL SECTOR REPORT
38 INTERNATIONAL MONETARY FUND
refer to the currency i composition of each foreign position for each of the five major reserve currencies—the USD, the euro, the sterling pond, the yen and the swiss franc.15
For example, currency valuation effects of foreign assets, , are obtained by aggregating all currency effects, each of which is calculated by multiplying the currency weight, , , to the size of the corresponding position, Ai, and the end-of-period bilateral exchange rate change, %τ :
∑ ∑ ∑ , ⋅ ⋅ %∆ . (6)
Price valuation effects of foreign assets are then obtained by subtracting currency valuation effects from the overall valuation effects:
∑ ∑ ∑ . (7)
Similarly, we obtain the currency ( ) and price ( ) valuation effects of foreign liabilities, as:
∑ ∑ ∑ , ⋅ ⋅ %∆ , (8)
∑ ∑ ∑ . (9)
15 Given the limited data on exposures to other currencies, the weights of the five reserve currencies are re-scaled to match the total foreign currency weights of foreign assets and liabilities provided by the authors.