2016 fda food safety survey - food and drug … food safety survey 2 table of contents executive...
TRANSCRIPT
2016 FDA Food Safety Survey
Amy Lando Linda Verrill Sherry Liu Ella Smith
Consumer Studies Branch Division of Public Health Informatics & Analytics
Office of Analytics and Outreach Center for Food Safety and Applied Nutrition, FDA

2016 FOOD SAFETY SURVEY
2
TABLE OF CONTENTS
Executive Summary ....................................................................................................................................... 3
Selected Key Findings ................................................................................................................................ 3
Introduction and Screener ............................................................................................................................ 5
Risk Perception ............................................................................................................................................. 6
Food Handling Practices ................................................................................................................................ 8
Microorganisms and Personal Vulnerability ............................................................................................... 23
Thermometers ............................................................................................................................................ 26
Food Consumption Habits........................................................................................................................... 29
Food Advisories ........................................................................................................................................... 33
Mechanically Tenderized Beef .................................................................................................................... 39
Foodborne Illness Perception ..................................................................................................................... 42
Demographics ............................................................................................................................................. 43
Methodology ............................................................................................................................................... 49

2016 FOOD SAFETY SURVEY
3
Executive Summary
The Food Safety Survey is a periodic national telephone survey of adults (18 years and older) in the 50 states and the District of Columbia. The Food and Drug Administration (FDA) in collaboration with the U.S. Department of Agriculture (USDA), Food Safety and Inspection Service (FSIS) has been commissioning the survey since 1988. The survey is intended to help FDA and USDA make informed regulatory, education, and other decisions by providing a better understanding of consumer knowledge, attitudes, and practices related to food safety. The 2016 survey was the seventh iteration of the survey. It was the first time that the survey sampled cell phone users in addition to users of landline phones. This change was instituted to ensure that we could reach respondents who only have cell phones. The survey consisted of interviews with 4,169 participants between October 2015 and January 2016. An overview of the survey methodology is included at the end of the document. Below are selected key findings as well as the questions and responses from the survey. Frequencies were weighted to account for sampling design (overlapping landline and cell phone dual-frame), probability of selection in the landline sample (number of landline telephone numbers and number of adults in a household), and key demographics (age, education, gender, and race/ethnicity).
Selected Key Findings
• Consumers are somewhat concerned about getting a foodborne illnesses from how theyprepare food, but think people are more likely to get a foodborne illness from food preparedat a restaurant compared to food prepared at home -- Most respondents, 53%, thought that itwas “Not very common” to get food poisoning because of the way food is prepared at home.Slightly over half (54%) thought that it is “more common” to get food poisoning fromrestaurants compared to food prepared at home.
• Consumers are more concerned about raw chicken and raw beef being contaminated thanraw vegetables -- The percent of respondents who thought that raw chicken (66%) and raw beef(41%) were “very likely” to have germs was higher than the 6% who thought the same of rawvegetables.
• Awareness of germs -- Awareness is high for Salmonella (93%) and E. coli (89%), and is low forCampylobacter (16%).
• Hand washing -- Consumers are more likely to wash hands with soap after touching raw meat(85%) or raw fish (85%), than before preparing food (75% use soap all the time), or aftercracking raw eggs (43%).
• Food thermometer ownership and use – Sixty seven (67%) of respondents reported owning afood thermometer. Thirty-eight percent (38%) always use a food thermometer for roasts,compared to 19% for chicken parts, 6% for baked egg dishes, and 10% for hamburgers.
• Most consumers wash cutting boards after cutting raw meat -- The percent that either wash oruse different cutting boards between cutting raw meat/chicken/fish and cutting other foods isaround 90%.
2016 FOOD SAFETY SURVEY
4
• Most consumers refrigerate meat/chicken dishes within two hours of cooking -- The percent to refrigerate these within two hours is 83%.
• Most consumers wash chicken parts or whole chickens before cooking them – Sixty-seven percent (67%) said that they always washed raw chicken parts before cooking them and 68% said they always washed whole chicken or turkeys before cooking them. The most common method is by rinsing them with water (94% used this method for chicken parts and 90% for whole chickens or turkeys). (This practice is not recommended by food safety experts since washing will not destroy pathogens and may increase the risk of contaminating other foods and surfaces.)
• Forty-eight percent (48%) of consumers use devices such as smartphones or tablets while preparing food – Of those, only 35% wash their hands with soap after touching the device while preparing food.
• Sixty-five percent (65%) of respondents had not heard of mechanically tenderized beef -- Forty-four percent (44%) of respondents said they were not at all likely to buy it if they saw it in the store. Labels were required starting in May 2016.
For the survey methodology, please go to the end of the report. Throughout this report we use the following notations:
1. “n” – the number of respondents who answered a question. 2. “*” – a number that is between zero and .5 before rounding. 3. “[]” – indication of information not read out loud during the survey. This includes response
categories, such as “Don’t Know”, that were not read to respondents but were recorded if volunteered and descriptive explanations provided for the interviewers that were not read to respondents.
4. Row or column percentages may not sum to 100 due to rounding, multiple responses, or both.
2016 FOOD SAFETY SURVEY
5
Introduction and Screener Hello, my name is __________, I am calling on behalf of the U.S. Food and Drug Administration, the FDA. Your telephone number has been randomly chosen for an important study and I would like to ask some questions about food. To help me classify this interview, could you let me know whether I have reached you on a landline or a cell phone? (INTERVIEWER NOTE: If the respondent says, “yes” to “Have I reached you on a landline or cell phone?” ask the respondent which one. A landline telephone is also a “home phone” “house phone” or “regular telephone”.) [IF LANDLINE] May I speak to the member of your household who is aged 18 or over and has had the most RECENT birthday? Would that be you? [IF YES, REINTRODUCE; IF NO, ASK FOR THE FIRST NAME OF THE ELIGIBLE RESPONDENT FOR CALL-BACK PURPOSE. REINTRODUCE AS NECESSARY.] May I speak with a member of the household who is at least 18 years old and has the most recent birthday? (IF NOT AVAILABLE, ASK FOR THE FIRST NAME OF THE ELIGIBLE RESPONDENT FOR CALL-BACK PURPOSE. REINTRODUCE AS NECESSARY) [ONLY respondents reached via a cell number] Are you 18 years old or older? [IF RESPONDENT IS 18+; CONTINUE, OTHERWISE END CALL] This call may be monitored for quality control purposes. Your answers to this survey are voluntary and will be kept secure to the extent permitted by law. The survey will take about 20 minutes. You may choose not to answer any question you don’t want to or stop at any time without penalty. I’d like to continue now unless you have any questions. (INTERVIEWER NOTE: Be sure for cell phone calls that the respondent is not distracted. If they seem distracted, please call back.)
2016 FOOD SAFETY SURVEY
Throughout this report we use the following notations: 1. “n” – the number of respondents who answered a question. 2. “*” – a number that is between zero and .5 before rounding. 3. “[]” – indication of information not read out loud during the survey. This includes response
categories, such as “Don’t Know”, that were not read to respondents but were recorded if volunteered and descriptive explanations provided for the interviewers that were not read to respondents.
4. Row or column percentages may not sum to 100 due to rounding, multiple responses, or both.
6
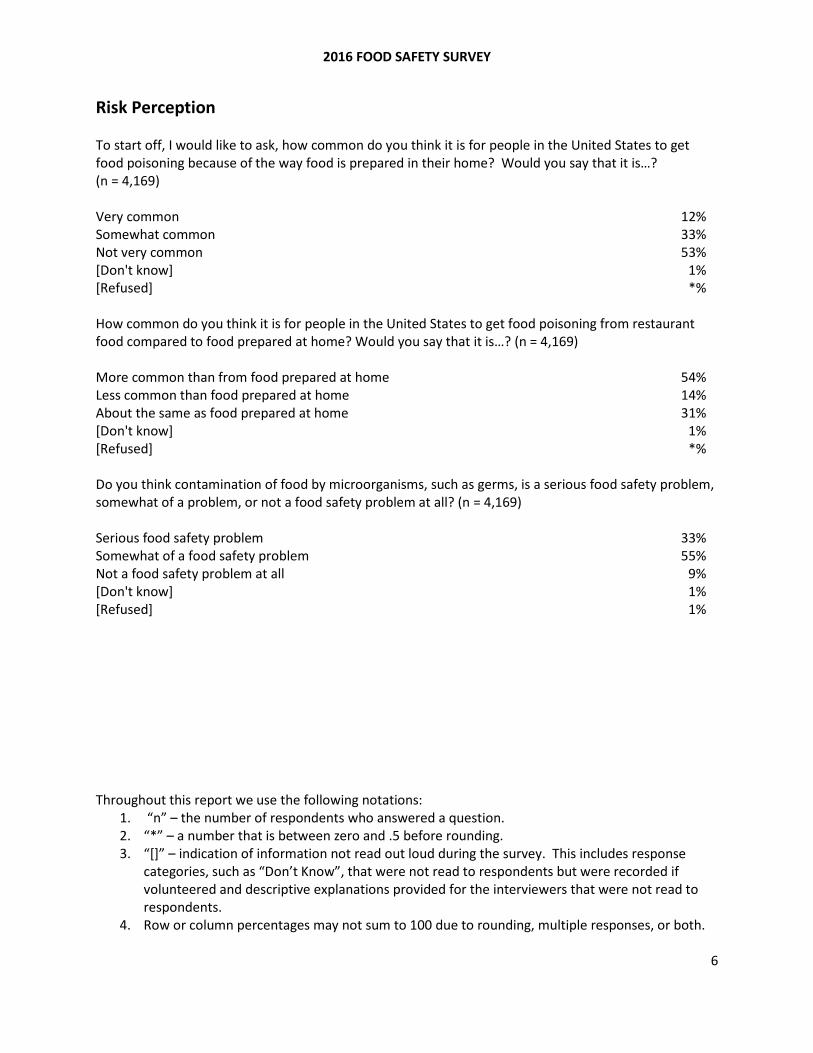
Risk Perception To start off, I would like to ask, how common do you think it is for people in the United States to get food poisoning because of the way food is prepared in their home? Would you say that it is…? (n = 4,169) Very common 12% Somewhat common 33% Not very common 53% [Don't know] 1% [Refused] *% How common do you think it is for people in the United States to get food poisoning from restaurant food compared to food prepared at home? Would you say that it is…? (n = 4,169) More common than from food prepared at home 54% Less common than food prepared at home 14% About the same as food prepared at home 31% [Don't know] 1% [Refused] *% Do you think contamination of food by microorganisms, such as germs, is a serious food safety problem, somewhat of a problem, or not a food safety problem at all? (n = 4,169) Serious food safety problem 33% Somewhat of a food safety problem 55% Not a food safety problem at all 9% [Don't know] 1% [Refused] 1%
2016 FOOD SAFETY SURVEY
Throughout this report we use the following notations: 1. “n” – the number of respondents who answered a question. 2. “*” – a number that is between zero and .5 before rounding. 3. “[]” – indication of information not read out loud during the survey. This includes response
categories, such as “Don’t Know”, that were not read to respondents but were recorded if volunteered and descriptive explanations provided for the interviewers that were not read to respondents.
4. Row or column percentages may not sum to 100 due to rounding, multiple responses, or both.
7
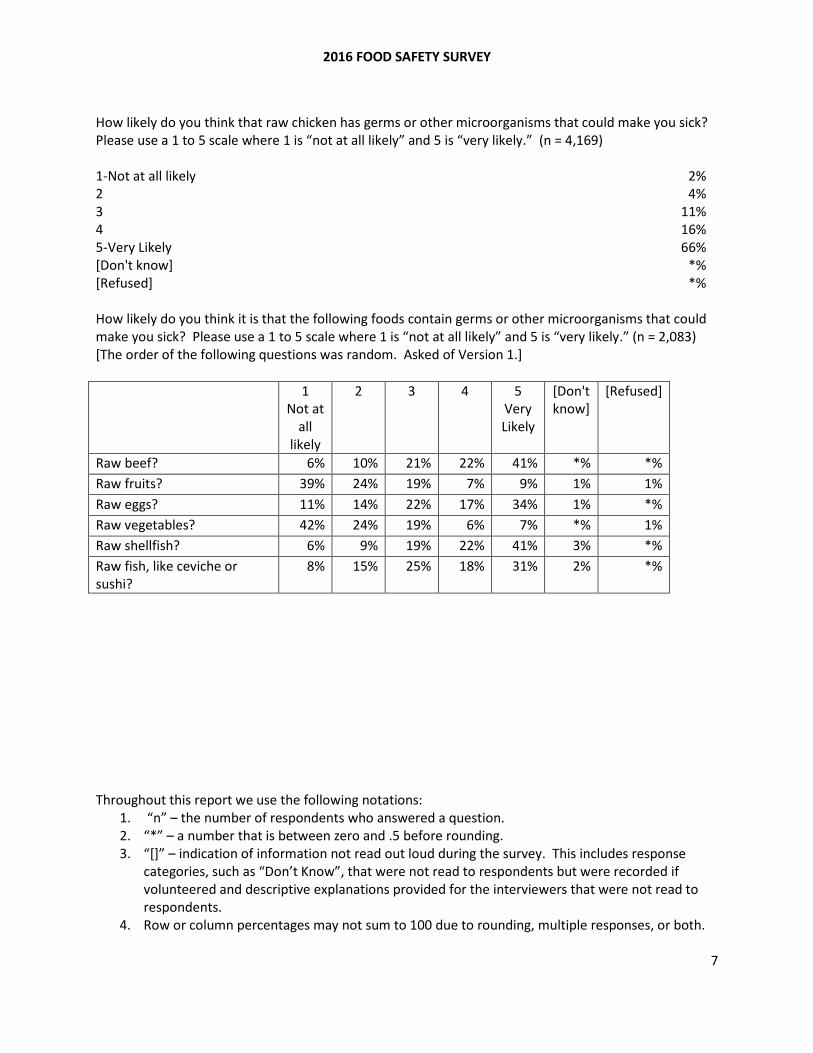
How likely do you think that raw chicken has germs or other microorganisms that could make you sick? Please use a 1 to 5 scale where 1 is “not at all likely” and 5 is “very likely.” (n = 4,169) 1-Not at all likely 2% 2 4% 3 11% 4 16% 5-Very Likely 66% [Don't know] *% [Refused] *% How likely do you think it is that the following foods contain germs or other microorganisms that could make you sick? Please use a 1 to 5 scale where 1 is “not at all likely” and 5 is “very likely.” (n = 2,083) [The order of the following questions was random. Asked of Version 1.] 1
Not at all
likely
2 3 4 5 Very Likely
[Don't know]
[Refused]
Raw beef? 6% 10% 21% 22% 41% *% *% Raw fruits? 39% 24% 19% 7% 9% 1% 1% Raw eggs? 11% 14% 22% 17% 34% 1% *% Raw vegetables? 42% 24% 19% 6% 7% *% 1% Raw shellfish? 6% 9% 19% 22% 41% 3% *% Raw fish, like ceviche or sushi?
8% 15% 25% 18% 31% 2% *%
2016 FOOD SAFETY SURVEY
Throughout this report we use the following notations: 1. “n” – the number of respondents who answered a question. 2. “*” – a number that is between zero and .5 before rounding. 3. “[]” – indication of information not read out loud during the survey. This includes response
categories, such as “Don’t Know”, that were not read to respondents but were recorded if volunteered and descriptive explanations provided for the interviewers that were not read to respondents.
4. Row or column percentages may not sum to 100 due to rounding, multiple responses, or both.
8
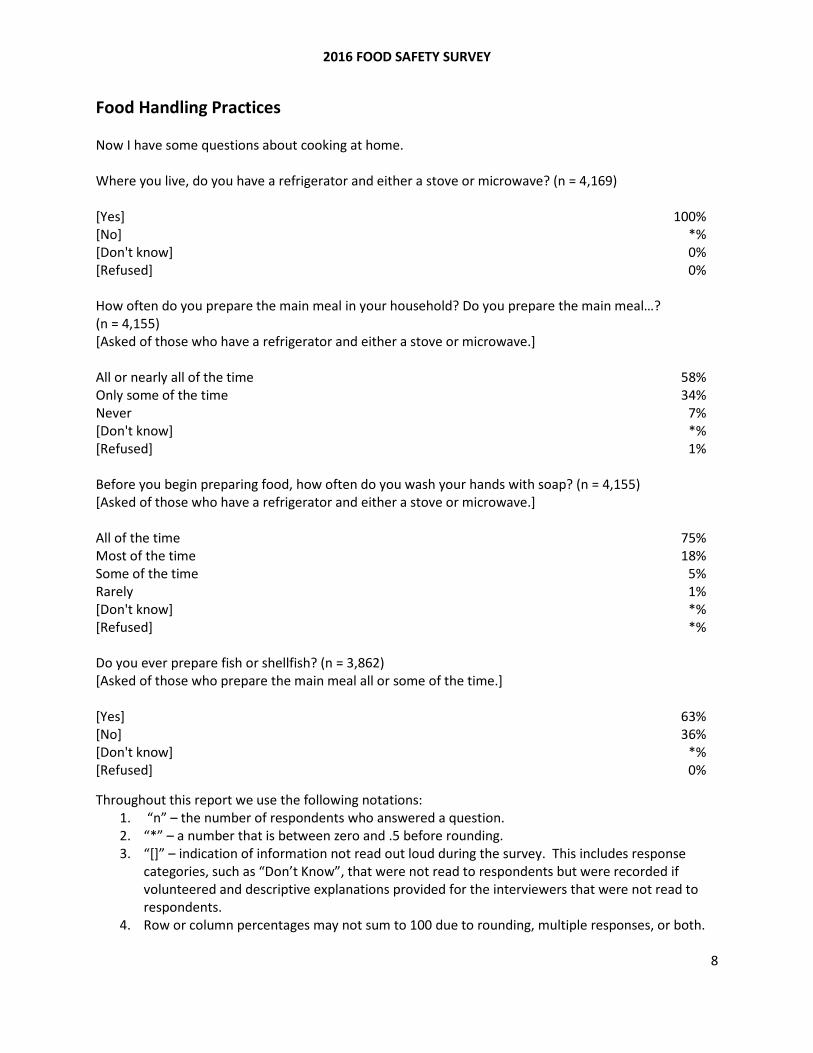
Food Handling Practices Now I have some questions about cooking at home. Where you live, do you have a refrigerator and either a stove or microwave? (n = 4,169) [Yes] 100% [No] *% [Don't know] 0% [Refused] 0% How often do you prepare the main meal in your household? Do you prepare the main meal…? (n = 4,155) [Asked of those who have a refrigerator and either a stove or microwave.] All or nearly all of the time 58% Only some of the time 34% Never 7% [Don't know] *% [Refused] 1% Before you begin preparing food, how often do you wash your hands with soap? (n = 4,155) [Asked of those who have a refrigerator and either a stove or microwave.] All of the time 75% Most of the time 18% Some of the time 5% Rarely 1% [Don't know] *% [Refused] *% Do you ever prepare fish or shellfish? (n = 3,862) [Asked of those who prepare the main meal all or some of the time.] [Yes] 63% [No] 36% [Don't know] *% [Refused] 0%

2016 FOOD SAFETY SURVEY
Throughout this report we use the following notations: 1. “n” – the number of respondents who answered a question. 2. “*” – a number that is between zero and .5 before rounding. 3. “[]” – indication of information not read out loud during the survey. This includes response
categories, such as “Don’t Know”, that were not read to respondents but were recorded if volunteered and descriptive explanations provided for the interviewers that were not read to respondents.
4. Row or column percentages may not sum to 100 due to rounding, multiple responses, or both.
9
Do you ever prepare meals where you begin with raw fish or shellfish? (n = 2,557) [Asked of those who prepare raw fish or shellfish.] [Yes] 80% [No] 19% [Don't know] *% [Refused] *% Do you ever prepare meat or chicken? (n = 3,862) [Asked of those who prepare the main meal all or some of the time.] [Yes] 96% [No] 4% [Don't know] *% [Refused] *% Do you ever prepare meals where you begin with raw meat or chicken? (n = 3,693) [Asked of those who prepare raw meat or chicken.] [Yes] 92% [No] 8% [Don't know] *% [Refused] *% In your home, are hamburgers usually served rare, medium, or well done? (n = 4,155) [Asked of those who have a refrigerator and either a stove/microwave.] Rare 2% Medium 24% Well Done 58% [Medium Rare] 4% [Medium Well] 5% [Hamburgers are never served] 7% [Don't know] *% [Refused] *%

2016 FOOD SAFETY SURVEY
Throughout this report we use the following notations: 1. “n” – the number of respondents who answered a question. 2. “*” – a number that is between zero and .5 before rounding. 3. “[]” – indication of information not read out loud during the survey. This includes response
categories, such as “Don’t Know”, that were not read to respondents but were recorded if volunteered and descriptive explanations provided for the interviewers that were not read to respondents.
4. Row or column percentages may not sum to 100 due to rounding, multiple responses, or both.
10
When you say hamburgers are usually served [INSERT medium, medium rare, or medium well DEPENDING ON PREVIOUS ANSWER] do you mean they are brown all the way through or that they still have some pink in the middle? (n = 1,395) [Asked of those who said that hamburgers are medium, medium rare, or medium well.] Brown all the way through 26% Still have some pink in the middle 73% [Don't know] *% [Refused] 1% After you have cracked open raw eggs, do you usually continue cooking, or do you first rinse your hands with water, or wipe them, or wash them with soap? (n = 3,862) [IF NECESSARY TO CLARIFY “CONTINUE COOKING”: You touch anything besides the eggs such as cookware, bottles of seasoning or other ingredients.] [Asked of those who prepare the main meal all or some of the time.] Continue cooking 25% Rinse or wipe hands 28% Wash with soap 43% [Never handle raw eggs] 2% [Don't know] *% [Refused] 1% After handling raw meat or chicken, do you usually continue cooking, or do you first rinse your hands with water, or wipe them, or wash them with soap? (n = 3,369) [IF NECESSARY TO CLARIFY “CONTINUE COOKING”: You touch anything besides the meat such as cookware, bottles of seasoning or other ingredients.] [Asked of those who prepare raw meat or chicken.] Continue cooking 3% Rinse or wipe hands 12% Wash with soap 85% [Never handle raw meat or chicken] *% [Don't know] *% [Refused] *%
2016 FOOD SAFETY SURVEY
Throughout this report we use the following notations: 1. “n” – the number of respondents who answered a question. 2. “*” – a number that is between zero and .5 before rounding. 3. “[]” – indication of information not read out loud during the survey. This includes response
categories, such as “Don’t Know”, that were not read to respondents but were recorded if volunteered and descriptive explanations provided for the interviewers that were not read to respondents.
4. Row or column percentages may not sum to 100 due to rounding, multiple responses, or both.
11
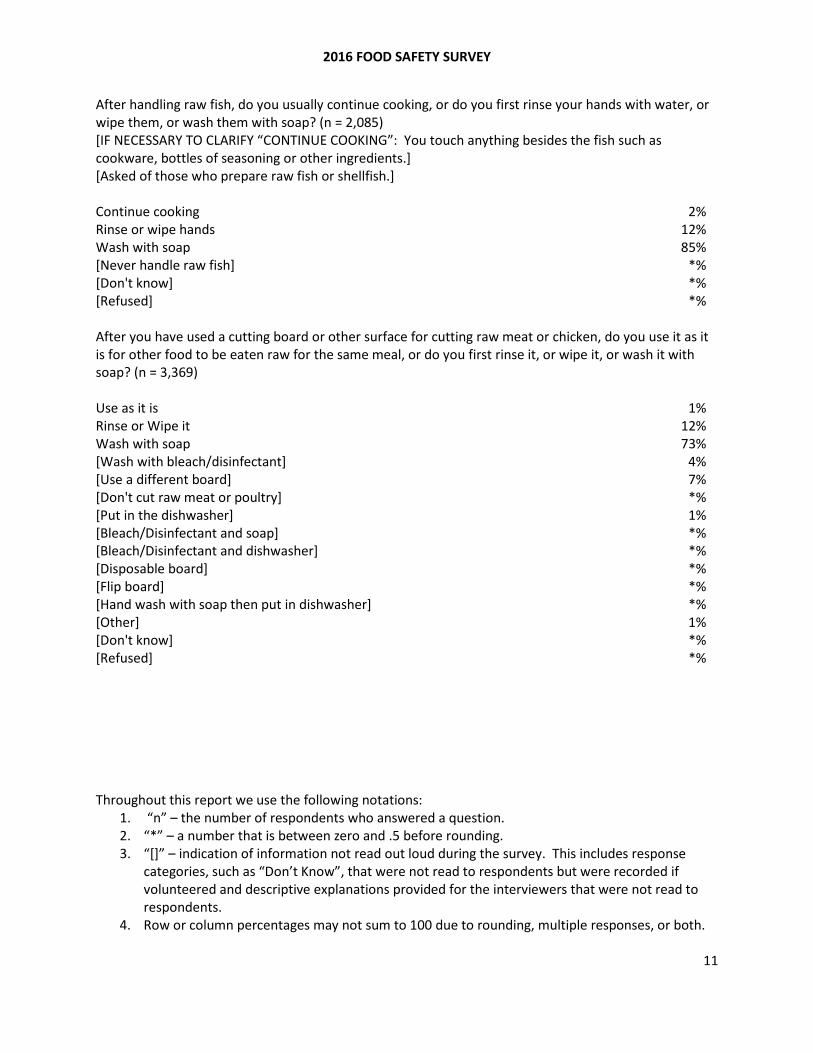
After handling raw fish, do you usually continue cooking, or do you first rinse your hands with water, or wipe them, or wash them with soap? (n = 2,085) [IF NECESSARY TO CLARIFY “CONTINUE COOKING”: You touch anything besides the fish such as cookware, bottles of seasoning or other ingredients.] [Asked of those who prepare raw fish or shellfish.] Continue cooking 2% Rinse or wipe hands 12% Wash with soap 85% [Never handle raw fish] *% [Don't know] *% [Refused] *% After you have used a cutting board or other surface for cutting raw meat or chicken, do you use it as it is for other food to be eaten raw for the same meal, or do you first rinse it, or wipe it, or wash it with soap? (n = 3,369) Use as it is 1% Rinse or Wipe it 12% Wash with soap 73% [Wash with bleach/disinfectant] 4% [Use a different board] 7% [Don't cut raw meat or poultry] *% [Put in the dishwasher] 1% [Bleach/Disinfectant and soap] *% [Bleach/Disinfectant and dishwasher] *% [Disposable board] *% [Flip board] *% [Hand wash with soap then put in dishwasher] *% [Other] 1% [Don't know] *% [Refused] *%
2016 FOOD SAFETY SURVEY
Throughout this report we use the following notations: 1. “n” – the number of respondents who answered a question. 2. “*” – a number that is between zero and .5 before rounding. 3. “[]” – indication of information not read out loud during the survey. This includes response
categories, such as “Don’t Know”, that were not read to respondents but were recorded if volunteered and descriptive explanations provided for the interviewers that were not read to respondents.
4. Row or column percentages may not sum to 100 due to rounding, multiple responses, or both.
12
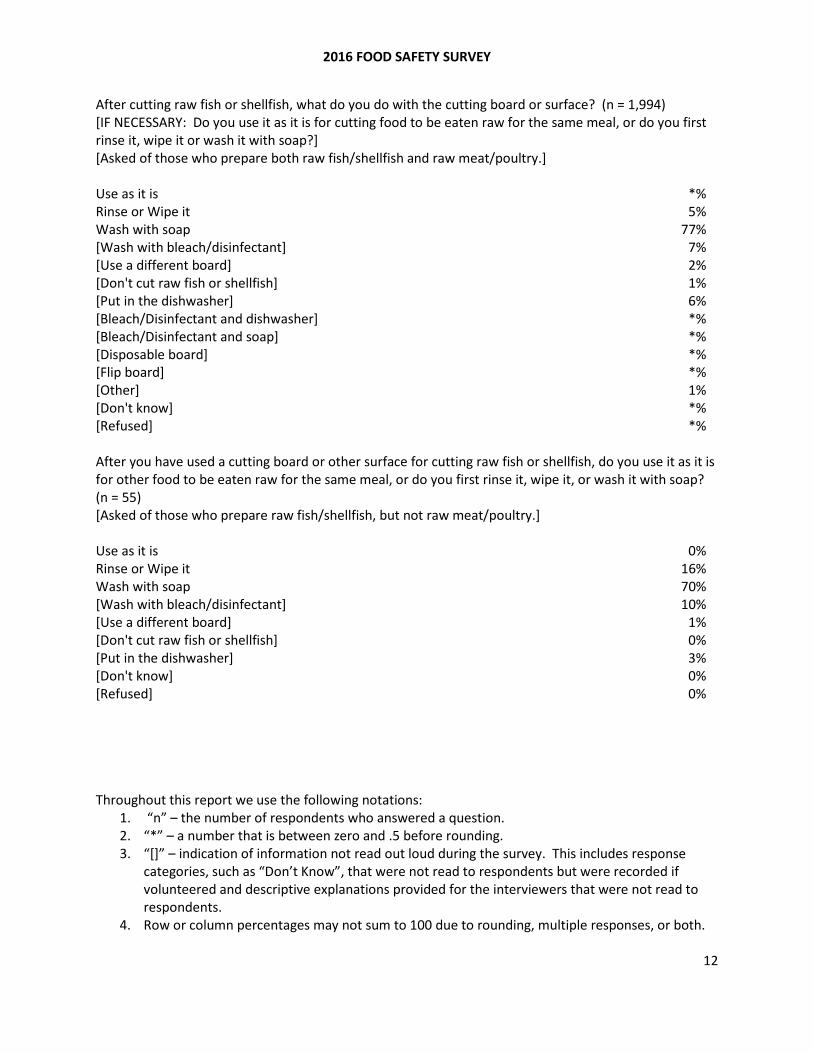
After cutting raw fish or shellfish, what do you do with the cutting board or surface? (n = 1,994) [IF NECESSARY: Do you use it as it is for cutting food to be eaten raw for the same meal, or do you first rinse it, wipe it or wash it with soap?] [Asked of those who prepare both raw fish/shellfish and raw meat/poultry.] Use as it is *% Rinse or Wipe it 5% Wash with soap 77% [Wash with bleach/disinfectant] 7% [Use a different board] 2% [Don't cut raw fish or shellfish] 1% [Put in the dishwasher] 6% [Bleach/Disinfectant and dishwasher] *% [Bleach/Disinfectant and soap] *% [Disposable board] *% [Flip board] *% [Other] 1% [Don't know] *% [Refused] *% After you have used a cutting board or other surface for cutting raw fish or shellfish, do you use it as it is for other food to be eaten raw for the same meal, or do you first rinse it, wipe it, or wash it with soap? (n = 55) [Asked of those who prepare raw fish/shellfish, but not raw meat/poultry.] Use as it is 0% Rinse or Wipe it 16% Wash with soap 70% [Wash with bleach/disinfectant] 10% [Use a different board] 1% [Don't cut raw fish or shellfish] 0% [Put in the dishwasher] 3% [Don't know] 0% [Refused] 0%
2016 FOOD SAFETY SURVEY
Throughout this report we use the following notations: 1. “n” – the number of respondents who answered a question. 2. “*” – a number that is between zero and .5 before rounding. 3. “[]” – indication of information not read out loud during the survey. This includes response
categories, such as “Don’t Know”, that were not read to respondents but were recorded if volunteered and descriptive explanations provided for the interviewers that were not read to respondents.
4. Row or column percentages may not sum to 100 due to rounding, multiple responses, or both.
13
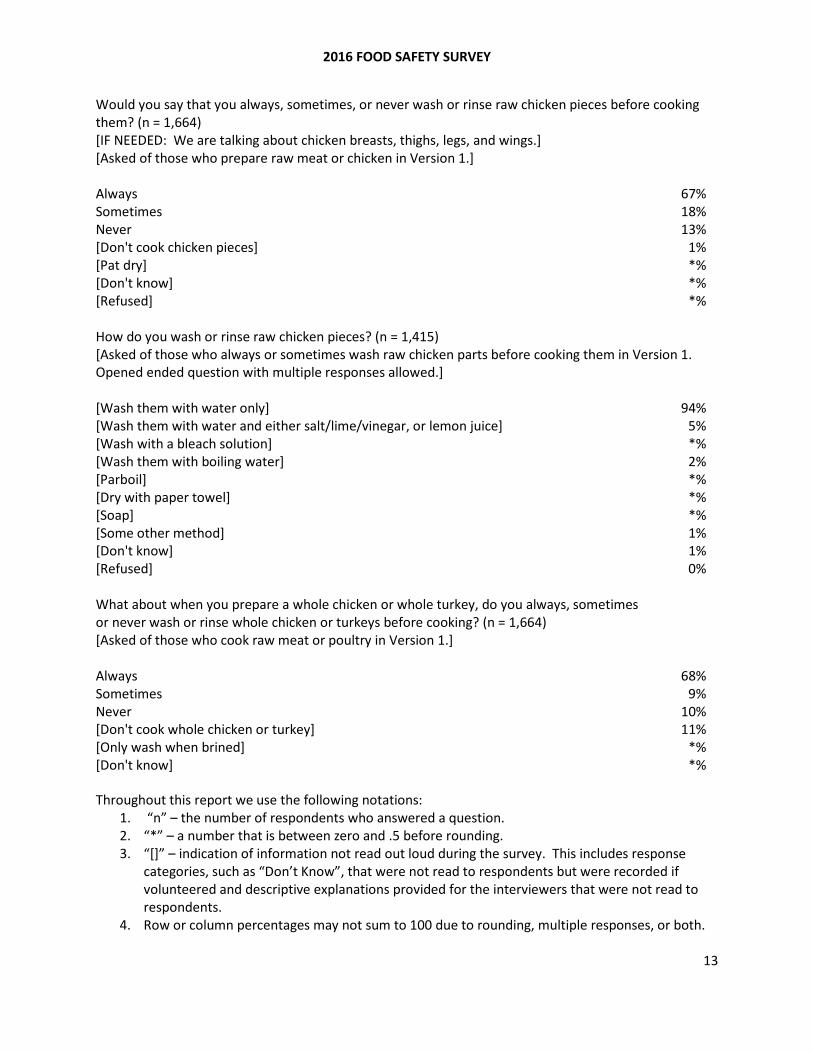
Would you say that you always, sometimes, or never wash or rinse raw chicken pieces before cooking them? (n = 1,664) [IF NEEDED: We are talking about chicken breasts, thighs, legs, and wings.] [Asked of those who prepare raw meat or chicken in Version 1.] Always 67% Sometimes 18% Never 13% [Don't cook chicken pieces] 1% [Pat dry] *% [Don't know] *% [Refused] *% How do you wash or rinse raw chicken pieces? (n = 1,415) [Asked of those who always or sometimes wash raw chicken parts before cooking them in Version 1. Opened ended question with multiple responses allowed.] [Wash them with water only] 94% [Wash them with water and either salt/lime/vinegar, or lemon juice] 5% [Wash with a bleach solution] *% [Wash them with boiling water] 2% [Parboil] *% [Dry with paper towel] *% [Soap] *% [Some other method] 1% [Don't know] 1% [Refused] 0% What about when you prepare a whole chicken or whole turkey, do you always, sometimes or never wash or rinse whole chicken or turkeys before cooking? (n = 1,664) [Asked of those who cook raw meat or poultry in Version 1.] Always 68% Sometimes 9% Never 10% [Don't cook whole chicken or turkey] 11% [Only wash when brined] *% [Don't know] *%

2016 FOOD SAFETY SURVEY
Throughout this report we use the following notations: 1. “n” – the number of respondents who answered a question. 2. “*” – a number that is between zero and .5 before rounding. 3. “[]” – indication of information not read out loud during the survey. This includes response
categories, such as “Don’t Know”, that were not read to respondents but were recorded if volunteered and descriptive explanations provided for the interviewers that were not read to respondents.
4. Row or column percentages may not sum to 100 due to rounding, multiple responses, or both.
14
[Refused] *% How do you wash whole chicken or turkey? (n = 1,300) [Asked of those who always or sometimes wash or rinse whole chickens or turkeys before cooking in Version 1. Open ended question with multiple responses allowed.] [Wash them with water only] 90% [Wash them with water and either salt/lime/vinegar, or lemon juice] 6% [Wash with a bleach solution] *% [Parboil] *% [Some other method] 4% [Don't know] 1% [Refused] *% When cleaning kitchen counter tops after preparing raw meat or chicken, which of the following types of cloth or wipe do you usually use? Do you use…? (n = 1,665) [Asked of those who prepare raw meat or chicken in Version 1. All responses were read. Multiple responses allowed.] A dish cloth 29% A sponge 15% Paper towels 35% Sanitizer wipes 32% [Don't know] 1% [Refused] 1% How often do you use a new or freshly laundered dish towel or cloth in your kitchen? Would you say... (n = 2,077) [Asked of those who have a refrigerator and either a stove or microwave in Version 1.] Daily 40% A couple of times a week 34% Weekly 16% Monthly 3% Less than once a month 2% Never use a dish towel or cloth 4% [Don't know] *% [Refused] 1%
2016 FOOD SAFETY SURVEY
Throughout this report we use the following notations: 1. “n” – the number of respondents who answered a question. 2. “*” – a number that is between zero and .5 before rounding. 3. “[]” – indication of information not read out loud during the survey. This includes response
categories, such as “Don’t Know”, that were not read to respondents but were recorded if volunteered and descriptive explanations provided for the interviewers that were not read to respondents.
4. Row or column percentages may not sum to 100 due to rounding, multiple responses, or both.
15
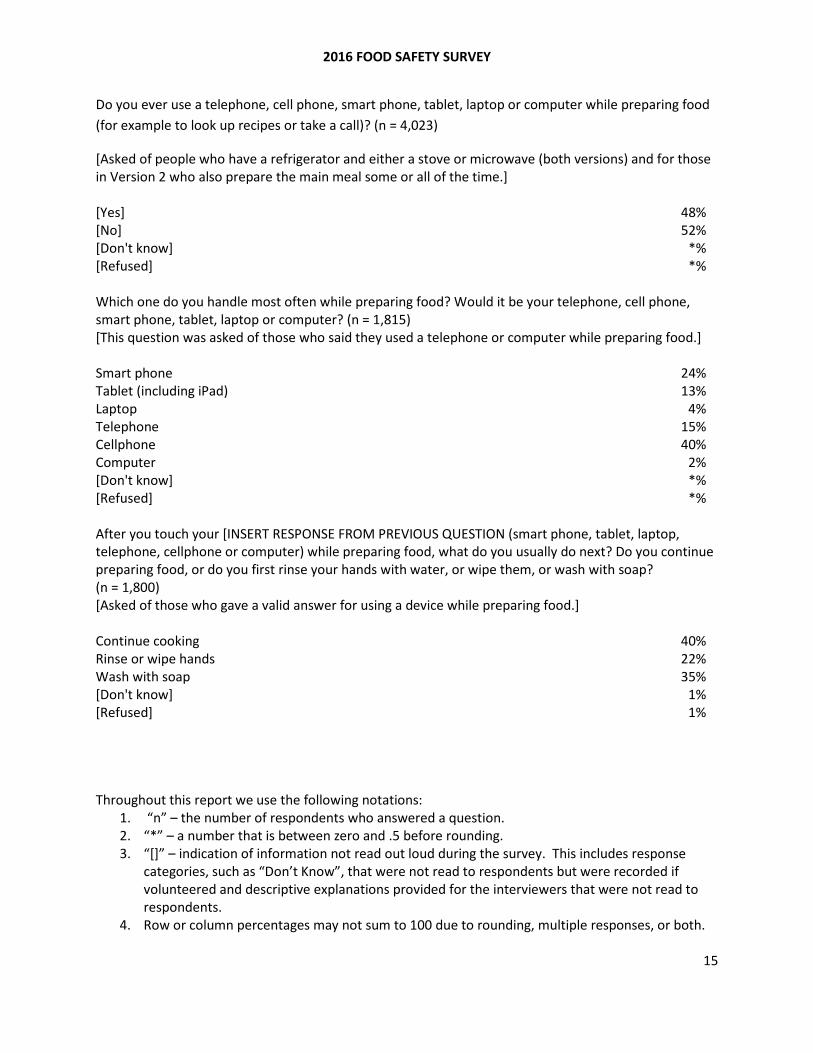
Do you ever use a telephone, cell phone, smart phone, tablet, laptop or computer while preparing food (for example to look up recipes or take a call)? (n = 4,023)
[Asked of people who have a refrigerator and either a stove or microwave (both versions) and for those in Version 2 who also prepare the main meal some or all of the time.] [Yes] 48% [No] 52% [Don't know] *% [Refused] *% Which one do you handle most often while preparing food? Would it be your telephone, cell phone, smart phone, tablet, laptop or computer? (n = 1,815) [This question was asked of those who said they used a telephone or computer while preparing food.] Smart phone 24% Tablet (including iPad) 13% Laptop 4% Telephone 15% Cellphone 40% Computer 2% [Don't know] *% [Refused] *% After you touch your [INSERT RESPONSE FROM PREVIOUS QUESTION (smart phone, tablet, laptop, telephone, cellphone or computer) while preparing food, what do you usually do next? Do you continue preparing food, or do you first rinse your hands with water, or wipe them, or wash with soap? (n = 1,800) [Asked of those who gave a valid answer for using a device while preparing food.] Continue cooking 40% Rinse or wipe hands 22% Wash with soap 35% [Don't know] 1% [Refused] 1%
2016 FOOD SAFETY SURVEY
Throughout this report we use the following notations: 1. “n” – the number of respondents who answered a question. 2. “*” – a number that is between zero and .5 before rounding. 3. “[]” – indication of information not read out loud during the survey. This includes response
categories, such as “Don’t Know”, that were not read to respondents but were recorded if volunteered and descriptive explanations provided for the interviewers that were not read to respondents.
4. Row or column percentages may not sum to 100 due to rounding, multiple responses, or both.
16
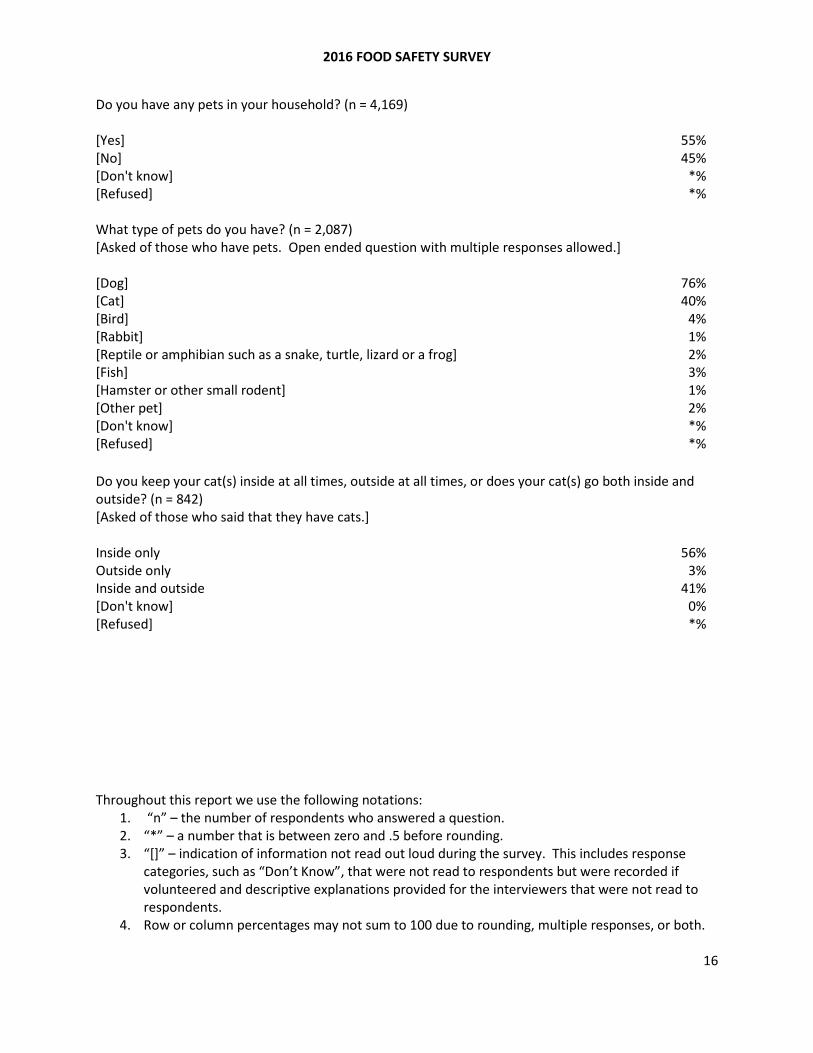
Do you have any pets in your household? (n = 4,169) [Yes] 55% [No] 45% [Don't know] *% [Refused] *% What type of pets do you have? (n = 2,087) [Asked of those who have pets. Open ended question with multiple responses allowed.] [Dog] 76% [Cat] 40% [Bird] 4% [Rabbit] 1% [Reptile or amphibian such as a snake, turtle, lizard or a frog] 2% [Fish] 3% [Hamster or other small rodent] 1% [Other pet] 2% [Don't know] *% [Refused] *% Do you keep your cat(s) inside at all times, outside at all times, or does your cat(s) go both inside and outside? (n = 842) [Asked of those who said that they have cats.] Inside only 56% Outside only 3% Inside and outside 41% [Don't know] 0% [Refused] *%
2016 FOOD SAFETY SURVEY
Throughout this report we use the following notations: 1. “n” – the number of respondents who answered a question. 2. “*” – a number that is between zero and .5 before rounding. 3. “[]” – indication of information not read out loud during the survey. This includes response
categories, such as “Don’t Know”, that were not read to respondents but were recorded if volunteered and descriptive explanations provided for the interviewers that were not read to respondents.
4. Row or column percentages may not sum to 100 due to rounding, multiple responses, or both.
17
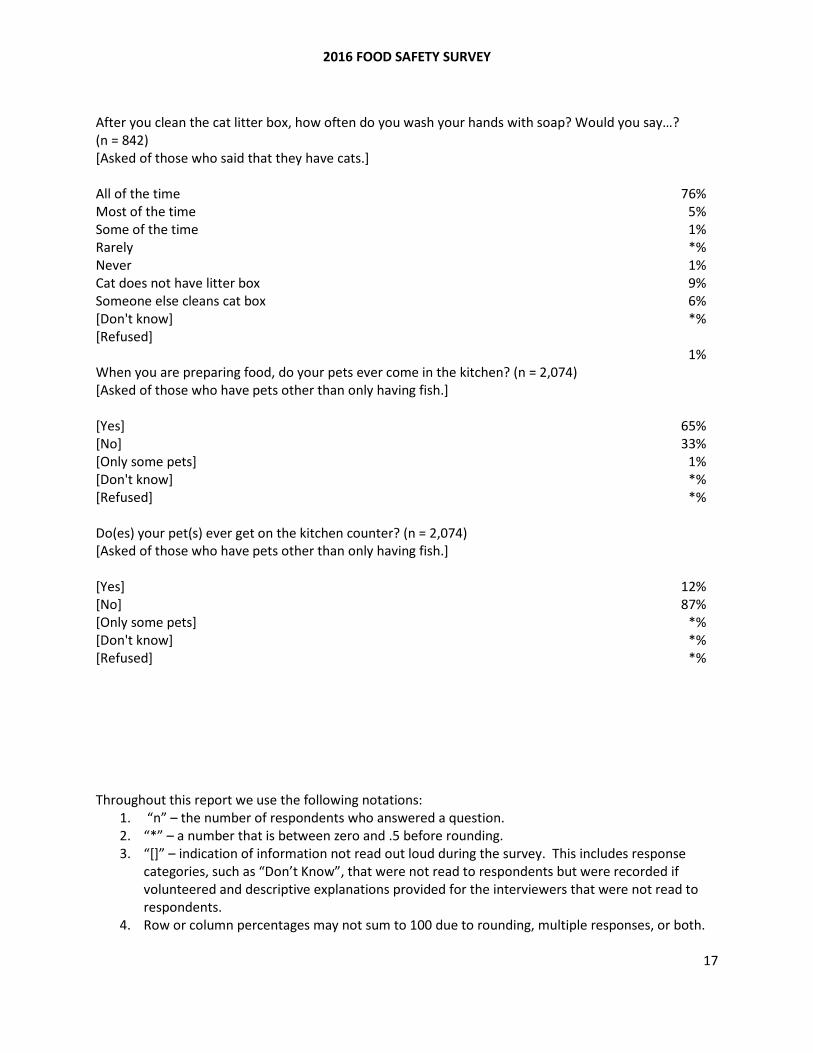
After you clean the cat litter box, how often do you wash your hands with soap? Would you say…? (n = 842) [Asked of those who said that they have cats.] All of the time 76% Most of the time 5% Some of the time 1% Rarely *% Never 1% Cat does not have litter box 9% Someone else cleans cat box 6% [Don't know] *% [Refused] 1% When you are preparing food, do your pets ever come in the kitchen? (n = 2,074) [Asked of those who have pets other than only having fish.] [Yes] 65% [No] 33% [Only some pets] 1% [Don't know] *% [Refused] *% Do(es) your pet(s) ever get on the kitchen counter? (n = 2,074) [Asked of those who have pets other than only having fish.] [Yes] 12% [No] 87% [Only some pets] *% [Don't know] *% [Refused] *%
2016 FOOD SAFETY SURVEY
Throughout this report we use the following notations: 1. “n” – the number of respondents who answered a question. 2. “*” – a number that is between zero and .5 before rounding. 3. “[]” – indication of information not read out loud during the survey. This includes response
categories, such as “Don’t Know”, that were not read to respondents but were recorded if volunteered and descriptive explanations provided for the interviewers that were not read to respondents.
4. Row or column percentages may not sum to 100 due to rounding, multiple responses, or both.
18
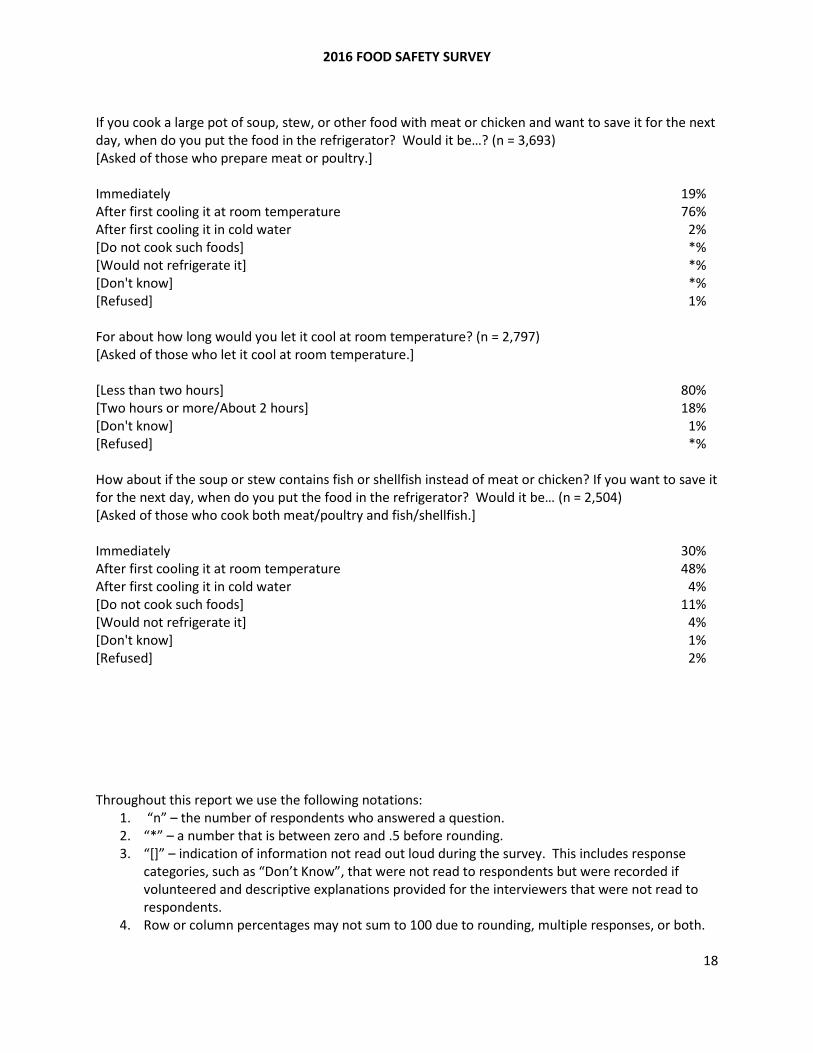
If you cook a large pot of soup, stew, or other food with meat or chicken and want to save it for the next day, when do you put the food in the refrigerator? Would it be…? (n = 3,693) [Asked of those who prepare meat or poultry.] Immediately 19% After first cooling it at room temperature 76% After first cooling it in cold water 2% [Do not cook such foods] *% [Would not refrigerate it] *% [Don't know] *% [Refused] 1% For about how long would you let it cool at room temperature? (n = 2,797) [Asked of those who let it cool at room temperature.] [Less than two hours] 80% [Two hours or more/About 2 hours] 18% [Don't know] 1% [Refused] *% How about if the soup or stew contains fish or shellfish instead of meat or chicken? If you want to save it for the next day, when do you put the food in the refrigerator? Would it be… (n = 2,504) [Asked of those who cook both meat/poultry and fish/shellfish.] Immediately 30% After first cooling it at room temperature 48% After first cooling it in cold water 4% [Do not cook such foods] 11% [Would not refrigerate it] 4% [Don't know] 1% [Refused] 2%
2016 FOOD SAFETY SURVEY
Throughout this report we use the following notations: 1. “n” – the number of respondents who answered a question. 2. “*” – a number that is between zero and .5 before rounding. 3. “[]” – indication of information not read out loud during the survey. This includes response
categories, such as “Don’t Know”, that were not read to respondents but were recorded if volunteered and descriptive explanations provided for the interviewers that were not read to respondents.
4. Row or column percentages may not sum to 100 due to rounding, multiple responses, or both.
19
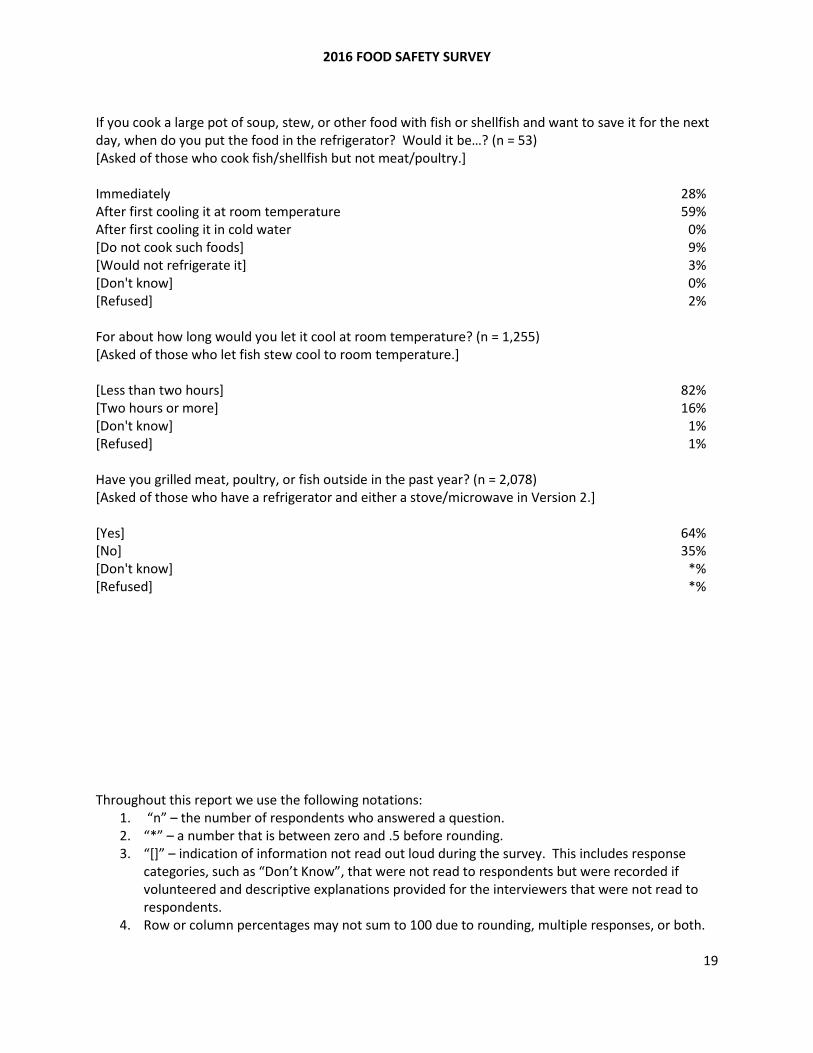
If you cook a large pot of soup, stew, or other food with fish or shellfish and want to save it for the next day, when do you put the food in the refrigerator? Would it be…? (n = 53) [Asked of those who cook fish/shellfish but not meat/poultry.] Immediately 28% After first cooling it at room temperature 59% After first cooling it in cold water 0% [Do not cook such foods] 9% [Would not refrigerate it] 3% [Don't know] 0% [Refused] 2% For about how long would you let it cool at room temperature? (n = 1,255) [Asked of those who let fish stew cool to room temperature.] [Less than two hours] 82% [Two hours or more] 16% [Don't know] 1% [Refused] 1% Have you grilled meat, poultry, or fish outside in the past year? (n = 2,078) [Asked of those who have a refrigerator and either a stove/microwave in Version 2.] [Yes] 64% [No] 35% [Don't know] *% [Refused] *%

2016 FOOD SAFETY SURVEY
Throughout this report we use the following notations: 1. “n” – the number of respondents who answered a question. 2. “*” – a number that is between zero and .5 before rounding. 3. “[]” – indication of information not read out loud during the survey. This includes response
categories, such as “Don’t Know”, that were not read to respondents but were recorded if volunteered and descriptive explanations provided for the interviewers that were not read to respondents.
4. Row or column percentages may not sum to 100 due to rounding, multiple responses, or both.
20
After the food is cooked, what do you usually use to carry it from the grill to the place where it will be eaten? Do you use…? (n = 1,254) [Asked of those who have grilled meat, poultry or fish in the past year in Version 2.] The plate or pan you used to carry the food to the grill 7% A different plate or pan 81% Serve directly from the grill to individual plates 10% [Other] 2% [Don't know] 0% [Refused] *% Do you use the plate or pan as it is, or do you first wipe it, or rinse it, or wash it with soap? (n = 82) [Asked of those who used the same plate or pan to carry the food to the grill in Version 2.] Use as is 17% Wipe or rinse it 36% Wash with soap or bleach 40% [Not sure] 4% [Don't know] 1% [Refused] 3% Do you ever buy bagged lettuce marked “prewashed” or “ready to eat”? ( n= 2,086) [IF NECESSARY: We are talking about bagged salad. Asked of Version 2.] [Yes] 66% [No] 31% [Don't know] 2% [Refused] *%

2016 FOOD SAFETY SURVEY
Throughout this report we use the following notations: 1. “n” – the number of respondents who answered a question. 2. “*” – a number that is between zero and .5 before rounding. 3. “[]” – indication of information not read out loud during the survey. This includes response
categories, such as “Don’t Know”, that were not read to respondents but were recorded if volunteered and descriptive explanations provided for the interviewers that were not read to respondents.
4. Row or column percentages may not sum to 100 due to rounding, multiple responses, or both.
21
Do you usually wash or rinse bagged lettuce that is marked “prewashed” or “ready to eat” or do you eat it as is from the bag? (n = 1,386) [Asked of those who buy bagged lettuce in Version 2.] Wash or rinse 54% Eat as is without washing 43% [It depends (I.e. product type, how it looks, how it smells)] 3% [Don't know] *% [Refused] *% Do you ever buy whole avocados? (n = 2,086) [Asked of Version 2.] [Yes] 61% [No] 39% [Don't know] *% [Refused] *% Do you usually wash or rinse avocados before you prepare or eat them? (n = 1,264) [Asked of those who buy avocados in Version 2.] [Yes] 56% [No] 43% [Don't know] *% [Refused] *% What methods do you use to wash or rinse avocados? Do you… (n = 697) [This series asked of those who wash or rinse avocados in Version 2.] [Yes] [No] [Don't
Know] [Refused]
Rub them under running water, with a brush, cloth or your hands
89% 8% *% 3%
Hold under running water, without rubbing them 34% 63% 1% 2% Soak them in a container of water 13% 85% 1% *% Use a cleaner to wash them 18% 81% 1% *%
2016 FOOD SAFETY SURVEY
Throughout this report we use the following notations: 1. “n” – the number of respondents who answered a question. 2. “*” – a number that is between zero and .5 before rounding. 3. “[]” – indication of information not read out loud during the survey. This includes response
categories, such as “Don’t Know”, that were not read to respondents but were recorded if volunteered and descriptive explanations provided for the interviewers that were not read to respondents.
4. Row or column percentages may not sum to 100 due to rounding, multiple responses, or both.
22
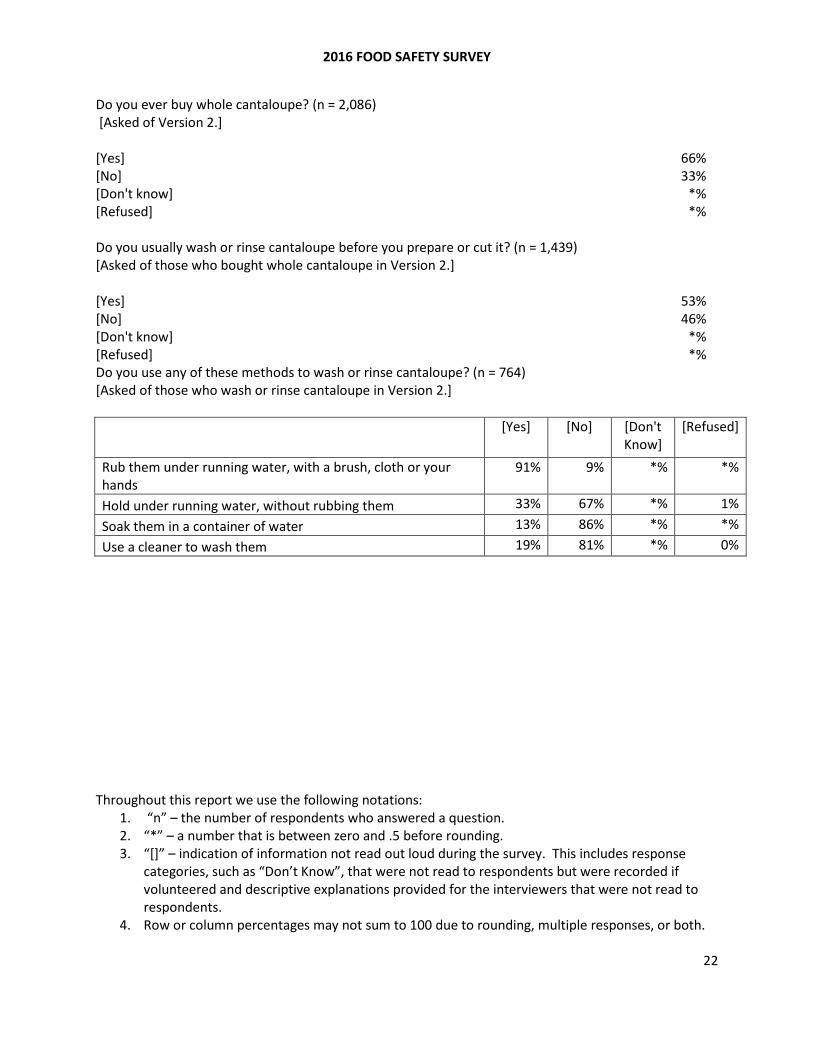
Do you ever buy whole cantaloupe? (n = 2,086) [Asked of Version 2.] [Yes] 66% [No] 33% [Don't know] *% [Refused] *% Do you usually wash or rinse cantaloupe before you prepare or cut it? (n = 1,439) [Asked of those who bought whole cantaloupe in Version 2.] [Yes] 53% [No] 46% [Don't know] *% [Refused] *% Do you use any of these methods to wash or rinse cantaloupe? (n = 764) [Asked of those who wash or rinse cantaloupe in Version 2.]
[Yes] [No] [Don't Know]
[Refused]
Rub them under running water, with a brush, cloth or your hands
91% 9% *% *%
Hold under running water, without rubbing them 33% 67% *% 1% Soak them in a container of water 13% 86% *% *% Use a cleaner to wash them 19% 81% *% 0%

2016 FOOD SAFETY SURVEY
Throughout this report we use the following notations: 1. “n” – the number of respondents who answered a question. 2. “*” – a number that is between zero and .5 before rounding. 3. “[]” – indication of information not read out loud during the survey. This includes response
categories, such as “Don’t Know”, that were not read to respondents but were recorded if volunteered and descriptive explanations provided for the interviewers that were not read to respondents.
4. Row or column percentages may not sum to 100 due to rounding, multiple responses, or both.
23
Microorganisms and Personal Vulnerability Have you ever heard of any of the following as a problem in food? (n = 4,169) [The order of the first three was random. Toxoplasma was always last.] [Yes] [No] [Don't
Know] [Refused]
Salmonella 93% 7% *% *% Listeria 58% 41% *% *% Campylobacter 16% 83% 1% *% E. coli 89% 11% *% *% Toxoplasma. Sometimes called toxoplasmosis or T. gondii 24% 75% 1% *% Do you think you can make a food that is contaminated with Toxoplasma safe to eat? (n = 1,051) [Asked of those who have heard of Toxoplasma as a problem in food.] [Yes] 16% [No] 56% [It depends] 5% [Don't know] 22% [Refused] 1%
2016 FOOD SAFETY SURVEY
Throughout this report we use the following notations: 1. “n” – the number of respondents who answered a question. 2. “*” – a number that is between zero and .5 before rounding. 3. “[]” – indication of information not read out loud during the survey. This includes response
categories, such as “Don’t Know”, that were not read to respondents but were recorded if volunteered and descriptive explanations provided for the interviewers that were not read to respondents.
4. Row or column percentages may not sum to 100 due to rounding, multiple responses, or both.
24
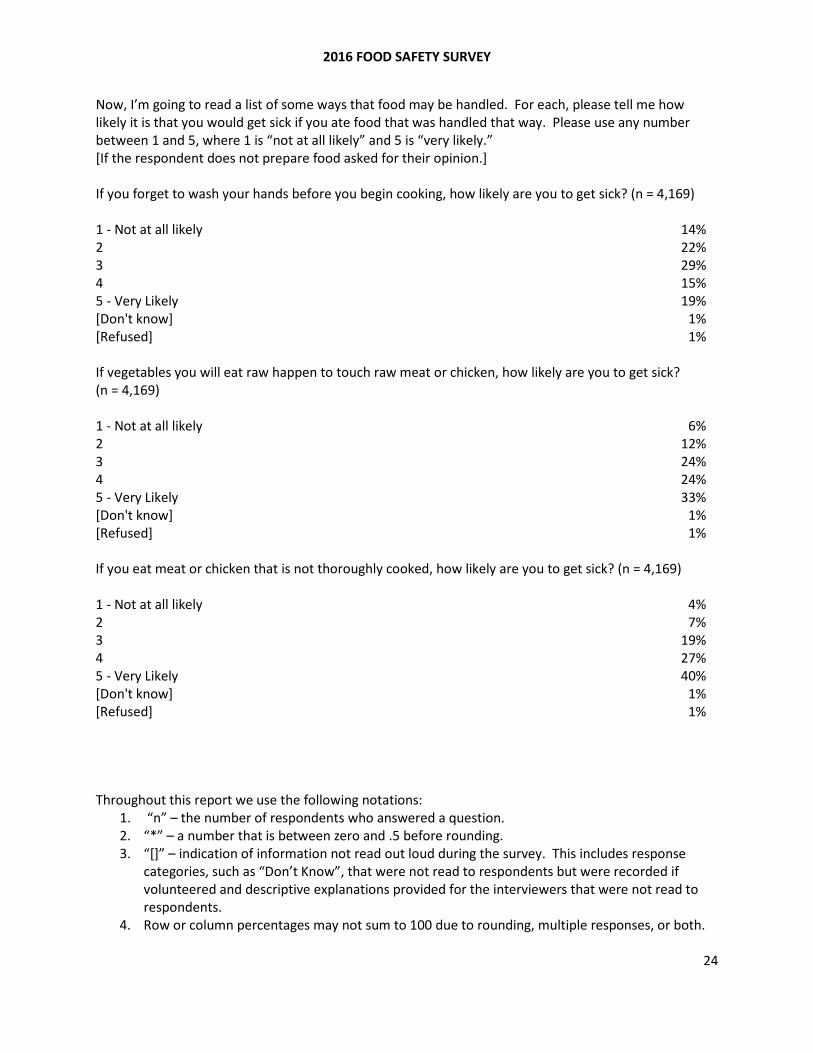
Now, I’m going to read a list of some ways that food may be handled. For each, please tell me how likely it is that you would get sick if you ate food that was handled that way. Please use any number between 1 and 5, where 1 is “not at all likely” and 5 is “very likely.” [If the respondent does not prepare food asked for their opinion.] If you forget to wash your hands before you begin cooking, how likely are you to get sick? (n = 4,169) 1 - Not at all likely 14% 2 22% 3 29% 4 15% 5 - Very Likely 19% [Don't know] 1% [Refused] 1% If vegetables you will eat raw happen to touch raw meat or chicken, how likely are you to get sick? (n = 4,169) 1 - Not at all likely 6% 2 12% 3 24% 4 24% 5 - Very Likely 33% [Don't know] 1% [Refused] 1% If you eat meat or chicken that is not thoroughly cooked, how likely are you to get sick? (n = 4,169) 1 - Not at all likely 4% 2 7% 3 19% 4 27% 5 - Very Likely 40% [Don't know] 1% [Refused] 1%

2016 FOOD SAFETY SURVEY
Throughout this report we use the following notations: 1. “n” – the number of respondents who answered a question. 2. “*” – a number that is between zero and .5 before rounding. 3. “[]” – indication of information not read out loud during the survey. This includes response
categories, such as “Don’t Know”, that were not read to respondents but were recorded if volunteered and descriptive explanations provided for the interviewers that were not read to respondents.
4. Row or column percentages may not sum to 100 due to rounding, multiple responses, or both.
25
If you happen to leave a meat or chicken stew or a casserole out of the refrigerator at room temperature for 2 to 5 hours after it has finished cooking, and eat it, how likely are you to get sick? (n = 4,169) 1 - Not at all likely 15% 2 20% 3 29% 4 17% 5 - Very Likely 17% [Don't know] 1% [Refused] *% If you forget to wash your hands after cleaning out a cat litter box before you prepare food, how likely are you to get sick? (n = 844) [Asked of those who indicated that they have a cat and are in Version 1.] 1 - Not at all likely 3% 2 7% 3 19% 4 22% 5 - Very Likely 47% [Don't know] 1% [Refused] *% How often do you wash your hands after yard work or gardening but before you prepare food? Would you say… (n = 2,083) [Asked of those in Version 1.] Always 89% Often 5% Sometimes 1% Never 1% [Never garden or do yard work] 4% [Don't know] *% [Refused] 0%
2016 FOOD SAFETY SURVEY
Throughout this report we use the following notations: 1. “n” – the number of respondents who answered a question. 2. “*” – a number that is between zero and .5 before rounding. 3. “[]” – indication of information not read out loud during the survey. This includes response
categories, such as “Don’t Know”, that were not read to respondents but were recorded if volunteered and descriptive explanations provided for the interviewers that were not read to respondents.
4. Row or column percentages may not sum to 100 due to rounding, multiple responses, or both.
26
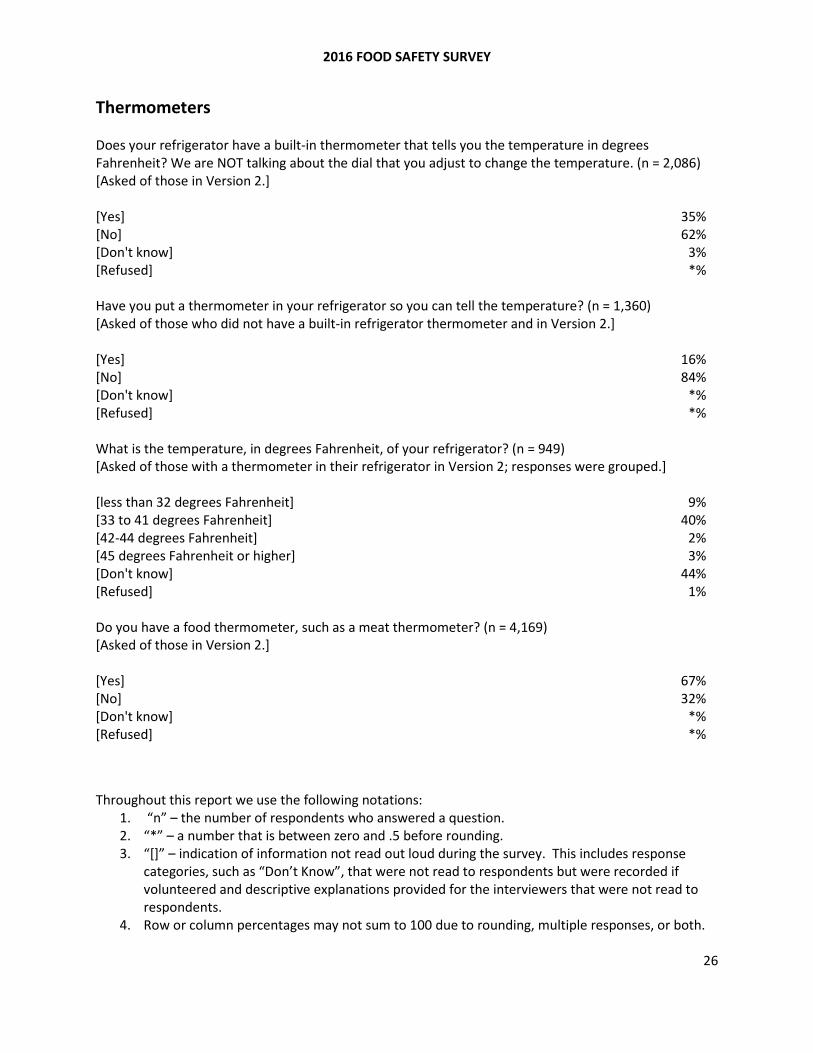
Thermometers Does your refrigerator have a built-in thermometer that tells you the temperature in degrees Fahrenheit? We are NOT talking about the dial that you adjust to change the temperature. (n = 2,086) [Asked of those in Version 2.] [Yes] 35% [No] 62% [Don't know] 3% [Refused] *% Have you put a thermometer in your refrigerator so you can tell the temperature? (n = 1,360) [Asked of those who did not have a built-in refrigerator thermometer and in Version 2.] [Yes] 16% [No] 84% [Don't know] *% [Refused] *% What is the temperature, in degrees Fahrenheit, of your refrigerator? (n = 949) [Asked of those with a thermometer in their refrigerator in Version 2; responses were grouped.] [less than 32 degrees Fahrenheit] 9% [33 to 41 degrees Fahrenheit] 40% [42-44 degrees Fahrenheit] 2% [45 degrees Fahrenheit or higher] 3% [Don't know] 44% [Refused] 1% Do you have a food thermometer, such as a meat thermometer? (n = 4,169) [Asked of those in Version 2.] [Yes] 67% [No] 32% [Don't know] *% [Refused] *%
2016 FOOD SAFETY SURVEY
Throughout this report we use the following notations: 1. “n” – the number of respondents who answered a question. 2. “*” – a number that is between zero and .5 before rounding. 3. “[]” – indication of information not read out loud during the survey. This includes response
categories, such as “Don’t Know”, that were not read to respondents but were recorded if volunteered and descriptive explanations provided for the interviewers that were not read to respondents.
4. Row or column percentages may not sum to 100 due to rounding, multiple responses, or both.
27
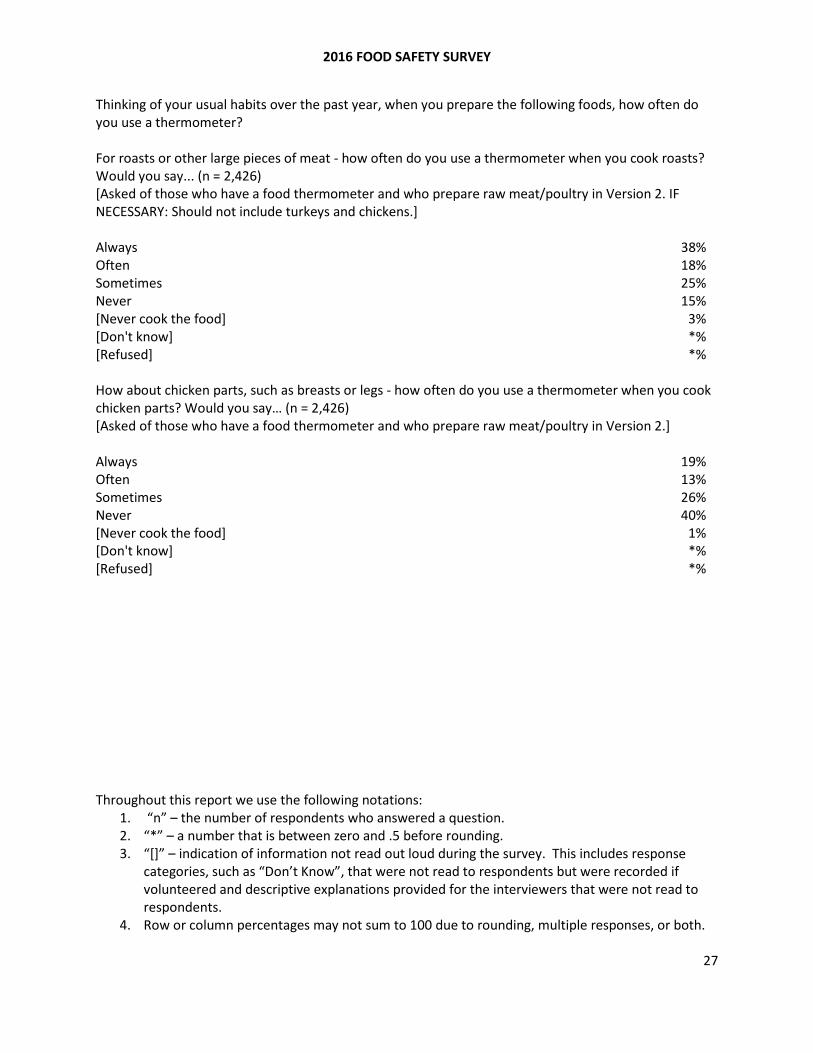
Thinking of your usual habits over the past year, when you prepare the following foods, how often do you use a thermometer? For roasts or other large pieces of meat - how often do you use a thermometer when you cook roasts? Would you say... (n = 2,426) [Asked of those who have a food thermometer and who prepare raw meat/poultry in Version 2. IF NECESSARY: Should not include turkeys and chickens.] Always 38% Often 18% Sometimes 25% Never 15% [Never cook the food] 3% [Don't know] *% [Refused] *% How about chicken parts, such as breasts or legs - how often do you use a thermometer when you cook chicken parts? Would you say… (n = 2,426) [Asked of those who have a food thermometer and who prepare raw meat/poultry in Version 2.] Always 19% Often 13% Sometimes 26% Never 40% [Never cook the food] 1% [Don't know] *% [Refused] *%
2016 FOOD SAFETY SURVEY
Throughout this report we use the following notations: 1. “n” – the number of respondents who answered a question. 2. “*” – a number that is between zero and .5 before rounding. 3. “[]” – indication of information not read out loud during the survey. This includes response
categories, such as “Don’t Know”, that were not read to respondents but were recorded if volunteered and descriptive explanations provided for the interviewers that were not read to respondents.
4. Row or column percentages may not sum to 100 due to rounding, multiple responses, or both.
28
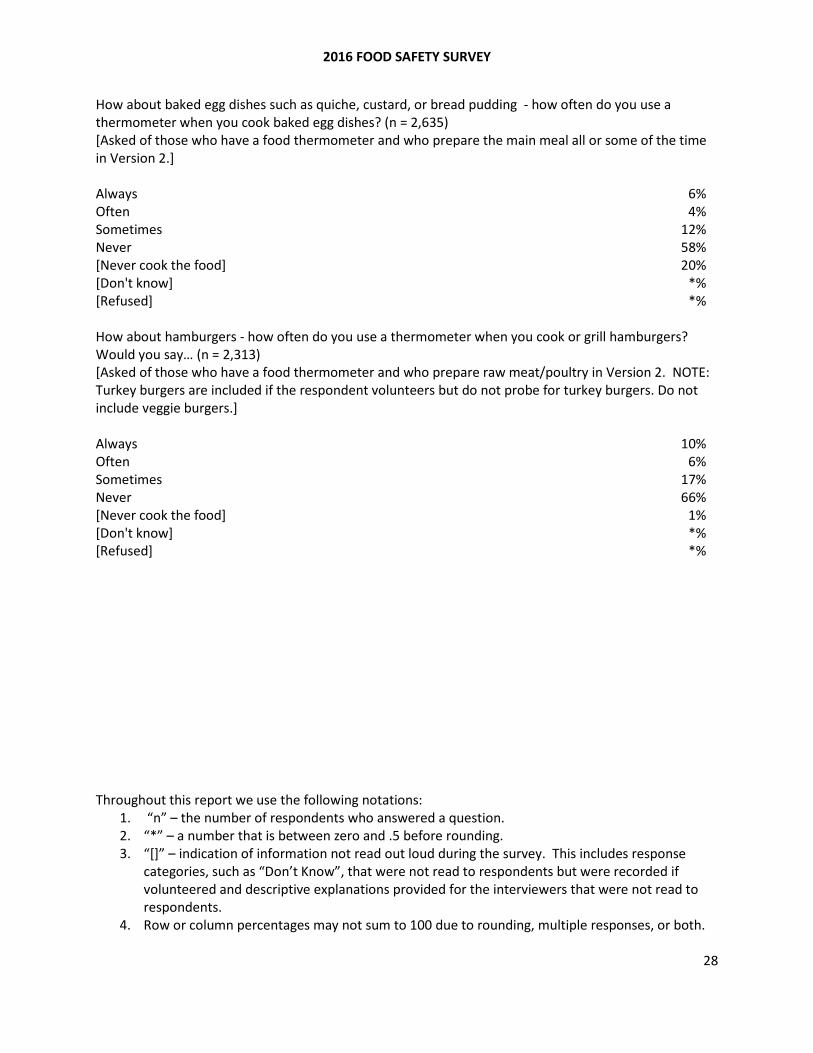
How about baked egg dishes such as quiche, custard, or bread pudding - how often do you use a thermometer when you cook baked egg dishes? (n = 2,635) [Asked of those who have a food thermometer and who prepare the main meal all or some of the time in Version 2.] Always 6% Often 4% Sometimes 12% Never 58% [Never cook the food] 20% [Don't know] *% [Refused] *% How about hamburgers - how often do you use a thermometer when you cook or grill hamburgers? Would you say… (n = 2,313) [Asked of those who have a food thermometer and who prepare raw meat/poultry in Version 2. NOTE: Turkey burgers are included if the respondent volunteers but do not probe for turkey burgers. Do not include veggie burgers.] Always 10% Often 6% Sometimes 17% Never 66% [Never cook the food] 1% [Don't know] *% [Refused] *%
2016 FOOD SAFETY SURVEY
Throughout this report we use the following notations: 1. “n” – the number of respondents who answered a question. 2. “*” – a number that is between zero and .5 before rounding. 3. “[]” – indication of information not read out loud during the survey. This includes response
categories, such as “Don’t Know”, that were not read to respondents but were recorded if volunteered and descriptive explanations provided for the interviewers that were not read to respondents.
4. Row or column percentages may not sum to 100 due to rounding, multiple responses, or both.
29
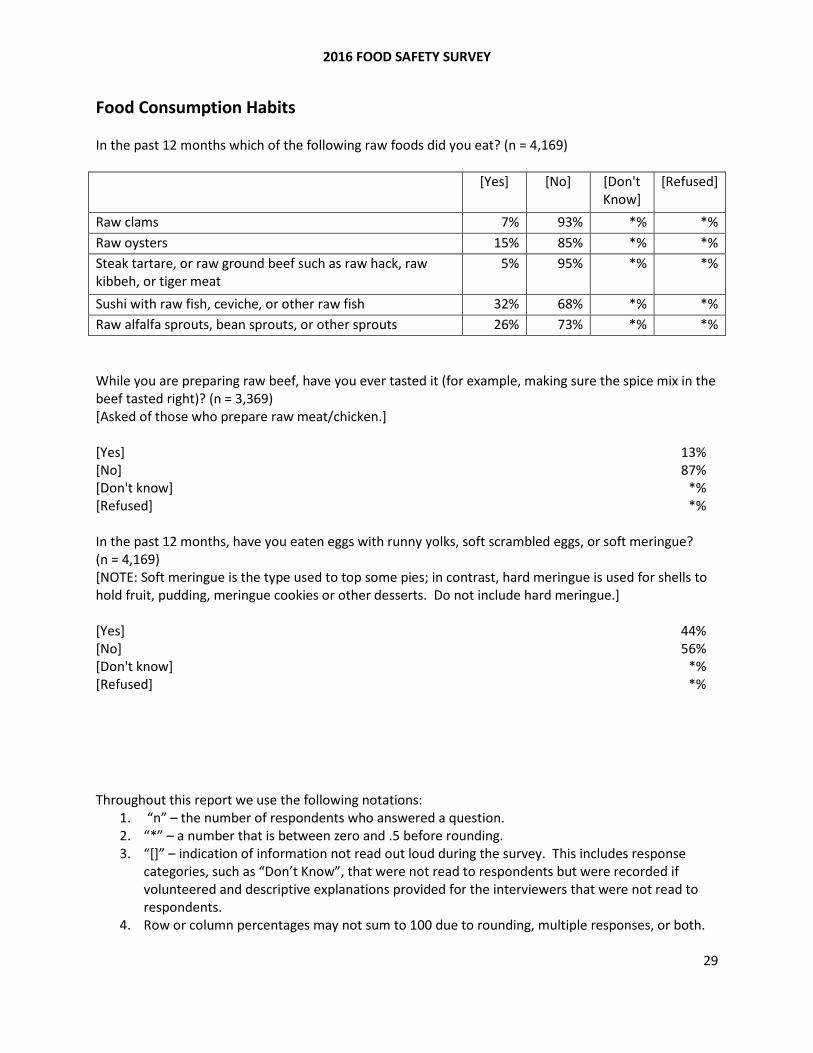
Food Consumption Habits In the past 12 months which of the following raw foods did you eat? (n = 4,169) [Yes] [No] [Don't
Know] [Refused]
Raw clams 7% 93% *% *% Raw oysters 15% 85% *% *% Steak tartare, or raw ground beef such as raw hack, raw kibbeh, or tiger meat
5% 95% *% *%
Sushi with raw fish, ceviche, or other raw fish 32% 68% *% *% Raw alfalfa sprouts, bean sprouts, or other sprouts 26% 73% *% *% While you are preparing raw beef, have you ever tasted it (for example, making sure the spice mix in the beef tasted right)? (n = 3,369) [Asked of those who prepare raw meat/chicken.] [Yes] 13% [No] 87% [Don't know] *% [Refused] *% In the past 12 months, have you eaten eggs with runny yolks, soft scrambled eggs, or soft meringue? (n = 4,169) [NOTE: Soft meringue is the type used to top some pies; in contrast, hard meringue is used for shells to hold fruit, pudding, meringue cookies or other desserts. Do not include hard meringue.] [Yes] 44% [No] 56% [Don't know] *% [Refused] *%
2016 FOOD SAFETY SURVEY
Throughout this report we use the following notations: 1. “n” – the number of respondents who answered a question. 2. “*” – a number that is between zero and .5 before rounding. 3. “[]” – indication of information not read out loud during the survey. This includes response
categories, such as “Don’t Know”, that were not read to respondents but were recorded if volunteered and descriptive explanations provided for the interviewers that were not read to respondents.
4. Row or column percentages may not sum to 100 due to rounding, multiple responses, or both.
30
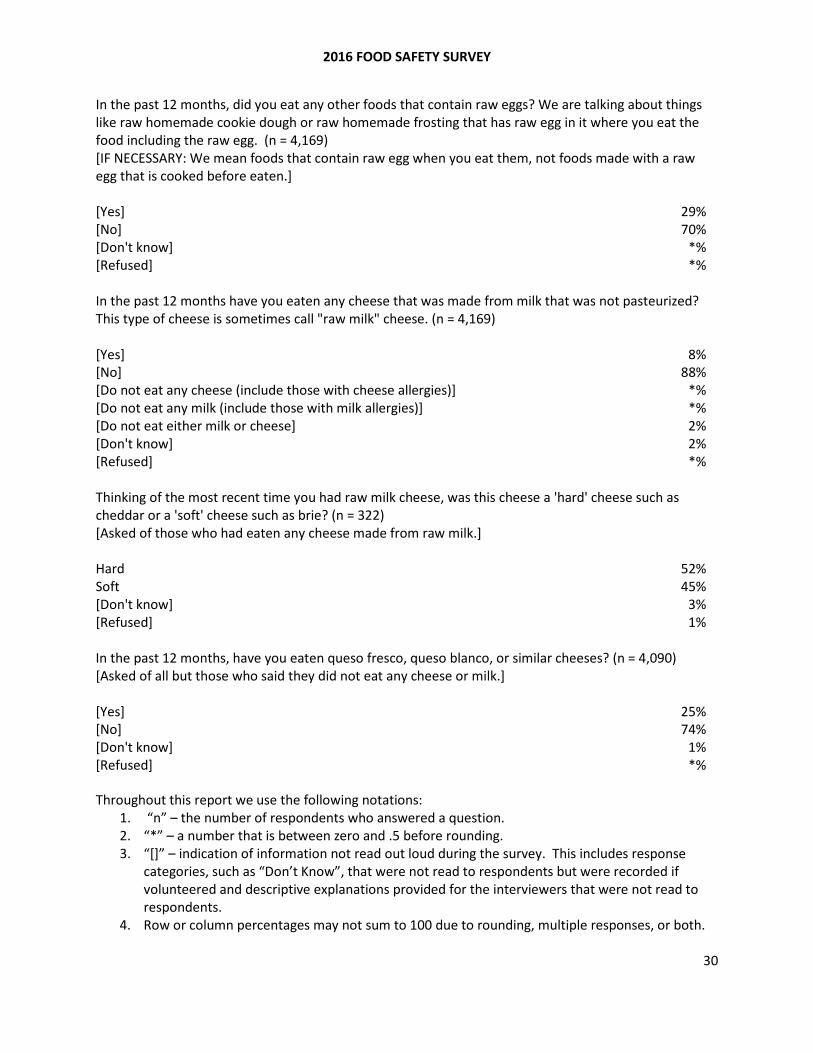
In the past 12 months, did you eat any other foods that contain raw eggs? We are talking about things like raw homemade cookie dough or raw homemade frosting that has raw egg in it where you eat the food including the raw egg. (n = 4,169) [IF NECESSARY: We mean foods that contain raw egg when you eat them, not foods made with a raw egg that is cooked before eaten.] [Yes] 29% [No] 70% [Don't know] *% [Refused] *% In the past 12 months have you eaten any cheese that was made from milk that was not pasteurized? This type of cheese is sometimes call "raw milk" cheese. (n = 4,169) [Yes] 8% [No] 88% [Do not eat any cheese (include those with cheese allergies)] *% [Do not eat any milk (include those with milk allergies)] *% [Do not eat either milk or cheese] 2% [Don't know] 2% [Refused] *% Thinking of the most recent time you had raw milk cheese, was this cheese a 'hard' cheese such as cheddar or a 'soft' cheese such as brie? (n = 322) [Asked of those who had eaten any cheese made from raw milk.] Hard 52% Soft 45% [Don't know] 3% [Refused] 1% In the past 12 months, have you eaten queso fresco, queso blanco, or similar cheeses? (n = 4,090) [Asked of all but those who said they did not eat any cheese or milk.] [Yes] 25% [No] 74% [Don't know] 1% [Refused] *%
2016 FOOD SAFETY SURVEY
Throughout this report we use the following notations: 1. “n” – the number of respondents who answered a question. 2. “*” – a number that is between zero and .5 before rounding. 3. “[]” – indication of information not read out loud during the survey. This includes response
categories, such as “Don’t Know”, that were not read to respondents but were recorded if volunteered and descriptive explanations provided for the interviewers that were not read to respondents.
4. Row or column percentages may not sum to 100 due to rounding, multiple responses, or both.
31
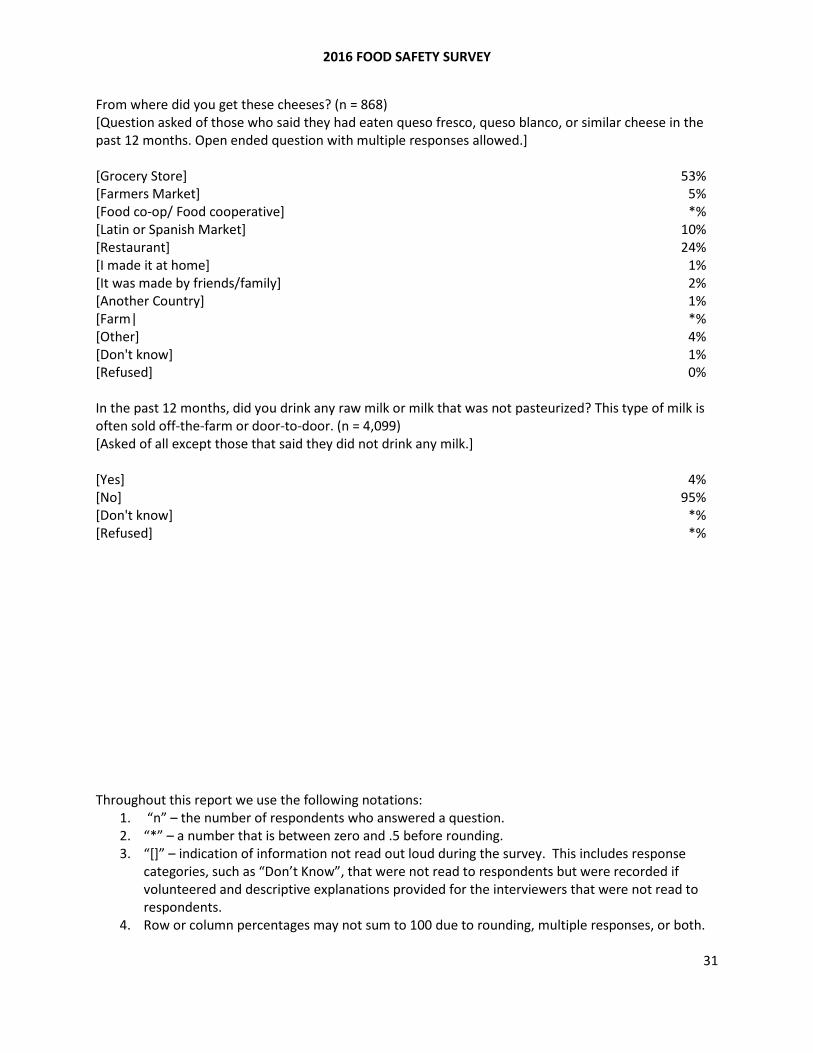
From where did you get these cheeses? (n = 868) [Question asked of those who said they had eaten queso fresco, queso blanco, or similar cheese in the past 12 months. Open ended question with multiple responses allowed.] [Grocery Store] 53% [Farmers Market] 5% [Food co-op/ Food cooperative] *% [Latin or Spanish Market] 10% [Restaurant] 24% [I made it at home] 1% [It was made by friends/family] 2% [Another Country] 1% [Farm| *% [Other] 4% [Don't know] 1% [Refused] 0% In the past 12 months, did you drink any raw milk or milk that was not pasteurized? This type of milk is often sold off-the-farm or door-to-door. (n = 4,099) [Asked of all except those that said they did not drink any milk.] [Yes] 4% [No] 95% [Don't know] *% [Refused] *%
2016 FOOD SAFETY SURVEY
Throughout this report we use the following notations: 1. “n” – the number of respondents who answered a question. 2. “*” – a number that is between zero and .5 before rounding. 3. “[]” – indication of information not read out loud during the survey. This includes response
categories, such as “Don’t Know”, that were not read to respondents but were recorded if volunteered and descriptive explanations provided for the interviewers that were not read to respondents.
4. Row or column percentages may not sum to 100 due to rounding, multiple responses, or both.
32
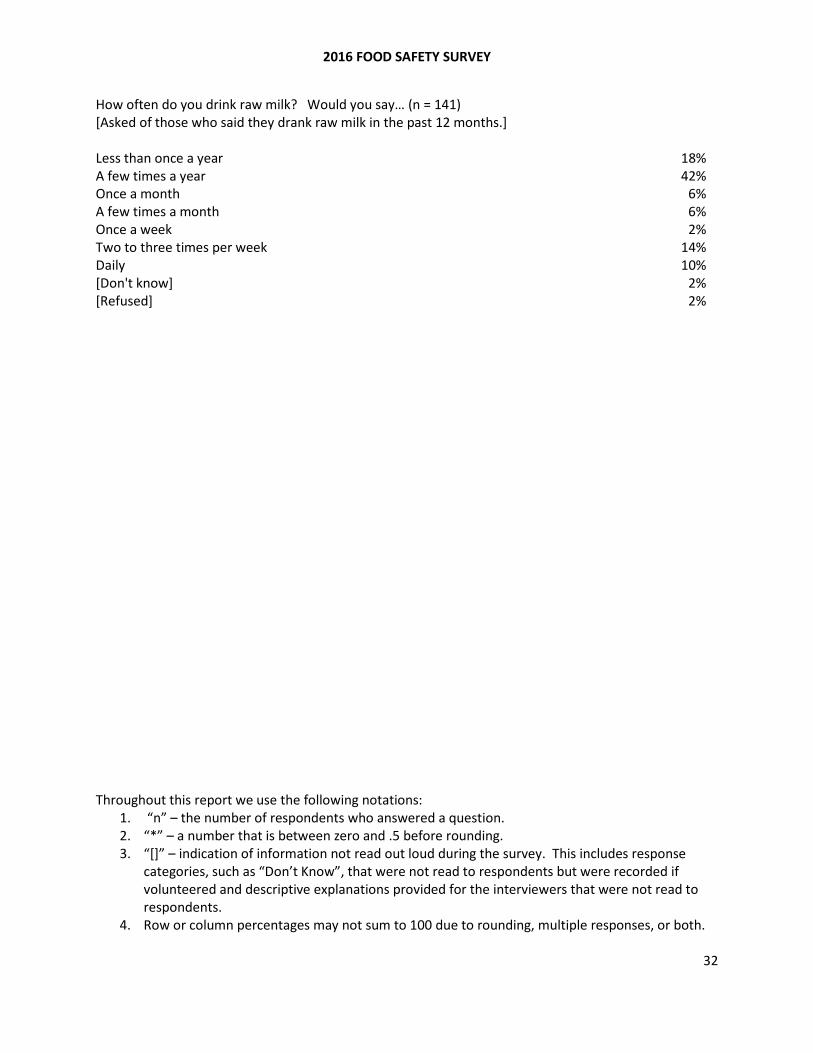
How often do you drink raw milk? Would you say… (n = 141) [Asked of those who said they drank raw milk in the past 12 months.] Less than once a year 18% A few times a year 42% Once a month 6% A few times a month 6% Once a week 2% Two to three times per week 14% Daily 10% [Don't know] 2% [Refused] 2%
2016 FOOD SAFETY SURVEY
Throughout this report we use the following notations: 1. “n” – the number of respondents who answered a question. 2. “*” – a number that is between zero and .5 before rounding. 3. “[]” – indication of information not read out loud during the survey. This includes response
categories, such as “Don’t Know”, that were not read to respondents but were recorded if volunteered and descriptive explanations provided for the interviewers that were not read to respondents.
4. Row or column percentages may not sum to 100 due to rounding, multiple responses, or both.
33
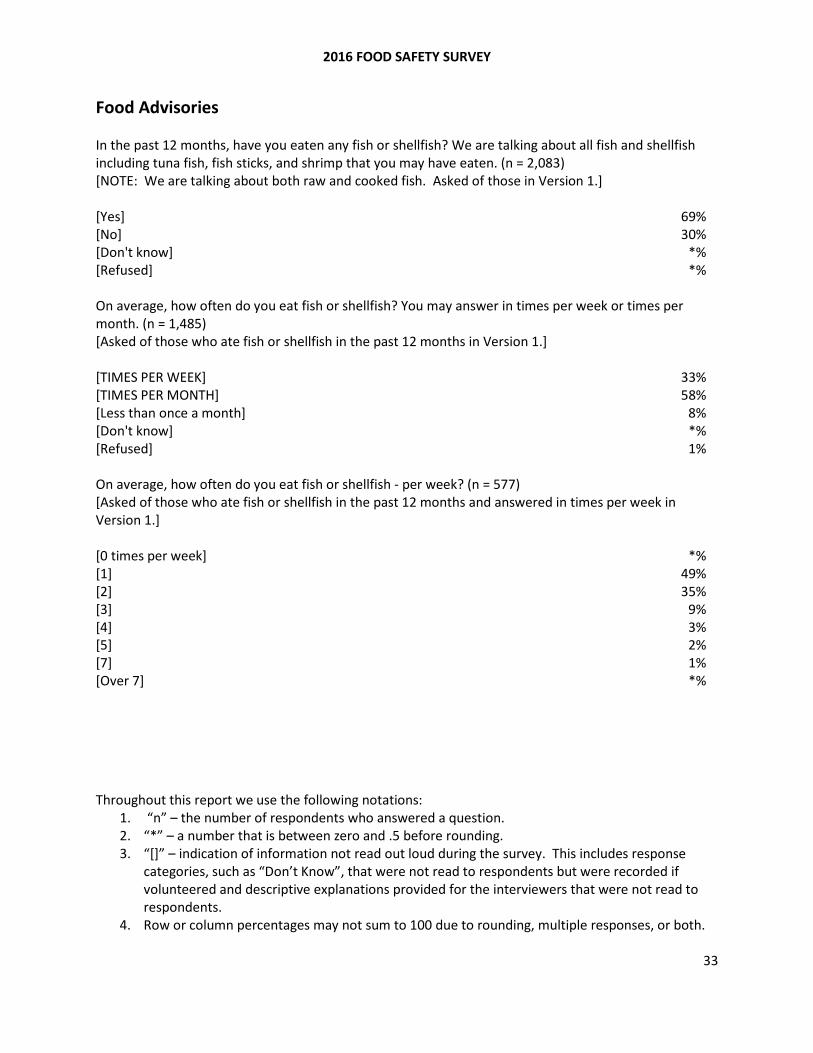
Food Advisories In the past 12 months, have you eaten any fish or shellfish? We are talking about all fish and shellfish including tuna fish, fish sticks, and shrimp that you may have eaten. (n = 2,083) [NOTE: We are talking about both raw and cooked fish. Asked of those in Version 1.] [Yes] 69% [No] 30% [Don't know] *% [Refused] *% On average, how often do you eat fish or shellfish? You may answer in times per week or times per month. (n = 1,485) [Asked of those who ate fish or shellfish in the past 12 months in Version 1.] [TIMES PER WEEK] 33% [TIMES PER MONTH] 58% [Less than once a month] 8% [Don't know] *% [Refused] 1% On average, how often do you eat fish or shellfish - per week? (n = 577) [Asked of those who ate fish or shellfish in the past 12 months and answered in times per week in Version 1.] [0 times per week] *% [1] 49% [2] 35% [3] 9% [4] 3% [5] 2% [7] 1% [Over 7] *%
2016 FOOD SAFETY SURVEY
Throughout this report we use the following notations: 1. “n” – the number of respondents who answered a question. 2. “*” – a number that is between zero and .5 before rounding. 3. “[]” – indication of information not read out loud during the survey. This includes response
categories, such as “Don’t Know”, that were not read to respondents but were recorded if volunteered and descriptive explanations provided for the interviewers that were not read to respondents.
4. Row or column percentages may not sum to 100 due to rounding, multiple responses, or both.
34
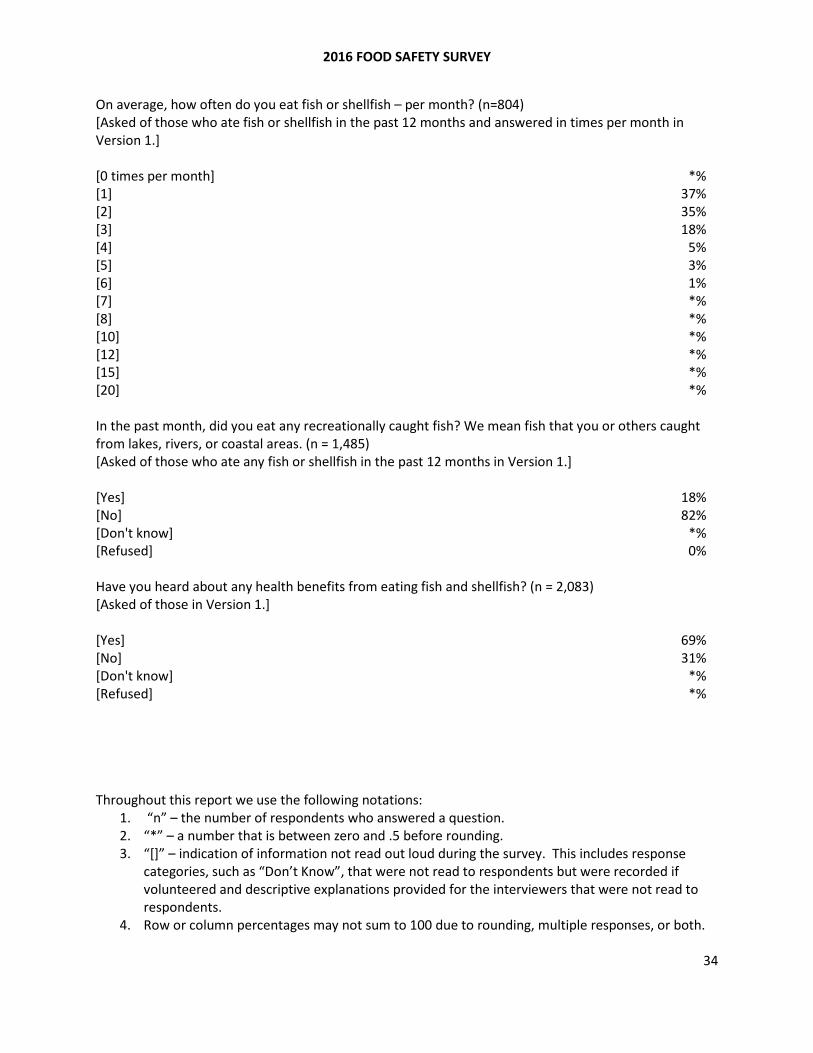
On average, how often do you eat fish or shellfish – per month? (n=804) [Asked of those who ate fish or shellfish in the past 12 months and answered in times per month in Version 1.] [0 times per month] *% [1] 37% [2] 35% [3] 18% [4] 5% [5] 3% [6] 1% [7] *% [8] *% [10] *% [12] *% [15] *% [20] *% In the past month, did you eat any recreationally caught fish? We mean fish that you or others caught from lakes, rivers, or coastal areas. (n = 1,485) [Asked of those who ate any fish or shellfish in the past 12 months in Version 1.] [Yes] 18% [No] 82% [Don't know] *% [Refused] 0% Have you heard about any health benefits from eating fish and shellfish? (n = 2,083) [Asked of those in Version 1.] [Yes] 69% [No] 31% [Don't know] *% [Refused] *%

2016 FOOD SAFETY SURVEY
Throughout this report we use the following notations: 1. “n” – the number of respondents who answered a question. 2. “*” – a number that is between zero and .5 before rounding. 3. “[]” – indication of information not read out loud during the survey. This includes response
categories, such as “Don’t Know”, that were not read to respondents but were recorded if volunteered and descriptive explanations provided for the interviewers that were not read to respondents.
4. Row or column percentages may not sum to 100 due to rounding, multiple responses, or both.
35
Have you heard about any health concerns with eating fish and shellfish? (n = 2,083) [Asked of those in Version 1.] [Yes] 67% [No] 33% [Don't know] *% [Refused] *% Have you heard anything about mercury as a problem in some fish? (n = 2,083) [Asked of those in Version 1.] [Yes] 84% [No] 15% [Don't know] *% [Refused] *%
2016 FOOD SAFETY SURVEY
Throughout this report we use the following notations: 1. “n” – the number of respondents who answered a question. 2. “*” – a number that is between zero and .5 before rounding. 3. “[]” – indication of information not read out loud during the survey. This includes response
categories, such as “Don’t Know”, that were not read to respondents but were recorded if volunteered and descriptive explanations provided for the interviewers that were not read to respondents.
4. Row or column percentages may not sum to 100 due to rounding, multiple responses, or both.
36
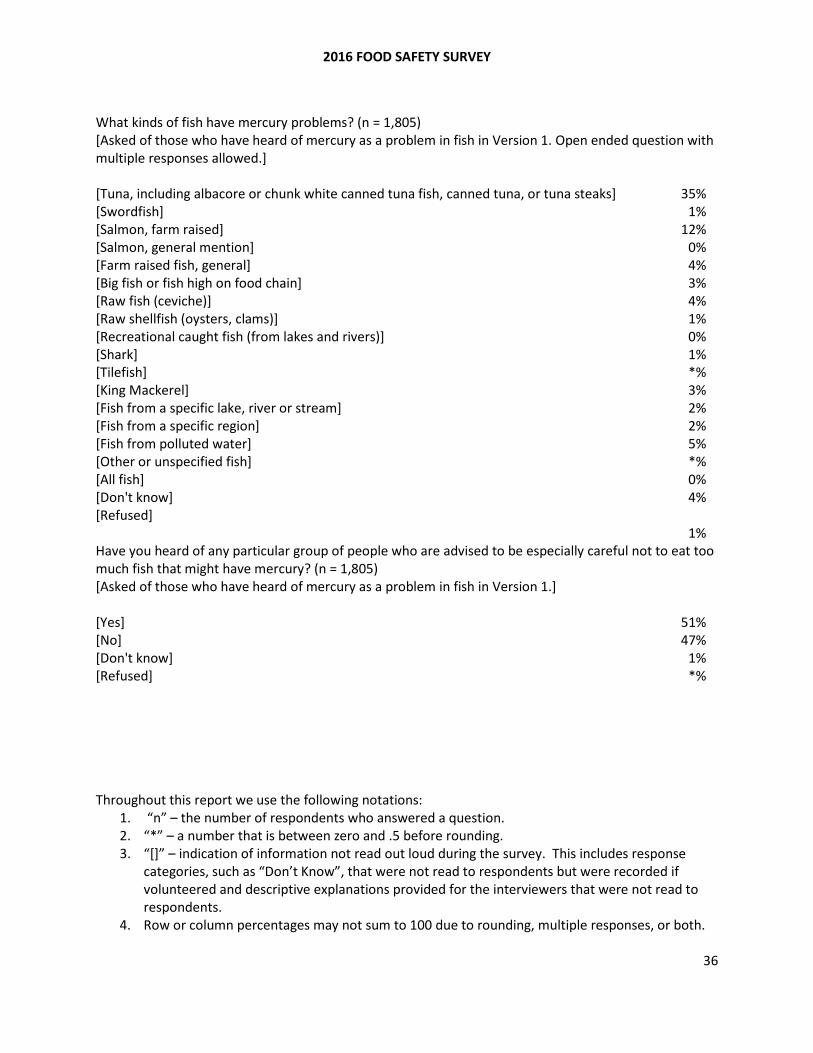
What kinds of fish have mercury problems? (n = 1,805) [Asked of those who have heard of mercury as a problem in fish in Version 1. Open ended question with multiple responses allowed.] [Tuna, including albacore or chunk white canned tuna fish, canned tuna, or tuna steaks] 35% [Swordfish] 1% [Salmon, farm raised] 12% [Salmon, general mention] 0% [Farm raised fish, general] 4% [Big fish or fish high on food chain] 3% [Raw fish (ceviche)] 4% [Raw shellfish (oysters, clams)] 1% [Recreational caught fish (from lakes and rivers)] 0% [Shark] 1% [Tilefish] *% [King Mackerel] 3% [Fish from a specific lake, river or stream] 2% [Fish from a specific region] 2% [Fish from polluted water] 5% [Other or unspecified fish] *% [All fish] 0% [Don't know] 4% [Refused] 1% Have you heard of any particular group of people who are advised to be especially careful not to eat too much fish that might have mercury? (n = 1,805) [Asked of those who have heard of mercury as a problem in fish in Version 1.] [Yes] 51% [No] 47% [Don't know] 1% [Refused] *%

2016 FOOD SAFETY SURVEY
Throughout this report we use the following notations: 1. “n” – the number of respondents who answered a question. 2. “*” – a number that is between zero and .5 before rounding. 3. “[]” – indication of information not read out loud during the survey. This includes response
categories, such as “Don’t Know”, that were not read to respondents but were recorded if volunteered and descriptive explanations provided for the interviewers that were not read to respondents.
4. Row or column percentages may not sum to 100 due to rounding, multiple responses, or both.
37
Of people who are advised to be especially careful not to eat too much fish that might have mercury which group have you heard of? (n = 944) [Open ended questions with multiple responses allowed.] [Not heard of a Particular Group] 2% [Pregnant Women or Women Who Might Become Pregnant] 63% [Nursing Mothers] 2% [Young Children] 25% [Elderly] 14% [Compromised Immune System] 9% [Allergy] 2% [Other] 5% [No Particular Group is at Higher Risk] 3% [Don't know] 9% [Refused] 1% Have you heard or read about any possible health problems related to eating “raw” sprouts, such as alfalfa or bean sprouts? (n = 2,083) [Asked of those in Version 1.] [Yes] 21% [No] 79% [Don't know] *% [Refused] *%
2016 FOOD SAFETY SURVEY
Throughout this report we use the following notations: 1. “n” – the number of respondents who answered a question. 2. “*” – a number that is between zero and .5 before rounding. 3. “[]” – indication of information not read out loud during the survey. This includes response
categories, such as “Don’t Know”, that were not read to respondents but were recorded if volunteered and descriptive explanations provided for the interviewers that were not read to respondents.
4. Row or column percentages may not sum to 100 due to rounding, multiple responses, or both.
38
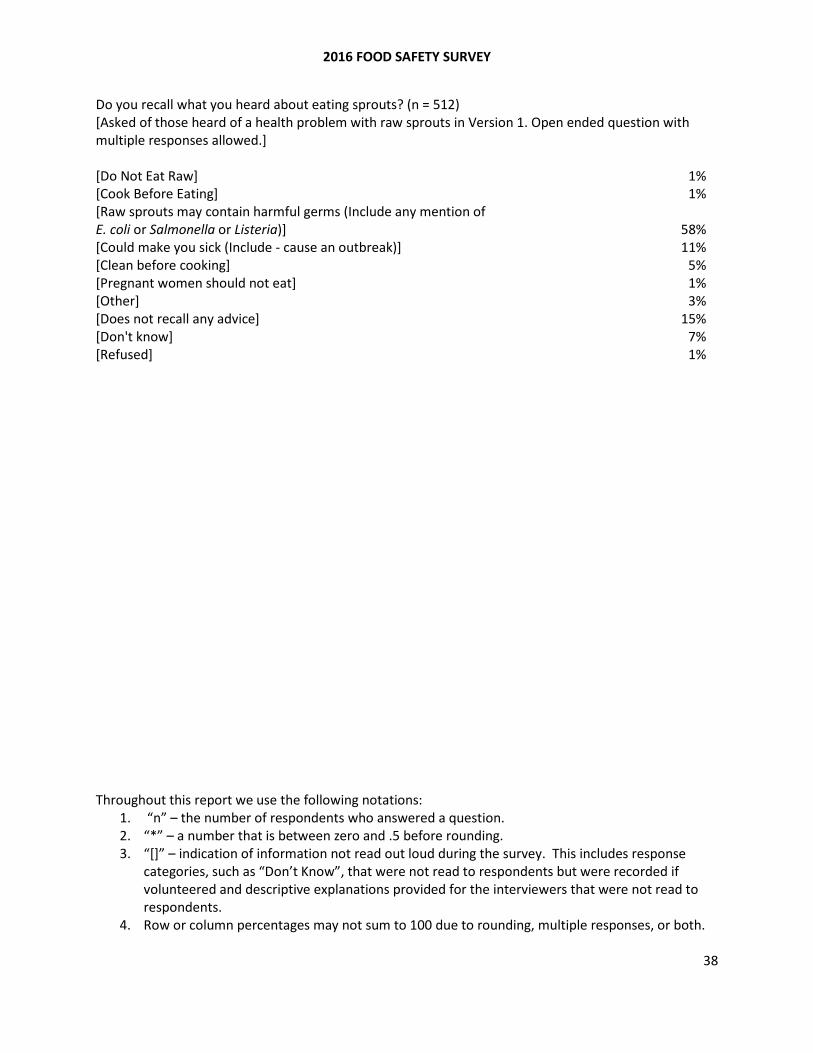
Do you recall what you heard about eating sprouts? (n = 512) [Asked of those heard of a health problem with raw sprouts in Version 1. Open ended question with multiple responses allowed.] [Do Not Eat Raw] 1% [Cook Before Eating] 1% [Raw sprouts may contain harmful germs (Include any mention of E. coli or Salmonella or Listeria)] 58% [Could make you sick (Include - cause an outbreak)] 11% [Clean before cooking] 5% [Pregnant women should not eat] 1% [Other] 3% [Does not recall any advice] 15% [Don't know] 7% [Refused] 1%
2016 FOOD SAFETY SURVEY
Throughout this report we use the following notations: 1. “n” – the number of respondents who answered a question. 2. “*” – a number that is between zero and .5 before rounding. 3. “[]” – indication of information not read out loud during the survey. This includes response
categories, such as “Don’t Know”, that were not read to respondents but were recorded if volunteered and descriptive explanations provided for the interviewers that were not read to respondents.
4. Row or column percentages may not sum to 100 due to rounding, multiple responses, or both.
39
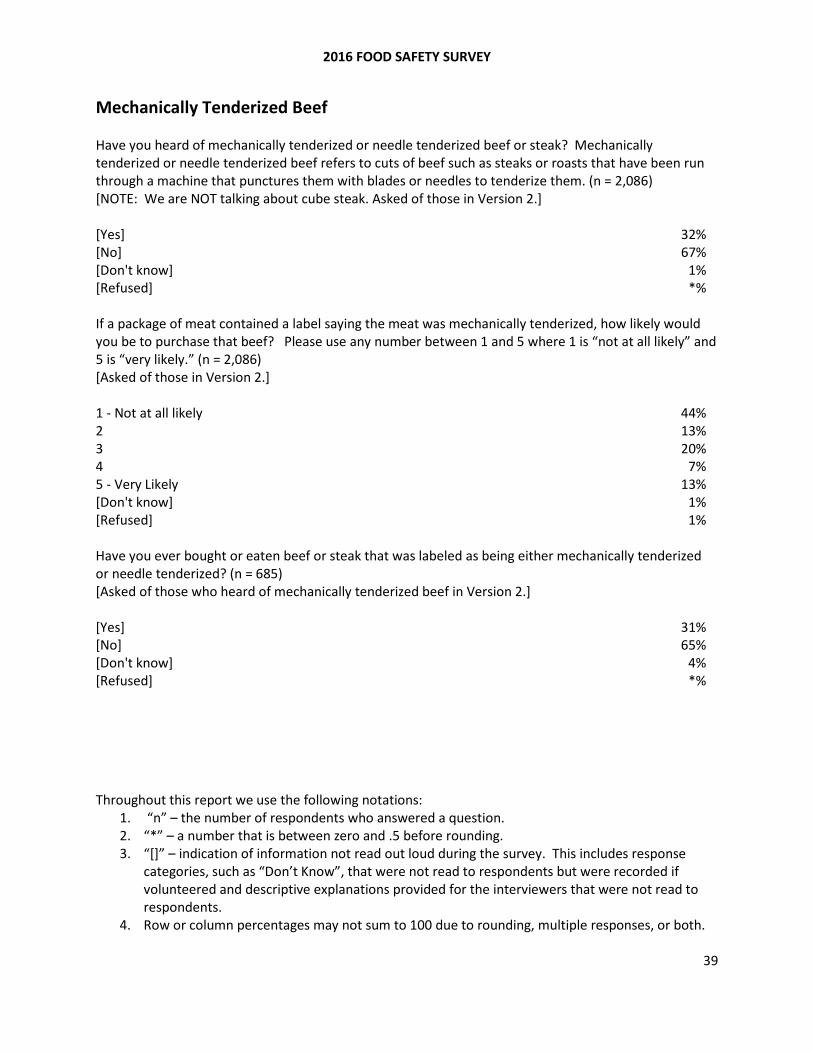
Mechanically Tenderized Beef Have you heard of mechanically tenderized or needle tenderized beef or steak? Mechanically tenderized or needle tenderized beef refers to cuts of beef such as steaks or roasts that have been run through a machine that punctures them with blades or needles to tenderize them. (n = 2,086) [NOTE: We are NOT talking about cube steak. Asked of those in Version 2.] [Yes] 32% [No] 67% [Don't know] 1% [Refused] *% If a package of meat contained a label saying the meat was mechanically tenderized, how likely would you be to purchase that beef? Please use any number between 1 and 5 where 1 is “not at all likely” and 5 is “very likely.” (n = 2,086) [Asked of those in Version 2.] 1 - Not at all likely 44% 2 13% 3 20% 4 7% 5 - Very Likely 13% [Don't know] 1% [Refused] 1% Have you ever bought or eaten beef or steak that was labeled as being either mechanically tenderized or needle tenderized? (n = 685) [Asked of those who heard of mechanically tenderized beef in Version 2.] [Yes] 31% [No] 65% [Don't know] 4% [Refused] *%
2016 FOOD SAFETY SURVEY
Throughout this report we use the following notations: 1. “n” – the number of respondents who answered a question. 2. “*” – a number that is between zero and .5 before rounding. 3. “[]” – indication of information not read out loud during the survey. This includes response
categories, such as “Don’t Know”, that were not read to respondents but were recorded if volunteered and descriptive explanations provided for the interviewers that were not read to respondents.
4. Row or column percentages may not sum to 100 due to rounding, multiple responses, or both.
40
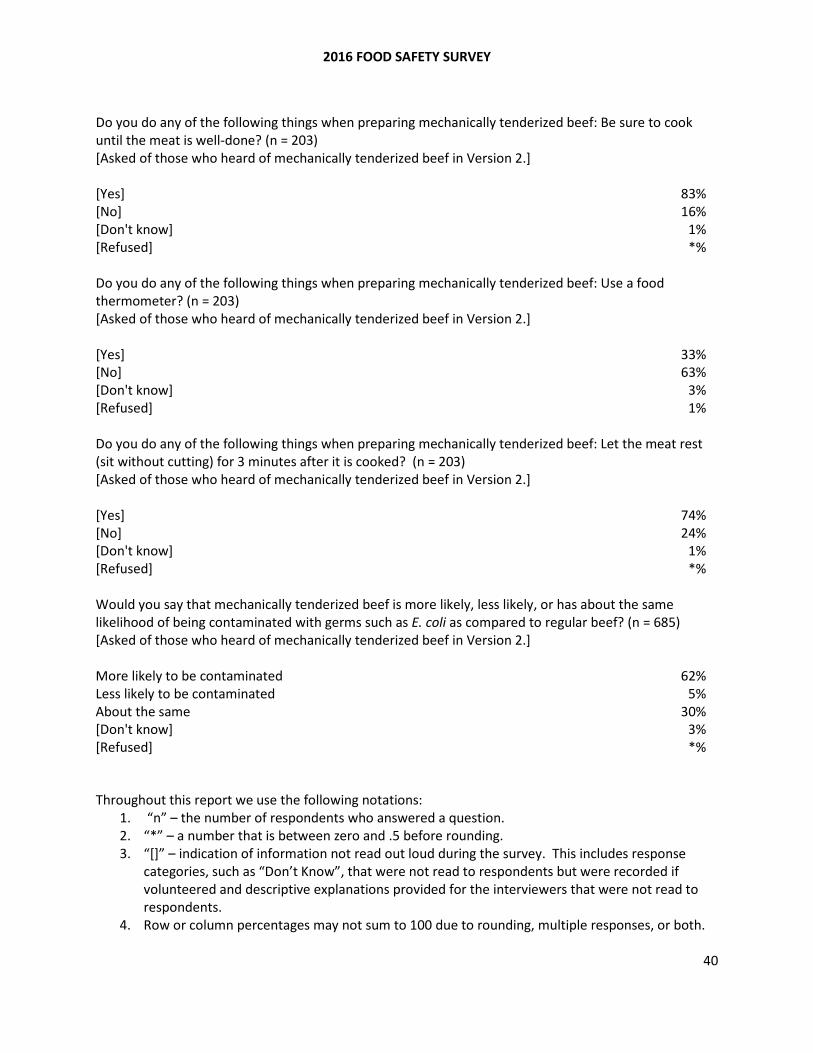
Do you do any of the following things when preparing mechanically tenderized beef: Be sure to cook until the meat is well-done? (n = 203) [Asked of those who heard of mechanically tenderized beef in Version 2.] [Yes] 83% [No] 16% [Don't know] 1% [Refused] *% Do you do any of the following things when preparing mechanically tenderized beef: Use a food thermometer? (n = 203) [Asked of those who heard of mechanically tenderized beef in Version 2.] [Yes] 33% [No] 63% [Don't know] 3% [Refused] 1% Do you do any of the following things when preparing mechanically tenderized beef: Let the meat rest (sit without cutting) for 3 minutes after it is cooked? (n = 203) [Asked of those who heard of mechanically tenderized beef in Version 2.] [Yes] 74% [No] 24% [Don't know] 1% [Refused] *% Would you say that mechanically tenderized beef is more likely, less likely, or has about the same likelihood of being contaminated with germs such as E. coli as compared to regular beef? (n = 685) [Asked of those who heard of mechanically tenderized beef in Version 2.] More likely to be contaminated 62% Less likely to be contaminated 5% About the same 30% [Don't know] 3% [Refused] *%
2016 FOOD SAFETY SURVEY
Throughout this report we use the following notations: 1. “n” – the number of respondents who answered a question. 2. “*” – a number that is between zero and .5 before rounding. 3. “[]” – indication of information not read out loud during the survey. This includes response
categories, such as “Don’t Know”, that were not read to respondents but were recorded if volunteered and descriptive explanations provided for the interviewers that were not read to respondents.
4. Row or column percentages may not sum to 100 due to rounding, multiple responses, or both.
41
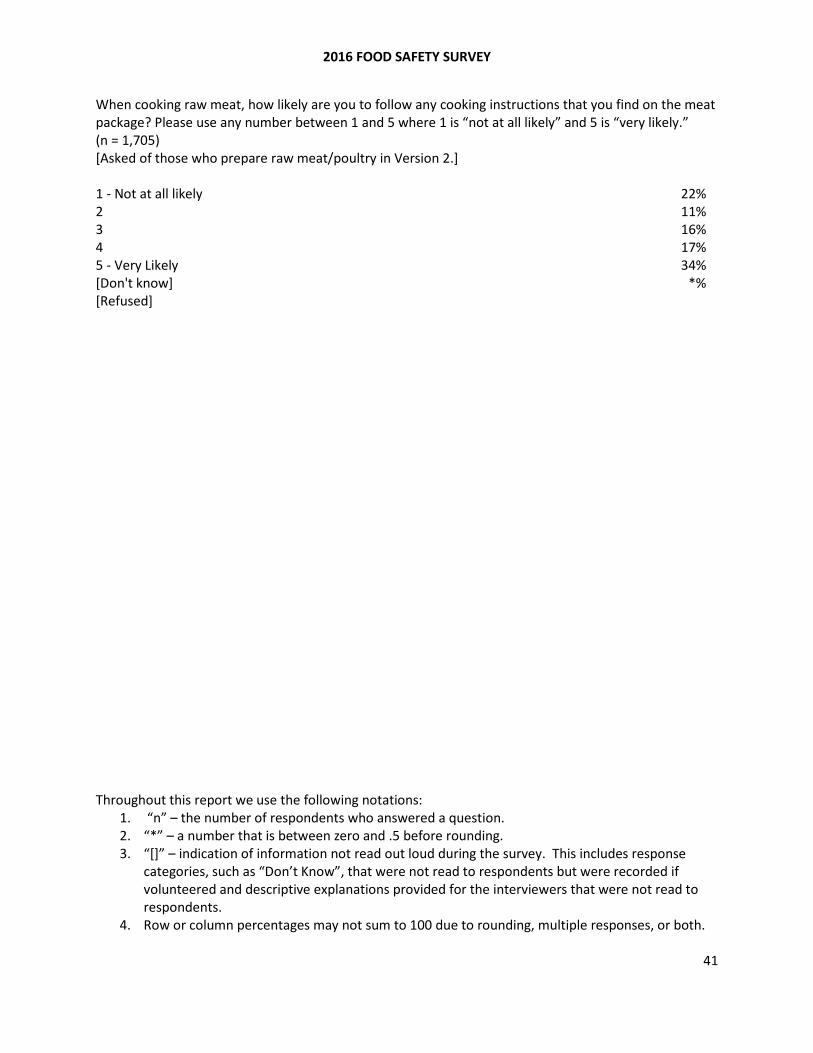
When cooking raw meat, how likely are you to follow any cooking instructions that you find on the meat package? Please use any number between 1 and 5 where 1 is “not at all likely” and 5 is “very likely.” (n = 1,705) [Asked of those who prepare raw meat/poultry in Version 2.] 1 - Not at all likely 22% 2 11% 3 16% 4 17% 5 - Very Likely 34% [Don't know] *% [Refused]
2016 FOOD SAFETY SURVEY
Throughout this report we use the following notations: 1. “n” – the number of respondents who answered a question. 2. “*” – a number that is between zero and .5 before rounding. 3. “[]” – indication of information not read out loud during the survey. This includes response
categories, such as “Don’t Know”, that were not read to respondents but were recorded if volunteered and descriptive explanations provided for the interviewers that were not read to respondents.
4. Row or column percentages may not sum to 100 due to rounding, multiple responses, or both.
42
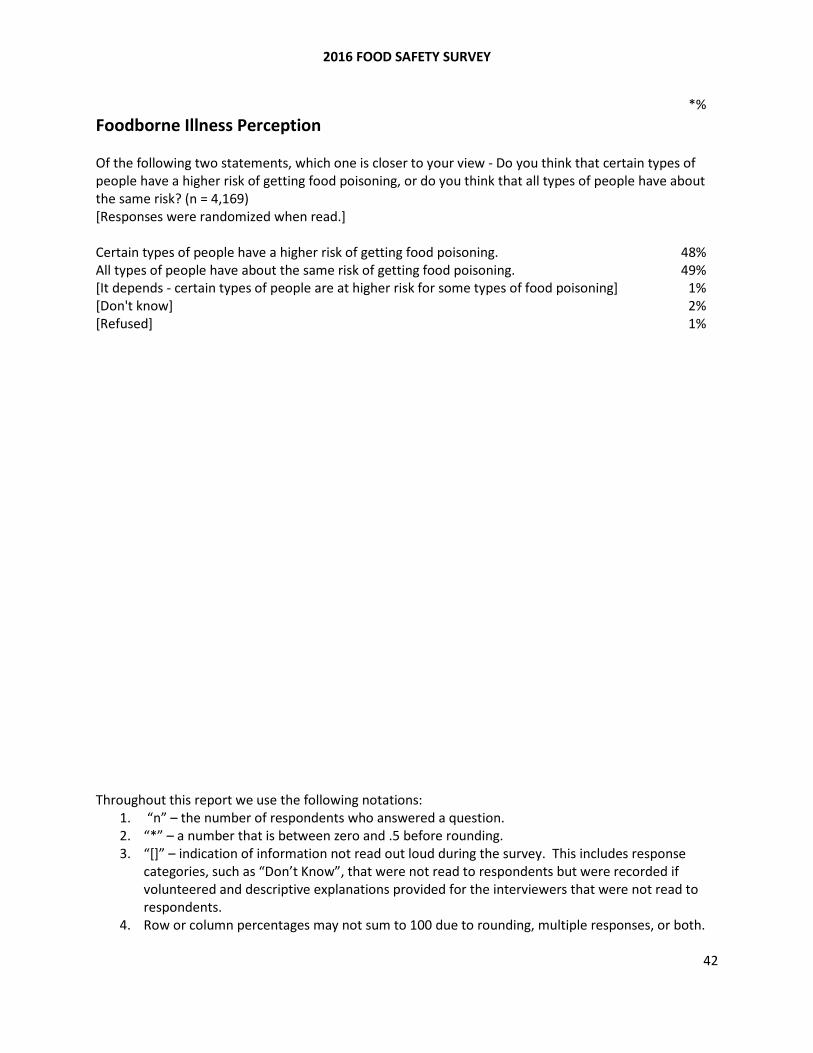
*% Foodborne Illness Perception Of the following two statements, which one is closer to your view - Do you think that certain types of people have a higher risk of getting food poisoning, or do you think that all types of people have about the same risk? (n = 4,169) [Responses were randomized when read.] Certain types of people have a higher risk of getting food poisoning. 48% All types of people have about the same risk of getting food poisoning. 49% [It depends - certain types of people are at higher risk for some types of food poisoning] 1% [Don't know] 2% [Refused] 1%
2016 FOOD SAFETY SURVEY
Throughout this report we use the following notations: 1. “n” – the number of respondents who answered a question. 2. “*” – a number that is between zero and .5 before rounding. 3. “[]” – indication of information not read out loud during the survey. This includes response
categories, such as “Don’t Know”, that were not read to respondents but were recorded if volunteered and descriptive explanations provided for the interviewers that were not read to respondents.
4. Row or column percentages may not sum to 100 due to rounding, multiple responses, or both.
43
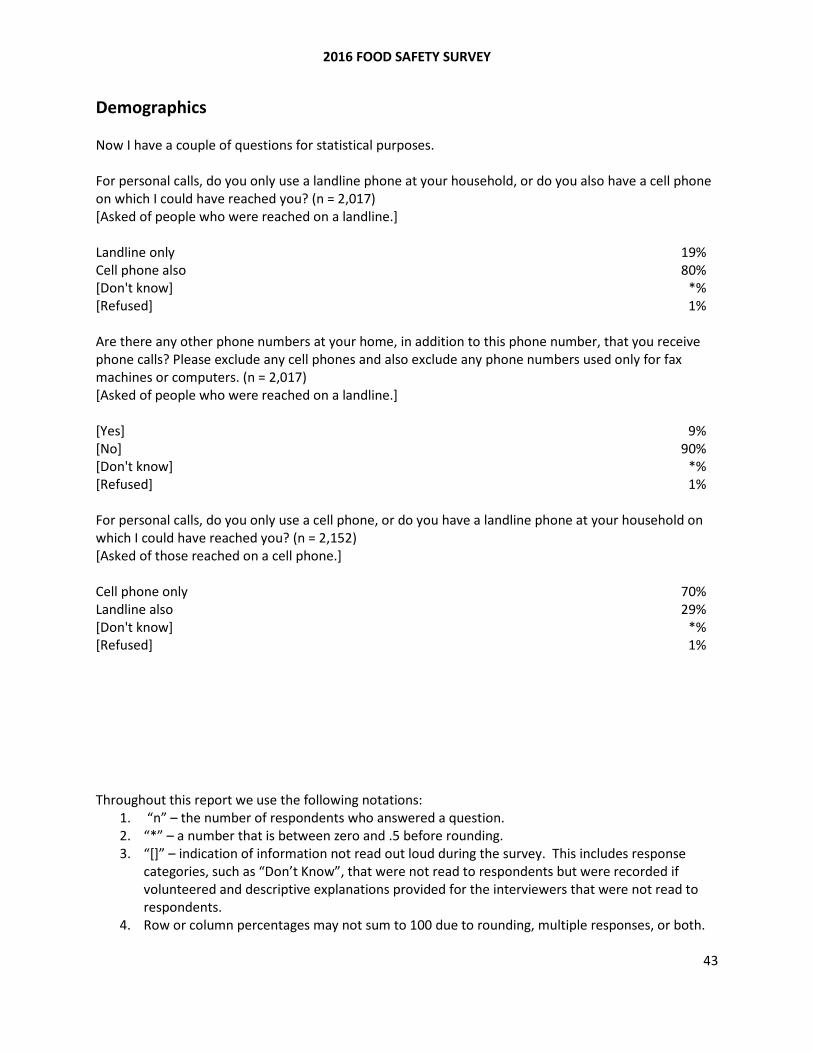
Demographics Now I have a couple of questions for statistical purposes. For personal calls, do you only use a landline phone at your household, or do you also have a cell phone on which I could have reached you? (n = 2,017) [Asked of people who were reached on a landline.] Landline only 19% Cell phone also 80% [Don't know] *% [Refused] 1% Are there any other phone numbers at your home, in addition to this phone number, that you receive phone calls? Please exclude any cell phones and also exclude any phone numbers used only for fax machines or computers. (n = 2,017) [Asked of people who were reached on a landline.] [Yes] 9% [No] 90% [Don't know] *% [Refused] 1% For personal calls, do you only use a cell phone, or do you have a landline phone at your household on which I could have reached you? (n = 2,152) [Asked of those reached on a cell phone.] Cell phone only 70% Landline also 29% [Don't know] *% [Refused] 1%

2016 FOOD SAFETY SURVEY
Throughout this report we use the following notations: 1. “n” – the number of respondents who answered a question. 2. “*” – a number that is between zero and .5 before rounding. 3. “[]” – indication of information not read out loud during the survey. This includes response
categories, such as “Don’t Know”, that were not read to respondents but were recorded if volunteered and descriptive explanations provided for the interviewers that were not read to respondents.
4. Row or column percentages may not sum to 100 due to rounding, multiple responses, or both.
44
How many total people, including yourself, live in your household? (n = 4,169) [1] 13% [2] 30% [3] 19% [4] 19% [5] 11% [6] 4% [7] 2% [8] 1% [9 +] *% [Don't know] *% [Refused] 1% How many of these people [in your household] are children five years and younger? (n = 4,169) [0] 69% [1] 12% [2] 5% [3] 1% [4 +] *% [Don't know] *% [Refused] 14% How many of these people [in your household] are children between 6 and 17 years? (n = 4,169) [0] 58% [1] 14% [2] 9% [3] 3% [4] 1% [5 +] *% [Don't know] *% [Refused] 14%
2016 FOOD SAFETY SURVEY
Throughout this report we use the following notations: 1. “n” – the number of respondents who answered a question. 2. “*” – a number that is between zero and .5 before rounding. 3. “[]” – indication of information not read out loud during the survey. This includes response
categories, such as “Don’t Know”, that were not read to respondents but were recorded if volunteered and descriptive explanations provided for the interviewers that were not read to respondents.
4. Row or column percentages may not sum to 100 due to rounding, multiple responses, or both.
45
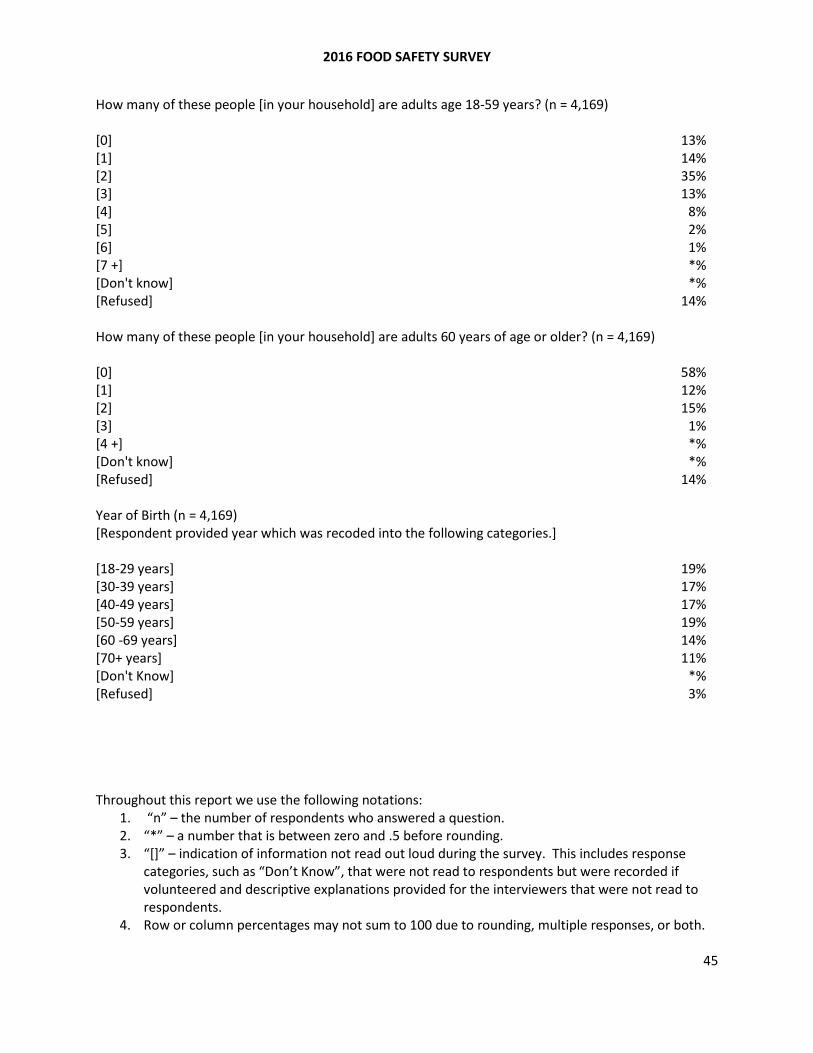
How many of these people [in your household] are adults age 18-59 years? (n = 4,169) [0] 13% [1] 14% [2] 35% [3] 13% [4] 8% [5] 2% [6] 1% [7 +] *% [Don't know] *% [Refused] 14% How many of these people [in your household] are adults 60 years of age or older? (n = 4,169) [0] 58% [1] 12% [2] 15% [3] 1% [4 +] *% [Don't know] *% [Refused] 14% Year of Birth (n = 4,169) [Respondent provided year which was recoded into the following categories.] [18-29 years] 19% [30-39 years] 17% [40-49 years] 17% [50-59 years] 19% [60 -69 years] 14% [70+ years] 11% [Don't Know] *% [Refused] 3%
2016 FOOD SAFETY SURVEY
Throughout this report we use the following notations: 1. “n” – the number of respondents who answered a question. 2. “*” – a number that is between zero and .5 before rounding. 3. “[]” – indication of information not read out loud during the survey. This includes response
categories, such as “Don’t Know”, that were not read to respondents but were recorded if volunteered and descriptive explanations provided for the interviewers that were not read to respondents.
4. Row or column percentages may not sum to 100 due to rounding, multiple responses, or both.
46
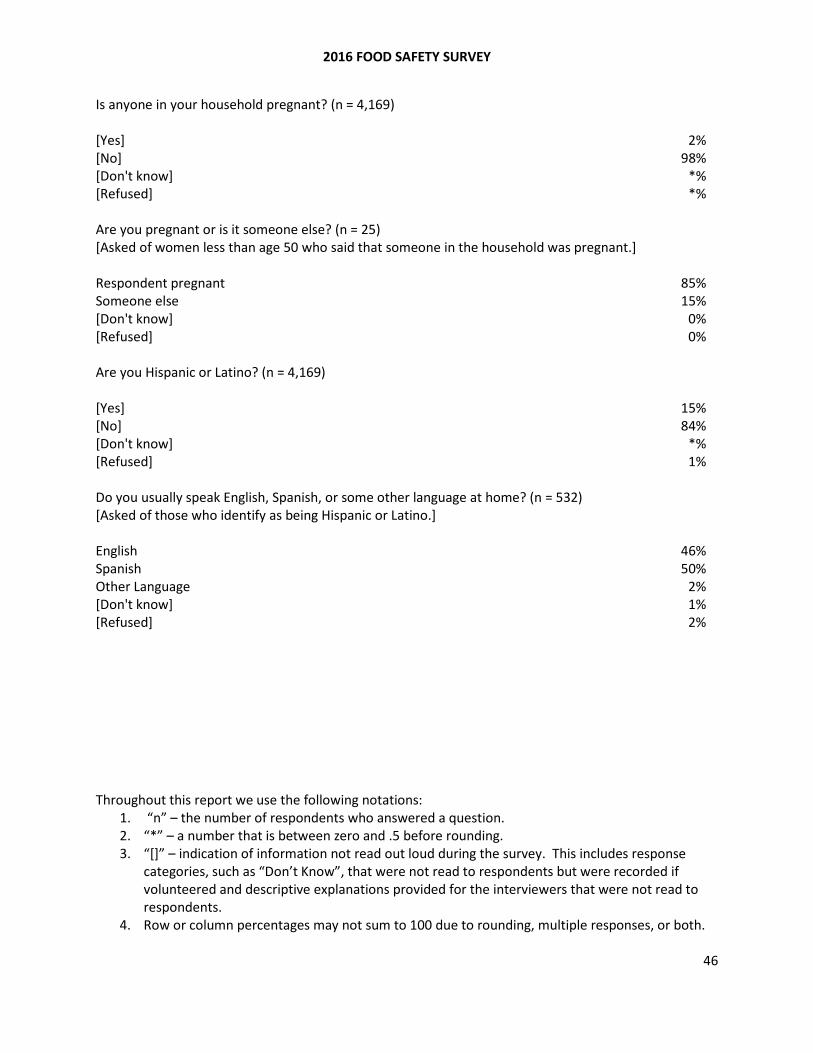
Is anyone in your household pregnant? (n = 4,169) [Yes] 2% [No] 98% [Don't know] *% [Refused] *% Are you pregnant or is it someone else? (n = 25) [Asked of women less than age 50 who said that someone in the household was pregnant.] Respondent pregnant 85% Someone else 15% [Don't know] 0% [Refused] 0% Are you Hispanic or Latino? (n = 4,169) [Yes] 15% [No] 84% [Don't know] *% [Refused] 1% Do you usually speak English, Spanish, or some other language at home? (n = 532) [Asked of those who identify as being Hispanic or Latino.] English 46% Spanish 50% Other Language 2% [Don't know] 1% [Refused] 2%
2016 FOOD SAFETY SURVEY
Throughout this report we use the following notations: 1. “n” – the number of respondents who answered a question. 2. “*” – a number that is between zero and .5 before rounding. 3. “[]” – indication of information not read out loud during the survey. This includes response
categories, such as “Don’t Know”, that were not read to respondents but were recorded if volunteered and descriptive explanations provided for the interviewers that were not read to respondents.
4. Row or column percentages may not sum to 100 due to rounding, multiple responses, or both.
47
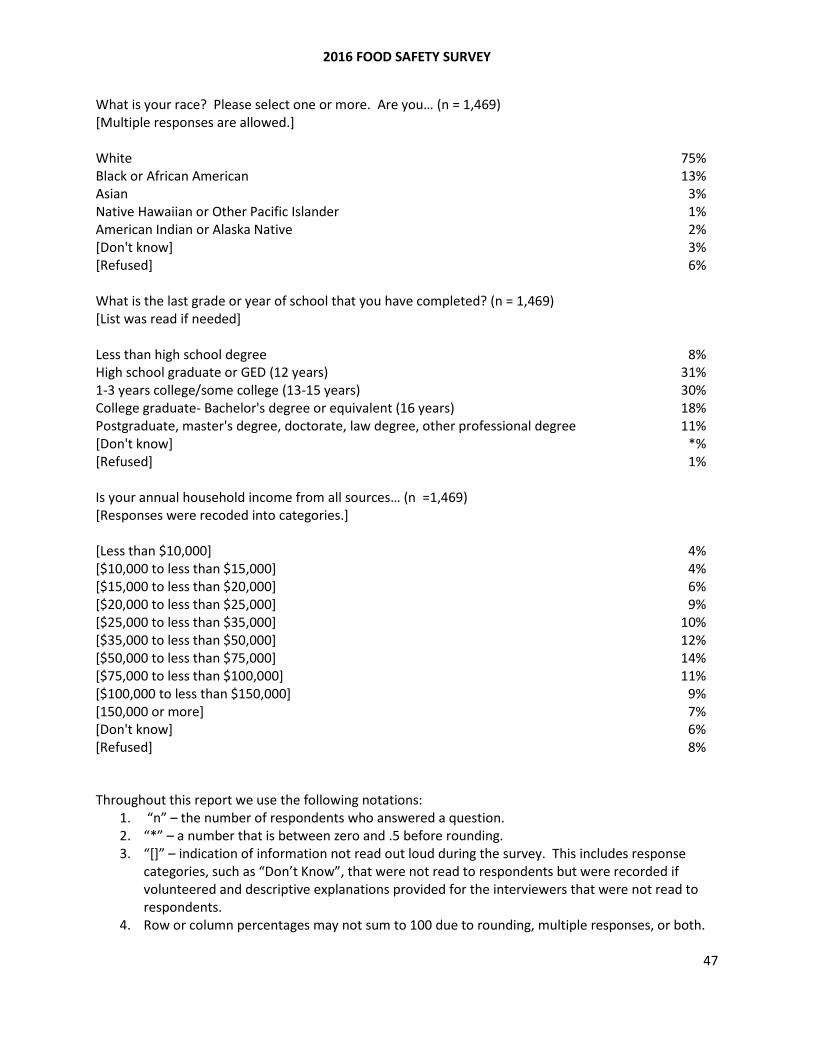
What is your race? Please select one or more. Are you… (n = 1,469) [Multiple responses are allowed.] White 75% Black or African American 13% Asian 3% Native Hawaiian or Other Pacific Islander 1% American Indian or Alaska Native 2% [Don't know] 3% [Refused] 6% What is the last grade or year of school that you have completed? (n = 1,469) [List was read if needed] Less than high school degree 8% High school graduate or GED (12 years) 31% 1-3 years college/some college (13-15 years) 30% College graduate- Bachelor's degree or equivalent (16 years) 18% Postgraduate, master's degree, doctorate, law degree, other professional degree 11% [Don't know] *% [Refused] 1% Is your annual household income from all sources… (n =1,469) [Responses were recoded into categories.] [Less than $10,000] 4% [$10,000 to less than $15,000] 4% [$15,000 to less than $20,000] 6% [$20,000 to less than $25,000] 9% [$25,000 to less than $35,000] 10% [$35,000 to less than $50,000] 12% [$50,000 to less than $75,000] 14% [$75,000 to less than $100,000] 11% [$100,000 to less than $150,000] 9% [150,000 or more] 7% [Don't know] 6% [Refused] 8%

2016 FOOD SAFETY SURVEY
Throughout this report we use the following notations: 1. “n” – the number of respondents who answered a question. 2. “*” – a number that is between zero and .5 before rounding. 3. “[]” – indication of information not read out loud during the survey. This includes response
categories, such as “Don’t Know”, that were not read to respondents but were recorded if volunteered and descriptive explanations provided for the interviewers that were not read to respondents.
4. Row or column percentages may not sum to 100 due to rounding, multiple responses, or both.
48
[This question was coded by the Interviewer:] Sex of respondent: (n = 4,169) [Male] 48% [Female] 52%
2016 FOOD SAFETY SURVEY
49
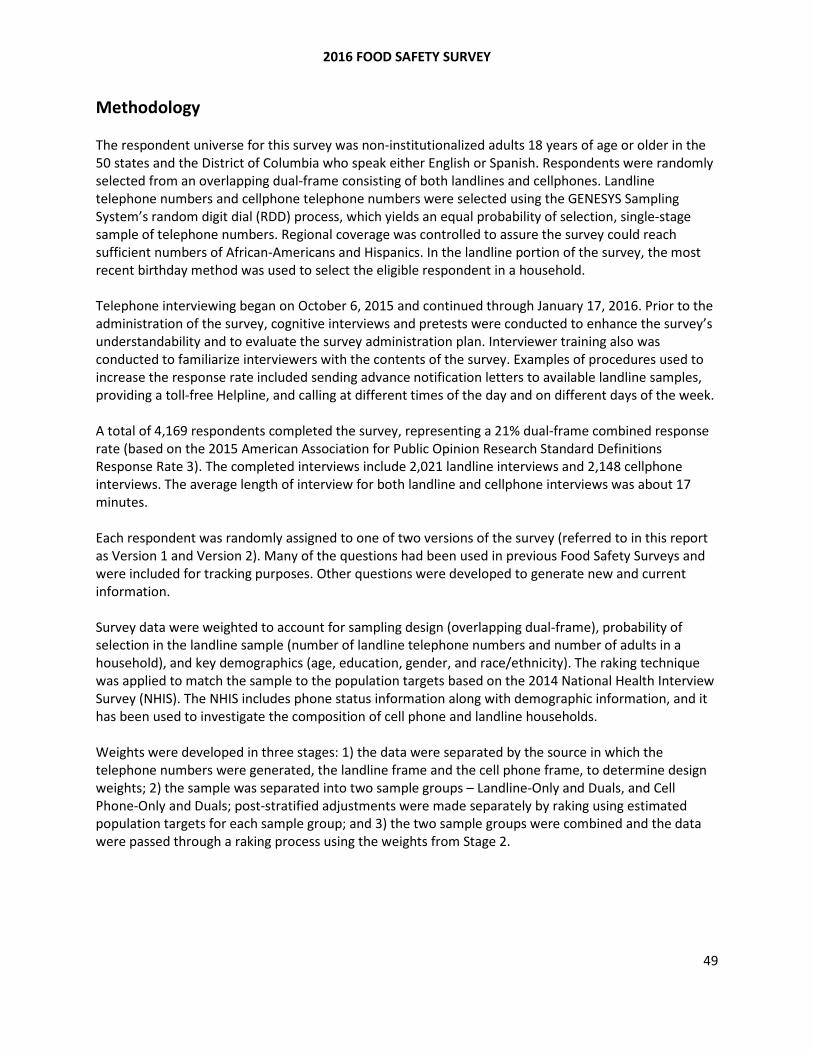
Methodology The respondent universe for this survey was non-institutionalized adults 18 years of age or older in the 50 states and the District of Columbia who speak either English or Spanish. Respondents were randomly selected from an overlapping dual-frame consisting of both landlines and cellphones. Landline telephone numbers and cellphone telephone numbers were selected using the GENESYS Sampling System’s random digit dial (RDD) process, which yields an equal probability of selection, single-stage sample of telephone numbers. Regional coverage was controlled to assure the survey could reach sufficient numbers of African-Americans and Hispanics. In the landline portion of the survey, the most recent birthday method was used to select the eligible respondent in a household. Telephone interviewing began on October 6, 2015 and continued through January 17, 2016. Prior to the administration of the survey, cognitive interviews and pretests were conducted to enhance the survey’s understandability and to evaluate the survey administration plan. Interviewer training also was conducted to familiarize interviewers with the contents of the survey. Examples of procedures used to increase the response rate included sending advance notification letters to available landline samples, providing a toll-free Helpline, and calling at different times of the day and on different days of the week. A total of 4,169 respondents completed the survey, representing a 21% dual-frame combined response rate (based on the 2015 American Association for Public Opinion Research Standard Definitions Response Rate 3). The completed interviews include 2,021 landline interviews and 2,148 cellphone interviews. The average length of interview for both landline and cellphone interviews was about 17 minutes. Each respondent was randomly assigned to one of two versions of the survey (referred to in this report as Version 1 and Version 2). Many of the questions had been used in previous Food Safety Surveys and were included for tracking purposes. Other questions were developed to generate new and current information. Survey data were weighted to account for sampling design (overlapping dual-frame), probability of selection in the landline sample (number of landline telephone numbers and number of adults in a household), and key demographics (age, education, gender, and race/ethnicity). The raking technique was applied to match the sample to the population targets based on the 2014 National Health Interview Survey (NHIS). The NHIS includes phone status information along with demographic information, and it has been used to investigate the composition of cell phone and landline households. Weights were developed in three stages: 1) the data were separated by the source in which the telephone numbers were generated, the landline frame and the cell phone frame, to determine design weights; 2) the sample was separated into two sample groups – Landline-Only and Duals, and Cell Phone-Only and Duals; post-stratified adjustments were made separately by raking using estimated population targets for each sample group; and 3) the two sample groups were combined and the data were passed through a raking process using the weights from Stage 2.