2016 financial fact book - s2.q4cdn.com · pdf file2016 financial fact book . contents...
TRANSCRIPT

NYSE: WMT
Wal-Mart Stores, Inc. Fact Book – Fiscal 2016 April 20, 2016 NYSE: WMT
2016 Financial Fact Book
Contents
Wal-Mart Stores, Inc. (WMT: NYSE) helps people around the world save money and live better - anytime and anywhere - in retail stores, online, and through their mobile devices. Each week, nearly 260 million customers and members visit our 11,528 stores under 63 banners in 28 countries and e-commerce websites in 11 countries. With fiscal year 2016 revenue of $482.1 billion, Walmart employs approximately 2.3 million associates worldwide. Walmart continues to be a leader in sustainability, corporate philanthropy and employment opportunity. Additional information about Walmart can be found by visiting http://corporate.walmart.com on Facebook at http://facebook.com/walmart and on Twitter at http://twitter.com/walmart.*
Investor Relations Contact Pauline Mohler Senior Director - Global Investor Relations 479-277-0218 Media Contact Randy Hargrove Director - National Media Relations 1-800-331-0085
Home Office
Wal-Mart Stores, Inc. 702 SW 8th Street Bentonville, AR 72716 Tel: 479-273-4000 Fax: 479-277-1830 http://corporate.walmart.com/
Walmart U.S. Home Office
Walmart U.S. 702 SW 8th Street Bentonville, AR 72716
Sam’s Club Home Office
Sam’s Club 2101 S.E. Simple Savings Dr. Bentonville, AR 72716
Walmart International Home Office
Walmart International Support Center 702 SW 8th Street Bentonville, AR 72716
Walmart eCommerce Home Office
Walmart eCommerce 850 Cherry Avenue San Bruno, CA 94066
Wal-Mart Stores, Inc.
* As of January 31, 2016 The amounts shown in this Fact Book are based on the most recently publically disclosed documents for fiscal 2016.
Page Contents
1 Description and Contacts
2 3-Year Growth Plan
3-5 Financial Overview
6 Stock Performance & Returns
7-8 Consolidated Statements of Income
9 Consolidated Balance Sheets
10 Consolidated Statements of Cash Flow
11 Opportunity, Sustainability, Community
12 Forward Looking Statements
Walmart Global eCommerce Retail Sites walmart.com samsclub.com walmart.ca walmart.com.br walmartchile.cl wal-mart.com.ar walmart.com.mx sams.com.mx superama.com.mx asda.com makro.co.za dionwired.co.za the-seiyu.com samsclub.cn yhd.com bestpricewholesale.co.in
1

Wal-Mart Stores, Inc. 3-Year Growth Plan
We’ll be the first to deliver a seamless shopping experience at scale.
No matter how you choose to shop at Walmart – in stores, online, mobile or a combination – it will be fast and easy.
2
Over the next three years we project we will add approximately $45 - $60B in new sales on a constant currency basis.
Our Strategy
Winning with Stores
Deepening Digital
Relationships with Customers
Adding Critical Capabilities
Our 5 Growth Areas
Delivering Value Providing
Convenience Being Great Merchants
In Key Geographies
Appealing to a Blend of Income
Levels

Financial Overview
3
56% 56% 56%
11% 11% 10%
9% 10% 11%
9% 9% 9% 8% 7% 7% 7% 7% 7%
0%
20%
40%
60%
80%
100%
FY16 FY15 FY14
Walmart U.S. Merchandise Category - % of Net Sales
Grocery* Health and wellness Entertainment
Hardlines Apparel Home
62% 26%
12%
Net Sales by Segment - FY16
Walmart U.S. Walmart International Sam's Club
59% 57% 56%
20% 23% 23%
9% 8% 8%
7% 7% 8% 5% 5% 5%
0%
20%
40%
60%
80%
100%
FY16 FY15 FY14
Sam's Club Merchandise Category - % of Net Sales
Grocery and consumables Fuel and other categories
Home and apparel Technology, office and entertainment
Health and wellness
* Walmart U.S. grocery consists of a full line of grocery items, including meat, produce, natural & organics, deli & bakery, dairy, frozen foods, alcoholic and nonalcoholic beverages, floral and dry grocery, as well as consumables such as health and beauty aids, baby products, household chemicals, paper goods and pet supplies

Financial Overview
* The company’s e-commerce sales impact includes those sales initiated through the company’s websites and fulfilled through the company’s dedicated e-commerce distribution facilities, as well as an estimate for sales initiated online, but fulfilled through the company’s stores and clubs. ** 14-week period *** Top 5 International markets by size. Results are on a constant currency basis. Source: Quarterly earnings presentations and releases 4
U.S. Quarterly Comparable Store Sales Results without fuel (4-5-4 Retail Calendar)
Fiscal Years Ended January 31
Comp-Store Sales Q4 Q3 Q2 Q1 Q4 Q3 Q2 Q1 Q4** Q3 Q2 Q1
Walmart U.S. 0.6% 1.5% 1.5% 1.1% 1.5% 0.5% 0.0% -0.1% -0.4% -0.3% -0.3% -1.4%
Neighborhood Market 7.0% 8.0% 7.3% 7.9% 7.7% 5.5% 5.6% 5.0% 5.0% 3.4% N/A N/A
Sam's Club -0.5% 0.4% 1.3% 0.4% 2.0% 0.4% 0.0% -0.5% -0.1% 1.1% 1.7% 0.2%
e-Commerce Impact* Q4 Q3 Q2 Q1 Q4 Q3 Q2 Q1 Q4 Q3 Q2 Q1
Walmart U.S. 0.3% 0.15% 0.2% 0.2% 0.3% 0.2% 0.3% 0.3% 0.3% 0.2% N/A N/A
Sam's Club 0.8% 0.6% 0.6% 0.4% 0.4% 0.2% 0.3% 0.2% 0.4% 0.2% N/A N/A
Quarterly Traffic/Ticket Trends (4-5-4 Retail Calendar)
Fiscal Years Ended January 31
Walmart U.S. Q4 Q3 Q2 Q1 Q4 Q3 Q2 Q1 Q4 Q3 Q2 Q1
Traffic 0.7% 1.7% 1.3% 1.0% 1.4% -0.7% -1.1% -1.4% -1.7% -0.4% -0.5% -1.8%
Ticket -0.1% -0.2% 0.2% 0.1% 0.1% 1.2% 1.1% 1.3% 1.3% 0.1% 0.2% 0.4%
Sam's Club Q4 Q3 Q2 Q1 Q4 Q3 Q2 Q1 Q4 Q3 Q2 Q1
Traffic -1.4% -0.3% 0.5% -0.2% 1.5% 0.2% 0.3% -0.2% 1.2% 2.4% 2.7% 1.3%
Ticket 0.9% 0.7% 0.8% 0.6% 0.5% 0.2% -0.3% -0.3% -1.3% -1.3% -1.0% -1.1%
FY2016 International Comparable Store Sales & Traffic/TicketFiscal Years Ended January 31
WMT International*** Q4 Q3 Q2 Q1 Q4 Q3 Q2 Q1 Q4 Q3 Q2 Q1
UK -5.5% -4.6% -5.2% -3.3% -5.7% -4.2% -3.3% -2.2% 0.2% -0.4% -1.9% -1.1%
Mexico 8.0% 5.9% 5.1% 5.3% 1.2% —% -0.2% -1.0% 6.8% 5.9% 5.3% 6.3%
Canada 4.3% 4.3% 3.9% 1.8% 2.0% 1.9% 1.0% 0.1% 2.3% 2.4% 2.9% 1.7%
Brazil 0.8% -0.6% -1.0% 3.0% -3.5% -3.1% -1.4% -1.1% 4.3% 2.5% 0.4% 4.1%
China -3.0% -0.7% -1.4% 0.4% -8.5% -6.9% -7.5% -8.9% 5.5% 6.2% 6.1% 9.3%
FY14
FY14FY15
FY15FY16
FY16
FY16 Comps FY16 TicketFY16 Traffic
FY15 FY14FY16
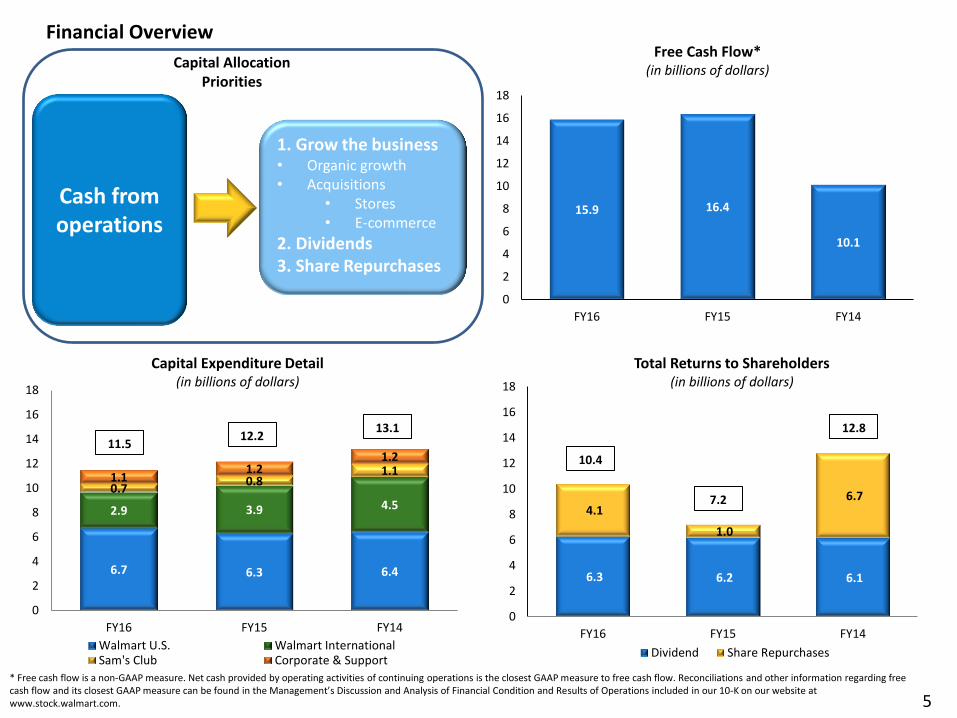
Financial Overview
* Free cash flow is a non-GAAP measure. Net cash provided by operating activities of continuing operations is the closest GAAP measure to free cash flow. Reconciliations and other information regarding free cash flow and its closest GAAP measure can be found in the Management’s Discussion and Analysis of Financial Condition and Results of Operations included in our 10-K on our website at www.stock.walmart.com.
5
Cash from operations
1. Grow the business • Organic growth • Acquisitions
• Stores • E-commerce
2. Dividends 3. Share Repurchases
Capital Allocation Priorities
6.3 6.2 6.1
4.1
1.0
6.7
0
2
4
6
8
10
12
14
16
18
FY16 FY15 FY14
Total Returns to Shareholders (in billions of dollars)
Dividend Share Repurchases
12.8
7.2
10.4
15.9 16.4
10.1
0
2
4
6
8
10
12
14
16
18
FY16 FY15 FY14
Free Cash Flow* (in billions of dollars)
6.7 6.3 6.4
2.9 3.9 4.5
0.7 0.8
1.1 1.1 1.2
1.2
0
2
4
6
8
10
12
14
16
18
FY16 FY15 FY14
Capital Expenditure Detail (in billions of dollars)
Walmart U.S. Walmart InternationalSam's Club Corporate & Support
13.1 12.2
11.5

$2.00
6
$0.00
$0.50
$1.00
$1.50
$2.00
$2.50
FY07 FY08 FY09 FY10 FY11 FY12 FY13 FY14 FY15 FY16 FY17
WMT Dividend
* Current FY ** As of close of the last trading day of fiscal 2016 *** Return on equity is defined as income from continuing operations divided by average total equity
-30.0%
-20.0%
-10.0%
0.0%
10.0%
20.0%
FY06 FY07 FY08 FY09 FY10 FY11 FY12 FY13 FY14 FY15 FY16
WMT Total Shareholder Return
-20.4%
WAL-MART STORES, INC.
Stock Performance & Returns
FY17* FY16 FY15 FY14 FY13 FY12 FY11 FY10 FY09 FY08 FY07 FY06
Stock Price
High N/A $88.00 $90.97 $81.37 $77.60 $62.00 $57.90 $55.20 $63.85 $51.44 $52.15 $53.51
Low N/A $56.30 $72.27 $68.13 $57.18 $48.31 $47.77 $46.25 $46.92 $42.09 $42.31 $42.49
Dividend
Declared $2.00 $1.96 $1.92 $1.88 $1.59 $1.46 $1.21 $1.09 $0.95 $0.88 $0.67 $0.60
Yield** N/A 2.95% 2.26% 2.52% 2.27% 2.38% 2.16% 2.04% 2.02% 1.73% 1.40% 1.30%
Price to Earnings** N/A 14.5 17.0 15.3 14.0 13.5 12.8 14.3 14.1 16.1 16.3 17.0
Return on Equity*** N/A 17.8% 20.1% 20.3% 21.7% 20.8% 21.7% 20.8% 20.5% 20.5% 21.3% 22.2%
Total Shareholder Return N/A -20.4% 16.6% 9.4% 16.8% 12.5% 7.4% 15.9% -5.5% 8.4% 5.0% -10.9%

7
Fiscal Years Ended January 31,
(Amounts in millions, except per share data) 2016 2015 2014
Revenues: Net sales $ 478,614 $ 482,229 $ 473,076 Membership and other income 3,516 3,422 3,218
Total revenues 482,130 485,651 476,294 Costs and expenses:
Cost of sales 360,984 365,086 358,069 Operating, selling, general and administrative expenses 97,041 93,418 91,353
Operating income 24,105 27,147 26,872 Interest:
Debt 2,027 2,161 2,072 Capital lease and financing obligations 521 300 263 Interest income (81 ) (113 ) (119 )
Interest, net 2,467 2,348 2,216 Income from continuing operations before income taxes 21,638 24,799 24,656 Provision for income taxes: Current 7,584 8,504 8,619 Deferred (1,026 ) (519 ) (514 )
Total provision for income taxes 6,558 7,985 8,105 Income from continuing operations 15,080 16,814 16,551 Income from discontinued operations, net of income taxes — 285 144
Consolidated net income 15,080 17,099 16,695 Consolidated net income attributable to noncontrolling interest (386 ) (736 ) (673 )
Consolidated net income attributable to Walmart $ 14,694 $ 16,363 $ 16,022
Basic net income per common share:
Basic income per common share from continuing operations attributable to Walmart $ 4.58 $ 5.01 $ 4.87 Basic income per common share from discontinued operations attributable to Walmart — 0.06 0.03
Basic net income per common share attributable to Walmart $ 4.58 $ 5.07 $ 4.90
Diluted net income per common share:
Diluted income per common share from continuing operations attributable to Walmart $ 4.57 $ 4.99 $ 4.85 Diluted income per common share from discontinued operations attributable to Walmart — 0.06 0.03
Diluted net income per common share attributable to Walmart $ 4.57 $ 5.05 $ 4.88
Weighted-average common shares outstanding:
Basic 3,207 3,230 3,269 Diluted 3,217 3,243 3,283
Dividends declared per common share $ 1.96 $ 1.92 $ 1.88
Wal-Mart Stores, Inc. Consolidated Statements of Income
Includes excerpts from audited financial statements. See full 10-K at www.stock.walmart.com.

(1) The sum of quarterly income per common share attributable to Walmart data may not agree to annual amounts due to rounding. Includes excerpts from audited financial statements. See full 10-K at www.stock.walmart.com.
8
Fiscal Year Ended January 31, 2016
(Amounts in millions, except per share data) Q1 Q2 Q3 Q4 Total
Total revenues $ 114,826 $ 120,229 $ 117,408 $ 129,667 $ 482,130 Net sales 114,002 119,330 116,598 128,684 478,614
Cost of sales 86,483 90,056 87,446 96,999 360,984
Income from continuing operations 3,283 3,635 3,414 4,748 15,080
Consolidated net income 3,283 3,635 3,414 4,748 15,080
Consolidated net income attributable to Walmart 3,341 3,475 3,304 4,574 14,694
Basic net income per common share attributable to Walmart 1.03 1.08 1.03 1.44 4.58
Diluted net income per common share attributable to Walmart 1.03 1.08 1.03 1.43 4.57
Fiscal Year Ended January 31, 2015
Q1 Q2 Q3 Q4 Total
Total revenues $ 114,960 $ 120,125 $ 119,001 $ 131,565 $ 485,651 Net sales 114,167 119,336 118,076 130,650 482,229
Cost of sales 86,714 90,010 89,247 99,115 365,086
Income from continuing operations 3,711 4,089 3,826 5,188 16,814
Consolidated net income 3,726 4,359 3,826 5,188 17,099
Consolidated net income attributable to Walmart 3,593 4,093 3,711 4,966 16,363
Basic net income per common share(1):
Basic income per common share from continuing operations
attributable to Walmart 1.10
1.22
1.15
1.54
5.01
Basic income (loss) per common share from discontinued operations attributable to Walmart
0.01 0.05
—
—
0.06
Basic net income per common share attributable to Walmart 1.11 1.27 1.15 1.54 5.07
Diluted net income per common share(1):
Diluted income per common share from continuing operations
attributable to Walmart 1.10
1.21
1.15
1.53
4.99
Diluted income (loss) per common share from discontinued operations attributable to Walmart
0.01 0.05
—
—
0.06
Diluted net income per common share attributable to Walmart 1.11 1.26 1.15 1.53 5.05
Wal-Mart Stores, Inc. Quarterly Consolidated Statements of Income

9
Wal-Mart Stores, Inc. Consolidated Balance Sheets
Fiscal Years Ended January 31,
(Amounts in millions) 2016 2015
ASSETS Current assets:
Cash and cash equivalents $ 8,705 $ 9,135
Receivables, net 5,624 6,778
Inventories 44,469 45,141
Prepaid expenses and other 1,441 2,224
Total current assets 60,239 63,278 Property and equipment:
Property and equipment 176,958 177,395
Less accumulated depreciation (66,787 ) (63,115 )
Property and equipment, net 110,171 114,280 Property under capital lease and financing obligations:
Property under capital lease and financing obligations 11,096 5,239
Less accumulated amortization (4,751 ) (2,864 )
Property under capital lease and financing obligations, net 6,345 2,375
Goodwill 16,695 18,102
Other assets and deferred charges 6,131 5,455
Total assets $ 199,581 $ 203,490
LIABILITIES AND EQUITY Current liabilities:
Short-term borrowings $ 2,708 $ 1,592
Accounts payable 38,487 38,410
Accrued liabilities 19,607 19,152
Accrued income taxes 521 1,021
Long-term debt due within one year 2,745 4,791
Capital lease and financing obligations due within one year 551 287
Total current liabilities 64,619 65,253
Long-term debt 38,214 40,889
Long-term capital lease and financing obligations 5,816 2,606
Deferred income taxes and other 7,321 8,805
Commitments and contingencies
Equity:
Common stock 317 323
Capital in excess of par value 1,805 2,462
Retained earnings 90,021 85,777
Accumulated other comprehensive income (loss) (11,597 ) (7,168 )
Total Walmart shareholders' equity 80,546 81,394 Nonredeemable noncontrolling interest 3,065 4,543
Total equity 83,611 85,937
Total liabilities and equity $ 199,581 $ 203,490
Includes excerpts from audited financial statements. See full 10-K at www.stock.walmart.com.

10
Wal-Mart Stores, Inc. Consolidated Statements of Cash Flows Fiscal Years Ended January 31,
(Amounts in millions) 2016 2015 2014
Cash flows from operating activities: Consolidated net income $ 15,080 $ 17,099 $ 16,695 Income from discontinued operations, net of income taxes — (285 ) (144 )
Income from continuing operations 15,080 16,814 16,551 Adjustments to reconcile income from continuing operations to net cash provided by operating activities:
Depreciation and amortization 9,454 9,173 8,870 Deferred income taxes (672 ) (503 ) (279 )
Other operating activities 1,410 785 938 Changes in certain assets and liabilities, net of effects of acquisitions:
Receivables, net (19 ) (569 ) (566 )
Inventories (703 ) (1,229 ) (1,667 )
Accounts payable 2,008 2,678 531 Accrued liabilities 1,303 1,249 103 Accrued income taxes (472 ) 166 (1,224 )
Net cash provided by operating activities 27,389 28,564 23,257
Cash flows from investing activities:
Payments for property and equipment (11,477 ) (12,174 ) (13,115 )
Proceeds from disposal of property and equipment 635 570 727 Proceeds from disposal of certain operations 246 671 — Other investing activities (79 ) (192 ) (138 )
Net cash used in investing activities (10,675 ) (11,125 ) (12,526 )
Cash flows from financing activities:
Net change in short-term borrowings 1,235 (6,288 ) 911 Proceeds from issuance of long-term debt 39 5,174 7,072 Payments of long-term debt (4,432 ) (3,904 ) (4,968 )
Dividends paid (6,294 ) (6,185 ) (6,139 )
Purchase of Company stock (4,112 ) (1,015 ) (6,683 )
Dividends paid to noncontrolling interest (719 ) (600 ) (426 )
Purchase of noncontrolling interest (1,326 ) (1,844 ) (296 )
Other financing activities (513 ) (409 ) (260 )
Net cash used in financing activities (16,122 ) (15,071 ) (10,789 )
Effect of exchange rates on cash and cash equivalents (1,022 ) (514 ) (442 )
Net increase (decrease) in cash and cash equivalents (430 ) 1,854 (500 )
Cash and cash equivalents at beginning of year 9,135 7,281 7,781
Cash and cash equivalents at end of period $ 8,705 $ 9,135 $ 7,281
Supplemental disclosure of cash flow information: Income taxes paid 8,111 8,169 8,641 Interest paid 2,540 2,433 2,362
Non-Cash Investing and Financing Activities: Property and equipment acquired through capital lease and financing obligations
Includes excerpts from audited financial statements. See full 10-K at www.stock.walmart.com.

Increase economic opportunity
Priorities
• Enhance economic mobility and
inclusion of associates, frontline retail
workers and workers in supply chains
• Promote growth of suppliers, local
manufacturing and small businesses –
especially women-owned, diverse
Opportunity
Enhance sustainability of
global supply chains
Priorities
• Reduce energy intensity and emissions
in our operations and the supply chain
• Move to a zero waste future across the
supply chain
• Help preserve natural resources,
especially forests, water and land
• Help create a more affordable,
sustainable and healthy food system
• Promote transparency and quality in our
products we sell
• Support the safety and dignity of
workers everywhere
Sustainability
Strengthen local communities
Priorities
• Enhance disaster resilience in
communities
• Develop communities through
engagement of associates, customers
and the company
Community
11 Includes excerpts from the Global Responsibility Report. See full GRR at www.stock.walmart.com.
Global Responsibility Report Highlights

Forward Looking Statements
Walmart includes the following cautionary statement so that any forward-looking statements made by or on behalf of Walmart will enjoy the safe harbor protection of the PRIVATE SECURITIES LITIGATION REFORM ACT OF 1995, as amended. Such forward-looking statements, which will describe our objectives, plans, goals, targets or expectations, can be identified by our use of word or phrases such as “anticipate,” “estimate,” “expect,” “forecast,” “goal,” “plan,” “projected,” “will be,” “will continue,” “will deliver,” “will have,” “project to,” “will sell,” or words or phrases of similar import. Statements of our expectations for FY17, and any subsequent fiscal years are forward-looking. Walmart’s actual results might differ materially from those expressed or implied in a forward-looking statement as a result of factors including, among other, cost of goods, competitive pressures and initiatives, inflation, deflation, consumer spending patterns, debt levels, credit access and disposable income, consumer acceptance of our merchandise offerings, programs and initiatives, availability of adequate volumes of particular merchandise from suppliers, availability of skilled and experienced labor in our markets, performance of our workforce, trade restrictions, tariff and freight rate changes, capital market conditions, weather conditions, storm-related damages to facilities, customer traffic, changes in laws and regulations, our cash flows and access to the capital markets, our ability to implement certain plans and programs within our stores and on our retail website and mobile commerce applications, unanticipated changes in our strategy, plans and focus with respect to any matter and other risks set forth in our SEC filings. Our most recent Annual Report on Form 10-K and our other filings with the SEC contain more information concerning factors that, along with changes in facts, assumptions not being realized or other circumstances, could cause actual results to differ materially from those expressed or implied in a forward-looking statement. Walmart undertakes no obligation to update any forward-looking statement to reflect subsequent events except to the extent required by applicable law.
12