2016 georgia k-12 teacher and leader workforce report · pdf filethe current k-12 teacher and...
TRANSCRIPT

2016 Georgia K-12 Teacher and Leader
Workforce Report Rosaline Tio
January 2017

ii
Executive Summary
The Georgia K-12 Teacher and Leader Workforce Report provides a snapshot of
the current K-12 teacher and leader workforce created at the request of the Alliance
of Education Agency Heads (AEAH). The report also examines teacher and leader
production, retention, and retirement patterns. The report incorporates data from
the Georgia Department of Education (GaDOE), the Georgia Professional
Standards Commission (GaPSC), and the Teachers Retirement System of Georgia
(TRS). The 2016 K-12 Teacher and Leader Workforce Report analyzes workforce,
production, retention, and retirement patterns for K-12 teachers and leaders during
the 2015-2016 school year.
Key findings include:
Current Status of the Workforce
o During the 2015-2016 school year, Georgia’s public education
workforce consisted of 110,059 teachers and 8,449 leaders.
o The majority (approximately 60%) of the teacher and leader
workforce was white.
o The share of black leaders (34%) was larger than the share of black
teachers (20%).
o The share of Hispanic leaders (4.4%) was lower than the share of
Hispanic teachers (9.2%).
o 44% of teachers held a Master’s degree as their highest earned
degree, and 53% of leaders held an Education Specialist degree as
their highest earned degree.
o Almost half of the teacher workforce had ten or fewer years of
experience working in Georgia public education. 25% of teachers
had five or fewer years of experience. Additionally, 21.9% of
teachers had eleven to fifteen years of experience.
o The majority of leaders had ten or fewer years of experience
working as a leader. 45% of all leaders had five or fewer years of
experience as a leader, and 27.5% of leaders had between six to ten
years of experience as a leader.
o High poverty schools had significantly larger shares of black
teachers and leaders and significantly smaller shares of white
teachers and leaders compared to low poverty schools.1
o 62.5% of all current certificate holders during the 2015-2016 school
year were employed as a teacher or leader, and 13.4% of all current
1 GOSA defined high poverty and low poverty schools by identifying the top and bottom quartile of
schools using free lunch direct certification percentages. The bottom quartile cut off was 23% of
students directly certified, and the top quartile cut off was 51% of students directly certified. For
more information on the use of direct certification percentages, see GOSA’s e-bulletin.
iii
certificate holders were not employed in the Georgia public
education workforce at all.
o 5,908 teachers (5.4% of all teachers) were new teachers in 2015-
2016, and 2,316 teachers (2.1%) returned to teaching after a break
in service.
o 1,060 leaders (12.5%) were new leaders in 2015-2016, and 45
leaders (0.5%) returned as a leader after a break in service.
o Hispanics comprised a larger share of new teachers and leaders
when compared to the entire teacher and leader workforce.
Teacher and Leader Production
o During the 2015-2016 school year, 19,428 teacher and leader
candidates were enrolled in Georgia preparation programs.
o 75% of teacher and leader candidates were enrolled in public in-state
programs, 15% were enrolled in private in-state programs, and 10%
were enrolled in alternative preparation programs.
o During 2015-2016, less than 10% of students in traditional
education preparation programs were employed as teachers while in
the program.
o 66% of completers in traditional educator preparation programs in
2014-2015 were employed as teachers as of October 2015. 85% of
completers in alternative preparation programs in 2014-2015 were
employed as of October 2015.
o 42% of completers in leader preparation programs in 2014-2015
were employed as leaders as of October 2015.
Teacher and Leader Mobility
o Between 2014-2015 and 2015-2016, 5% of teachers and 2% of
leaders changed school districts.
o Approximately 40% of teachers and leaders who changed school
districts had five or fewer years of experience working as a teacher
or leader, respectively.
o Between 2014-2015 and 2015-2016, 5% of teachers and 8% of
leaders changed schools within a district.
o High poverty schools had more teachers and leaders changing
schools from 2014-2015 to 2015-2016 than low poverty schools.
Teacher and Leader Retention
o 90.5% of teachers and leaders remained in their respective roles
from 2014-2015 to 2015-2016.
o High poverty schools do not retain as many teachers and leaders as
low poverty schools.
iv
o The retention rates for teachers and leaders with five or fewer years
of experience were a few percentage points lower than the retention
rates for all teachers and leaders.
Teacher and Leader Retirement
o As of 2015-2016, 80% of all school and district teachers, leaders,
and staff in TRS were active members.2
o 10% of all active teacher/leader/staff TRS members were eligible
for retirement or a reduced retirement benefit.
o Almost 50% of all active teacher/leader/staff TRS members had at
least ten years of service credit, but the majority of these members
were not yet eligible for retirement.
o 51% of all active teacher/leader/staff TRS members had fewer than
ten years of service credit.
2 Active members have made at least one contribution to TRS in the past four years.
v
Table of Contents
Executive Summary .............................................................................................. ii
Table of Figures and Tables ............................................................................... vii
Table of Abbreviations ...................................................................................... viii
Introduction ............................................................................................................9
Current Status of the Workforce ..........................................................................9
2015-2016 Teacher Workforce Characteristics....................................................9
Demographics ...................................................................................................9 Certificate Analysis.........................................................................................10 Years of Experience ........................................................................................12
District and School Analysis...........................................................................12 2015-2016 Leader Workforce Characteristics ...................................................17
Demographics .................................................................................................17
Certificate Analysis.........................................................................................17 Years of Experience ........................................................................................19
District and School Analysis...........................................................................20 Comparison of Current Workforce to All Certificate Holders ...........................22
Demographics .................................................................................................22 Certificate Analysis.........................................................................................23
2015-2016 Teacher New Hire Characteristics ...................................................25 Demographics .................................................................................................25
Certificate Analysis.........................................................................................26
2015-2016 New Leader Hire Characteristics .....................................................28 Demographics .................................................................................................28 Certificate Analysis.........................................................................................28
Years of Experience ........................................................................................30 2015-2016 Teacher Rehire Characteristics ........................................................31
Demographics .................................................................................................31 Certificate Analysis.........................................................................................32 Years of Experience ........................................................................................34
2015-2016 Leader Rehire Characteristics ..........................................................35 Demographics .................................................................................................35
Certificate Analysis.........................................................................................35 Years of Experience ........................................................................................36
Teacher and Leader Production .........................................................................37
Employment Patterns of Teacher and Leader Candidates and Completers .......37 2015-2016 Teacher and Leader Candidate Enrollment......................................39
Teacher and Leader Mobility .............................................................................40
Teacher Mobility ................................................................................................40
Inter-District Mobility ....................................................................................40 Intra-District Mobility ....................................................................................43 Teacher Mobility in High Poverty and Low Poverty Schools ........................45
vi
Leader Mobility ..................................................................................................46
Inter-District Mobility ....................................................................................46 Intra-District Mobility ....................................................................................46 Leader Mobility in High Poverty and Low Poverty Schools ..........................47
Teacher and Leader Retention ...........................................................................48
Retention of Teachers.........................................................................................48 Demographics .................................................................................................48 Certificate Analysis.........................................................................................49 District and School Analysis...........................................................................49
Retention of Recently Hired Teachers ...............................................................51 Demographics .................................................................................................51 Certificate Analysis.........................................................................................52
District Analysis .............................................................................................52 Retention of Leaders ..........................................................................................53
Demographics .................................................................................................53
Certificate Analysis.........................................................................................53 District Analysis .............................................................................................54
Retention of Recently Hired Leaders .................................................................54 Demographics .................................................................................................54 Certificate Analysis.........................................................................................55
District Analysis .............................................................................................55
Teacher and Leader Retirement .........................................................................56
Summary of Findings ..........................................................................................58
Acknowledgements ..............................................................................................61
vii
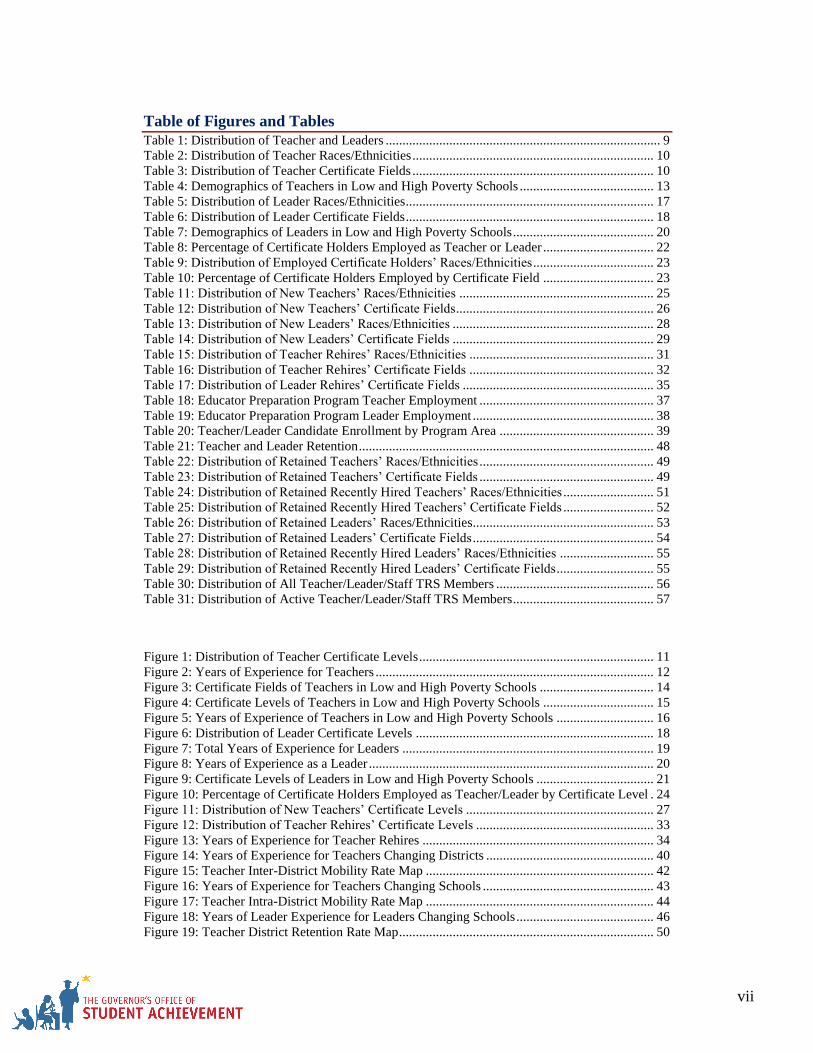
Table of Figures and Tables
Table 1: Distribution of Teacher and Leaders .................................................................................. 9 Table 2: Distribution of Teacher Races/Ethnicities ........................................................................ 10 Table 3: Distribution of Teacher Certificate Fields ........................................................................ 10 Table 4: Demographics of Teachers in Low and High Poverty Schools ........................................ 13 Table 5: Distribution of Leader Races/Ethnicities.......................................................................... 17 Table 6: Distribution of Leader Certificate Fields .......................................................................... 18 Table 7: Demographics of Leaders in Low and High Poverty Schools .......................................... 20 Table 8: Percentage of Certificate Holders Employed as Teacher or Leader ................................. 22 Table 9: Distribution of Employed Certificate Holders’ Races/Ethnicities .................................... 23 Table 10: Percentage of Certificate Holders Employed by Certificate Field ................................. 23 Table 11: Distribution of New Teachers’ Races/Ethnicities .......................................................... 25 Table 12: Distribution of New Teachers’ Certificate Fields ........................................................... 26 Table 13: Distribution of New Leaders’ Races/Ethnicities ............................................................ 28 Table 14: Distribution of New Leaders’ Certificate Fields ............................................................ 29 Table 15: Distribution of Teacher Rehires’ Races/Ethnicities ....................................................... 31 Table 16: Distribution of Teacher Rehires’ Certificate Fields ....................................................... 32 Table 17: Distribution of Leader Rehires’ Certificate Fields ......................................................... 35 Table 18: Educator Preparation Program Teacher Employment .................................................... 37 Table 19: Educator Preparation Program Leader Employment ...................................................... 38 Table 20: Teacher/Leader Candidate Enrollment by Program Area .............................................. 39 Table 21: Teacher and Leader Retention ........................................................................................ 48 Table 22: Distribution of Retained Teachers’ Races/Ethnicities .................................................... 49 Table 23: Distribution of Retained Teachers’ Certificate Fields .................................................... 49 Table 24: Distribution of Retained Recently Hired Teachers’ Races/Ethnicities ........................... 51 Table 25: Distribution of Retained Recently Hired Teachers’ Certificate Fields ........................... 52 Table 26: Distribution of Retained Leaders’ Races/Ethnicities ...................................................... 53 Table 27: Distribution of Retained Leaders’ Certificate Fields ...................................................... 54 Table 28: Distribution of Retained Recently Hired Leaders’ Races/Ethnicities ............................ 55 Table 29: Distribution of Retained Recently Hired Leaders’ Certificate Fields ............................. 55 Table 30: Distribution of All Teacher/Leader/Staff TRS Members ............................................... 56 Table 31: Distribution of Active Teacher/Leader/Staff TRS Members .......................................... 57
Figure 1: Distribution of Teacher Certificate Levels ...................................................................... 11 Figure 2: Years of Experience for Teachers ................................................................................... 12 Figure 3: Certificate Fields of Teachers in Low and High Poverty Schools .................................. 14 Figure 4: Certificate Levels of Teachers in Low and High Poverty Schools ................................. 15 Figure 5: Years of Experience of Teachers in Low and High Poverty Schools ............................. 16 Figure 6: Distribution of Leader Certificate Levels ....................................................................... 18 Figure 7: Total Years of Experience for Leaders ........................................................................... 19 Figure 8: Years of Experience as a Leader ..................................................................................... 20 Figure 9: Certificate Levels of Leaders in Low and High Poverty Schools ................................... 21 Figure 10: Percentage of Certificate Holders Employed as Teacher/Leader by Certificate Level . 24 Figure 11: Distribution of New Teachers’ Certificate Levels ........................................................ 27 Figure 12: Distribution of Teacher Rehires’ Certificate Levels ..................................................... 33 Figure 13: Years of Experience for Teacher Rehires ..................................................................... 34 Figure 14: Years of Experience for Teachers Changing Districts .................................................. 40 Figure 15: Teacher Inter-District Mobility Rate Map .................................................................... 42 Figure 16: Years of Experience for Teachers Changing Schools ................................................... 43 Figure 17: Teacher Intra-District Mobility Rate Map .................................................................... 44 Figure 18: Years of Leader Experience for Leaders Changing Schools ......................................... 46 Figure 19: Teacher District Retention Rate Map ............................................................................ 50
viii
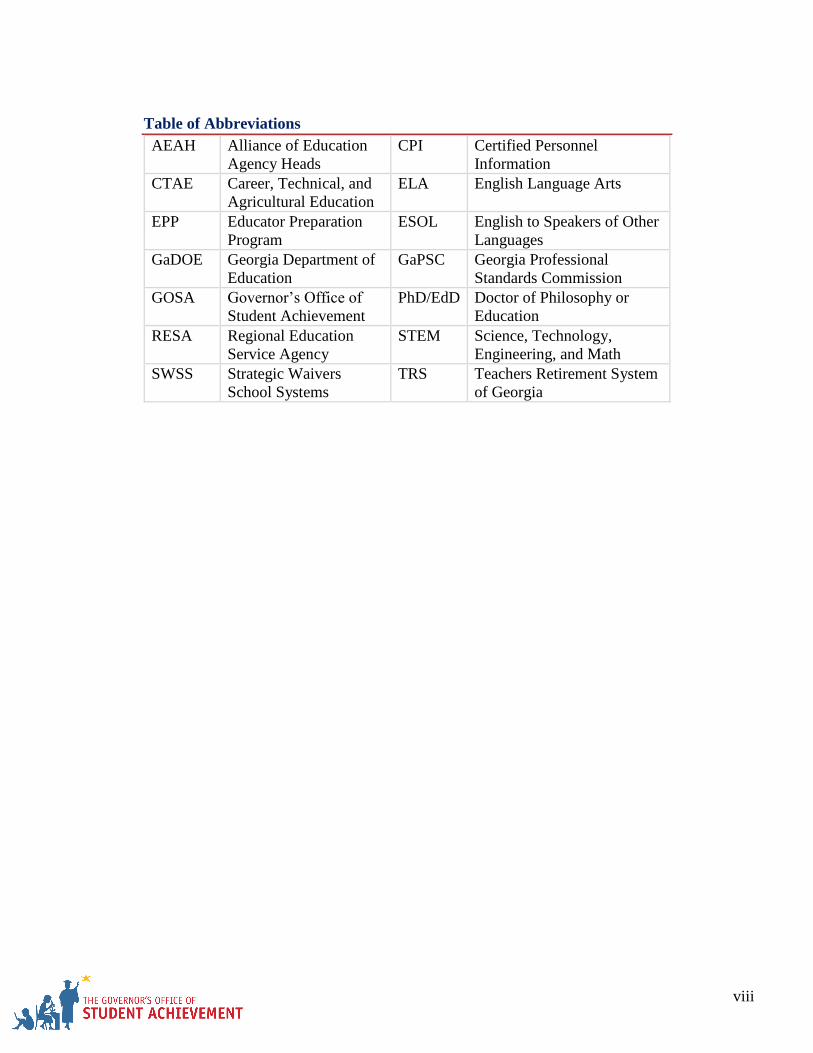
Table of Abbreviations
AEAH Alliance of Education
Agency Heads
CPI Certified Personnel
Information
CTAE Career, Technical, and
Agricultural Education
ELA English Language Arts
EPP Educator Preparation
Program
ESOL English to Speakers of Other
Languages
GaDOE Georgia Department of
Education
GaPSC Georgia Professional
Standards Commission
GOSA Governor’s Office of
Student Achievement
PhD/EdD Doctor of Philosophy or
Education
RESA Regional Education
Service Agency
STEM Science, Technology,
Engineering, and Math
SWSS Strategic Waivers
School Systems
TRS Teachers Retirement System
of Georgia
2016 Georgia K-12 Teacher and Leader Workforce Status Report
9
Introduction
The Georgia K-12 Teacher and Leader Workforce Report provides a snapshot of
the current K-12 teacher and leader workforce, production, retention, and
retirement patterns. Created at the request of the Alliance of Education Agency
Heads (AEAH), the report utilizes data from the Georgia Department of Education
(GaDOE), the Georgia Professional Standards Commission (GaPSC), and the
Teachers Retirement System of Georgia (TRS). This report analyzes K-12 teacher
and leader workforce, production, retention, and retirement patterns during the
2015-2016 school year.
Current Status of the Workforce
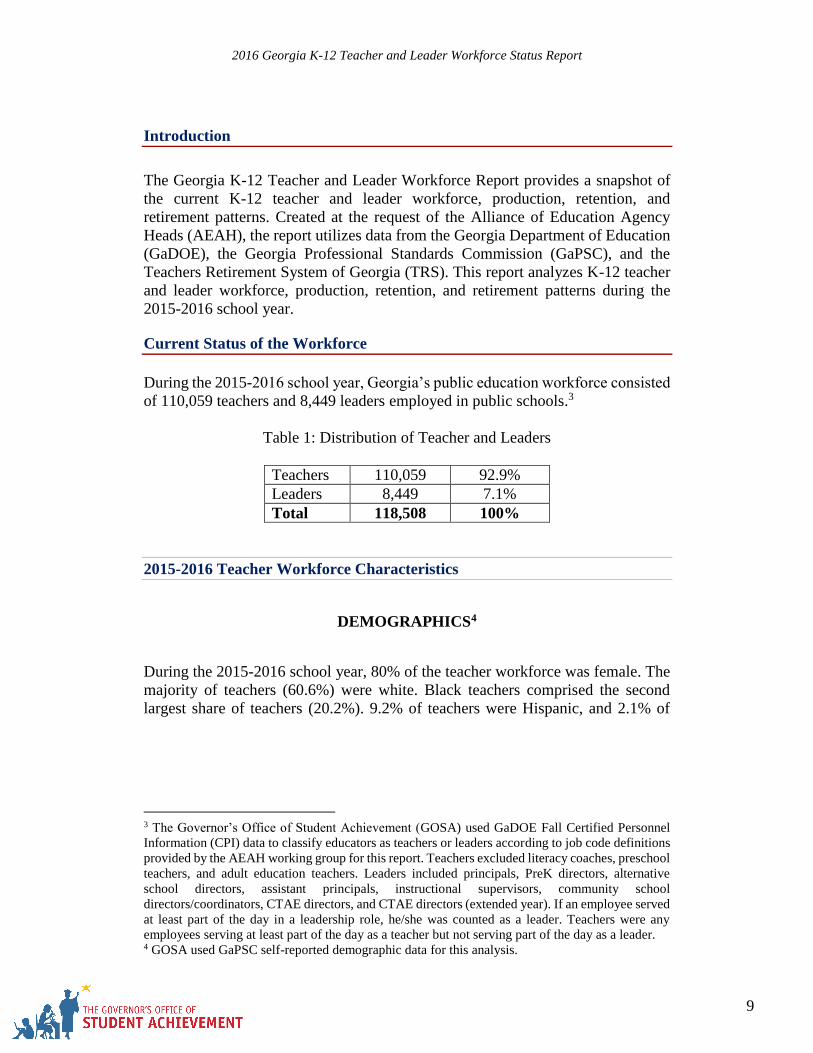
During the 2015-2016 school year, Georgia’s public education workforce consisted
of 110,059 teachers and 8,449 leaders employed in public schools.3
Table 1: Distribution of Teacher and Leaders
Teachers 110,059 92.9%
Leaders 8,449 7.1%
Total 118,508 100%
2015-2016 Teacher Workforce Characteristics
DEMOGRAPHICS4
During the 2015-2016 school year, 80% of the teacher workforce was female. The
majority of teachers (60.6%) were white. Black teachers comprised the second
largest share of teachers (20.2%). 9.2% of teachers were Hispanic, and 2.1% of
3 The Governor’s Office of Student Achievement (GOSA) used GaDOE Fall Certified Personnel
Information (CPI) data to classify educators as teachers or leaders according to job code definitions
provided by the AEAH working group for this report. Teachers excluded literacy coaches, preschool
teachers, and adult education teachers. Leaders included principals, PreK directors, alternative
school directors, assistant principals, instructional supervisors, community school
directors/coordinators, CTAE directors, and CTAE directors (extended year). If an employee served
at least part of the day in a leadership role, he/she was counted as a leader. Teachers were any
employees serving at least part of the day as a teacher but not serving part of the day as a leader. 4 GOSA used GaPSC self-reported demographic data for this analysis.
2016 Georgia K-12 Teacher and Leader Workforce Status Report
10
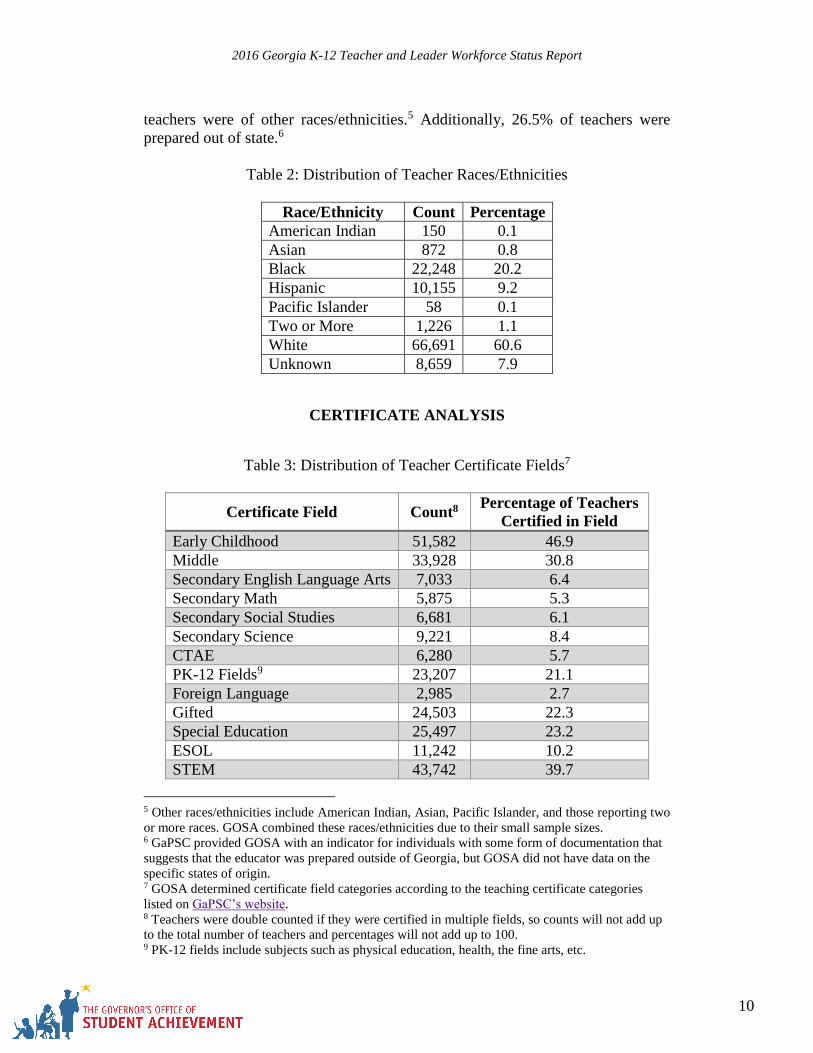
teachers were of other races/ethnicities.5 Additionally, 26.5% of teachers were
prepared out of state.6
Table 2: Distribution of Teacher Races/Ethnicities
Race/Ethnicity Count Percentage
American Indian 150 0.1
Asian 872 0.8
Black 22,248 20.2
Hispanic 10,155 9.2
Pacific Islander 58 0.1
Two or More 1,226 1.1
White 66,691 60.6
Unknown 8,659 7.9
CERTIFICATE ANALYSIS
Table 3: Distribution of Teacher Certificate Fields7
Certificate Field Count8 Percentage of Teachers
Certified in Field
Early Childhood 51,582 46.9
Middle 33,928 30.8
Secondary English Language Arts 7,033 6.4
Secondary Math 5,875 5.3
Secondary Social Studies 6,681 6.1
Secondary Science 9,221 8.4
CTAE 6,280 5.7
PK-12 Fields9 23,207 21.1
Foreign Language 2,985 2.7
Gifted 24,503 22.3
Special Education 25,497 23.2
ESOL 11,242 10.2
STEM 43,742 39.7
5 Other races/ethnicities include American Indian, Asian, Pacific Islander, and those reporting two
or more races. GOSA combined these races/ethnicities due to their small sample sizes. 6 GaPSC provided GOSA with an indicator for individuals with some form of documentation that
suggests that the educator was prepared outside of Georgia, but GOSA did not have data on the
specific states of origin. 7 GOSA determined certificate field categories according to the teaching certificate categories
listed on GaPSC’s website. 8 Teachers were double counted if they were certified in multiple fields, so counts will not add up
to the total number of teachers and percentages will not add up to 100. 9 PK-12 fields include subjects such as physical education, health, the fine arts, etc.
2016 Georgia K-12 Teacher and Leader Workforce Status Report
11
Table 3 on the previous page examines the certificate fields held by teachers during
the 2015-2016 school year.10 46.9% of teachers were certified in elementary fields
(grades PK-5). 30.8% of teachers were certified in middle grade fields (grades 4-
8). 26.2% of teachers were certified in secondary fields (grades 6-12). Among the
secondary fields, 8.4% of teachers were certified in a secondary science field, which
was at least 2 percentage points greater than other secondary subjects. 23.2% of
teachers were certified in special education fields, and 22.3% of teachers were
certified in gifted fields. Additionally, about 40% of teachers were certified in a
STEM (Science, Technology, Engineering, and Math) field.
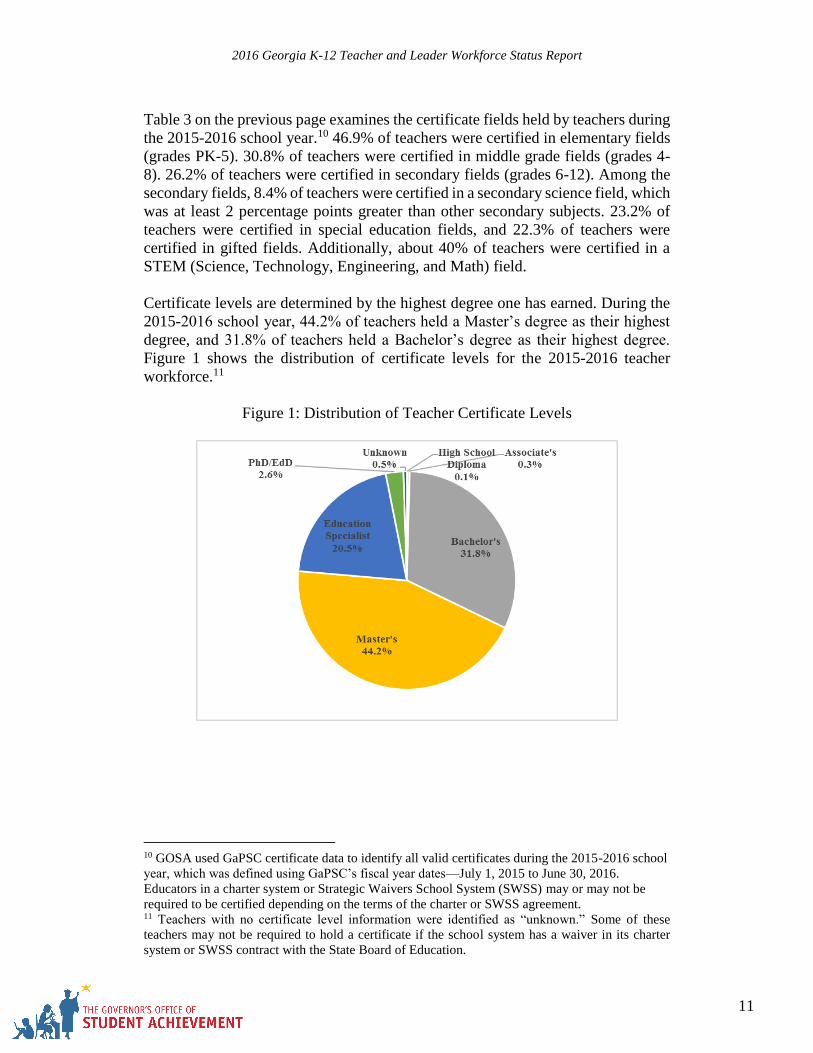
Certificate levels are determined by the highest degree one has earned. During the
2015-2016 school year, 44.2% of teachers held a Master’s degree as their highest
degree, and 31.8% of teachers held a Bachelor’s degree as their highest degree.
Figure 1 shows the distribution of certificate levels for the 2015-2016 teacher
workforce.11
Figure 1: Distribution of Teacher Certificate Levels
10 GOSA used GaPSC certificate data to identify all valid certificates during the 2015-2016 school
year, which was defined using GaPSC’s fiscal year dates—July 1, 2015 to June 30, 2016.
Educators in a charter system or Strategic Waivers School System (SWSS) may or may not be
required to be certified depending on the terms of the charter or SWSS agreement. 11 Teachers with no certificate level information were identified as “unknown.” Some of these
teachers may not be required to hold a certificate if the school system has a waiver in its charter
system or SWSS contract with the State Board of Education.
2016 Georgia K-12 Teacher and Leader Workforce Status Report
12
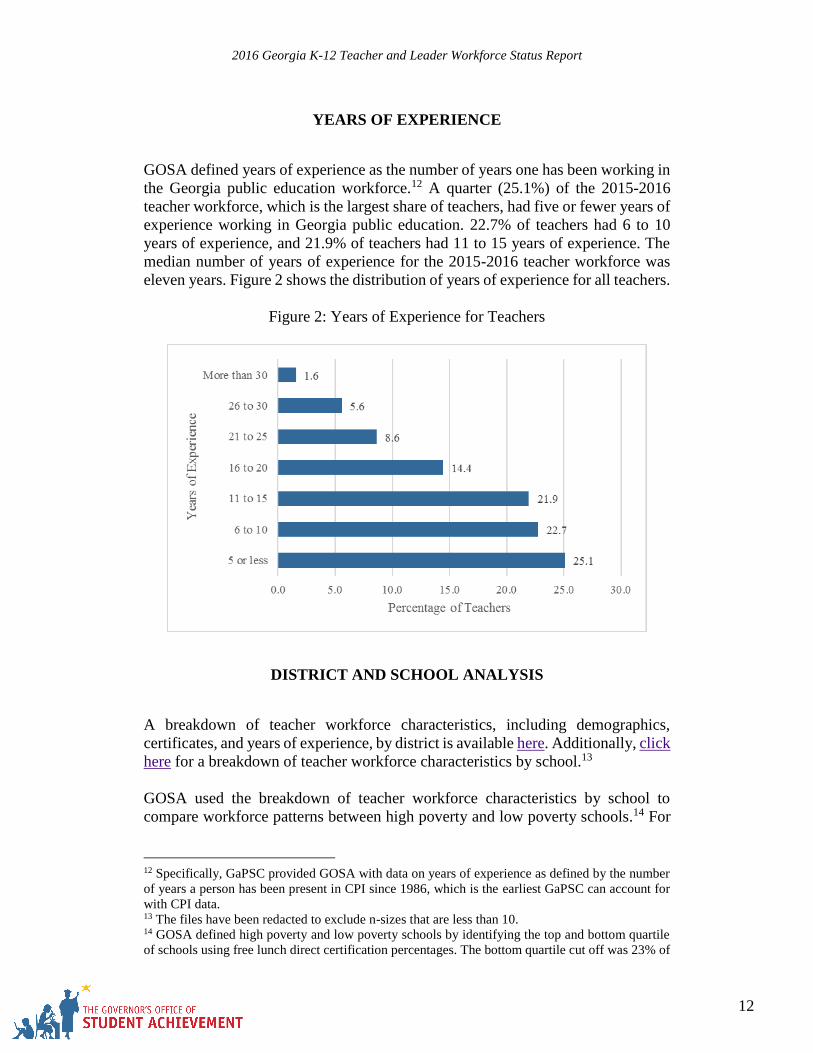
YEARS OF EXPERIENCE
GOSA defined years of experience as the number of years one has been working in
the Georgia public education workforce.12 A quarter (25.1%) of the 2015-2016
teacher workforce, which is the largest share of teachers, had five or fewer years of
experience working in Georgia public education. 22.7% of teachers had 6 to 10
years of experience, and 21.9% of teachers had 11 to 15 years of experience. The
median number of years of experience for the 2015-2016 teacher workforce was
eleven years. Figure 2 shows the distribution of years of experience for all teachers.
Figure 2: Years of Experience for Teachers
DISTRICT AND SCHOOL ANALYSIS
A breakdown of teacher workforce characteristics, including demographics,
certificates, and years of experience, by district is available here. Additionally, click
here for a breakdown of teacher workforce characteristics by school.13
GOSA used the breakdown of teacher workforce characteristics by school to
compare workforce patterns between high poverty and low poverty schools.14 For
12 Specifically, GaPSC provided GOSA with data on years of experience as defined by the number
of years a person has been present in CPI since 1986, which is the earliest GaPSC can account for
with CPI data. 13 The files have been redacted to exclude n-sizes that are less than 10. 14 GOSA defined high poverty and low poverty schools by identifying the top and bottom quartile
of schools using free lunch direct certification percentages. The bottom quartile cut off was 23% of
2016 Georgia K-12 Teacher and Leader Workforce Status Report
13
this analysis, GOSA summed the teacher counts for all schools in each category to
determine overall teacher counts and percentages for high poverty schools and low
poverty schools. GOSA then used a t-test of proportions to determine if the
differences between high poverty and low poverty schools were statistically
significant.15 In terms of demographics, the share of male teachers in low poverty
schools (22.8%) was statistically significantly greater than the share of male
teachers in high poverty schools (15.8%). However, this may be due to the fact that
a larger share of high poverty schools were elementary schools—roughly 67% of
high poverty schools were elementary schools compared to 47% of low poverty
schools.16 The differences in the shares of black and white teachers between low
and high poverty schools were also statistically significant. 43.2% of teachers in
high poverty schools were black compared to only 8.1% of teachers in low poverty
schools; in addition, only 37.3% of teachers in high poverty schools were white
compared to 73% of teachers in low poverty schools.
Table 4: Demographics of Teachers in Low and High Poverty Schools
Subgroup
Percentage of
Teachers in Low
Poverty Schools
Percentage of
Teachers in High
Poverty Schools
Female 77.1 84.0
Male 22.8 15.8
American Indian 0.1 0.1
Asian 0.9 0.5
Black 8.1 43.2
Hispanic 9.0 9.7
Pacific Islander 0.0 0.1
Two or More 1.1 1.1
White 73.0 37.3
students directly certified, and the top quartile cut off was 51% of students directly certified. For
more information on the use of direct certification percentages, see GOSA’s e-bulletin. 15 GOSA defined statistically significant as p < 0.05. 16 Since GOSA could not access 2015-2016 enrollment information while compiling the report,
GOSA identified school grade clusters using 2014-2015 enrollment data.
2016 Georgia K-12 Teacher and Leader Workforce Status Report
14
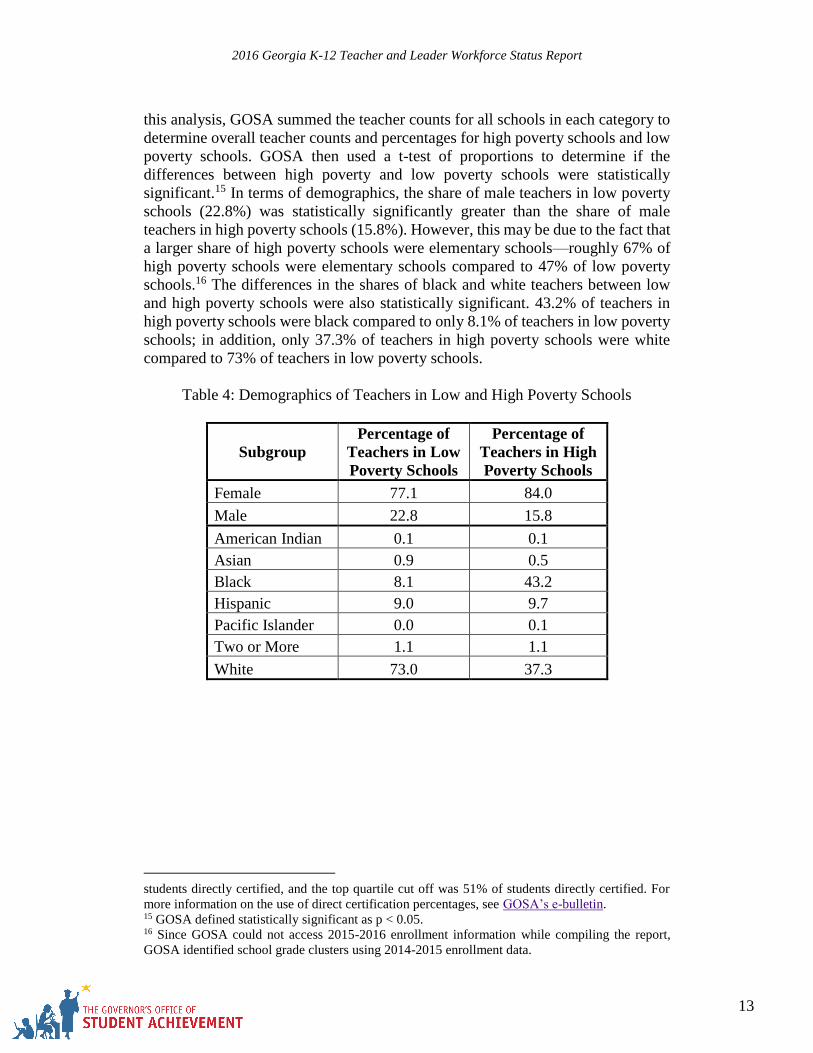
Figure 3: Certificate Fields of Teachers in Low and High Poverty Schools17
When analyzing certificate fields held by teachers, a larger share of teachers in high
poverty schools were certified in elementary grades, while a larger share of teachers
in low poverty schools were certified in secondary subjects; however, this is also
likely due to differences in the distributions of elementary, middle, and high schools
between low poverty and high poverty schools. The proportion of teachers with
gifted certification in low poverty schools (29.8%) was more than double the share
of gifted certified teachers in high poverty schools (13.2%). Additionally, the share
of teachers certified in STEM subjects was about 8 percentage points higher in low
poverty schools (41.7%) than high poverty schools (33.3%). The share of teachers
certified in special education was also somewhat higher in low poverty schools
(23%) than high poverty schools (20.6%). On the other hand, the proportion of
teachers with ESOL certification was slightly higher (about one percentage point)
in high poverty schools than low poverty schools. Figure 3 compares the percentage
of teachers certified in each field category in high poverty and low poverty schools.
17 An asterisk denotes a statistically significant difference in percentages using a t-test of
proportions (p < 0.05).
2016 Georgia K-12 Teacher and Leader Workforce Status Report
15
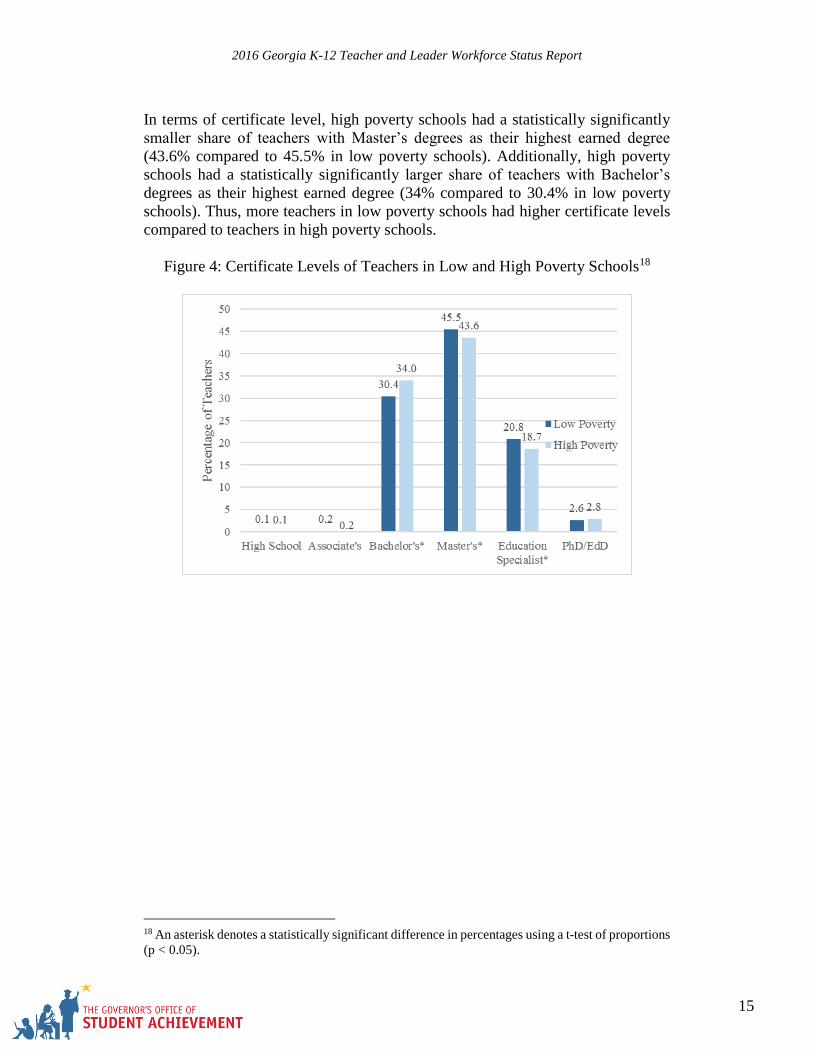
In terms of certificate level, high poverty schools had a statistically significantly
smaller share of teachers with Master’s degrees as their highest earned degree
(43.6% compared to 45.5% in low poverty schools). Additionally, high poverty
schools had a statistically significantly larger share of teachers with Bachelor’s
degrees as their highest earned degree (34% compared to 30.4% in low poverty
schools). Thus, more teachers in low poverty schools had higher certificate levels
compared to teachers in high poverty schools.
Figure 4: Certificate Levels of Teachers in Low and High Poverty Schools18
18 An asterisk denotes a statistically significant difference in percentages using a t-test of proportions
(p < 0.05).

2016 Georgia K-12 Teacher and Leader Workforce Status Report
16
When analyzing years of experience, the share of teachers with five or fewer years
of experience was about five percentage points larger in high poverty schools than
low poverty schools. Additionally, the share of teachers with eleven to twenty years
of experience was slightly lower in high poverty schools than low poverty schools.
However, though the share of teachers with twenty-six or more years of experience
was small, this proportion of teachers was slightly larger in high poverty schools.
Thus, high poverty schools had a larger share of teachers with very little experience
or a lot of experience.
Figure 5: Years of Experience of Teachers in Low and High Poverty Schools19
Finally, a statistically significantly larger share of teachers in low poverty schools
were prepared out of state—29.4% compared to 24.9% in high poverty schools.
19 An asterisk denotes a statistically significant difference in percentages using a t-test of proportions
(p < 0.05).

2016 Georgia K-12 Teacher and Leader Workforce Status Report
17
2015-2016 Leader Workforce Characteristics
DEMOGRAPHICS
In contrast to the teacher workforce, only 68% of the leader workforce were female.
The percentage of leaders who were male (31.8%) was much higher than the
percentage of teachers who were male (20.3%).
The majority of the leader workforce was also white (56.9%). However, the share
of leaders who were black was larger than the share of black teachers; 34.2% of
leaders were black compared to 20.2% of teachers. On the other hand, the
percentage of Hispanic leaders (4.4%) was lower than the percentage of Hispanic
teachers (9.2%).
Table 5: Distribution of Leader Races/Ethnicities20
Race/Ethnicity Count Percentage
American Indian 13 0.2
Asian 39 0.5
Black 2,893 34.2
Hispanic 372 4.4
Two or More 104 1.2
White 4,808 56.9
Unknown 218 2.6
Additionally, 30.6% of leaders were prepared out of state, which is larger than the
share of teachers who were prepared out of state (26.5%).
CERTIFICATE ANALYSIS
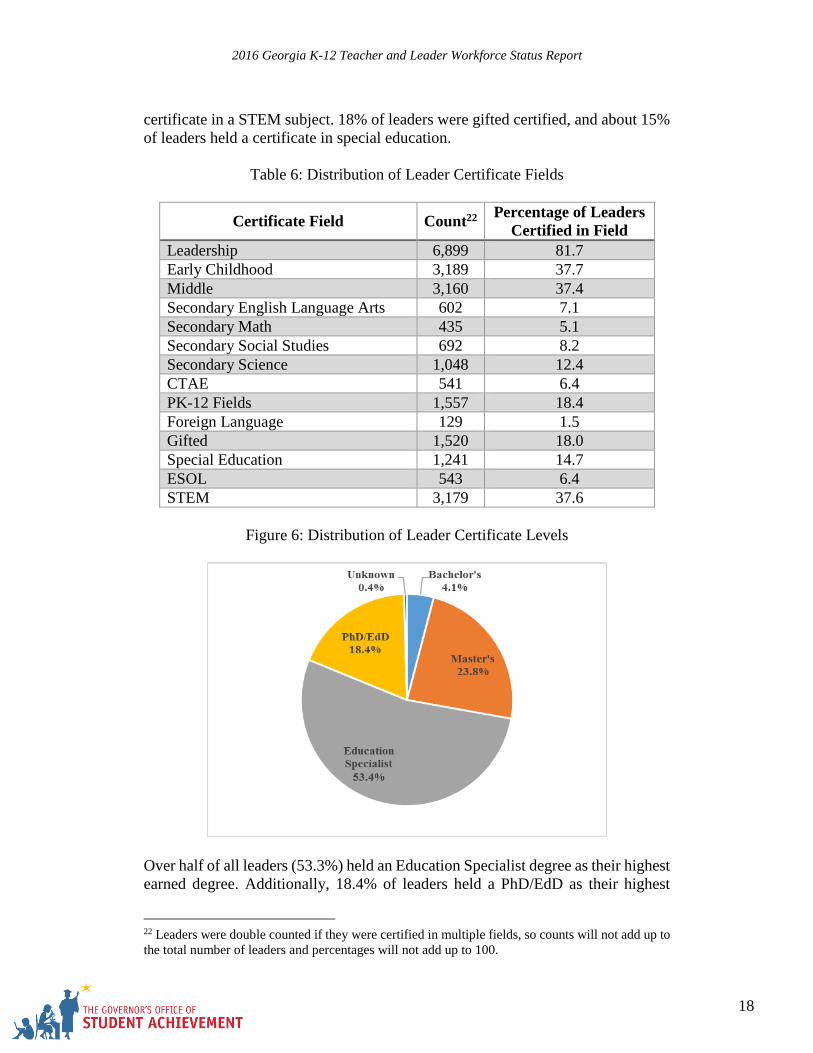
Table 6 on the following page examines the certificate fields held by leaders.21
81.7% of leaders held leadership certificates during the 2015-2016 school year.
Many leaders also held certificates in multiple other teaching fields. When
analyzing the teaching certificates held by leaders, 37.6% of leaders held a
20 Pacific Islanders were excluded because n < 10. 21 The leadership certificates include educational leadership tiers I and II certificates and other
certificates associated with the CPI job titles for leaders such as instructional supervision and
director of CTAE or special education. The remaining certificate fields are the same types of
certificates held by teachers. Educators in a charter system or Strategic Waivers School System
(SWSS) may or may not be required to be certified depending on the terms of the charter or SWSS
agreement.
2016 Georgia K-12 Teacher and Leader Workforce Status Report
18
certificate in a STEM subject. 18% of leaders were gifted certified, and about 15%
of leaders held a certificate in special education.
Table 6: Distribution of Leader Certificate Fields
Certificate Field Count22 Percentage of Leaders
Certified in Field
Leadership 6,899 81.7
Early Childhood 3,189 37.7
Middle 3,160 37.4
Secondary English Language Arts 602 7.1
Secondary Math 435 5.1
Secondary Social Studies 692 8.2
Secondary Science 1,048 12.4
CTAE 541 6.4
PK-12 Fields 1,557 18.4
Foreign Language 129 1.5
Gifted 1,520 18.0
Special Education 1,241 14.7
ESOL 543 6.4
STEM 3,179 37.6
Figure 6: Distribution of Leader Certificate Levels
Over half of all leaders (53.3%) held an Education Specialist degree as their highest
earned degree. Additionally, 18.4% of leaders held a PhD/EdD as their highest
22 Leaders were double counted if they were certified in multiple fields, so counts will not add up to
the total number of leaders and percentages will not add up to 100.
2016 Georgia K-12 Teacher and Leader Workforce Status Report
19
earned degree, and 23.8% of leaders held a Master’s degree as their highest earned
degree. All leaders had a certificate level above a high school diploma. Figure 6
displays the distribution of certificate levels for all leaders.23
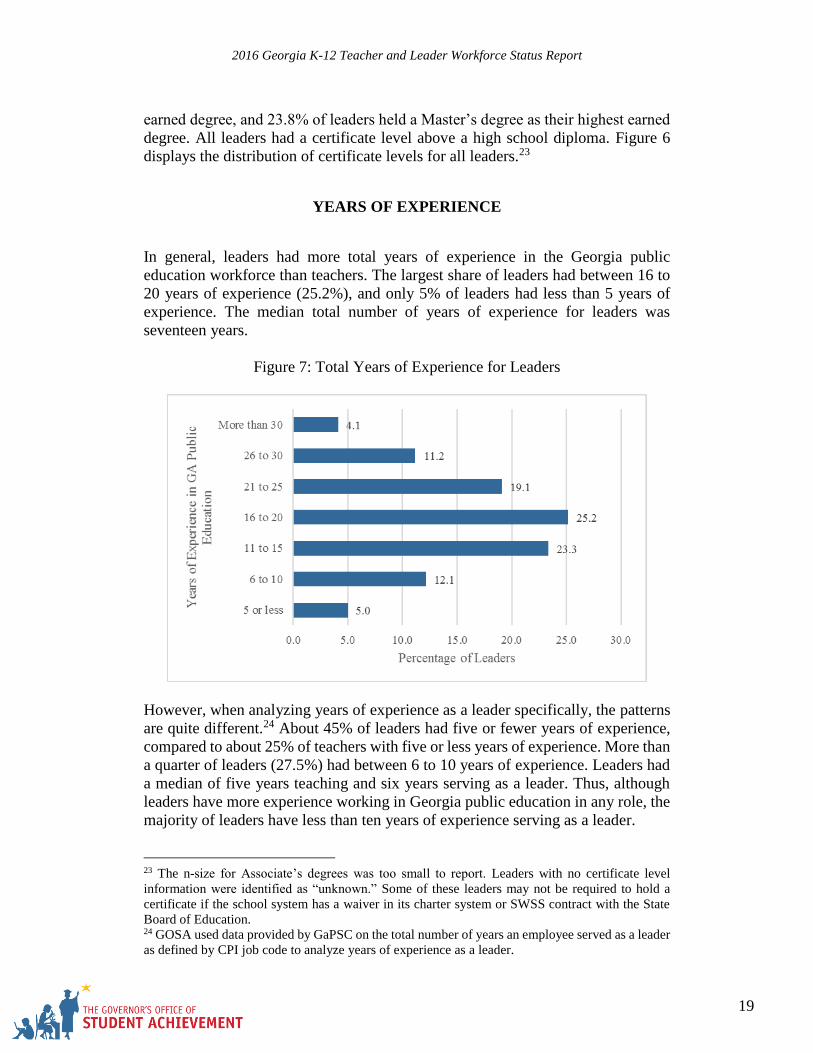
YEARS OF EXPERIENCE
In general, leaders had more total years of experience in the Georgia public
education workforce than teachers. The largest share of leaders had between 16 to
20 years of experience (25.2%), and only 5% of leaders had less than 5 years of
experience. The median total number of years of experience for leaders was
seventeen years.
Figure 7: Total Years of Experience for Leaders
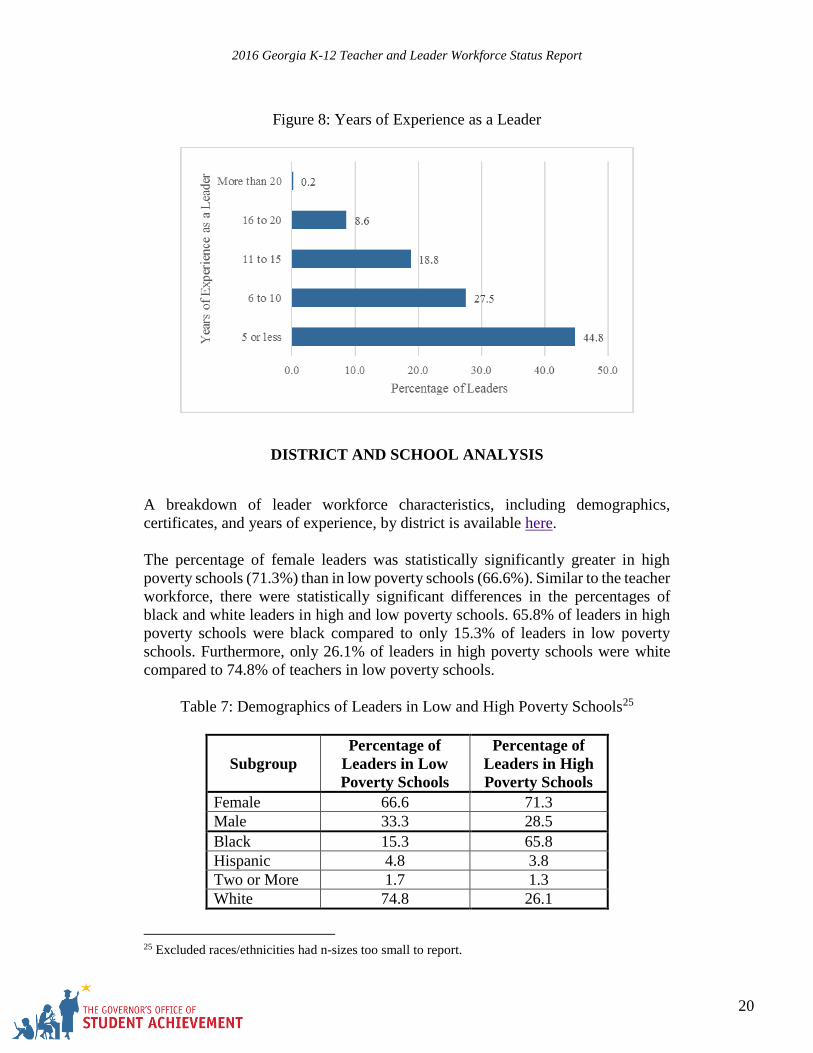
However, when analyzing years of experience as a leader specifically, the patterns
are quite different.24 About 45% of leaders had five or fewer years of experience,
compared to about 25% of teachers with five or less years of experience. More than
a quarter of leaders (27.5%) had between 6 to 10 years of experience. Leaders had
a median of five years teaching and six years serving as a leader. Thus, although
leaders have more experience working in Georgia public education in any role, the
majority of leaders have less than ten years of experience serving as a leader.
23 The n-size for Associate’s degrees was too small to report. Leaders with no certificate level
information were identified as “unknown.” Some of these leaders may not be required to hold a
certificate if the school system has a waiver in its charter system or SWSS contract with the State
Board of Education. 24 GOSA used data provided by GaPSC on the total number of years an employee served as a leader
as defined by CPI job code to analyze years of experience as a leader.
2016 Georgia K-12 Teacher and Leader Workforce Status Report
20
Figure 8: Years of Experience as a Leader
DISTRICT AND SCHOOL ANALYSIS
A breakdown of leader workforce characteristics, including demographics,
certificates, and years of experience, by district is available here.
The percentage of female leaders was statistically significantly greater in high
poverty schools (71.3%) than in low poverty schools (66.6%). Similar to the teacher
workforce, there were statistically significant differences in the percentages of
black and white leaders in high and low poverty schools. 65.8% of leaders in high
poverty schools were black compared to only 15.3% of leaders in low poverty
schools. Furthermore, only 26.1% of leaders in high poverty schools were white
compared to 74.8% of teachers in low poverty schools.
Table 7: Demographics of Leaders in Low and High Poverty Schools25
Subgroup
Percentage of
Leaders in Low
Poverty Schools
Percentage of
Leaders in High
Poverty Schools
Female 66.6 71.3
Male 33.3 28.5
Black 15.3 65.8
Hispanic 4.8 3.8
Two or More 1.7 1.3
White 74.8 26.1
25 Excluded races/ethnicities had n-sizes too small to report.
2016 Georgia K-12 Teacher and Leader Workforce Status Report
21
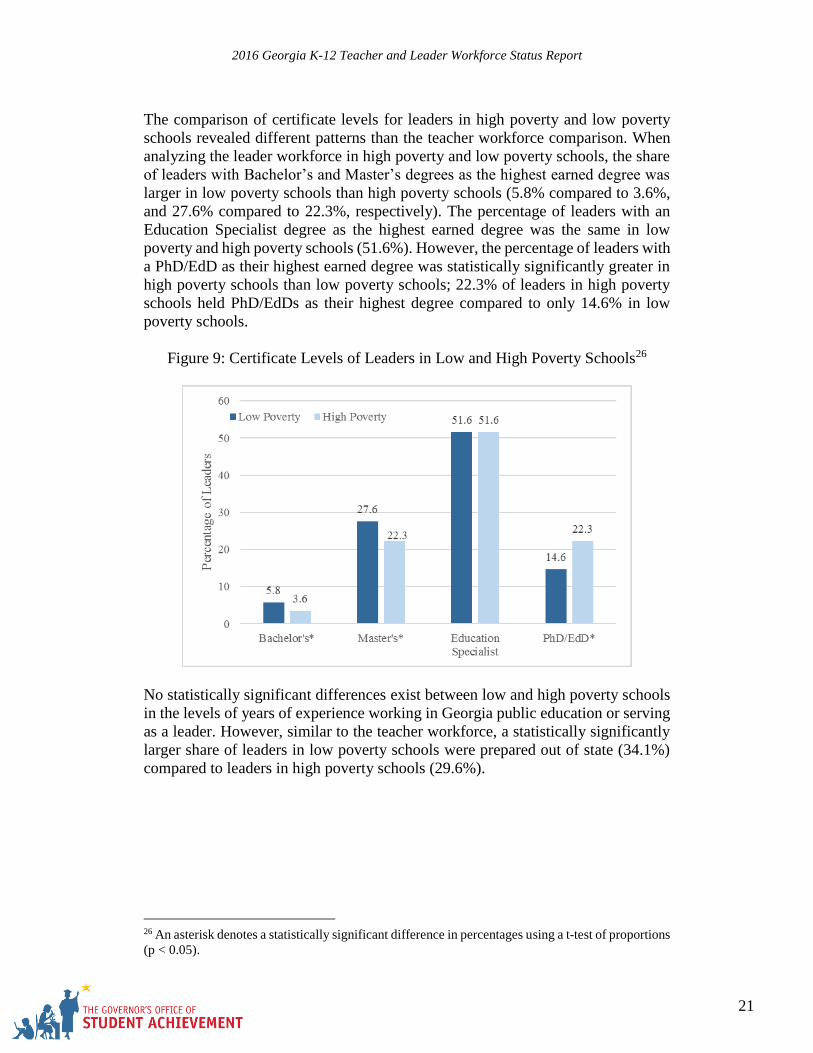
The comparison of certificate levels for leaders in high poverty and low poverty
schools revealed different patterns than the teacher workforce comparison. When
analyzing the leader workforce in high poverty and low poverty schools, the share
of leaders with Bachelor’s and Master’s degrees as the highest earned degree was
larger in low poverty schools than high poverty schools (5.8% compared to 3.6%,
and 27.6% compared to 22.3%, respectively). The percentage of leaders with an
Education Specialist degree as the highest earned degree was the same in low
poverty and high poverty schools (51.6%). However, the percentage of leaders with
a PhD/EdD as their highest earned degree was statistically significantly greater in
high poverty schools than low poverty schools; 22.3% of leaders in high poverty
schools held PhD/EdDs as their highest degree compared to only 14.6% in low
poverty schools.
Figure 9: Certificate Levels of Leaders in Low and High Poverty Schools26
No statistically significant differences exist between low and high poverty schools
in the levels of years of experience working in Georgia public education or serving
as a leader. However, similar to the teacher workforce, a statistically significantly
larger share of leaders in low poverty schools were prepared out of state (34.1%)
compared to leaders in high poverty schools (29.6%).
26 An asterisk denotes a statistically significant difference in percentages using a t-test of proportions
(p < 0.05).
2016 Georgia K-12 Teacher and Leader Workforce Status Report
22
Comparison of Current Workforce to All Certificate Holders
The report compares the current teacher and leader workforce to all current
certificate holders in order to analyze the percentage of all certificate holders that
were actually employed as teachers or leaders during the 2015-2016 school year.
GOSA defined all current certificate holders for the 2015-2016 school year as
anyone with a valid certificate between July 1, 2015 to June 30, 2016.27 As such,
there were 189,468 valid certificate holders during the 2015-2016 school year.28
Table 8: Percentage of Certificate Holders Employed as Teacher or Leader29
Count of
All
Certificate
Holders
Percentage of All
Certificate Holders
Employed as Teacher 109,855 58.0%
Employed as Leader 8,432 4.5%
Employed as Teacher or Leader 118,287 62.5%
Table 8 shows the percentages of all certificate holders employed as either a teacher
or leader. 62.5% of all current certificate holders were employed as either a teacher
or a leader during the 2015-2016 school year. 13.4% of all current certificate
holders were not employed in the Georgia public education workforce at all during
the 2015-2016 school year.30
DEMOGRAPHICS
Males have a higher percentage of certificate holders who are employed as teachers
or leaders than females. 71.9% of male certificate holders were employed as a
teacher or leader compared to 60.6% of female certificate holders. However, there
were more than four times as many female certificate holders as male certificate
holders.
27 GOSA chose these dates because they align with GaPSC’s fiscal year. 28 The total number of valid certificate holders includes those with certificates in fields that do not
necessarily correspond specifically to a teacher or leader job code definition (e.g. service personnel). 29 A small number of teachers and leaders identified using CPI data did not match to the certificate
data provided by GaPSC, likely due to reporting errors or educators not being certified under
conditions of a district’s charter system or SWSS contract. Thus, GOSA used the total number of
teachers or leaders identified in CPI data who matched to GaPSC certificate data to calculate these
percentages. 30 GOSA determined this percentage by calculating the number of current certificate holders who
were not present in the Fall 2016 CPI data.
2016 Georgia K-12 Teacher and Leader Workforce Status Report
23
White certificate holders had slightly higher shares of certificate holders who were
employed as a teacher or leader when compared to other races/ethnicities. 65.7%
of white certificate holders were employed as a teacher or leader. Among all other
races, approximately 60% of certificate holders were employed as a teacher or
leader during the 2015-2016 school year.
Table 9: Distribution of Employed Certificate Holders’ Races/Ethnicities
Race/Ethnicity Percentage of Certificate Holders
Employed as Teacher/Leader
American Indian 60.4
Asian 59.4
Black 59.4
Hispanic 59.7
Pacific Islander 63.8
Two or More 61.1
White 65.7
CERTIFICATE ANALYSIS
Table 10: Percentage of Certificate Holders Employed by Certificate Field
Certificate Field
Percentage
Employed as
Teacher
Percentage
Employed
as Leader
Percentage
Employed as
Teacher or Leader
Early Childhood 75.9 4.7 80.6
Middle 75.5 7.0 82.5
Secondary English Language Arts 75.2 6.4 81.6
Secondary Math 79.2 5.9 85.0
Secondary Social Studies 76.5 7.9 84.5
Secondary Science 76.5 8.7 85.2
CTAE 75.1 6.5 81.5
PK-12 Fields 78.5 5.3 83.7
Foreign Language 81.0 3.5 84.5
Gifted 84.6 5.2 89.8
Special Education 76.7 3.7 80.4
ESOL 80.7 3.9 84.6
STEM 77.3 5.6 82.9
Leadership 39.0 34.3 73.3
Other Fields31 57.9 5.0 62.9
31 Other fields include service fields that do not align with the job code definitions used for
identifying teachers and leaders (see footnote 1).
2016 Georgia K-12 Teacher and Leader Workforce Status Report
24
The certificate field with the highest percentage of certificate holders employed as
a teacher or leader was gifted certification; about 90% of all gifted certificate
holders were employed as a teacher or leader. However, only 80% of special
education certificate holders were employed as a teacher or leader. Approximately
85% of ESOL certificate holders were employed as a teacher or leader.
Additionally, 82.9% of those holding certificates in a STEM subject were employed
as a teacher or leader. Among the secondary fields, about 85% of secondary math,
science, and social studies certificate holders were employed as a teacher or leader,
which was slightly higher the percentage of secondary English language arts
certificate holders who were employed (81.6%). Only 73.3% of leadership
certificate holders were employed, with 34.3% of leadership certificate holders
employed as a leader and 39% employed as a teacher.
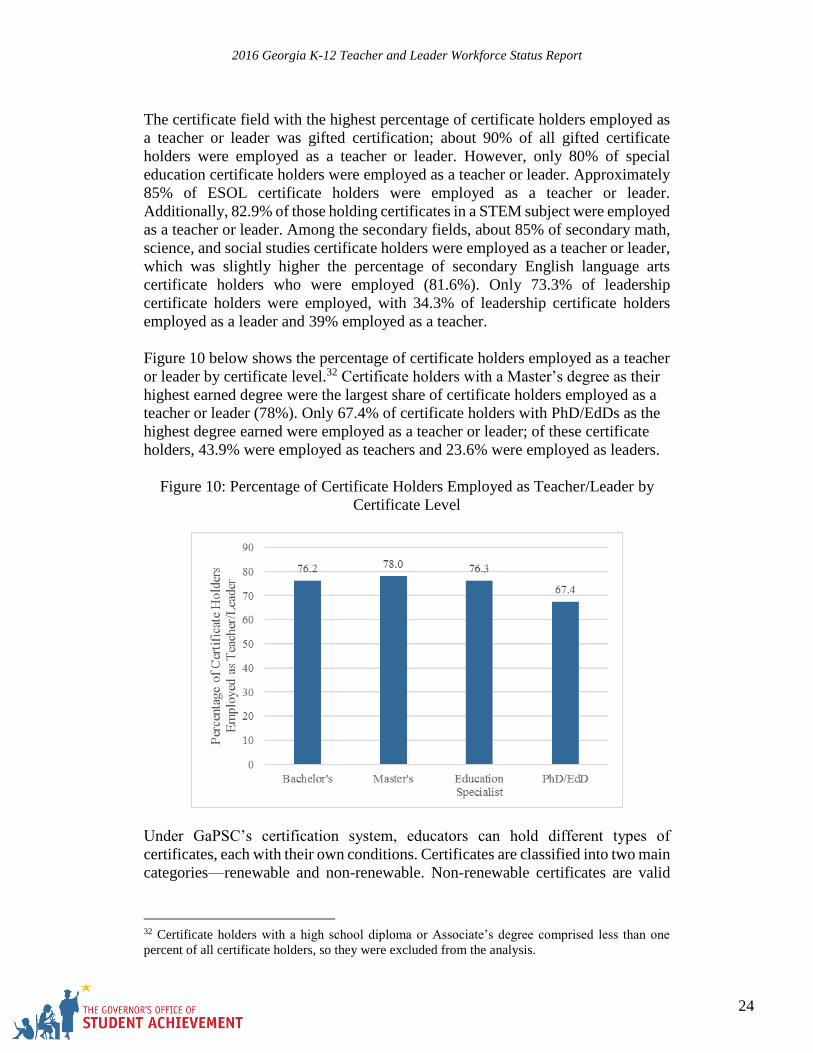
Figure 10 below shows the percentage of certificate holders employed as a teacher
or leader by certificate level.32 Certificate holders with a Master’s degree as their
highest earned degree were the largest share of certificate holders employed as a
teacher or leader (78%). Only 67.4% of certificate holders with PhD/EdDs as the
highest degree earned were employed as a teacher or leader; of these certificate
holders, 43.9% were employed as teachers and 23.6% were employed as leaders.
Figure 10: Percentage of Certificate Holders Employed as Teacher/Leader by
Certificate Level
Under GaPSC’s certification system, educators can hold different types of
certificates, each with their own conditions. Certificates are classified into two main
categories—renewable and non-renewable. Non-renewable certificates are valid
32 Certificate holders with a high school diploma or Associate’s degree comprised less than one
percent of all certificate holders, so they were excluded from the analysis.
2016 Georgia K-12 Teacher and Leader Workforce Status Report
25
for only one to five years depending on the certificate type.33 79% of renewable
certificate holders were employed as teachers or leaders during the 2015-2016
school year, and 52.3% of non-renewable certificate holders were employed as
teachers or leaders. Waiver certificates are included under the non-renewable
category. Waiver certificates are unique in that they are issued at the request of an
employer to educators who have not satisfied all certification requirements and are
thus only valid for one year. 68.3% of all waiver certificate holders were employed
as a teacher or leader during the 2015-2016 school year.
2015-2016 Teacher New Hire Characteristics
During the 2015-2016 school year, 5,908 teachers were new hires to the teacher
workforce, which represented 5.4% of the entire teacher workforce.34
DEMOGRAPHICS
The gender breakdown of new teachers was similar to the gender distribution of the
overall teacher workforce. 77.1% of new teachers were female.
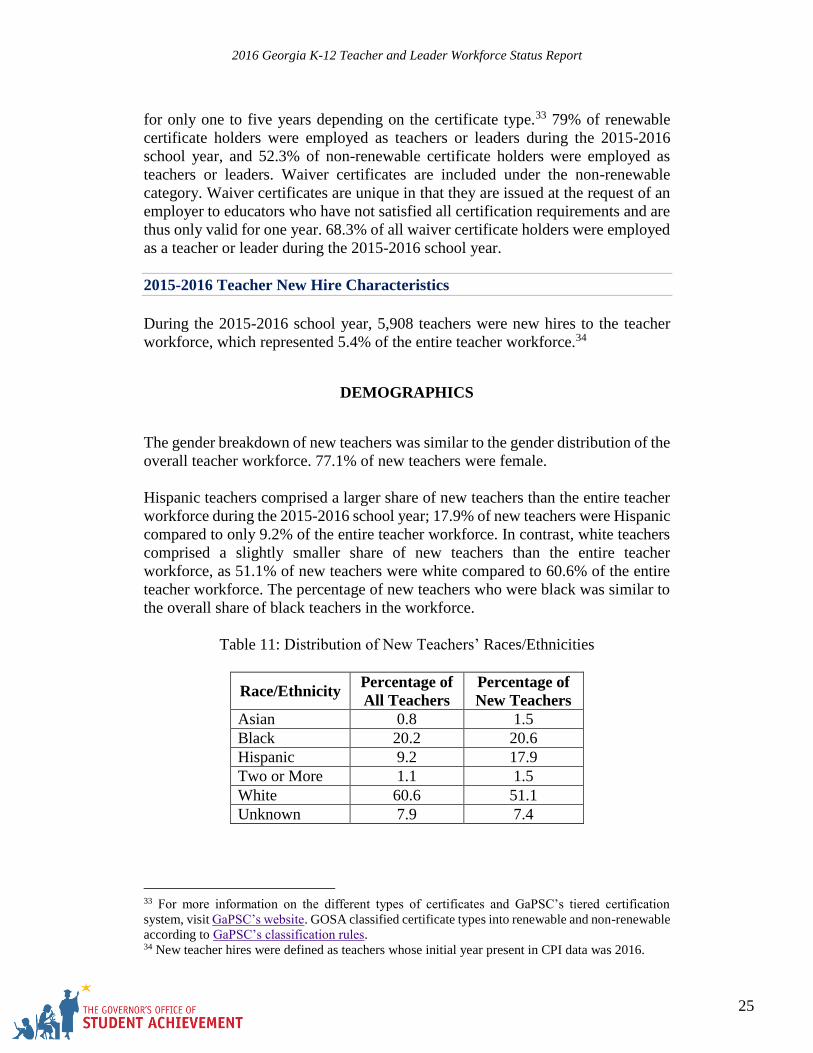
Hispanic teachers comprised a larger share of new teachers than the entire teacher
workforce during the 2015-2016 school year; 17.9% of new teachers were Hispanic
compared to only 9.2% of the entire teacher workforce. In contrast, white teachers
comprised a slightly smaller share of new teachers than the entire teacher
workforce, as 51.1% of new teachers were white compared to 60.6% of the entire
teacher workforce. The percentage of new teachers who were black was similar to
the overall share of black teachers in the workforce.
Table 11: Distribution of New Teachers’ Races/Ethnicities
Race/Ethnicity Percentage of
All Teachers
Percentage of
New Teachers
Asian 0.8 1.5
Black 20.2 20.6
Hispanic 9.2 17.9
Two or More 1.1 1.5
White 60.6 51.1
Unknown 7.9 7.4
33 For more information on the different types of certificates and GaPSC’s tiered certification
system, visit GaPSC’s website. GOSA classified certificate types into renewable and non-renewable
according to GaPSC’s classification rules. 34 New teacher hires were defined as teachers whose initial year present in CPI data was 2016.
2016 Georgia K-12 Teacher and Leader Workforce Status Report
26
Furthermore, 31.6% of new teachers were prepared out of state, which is 5
percentage points higher than the share of all teachers who were prepared outside
of Georgia.
CERTIFICATE ANALYSIS
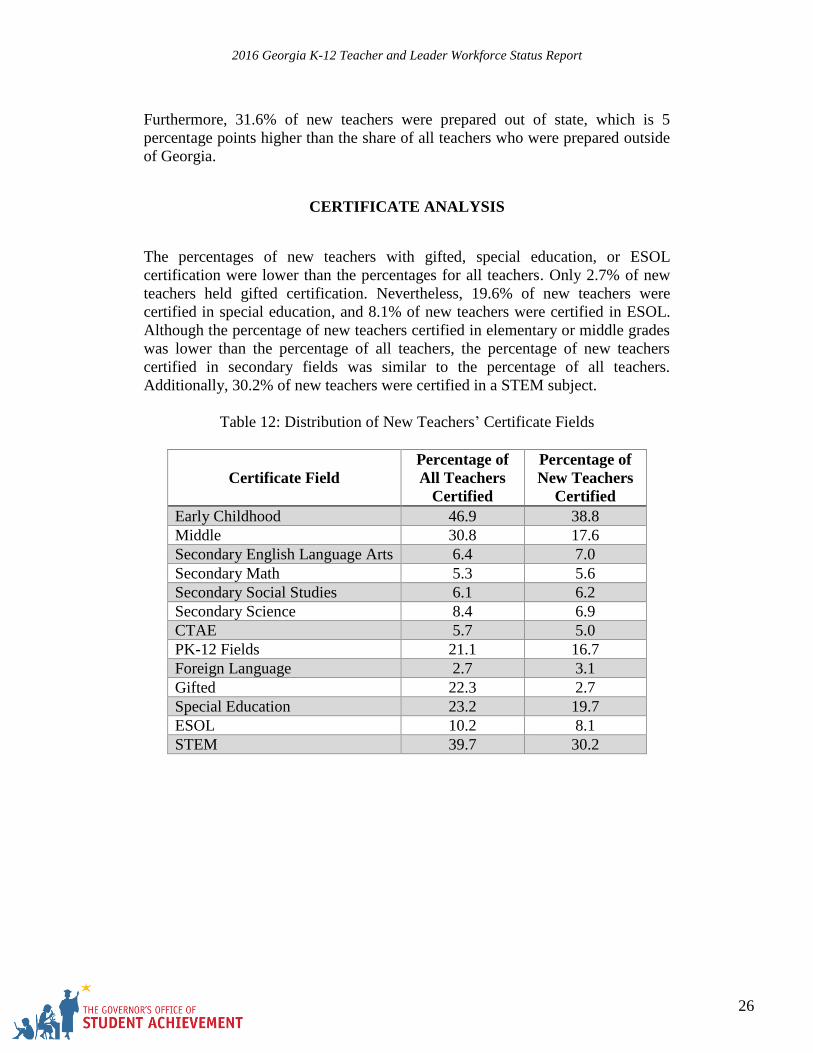
The percentages of new teachers with gifted, special education, or ESOL
certification were lower than the percentages for all teachers. Only 2.7% of new
teachers held gifted certification. Nevertheless, 19.6% of new teachers were
certified in special education, and 8.1% of new teachers were certified in ESOL.
Although the percentage of new teachers certified in elementary or middle grades
was lower than the percentage of all teachers, the percentage of new teachers
certified in secondary fields was similar to the percentage of all teachers.
Additionally, 30.2% of new teachers were certified in a STEM subject.
Table 12: Distribution of New Teachers’ Certificate Fields
Certificate Field
Percentage of
All Teachers
Certified
Percentage of
New Teachers
Certified
Early Childhood 46.9 38.8
Middle 30.8 17.6
Secondary English Language Arts 6.4 7.0
Secondary Math 5.3 5.6
Secondary Social Studies 6.1 6.2
Secondary Science 8.4 6.9
CTAE 5.7 5.0
PK-12 Fields 21.1 16.7
Foreign Language 2.7 3.1
Gifted 22.3 2.7
Special Education 23.2 19.7
ESOL 10.2 8.1
STEM 39.7 30.2
2016 Georgia K-12 Teacher and Leader Workforce Status Report
27
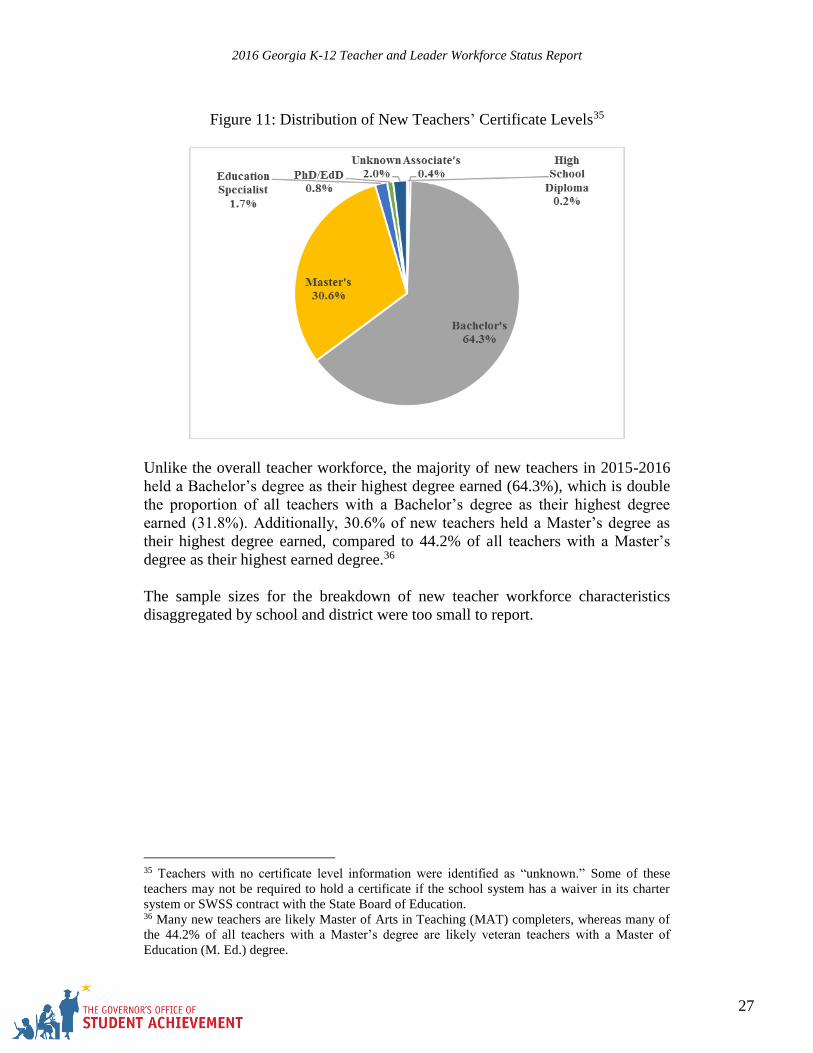
Figure 11: Distribution of New Teachers’ Certificate Levels35
Unlike the overall teacher workforce, the majority of new teachers in 2015-2016
held a Bachelor’s degree as their highest degree earned (64.3%), which is double
the proportion of all teachers with a Bachelor’s degree as their highest degree
earned (31.8%). Additionally, 30.6% of new teachers held a Master’s degree as
their highest degree earned, compared to 44.2% of all teachers with a Master’s
degree as their highest earned degree.36
The sample sizes for the breakdown of new teacher workforce characteristics
disaggregated by school and district were too small to report.
35 Teachers with no certificate level information were identified as “unknown.” Some of these
teachers may not be required to hold a certificate if the school system has a waiver in its charter
system or SWSS contract with the State Board of Education. 36 Many new teachers are likely Master of Arts in Teaching (MAT) completers, whereas many of
the 44.2% of all teachers with a Master’s degree are likely veteran teachers with a Master of
Education (M. Ed.) degree.
2016 Georgia K-12 Teacher and Leader Workforce Status Report
28
2015-2016 New Leader Hire Characteristics
During the 2015-2016 school year, 1,060 leaders were new leader hires, or
educators serving as leaders for the first time, representing 12.5% of the entire
leader workforce.37
DEMOGRAPHICS
Females comprised a larger share of new leaders than the entire leader workforce.
74.8% of new leaders were female compared to 68% of all leaders.
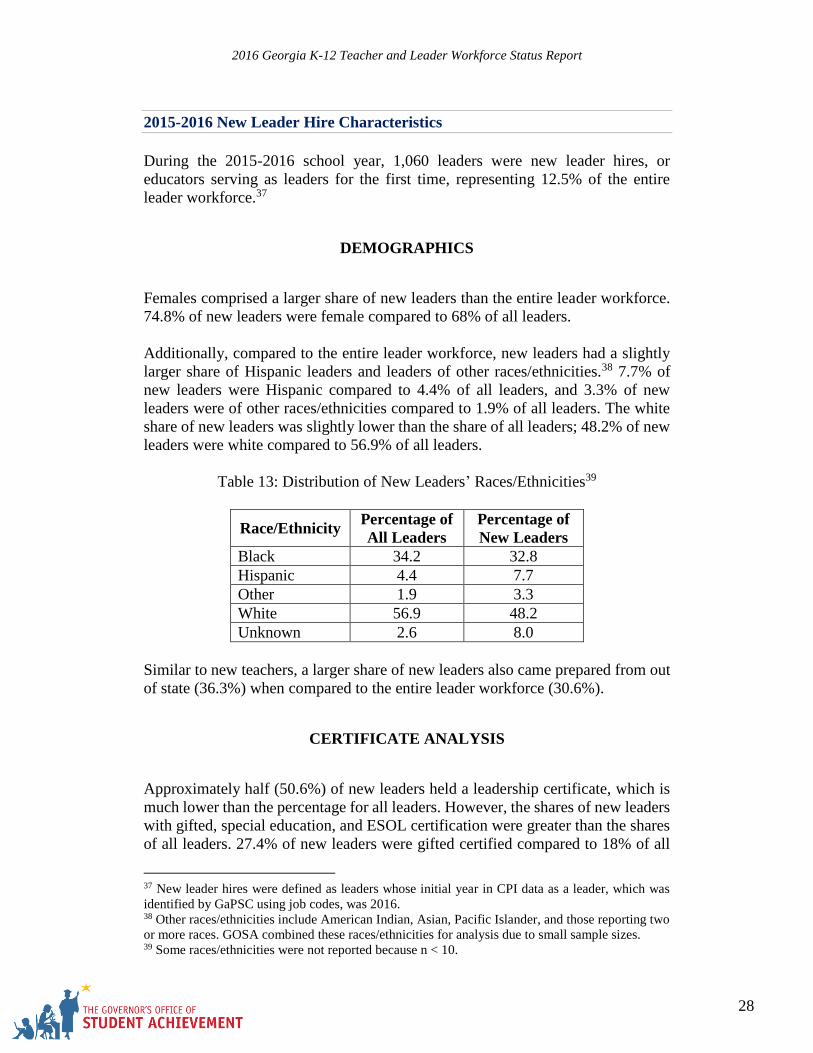
Additionally, compared to the entire leader workforce, new leaders had a slightly
larger share of Hispanic leaders and leaders of other races/ethnicities.38 7.7% of
new leaders were Hispanic compared to 4.4% of all leaders, and 3.3% of new
leaders were of other races/ethnicities compared to 1.9% of all leaders. The white
share of new leaders was slightly lower than the share of all leaders; 48.2% of new
leaders were white compared to 56.9% of all leaders.
Table 13: Distribution of New Leaders’ Races/Ethnicities39
Race/Ethnicity Percentage of
All Leaders
Percentage of
New Leaders
Black 34.2 32.8
Hispanic 4.4 7.7
Other 1.9 3.3
White 56.9 48.2
Unknown 2.6 8.0
Similar to new teachers, a larger share of new leaders also came prepared from out
of state (36.3%) when compared to the entire leader workforce (30.6%).
CERTIFICATE ANALYSIS
Approximately half (50.6%) of new leaders held a leadership certificate, which is
much lower than the percentage for all leaders. However, the shares of new leaders
with gifted, special education, and ESOL certification were greater than the shares
of all leaders. 27.4% of new leaders were gifted certified compared to 18% of all
37 New leader hires were defined as leaders whose initial year in CPI data as a leader, which was
identified by GaPSC using job codes, was 2016. 38 Other races/ethnicities include American Indian, Asian, Pacific Islander, and those reporting two
or more races. GOSA combined these races/ethnicities for analysis due to small sample sizes. 39 Some races/ethnicities were not reported because n < 10.
2016 Georgia K-12 Teacher and Leader Workforce Status Report
29
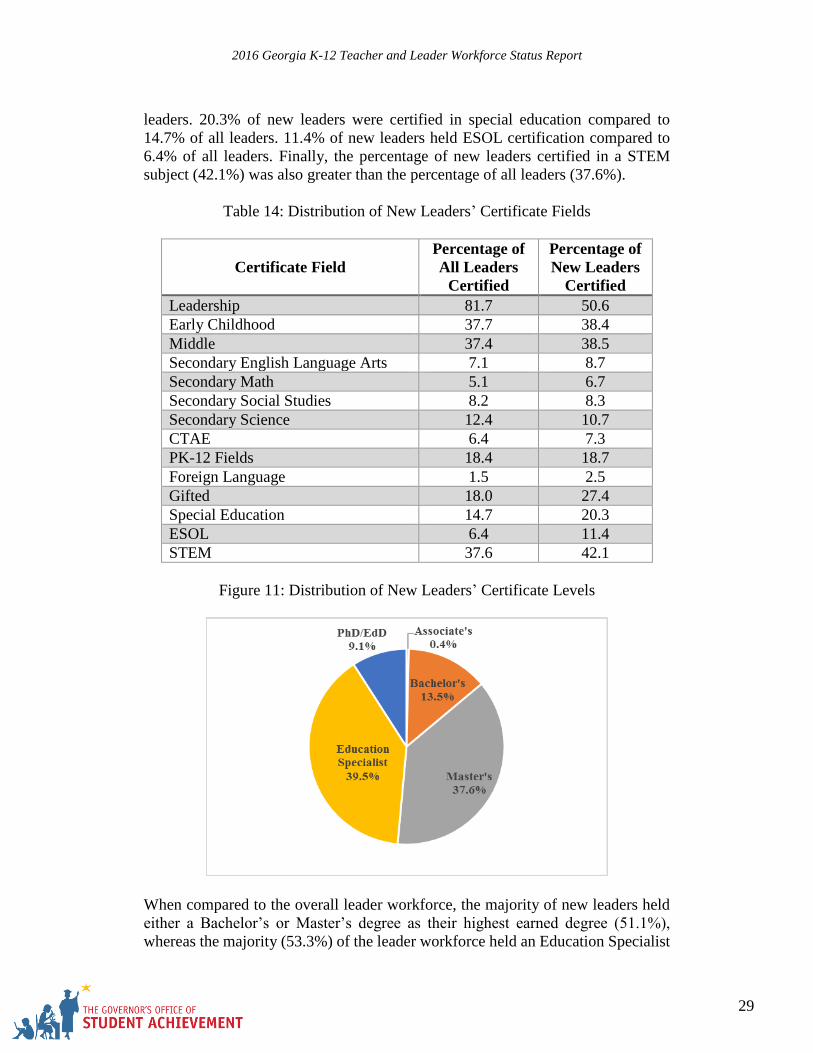
leaders. 20.3% of new leaders were certified in special education compared to
14.7% of all leaders. 11.4% of new leaders held ESOL certification compared to
6.4% of all leaders. Finally, the percentage of new leaders certified in a STEM
subject (42.1%) was also greater than the percentage of all leaders (37.6%).
Table 14: Distribution of New Leaders’ Certificate Fields
Certificate Field
Percentage of
All Leaders
Certified
Percentage of
New Leaders
Certified
Leadership 81.7 50.6
Early Childhood 37.7 38.4
Middle 37.4 38.5
Secondary English Language Arts 7.1 8.7
Secondary Math 5.1 6.7
Secondary Social Studies 8.2 8.3
Secondary Science 12.4 10.7
CTAE 6.4 7.3
PK-12 Fields 18.4 18.7
Foreign Language 1.5 2.5
Gifted 18.0 27.4
Special Education 14.7 20.3
ESOL 6.4 11.4
STEM 37.6 42.1
Figure 11: Distribution of New Leaders’ Certificate Levels
When compared to the overall leader workforce, the majority of new leaders held
either a Bachelor’s or Master’s degree as their highest earned degree (51.1%),
whereas the majority (53.3%) of the leader workforce held an Education Specialist
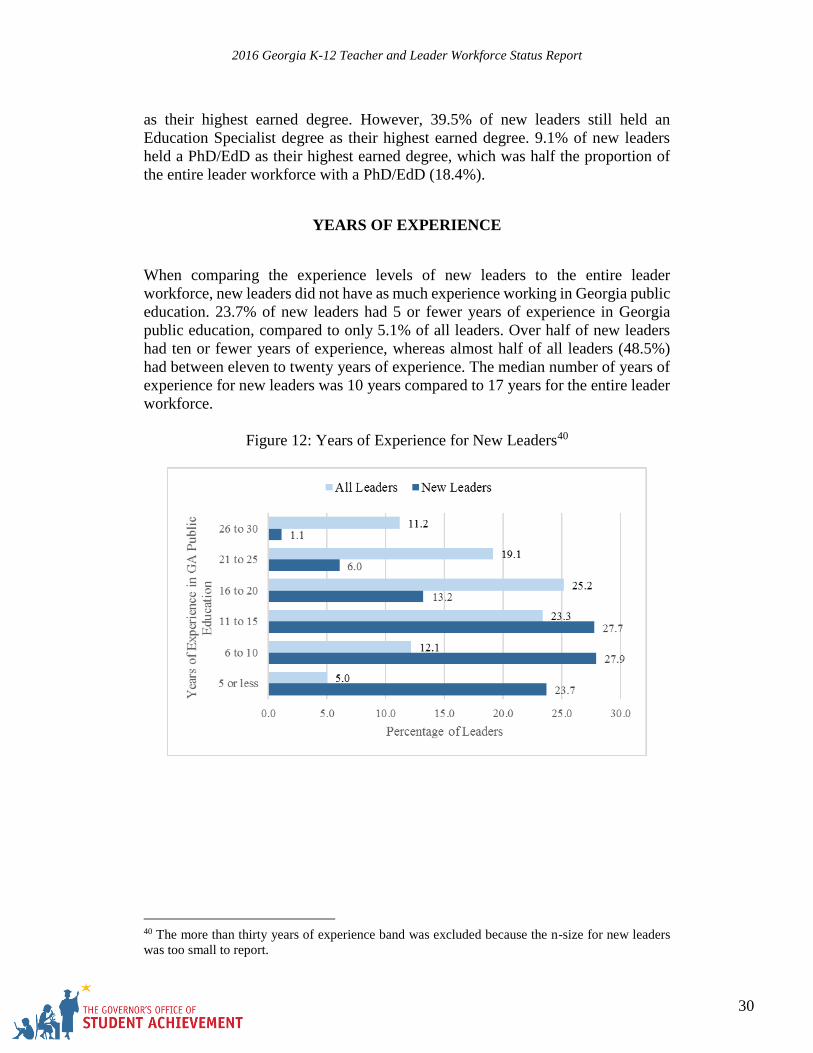
2016 Georgia K-12 Teacher and Leader Workforce Status Report
30
as their highest earned degree. However, 39.5% of new leaders still held an
Education Specialist degree as their highest earned degree. 9.1% of new leaders
held a PhD/EdD as their highest earned degree, which was half the proportion of
the entire leader workforce with a PhD/EdD (18.4%).
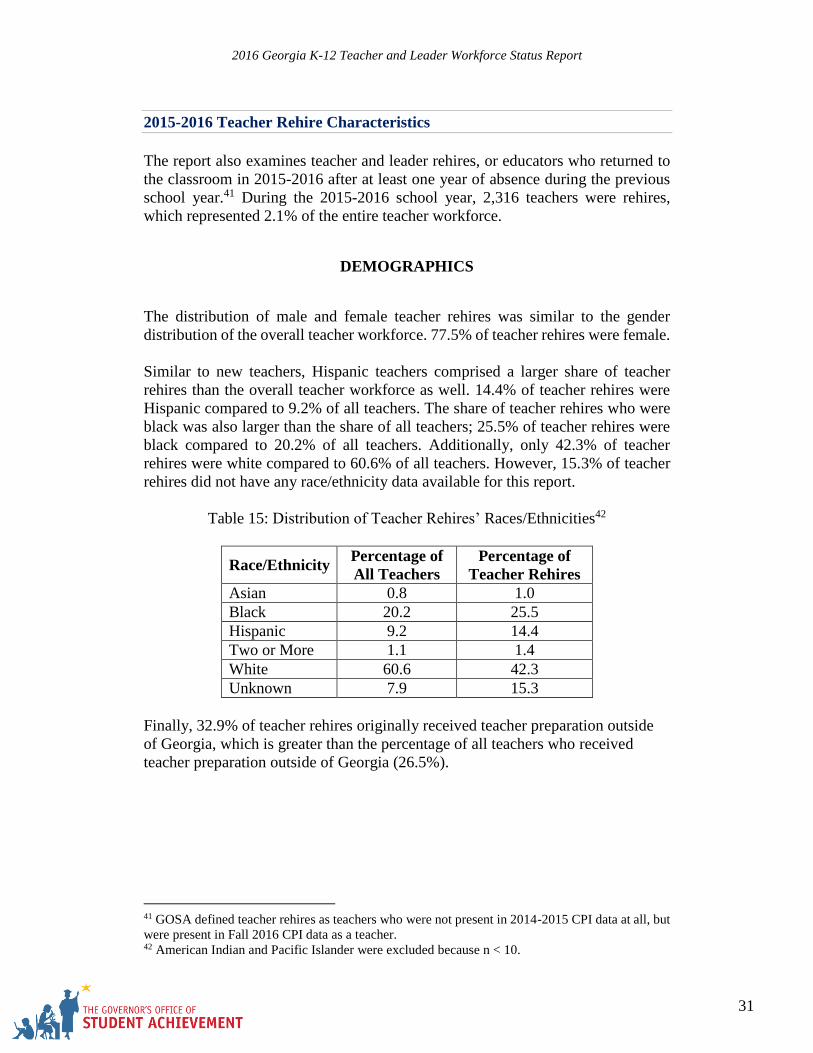
YEARS OF EXPERIENCE
When comparing the experience levels of new leaders to the entire leader
workforce, new leaders did not have as much experience working in Georgia public
education. 23.7% of new leaders had 5 or fewer years of experience in Georgia
public education, compared to only 5.1% of all leaders. Over half of new leaders
had ten or fewer years of experience, whereas almost half of all leaders (48.5%)
had between eleven to twenty years of experience. The median number of years of
experience for new leaders was 10 years compared to 17 years for the entire leader
workforce.
Figure 12: Years of Experience for New Leaders40
40 The more than thirty years of experience band was excluded because the n-size for new leaders
was too small to report.
2016 Georgia K-12 Teacher and Leader Workforce Status Report
31
2015-2016 Teacher Rehire Characteristics
The report also examines teacher and leader rehires, or educators who returned to
the classroom in 2015-2016 after at least one year of absence during the previous
school year.41 During the 2015-2016 school year, 2,316 teachers were rehires,
which represented 2.1% of the entire teacher workforce.
DEMOGRAPHICS
The distribution of male and female teacher rehires was similar to the gender
distribution of the overall teacher workforce. 77.5% of teacher rehires were female.
Similar to new teachers, Hispanic teachers comprised a larger share of teacher
rehires than the overall teacher workforce as well. 14.4% of teacher rehires were
Hispanic compared to 9.2% of all teachers. The share of teacher rehires who were
black was also larger than the share of all teachers; 25.5% of teacher rehires were
black compared to 20.2% of all teachers. Additionally, only 42.3% of teacher
rehires were white compared to 60.6% of all teachers. However, 15.3% of teacher
rehires did not have any race/ethnicity data available for this report.
Table 15: Distribution of Teacher Rehires’ Races/Ethnicities42
Race/Ethnicity Percentage of
All Teachers
Percentage of
Teacher Rehires
Asian 0.8 1.0
Black 20.2 25.5
Hispanic 9.2 14.4
Two or More 1.1 1.4
White 60.6 42.3
Unknown 7.9 15.3
Finally, 32.9% of teacher rehires originally received teacher preparation outside
of Georgia, which is greater than the percentage of all teachers who received
teacher preparation outside of Georgia (26.5%).
41 GOSA defined teacher rehires as teachers who were not present in 2014-2015 CPI data at all, but
were present in Fall 2016 CPI data as a teacher. 42 American Indian and Pacific Islander were excluded because n < 10.
2016 Georgia K-12 Teacher and Leader Workforce Status Report
32
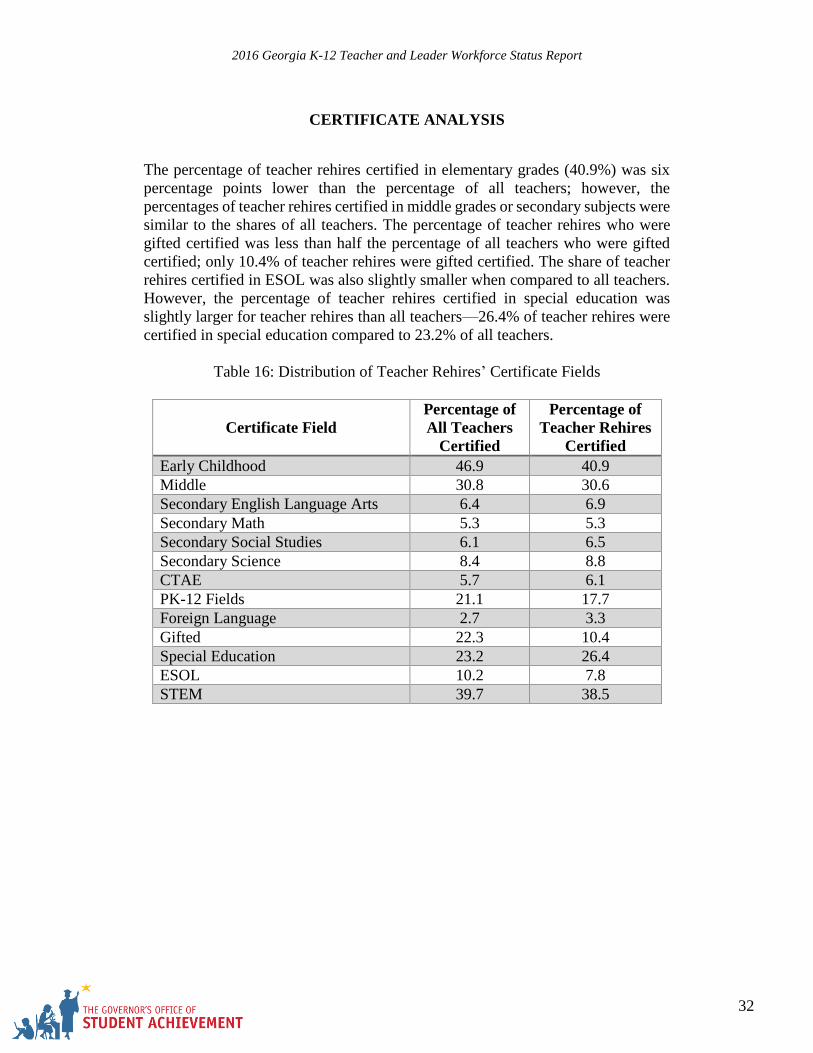
CERTIFICATE ANALYSIS
The percentage of teacher rehires certified in elementary grades (40.9%) was six
percentage points lower than the percentage of all teachers; however, the
percentages of teacher rehires certified in middle grades or secondary subjects were
similar to the shares of all teachers. The percentage of teacher rehires who were
gifted certified was less than half the percentage of all teachers who were gifted
certified; only 10.4% of teacher rehires were gifted certified. The share of teacher
rehires certified in ESOL was also slightly smaller when compared to all teachers.
However, the percentage of teacher rehires certified in special education was
slightly larger for teacher rehires than all teachers—26.4% of teacher rehires were
certified in special education compared to 23.2% of all teachers.
Table 16: Distribution of Teacher Rehires’ Certificate Fields
Certificate Field
Percentage of
All Teachers
Certified
Percentage of
Teacher Rehires
Certified
Early Childhood 46.9 40.9
Middle 30.8 30.6
Secondary English Language Arts 6.4 6.9
Secondary Math 5.3 5.3
Secondary Social Studies 6.1 6.5
Secondary Science 8.4 8.8
CTAE 5.7 6.1
PK-12 Fields 21.1 17.7
Foreign Language 2.7 3.3
Gifted 22.3 10.4
Special Education 23.2 26.4
ESOL 10.2 7.8
STEM 39.7 38.5
2016 Georgia K-12 Teacher and Leader Workforce Status Report
33
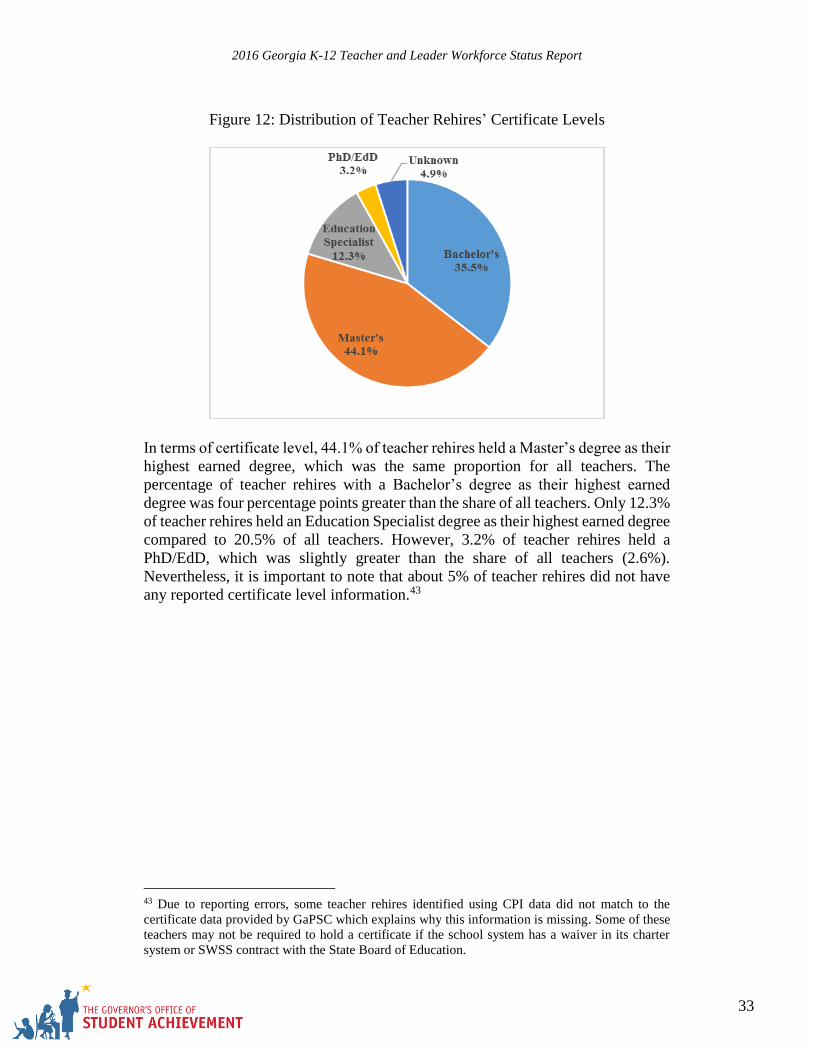
Figure 12: Distribution of Teacher Rehires’ Certificate Levels
In terms of certificate level, 44.1% of teacher rehires held a Master’s degree as their
highest earned degree, which was the same proportion for all teachers. The
percentage of teacher rehires with a Bachelor’s degree as their highest earned
degree was four percentage points greater than the share of all teachers. Only 12.3%
of teacher rehires held an Education Specialist degree as their highest earned degree
compared to 20.5% of all teachers. However, 3.2% of teacher rehires held a
PhD/EdD, which was slightly greater than the share of all teachers (2.6%).
Nevertheless, it is important to note that about 5% of teacher rehires did not have
any reported certificate level information.43
43 Due to reporting errors, some teacher rehires identified using CPI data did not match to the
certificate data provided by GaPSC which explains why this information is missing. Some of these
teachers may not be required to hold a certificate if the school system has a waiver in its charter
system or SWSS contract with the State Board of Education.
2016 Georgia K-12 Teacher and Leader Workforce Status Report
34
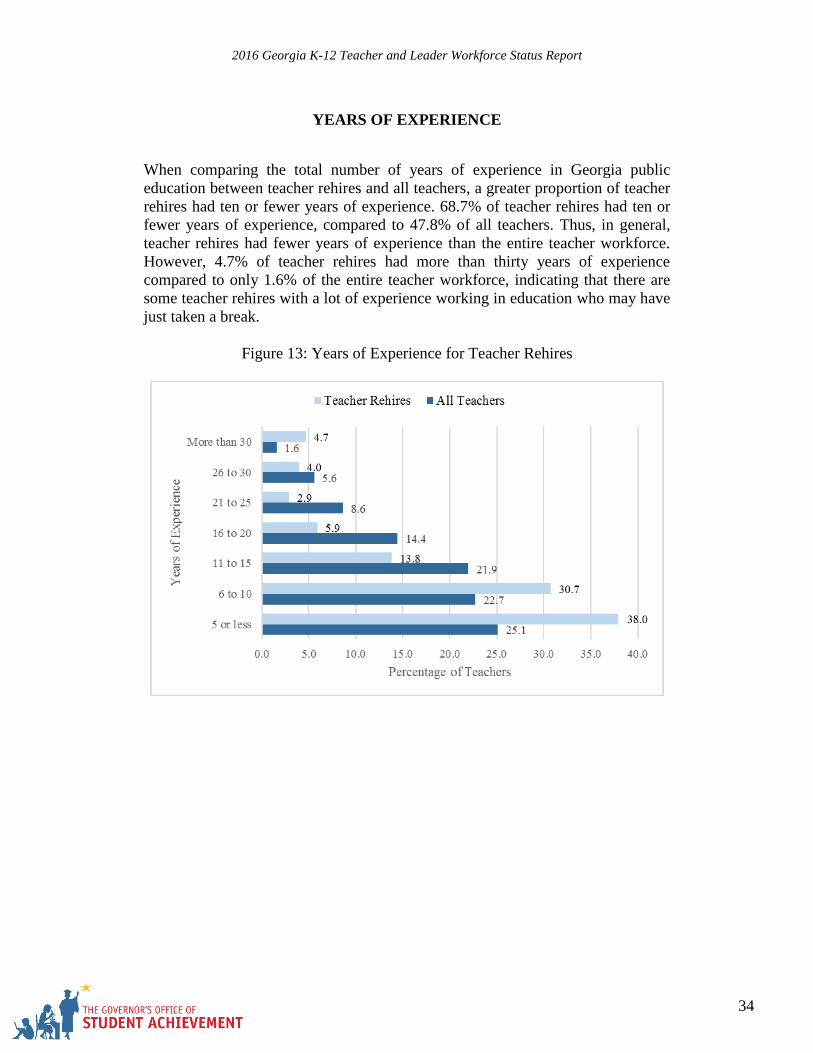
YEARS OF EXPERIENCE
When comparing the total number of years of experience in Georgia public
education between teacher rehires and all teachers, a greater proportion of teacher
rehires had ten or fewer years of experience. 68.7% of teacher rehires had ten or
fewer years of experience, compared to 47.8% of all teachers. Thus, in general,
teacher rehires had fewer years of experience than the entire teacher workforce.
However, 4.7% of teacher rehires had more than thirty years of experience
compared to only 1.6% of the entire teacher workforce, indicating that there are
some teacher rehires with a lot of experience working in education who may have
just taken a break.
Figure 13: Years of Experience for Teacher Rehires
2016 Georgia K-12 Teacher and Leader Workforce Status Report
35
2015-2016 Leader Rehire Characteristics
Out of 8,449 total leaders in 2015-2016, only 45 leaders were leader rehires, which
represented 0.5% of all leaders.44
DEMOGRAPHICS
The gender distribution of leader rehires was similar to the distribution of all
leaders. 62.2% of leader rehires were female, which was slightly lower than the
percentage of all leaders who were female (68%).
Given the small sample size of leader rehires, most leader rehire race/ethnicity
subgroups were too small to report. Nevertheless, 37.8% of leader rehires were
black, which was slightly larger than the share of all leaders who were black
(34.2%). Additionally, only 44.4% of leader rehires were white, which was much
smaller than the share of all leaders who were white (56.9%).
The percentage of leader rehires who were prepared out of state (28.9%) was just
slightly lower than the percentage of all leaders prepared out of state (30.6%).
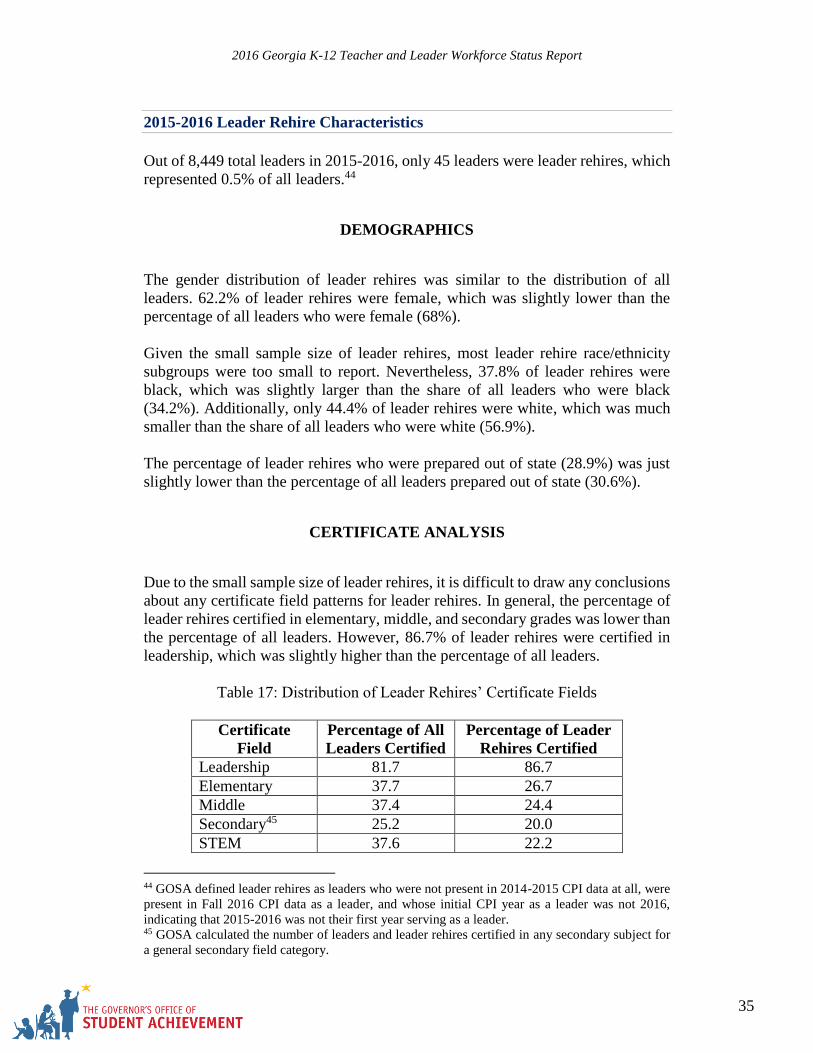
CERTIFICATE ANALYSIS
Due to the small sample size of leader rehires, it is difficult to draw any conclusions
about any certificate field patterns for leader rehires. In general, the percentage of
leader rehires certified in elementary, middle, and secondary grades was lower than
the percentage of all leaders. However, 86.7% of leader rehires were certified in
leadership, which was slightly higher than the percentage of all leaders.
Table 17: Distribution of Leader Rehires’ Certificate Fields
Certificate
Field
Percentage of All
Leaders Certified
Percentage of Leader
Rehires Certified
Leadership 81.7 86.7
Elementary 37.7 26.7
Middle 37.4 24.4
Secondary45 25.2 20.0
STEM 37.6 22.2
44 GOSA defined leader rehires as leaders who were not present in 2014-2015 CPI data at all, were
present in Fall 2016 CPI data as a leader, and whose initial CPI year as a leader was not 2016,
indicating that 2015-2016 was not their first year serving as a leader. 45 GOSA calculated the number of leaders and leader rehires certified in any secondary subject for
a general secondary field category.
2016 Georgia K-12 Teacher and Leader Workforce Status Report
36
No leader rehires had below a Master’s degree as their highest earned degree.46 In
general, the percentages of leader rehires holding a Master’s, Education Specialist,
or PhD/EdD as their highest earned degree were very similar to the percentages for
all leaders. The largest share (48.9%) of leader rehires held an Education Specialist
degree as their highest earned degree.
YEARS OF EXPERIENCE
Again, due to the small sample size of leader rehires, findings on patterns in years
of experience for leader rehires are limited. Nevertheless, the largest share of leader
rehires (26.7%) had between 26 and 30 years of experience working in Georgia
public education, which is greater than the share of all leaders with that amount of
experience (11.2%). The median number of years of experience as a leader for
leader rehires was 8 years compared to 6 years for all leaders. Though these
differences are minimal, these findings may indicate that some leader rehires have
a lot of experience working in Georgia public education and are returning as a
leader after a break.
46 GOSA did not have certificate level data on four leader rehires.
2016 Georgia K-12 Teacher and Leader Workforce Status Report
37
Teacher and Leader Production
In addition to analyzing patterns of the current teacher and leader workforce during
the 2015-2016 school year, this report also examines the teacher and leader pipeline
to the workforce using GaPSC educator preparation program (EPP) participant data
to identify patterns in teacher and leader production.47
Employment Patterns of Teacher and Leader Candidates and Completers
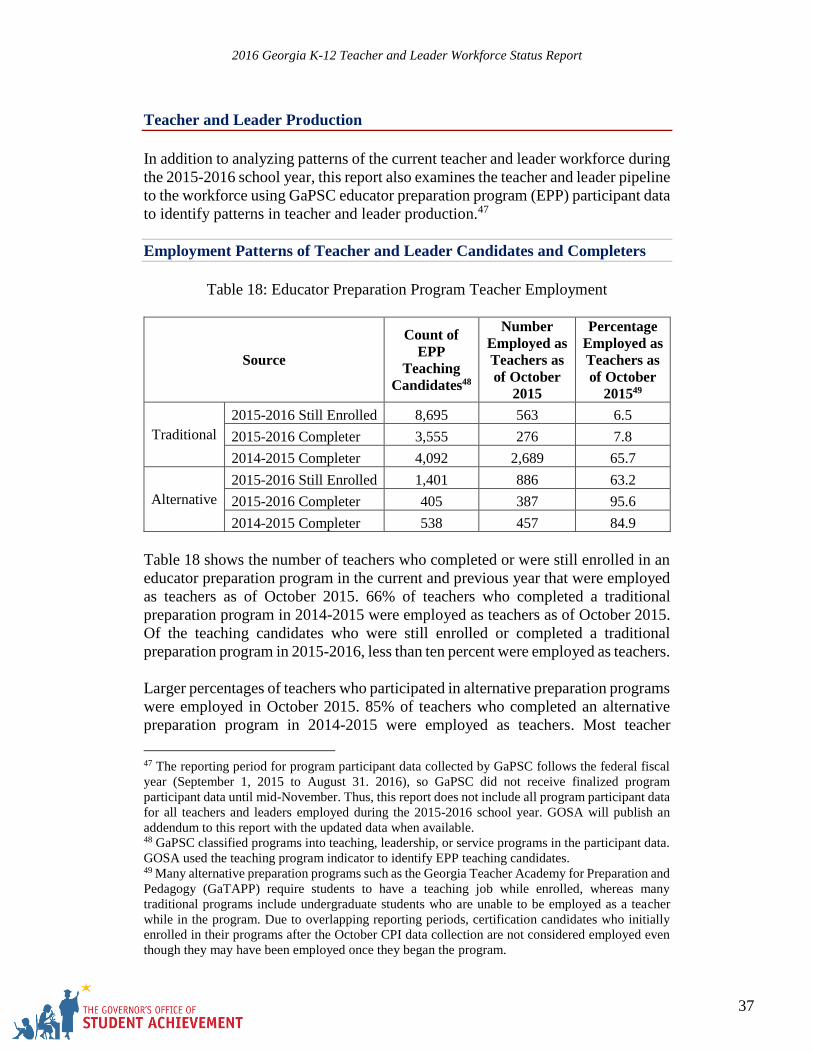
Table 18: Educator Preparation Program Teacher Employment
Source
Count of
EPP
Teaching
Candidates48
Number
Employed as
Teachers as
of October
2015
Percentage
Employed as
Teachers as
of October
201549
Traditional
2015-2016 Still Enrolled 8,695 563 6.5
2015-2016 Completer 3,555 276 7.8
2014-2015 Completer 4,092 2,689 65.7
Alternative
2015-2016 Still Enrolled 1,401 886 63.2
2015-2016 Completer 405 387 95.6
2014-2015 Completer 538 457 84.9
Table 18 shows the number of teachers who completed or were still enrolled in an
educator preparation program in the current and previous year that were employed
as teachers as of October 2015. 66% of teachers who completed a traditional
preparation program in 2014-2015 were employed as teachers as of October 2015.
Of the teaching candidates who were still enrolled or completed a traditional
preparation program in 2015-2016, less than ten percent were employed as teachers.
Larger percentages of teachers who participated in alternative preparation programs
were employed in October 2015. 85% of teachers who completed an alternative
preparation program in 2014-2015 were employed as teachers. Most teacher
47 The reporting period for program participant data collected by GaPSC follows the federal fiscal
year (September 1, 2015 to August 31. 2016), so GaPSC did not receive finalized program
participant data until mid-November. Thus, this report does not include all program participant data
for all teachers and leaders employed during the 2015-2016 school year. GOSA will publish an
addendum to this report with the updated data when available. 48 GaPSC classified programs into teaching, leadership, or service programs in the participant data.
GOSA used the teaching program indicator to identify EPP teaching candidates. 49 Many alternative preparation programs such as the Georgia Teacher Academy for Preparation and
Pedagogy (GaTAPP) require students to have a teaching job while enrolled, whereas many
traditional programs include undergraduate students who are unable to be employed as a teacher
while in the program. Due to overlapping reporting periods, certification candidates who initially
enrolled in their programs after the October CPI data collection are not considered employed even
though they may have been employed once they began the program.
2016 Georgia K-12 Teacher and Leader Workforce Status Report
38
candidates (96%) who completed an alternative preparation program during 2015-
2016 were also employed as teachers in October 2015. Additionally, 63% of teacher
candidates who were still enrolled in an alternative preparation during the 2015-
2016 school year were simultaneously employed as teachers.
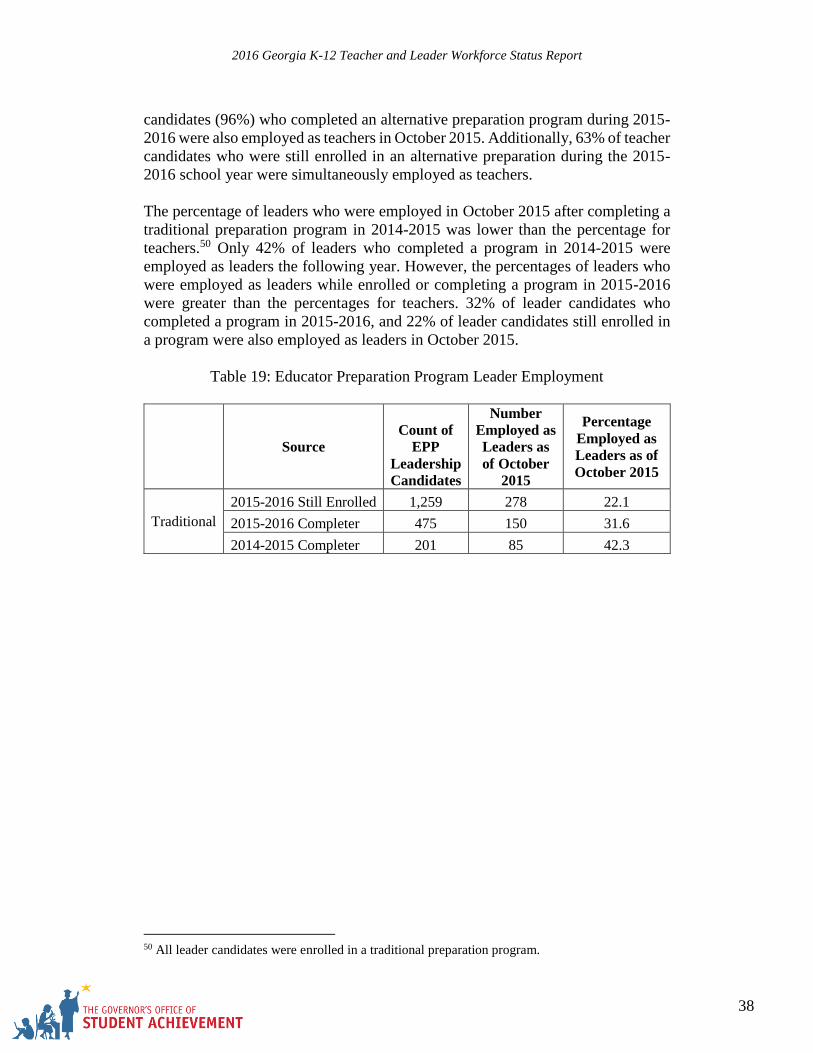
The percentage of leaders who were employed in October 2015 after completing a
traditional preparation program in 2014-2015 was lower than the percentage for
teachers.50 Only 42% of leaders who completed a program in 2014-2015 were
employed as leaders the following year. However, the percentages of leaders who
were employed as leaders while enrolled or completing a program in 2015-2016
were greater than the percentages for teachers. 32% of leader candidates who
completed a program in 2015-2016, and 22% of leader candidates still enrolled in
a program were also employed as leaders in October 2015.
Table 19: Educator Preparation Program Leader Employment
Source
Count of
EPP
Leadership
Candidates
Number
Employed as
Leaders as
of October
2015
Percentage
Employed as
Leaders as of
October 2015
Traditional
2015-2016 Still Enrolled 1,259 278 22.1
2015-2016 Completer 475 150 31.6
2014-2015 Completer 201 85 42.3
50 All leader candidates were enrolled in a traditional preparation program.
2016 Georgia K-12 Teacher and Leader Workforce Status Report
39
2015-2016 Teacher and Leader Candidate Enrollment
The report uses program participant data provided by GaPSC to examine patterns
in teacher and leader candidate enrollment during the 2015-2016 school year. All
participants who were enrolled in a program as of September 1, 2015 are included
in this analysis.51
During the 2015-2016 school year, 19,428 teacher and leader candidates were
enrolled in Georgia preparation programs. Of those enrolled, 75.3% were enrolled
in a public in-state program, 15.2% were enrolled in a private in-state program, and
9.8% were enrolled in an alternative preparation program.52
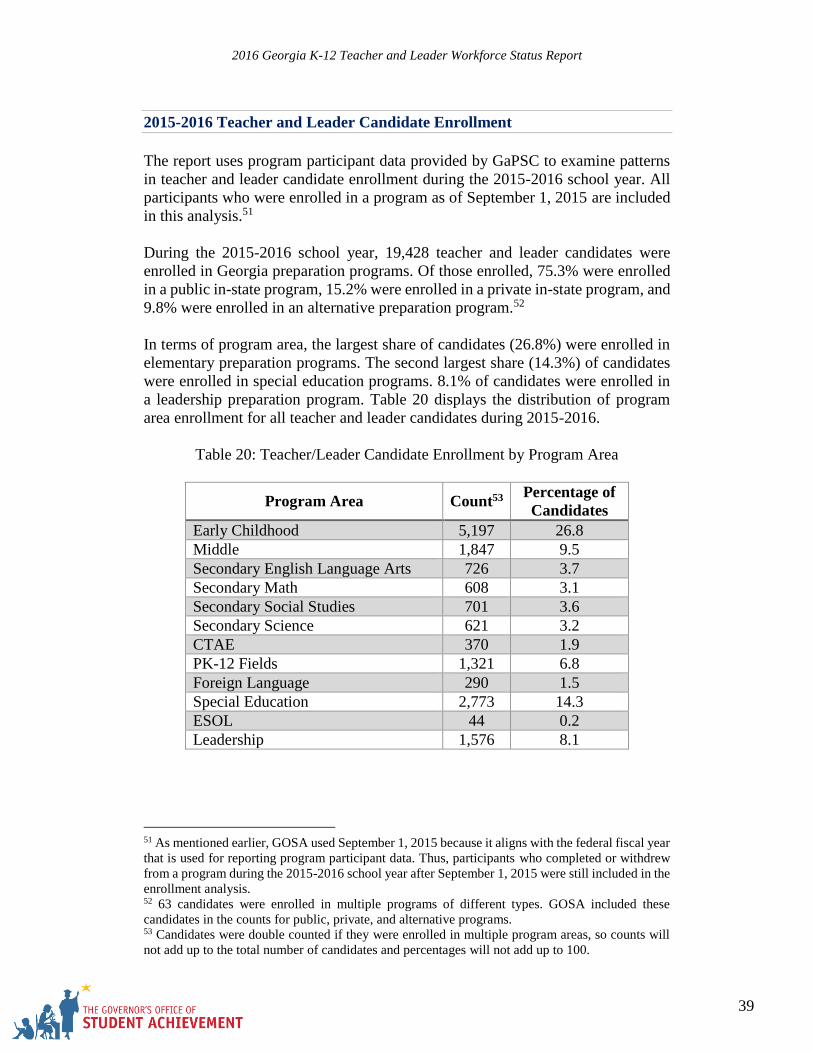
In terms of program area, the largest share of candidates (26.8%) were enrolled in
elementary preparation programs. The second largest share (14.3%) of candidates
were enrolled in special education programs. 8.1% of candidates were enrolled in
a leadership preparation program. Table 20 displays the distribution of program
area enrollment for all teacher and leader candidates during 2015-2016.
Table 20: Teacher/Leader Candidate Enrollment by Program Area
Program Area Count53 Percentage of
Candidates
Early Childhood 5,197 26.8
Middle 1,847 9.5
Secondary English Language Arts 726 3.7
Secondary Math 608 3.1
Secondary Social Studies 701 3.6
Secondary Science 621 3.2
CTAE 370 1.9
PK-12 Fields 1,321 6.8
Foreign Language 290 1.5
Special Education 2,773 14.3
ESOL 44 0.2
Leadership 1,576 8.1
51 As mentioned earlier, GOSA used September 1, 2015 because it aligns with the federal fiscal year
that is used for reporting program participant data. Thus, participants who completed or withdrew
from a program during the 2015-2016 school year after September 1, 2015 were still included in the
enrollment analysis. 52 63 candidates were enrolled in multiple programs of different types. GOSA included these
candidates in the counts for public, private, and alternative programs. 53 Candidates were double counted if they were enrolled in multiple program areas, so counts will
not add up to the total number of candidates and percentages will not add up to 100.
2016 Georgia K-12 Teacher and Leader Workforce Status Report
40
Teacher and Leader Mobility
The report analyzes teacher and leader mobility across and within school districts
to identify any potential patterns by examining whether a teacher or leader changed
school districts or schools from the 2014-2015 school year to the 2015-2016 school
year.54 The following analysis looks at teacher and leader mobility across school
districts (inter-district mobility) and within school districts (intra-district mobility).
Teacher Mobility
INTER-DISTRICT MOBILITY
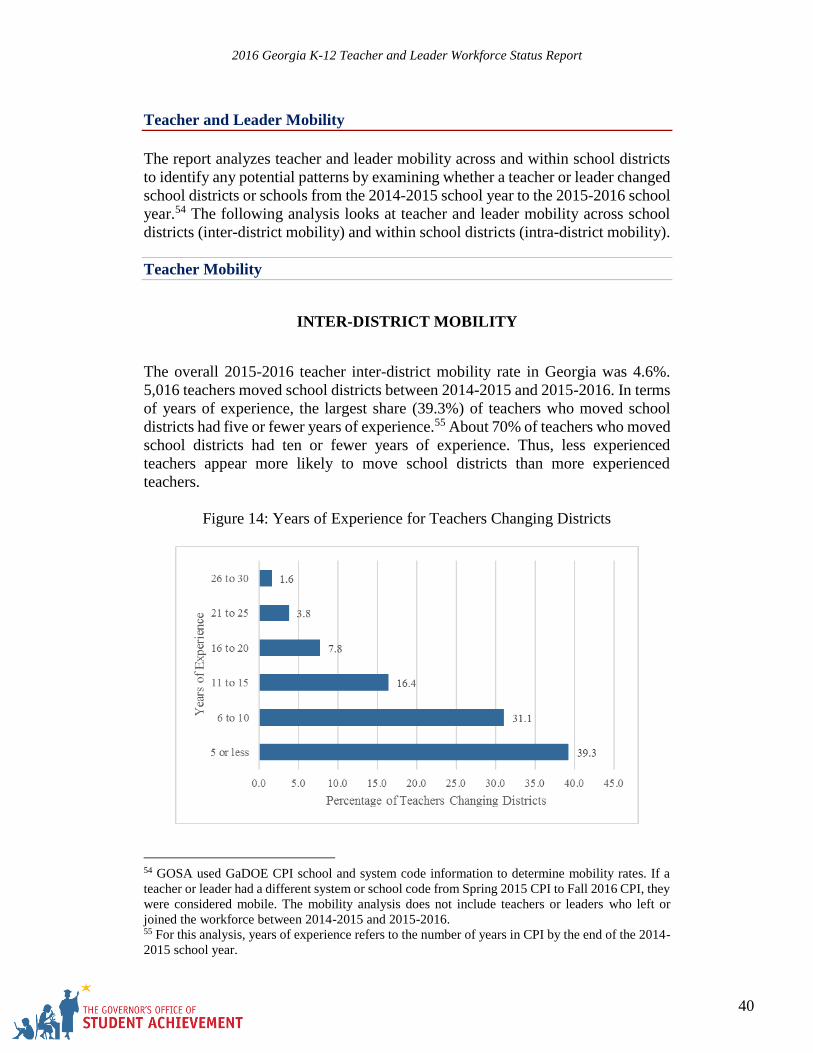
The overall 2015-2016 teacher inter-district mobility rate in Georgia was 4.6%.
5,016 teachers moved school districts between 2014-2015 and 2015-2016. In terms
of years of experience, the largest share (39.3%) of teachers who moved school
districts had five or fewer years of experience.55 About 70% of teachers who moved
school districts had ten or fewer years of experience. Thus, less experienced
teachers appear more likely to move school districts than more experienced
teachers.
Figure 14: Years of Experience for Teachers Changing Districts
54 GOSA used GaDOE CPI school and system code information to determine mobility rates. If a
teacher or leader had a different system or school code from Spring 2015 CPI to Fall 2016 CPI, they
were considered mobile. The mobility analysis does not include teachers or leaders who left or
joined the workforce between 2014-2015 and 2015-2016. 55 For this analysis, years of experience refers to the number of years in CPI by the end of the 2014-
2015 school year.
2016 Georgia K-12 Teacher and Leader Workforce Status Report
41
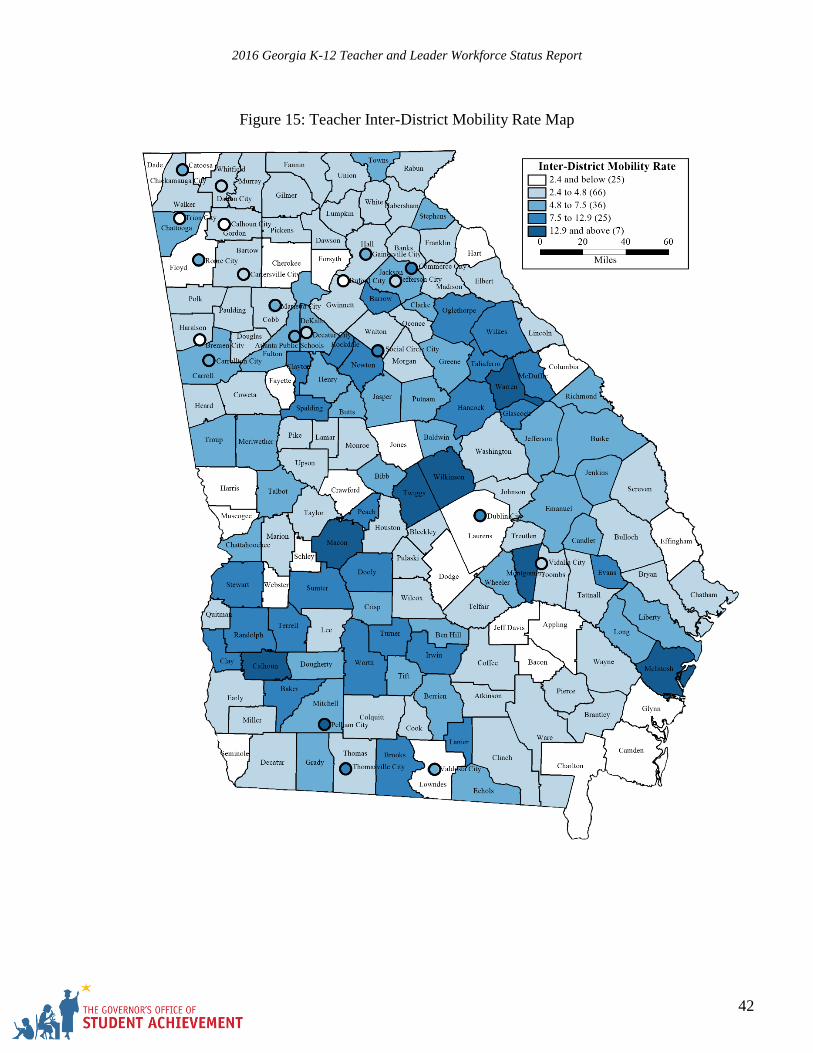
The map on the following page displays the teacher inter-district mobility rate for
each school district in Georgia.56 Macon County had the highest teacher inter-
district mobility rate of 22.3%. Calhoun County had the second highest inter-
district mobility rate at 17.5%. Although there are no clear geographic patterns, the
inter-district mobility rate map suggests that districts across middle Georgia appear
to have higher mobility rates than districts in the northernmost and southernmost
regions of the state. Additionally, Charlton County, Crawford County, Webster
County, and Trion City did not have any teachers who changed school districts
between 2014-2015 and 2015-2016.57
56 GOSA calculated the mobility rate by dividing the number of teachers who moved out of the
district in 2015-2016 by the total number of teachers in the district in Spring 2015. 57 The inter-district mobility rate for these districts was zero, but this analysis does not account for
teachers who left the workforce all together, so these districts do not necessarily have 100%
retention. Please see the Teacher Retention section of the report for this analysis.
2016 Georgia K-12 Teacher and Leader Workforce Status Report
42
Figure 15: Teacher Inter-District Mobility Rate Map
2016 Georgia K-12 Teacher and Leader Workforce Status Report
43
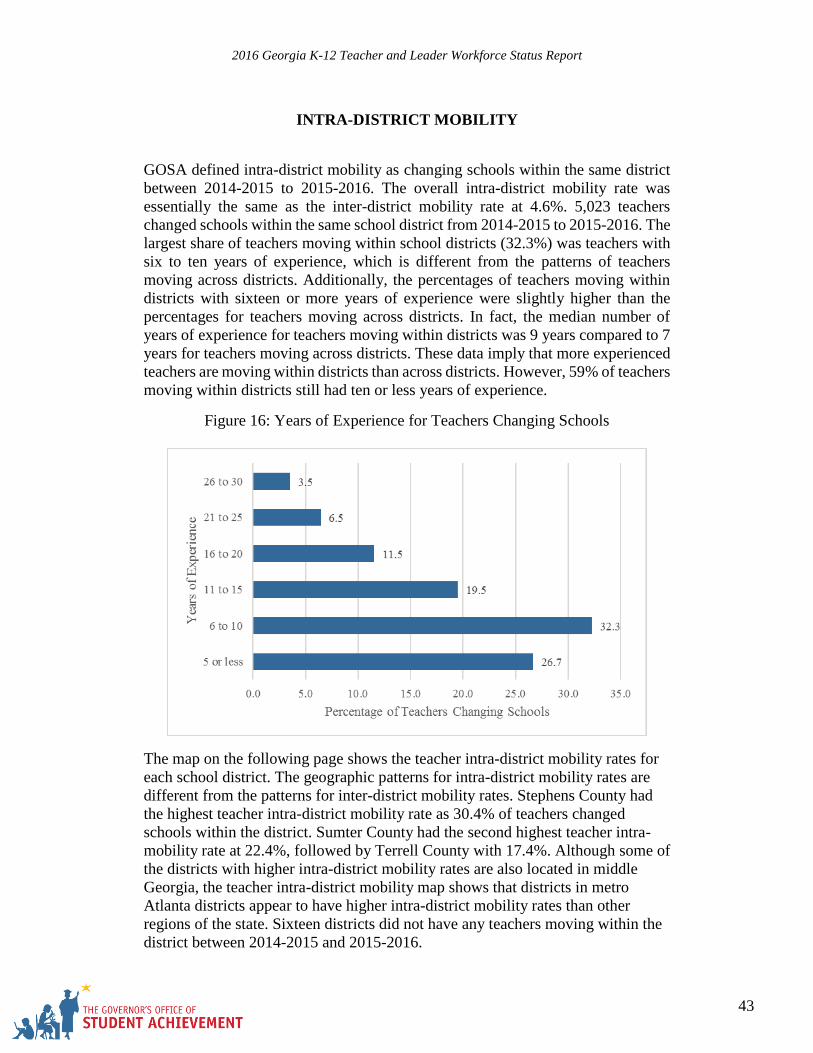
INTRA-DISTRICT MOBILITY
GOSA defined intra-district mobility as changing schools within the same district
between 2014-2015 to 2015-2016. The overall intra-district mobility rate was
essentially the same as the inter-district mobility rate at 4.6%. 5,023 teachers
changed schools within the same school district from 2014-2015 to 2015-2016. The
largest share of teachers moving within school districts (32.3%) was teachers with
six to ten years of experience, which is different from the patterns of teachers
moving across districts. Additionally, the percentages of teachers moving within
districts with sixteen or more years of experience were slightly higher than the
percentages for teachers moving across districts. In fact, the median number of
years of experience for teachers moving within districts was 9 years compared to 7
years for teachers moving across districts. These data imply that more experienced
teachers are moving within districts than across districts. However, 59% of teachers
moving within districts still had ten or less years of experience.
Figure 16: Years of Experience for Teachers Changing Schools
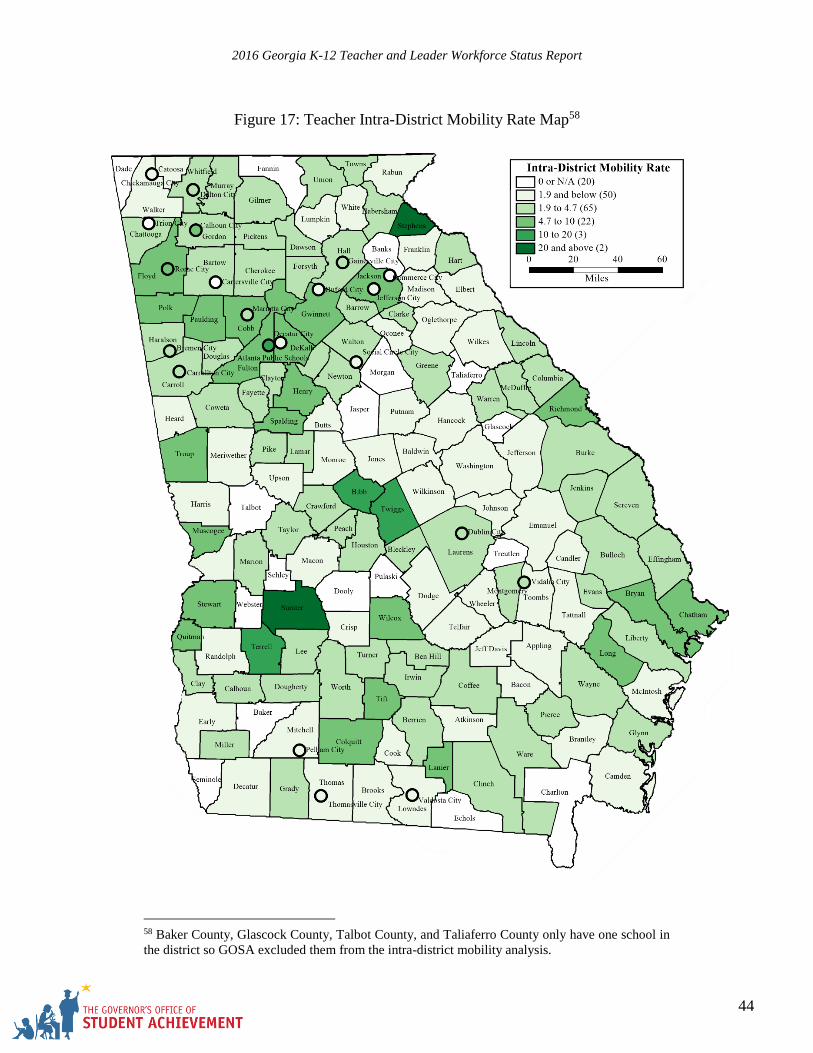
The map on the following page shows the teacher intra-district mobility rates for
each school district. The geographic patterns for intra-district mobility rates are
different from the patterns for inter-district mobility rates. Stephens County had
the highest teacher intra-district mobility rate as 30.4% of teachers changed
schools within the district. Sumter County had the second highest teacher intra-
mobility rate at 22.4%, followed by Terrell County with 17.4%. Although some of
the districts with higher intra-district mobility rates are also located in middle
Georgia, the teacher intra-district mobility map shows that districts in metro
Atlanta districts appear to have higher intra-district mobility rates than other
regions of the state. Sixteen districts did not have any teachers moving within the
district between 2014-2015 and 2015-2016.
2016 Georgia K-12 Teacher and Leader Workforce Status Report
44
Figure 17: Teacher Intra-District Mobility Rate Map58
58 Baker County, Glascock County, Talbot County, and Taliaferro County only have one school in
the district so GOSA excluded them from the intra-district mobility analysis.
2016 Georgia K-12 Teacher and Leader Workforce Status Report
45
TEACHER MOBILITY IN HIGH POVERTY AND LOW POVERTY
SCHOOLS
To analyze mobility patterns in high poverty and low poverty schools, GOSA
calculated a mobility rate for each school and averaged the mobility rates for high
poverty and low poverty schools for comparison.59 The average mobility rate in
high poverty schools was 14.7%, which was more than double the average
mobility rate for low poverty schools (6.5%); using a two sample t-test, this
difference is statistically significant (p < 0.05). Similarly, when analyzing the total
counts of teachers who changed schools in high poverty and low poverty schools,
14.3% of teachers in high poverty schools changed schools from 2014-2015 to
2015-2016 compared to 6.3% of teachers in low poverty schools; this difference
was also statistically significant using a t-test of proportions (p < 0.05). Thus, in
2015-2016, high poverty schools appeared to have more teachers changing
schools between school years than low poverty schools.
59 The school mobility rate was calculated by dividing the number of teachers who changed schools
from 2014-2015 to 2015-2016 by the number of teachers in the school in 2014-2015.
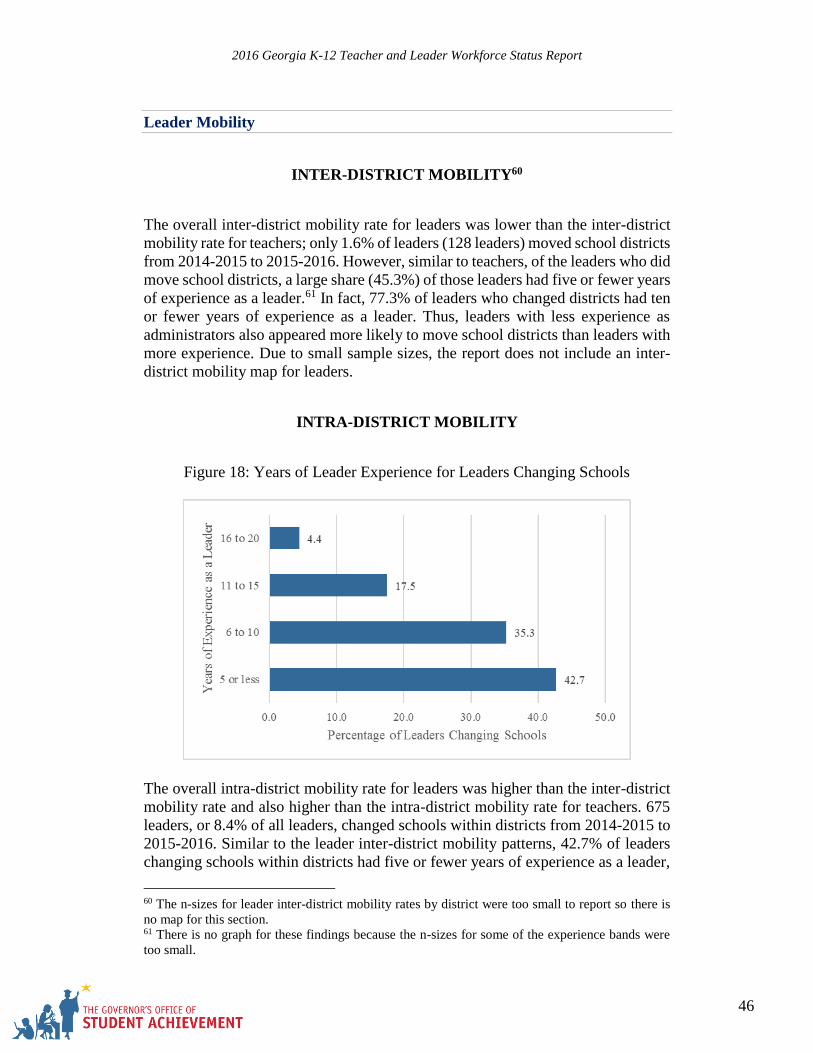
2016 Georgia K-12 Teacher and Leader Workforce Status Report
46
Leader Mobility
INTER-DISTRICT MOBILITY60
The overall inter-district mobility rate for leaders was lower than the inter-district
mobility rate for teachers; only 1.6% of leaders (128 leaders) moved school districts
from 2014-2015 to 2015-2016. However, similar to teachers, of the leaders who did
move school districts, a large share (45.3%) of those leaders had five or fewer years
of experience as a leader.61 In fact, 77.3% of leaders who changed districts had ten
or fewer years of experience as a leader. Thus, leaders with less experience as
administrators also appeared more likely to move school districts than leaders with
more experience. Due to small sample sizes, the report does not include an inter-
district mobility map for leaders.
INTRA-DISTRICT MOBILITY
Figure 18: Years of Leader Experience for Leaders Changing Schools
The overall intra-district mobility rate for leaders was higher than the inter-district
mobility rate and also higher than the intra-district mobility rate for teachers. 675
leaders, or 8.4% of all leaders, changed schools within districts from 2014-2015 to
2015-2016. Similar to the leader inter-district mobility patterns, 42.7% of leaders
changing schools within districts had five or fewer years of experience as a leader,
60 The n-sizes for leader inter-district mobility rates by district were too small to report so there is
no map for this section. 61 There is no graph for these findings because the n-sizes for some of the experience bands were
too small.
2016 Georgia K-12 Teacher and Leader Workforce Status Report
47
and 78% of these leaders had ten or fewer years of experience as a leader.
Therefore, leaders who changed schools within the same district also appeared to
have less experience as a leader.
Burke County had one of the highest leader intra-mobility rates with 40.7% of
leaders changing schools between school years. Whitfield County and Richmond
County both had around 25% of leaders who moved schools within the district.
However, for many districts, the numbers of leaders and leaders who moved
within the district were too small to include in this report, so the report does not
include a leader intra-mobility rate map. Additionally, many districts did not have
any leaders who changed schools between 2014-2015 and 2015-2016.
LEADER MOBILITY IN HIGH POVERTY AND LOW POVERTY
SCHOOLS
The average leader mobility rate in high poverty schools was 15% compared to
8.7% of leaders changing schools in low poverty schools; using a two sample t-
test, this difference is statistically significant (p < 0.05). However, it is important
to note that the number of leaders in a single school is small, so school mobility
rates for leaders have a wide range and many schools had zero leaders changing
schools. Furthermore, when analyzing the total counts of leaders who changed
schools in high poverty and low poverty schools, 14.1% of leaders in high poverty
schools changed schools after the 2014-2015 school year compared to 8.3% of
leaders in low poverty schools; this difference was also statistically significant
using a t-test of proportions (p < 0.05). Therefore, similar to teachers, high
poverty schools seemed to have more leaders who changed schools from 2014-
2015 to 2015-2016 than low poverty schools.
2016 Georgia K-12 Teacher and Leader Workforce Status Report
48
Teacher and Leader Retention
Teacher and leader retention patterns are important for assessing the stability of the
educator workforce in Georgia, which can have implications for student
achievement. GOSA considered teachers and leaders retained if they were present
in their respective roles in the spring of 2014-2015 and fall of 2015-2016.62 Table
21 below shows the overall retention rates for teachers and leaders. From 2014-
2015 to 2015-2016, 90.5% of teachers and leaders remained in their respective role
between school years. The leader retention rate was 4.6 percentage points lower
than the retention rate for teachers. Additionally, 1,122 teachers (1% of teachers)
became leaders from 2014-2015 to 2015-2016.
Table 21: Teacher and Leader Retention
Spring 2014-
2015 Count
Fall 2015-
2016 Count
Retention
Percentage
Teachers 109,327 99,317 90.8
Leaders 8,011 6,904 86.2
Total 117,338 106,221 90.5
Retention of Teachers
The following sections explore the demographic characteristics and certificate
fields of all teachers who were retained from 2014-2015 to 2015-2016 to identify
any patterns.
DEMOGRAPHICS
No significant teacher retention patterns by gender and race/ethnicity emerged.
Approximately 91% of males and females were retained from 2014-2015 to 2015-
2016.
Table 22 displays the retention percentages for each race/ethnicity subgroup. The
retention percentage of Asian teachers was slightly lower than the percentages for
all other races/ethnicities.
62 Teachers were retained if they were present in Spring 2015 CPI and Fall 2016 CPI as a teacher
(defined by job code). Leaders were retained if they were present in Spring 2015 CPI and Fall 2016
CPI as a leader (defined by job code). All retention percentages use 2014-2015 counts as the
denominator.
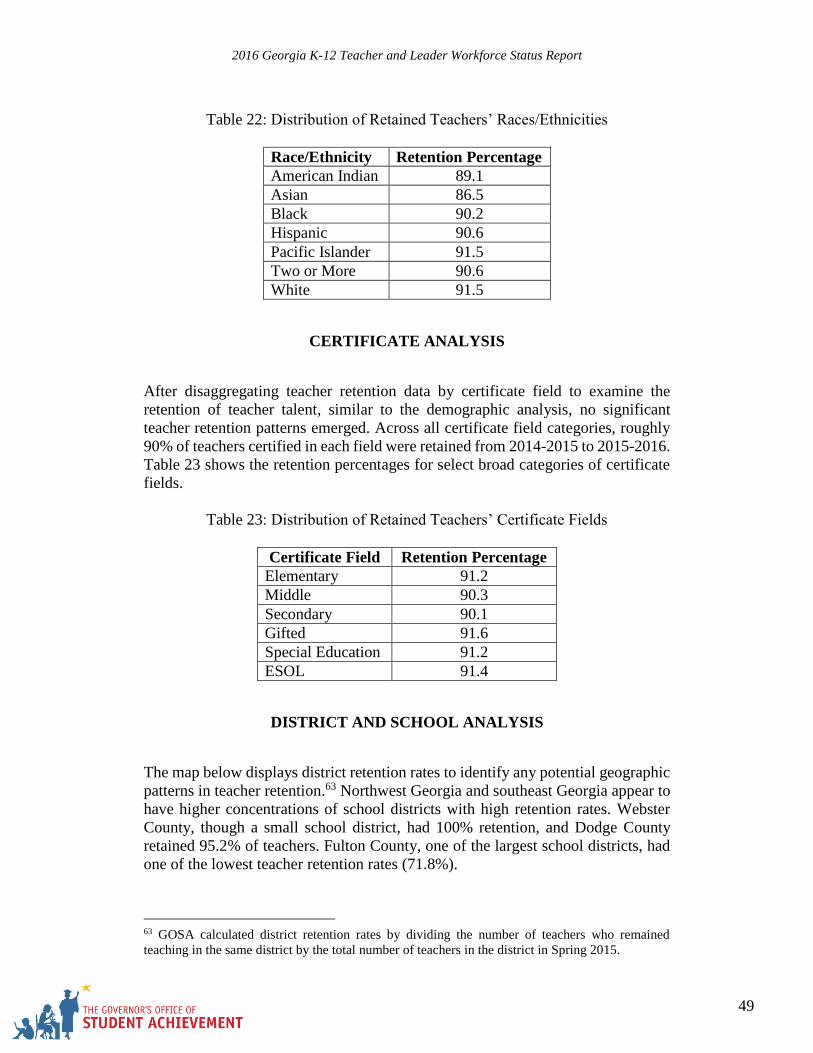
2016 Georgia K-12 Teacher and Leader Workforce Status Report
49
Table 22: Distribution of Retained Teachers’ Races/Ethnicities
Race/Ethnicity Retention Percentage
American Indian 89.1
Asian 86.5
Black 90.2
Hispanic 90.6
Pacific Islander 91.5
Two or More 90.6
White 91.5
CERTIFICATE ANALYSIS
After disaggregating teacher retention data by certificate field to examine the
retention of teacher talent, similar to the demographic analysis, no significant
teacher retention patterns emerged. Across all certificate field categories, roughly
90% of teachers certified in each field were retained from 2014-2015 to 2015-2016.
Table 23 shows the retention percentages for select broad categories of certificate
fields.
Table 23: Distribution of Retained Teachers’ Certificate Fields
Certificate Field Retention Percentage
Elementary 91.2
Middle 90.3
Secondary 90.1
Gifted 91.6
Special Education 91.2
ESOL 91.4
DISTRICT AND SCHOOL ANALYSIS
The map below displays district retention rates to identify any potential geographic
patterns in teacher retention.63 Northwest Georgia and southeast Georgia appear to
have higher concentrations of school districts with high retention rates. Webster
County, though a small school district, had 100% retention, and Dodge County
retained 95.2% of teachers. Fulton County, one of the largest school districts, had
one of the lowest teacher retention rates (71.8%).
63 GOSA calculated district retention rates by dividing the number of teachers who remained
teaching in the same district by the total number of teachers in the district in Spring 2015.
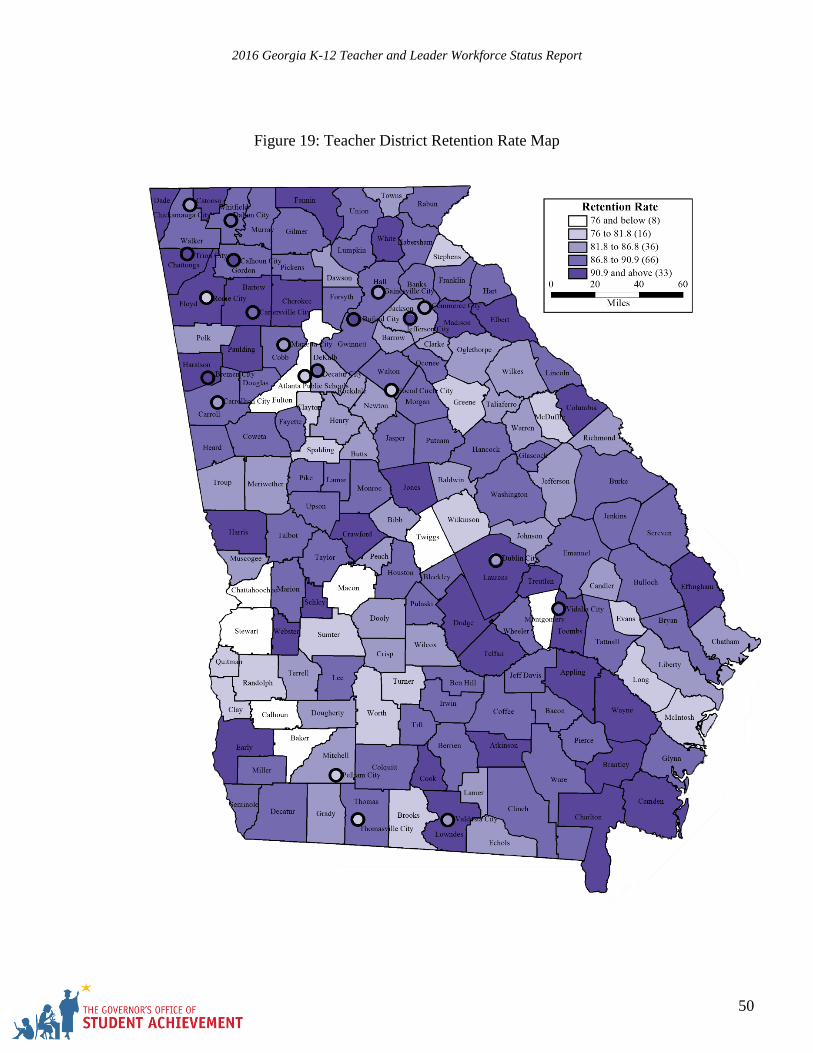
2016 Georgia K-12 Teacher and Leader Workforce Status Report
50
Figure 19: Teacher District Retention Rate Map
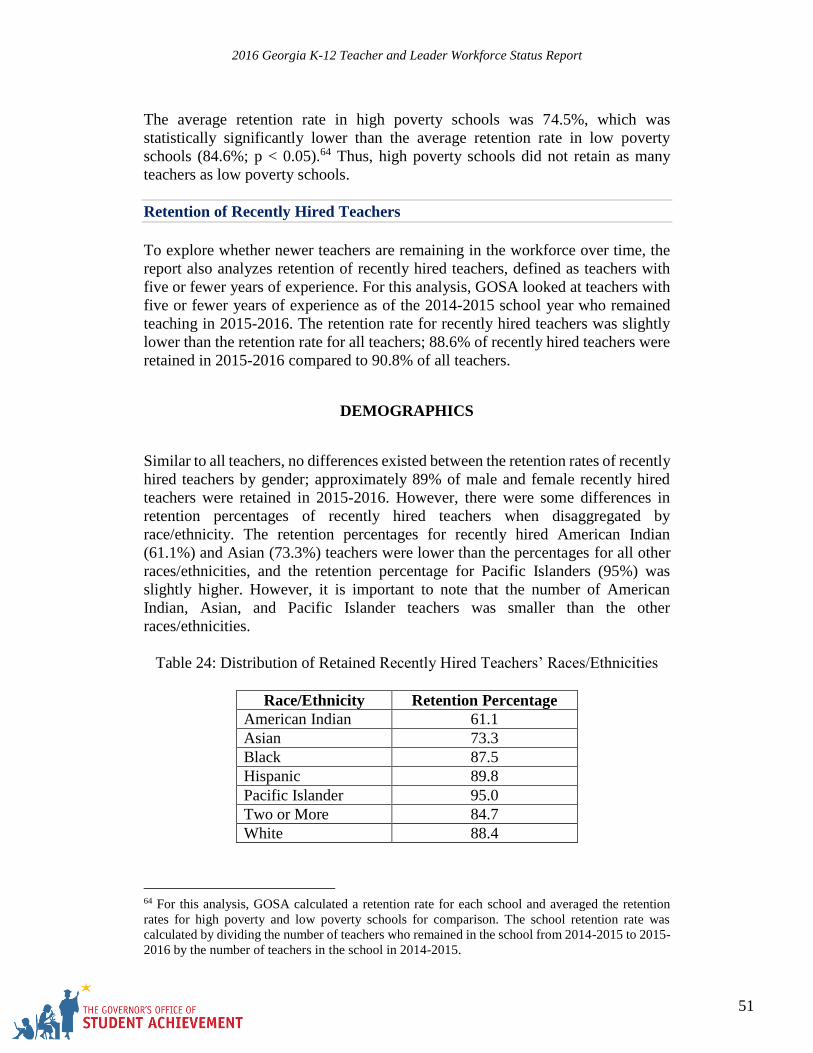
2016 Georgia K-12 Teacher and Leader Workforce Status Report
51
The average retention rate in high poverty schools was 74.5%, which was
statistically significantly lower than the average retention rate in low poverty
schools (84.6%; p < 0.05).64 Thus, high poverty schools did not retain as many
teachers as low poverty schools.
Retention of Recently Hired Teachers
To explore whether newer teachers are remaining in the workforce over time, the
report also analyzes retention of recently hired teachers, defined as teachers with
five or fewer years of experience. For this analysis, GOSA looked at teachers with
five or fewer years of experience as of the 2014-2015 school year who remained
teaching in 2015-2016. The retention rate for recently hired teachers was slightly
lower than the retention rate for all teachers; 88.6% of recently hired teachers were
retained in 2015-2016 compared to 90.8% of all teachers.
DEMOGRAPHICS
Similar to all teachers, no differences existed between the retention rates of recently
hired teachers by gender; approximately 89% of male and female recently hired
teachers were retained in 2015-2016. However, there were some differences in
retention percentages of recently hired teachers when disaggregated by
race/ethnicity. The retention percentages for recently hired American Indian
(61.1%) and Asian (73.3%) teachers were lower than the percentages for all other
races/ethnicities, and the retention percentage for Pacific Islanders (95%) was
slightly higher. However, it is important to note that the number of American
Indian, Asian, and Pacific Islander teachers was smaller than the other
races/ethnicities.
Table 24: Distribution of Retained Recently Hired Teachers’ Races/Ethnicities
Race/Ethnicity Retention Percentage
American Indian 61.1
Asian 73.3
Black 87.5
Hispanic 89.8
Pacific Islander 95.0
Two or More 84.7
White 88.4
64 For this analysis, GOSA calculated a retention rate for each school and averaged the retention
rates for high poverty and low poverty schools for comparison. The school retention rate was
calculated by dividing the number of teachers who remained in the school from 2014-2015 to 2015-
2016 by the number of teachers in the school in 2014-2015.
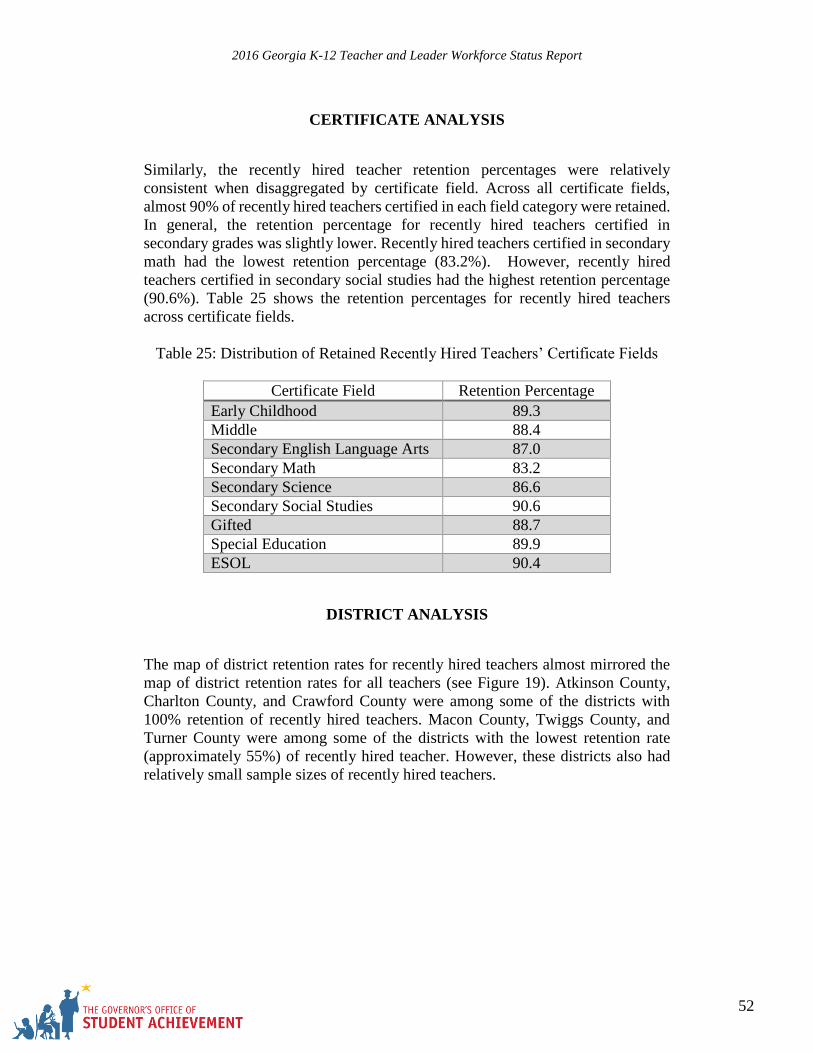
2016 Georgia K-12 Teacher and Leader Workforce Status Report
52
CERTIFICATE ANALYSIS
Similarly, the recently hired teacher retention percentages were relatively
consistent when disaggregated by certificate field. Across all certificate fields,
almost 90% of recently hired teachers certified in each field category were retained.
In general, the retention percentage for recently hired teachers certified in
secondary grades was slightly lower. Recently hired teachers certified in secondary
math had the lowest retention percentage (83.2%). However, recently hired
teachers certified in secondary social studies had the highest retention percentage
(90.6%). Table 25 shows the retention percentages for recently hired teachers
across certificate fields.
Table 25: Distribution of Retained Recently Hired Teachers’ Certificate Fields
Certificate Field Retention Percentage
Early Childhood 89.3
Middle 88.4
Secondary English Language Arts 87.0
Secondary Math 83.2
Secondary Science 86.6
Secondary Social Studies 90.6
Gifted 88.7
Special Education 89.9
ESOL 90.4
DISTRICT ANALYSIS
The map of district retention rates for recently hired teachers almost mirrored the
map of district retention rates for all teachers (see Figure 19). Atkinson County,
Charlton County, and Crawford County were among some of the districts with
100% retention of recently hired teachers. Macon County, Twiggs County, and
Turner County were among some of the districts with the lowest retention rate
(approximately 55%) of recently hired teacher. However, these districts also had
relatively small sample sizes of recently hired teachers.
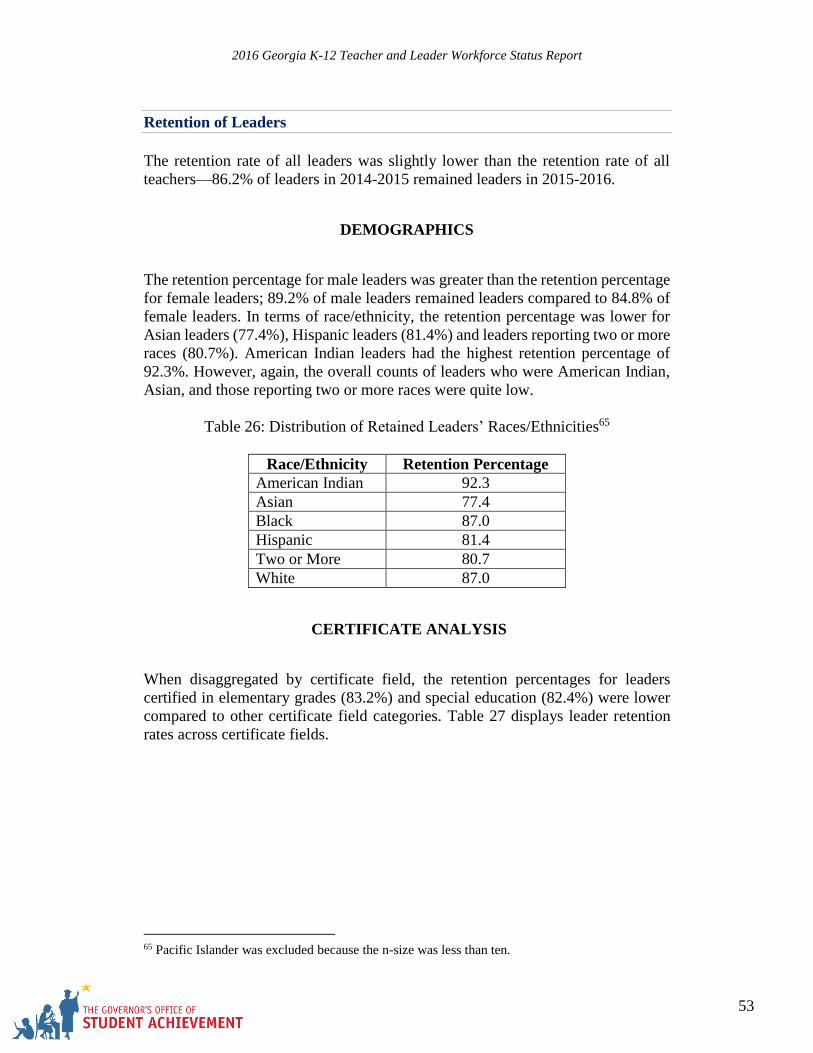
2016 Georgia K-12 Teacher and Leader Workforce Status Report
53
Retention of Leaders
The retention rate of all leaders was slightly lower than the retention rate of all
teachers—86.2% of leaders in 2014-2015 remained leaders in 2015-2016.
DEMOGRAPHICS
The retention percentage for male leaders was greater than the retention percentage
for female leaders; 89.2% of male leaders remained leaders compared to 84.8% of
female leaders. In terms of race/ethnicity, the retention percentage was lower for
Asian leaders (77.4%), Hispanic leaders (81.4%) and leaders reporting two or more
races (80.7%). American Indian leaders had the highest retention percentage of
92.3%. However, again, the overall counts of leaders who were American Indian,
Asian, and those reporting two or more races were quite low.
Table 26: Distribution of Retained Leaders’ Races/Ethnicities65
Race/Ethnicity Retention Percentage
American Indian 92.3
Asian 77.4
Black 87.0
Hispanic 81.4
Two or More 80.7
White 87.0
CERTIFICATE ANALYSIS
When disaggregated by certificate field, the retention percentages for leaders
certified in elementary grades (83.2%) and special education (82.4%) were lower
compared to other certificate field categories. Table 27 displays leader retention
rates across certificate fields.
65 Pacific Islander was excluded because the n-size was less than ten.
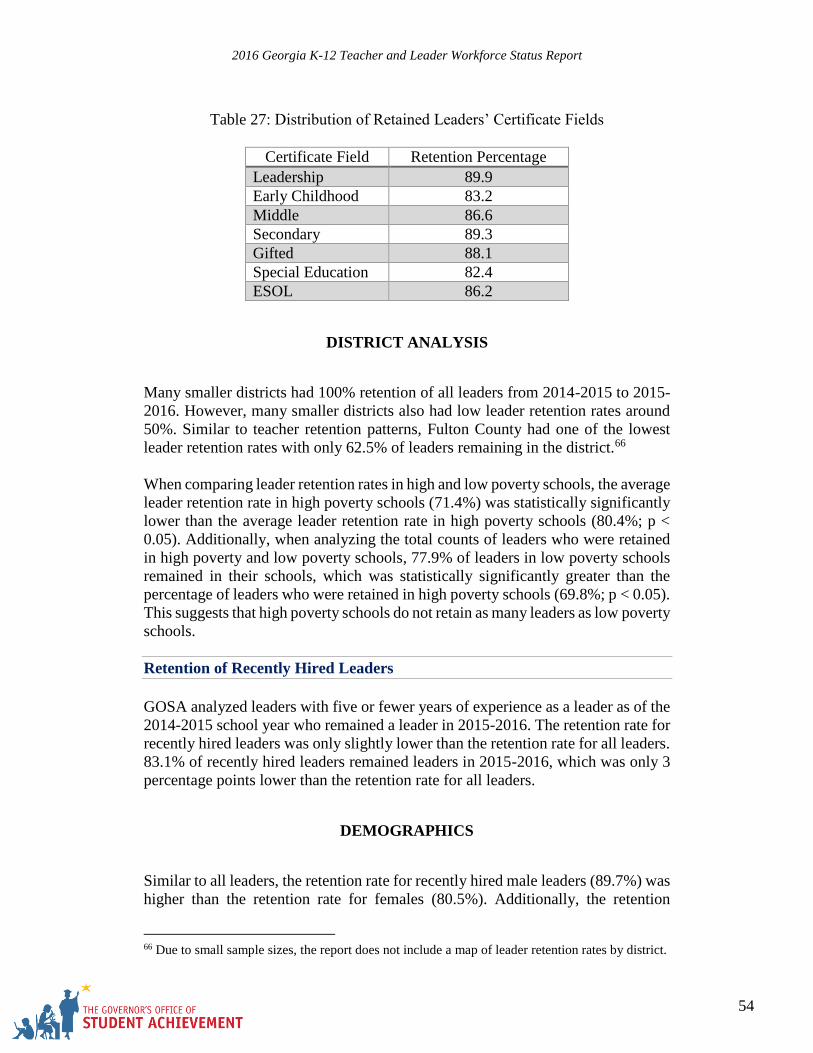
2016 Georgia K-12 Teacher and Leader Workforce Status Report
54
Table 27: Distribution of Retained Leaders’ Certificate Fields
Certificate Field Retention Percentage
Leadership 89.9
Early Childhood 83.2
Middle 86.6
Secondary 89.3
Gifted 88.1
Special Education 82.4
ESOL 86.2
DISTRICT ANALYSIS
Many smaller districts had 100% retention of all leaders from 2014-2015 to 2015-
2016. However, many smaller districts also had low leader retention rates around
50%. Similar to teacher retention patterns, Fulton County had one of the lowest
leader retention rates with only 62.5% of leaders remaining in the district.66
When comparing leader retention rates in high and low poverty schools, the average
leader retention rate in high poverty schools (71.4%) was statistically significantly
lower than the average leader retention rate in high poverty schools (80.4%; p <
0.05). Additionally, when analyzing the total counts of leaders who were retained
in high poverty and low poverty schools, 77.9% of leaders in low poverty schools
remained in their schools, which was statistically significantly greater than the
percentage of leaders who were retained in high poverty schools (69.8%; p < 0.05).
This suggests that high poverty schools do not retain as many leaders as low poverty
schools.
Retention of Recently Hired Leaders
GOSA analyzed leaders with five or fewer years of experience as a leader as of the
2014-2015 school year who remained a leader in 2015-2016. The retention rate for
recently hired leaders was only slightly lower than the retention rate for all leaders.
83.1% of recently hired leaders remained leaders in 2015-2016, which was only 3
percentage points lower than the retention rate for all leaders.
DEMOGRAPHICS
Similar to all leaders, the retention rate for recently hired male leaders (89.7%) was
higher than the retention rate for females (80.5%). Additionally, the retention
66 Due to small sample sizes, the report does not include a map of leader retention rates by district.
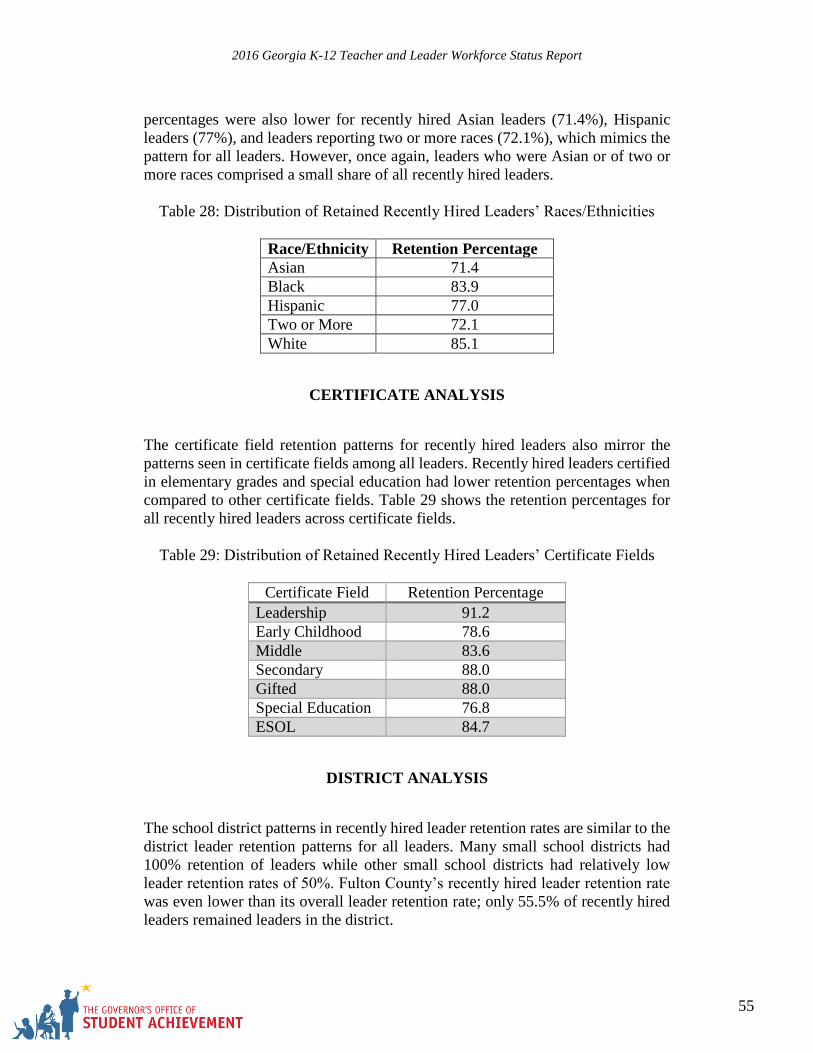
2016 Georgia K-12 Teacher and Leader Workforce Status Report
55
percentages were also lower for recently hired Asian leaders (71.4%), Hispanic
leaders (77%), and leaders reporting two or more races (72.1%), which mimics the
pattern for all leaders. However, once again, leaders who were Asian or of two or
more races comprised a small share of all recently hired leaders.
Table 28: Distribution of Retained Recently Hired Leaders’ Races/Ethnicities
Race/Ethnicity Retention Percentage
Asian 71.4
Black 83.9
Hispanic 77.0
Two or More 72.1
White 85.1
CERTIFICATE ANALYSIS
The certificate field retention patterns for recently hired leaders also mirror the
patterns seen in certificate fields among all leaders. Recently hired leaders certified
in elementary grades and special education had lower retention percentages when
compared to other certificate fields. Table 29 shows the retention percentages for
all recently hired leaders across certificate fields.
Table 29: Distribution of Retained Recently Hired Leaders’ Certificate Fields
Certificate Field Retention Percentage
Leadership 91.2
Early Childhood 78.6
Middle 83.6
Secondary 88.0
Gifted 88.0
Special Education 76.8
ESOL 84.7
DISTRICT ANALYSIS
The school district patterns in recently hired leader retention rates are similar to the
district leader retention patterns for all leaders. Many small school districts had
100% retention of leaders while other small school districts had relatively low
leader retention rates of 50%. Fulton County’s recently hired leader retention rate
was even lower than its overall leader retention rate; only 55.5% of recently hired
leaders remained leaders in the district.
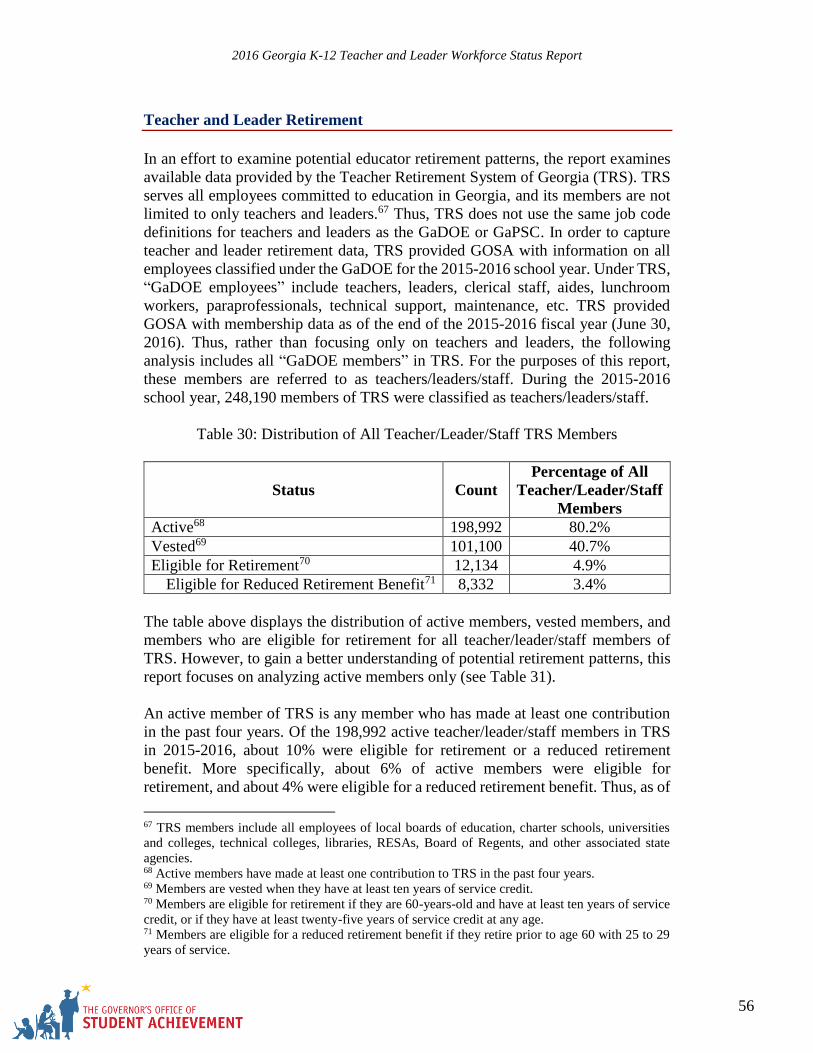
2016 Georgia K-12 Teacher and Leader Workforce Status Report
56
Teacher and Leader Retirement
In an effort to examine potential educator retirement patterns, the report examines
available data provided by the Teacher Retirement System of Georgia (TRS). TRS
serves all employees committed to education in Georgia, and its members are not
limited to only teachers and leaders.67 Thus, TRS does not use the same job code
definitions for teachers and leaders as the GaDOE or GaPSC. In order to capture
teacher and leader retirement data, TRS provided GOSA with information on all
employees classified under the GaDOE for the 2015-2016 school year. Under TRS,
“GaDOE employees” include teachers, leaders, clerical staff, aides, lunchroom
workers, paraprofessionals, technical support, maintenance, etc. TRS provided
GOSA with membership data as of the end of the 2015-2016 fiscal year (June 30,
2016). Thus, rather than focusing only on teachers and leaders, the following
analysis includes all “GaDOE members” in TRS. For the purposes of this report,
these members are referred to as teachers/leaders/staff. During the 2015-2016
school year, 248,190 members of TRS were classified as teachers/leaders/staff.
Table 30: Distribution of All Teacher/Leader/Staff TRS Members
Status Count
Percentage of All
Teacher/Leader/Staff
Members
Active68 198,992 80.2%
Vested69 101,100 40.7%
Eligible for Retirement70 12,134 4.9%
Eligible for Reduced Retirement Benefit71 8,332 3.4%
The table above displays the distribution of active members, vested members, and
members who are eligible for retirement for all teacher/leader/staff members of
TRS. However, to gain a better understanding of potential retirement patterns, this
report focuses on analyzing active members only (see Table 31).
An active member of TRS is any member who has made at least one contribution
in the past four years. Of the 198,992 active teacher/leader/staff members in TRS
in 2015-2016, about 10% were eligible for retirement or a reduced retirement
benefit. More specifically, about 6% of active members were eligible for
retirement, and about 4% were eligible for a reduced retirement benefit. Thus, as of
67 TRS members include all employees of local boards of education, charter schools, universities
and colleges, technical colleges, libraries, RESAs, Board of Regents, and other associated state
agencies. 68 Active members have made at least one contribution to TRS in the past four years. 69 Members are vested when they have at least ten years of service credit. 70 Members are eligible for retirement if they are 60-years-old and have at least ten years of service
credit, or if they have at least twenty-five years of service credit at any age. 71 Members are eligible for a reduced retirement benefit if they retire prior to age 60 with 25 to 29
years of service.
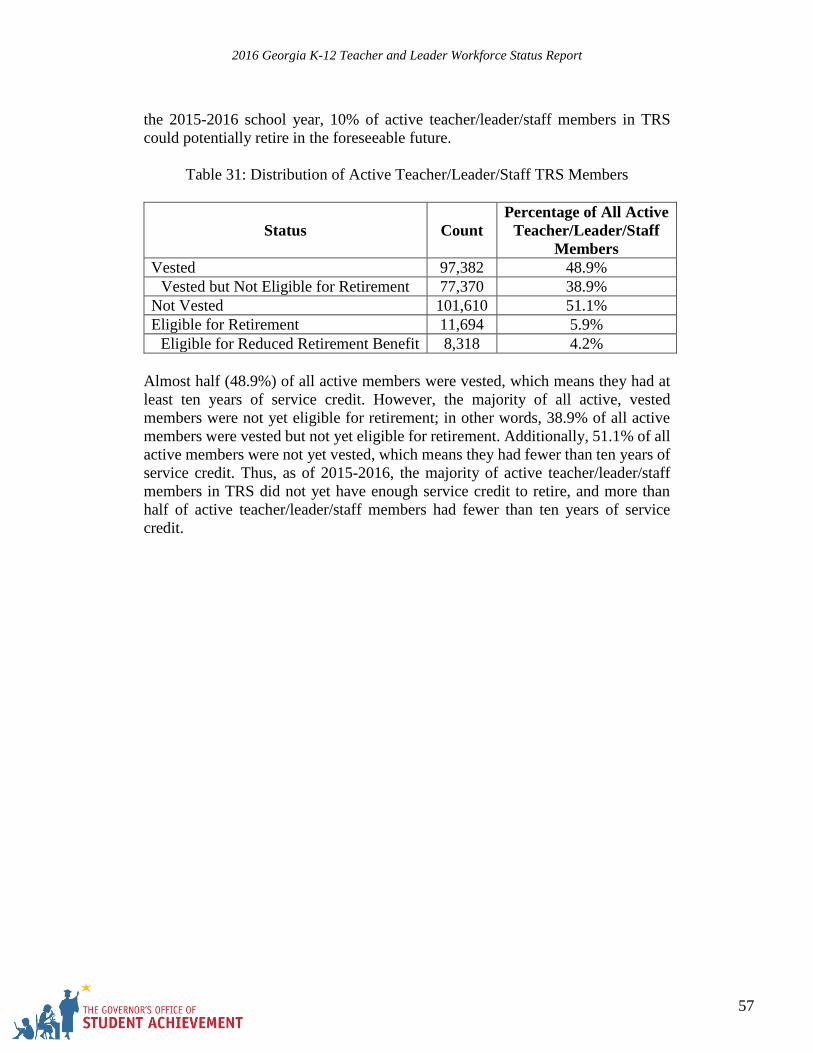
2016 Georgia K-12 Teacher and Leader Workforce Status Report
57
the 2015-2016 school year, 10% of active teacher/leader/staff members in TRS
could potentially retire in the foreseeable future.
Table 31: Distribution of Active Teacher/Leader/Staff TRS Members
Status Count
Percentage of All Active
Teacher/Leader/Staff
Members
Vested 97,382 48.9%
Vested but Not Eligible for Retirement 77,370 38.9%
Not Vested 101,610 51.1%
Eligible for Retirement 11,694 5.9%
Eligible for Reduced Retirement Benefit 8,318 4.2%
Almost half (48.9%) of all active members were vested, which means they had at
least ten years of service credit. However, the majority of all active, vested
members were not yet eligible for retirement; in other words, 38.9% of all active
members were vested but not yet eligible for retirement. Additionally, 51.1% of all
active members were not yet vested, which means they had fewer than ten years of
service credit. Thus, as of 2015-2016, the majority of active teacher/leader/staff
members in TRS did not yet have enough service credit to retire, and more than
half of active teacher/leader/staff members had fewer than ten years of service
credit.
2016 Georgia K-12 Teacher and Leader Workforce Status Report
58
Summary of Findings
The K-12 Teacher and Leader Workforce Report aims to inform the development
and implementation of educator policies in Georgia. The report analyzes workforce,
production, retention, and retirement patterns for K-12 teachers and leaders in
Georgia during the 2015-2016 school year. The report uncovers insightful teacher
and leader workforce, production, retention, and retirement patterns.
Key findings include:
Current Status of the Workforce
o During the 2015-2016 school year, Georgia’s public education
workforce consisted of 110,059 teachers and 8,449 leaders.
o The majority (approximately 60%) of the teacher and leader
workforce was white.
o The share of black leaders (34%) was larger than the share of black
teachers (20%).
o The share of Hispanic leaders (4.4%) was lower than the share of
Hispanic teachers (9.2%).
o 44% of teachers held a Master’s degree as their highest earned
degree and 53% of leaders held an Education Specialist degree as
their highest earned degree.
o Almost half of the teacher workforce had ten or fewer years of
experience working in Georgia public education. 25% of teachers
had five or fewer years of experience. Additionally, 21.9% of
teachers had eleven to fifteen years of experience.
o The majority of all leaders had ten or fewer years of experience
working as a leader. 45% of all leaders had five or fewer years of
experience working as a leader, and 27.5% of leaders had between
six to ten years of experience as a leader.
o High poverty schools had significantly larger shares of black
teachers and leaders and significantly smaller shares of white
teachers and leaders compared to low poverty schools.
o 62.5% of all current certificate holders during the 2015-2016 school
year were employed as a teacher or leader, and 13.4% of all current
certificate holders were not employed in the Georgia public
education workforce at all.
o 5,908 teachers (5.4% of all teachers) were new teachers in 2015-
2016 and 2,316 teachers (2.1%) returned to teaching after a break in
service.
o 1,060 leaders (12.5%) were new leaders in 2015-2016 and 45
leaders (0.5%) returned as a leader after a break in service.
o Hispanics comprised a larger share of new teachers and leaders
when compared to the entire teacher and leader workforce.
2016 Georgia K-12 Teacher and Leader Workforce Status Report
59
Teacher and Leader Production
o During the 2015-2016 school year, 19,428 teacher and leader
candidates were enrolled in Georgia preparation programs.
o 75% of teacher and leader candidates were enrolled in public in-state
programs, 15% were enrolled in private in-state programs, and 10%
were enrolled in alternative preparation programs.
o During 2015-2016, less than 10% of students in traditional
education preparation programs were employed as teachers while in
the program.
o 66% of completers in traditional educator preparation programs in
2014-2015 were employed as teachers as of October 2015. 85% of
completers in alternative preparation programs in 2014-2015 were
employed as of October 2015.
o 42% of completers in leader preparation programs in 2014-2015
were employed as leaders as of October 2015.
Teacher and Leader Mobility
o Between 2014-2015 and 2015-2016, 5% of teachers and 2% of
leaders changed school districts.
o Approximately 40% of teachers and leaders who changed school
districts had five or fewer years of experience working as a teacher
or leader, respectively.
o Between 2014-2015 and 2015-2016, 5% of teachers and 8% of
leaders changed schools within a district.
o High poverty schools had more teachers and leaders changing
schools from 2014-2015 to 2015-2016 than low poverty schools.
Teacher and Leader Retention
o 90.5% of teachers and leaders remained in their respective roles
from 2014-2015 to 2015-2016.
o High poverty schools do not retain as many teachers and leaders as
low poverty schools.
o The retention rates for teachers and leaders with five or fewer years
of experience were a few percentage points lower than the retention
rates for all teachers and leaders.
Teacher and Leader Retirement
o As of 2015-2016, 80% of all teachers/leaders/staff in TRS were
active members.72
72 Active members have made at least one contribution to TRS in the past four years.
2016 Georgia K-12 Teacher and Leader Workforce Status Report
60
o 10% of all active teacher/leader/staff TRS members were eligible
for retirement or a reduced retirement benefit.
o Almost 50% of all active teacher/leader/staff TRS members had at
least ten years of service credit, but the majority of these members
were not yet eligible for retirement.
o 51% of all active teacher/leader/staff TRS members had fewer than
ten years of service credit.
2016 Georgia K-12 Teacher and Leader Workforce Status Report
61
Acknowledgements
This research was conducted at the request of the Georgia Alliance of Education
Agency Heads with guidance from the Georgia Professional Standards
Commission, the Georgia Department of Education, and the Teachers Retirement
System of Georgia.

2016 Georgia K-12 Teacher and Leader Workforce Status Report
62