2016 ipri full report
TRANSCRIPT
IPRI - 2016 Levy Carciente, Sary
1
INTERNATIONAL PROPERTY RIGHTS INDEX 2016
I. Property rights in the knowledge society
‘Simplicity is the ultimate sophistication’
Leonardo da Vinci
Since the end of the 20th century it has been stated that we are in the early stages of a Third
Industrial Revolution, or more accurately, of a non-Industrial one. The notion ‘knowledge based
society’ is a concept which attempts to grasp the multidimensional transformations which are
taking place in the current society and serves also for the analysis of those alterations. It has its
origins in the 1960s when, analyzing changes, the term ‘postindustrial society’ was coined. The
concept expressed transition from an economy that produces products to one based on services,
led by technically qualified professionals. In a 'knowledge society,' structures and processes of
material and symbolic reproduction are so immersed in knowledge operations that information
processing, symbolic analysis and expert systems take precedence over other factors, like capital
and labor.
We are talking about the configuration of a new model of society, one in which everyone and
everything is connected, all over the world and all the time, creating zillions of terabytes of data
per picosecond. The topological structures of these networks are becoming the new appropriate
models to look at societies, evaluated as complex systems, shaped by the collective action of
individuals, and displaying emergent behaviors. Non-linearity, cascading failures, optimal
interdependence and phase transitions are the focal points of current ongoing research.
Innovation is critical to this economic transition and so a Schumpeterian moment is in place:
when creative destruction threatens the past and promises a future; a moment that embraces
disruption instead of fighting it. There is a growing consensus citing the innovation triangle
(science - economy - society) and the knowledge triangle (education - research - innovation) as
the key roots of the success. As always in complex systems, a linear or simple relationship
among these elements is not found and much remains to deepen our understanding yet.
While embracing complexity may be quixotic, ignoring it is not an option; and assessing the
governance of these complex systems involves an understanding of the relevance of the
underlying institutions. Appropriate and robust institutions would be those that show adaptability
to changing conditions and favor appropriate synergies among individuals.
In a ‘knowledge society’, structures of stiff control are more quickly eroded and this type of
society is characterized by the development of new rules. Therefore, ‘knowledge societies’ gain
in flexibility, but also in fragility. Heterogeneity and self-organization overlaps the pretension of
homogeneity and rigid control, and simple and basic rules, respecting the nature of the agents of
the system, are best applied. In other words, a complex knowledge society can prosper
sufficiently if it is backed by a moldable but robust backbone of institutional arrangement. And
among these basic institutions is the property rights system.
IPRI - 2016 Levy Carciente, Sary
2
Since the 1990s, there is considerable empirical literature dealing with the relationship between
institutions and the improvement of social wellbeing, and particularly between property rights
and social prosperity1.
While classical economists gave a central position to the role of property rights in the process of
economic development, the core welfare results of mainstream economics assumes that property
rights are well defined and costlessly enforced. It is this new institutional approach that concerns
effective property rights as the center of thoughts about development, defining them as
endogenous to the system, evolving in time by the effects of political, economic and cultural
forces. Effective property rights means that ownership structures are well defined having
important effects on assets allocation (separating ownership from control), wealth distribution
and consumption.
Besley and Ghatak (2010) address two areas concerning the relationship between property rights
and development: the mechanisms through which property rights affect economic activity and
the determinants of property rights. In the first they emphasize some economic costs of weak
property rights by means of expropriation risk, unproductive costs to defend property, failure to
facilitate gains and supporting other transactions. Their model concludes that increasing the
security of property rights can reduce asset sub-utilization. Their results capture the mechanisms
suggested by de Soto (2000) linking property rights’ increase of the use of assets as collateral
and economic efficiency.
Other research finds similar positive links: Wang (2008) shows that the housing reform in China
(allowing employees to buy state-owned houses) increased entrepreneurial ventures using houses
as collateral; Johnson, McMillan and Woodruff (2002) found that weak property rights
discourage profit reinvestment in post-communist countries; Galiani and Schargrodsky (2005)
found that titled parcels in Argentina favored housing investment and child education; and Field
and Torero (2004) revealed that urban land titling in Peru is associated with a 9-10% increase in
loan approval rates from the public sector bank for housing construction materials, while finding
no effect on the loan approval rate from private sector lenders.
However, the analysis of the impact of the property rights system is not an easy task: Domingo
(2013) examines the evidence on the relationship between property rights and social and political
empowerment, finding ambivalent evidence, basically because it needs to take account of the
political and social relations in which property regimes are embedded; and Locke (2013) found
contradictory evidence in the relationship of land rights and growth (through investment, credit
and efficiency) due to the presence of factors other than property rights (i.e. skills) also of
primary importance for growth, recognizing a ‘cluster of institutions’ that drive economic
growth.
An important problem with economic and social dynamics, as with any other complex system, is
the so-called problem of endogeneity: institutions cause development, but development also
1See among others: F.A. Hayek, 1960; Milton Friedman, 1962; A. Rand, 1964; Alchian & Demsetz, 1973; Demsetz,
1967; Nozick, 1974; R. A. Epstein, 1985, 1995; J. M. Buchanan, 1993;J. V. Delong, 1997; North 1981, 1990,
Richard R. Pipes, 1999; Von Mises, L., 2002, De Soto, 2000; De Soto & Cheneval, 2006; Barzel, 1997, Knack&
Keefer, 1995; Hall & Jones, 1999; Acemoglu et al. 2001, 2002, 2005;Acemoglu& Johnson, 2005; Easterly &
Levine, 2003;Rodriket al. 2004;Feyrer&Sacerdote, 2009; Hansson, 2009; T. R. Machan, 2002; Sandefur, 2006;
Waldron, 2012. For dissenting views see Glaeser et al., 2004 and Angeles, 2010.
IPRI - 2016 Levy Carciente, Sary
3
causes institutions. This is an issue recognized in the empirical literature but never fully solved.
Paldam and Gundlach (2007) address this problem using two measures of institutional quality,
democracy and corruption. In both cases they found mixed results on causality direction, but
strong support on the interactions of institutions and income and development, and so of the
creation of a virtuous circle.
In this way, enforcing a strong property rights system is a key element fostering economic
growth as a linchpin of a multidimensional prosperity goal. However, assigning and
administering property rights can be challenging. This is particularly true with respect to
knowledge-based goods and economic use of some natural resources. In this sense, the
environment and knowledge-based products will continue to be at the heart of the biggest
potential conflicts on property rights in the 21st century.
To understand this issue it has to be noted that knowledge and information are not like other kind
of physical goods widely traded in markets. They possess a specific characteristic referred as
‘non-rival in use’, that is, they can be used repeatedly and concurrently by many people, without
being ‘depleted’. In this sense the allocation of intellectual property rights does not confer
exclusive possession (as physical property rights) but of the benefits of its economic exploitation.
This creates economic incentives for people to go on research and innovation, as well as finding
new applications for old ideas. Intellectual property rights also tend to prevent ideas from
remaining in secrecy, being shared with the whole society, encouraging creativity spillovers
(David & Foray, 2003).
Most legal systems nowadays recognize three different kinds of intellectual property rights:
trademarks, copyrights and patents:
A trademark is a word, name, symbol or device which is used in trade with goods to indicate
the source of the goods and to distinguish them from others. A servicemark is the same as a
trademark except that it identifies and distinguishes the source of a service rather than a
product.
A copyright is a form of protection provided to the authors of original works of authorship
including literary, dramatic, musical, artistic and intellectual works, published or
unpublished.
A patent is the grant of a property of an invention to its creator. What is granted is not the
right to make, use, offer for sale, sell or import, but the right to exclude others from making,
using, offering for sale, selling or importing the creation.
In synthesis, trademarks distinguish products or services; copyrights apply to expressions, and
not to ideas, procedures, or methods of operation, while patents apply to specific
implementations of ideas. But in all cases we are talking about knowledge based rights.
There are other kinds of intellectual property rights: Industrial Designs and Geographical
Indicators. An industrial design is somewhat similar to a particular type of trademark known as a
‘distinguishing guise’, the aesthetic aspect of an article (its shape, patterns, lines or colors). A
geographical indication (GI) is a name or sign used on products corresponding to specific
geographical origin, acting as a quality certification.
The main goal for promoting strong intellectual property rights is to fuel the creation of
knowledge-based economies. Such legal infrastructure promotes innovation, and that new ideas
IPRI - 2016 Levy Carciente, Sary
4
would become products, leading to economic growth, job creation, economic productivity,
sustained competitiveness in global markets, and improvement of social well-being.
Simultaneously there are critics addressed to instituting a system of intellectual property rights,
saying that they could threat fair competition. This critic is mainly related to health related
products and the concern that IP rights could rise their price. However, competition is not
opposed to property rights. On the contrary, strong IP rights are a complementary dimension of a
competitive economy whose main goal is the consumer’s benefit. This is because innovation is
based on a dynamical perspective of competition, which creates dynamical efficiency (creative
capacity) and not static efficiency (with fixed technology). The dynamical approach shows not
only indecisive short term impacts, but positive ones in the medium and long term, which are not
confined to a price reduction in time as a result of increased production, but also includes the
promotion of positive side effects on other social spheres: education, research and innovation,
endogenous development of technologies, and so on.
There is an important ongoing debate on this issue and, as in all social affairs; there are not easy
or general ‘one-size-fits-all’ solutions. This controversy will not vanish soon. We are talking
about complex systems, with multiple interactions and multidimensional dependence. But what it
is very important is to understand the relevance of institutional arrangements in the aim of
building productive, free and inclusive societies. A main building block of this institutional
support is, with no doubt, a strong Property Rights System.
IPRI - 2016 Levy Carciente, Sary
5
II. IPRI Structure and Methodology
One of the most important things to achieve a goal is to evaluate its evolution in time and space,
and for that, measuring is a key tool. Since 2007, the Property Rights Alliance (PRA) -
dedicated to the protection of property rights all around the world - instituted the Hernando de
Soto fellowship to produce a yearly edition of the International Property Rights Index, IPRI.
The IPRI was developed to serve as a barometer for the status of property rights across the
world. A vast review of the literature on property rights was done in order to conceptualize and
operationalize a comprehensive characterization of property rights. Following convention set in
place by previously compiled indexes, several experts and practitioners in the field of property
rights were consulted to finalize the set of core categories (here referred to as “components” or
‘sub-indexes’) and the items that create the components.
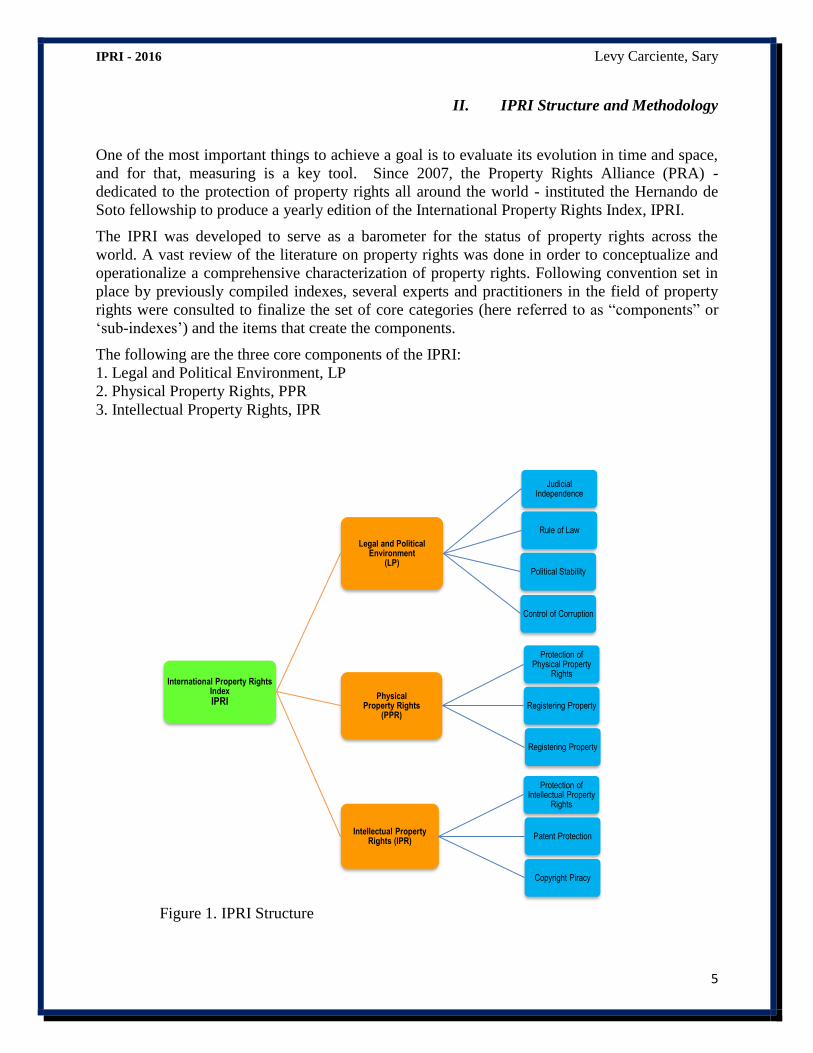
The following are the three core components of the IPRI:
1. Legal and Political Environment, LP
2. Physical Property Rights, PPR
3. Intellectual Property Rights, IPR
Figure 1. IPRI Structure
International Property Rights Index IPRI
Legal and Political Environment
(LP)
Judicial Independence
Control of Corruption
Rule of Law
Political Stability
Physical Property Rights
(PPR)
Protection of Physical Property
Rights
Registering Property
Registering Property
Intellectual Property Rights (IPR)
Protection of Intellectual Property
Rights
Patent Protection
Copyright Piracy
IPRI - 2016 Levy Carciente, Sary
6
The Legal and Political Environment (LP) component provides an insight into the strength of the
institutions of a country, the respect of the ‘rules of the game’ among citizens; consequently, the
measures used for the LP are broad in scope. This component has a significant impact on the
development and protection of physical and intellectual property rights.
The other two components of the index - Physical and Intellectual Property Rights (PPR and
IPR) - reflect two forms of property rights, both of which are crucial to the economic
development of a country. The items included in these two categories account for both de jure
rights and de facto outcomes of the countries considered.
The IPRI is comprised of 10 items in total, grouped under one of the three components: LP, PPR,
or IPR. While considering numerous items related to property rights, the final IPRI is specific to
the core factors that are directly related to the strength and protection of physical and intellectual
property rights. Furthermore, items for which data was available both more regularly and in a
greater number of countries were given preference. This was done to ensure that scores were
comparable across countries and years.
The IPRI-2016 keeps previous years’ methodology to allow a full comparison of its results with
previous editions.
II.1. Legal and Political Environment (LP)
The Legal and Political Environment component grasps the ability of a nation to enforce a de
jure system of property rights. In this sense there are considered four dimensions or sub-
components: the independence of its judicial system, the strength of the rule of law, the control
of corruption and the stability of its political system.
Judicial Independence
This item examines the judiciary’s freedom from influence by political and business groups. The
independence of the judiciary is a central underpinning for the sound protection and sovereign
support of the court system with respect to private property. For this item the chosen data source
was the Global Competitiveness Index from the World Economic Forum’s 2015-2016.
(www3.weforum.org/docs/gcr/2015-2016/GCI_Dataset_2006-2015.xlsx).
Rule of Law
This item measures the extent to which agents have confidence in and abide by the rules of
society. In particular, it measures the quality of contract enforcement, property rights, police, and
courts, as well as the likelihood of crime and violence. The item combines several indicators
including: fairness, honesty, enforcement, speed, affordability of the court system, protection of
private property rights, and judicial and executive accountability. This item complements the
judicial Independence variable. For this item the chosen data source was the World Bank
Worldwide Governance Indicators, 2015
(http://info.worldbank.org/governance/wgi/index.aspx#homeDimension: Rule of Law).
Political Stability
The degree of political stability influences incentives to obtain or to extend ownership and/or
management of property. The higher the likelihood of government instability, the less likely
IPRI - 2016 Levy Carciente, Sary
7
people will be to obtain property and to develop trust in the validity of the rights attached. For
this item the chosen data source was the World Bank Worldwide Governance Indicators, 2015
(http://info.worldbank.org/governance/wgi/index.aspx#home Dimension: Political Stability and
Absence of Violence).
Control of Corruption
This item combines several indicators that measure the extent to which public power is exercised
for private gain. This includes petty and grand forms of corruption, as well as ‘capture’ of the
state by elites and private interests. Similarly to the other items in the LP component, corruption
influences people’s confidence in the existence of sound implementation and enforcement of
property rights. Corruption reflects the degree of informality in the economy, which is a
distracting factor to the expansion of respect for legal private property. A support for these ideas
is the research by Dong and Torgler (2011) in which they give theoretical and empirical evidence
of 108 countries from 1995-2006, showing that the effects of democratization on control of
corruption depend on the protection of property rights and income equality, creating a virtuous
circle.
The data chosen for this item was World Bank Worldwide Governance Indicators, 2015
(http://info.worldbank.org/governance/wgi/index.aspx#homeDimension: Control of Corruption)
II.2. Physical Property Rights (PPR)
A strong property rights regime commands the confidence of people in its effectiveness to
protect private property rights. It also provides for unified transactions related to registering
property and allows access to credit necessary to convert property into capital. For these reasons,
the following items are used to measure private physical property rights protection (PPR).
Protection of Physical Property Rights
Many scientific research efforts have attempted to explain countries’ prosperity: Talbott and Roll
(2001) found that enforcing strong property rights is among the main factors to the promotion of
growth of GDP per capita. Meinzen-Dick, R., 2009 and Meinzen-Dick, Kameri-Mbote, and
Markelova (2007) focus on the importance of property rights for poverty reduction.
The Protection of Physical Property Rights directly relates to the strength of a country’s property
rights system based on experts’ views on the quality of judicial protection of private property,
including financial assets. Additionally, it encompasses professionals’ opinions on the clarity of
the legal definition of property rights. The data used to measure this sub-component was the
Global Competitiveness Index of the World Economic Forum’s 2015-2016
(www3.weforum.org/docs/gcr/2015-2016/GCI_Dataset_2006-2015.xlsx).
Registering Property
This item reflects businesses’ point of view on the complexity of registering property in terms of
the number of days and procedures necessary. The data chosen for measuring this item was The
World Bank Group’s 2015 Doing Business Report (http://www.doingbusiness.org/custom-
query).This item records the full sequence of procedures necessary to transfer the property title
from seller to buyer when a business purchases land and a building. This information is critical
IPRI - 2016 Levy Carciente, Sary
8
because the more difficult property registration is, the more likely it is that assets stay in the
informal sector, thus restricting the development of the broader public’s understanding and
support for a strong legal and sound property rights system. Moreover, registration barriers
discourage the movement of assets from lower to higher valued uses. This item reflects one of
the main economic arguments set forth by Hernando de Soto: “what the poor lack is easy access
to the property mechanisms that could legally fix the economic potential of their assets so they
could be used to produce, secure or guarantee greater value in the extended market” (2000:48).
This item is calculated as:
Registering Property = 0.7 ∗ #days + 0.3 ∗ #procedures
Ease of Access to Loans
Access to a bank loan without collateral serves as a proxy for the level of development of
financial institutions in a country. Financial institutions play a complementary role, along with a
strong property rights system, to bring economic assets into the formal economy. An important
channel trying to alleviate poverty had been credit facilities. Singh and Huang (2011) in a
research of 37 countries in Sub-Saharan Arica from 1992-2006 conclude that not only do
property rights reinforce the effect of narrowing inequalities with financial deepening, but that its
absence could be in detrimental to the poor.
The data chosen for this item was The Global Competitiveness Index World Economic Forum’s
2015-2016
(www3.weforum.org/docs/gcr/2015-2016/GCI_Dataset_2006-2015.xlsx)
II.3. - Intellectual Property Rights (IPR)
The Intellectual Property Rights component evaluates the protection of intellectual property. In
addition to an opinion-based measure of the protection of intellectual property, it assesses
protection of two major forms of intellectual property rights (patents and copyrights) from de
jure and de facto perspectives, respectively.
A number of empirical studies exist on the relationship among IPRs, R&D, productivity and
economic performance: Diwan and Rodrik (1991) and Taylor (1994) find that stronger IPRs may
enhance global welfare, innovation, and productivity. Korenko (1999) found that, for the Italian
pharmaceutical industry, a strengthening of local intellectual property rights helped expand
domestic R&D and market share. And as confirmed in a recent paper by Zhang, Du and Park
(2015) there is a positive relationship between IPRs and economic growth.
Protection of Intellectual Property Rights
This item contains opinion survey outcomes reflecting a nation’s protection of intellectual
property; therefore, it is a crucial aspect of the IPR component. Expert participants in each
country were asked to rate their nation’s IP protection, scoring it from “weak and not enforced”
to “strong and enforced.” The source of the data chosen to measure this item was the Global
Competitiveness Index from The World Economic Forum’s 2015-2016
(www3.weforum.org/docs/gcr/2015-2016/GCI_Dataset_2006-2015.xlsx).
Patent Protection
IPRI - 2016 Levy Carciente, Sary
9
This item reflects the strength of a country’s patent laws based on five extensive criteria:
coverage, membership in international treaties, restrictions on patent rights, enforcement, and
duration of protection. The data used for this item was from Ginarte-Park Patent Protection
(1960-2010, International Patent Protection: 1960-2005, Research Policy, 2008, Vol. 37(4):761-
766. Specific Source: http://nw08.american.edu/~wgp/#PR Data: 2010). This data source is
updated each five years and data 2015 will be released ending 2016.
Copyright Piracy
The level of piracy in the IP sector is an important indicator of the effectiveness of intellectual
property rights enforcement in a country. The data source chosen for this item was the BSA
Global Software Survey; The Compliance Gap (June 2014 edition,
http://globalstudy.bsa.org/2013/downloads/studies/2013GlobalSurvey_Study_en.pdf), which
estimates the volume and value of unlicensed software installed on personal computers, and also
reveals attitudes and behaviors related to software licensing, intellectual property and emerging
technologies.
IPRI - 2016 Levy Carciente, Sary
10
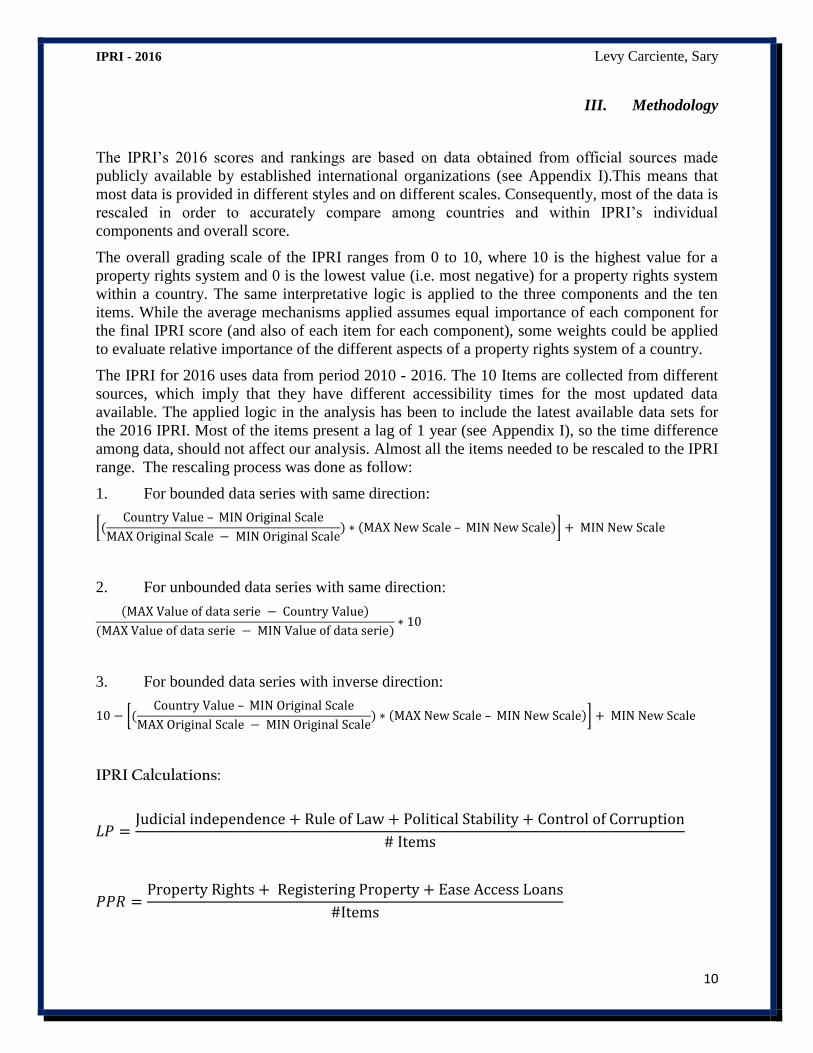
III. Methodology
The IPRI’s 2016 scores and rankings are based on data obtained from official sources made
publicly available by established international organizations (see Appendix I).This means that
most data is provided in different styles and on different scales. Consequently, most of the data is
rescaled in order to accurately compare among countries and within IPRI’s individual
components and overall score.
The overall grading scale of the IPRI ranges from 0 to 10, where 10 is the highest value for a
property rights system and 0 is the lowest value (i.e. most negative) for a property rights system
within a country. The same interpretative logic is applied to the three components and the ten
items. While the average mechanisms applied assumes equal importance of each component for
the final IPRI score (and also of each item for each component), some weights could be applied
to evaluate relative importance of the different aspects of a property rights system of a country.
The IPRI for 2016 uses data from period 2010 - 2016. The 10 Items are collected from different
sources, which imply that they have different accessibility times for the most updated data
available. The applied logic in the analysis has been to include the latest available data sets for
the 2016 IPRI. Most of the items present a lag of 1 year (see Appendix I), so the time difference
among data, should not affect our analysis. Almost all the items needed to be rescaled to the IPRI
range. The rescaling process was done as follow:
1. For bounded data series with same direction:
[(Country Value – MIN Original Scale
MAX Original Scale − MIN Original Scale) ∗ (MAX New Scale – MIN New Scale)] + MIN New Scale
2. For unbounded data series with same direction:
(MAX Value of data serie − Country Value)
(MAX Value of data serie − MIN Value of data serie)∗ 10
3. For bounded data series with inverse direction:
10 − [(Country Value – MIN Original Scale
MAX Original Scale − MIN Original Scale) ∗ (MAX New Scale – MIN New Scale)] + MIN New Scale
IPRI Calculations:
𝐿𝑃 =Judicial independence + Rule of Law + Political Stability + Control of Corruption
# Items
𝑃𝑃𝑅 =Property Rights + Registering Property + Ease Access Loans
#Items
IPRI - 2016 Levy Carciente, Sary
11
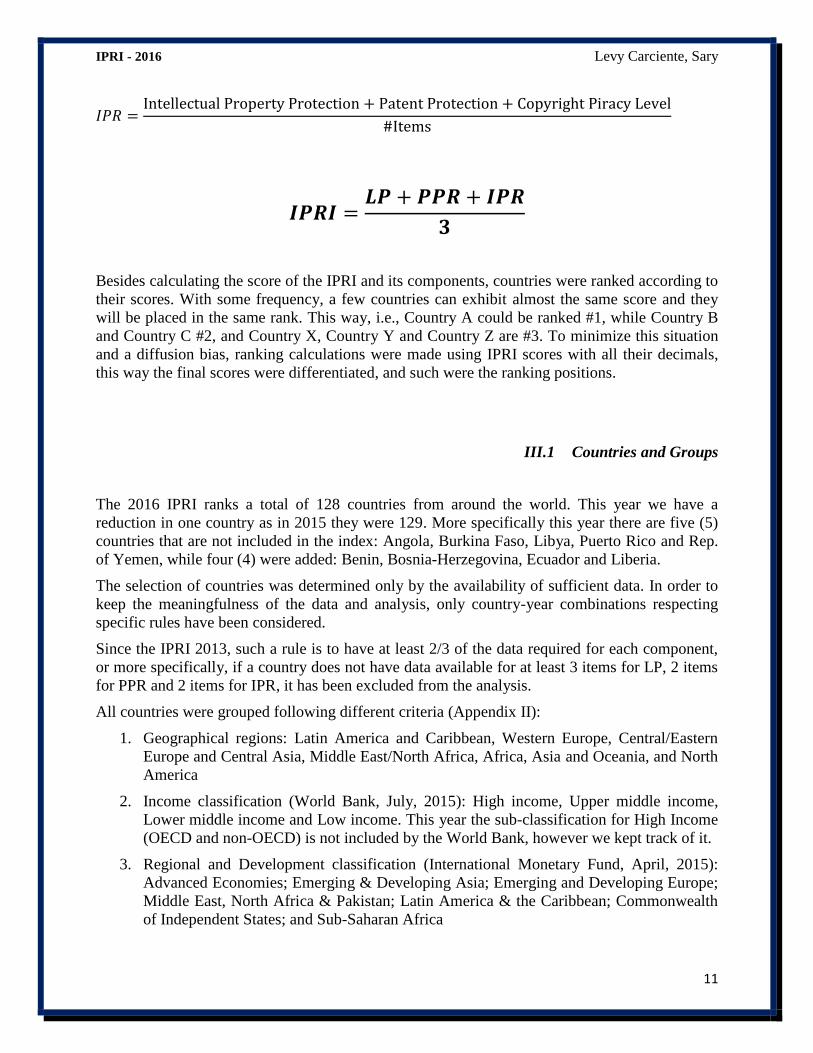
𝐼𝑃𝑅 =Intellectual Property Protection + Patent Protection + Copyright Piracy Level
#Items
𝑰𝑷𝑹𝑰 =𝑳𝑷 + 𝑷𝑷𝑹 + 𝑰𝑷𝑹
𝟑
Besides calculating the score of the IPRI and its components, countries were ranked according to
their scores. With some frequency, a few countries can exhibit almost the same score and they
will be placed in the same rank. This way, i.e., Country A could be ranked #1, while Country B
and Country C #2, and Country X, Country Y and Country Z are #3. To minimize this situation
and a diffusion bias, ranking calculations were made using IPRI scores with all their decimals,
this way the final scores were differentiated, and such were the ranking positions.
III.1 Countries and Groups
The 2016 IPRI ranks a total of 128 countries from around the world. This year we have a
reduction in one country as in 2015 they were 129. More specifically this year there are five (5)
countries that are not included in the index: Angola, Burkina Faso, Libya, Puerto Rico and Rep.
of Yemen, while four (4) were added: Benin, Bosnia-Herzegovina, Ecuador and Liberia.
The selection of countries was determined only by the availability of sufficient data. In order to
keep the meaningfulness of the data and analysis, only country-year combinations respecting
specific rules have been considered.
Since the IPRI 2013, such a rule is to have at least 2/3 of the data required for each component,
or more specifically, if a country does not have data available for at least 3 items for LP, 2 items
for PPR and 2 items for IPR, it has been excluded from the analysis.
All countries were grouped following different criteria (Appendix II):
1. Geographical regions: Latin America and Caribbean, Western Europe, Central/Eastern
Europe and Central Asia, Middle East/North Africa, Africa, Asia and Oceania, and North
America
2. Income classification (World Bank, July, 2015): High income, Upper middle income,
Lower middle income and Low income. This year the sub-classification for High Income
(OECD and non-OECD) is not included by the World Bank, however we kept track of it.
3. Regional and Development classification (International Monetary Fund, April, 2015):
Advanced Economies; Emerging & Developing Asia; Emerging and Developing Europe;
Middle East, North Africa & Pakistan; Latin America & the Caribbean; Commonwealth
of Independent States; and Sub-Saharan Africa
IPRI - 2016 Levy Carciente, Sary
12
4. Economic and Regional Integration Agreements: European Union, Southern African
Development Community, Economic Community of Western African States, Association
of Southeast Asian Nations, Central American Parliament, Gulf Cooperation Council,
Pacific Alliance, southern Common Market, South Asian Association for Regional
Cooperation, Central African Economic and Monetary Community, Central American
Common Market, Commonwealth of Independent States, Arab Maghreb Union,
Caribbean Community, Andean Community, European Free Trade Association,
Intergovernmental Authority on Development, North American Free Trade Agreement,
Organization of the Petroleum Exporting Countries, Economic Community of Central
African States and Trans-Pacific Partnership.
IPRI - 2016 Levy Carciente, Sary
13
IV. IPRI 2016 Country Results
This chapter presents the results of the 2016 International Property Rights Index. Starting from
the scores of the overall IPRI and its three (3) components, we follow showing countries’
ranking of the IPRI and its components. Variations between 2015 and 2016 of both individual
IPRI components and of the overall IPRI score were considered. This chapter also includes an
analysis of the IPRI for countries aggrupation.
As an average, the sample of the 128 countries yielded this year an IPRI score of 5.45, with the
Legal and Political Environment (LP) being the weakest component with a score of 5.13,
followed by the Intellectual Property Rights (IPR) component with a score of 5.33 and Physical
Property Rights (PPR) as the strongest component with a score of 5.87. This year we found an
overall improvement of the IPRI score compared to 2015, and also of all of its components.
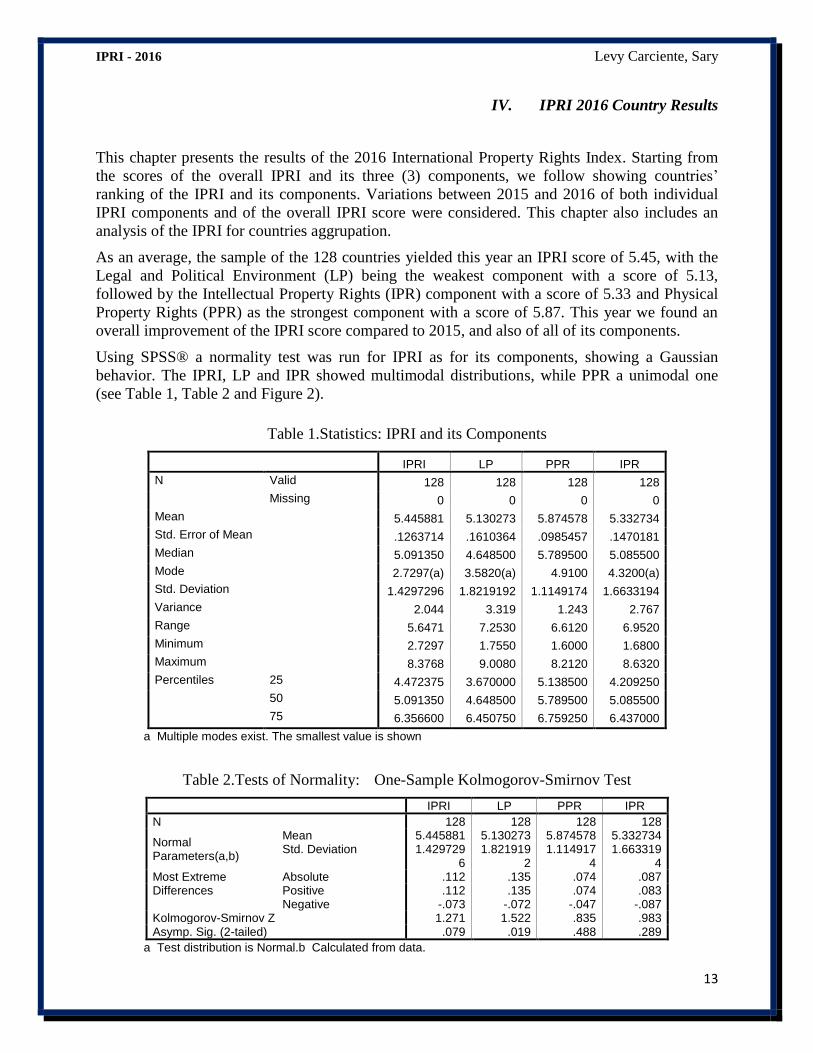
Using SPSS® a normality test was run for IPRI as for its components, showing a Gaussian
behavior. The IPRI, LP and IPR showed multimodal distributions, while PPR a unimodal one
(see Table 1, Table 2 and Figure 2).
Table 1.Statistics: IPRI and its Components
IPRI LP PPR IPR
N Valid 128 128 128 128
Missing 0 0 0 0
Mean 5.445881 5.130273 5.874578 5.332734
Std. Error of Mean .1263714 .1610364 .0985457 .1470181
Median 5.091350 4.648500 5.789500 5.085500
Mode 2.7297(a) 3.5820(a) 4.9100 4.3200(a)
Std. Deviation 1.4297296 1.8219192 1.1149174 1.6633194
Variance 2.044 3.319 1.243 2.767
Range 5.6471 7.2530 6.6120 6.9520
Minimum 2.7297 1.7550 1.6000 1.6800
Maximum 8.3768 9.0080 8.2120 8.6320
Percentiles 25 4.472375 3.670000 5.138500 4.209250
50 5.091350 4.648500 5.789500 5.085500
75 6.356600 6.450750 6.759250 6.437000
a Multiple modes exist. The smallest value is shown
Table 2.Tests of Normality: One-Sample Kolmogorov-Smirnov Test
IPRI LP PPR IPR
N 128 128 128 128
Normal Parameters(a,b)
Mean 5.445881 5.130273 5.874578 5.332734 Std. Deviation 1.429729
6 1.821919
2 1.114917
4 1.663319
4 Most Extreme Differences
Absolute .112 .135 .074 .087 Positive .112 .135 .074 .083 Negative -.073 -.072 -.047 -.087
Kolmogorov-Smirnov Z 1.271 1.522 .835 .983 Asymp. Sig. (2-tailed) .079 .019 .488 .289
a Test distribution is Normal.b Calculated from data.

IPRI - 2016 Levy Carciente, Sary
14
Figure 2. IPRI Histogram
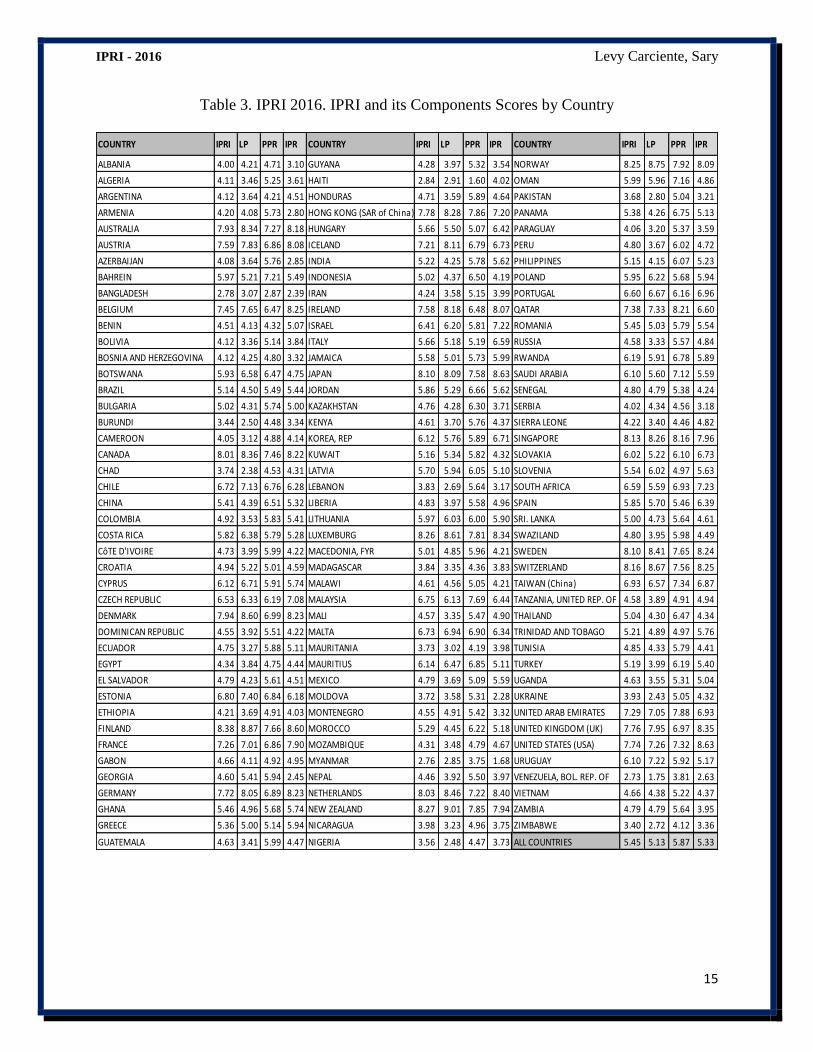
Table 3 shows -alphabetically ordered- the score value of the 128 countries included in the IPRI
2016, as the scores of its components: Legal and Political Environment (LP), Physical Property
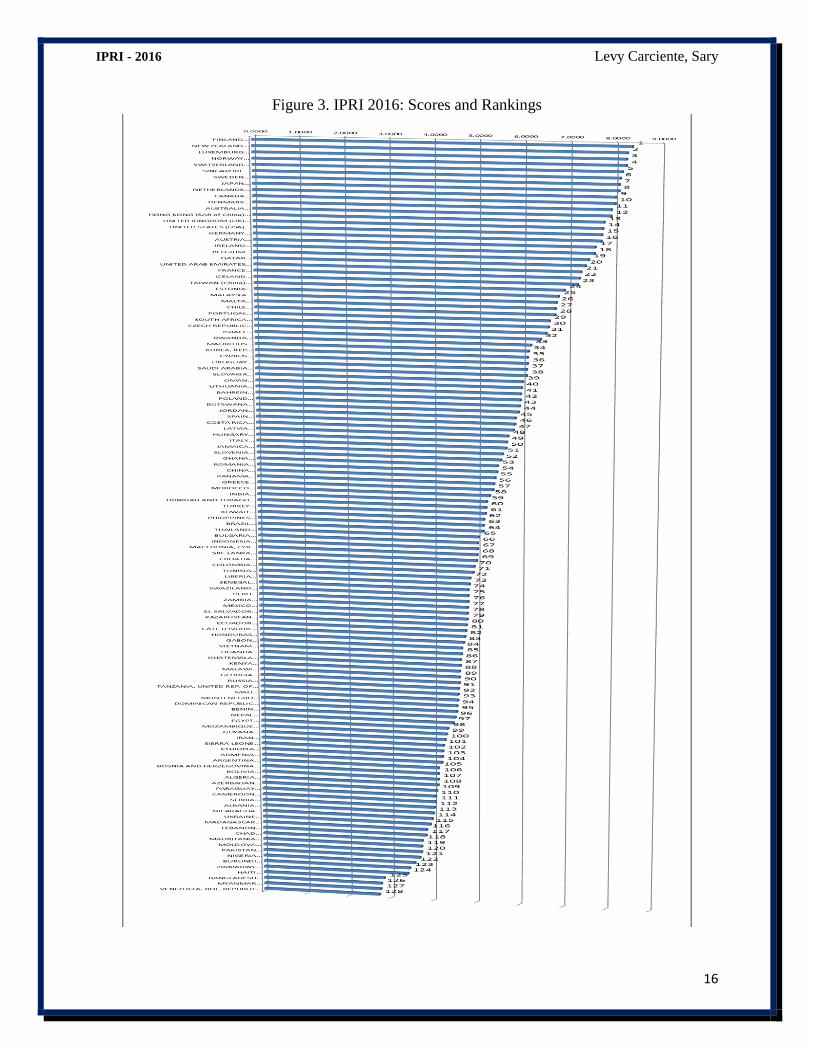
Rights (PPR) and Intellectual Property Rights (IPR). Figure 3 presents countries organized by its
IPRI ranking from top to bottom, showing simultaneously their IPRI scores.
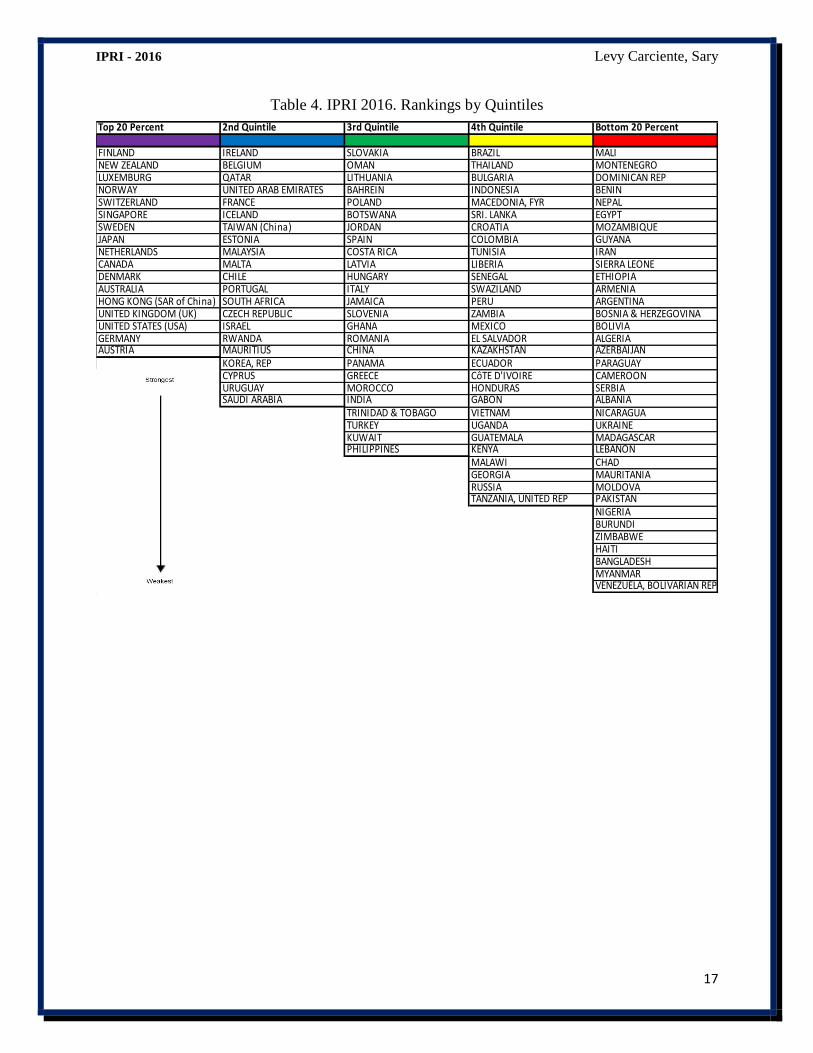
Table 4 shows the IPRI 2016 rankings by quintile for all the 128 countries in our sample. In
general, the number of countries belonging to each quintile increases from the top 20% to the
bottom 20% (1st quintile 17 countries, 2nd quintile 21 countries, 3rd quintile 25 countries, 4rd
quintile 29 countries and 5th quintile 36 countries). Hence, the forth and the fifth quintiles
include 65 countries which is a 50.7% of our sample, while the first three quintiles includes
almost the same amount countries, 63, being the 49.2% of the sample.
9.008.007.006.005.004.003.002.00
VAR00007
30
25
20
15
10
5
0
Freq
uenc
y
Mean = 5.4459
Std. Dev. = 1.42973
N = 128
IPRI - 2016 Levy Carciente, Sary
15
Table 3. IPRI 2016. IPRI and its Components Scores by Country
COUNTRY IPRI LP PPR IPR COUNTRY IPRI LP PPR IPR COUNTRY IPRI LP PPR IPR
ALBANIA 4.00 4.21 4.71 3.10 GUYANA 4.28 3.97 5.32 3.54 NORWAY 8.25 8.75 7.92 8.09
ALGERIA 4.11 3.46 5.25 3.61 HAITI 2.84 2.91 1.60 4.02 OMAN 5.99 5.96 7.16 4.86
ARGENTINA 4.12 3.64 4.21 4.51 HONDURAS 4.71 3.59 5.89 4.64 PAKISTAN 3.68 2.80 5.04 3.21
ARMENIA 4.20 4.08 5.73 2.80 HONG KONG (SAR of China) 7.78 8.28 7.86 7.20 PANAMA 5.38 4.26 6.75 5.13
AUSTRALIA 7.93 8.34 7.27 8.18 HUNGARY 5.66 5.50 5.07 6.42 PARAGUAY 4.06 3.20 5.37 3.59
AUSTRIA 7.59 7.83 6.86 8.08 ICELAND 7.21 8.11 6.79 6.73 PERU 4.80 3.67 6.02 4.72
AZERBAIJAN 4.08 3.64 5.76 2.85 INDIA 5.22 4.25 5.78 5.62 PHILIPPINES 5.15 4.15 6.07 5.23
BAHREIN 5.97 5.21 7.21 5.49 INDONESIA 5.02 4.37 6.50 4.19 POLAND 5.95 6.22 5.68 5.94
BANGLADESH 2.78 3.07 2.87 2.39 IRAN 4.24 3.58 5.15 3.99 PORTUGAL 6.60 6.67 6.16 6.96
BELGIUM 7.45 7.65 6.47 8.25 IRELAND 7.58 8.18 6.48 8.07 QATAR 7.38 7.33 8.21 6.60
BENIN 4.51 4.13 4.32 5.07 ISRAEL 6.41 6.20 5.81 7.22 ROMANIA 5.45 5.03 5.79 5.54
BOLIVIA 4.12 3.36 5.14 3.84 ITALY 5.66 5.18 5.19 6.59 RUSSIA 4.58 3.33 5.57 4.84
BOSNIA AND HERZEGOVINA 4.12 4.25 4.80 3.32 JAMAICA 5.58 5.01 5.73 5.99 RWANDA 6.19 5.91 6.78 5.89
BOTSWANA 5.93 6.58 6.47 4.75 JAPAN 8.10 8.09 7.58 8.63 SAUDI ARABIA 6.10 5.60 7.12 5.59
BRAZIL 5.14 4.50 5.49 5.44 JORDAN 5.86 5.29 6.66 5.62 SENEGAL 4.80 4.79 5.38 4.24
BULGARIA 5.02 4.31 5.74 5.00 KAZAKHSTAN 4.76 4.28 6.30 3.71 SERBIA 4.02 4.34 4.56 3.18
BURUNDI 3.44 2.50 4.48 3.34 KENYA 4.61 3.70 5.76 4.37 SIERRA LEONE 4.22 3.40 4.46 4.82
CAMEROON 4.05 3.12 4.88 4.14 KOREA, REP 6.12 5.76 5.89 6.71 SINGAPORE 8.13 8.26 8.16 7.96
CANADA 8.01 8.36 7.46 8.22 KUWAIT 5.16 5.34 5.82 4.32 SLOVAKIA 6.02 5.22 6.10 6.73
CHAD 3.74 2.38 4.53 4.31 LATVIA 5.70 5.94 6.05 5.10 SLOVENIA 5.54 6.02 4.97 5.63
CHILE 6.72 7.13 6.76 6.28 LEBANON 3.83 2.69 5.64 3.17 SOUTH AFRICA 6.59 5.59 6.93 7.23
CHINA 5.41 4.39 6.51 5.32 LIBERIA 4.83 3.97 5.58 4.96 SPAIN 5.85 5.70 5.46 6.39
COLOMBIA 4.92 3.53 5.83 5.41 LITHUANIA 5.97 6.03 6.00 5.90 SRI. LANKA 5.00 4.73 5.64 4.61
COSTA RICA 5.82 6.38 5.79 5.28 LUXEMBURG 8.26 8.61 7.81 8.34 SWAZILAND 4.80 3.95 5.98 4.49
CôTE D'IVOIRE 4.73 3.99 5.99 4.22 MACEDONIA, FYR 5.01 4.85 5.96 4.21 SWEDEN 8.10 8.41 7.65 8.24
CROATIA 4.94 5.22 5.01 4.59 MADAGASCAR 3.84 3.35 4.36 3.83 SWITZERLAND 8.16 8.67 7.56 8.25
CYPRUS 6.12 6.71 5.91 5.74 MALAWI 4.61 4.56 5.05 4.21 TAIWAN (China) 6.93 6.57 7.34 6.87
CZECH REPUBLIC 6.53 6.33 6.19 7.08 MALAYSIA 6.75 6.13 7.69 6.44 TANZANIA, UNITED REP. OF 4.58 3.89 4.91 4.94
DENMARK 7.94 8.60 6.99 8.23 MALI 4.57 3.35 5.47 4.90 THAILAND 5.04 4.30 6.47 4.34
DOMINICAN REPUBLIC 4.55 3.92 5.51 4.22 MALTA 6.73 6.94 6.90 6.34 TRINIDAD AND TOBAGO 5.21 4.89 4.97 5.76
ECUADOR 4.75 3.27 5.88 5.11 MAURITANIA 3.73 3.02 4.19 3.98 TUNISIA 4.85 4.33 5.79 4.41
EGYPT 4.34 3.84 4.75 4.44 MAURITIUS 6.14 6.47 6.85 5.11 TURKEY 5.19 3.99 6.19 5.40
EL SALVADOR 4.79 4.23 5.61 4.51 MEXICO 4.79 3.69 5.09 5.59 UGANDA 4.63 3.55 5.31 5.04
ESTONIA 6.80 7.40 6.84 6.18 MOLDOVA 3.72 3.58 5.31 2.28 UKRAINE 3.93 2.43 5.05 4.32
ETHIOPIA 4.21 3.69 4.91 4.03 MONTENEGRO 4.55 4.91 5.42 3.32 UNITED ARAB EMIRATES 7.29 7.05 7.88 6.93
FINLAND 8.38 8.87 7.66 8.60 MOROCCO 5.29 4.45 6.22 5.18 UNITED KINGDOM (UK) 7.76 7.95 6.97 8.35
FRANCE 7.26 7.01 6.86 7.90 MOZAMBIQUE 4.31 3.48 4.79 4.67 UNITED STATES (USA) 7.74 7.26 7.32 8.63
GABON 4.66 4.11 4.92 4.95 MYANMAR 2.76 2.85 3.75 1.68 URUGUAY 6.10 7.22 5.92 5.17
GEORGIA 4.60 5.41 5.94 2.45 NEPAL 4.46 3.92 5.50 3.97 VENEZUELA, BOL. REP. OF 2.73 1.75 3.81 2.63
GERMANY 7.72 8.05 6.89 8.23 NETHERLANDS 8.03 8.46 7.22 8.40 VIETNAM 4.66 4.38 5.22 4.37
GHANA 5.46 4.96 5.68 5.74 NEW ZEALAND 8.27 9.01 7.85 7.94 ZAMBIA 4.79 4.79 5.64 3.95
GREECE 5.36 5.00 5.14 5.94 NICARAGUA 3.98 3.23 4.96 3.75 ZIMBABWE 3.40 2.72 4.12 3.36
GUATEMALA 4.63 3.41 5.99 4.47 NIGERIA 3.56 2.48 4.47 3.73 ALL COUNTRIES 5.45 5.13 5.87 5.33
IPRI - 2016 Levy Carciente, Sary
16
Figure 3. IPRI 2016: Scores and Rankings
IPRI - 2016 Levy Carciente, Sary
17
Table 4. IPRI 2016. Rankings by Quintiles
Top 20 Percent 2nd Quintile 3rd Quintile 4th Quintile Bottom 20 Percent
FINLAND IRELAND SLOVAKIA BRAZIL MALINEW ZEALAND BELGIUM OMAN THAILAND MONTENEGROLUXEMBURG QATAR LITHUANIA BULGARIA DOMINICAN REPNORWAY UNITED ARAB EMIRATES BAHREIN INDONESIA BENINSWITZERLAND FRANCE POLAND MACEDONIA, FYR NEPALSINGAPORE ICELAND BOTSWANA SRI. LANKA EGYPTSWEDEN TAIWAN (China) JORDAN CROATIA MOZAMBIQUEJAPAN ESTONIA SPAIN COLOMBIA GUYANANETHERLANDS MALAYSIA COSTA RICA TUNISIA IRANCANADA MALTA LATVIA LIBERIA SIERRA LEONEDENMARK CHILE HUNGARY SENEGAL ETHIOPIAAUSTRALIA PORTUGAL ITALY SWAZILAND ARMENIAHONG KONG (SAR of China) SOUTH AFRICA JAMAICA PERU ARGENTINAUNITED KINGDOM (UK) CZECH REPUBLIC SLOVENIA ZAMBIA BOSNIA & HERZEGOVINAUNITED STATES (USA) ISRAEL GHANA MEXICO BOLIVIAGERMANY RWANDA ROMANIA EL SALVADOR ALGERIAAUSTRIA MAURITIUS CHINA KAZAKHSTAN AZERBAIJAN
KOREA, REP PANAMA ECUADOR PARAGUAYCYPRUS GREECE CôTE D'IVOIRE CAMEROONURUGUAY MOROCCO HONDURAS SERBIASAUDI ARABIA INDIA GABON ALBANIA
TRINIDAD & TOBAGO VIETNAM NICARAGUATURKEY UGANDA UKRAINEKUWAIT GUATEMALA MADAGASCARPHILIPPINES KENYA LEBANON
MALAWI CHADGEORGIA MAURITANIARUSSIA MOLDOVATANZANIA, UNITED REP PAKISTAN
NIGERIABURUNDIZIMBABWEHAITIBANGLADESHMYANMARVENEZUELA, BOLIVARIAN REP
IPRI - 2016 Levy Carciente, Sary
18
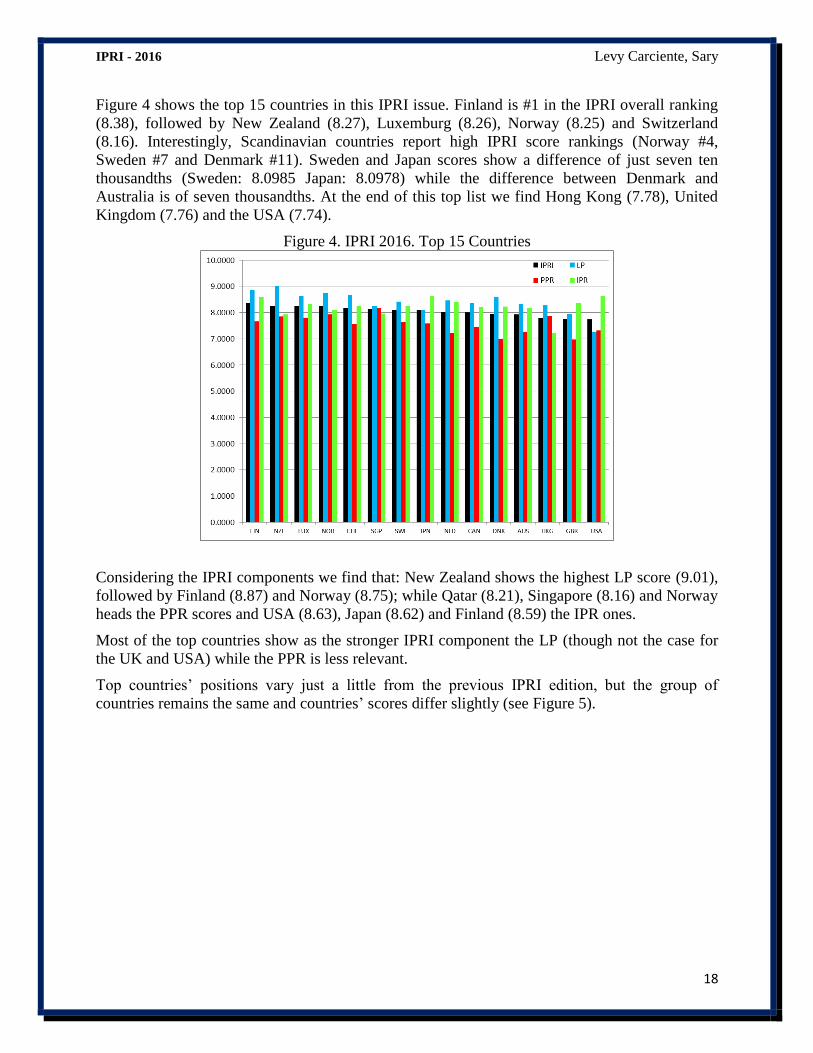
Figure 4 shows the top 15 countries in this IPRI issue. Finland is #1 in the IPRI overall ranking
(8.38), followed by New Zealand (8.27), Luxemburg (8.26), Norway (8.25) and Switzerland
(8.16). Interestingly, Scandinavian countries report high IPRI score rankings (Norway #4,
Sweden #7 and Denmark #11). Sweden and Japan scores show a difference of just seven ten
thousandths (Sweden: 8.0985 Japan: 8.0978) while the difference between Denmark and
Australia is of seven thousandths. At the end of this top list we find Hong Kong (7.78), United
Kingdom (7.76) and the USA (7.74).
Figure 4. IPRI 2016. Top 15 Countries
Considering the IPRI components we find that: New Zealand shows the highest LP score (9.01),
followed by Finland (8.87) and Norway (8.75); while Qatar (8.21), Singapore (8.16) and Norway
heads the PPR scores and USA (8.63), Japan (8.62) and Finland (8.59) the IPR ones.
Most of the top countries show as the stronger IPRI component the LP (though not the case for
the UK and USA) while the PPR is less relevant.
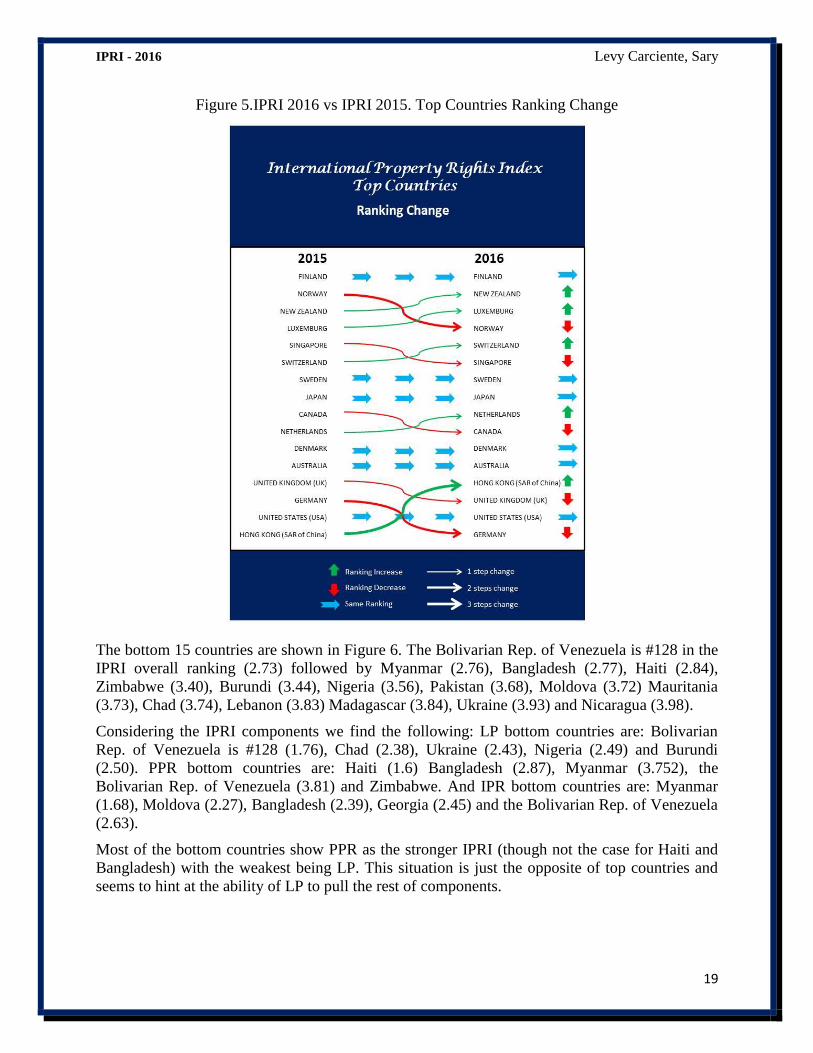
Top countries’ positions vary just a little from the previous IPRI edition, but the group of
countries remains the same and countries’ scores differ slightly (see Figure 5).
IPRI - 2016 Levy Carciente, Sary
19
Figure 5.IPRI 2016 vs IPRI 2015. Top Countries Ranking Change
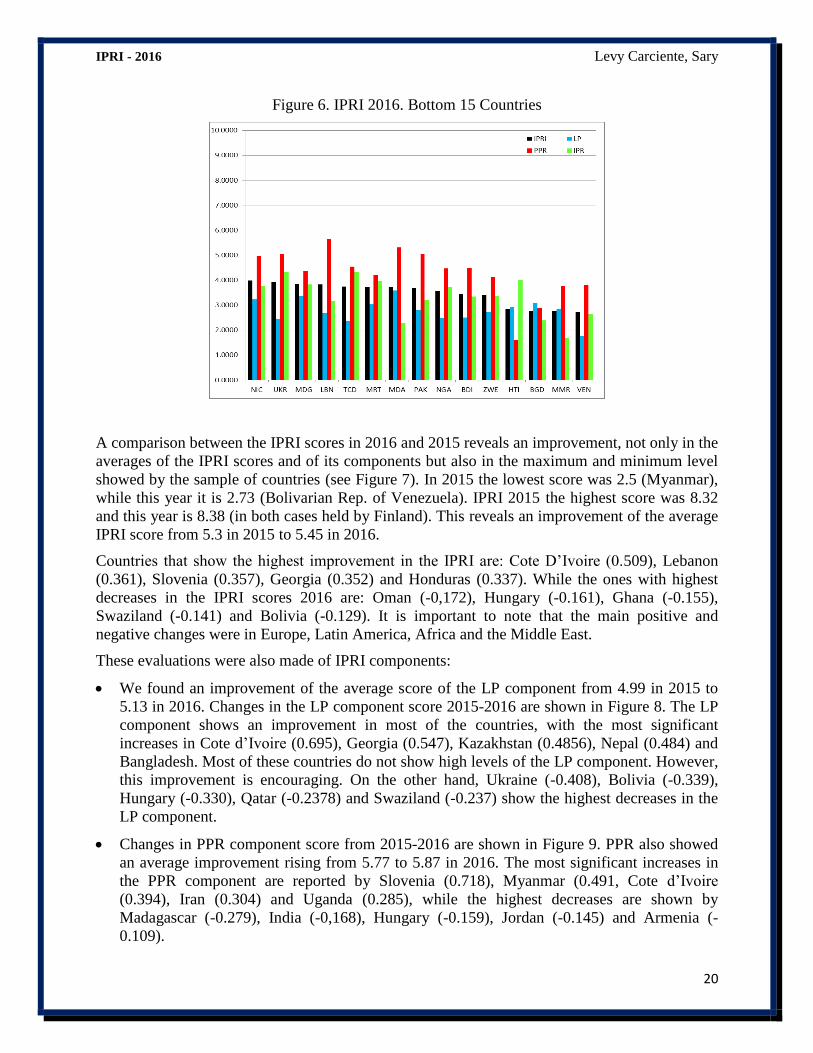
The bottom 15 countries are shown in Figure 6. The Bolivarian Rep. of Venezuela is #128 in the
IPRI overall ranking (2.73) followed by Myanmar (2.76), Bangladesh (2.77), Haiti (2.84),
Zimbabwe (3.40), Burundi (3.44), Nigeria (3.56), Pakistan (3.68), Moldova (3.72) Mauritania
(3.73), Chad (3.74), Lebanon (3.83) Madagascar (3.84), Ukraine (3.93) and Nicaragua (3.98).
Considering the IPRI components we find the following: LP bottom countries are: Bolivarian
Rep. of Venezuela is #128 (1.76), Chad (2.38), Ukraine (2.43), Nigeria (2.49) and Burundi
(2.50). PPR bottom countries are: Haiti (1.6) Bangladesh (2.87), Myanmar (3.752), the
Bolivarian Rep. of Venezuela (3.81) and Zimbabwe. And IPR bottom countries are: Myanmar
(1.68), Moldova (2.27), Bangladesh (2.39), Georgia (2.45) and the Bolivarian Rep. of Venezuela
(2.63).
Most of the bottom countries show PPR as the stronger IPRI (though not the case for Haiti and
Bangladesh) with the weakest being LP. This situation is just the opposite of top countries and
seems to hint at the ability of LP to pull the rest of components.
IPRI - 2016 Levy Carciente, Sary
20
Figure 6. IPRI 2016. Bottom 15 Countries
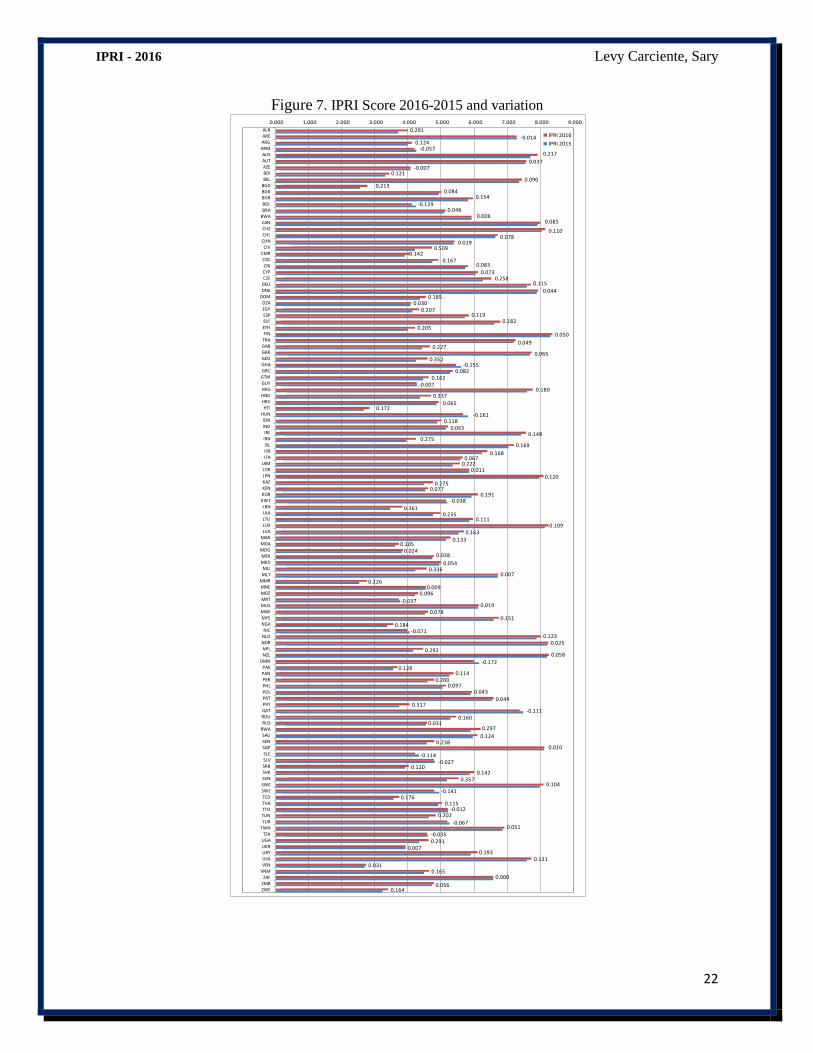
A comparison between the IPRI scores in 2016 and 2015 reveals an improvement, not only in the
averages of the IPRI scores and of its components but also in the maximum and minimum level
showed by the sample of countries (see Figure 7). In 2015 the lowest score was 2.5 (Myanmar),
while this year it is 2.73 (Bolivarian Rep. of Venezuela). IPRI 2015 the highest score was 8.32
and this year is 8.38 (in both cases held by Finland). This reveals an improvement of the average
IPRI score from 5.3 in 2015 to 5.45 in 2016.
Countries that show the highest improvement in the IPRI are: Cote D’Ivoire (0.509), Lebanon
(0.361), Slovenia (0.357), Georgia (0.352) and Honduras (0.337). While the ones with highest
decreases in the IPRI scores 2016 are: Oman (-0,172), Hungary (-0.161), Ghana (-0.155),
Swaziland (-0.141) and Bolivia (-0.129). It is important to note that the main positive and
negative changes were in Europe, Latin America, Africa and the Middle East.
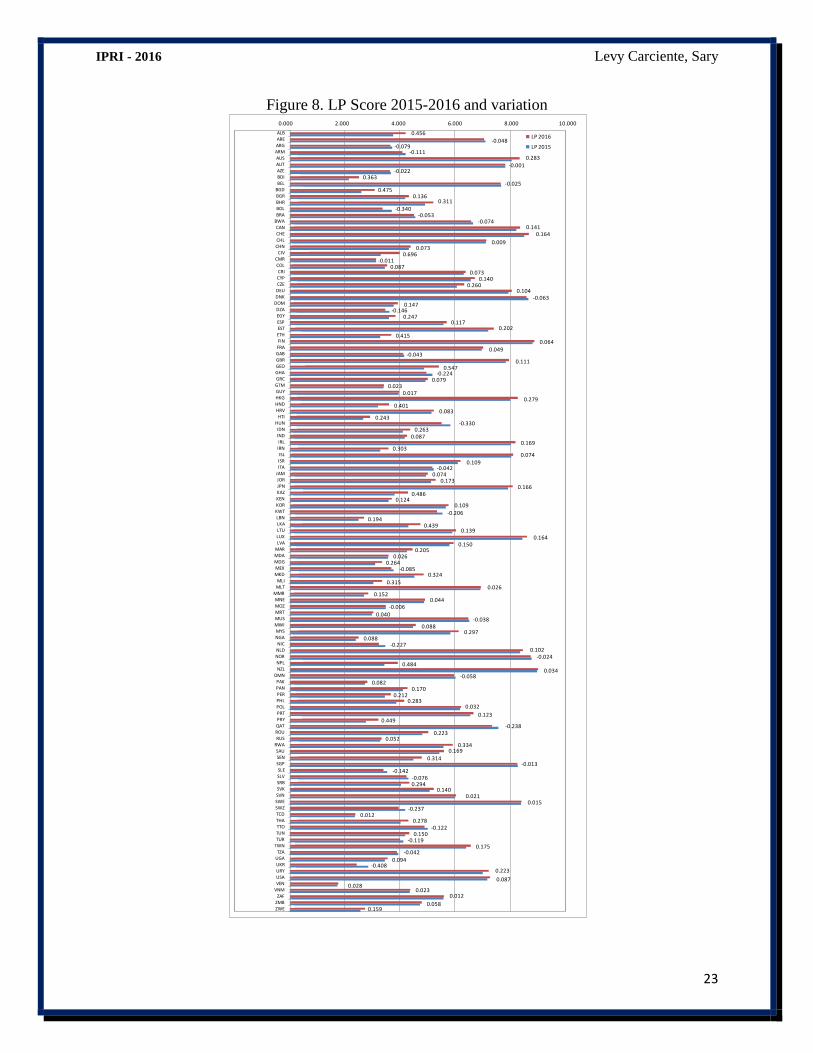
These evaluations were also made of IPRI components:
We found an improvement of the average score of the LP component from 4.99 in 2015 to
5.13 in 2016. Changes in the LP component score 2015-2016 are shown in Figure 8. The LP
component shows an improvement in most of the countries, with the most significant
increases in Cote d’Ivoire (0.695), Georgia (0.547), Kazakhstan (0.4856), Nepal (0.484) and
Bangladesh. Most of these countries do not show high levels of the LP component. However,
this improvement is encouraging. On the other hand, Ukraine (-0.408), Bolivia (-0.339),
Hungary (-0.330), Qatar (-0.2378) and Swaziland (-0.237) show the highest decreases in the
LP component.
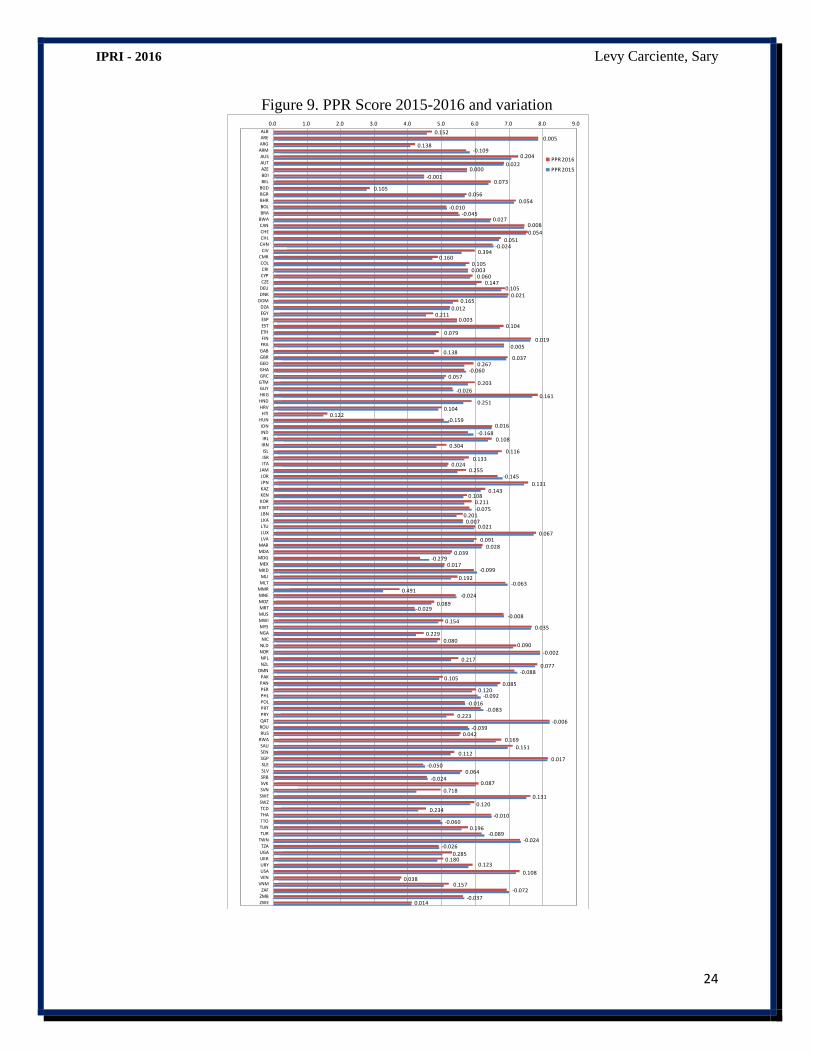
Changes in PPR component score from 2015-2016 are shown in Figure 9. PPR also showed
an average improvement rising from 5.77 to 5.87 in 2016. The most significant increases in
the PPR component are reported by Slovenia (0.718), Myanmar (0.491, Cote d’Ivoire
(0.394), Iran (0.304) and Uganda (0.285), while the highest decreases are shown by
Madagascar (-0.279), India (-0,168), Hungary (-0.159), Jordan (-0.145) and Armenia (-
0.109).
IPRI - 2016 Levy Carciente, Sary
21
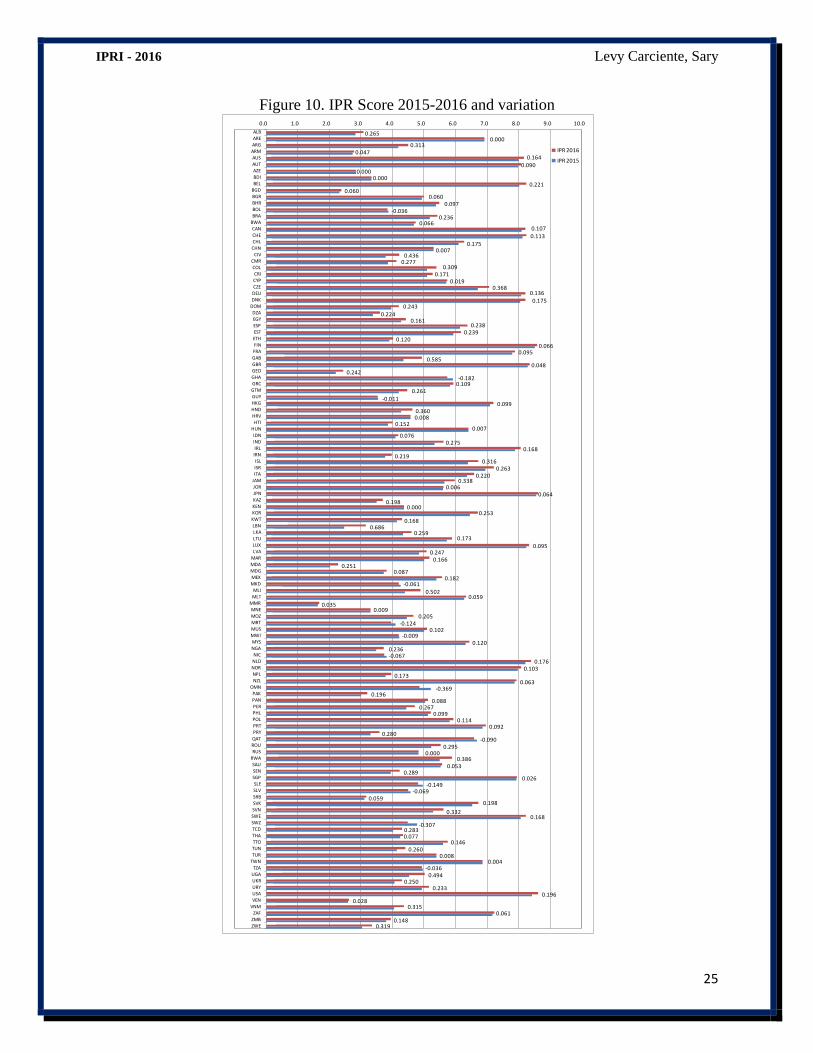
Changes in the IPR component score from 2015-2016 are shown in Figure 10. The IPR
component average rose from 5.14 in 2015 to 5.33 for 2016. The most significant increases
in the IPR component are reported by Lebanon (0.686), Gabon (0.585), Mali (0.502), Uganda
(0.494) and Cote d’Ivoire (0.436); while the countries that showed the most relevant
decreases are Oman (-0.369) Swaziland (-0.307), Ghana (-0.1815), Sierra Leone (-0.149) and
Mauritania (-0.124).
IPRI - 2016 Levy Carciente, Sary
22
Figure 7. IPRI Score 2016-2015 and variation
0.1640.056
0.0000.165
0.0310.131
0.1930.007
0.291-0.035
0.051-0.067
0.202-0.012
0.1150.176
-0.1410.104
0.3570.142
0.110-0.027
-0.114
0.0100.238
0.124
0.2970.031
0.160-0.111
0.3170.044
0.0430.097
0.2000.114
0.128-0.172
0.0580.292
0.0250.123
-0.0710.184
0.1510.078
0.019-0.037
0.0960.009
0.226
0.0070.336
0.054
0.0380.024
0.1050.133
0.1630.109
0.1110.235
0.361
-0.0380.191
0.0770.275
0.1200.011
0.2220.067
0.168
0.1690.275
0.1480.065
0.118-0.161
0.1720.065
0.3370.180
-0.0070.162
0.082-0.155
0.3520.065
0.2270.049
0.0500.205
0.1820.119
0.2070.030
0.1850.044
0.1150.258
0.073
0.0830.167
0.1420.509
0.0190.078
0.110
0.0850.006
0.046-0.129
0.1540.084
0.2130.090
0.121-0.007
0.037
0.217-0.057
0.124-0.014
0.291
ZWEZMBZAF
VNM
VENUSAURYUKRUGA
TZATWNTURTUNTTO
THATCDSWZSWESVNSVKSRBSLVSLESGPSENSAU
RWARUSROUQATPRYPRTPOLPHLPERPANPAK
OMN
NZLNPLNORNLDNIC
NGAMYSMWIMUSMRT
MOZMNEMMRMLTMLI
MKDMEX
MDGMDAMARLVALUXLTULKALBN
KWTKORKENKAZJPNJORJAM
ITAISR
ISLIRNIRL
INDIDN
HUNHTI
HRVHNDHKG
GUYGTMGRCGHAGEOGBRGABFRAFINETHESTESPEGYDZA
DOMDNKDEUCZECYPCRI
COLCMR
CIVCHN
CHLCHECANBWABRA
BOLBHRBGRBGDBEL
BDIAZEAUTAUS
ARMARGAREALB
IPRI 2016
IPRI 2015
0.1640.056
0.0000.165
0.0310.131
0.1930.007
0.291-0.035
0.051-0.067
0.202-0.012
0.1150.176
-0.1410.104
0.3570.142
0.110-0.027
-0.114
0.0100.238
0.124
0.2970.031
0.160-0.111
0.3170.044
0.0430.097
0.2000.114
0.128-0.172
0.0580.292
0.0250.123
-0.0710.184
0.1510.078
0.019-0.037
0.0960.009
0.2260.007
0.3360.054
0.0380.024
0.1050.133
0.1630.109
0.1110.235
0.361-0.038
0.1910.077
0.2750.120
0.0110.222
0.0670.168
0.1690.275
0.1480.065
0.118-0.161
0.1720.065
0.3370.180
-0.0070.162
0.082-0.155
0.3520.065
0.2270.049
0.0500.205
0.1820.119
0.2070.030
0.1850.044
0.1150.258
0.0730.083
0.1670.142
0.5090.019
0.0780.110
0.0850.006
0.046-0.129
0.1540.084
0.2130.090
0.121-0.007
0.037
0.217-0.057
0.124-0.014
0.291
-1.000 0.000 1.000 2.000 3.000 4.000 5.000 6.000 7.000 8.000 9.000
ZWEZMBZAF
VNMVENUSAURYUKRUGATZA
TWNTURTUNTTOTHATCDSWZSWESVNSVKSRBSLVSLESGPSENSAU
RWARUSROUQATPRYPRTPOLPHLPERPANPAK
OMNNZLNPLNORNLDNIC
NGAMYSMWIMUSMRTMOZMNEMMRMLTMLI
MKDMEX
MDGMDAMARLVALUXLTULKALBN
KWTKORKENKAZJPNJORJAM
ITAISRISL
IRNIRL
INDIDN
HUNHTI
HRVHNDHKGGUYGTMGRCGHAGEOGBRGABFRAFINETHESTESPEGYDZA
DOMDNKDEUCZECYPCRI
COLCMR
CIVCHNCHLCHECANBWABRABOLBHRBGRBGDBELBDIAZEAUTAUS
ARMARGAREALB
Variación
IPRI 2016
IPRI 2015
IPRI - 2016 Levy Carciente, Sary
23
Figure 8. LP Score 2015-2016 and variation
0.159
0.058
0.0120.023
0.0280.087
0.223-0.408
0.094
-0.0420.175
-0.1190.150
-0.1220.278
0.012-0.237
0.0150.021
0.1400.294-0.076
-0.142-0.013
0.314
0.1690.334
0.0520.223
-0.2380.449
0.123
0.0320.283
0.2120.170
0.082-0.058
0.0340.484
-0.0240.102
-0.2270.088
0.2970.088
-0.0380.040
-0.0060.044
0.1520.026
0.315
0.324-0.085
0.2640.026
0.2050.150
0.1640.139
0.4390.194
-0.206
0.1090.124
0.4860.166
0.1730.074
-0.0420.109
0.0740.303
0.1690.087
0.263-0.330
0.2430.083
0.4010.279
0.0170.023
0.079-0.224
0.5470.111
-0.0430.049
0.0640.415
0.2020.117
0.247-0.146
0.147-0.063
0.1040.260
0.1400.073
0.087-0.011
0.6960.073
0.009
0.1640.141
-0.074-0.053
-0.340
0.3110.136
0.475-0.025
0.363-0.022
-0.001
0.283-0.111
-0.079-0.048
0.456
ZWEZMBZAF
VNMVENUSAURYUKRUGATZA
TWNTURTUNTTOTHATCDSWZSWESVNSVKSRBSLVSLE
SGPSENSAU
RWARUSROUQATPRYPRTPOLPHLPERPANPAK
OMNNZLNPLNORNLDNIC
NGAMYS
MWIMUSMRTMOZMNE
MMRMLTMLI
MKDMEXMDGMDAMARLVALUXLTULKALBN
KWTKORKENKAZJPNJORJAMITAISRISL
IRNIRL
INDIDN
HUNHTI
HRVHNDHKGGUYGTMGRCGHAGEOGBRGABFRAFINETHESTESPEGYDZA
DOMDNKDEUCZECYPCRI
COLCMR
CIVCHNCHLCHECAN
BWABRABOLBHRBGRBGDBELBDIAZEAUTAUS
ARMARGAREALB
LP 2016
LP 2015
0.1590.058
0.0120.023
0.0280.087
0.223-0.408
0.094-0.042
0.175-0.119
0.150-0.122
0.2780.012
-0.2370.015
0.0210.140
0.294-0.076
-0.142-0.013
0.3140.169
0.3340.052
0.223-0.238
0.4490.123
0.0320.283
0.2120.170
0.082-0.058
0.0340.484
-0.0240.102
-0.2270.088
0.2970.088
-0.0380.040
-0.0060.044
0.1520.026
0.3150.324
-0.0850.264
0.0260.205
0.1500.164
0.1390.439
0.194-0.206
0.1090.124
0.4860.166
0.1730.074
-0.0420.109
0.0740.303
0.1690.087
0.263-0.330
0.2430.083
0.4010.279
0.0170.023
0.079-0.224
0.5470.111
-0.0430.049
0.0640.415
0.2020.117
0.247-0.146
0.147-0.063
0.1040.260
0.1400.073
0.087-0.011
0.6960.073
0.009
0.1640.141
-0.074-0.053
-0.3400.311
0.1360.475
-0.0250.363
-0.022-0.001
0.283-0.111
-0.079-0.048
0.456
-2.000 0.000 2.000 4.000 6.000 8.000 10.000
ZWEZMBZAF
VNMVENUSAURYUKRUGATZA
TWNTURTUNTTOTHATCDSWZSWESVNSVKSRBSLVSLE
SGPSENSAU
RWARUSROUQATPRYPRTPOLPHLPERPANPAK
OMNNZLNPLNORNLDNIC
NGAMYS
MWIMUSMRTMOZMNE
MMRMLTMLI
MKDMEXMDGMDAMARLVALUXLTULKALBN
KWTKORKENKAZJPNJORJAMITAISRISL
IRNIRL
INDIDN
HUNHTI
HRVHNDHKGGUYGTMGRCGHAGEOGBRGABFRAFINETHESTESPEGYDZA
DOMDNKDEUCZECYPCRI
COLCMR
CIVCHNCHLCHECAN
BWABRABOLBHRBGRBGDBELBDIAZEAUTAUS
ARMARGAREALB
LP 2016
LP 2015
IPRI - 2016 Levy Carciente, Sary
24
Figure 9. PPR Score 2015-2016 and variation
0.014-0.037
-0.0720.157
0.0380.108
0.1230.180
0.285
-0.026-0.024
-0.0890.196
-0.060-0.010
0.2340.120
0.1310.718
0.087-0.024
0.064-0.050
0.0170.112
0.151
0.1690.042
-0.039-0.006
0.223-0.083
-0.016
-0.0920.120
0.0850.105
-0.0880.077
0.217-0.002
0.0900.080
0.2290.035
0.154-0.008
-0.0290.089
-0.0240.491
-0.0630.192
-0.0990.017
-0.2790.039
0.0280.091
0.0670.021
0.0070.201
-0.0750.211
0.1080.143
0.131
-0.1450.255
0.0240.133
0.1160.304
0.108-0.168
0.016-0.159
0.1220.104
0.2510.161
-0.026
0.2030.057
-0.0600.267
0.0370.138
0.0050.019
0.0790.104
0.0030.211
0.012
0.1650.021
0.1050.147
0.0600.0030.105
0.1600.394
-0.0240.051
0.054
0.0080.027
-0.045-0.010
0.0540.056
0.1050.073
-0.001
0.0000.022
0.204-0.109
0.1380.005
0.152
ZWEZMBZAF
VNMVENUSAURYUKRUGATZA
TWNTURTUNTTOTHATCDSWZSWESVNSVKSRBSLVSLESGPSENSAU
RWARUSROUQATPRYPRTPOLPHLPERPANPAK
OMNNZLNPLNORNLDNIC
NGAMYSMWIMUSMRTMOZMNEMMRMLTMLI
MKDMEX
MDGMDAMARLVALUXLTULKALBN
KWTKORKENKAZJPNJORJAM
ITAISRISL
IRNIRL
INDIDN
HUNHTI
HRVHNDHKGGUYGTMGRCGHAGEOGBRGABFRAFINETHESTESPEGYDZA
DOMDNKDEUCZECYPCRI
COLCMR
CIVCHNCHLCHECANBWABRABOLBHRBGRBGDBELBDIAZEAUTAUS
ARMARGAREALB
PPR 2016
PPR 2015
0.014-0.037
-0.0720.157
0.0380.108
0.1230.180
0.285-0.026
-0.024-0.089
0.196-0.060
-0.0100.234
0.1200.131
0.7180.087
-0.0240.064
-0.0500.017
0.1120.151
0.1690.042
-0.039-0.006
0.223-0.083
-0.016-0.092
0.1200.085
0.105-0.088
0.0770.217
-0.0020.090
0.0800.229
0.0350.154
-0.008-0.029
0.089
-0.0240.491
-0.0630.192
-0.0990.017
-0.2790.039
0.0280.091
0.0670.021
0.0070.201
-0.0750.211
0.1080.143
0.131-0.145
0.2550.024
0.1330.116
0.3040.108
-0.1680.016
-0.1590.122
0.1040.251
0.161-0.026
0.2030.057
-0.0600.267
0.0370.138
0.0050.019
0.0790.104
0.0030.211
0.0120.165
0.0210.105
0.1470.060
0.0030.105
0.1600.394
-0.0240.051
0.0540.008
0.027-0.045
-0.0100.054
0.0560.105
0.073-0.001
0.0000.022
0.204-0.109
0.1380.005
0.152
-1.0 0.0 1.0 2.0 3.0 4.0 5.0 6.0 7.0 8.0 9.0
ZWEZMBZAF
VNMVENUSAURYUKRUGATZA
TWNTURTUNTTOTHATCDSWZSWESVNSVKSRBSLVSLESGPSENSAU
RWARUSROUQATPRYPRTPOLPHLPERPANPAK
OMNNZLNPLNORNLDNIC
NGAMYSMWIMUSMRTMOZMNEMMRMLTMLI
MKDMEX
MDGMDAMARLVALUXLTULKALBN
KWTKORKENKAZJPNJORJAM
ITAISRISL
IRNIRL
INDIDN
HUNHTI
HRVHNDHKGGUYGTMGRCGHAGEOGBRGABFRAFINETHESTESPEGYDZA
DOMDNKDEUCZECYPCRI
COLCMR
CIVCHNCHLCHECANBWABRABOLBHRBGRBGDBELBDIAZEAUTAUS
ARMARGAREALB
PPR 2016
PPR 2015
IPRI - 2016 Levy Carciente, Sary
25
Figure 10. IPR Score 2015-2016 and variation
0.3190.148
0.0610.315
0.0280.196
0.2330.250
0.494-0.036
0.0040.008
0.2600.146
0.0770.283
-0.307
0.1680.332
0.1980.059
-0.069-0.149
0.0260.289
0.0530.386
0.0000.295
-0.0900.280
0.0920.114
0.0990.267
0.0880.196
-0.3690.063
0.1730.103
0.176-0.0670.236
0.120-0.009
0.102-0.124
0.2050.009
0.035
0.0590.502
-0.0610.182
0.0870.251
0.1660.247
0.095
0.1730.259
0.6860.168
0.2530.000
0.198
0.0640.006
0.3380.220
0.2630.316
0.2190.168
0.2750.076
0.0070.152
0.0080.360
0.099-0.011
0.2610.109-0.182
0.2420.048
0.5850.095
0.0660.120
0.2390.238
0.1610.224
0.2430.175
0.1360.368
0.0190.171
0.3090.277
0.4360.007
0.175
0.113
0.1070.066
0.236-0.036
0.0970.060
0.0600.221
0.0000.000
0.090
0.1640.047
0.3130.000
0.265
ZWEZMBZAF
VNMVENUSAURYUKRUGATZA
TWNTURTUNTTOTHATCDSWZSWESVNSVKSRBSLVSLE
SGPSENSAU
RWARUSROUQATPRYPRTPOLPHLPERPANPAK
OMNNZLNPLNORNLDNIC
NGAMYS
MWIMUSMRTMOZMNE
MMRMLTMLI
MKDMEXMDGMDAMARLVALUXLTULKALBN
KWTKORKENKAZJPNJORJAMITAISRISL
IRNIRL
INDIDN
HUNHTI
HRVHNDHKGGUYGTMGRCGHAGEOGBRGABFRAFINETHESTESPEGYDZA
DOMDNKDEUCZECYPCRI
COLCMR
CIVCHNCHLCHECAN
BWABRABOLBHRBGRBGDBELBDIAZEAUTAUS
ARMARGAREALB
IPR 2016
IPR 2015
0.3190.148
0.0610.315
0.0280.196
0.2330.250
0.494-0.036
0.0040.008
0.2600.146
0.0770.283
-0.3070.168
0.332
0.1980.059
-0.069-0.149
0.0260.289
0.0530.386
0.0000.295
-0.0900.280
0.0920.114
0.0990.267
0.0880.196
-0.3690.063
0.1730.103
0.176-0.0670.236
0.120-0.009
0.102-0.124
0.2050.009
0.0350.059
0.502-0.061
0.1820.087
0.2510.166
0.2470.095
0.1730.259
0.6860.168
0.2530.000
0.1980.064
0.0060.338
0.2200.263
0.3160.219
0.1680.275
0.0760.007
0.1520.0080.360
0.099-0.011
0.2610.109-0.182
0.2420.048
0.5850.095
0.0660.120
0.2390.238
0.1610.224
0.2430.175
0.1360.368
0.0190.171
0.3090.277
0.4360.007
0.1750.1130.107
0.0660.236
-0.0360.097
0.0600.060
0.2210.000
0.0000.090
0.1640.047
0.3130.000
0.265
-1.0 0.0 1.0 2.0 3.0 4.0 5.0 6.0 7.0 8.0 9.0 10.0
ZWEZMBZAF
VNMVENUSAURYUKRUGATZA
TWNTURTUNTTOTHATCDSWZSWESVNSVKSRBSLVSLE
SGPSENSAU
RWARUSROUQATPRYPRTPOLPHLPERPANPAK
OMNNZLNPLNORNLDNIC
NGAMYS
MWIMUSMRTMOZMNE
MMRMLTMLI
MKDMEXMDGMDAMARLVALUXLTULKALBN
KWTKORKENKAZJPNJORJAMITAISRISL
IRNIRL
INDIDN
HUNHTI
HRVHNDHKGGUYGTMGRCGHAGEOGBRGABFRAFINETHESTESPEGYDZA
DOMDNKDEUCZECYPCRI
COLCMR
CIVCHNCHLCHECAN
BWABRABOLBHRBGRBGDBELBDIAZEAUTAUS
ARMARGAREALB
IPR 2016
IPR 2015
IPRI - 2016 Levy Carciente, Sary
26
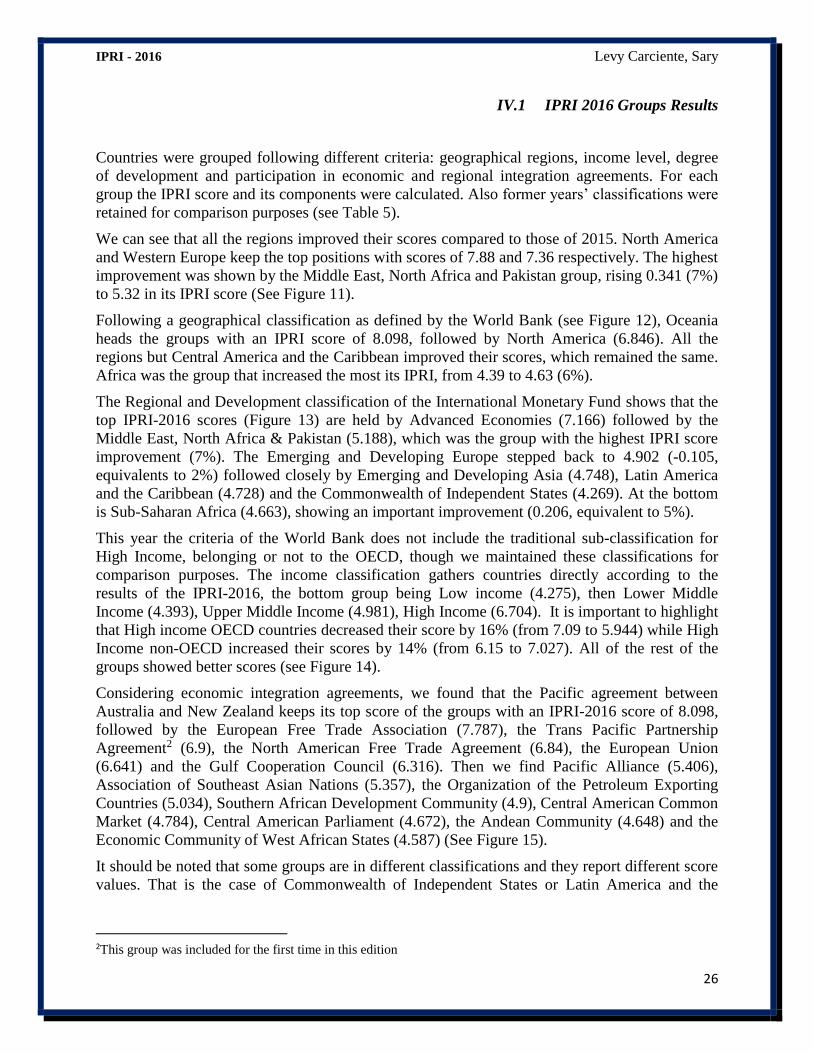
IV.1 IPRI 2016 Groups Results
Countries were grouped following different criteria: geographical regions, income level, degree
of development and participation in economic and regional integration agreements. For each
group the IPRI score and its components were calculated. Also former years’ classifications were
retained for comparison purposes (see Table 5).
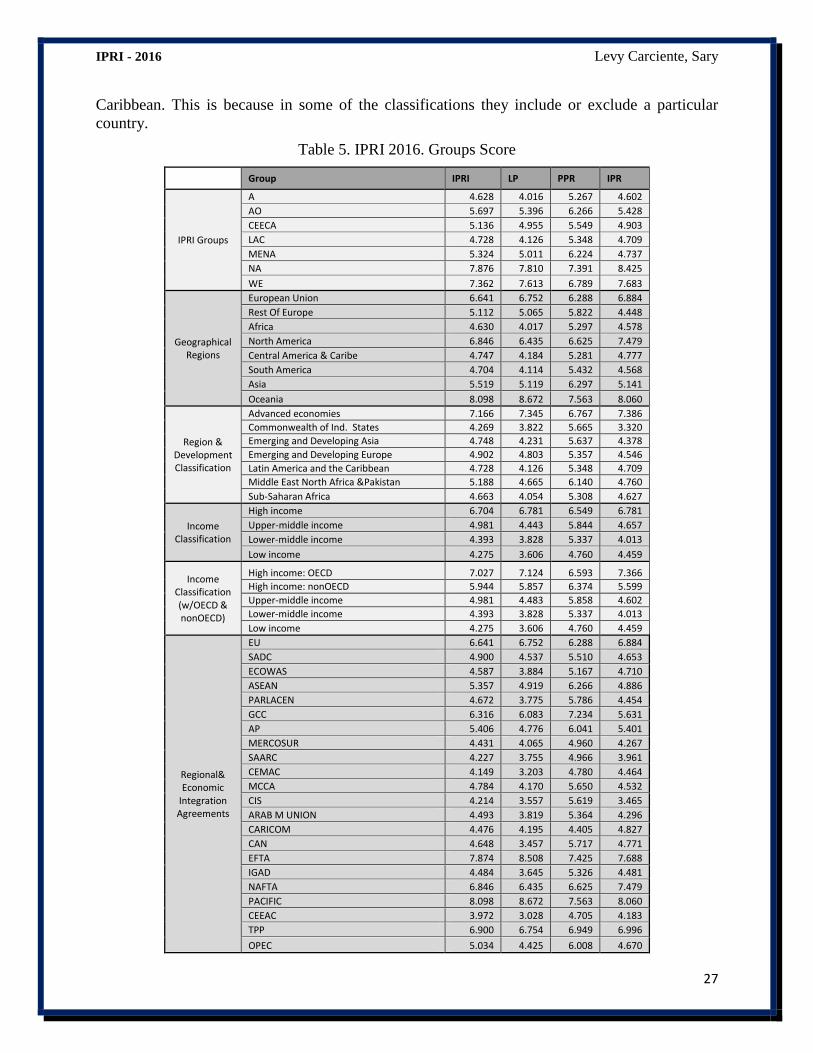
We can see that all the regions improved their scores compared to those of 2015. North America
and Western Europe keep the top positions with scores of 7.88 and 7.36 respectively. The highest
improvement was shown by the Middle East, North Africa and Pakistan group, rising 0.341 (7%)
to 5.32 in its IPRI score (See Figure 11).
Following a geographical classification as defined by the World Bank (see Figure 12), Oceania
heads the groups with an IPRI score of 8.098, followed by North America (6.846). All the
regions but Central America and the Caribbean improved their scores, which remained the same.
Africa was the group that increased the most its IPRI, from 4.39 to 4.63 (6%).
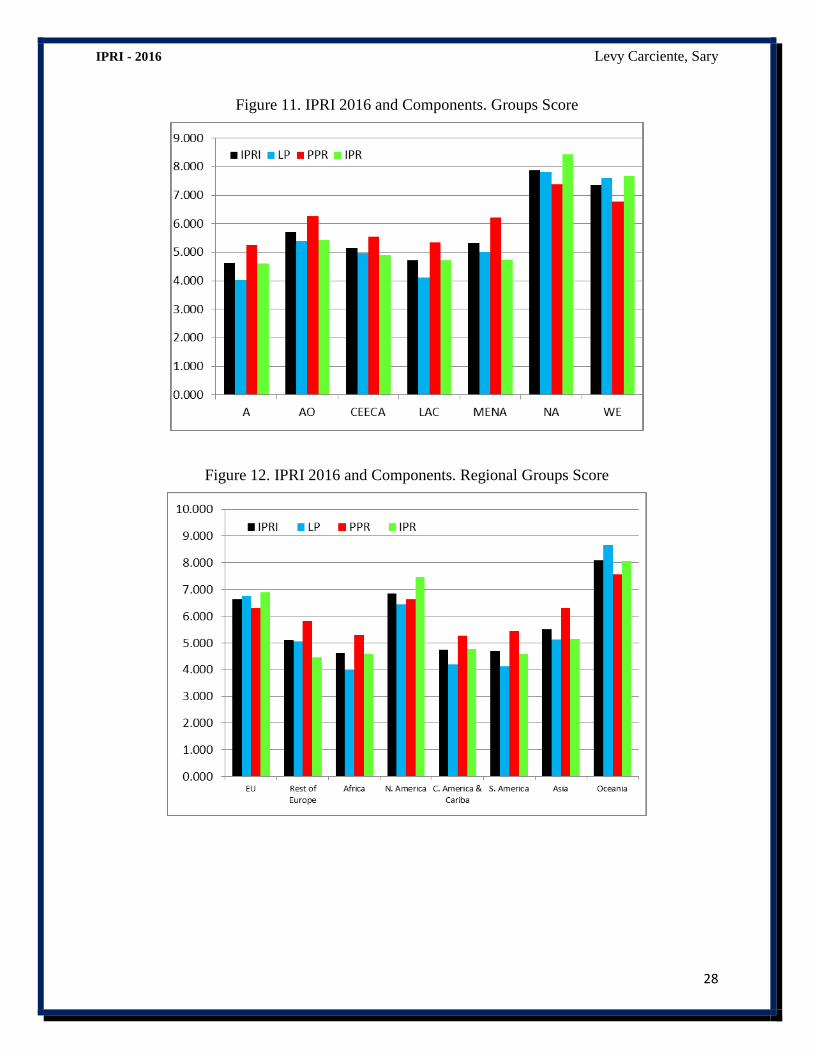
The Regional and Development classification of the International Monetary Fund shows that the
top IPRI-2016 scores (Figure 13) are held by Advanced Economies (7.166) followed by the
Middle East, North Africa & Pakistan (5.188), which was the group with the highest IPRI score
improvement (7%). The Emerging and Developing Europe stepped back to 4.902 (-0.105,
equivalents to 2%) followed closely by Emerging and Developing Asia (4.748), Latin America
and the Caribbean (4.728) and the Commonwealth of Independent States (4.269). At the bottom
is Sub-Saharan Africa (4.663), showing an important improvement (0.206, equivalent to 5%).
This year the criteria of the World Bank does not include the traditional sub-classification for
High Income, belonging or not to the OECD, though we maintained these classifications for
comparison purposes. The income classification gathers countries directly according to the
results of the IPRI-2016, the bottom group being Low income (4.275), then Lower Middle
Income (4.393), Upper Middle Income (4.981), High Income (6.704). It is important to highlight
that High income OECD countries decreased their score by 16% (from 7.09 to 5.944) while High
Income non-OECD increased their scores by 14% (from 6.15 to 7.027). All of the rest of the
groups showed better scores (see Figure 14).
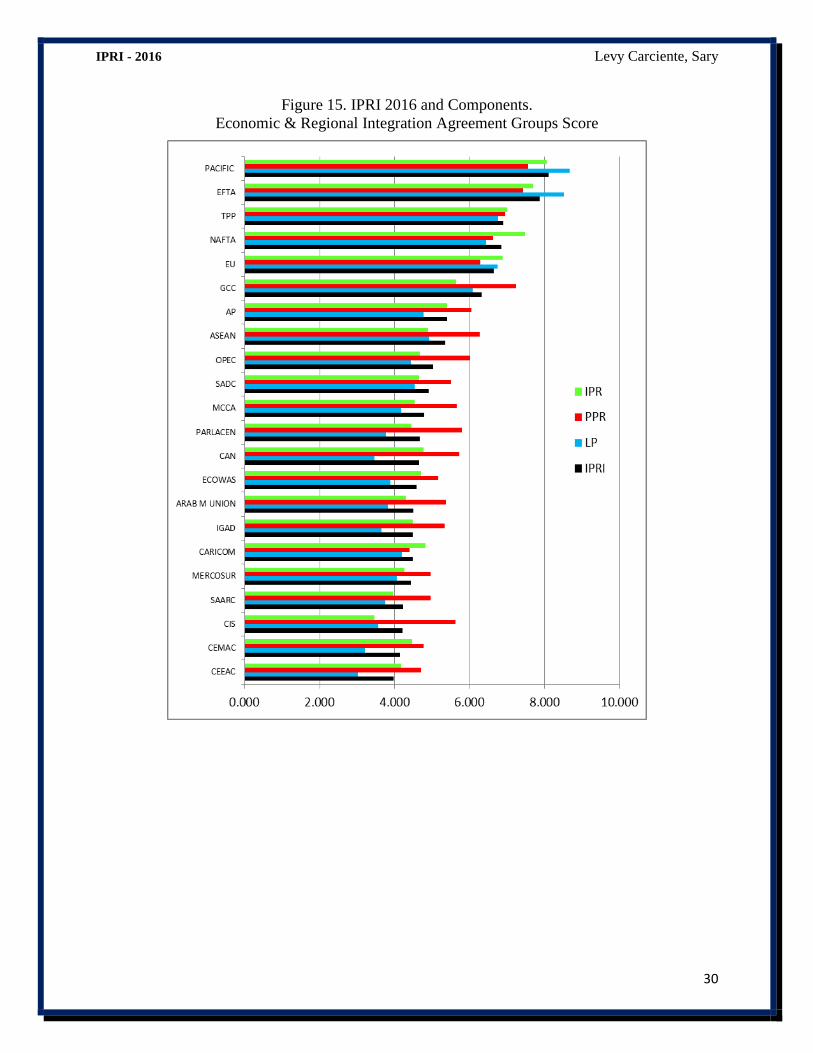
Considering economic integration agreements, we found that the Pacific agreement between
Australia and New Zealand keeps its top score of the groups with an IPRI-2016 score of 8.098,
followed by the European Free Trade Association (7.787), the Trans Pacific Partnership
Agreement2 (6.9), the North American Free Trade Agreement (6.84), the European Union
(6.641) and the Gulf Cooperation Council (6.316). Then we find Pacific Alliance (5.406),
Association of Southeast Asian Nations (5.357), the Organization of the Petroleum Exporting
Countries (5.034), Southern African Development Community (4.9), Central American Common
Market (4.784), Central American Parliament (4.672), the Andean Community (4.648) and the
Economic Community of West African States (4.587) (See Figure 15).
It should be noted that some groups are in different classifications and they report different score
values. That is the case of Commonwealth of Independent States or Latin America and the
2This group was included for the first time in this edition
IPRI - 2016 Levy Carciente, Sary
27
Caribbean. This is because in some of the classifications they include or exclude a particular
country.
Table 5. IPRI 2016. Groups Score
Group IPRI LP PPR IPR
IPRI Groups
A 4.628 4.016 5.267 4.602
AO 5.697 5.396 6.266 5.428
CEECA 5.136 4.955 5.549 4.903
LAC 4.728 4.126 5.348 4.709
MENA 5.324 5.011 6.224 4.737
NA 7.876 7.810 7.391 8.425
WE 7.362 7.613 6.789 7.683
Geographical Regions
European Union 6.641 6.752 6.288 6.884
Rest Of Europe 5.112 5.065 5.822 4.448
Africa 4.630 4.017 5.297 4.578
North America 6.846 6.435 6.625 7.479
Central America & Caribe 4.747 4.184 5.281 4.777
South America 4.704 4.114 5.432 4.568
Asia 5.519 5.119 6.297 5.141
Oceania 8.098 8.672 7.563 8.060
Region & Development Classification
Advanced economies 7.166 7.345 6.767 7.386
Commonwealth of Ind. States 4.269 3.822 5.665 3.320
Emerging and Developing Asia 4.748 4.231 5.637 4.378
Emerging and Developing Europe 4.902 4.803 5.357 4.546
Latin America and the Caribbean 4.728 4.126 5.348 4.709
Middle East North Africa &Pakistan 5.188 4.665 6.140 4.760
Sub-Saharan Africa 4.663 4.054 5.308 4.627
Income Classification
High income 6.704 6.781 6.549 6.781
Upper-middle income 4.981 4.443 5.844 4.657
Lower-middle income 4.393 3.828 5.337 4.013
Low income 4.275 3.606 4.760 4.459
Income Classification (w/OECD & nonOECD)
High income: OECD 7.027 7.124 6.593 7.366
High income: nonOECD 5.944 5.857 6.374 5.599
Upper-middle income 4.981 4.483 5.858 4.602
Lower-middle income 4.393 3.828 5.337 4.013
Low income 4.275 3.606 4.760 4.459
Regional& Economic
Integration Agreements
EU 6.641 6.752 6.288 6.884
SADC 4.900 4.537 5.510 4.653
ECOWAS 4.587 3.884 5.167 4.710
ASEAN 5.357 4.919 6.266 4.886
PARLACEN 4.672 3.775 5.786 4.454
GCC 6.316 6.083 7.234 5.631
AP 5.406 4.776 6.041 5.401
MERCOSUR 4.431 4.065 4.960 4.267
SAARC 4.227 3.755 4.966 3.961
CEMAC 4.149 3.203 4.780 4.464
MCCA 4.784 4.170 5.650 4.532
CIS 4.214 3.557 5.619 3.465
ARAB M UNION 4.493 3.819 5.364 4.296
CARICOM 4.476 4.195 4.405 4.827
CAN 4.648 3.457 5.717 4.771
EFTA 7.874 8.508 7.425 7.688
IGAD 4.484 3.645 5.326 4.481
NAFTA 6.846 6.435 6.625 7.479
PACIFIC 8.098 8.672 7.563 8.060
CEEAC 3.972 3.028 4.705 4.183
TPP 6.900 6.754 6.949 6.996
OPEC 5.034 4.425 6.008 4.670
IPRI - 2016 Levy Carciente, Sary
28
Figure 11. IPRI 2016 and Components. Groups Score
Figure 12. IPRI 2016 and Components. Regional Groups Score
IPRI - 2016 Levy Carciente, Sary
29
Figure 13. IPRI 2016 and Components. Development Groups Score
Figure 14. IPRI 2016 and Components. Income Groups Score
IPRI - 2016 Levy Carciente, Sary
30
Figure 15. IPRI 2016 and Components.
Economic & Regional Integration Agreement Groups Score
IPRI - 2016 Levy Carciente, Sary
31
V. IPRI-Population
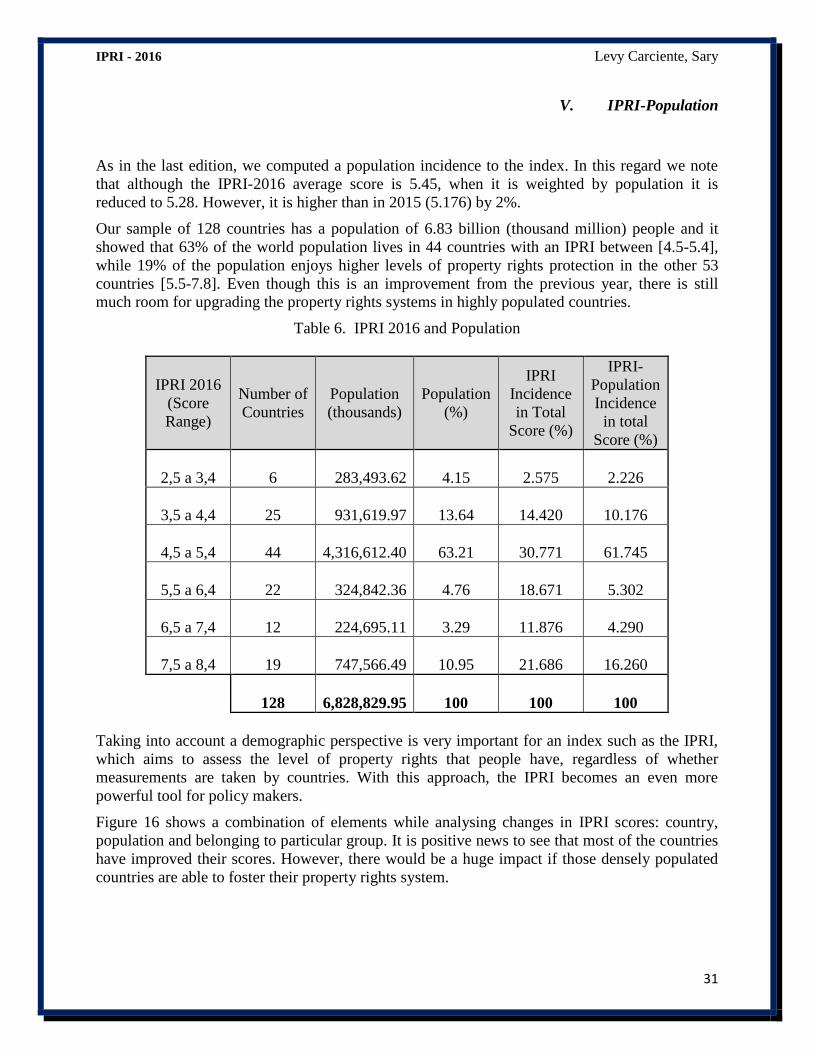
As in the last edition, we computed a population incidence to the index. In this regard we note
that although the IPRI-2016 average score is 5.45, when it is weighted by population it is
reduced to 5.28. However, it is higher than in 2015 (5.176) by 2%.
Our sample of 128 countries has a population of 6.83 billion (thousand million) people and it
showed that 63% of the world population lives in 44 countries with an IPRI between [4.5-5.4],
while 19% of the population enjoys higher levels of property rights protection in the other 53
countries [5.5-7.8]. Even though this is an improvement from the previous year, there is still
much room for upgrading the property rights systems in highly populated countries.
Table 6. IPRI 2016 and Population
IPRI 2016
(Score
Range)
Number of
Countries
Population
(thousands)
Population
(%)
IPRI
Incidence
in Total
Score (%)
IPRI-
Population
Incidence
in total
Score (%)
2,5 a 3,4 6
283,493.62 4.15 2.575 2.226
3,5 a 4,4 25
931,619.97 13.64 14.420 10.176
4,5 a 5,4 44
4,316,612.40 63.21 30.771 61.745
5,5 a 6,4 22
324,842.36 4.76 18.671 5.302
6,5 a 7,4 12
224,695.11 3.29 11.876 4.290
7,5 a 8,4 19
747,566.49 10.95 21.686 16.260
128
6,828,829.95 100 100 100
Taking into account a demographic perspective is very important for an index such as the IPRI,
which aims to assess the level of property rights that people have, regardless of whether
measurements are taken by countries. With this approach, the IPRI becomes an even more
powerful tool for policy makers.
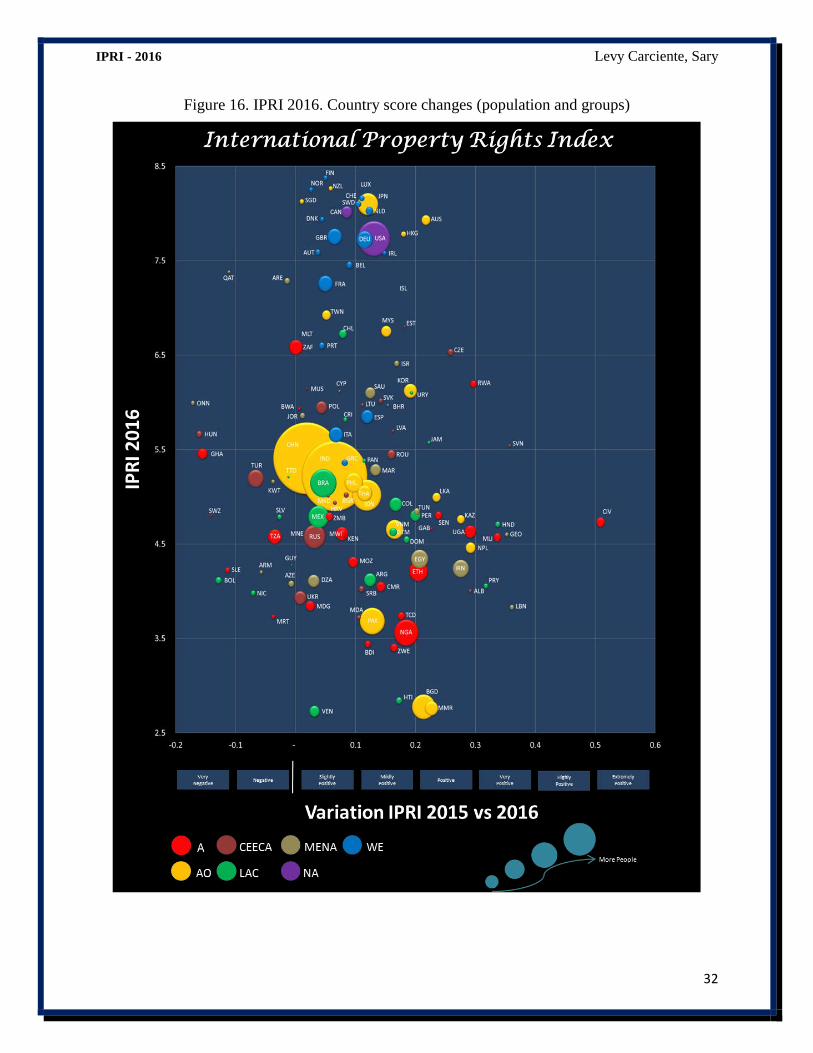
Figure 16 shows a combination of elements while analysing changes in IPRI scores: country,
population and belonging to particular group. It is positive news to see that most of the countries
have improved their scores. However, there would be a huge impact if those densely populated
countries are able to foster their property rights system.
IPRI - 2016 Levy Carciente, Sary
32
Figure 16. IPRI 2016. Country score changes (population and groups)
IPRI - 2016 Levy Carciente, Sary
33
VI. IPRI and Gender
Gender refers to the social attributes and opportunities associated with being male and female
and the relationships between women and men, which are socially constructed and learned
through the socialization processes. Gender Equality refers to the equal rights, responsibilities
and opportunities of women and men and girls and boys; this means that the interests, needs and
priorities of both female and male are taken into consideration, recognizing the diversity of these
different groups. This is an issue of human rights and social justice, so it is a goal in itself.
Simultaneously, it has been demonstrated its relevance fostering development, being especially
evident in some areas like health, education, agriculture and equitable access to credit for
reducing poverty. This means that gender equality plays a crucial role for less developed and
developing countries.
We used the Social Institutions and Gender Index, SIGI (by OECD), to calculate the Gender
component for the IPRI, giving mayor relevance to those items more closely related to property
rights and its impact on economic development.3
To account for gender equality, this chapter extends the standard IPRI measure to include a
measure of gender equality (GE) concerning property rights. The IPRI formula was modified to
incorporate gender equality as following:
IPRI-GE = IPRI + 0.2*GE
A weight of 0.2 for the gender equality measure is arbitrary. We varied the weight to 0.5 or
according to the female/male population in each country, but scores were highly correlated. We
decided to keep the weight of 0.2 for comparison purposes with previous data series.
VI.1 Data & Methodology
The construction of the GE measure is based on the following five indicators (Source: OECD
Gender, Institutions, and Development Database 2014 (GID-DB) details in Appendix III):
1. Women’s Access to Land: Measures whether women and men have equal and secure access
to land use, control and ownership.
2. Women’s Access to Credit: Measures whether women and men have equal access to
financial services
3The SIGI is composed of 5 sub-indexes, each representing a distinct dimension of discrimination: Discriminatory
Family Code, Restricted Physical Integrity, Son Bias, Restricted Resources and Assets and Restricted Civil
Liberties.
IPRI - 2016 Levy Carciente, Sary
34
3. Women’s Access to Property Other than Land: Measures whether women and men have
equal and secure access to non-land asset use, control and ownership
4. Inheritance Practices combines two elements:
a. Inheritance Practice to Daughters: Measures whether daughters and sons have equal
inheritance rights
b. Inheritance Practice to Widows: Measures whether widows and widowers have equal
inheritance rights
5. Women’s Social Rights, covers broader aspects of women’s equality and it is a composite of
four other items crucial to equal standing in society:
a. Parental authority
i. In marriage: Measures whether women and men have the same right to be the
legal guardian of a child during marriage
ii. After divorce: Measures whether women and men have the same right to be
the legal guardian of and have custody rights over a child after divorce
b. Female genital mutilation: Measures the prevalence of female genital mutilation
c. Access to public space: Measures whether women face restrictions on their freedom
of movement and access to public space
d. Son preference in education: Percentage of people agreeing that university is more
important for boys than for girls.
The original data has three levels: 0 (Best), 0.5 (Average) and 1 (Worst). All data series were
rescaled to IPRI scale (0-10). The final GE score is an index based on the average of the five
equally weighted variables. Those variable with more than one item where calculated also as
equally weighted.
A minimum score (0) means complete discrimination against women, while maximum score (10)
is given to countries with gender equality. Consequently, the IPRI-GE scale is (0-12).
As the GE data source is discrete, equal outcomes are likely to be found. That will be reduced in
the IPRI-GE due to the variability of the IPRI scores.
VI.2. IPRI-GE and GE. Country Results
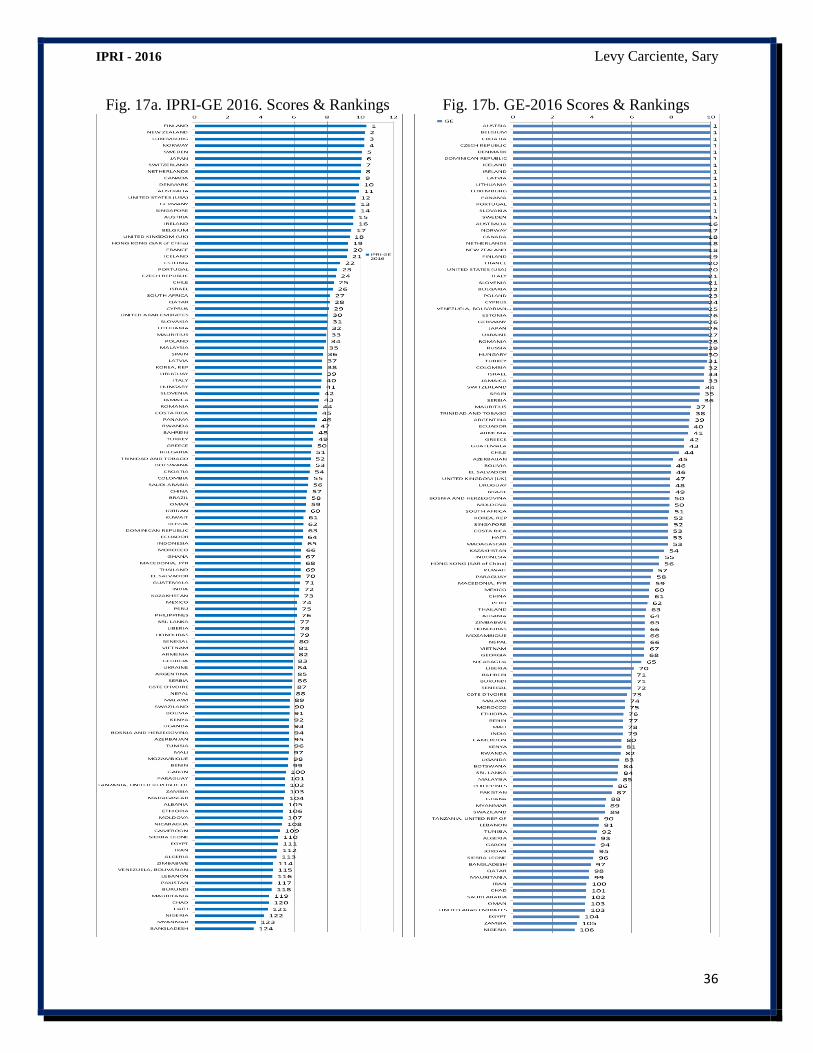
The IPRI-GE shows results for 124 from 128 countries included in the IPRI-2016, as there was
no information available for Guyana, Malta, Montenegro and Taiwan. On average, the 124
countries show a GE of 7.466 and an IPRI-GE of 6.933. This is an improvement from 2015
which yielded a GE of 7.39 and an IPRI-GE of 6.76. The scores and ranking of IPRI-GE 2015
and GE-2015 can be seen in Figures 17a and 17b.
There are 14 countries with a maximum score of GE=10: Austria, Belgium, Croatia, Czech Rep.,
Denmark, Dominican Rep. Iceland Ireland, Latvia, Lithuania, Luxemburg, Panama, Portugal and
Slovakia, and there are 30 other countries in the range of 9-10. The bottom scores of GE are held
IPRI - 2016 Levy Carciente, Sary
35
by Nigeria (3.12), Zambia (3.25), Egypt (3.365), United Arab Emirates (3.666), Oman (3.666),
Saudi Arabia (3.7), Chad (3.706), Iran (3.725) Mauritania (3.853), Qatar (3.86) and Bangladesh
(3.94).
Finland tops the IPRI-GE (10.371), followed by New Zealand (10.261), Luxemburg (10.256),
Norway (10.248), Sweden (10.001), Japan (10.082), Switzerland (10.051), Netherlands (10.022),
Canada (10.009)). All of them very close in their score values, and over 10. In the score range 9-
10 we find Denmark, Australia, USA, Germany, Singapore, Austria, Ireland, Belgium, UK,
Hong Kong, France and Iceland.
On the other extreme of the IPRI-GE we find Bangladesh (3.565), Myanmar (3.693), Nigeria
(4.186), Haiti (4.409), Chad (4.48) Mauritania (4.501), Burundi (4.64), Pakistan (4.683) and
Lebanon (4.7) and the Bolivarian Rep. of Venezuela (4.715). The lattermost not because of its
gender component (which is high: 9.93) but because of its low IPRI score (2.7). The same
applies for Haiti (GE=7.83, IPRI=2.8)
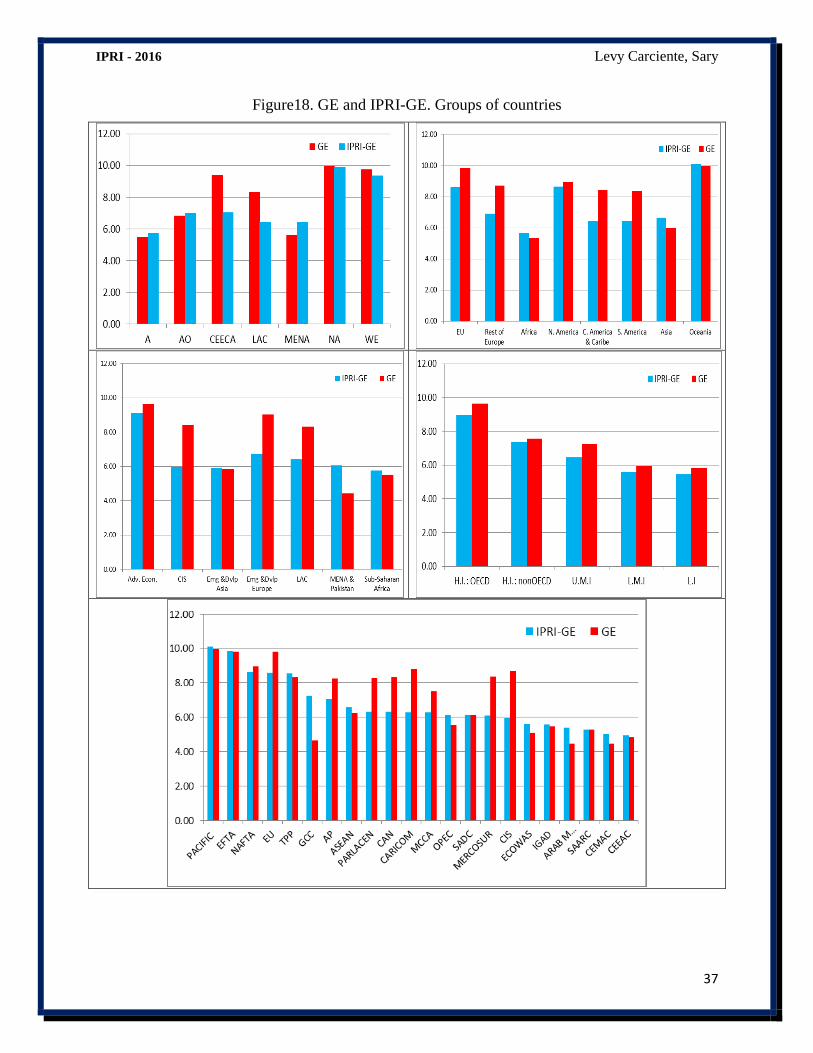
Analyzing the IPRI-GE by groups of countries we found very interesting results (see Figure 18):
• By Region: the three top groups are Oceania, North America, and Europe Union while at the
bottom we find Africa and MENA countries. In these two groups the GE component is
particularly low, pushing down the IPRI-GE score; just the opposite what happens to Latin
America & the Caribbean and part of Europe, high GE scores pull up the IPRI-GE.
• By Regional and Development criteria: The top group is Advanced Economies (9.11)
followed by Emerging and Developing Europe (6.75) and Latin America and the Caribbean
(6.41). Again these two last groups show much better behavior in their GE scores (9.04 and
8.31 respectively) than in the IPRI. The bottom groups are Sub-Saharan Africa (5.77)
Commonwealth of Independent States (5.95) and Emerging and Developing Asia (5.92). The
Middle East, North Africa and Pakistan show the lowest GE score (4.43) followed by the
Sub-Saharan Africa (5.52).
• By Income classification: the GE and the IPRI-GE, follow the same pattern as the IPRI. On
top we find High Income OECD countries (GE=9.63 IPRI-GE=8.95), followed High Income
non-OECD (GE=7.36 IPRI-GE=7.58), Upper Middle Income (GE=6.45 IPRI-GE=7.25),
Low Middle Income (GE=5.58 IPRI-GE=5.93) and Low Income countries (GE=5.44 IPRI-
GE=5.82).
• By Economic and Regional Integration Agreements: As with last year, the top five groups
are Pacific (10.09), European Free Trade Association (9.84), NAFTA (8.64), European
Union (8.60), TPP (8.57), GCC (7.25) and AP (7.06). However the Gulf Cooperation Council
shows a low GE score (4.66) just following the bottom of the list which is held by CEMAC
(4.45) Arab M. Union (4.49). The bottom three groups for the IPRI-GE are the Economic
Community of Central African States (4.94) Central African Economic and Monetary
Community (5.04), South Asian Association for Regional Cooperation (5.29), Arab
Monetary Union (5.39) and Intergovernmental Authority on Development (5.58). It should
be highlighted that all the Latin American agreements (PARLACEN, CAN, CARICOM,
MCCA, MERCOSUR) and the Commonwealth of Independent States show medium IPRI-
GE scores, while showing high levels in GE values.
IPRI - 2016 Levy Carciente, Sary
36
Fig. 17a. IPRI-GE 2016. Scores & Rankings Fig. 17b. GE-2016 Scores & Rankings
IPRI - 2016 Levy Carciente, Sary
37
Figure18. GE and IPRI-GE. Groups of countries
IPRI - 2016 Levy Carciente, Sary
38
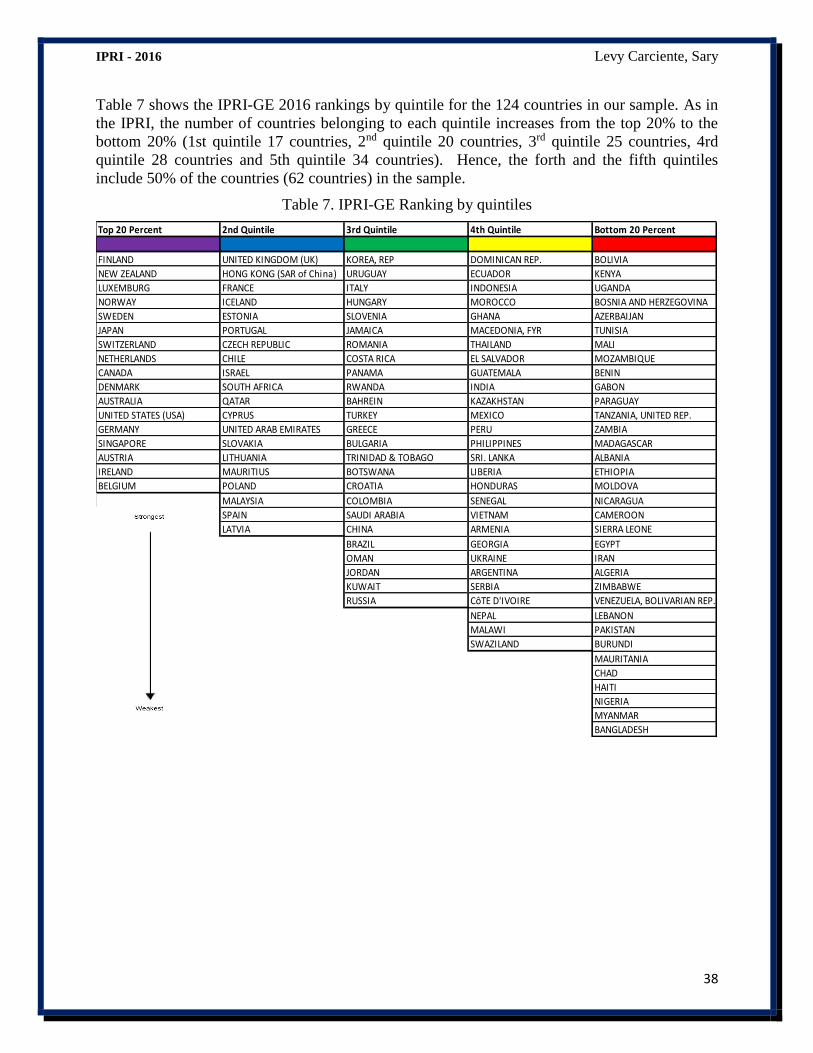
Table 7 shows the IPRI-GE 2016 rankings by quintile for the 124 countries in our sample. As in
the IPRI, the number of countries belonging to each quintile increases from the top 20% to the
bottom 20% (1st quintile 17 countries, 2nd quintile 20 countries, 3rd quintile 25 countries, 4rd
quintile 28 countries and 5th quintile 34 countries). Hence, the forth and the fifth quintiles
include 50% of the countries (62 countries) in the sample.
Table 7. IPRI-GE Ranking by quintiles
Top 20 Percent 2nd Quintile 3rd Quintile 4th Quintile Bottom 20 Percent
FINLAND UNITED KINGDOM (UK) KOREA, REP DOMINICAN REP. BOLIVIA
NEW ZEALAND HONG KONG (SAR of China) URUGUAY ECUADOR KENYA
LUXEMBURG FRANCE ITALY INDONESIA UGANDA
NORWAY ICELAND HUNGARY MOROCCO BOSNIA AND HERZEGOVINA
SWEDEN ESTONIA SLOVENIA GHANA AZERBAIJAN
JAPAN PORTUGAL JAMAICA MACEDONIA, FYR TUNISIA
SWITZERLAND CZECH REPUBLIC ROMANIA THAILAND MALI
NETHERLANDS CHILE COSTA RICA EL SALVADOR MOZAMBIQUE
CANADA ISRAEL PANAMA GUATEMALA BENIN
DENMARK SOUTH AFRICA RWANDA INDIA GABON
AUSTRALIA QATAR BAHREIN KAZAKHSTAN PARAGUAY
UNITED STATES (USA) CYPRUS TURKEY MEXICO TANZANIA, UNITED REP.
GERMANY UNITED ARAB EMIRATES GREECE PERU ZAMBIA
SINGAPORE SLOVAKIA BULGARIA PHILIPPINES MADAGASCAR
AUSTRIA LITHUANIA TRINIDAD & TOBAGO SRI. LANKA ALBANIA
IRELAND MAURITIUS BOTSWANA LIBERIA ETHIOPIA
BELGIUM POLAND CROATIA HONDURAS MOLDOVA
MALAYSIA COLOMBIA SENEGAL NICARAGUA
SPAIN SAUDI ARABIA VIETNAM CAMEROON
LATVIA CHINA ARMENIA SIERRA LEONE
BRAZIL GEORGIA EGYPT
OMAN UKRAINE IRAN
JORDAN ARGENTINA ALGERIA
KUWAIT SERBIA ZIMBABWE
RUSSIA CôTE D'IVOIRE VENEZUELA, BOLIVARIAN REP.
NEPAL LEBANON
MALAWI PAKISTAN
SWAZILAND BURUNDI
MAURITANIA
CHAD
HAITI
NIGERIA
MYANMAR
BANGLADESH

IPRI - 2016 Levy Carciente, Sary
39
VII. IPRI and Development
Since those early stages of modernity when the idea of progress became a goal, nations began to
promote economic growth to achieve development. But development is a much wider concept, a
multidimensional one, addressing economic, political, social, cultural, technological and
ecological spheres, looking for the well-being of present and future generations. Having
examined the important interactions between property rights and development, we analyzed in
this edition some different dimensions of development with the IPRI and its components, as
follows:
Economic Outcomes
Human Capabilities
Social Capital
Research and Innovation
Ecological Performance
VII.1. Economic Outcomes
Trying to grasp development, economic outcomes obviously do not capture everything and many
other factors are likely to influence it, however it is a first approach to it. Four (4) economic
elements were evaluated with the IPRI and its components:
Production: using the Gross Domestic Product (GDP) in constant USD in per capita terms,
and also adjusted by the GINI coefficient. GDP is the sum of gross value added by all
resident producers in the economy plus any product taxes and minus any subsidies not
included in the value of the products. It is calculated without making deductions for
depreciation of fabricated assets or for depletion and degradation of natural resources.
(Source: World Bank data, http://wdi.worldbank.org)
Domestic Investment: using the Gross Capital Formation in current per capita terms, which
consists of outlays on additions to the fixed assets of the economy plus net changes in the
level of inventories (Source: World Bank data, http://wdi.worldbank.org)
The composition of production: using the Index by the Atlas of Economic Complexity. The
complexity of an economy is related to the multiplicity of useful knowledge embedded in it.
We can measure economic complexity by the mix of products that countries are able to
make. (http://atlas.media.mit.edu/en/resources/economic_complexity/).
The entrepreneurship ecosystem: using the Global Entrepreneurship Index of the GEDI that
measures the health of the entrepreneurship ecosystems in countries. It then ranks the
performance of these against each other; providing a picture of how each country performs in
both the domestic and international context. (Source: http://thegedi.org/global-
entrepreneurship-and-development-index/)
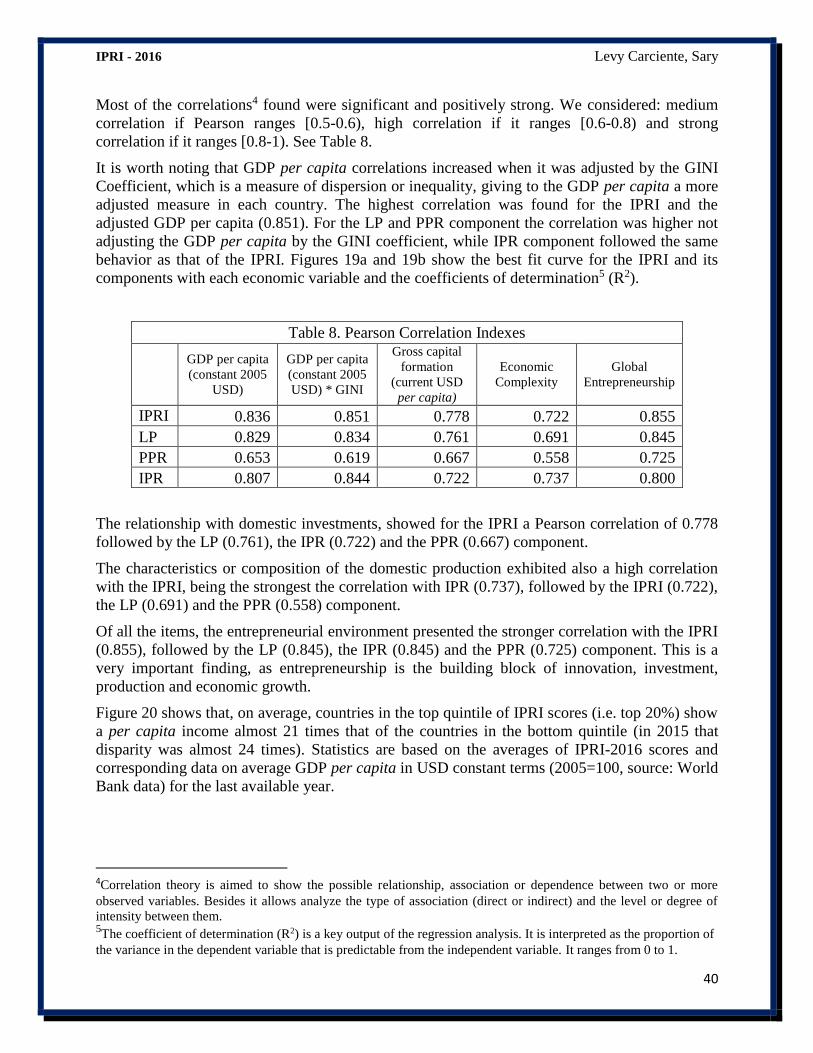
IPRI - 2016 Levy Carciente, Sary
40
Most of the correlations4 found were significant and positively strong. We considered: medium
correlation if Pearson ranges [0.5-0.6), high correlation if it ranges [0.6-0.8) and strong
correlation if it ranges [0.8-1). See Table 8.
It is worth noting that GDP per capita correlations increased when it was adjusted by the GINI
Coefficient, which is a measure of dispersion or inequality, giving to the GDP per capita a more
adjusted measure in each country. The highest correlation was found for the IPRI and the
adjusted GDP per capita (0.851). For the LP and PPR component the correlation was higher not
adjusting the GDP per capita by the GINI coefficient, while IPR component followed the same
behavior as that of the IPRI. Figures 19a and 19b show the best fit curve for the IPRI and its
components with each economic variable and the coefficients of determination5 (R2).
Table 8. Pearson Correlation Indexes
GDP per capita
(constant 2005
USD)
GDP per capita
(constant 2005
USD) * GINI
Gross capital
formation
(current USD
per capita)
Economic
Complexity
Global
Entrepreneurship
IPRI 0.836 0.851 0.778 0.722 0.855
LP 0.829 0.834 0.761 0.691 0.845
PPR 0.653 0.619 0.667 0.558 0.725
IPR 0.807 0.844 0.722 0.737 0.800
The relationship with domestic investments, showed for the IPRI a Pearson correlation of 0.778
followed by the LP (0.761), the IPR (0.722) and the PPR (0.667) component.
The characteristics or composition of the domestic production exhibited also a high correlation
with the IPRI, being the strongest the correlation with IPR (0.737), followed by the IPRI (0.722),
the LP (0.691) and the PPR (0.558) component.
Of all the items, the entrepreneurial environment presented the stronger correlation with the IPRI
(0.855), followed by the LP (0.845), the IPR (0.845) and the PPR (0.725) component. This is a
very important finding, as entrepreneurship is the building block of innovation, investment,
production and economic growth.
Figure 20 shows that, on average, countries in the top quintile of IPRI scores (i.e. top 20%) show
a per capita income almost 21 times that of the countries in the bottom quintile (in 2015 that
disparity was almost 24 times). Statistics are based on the averages of IPRI-2016 scores and
corresponding data on average GDP per capita in USD constant terms (2005=100, source: World
Bank data) for the last available year.
4Correlation theory is aimed to show the possible relationship, association or dependence between two or more
observed variables. Besides it allows analyze the type of association (direct or indirect) and the level or degree of
intensity between them. 5The coefficient of determination (R2) is a key output of the regression analysis. It is interpreted as the proportion of
the variance in the dependent variable that is predictable from the independent variable. It ranges from 0 to 1.
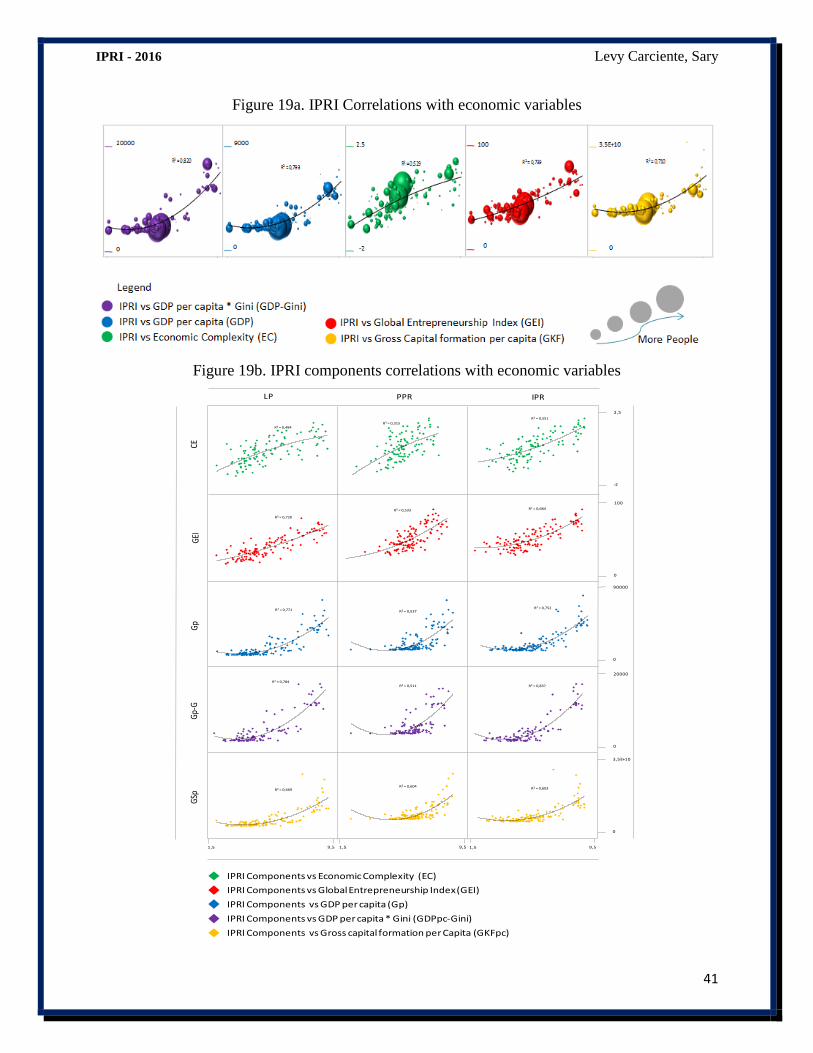
IPRI - 2016 Levy Carciente, Sary
41
Figure 19a. IPRI Correlations with economic variables
Figure 19b. IPRI components correlations with economic variables
IPRI Components vs Economic Complexity (EC)
IPRI Components vs Global Entrepreneurship Index (GEI)
IPRI Components vs GDP per capita (Gp)
IPRI Components vs GDP per capita * Gini (GDPpc-Gini)
IPRI Components vs Gross capital formation per Capita (GKFpc)
IPRPPRLP
GSp
Gp-
GG
pG
EICE
1,5 9,5 1,5 9,5 1,5 9,5
R² = 0,484R² = 0,315
R² = 0,551
R² = 0,720
R² = 0,533 R² = 0,684
R² = 0,771 R² = 0,537R² = 0,752
R² = 0,784R² = 0,511 R² = 0,837
R² = 0,669R² = 0,604
R² = 0,603
0
3,5E+10
0
20000
0
90000
0
100
-2
2,5

IPRI - 2016 Levy Carciente, Sary
42
Figure 20: Average per capita Income by IPRI Quintiles
These results insist in the significant and positive relationship between prosperity and a property
rights system, measured at an individual level. The statistical dispersion of the GDP distribution
in each country was considered in this analysis using the GINI coefficient, which improved the
correlations.
Figure 19a displays the relationship IPRI-economic outcomes showing countries with a
demographic perspective. This insists in the huge proportion of population (represented by the
radio of each circle) living in countries of middle level of IPRI and low to mid economic
outcomes.
VII.2. Human Capabilities
The focal element of the development equation is the people, and therefore their capabilities. In
this area, two (2) elements were evaluated:
Human Development Index (UNDP, http://hdr.undp.org/en/data) which has three
dimensions: long and healthy life, being knowledgeable and a decent standard of living.
Global Index on Freedom of Education, which includes a set of data on an international
scale, analyzing the protection and promotion of this fundamental human right, as well as
policies in support of freedom of education in the national context and in other countries. The
indicators will focus on: freedom of choice for children's education (constitutional and
legislative previsions, public schools, home schooling); public support for freedom of
education (family vouchers, direct support for schools, teachers' wages, costs of structures
and buildings etc.); NET (Net Enrolment Rate): the participation rate in a certain stage of
children's and young people's education; Rate of students' participation in comprehensive
schools (http://www.novaeterrae.eu/en/).
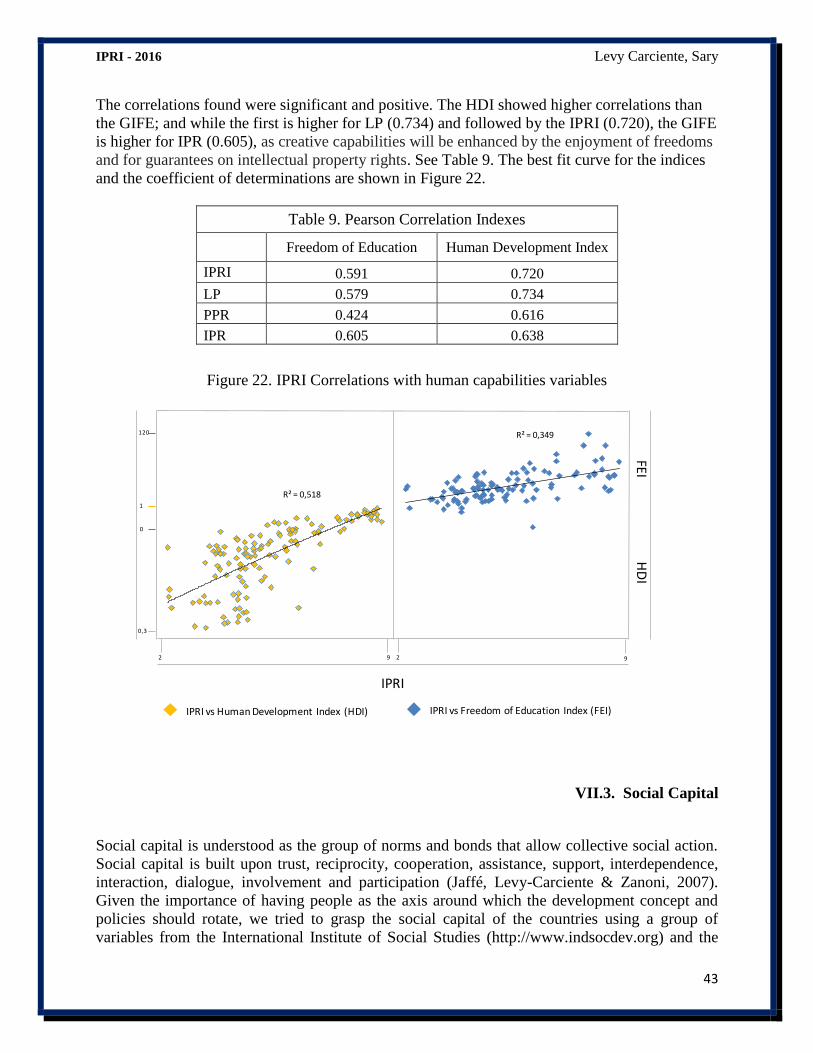
IPRI - 2016 Levy Carciente, Sary
43
The correlations found were significant and positive. The HDI showed higher correlations than
the GIFE; and while the first is higher for LP (0.734) and followed by the IPRI (0.720), the GIFE
is higher for IPR (0.605), as creative capabilities will be enhanced by the enjoyment of freedoms
and for guarantees on intellectual property rights. See Table 9. The best fit curve for the indices
and the coefficient of determinations are shown in Figure 22.
Table 9. Pearson Correlation Indexes
Freedom of Education Human Development Index
IPRI 0.591 0.720
LP 0.579 0.734
PPR 0.424 0.616
IPR 0.605 0.638
Figure 22. IPRI Correlations with human capabilities variables
VII.3. Social Capital
Social capital is understood as the group of norms and bonds that allow collective social action.
Social capital is built upon trust, reciprocity, cooperation, assistance, support, interdependence,
interaction, dialogue, involvement and participation (Jaffé, Levy-Carciente & Zanoni, 2007).
Given the importance of having people as the axis around which the development concept and
policies should rotate, we tried to grasp the social capital of the countries using a group of
variables from the International Institute of Social Studies (http://www.indsocdev.org) and the
IPRI vs Freedom of Education Index (FEI)IPRI vs Human Development Index (HDI)
1
120
0,3
0
IPRI
HD
IFE
I
2 9 2 9
R² = 0,518
R² = 0,349
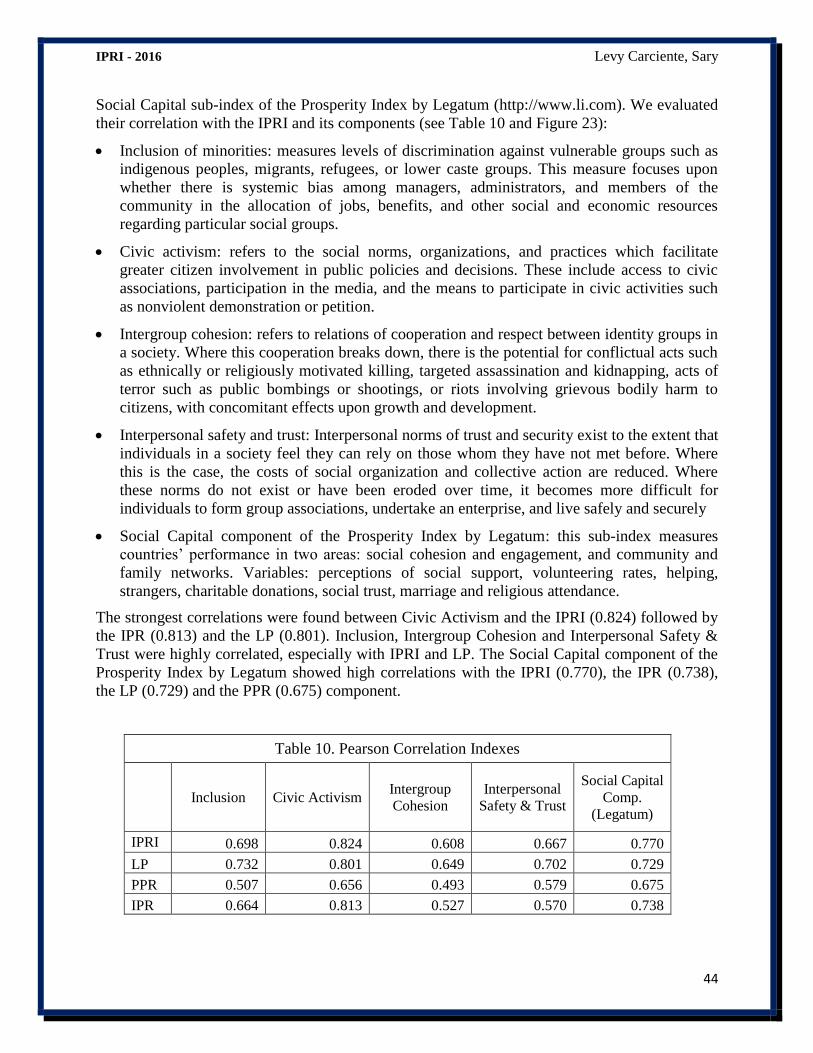
IPRI - 2016 Levy Carciente, Sary
44
Social Capital sub-index of the Prosperity Index by Legatum (http://www.li.com). We evaluated
their correlation with the IPRI and its components (see Table 10 and Figure 23):
Inclusion of minorities: measures levels of discrimination against vulnerable groups such as
indigenous peoples, migrants, refugees, or lower caste groups. This measure focuses upon
whether there is systemic bias among managers, administrators, and members of the
community in the allocation of jobs, benefits, and other social and economic resources
regarding particular social groups.
Civic activism: refers to the social norms, organizations, and practices which facilitate
greater citizen involvement in public policies and decisions. These include access to civic
associations, participation in the media, and the means to participate in civic activities such
as nonviolent demonstration or petition.
Intergroup cohesion: refers to relations of cooperation and respect between identity groups in
a society. Where this cooperation breaks down, there is the potential for conflictual acts such
as ethnically or religiously motivated killing, targeted assassination and kidnapping, acts of
terror such as public bombings or shootings, or riots involving grievous bodily harm to
citizens, with concomitant effects upon growth and development.
Interpersonal safety and trust: Interpersonal norms of trust and security exist to the extent that
individuals in a society feel they can rely on those whom they have not met before. Where
this is the case, the costs of social organization and collective action are reduced. Where
these norms do not exist or have been eroded over time, it becomes more difficult for
individuals to form group associations, undertake an enterprise, and live safely and securely
Social Capital component of the Prosperity Index by Legatum: this sub-index measures
countries’ performance in two areas: social cohesion and engagement, and community and
family networks. Variables: perceptions of social support, volunteering rates, helping,
strangers, charitable donations, social trust, marriage and religious attendance.
The strongest correlations were found between Civic Activism and the IPRI (0.824) followed by
the IPR (0.813) and the LP (0.801). Inclusion, Intergroup Cohesion and Interpersonal Safety &
Trust were highly correlated, especially with IPRI and LP. The Social Capital component of the
Prosperity Index by Legatum showed high correlations with the IPRI (0.770), the IPR (0.738),
the LP (0.729) and the PPR (0.675) component.
Table 10. Pearson Correlation Indexes
Inclusion Civic Activism Intergroup
Cohesion
Interpersonal
Safety & Trust
Social Capital
Comp.
(Legatum)
IPRI 0.698 0.824 0.608 0.667 0.770
LP 0.732 0.801 0.649 0.702 0.729
PPR 0.507 0.656 0.493 0.579 0.675
IPR 0.664 0.813 0.527 0.570 0.738
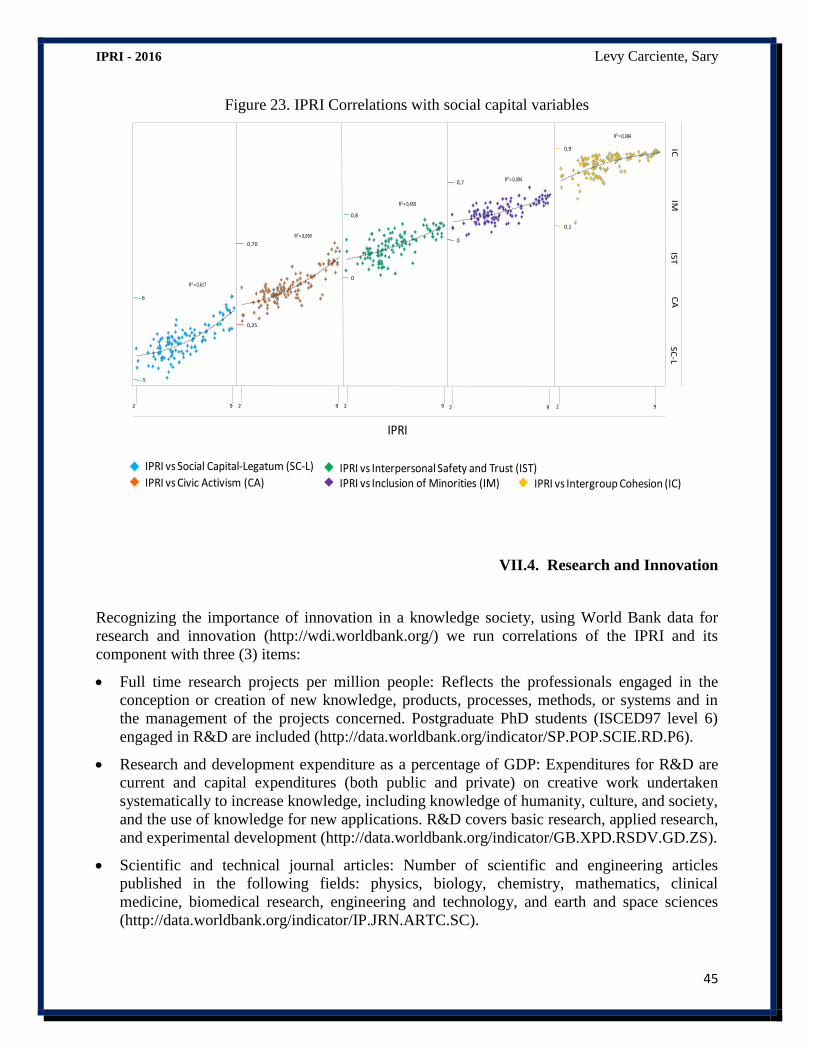
IPRI - 2016 Levy Carciente, Sary
45
Figure 23. IPRI Correlations with social capital variables
VII.4. Research and Innovation
Recognizing the importance of innovation in a knowledge society, using World Bank data for
research and innovation (http://wdi.worldbank.org/) we run correlations of the IPRI and its
component with three (3) items:
Full time research projects per million people: Reflects the professionals engaged in the
conception or creation of new knowledge, products, processes, methods, or systems and in
the management of the projects concerned. Postgraduate PhD students (ISCED97 level 6)
engaged in R&D are included (http://data.worldbank.org/indicator/SP.POP.SCIE.RD.P6).
Research and development expenditure as a percentage of GDP: Expenditures for R&D are
current and capital expenditures (both public and private) on creative work undertaken
systematically to increase knowledge, including knowledge of humanity, culture, and society,
and the use of knowledge for new applications. R&D covers basic research, applied research,
and experimental development (http://data.worldbank.org/indicator/GB.XPD.RSDV.GD.ZS).
Scientific and technical journal articles: Number of scientific and engineering articles
published in the following fields: physics, biology, chemistry, mathematics, clinical
medicine, biomedical research, engineering and technology, and earth and space sciences
(http://data.worldbank.org/indicator/IP.JRN.ARTC.SC).
0,7
0,9
0
0,8
0,1
0,70
6
0
0,35
-5
IPRI
SC
-LC
AIS
TIM
IC
2 9 2 9 2 9 2 9 2 9
R² = 0,617
R² = 0,699
R² = 0,450
R² = 0,494
R² = 0,384
IPRI vs Social Capital-Legatum (SC-L)
IPRI vs Civic Activism (CA)IPRI vs Interpersonal Safety and Trust (IST)IPRI vs Inclusion of Minorities (IM) IPRI vs Intergroup Cohesion (IC)
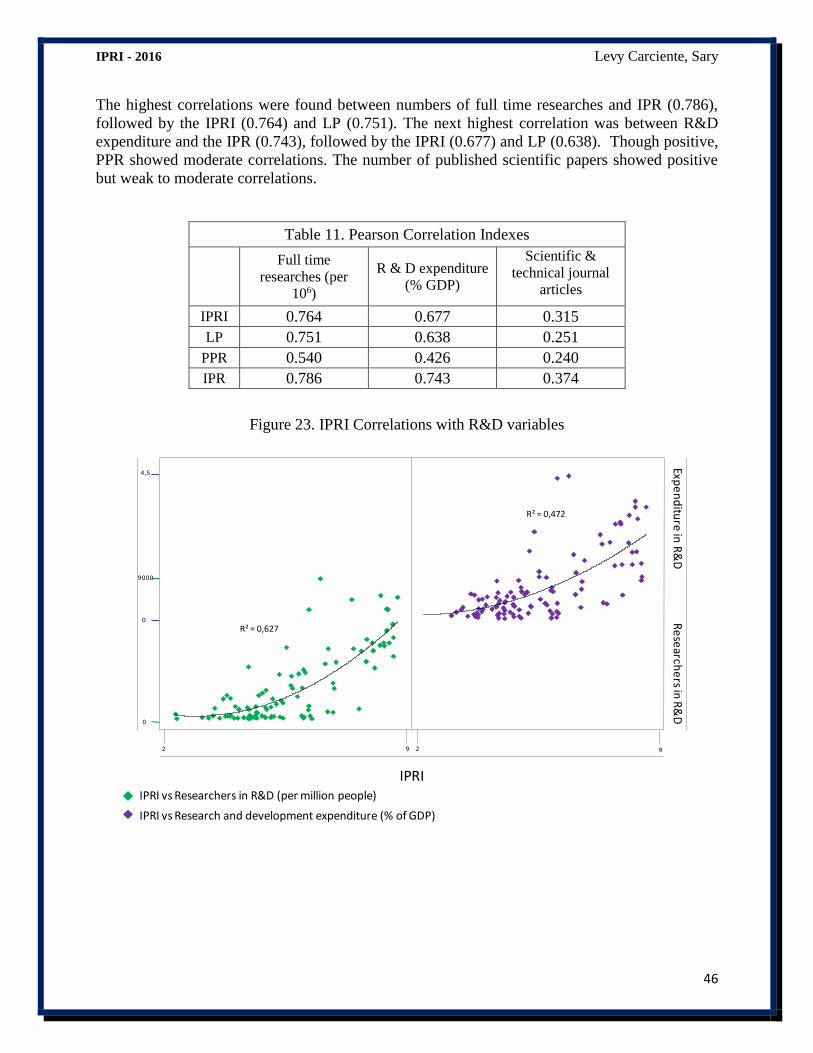
IPRI - 2016 Levy Carciente, Sary
46
The highest correlations were found between numbers of full time researches and IPR (0.786),
followed by the IPRI (0.764) and LP (0.751). The next highest correlation was between R&D
expenditure and the IPR (0.743), followed by the IPRI (0.677) and LP (0.638). Though positive,
PPR showed moderate correlations. The number of published scientific papers showed positive
but weak to moderate correlations.
Table 11. Pearson Correlation Indexes
Full time
researches (per
106)
R & D expenditure
(% GDP)
Scientific &
technical journal
articles
IPRI 0.764 0.677 0.315
LP 0.751 0.638 0.251
PPR 0.540 0.426 0.240
IPR 0.786 0.743 0.374
Figure 23. IPRI Correlations with R&D variables
9000
4,5
0
0
IPRI
Expe
nd
iture
in R
&D
Re
search
ers in
R&
D
2 9 2 9
R² = 0,472
R² = 0,627
IPRI vs Researchers in R&D (per million people)
IPRI vs Research and development expenditure (% of GDP)
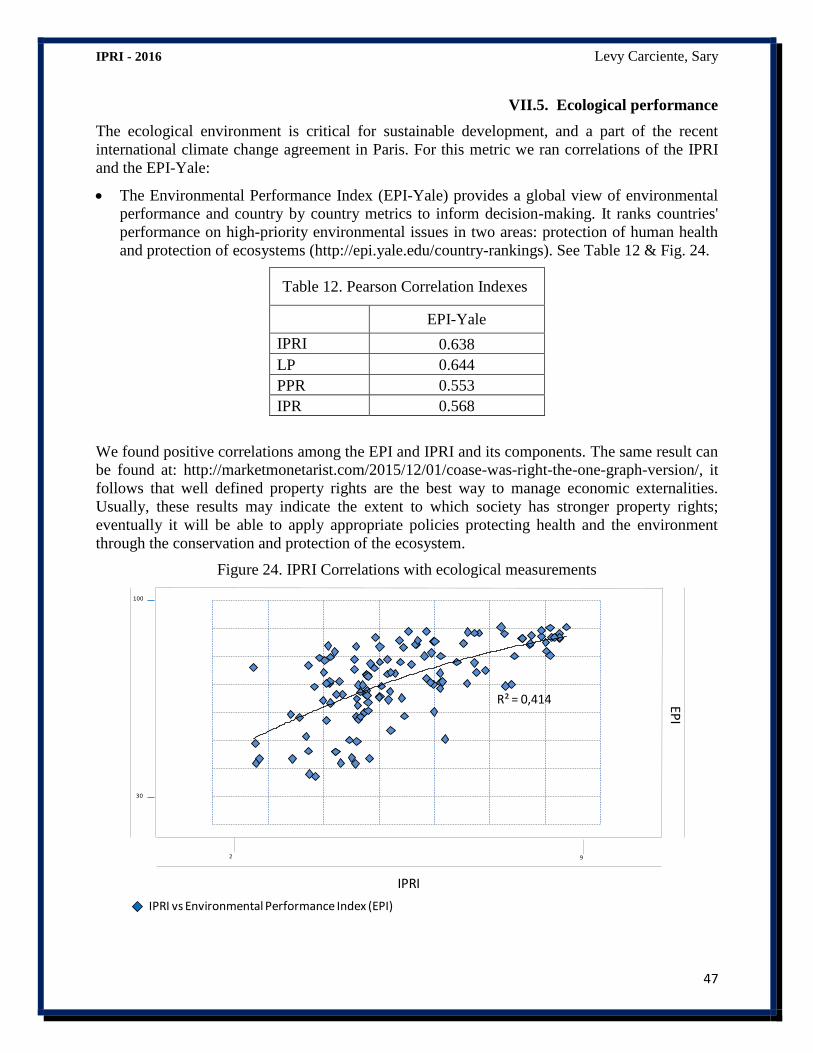
IPRI - 2016 Levy Carciente, Sary
47
VII.5. Ecological performance
The ecological environment is critical for sustainable development, and a part of the recent
international climate change agreement in Paris. For this metric we ran correlations of the IPRI
and the EPI-Yale:
The Environmental Performance Index (EPI-Yale) provides a global view of environmental
performance and country by country metrics to inform decision-making. It ranks countries'
performance on high-priority environmental issues in two areas: protection of human health
and protection of ecosystems (http://epi.yale.edu/country-rankings). See Table 12 & Fig. 24.
Table 12. Pearson Correlation Indexes
EPI-Yale
IPRI 0.638
LP 0.644
PPR 0.553
IPR 0.568
We found positive correlations among the EPI and IPRI and its components. The same result can
be found at: http://marketmonetarist.com/2015/12/01/coase-was-right-the-one-graph-version/, it
follows that well defined property rights are the best way to manage economic externalities.
Usually, these results may indicate the extent to which society has stronger property rights;
eventually it will be able to apply appropriate policies protecting health and the environment
through the conservation and protection of the ecosystem.
Figure 24. IPRI Correlations with ecological measurements
100
30
IPRI
EPI
2 9
R² = 0,414
IPRI vs Environmental Performance Index (EPI)
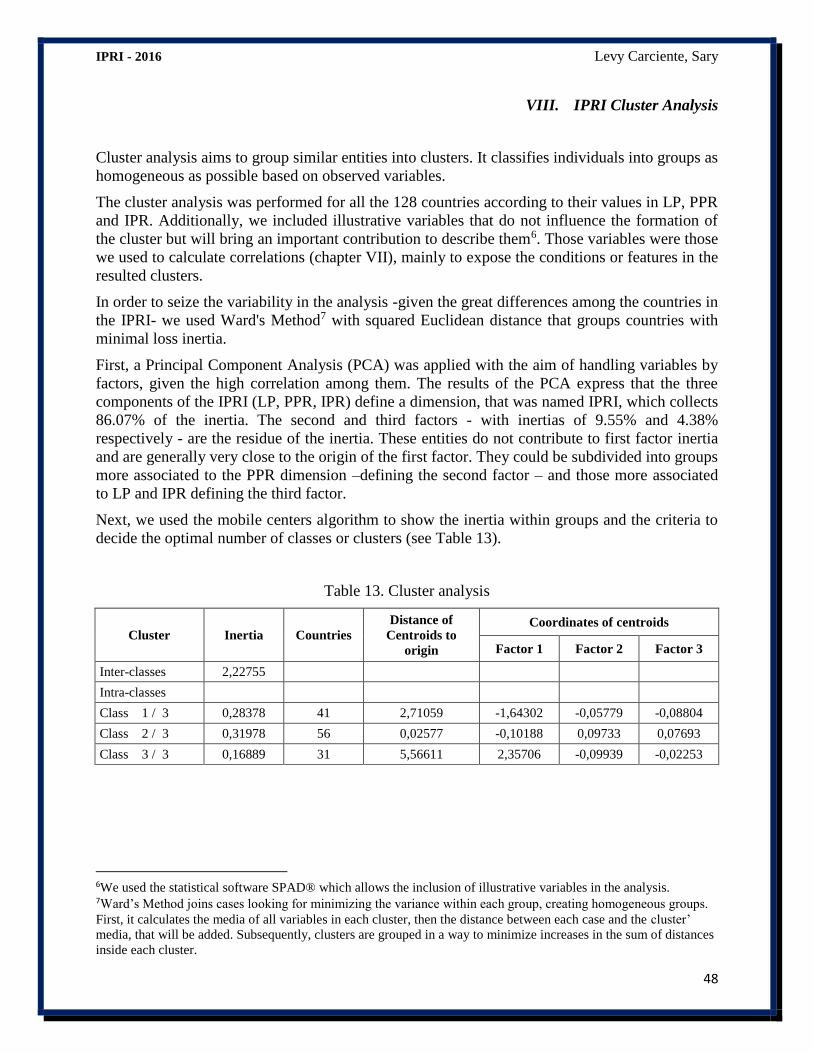
IPRI - 2016 Levy Carciente, Sary
48
VIII. IPRI Cluster Analysis
Cluster analysis aims to group similar entities into clusters. It classifies individuals into groups as
homogeneous as possible based on observed variables.
The cluster analysis was performed for all the 128 countries according to their values in LP, PPR
and IPR. Additionally, we included illustrative variables that do not influence the formation of
the cluster but will bring an important contribution to describe them6. Those variables were those
we used to calculate correlations (chapter VII), mainly to expose the conditions or features in the
resulted clusters.
In order to seize the variability in the analysis -given the great differences among the countries in
the IPRI- we used Ward's Method7 with squared Euclidean distance that groups countries with
minimal loss inertia.
First, a Principal Component Analysis (PCA) was applied with the aim of handling variables by
factors, given the high correlation among them. The results of the PCA express that the three
components of the IPRI (LP, PPR, IPR) define a dimension, that was named IPRI, which collects
86.07% of the inertia. The second and third factors - with inertias of 9.55% and 4.38%
respectively - are the residue of the inertia. These entities do not contribute to first factor inertia
and are generally very close to the origin of the first factor. They could be subdivided into groups
more associated to the PPR dimension –defining the second factor – and those more associated
to LP and IPR defining the third factor.
Next, we used the mobile centers algorithm to show the inertia within groups and the criteria to
decide the optimal number of classes or clusters (see Table 13).
Table 13. Cluster analysis
Cluster Inertia Countries
Distance of
Centroids to
origin
Coordinates of centroids
Factor 1 Factor 2 Factor 3
Inter-classes 2,22755
Intra-classes
Class 1 / 3 0,28378 41 2,71059 -1,64302 -0,05779 -0,08804
Class 2 / 3 0,31978 56 0,02577 -0,10188 0,09733 0,07693
Class 3 / 3 0,16889 31 5,56611 2,35706 -0,09939 -0,02253
6We used the statistical software SPAD® which allows the inclusion of illustrative variables in the analysis. 7Ward’s Method joins cases looking for minimizing the variance within each group, creating homogeneous groups.
First, it calculates the media of all variables in each cluster, then the distance between each case and the cluster’
media, that will be added. Subsequently, clusters are grouped in a way to minimize increases in the sum of distances
inside each cluster.
IPRI - 2016 Levy Carciente, Sary
49
The analysis showed that the three clusters were enough to explain the grouping of countries,
more specifically, where the observed inertia within each group does not exceed the inertia
among groups. In this sense the clusters are formed as shown in Table 14 and illustrated in
Figure 25.
Although the first factor contains 86.07% of inertia, which is enough to illustrate the formation
of the clusters, Fig. 35 illustrates Factors 1 and 2 as well as the three clusters centroids (yellow).
Cluster 1, with countries located in the negative coordinates of the first factor (red), groups
individuals associated with low values of the LP, IPR and PPR. Cluster 2 includes countries
(green) located very close to the origin, showing average values of the LP, IPR, and PPR. Cluster
3 contains countries (blue) located in the positive coordinates of the first factor and its members
are linked to high values of the LP, IPR and PPR. The second factor consists mostly of countries
in Cluster 2, including those whose scores are very close to the average, including both
neighboring countries between Cluster 2 and Cluster 1, and those neighboring Cluster 2 and
Cluster 3. Cluster 1 and Cluster 3 are complete opposites and their individuals are not directly
associated with each other.
Besides the clusters, Figure 25 also shows the contribution of each country explaining the inertia
gathered by the factors, hence the bigger the dot size representing the country, the higher its
contribution. Very close countries show how they are similar and how they differ as the distance
increases between them.
In the central circle are those countries that have no statistically significant contribution to the
definition of the factors. As already mentioned, they are close to the average and are mostly
members of Cluster 2. In addition, arrows represent each of the three dimensions of the IPRI,
their definite direction indicates the direct relationship with the individuals, i.e., as countries are
in the same direction of the vector, countries tend to have a higher relationship with this
dimension; and as a country direction diverts from the vector, the relationship between the
country decreases to point of being contrary to it. This can be exemplified with the case of Haiti,
which is totally opposite to the direction of vector PPR, which coincides with its low score in this
sub-index, being the bottom country of the sample.
Subsequently, clusters composed using income, population, participation in economic and
regional integration agreements and regional and development criteria are shown in Fig. 26a-
26d, where font size represent the frequency of the groupings in the cluster.
The analysis of each cluster can describe the internal characteristics of the countries within it. In
this regard Table 15 exhibits the features that are statistically significant8 in each group.
Additional statistics are shown in Table 16 and Appendix IV.
8To be statistically significant the value must be less or equal -1.96 or greater or equal 1.96
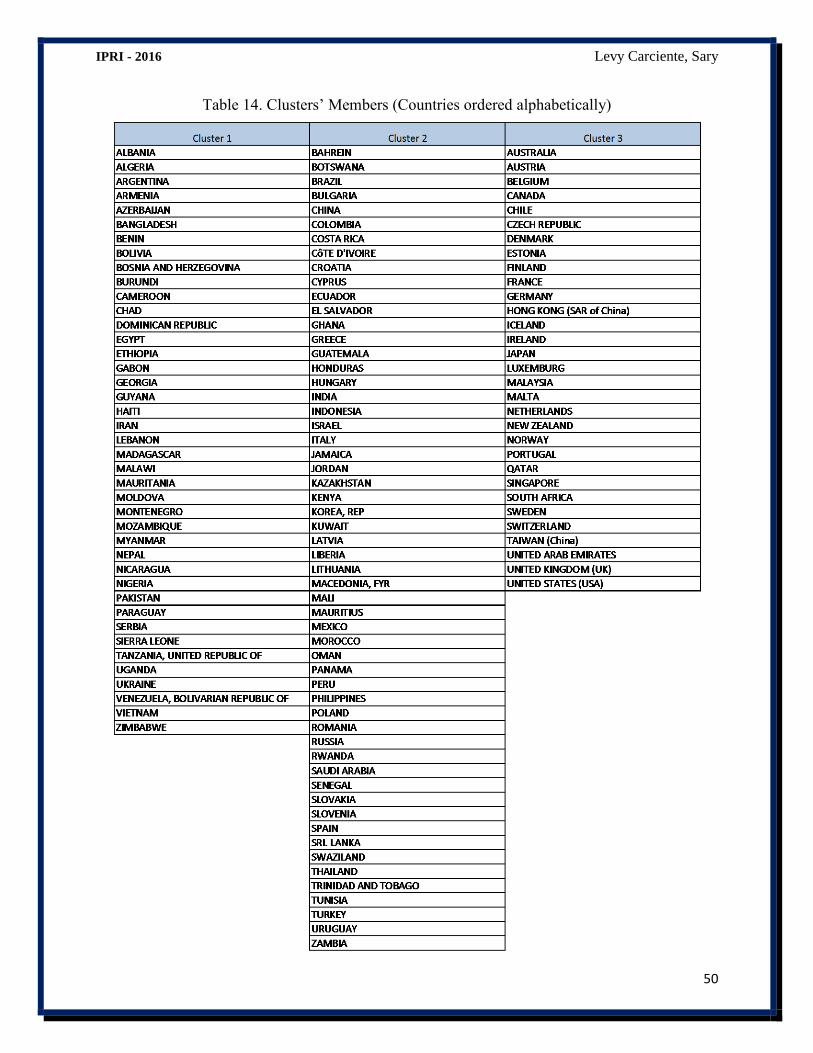
IPRI - 2016 Levy Carciente, Sary
50
Table 14. Clusters’ Members (Countries ordered alphabetically)
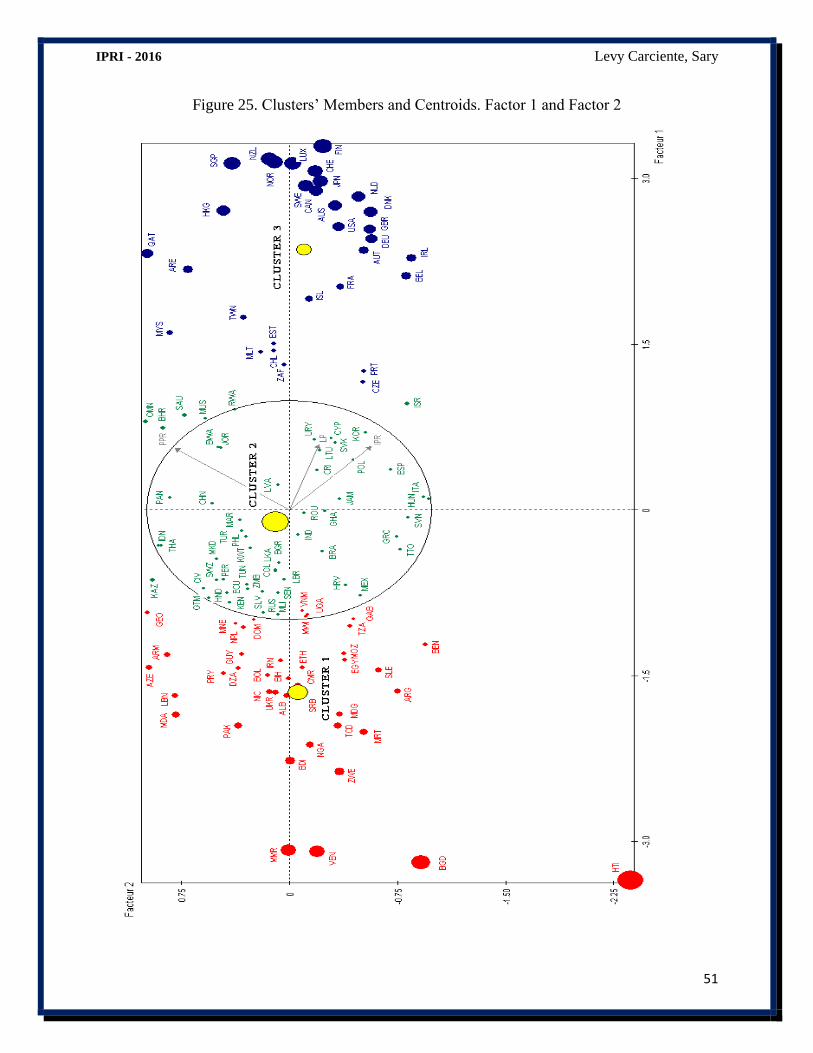
IPRI - 2016 Levy Carciente, Sary
51
Figure 25. Clusters’ Members and Centroids. Factor 1 and Factor 2

IPRI - 2016 Levy Carciente, Sary
52
Figure 26a. Clusters composition by Income classification
Figure 26b. Clusters composition by Regional and Development criteria
Figure 26c. Clusters composition and Population weight (thousands)
Cluster 1 Cluster 2 Cluster 3
Advancedeconomies
Emerging and Developing Asia
Latin America and the Caribbean
Middle East, North Africa, and Pakistan
Sub-Saharan Africa
Advancedeconomies
Latin America and the Caribbean
Emerging and Developing Europe
Middle East, North Africa, and Pakistan
Sub-SaharanAfricaEmerging and
Developing Asia
Commonwealth of Independent States
Sub-SaharanAfrica
Middle East, North Africa, and Pakistan
Latin America and the Caribbean
Commonwealth of Independent States
Emerging and Developing Asia
Emerging and Developing Europe
Cluster 1 Cluster 2 Cluster 3
1.474.552972.262
4.382.016
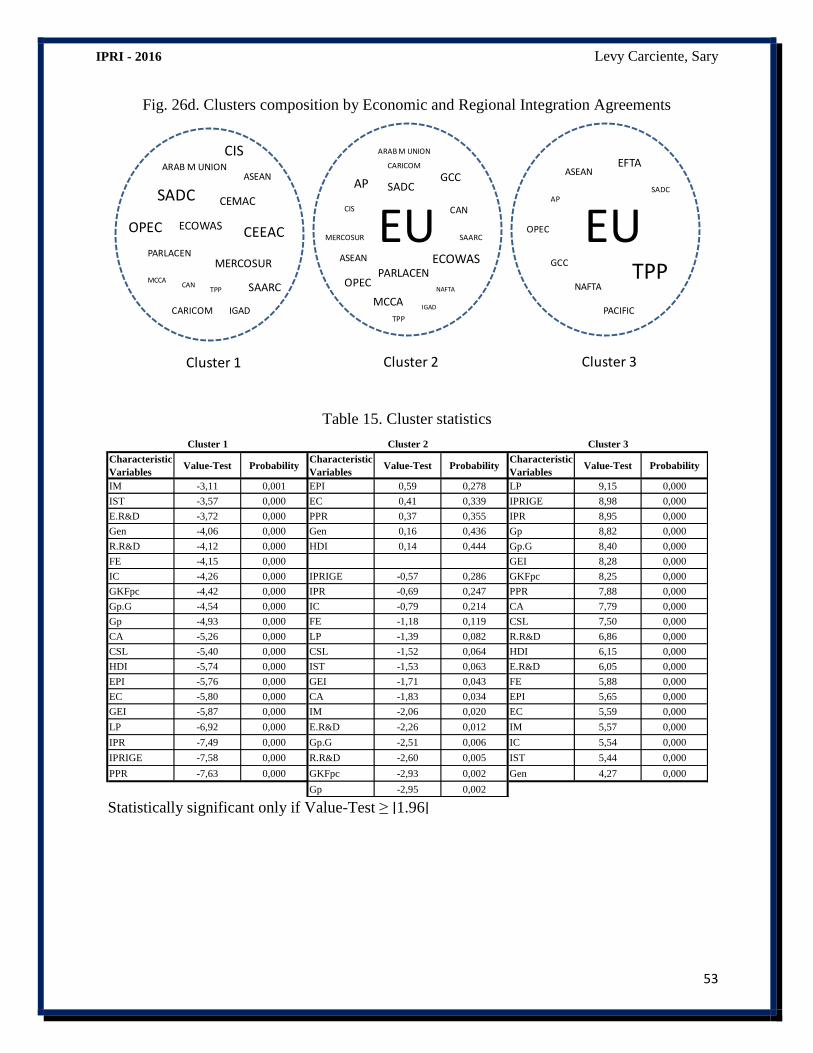
IPRI - 2016 Levy Carciente, Sary
53
Fig. 26d. Clusters composition by Economic and Regional Integration Agreements
Table 15. Cluster statistics
Statistically significant only if Value-Test ≥ ∣1.96∣
Cluster 1 Cluster 2 Cluster 3
EUNAFTA
ASEAN
GCC
EFTA
EU
PACIFIC
SADCAP
AP SADCGCC
ASEAN
PARLACEN
MCCA
ARAB M UNION
CAN
CARICOM
CIS
MERCOSUR SAARC
IGAD
NAFTA
ECOWAS
ECOWAS
SADC CEMAC
ARAB M UNION
CIS
MERCOSURPARLACEN
SAARC
ASEAN
CARICOM IGAD
MCCACAN
CEEACOPEC
TPP
TPP
OPEC
TPP
OPEC
Characteristic
VariablesValue-Test Probability
Characteristic
VariablesValue-Test Probability
Characteristic
VariablesValue-Test Probability
IM -3,11 0,001 EPI 0,59 0,278 LP 9,15 0,000
IST -3,57 0,000 EC 0,41 0,339 IPRIGE 8,98 0,000
E.R&D -3,72 0,000 PPR 0,37 0,355 IPR 8,95 0,000
Gen -4,06 0,000 Gen 0,16 0,436 Gp 8,82 0,000
R.R&D -4,12 0,000 HDI 0,14 0,444 Gp.G 8,40 0,000
FE -4,15 0,000 GEI 8,28 0,000
IC -4,26 0,000 IPRIGE -0,57 0,286 GKFpc 8,25 0,000
GKFpc -4,42 0,000 IPR -0,69 0,247 PPR 7,88 0,000
Gp.G -4,54 0,000 IC -0,79 0,214 CA 7,79 0,000
Gp -4,93 0,000 FE -1,18 0,119 CSL 7,50 0,000
CA -5,26 0,000 LP -1,39 0,082 R.R&D 6,86 0,000
CSL -5,40 0,000 CSL -1,52 0,064 HDI 6,15 0,000
HDI -5,74 0,000 IST -1,53 0,063 E.R&D 6,05 0,000
EPI -5,76 0,000 GEI -1,71 0,043 FE 5,88 0,000
EC -5,80 0,000 CA -1,83 0,034 EPI 5,65 0,000
GEI -5,87 0,000 IM -2,06 0,020 EC 5,59 0,000
LP -6,92 0,000 E.R&D -2,26 0,012 IM 5,57 0,000
IPR -7,49 0,000 Gp.G -2,51 0,006 IC 5,54 0,000
IPRIGE -7,58 0,000 R.R&D -2,60 0,005 IST 5,44 0,000
PPR -7,63 0,000 GKFpc -2,93 0,002 Gen 4,27 0,000
Gp -2,95 0,002
Cluster 1 Cluster 2 Cluster 3
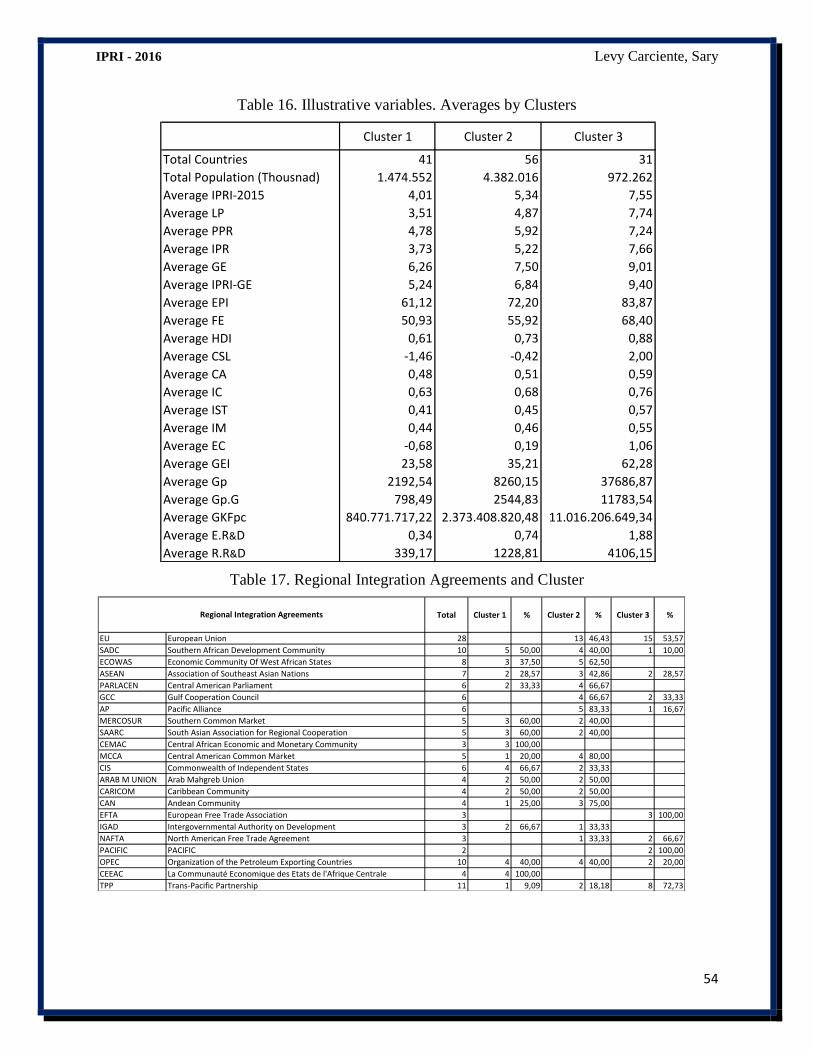
IPRI - 2016 Levy Carciente, Sary
54
Table 16. Illustrative variables. Averages by Clusters
Table 17. Regional Integration Agreements and Cluster
Cluster 1 Cluster 2 Cluster 3
Total Countries 41 56 31
Total Population (Thousnad) 1.474.552 4.382.016 972.262
Average IPRI-2015 4,01 5,34 7,55
Average LP 3,51 4,87 7,74
Average PPR 4,78 5,92 7,24
Average IPR 3,73 5,22 7,66
Average GE 6,26 7,50 9,01
Average IPRI-GE 5,24 6,84 9,40
Average EPI 61,12 72,20 83,87
Average FE 50,93 55,92 68,40
Average HDI 0,61 0,73 0,88
Average CSL -1,46 -0,42 2,00
Average CA 0,48 0,51 0,59
Average IC 0,63 0,68 0,76
Average IST 0,41 0,45 0,57
Average IM 0,44 0,46 0,55
Average EC -0,68 0,19 1,06
Average GEI 23,58 35,21 62,28
Average Gp 2192,54 8260,15 37686,87
Average Gp.G 798,49 2544,83 11783,54
Average GKFpc 840.771.717,22 2.373.408.820,48 11.016.206.649,34
Average E.R&D 0,34 0,74 1,88
Average R.R&D 339,17 1228,81 4106,15
Total Cluster 1 % Cluster 2 % Cluster 3 %
EU European Union 28 13 46,43 15 53,57
SADC Southern African Development Community 10 5 50,00 4 40,00 1 10,00
ECOWAS Economic Community Of West African States 8 3 37,50 5 62,50
ASEAN Association of Southeast Asian Nations 7 2 28,57 3 42,86 2 28,57
PARLACEN Central American Parliament 6 2 33,33 4 66,67
GCC Gulf Cooperation Council 6 4 66,67 2 33,33
AP Pacific Alliance 6 5 83,33 1 16,67
MERCOSUR Southern Common Market 5 3 60,00 2 40,00
SAARC South Asian Association for Regional Cooperation 5 3 60,00 2 40,00
CEMAC Central African Economic and Monetary Community 3 3 100,00
MCCA Central American Common Market 5 1 20,00 4 80,00
CIS Commonwealth of Independent States 6 4 66,67 2 33,33
ARAB M UNION Arab Mahgreb Union 4 2 50,00 2 50,00
CARICOM Caribbean Community 4 2 50,00 2 50,00
CAN Andean Community 4 1 25,00 3 75,00
EFTA European Free Trade Association 3 3 100,00
IGAD Intergovernmental Authority on Development 3 2 66,67 1 33,33
NAFTA North American Free Trade Agreement 3 1 33,33 2 66,67
PACIFIC PACIFIC 2 2 100,00
OPEC Organization of the Petroleum Exporting Countries 10 4 40,00 4 40,00 2 20,00
CEEAC La Communauté Economique des Etats de l'Afrique Centrale 4 4 100,00
TPP Trans-Pacific Partnership 11 1 9,09 2 18,18 8 72,73
Regional Integration Agreements
IPRI - 2016 Levy Carciente, Sary
55
VIII.1. Cluster Description
Cluster 1
Cluster 1 is composed of 41 countries with a population of more than 1.4 billion people. The
country closest to its centroid is Ethiopia, followed by Nicaragua, Bolivia, Iran and Cameroon.
Haiti is by far the most remote country of the cluster, followed by Bangladesh, Georgia,
Myanmar and Venezuela.
A close look at Cluster 1 countries’ coordinates reveals that Vietnam, Malawi and Uganda are
the closest to the Cluster 2 Centroid. Looking simultaneously to Cluster 1 and Cluster 2, the
closest countries are Dominican Republic (Cluster 1) and Russia (Cluster 2), which also means
similarity in conditions (see Fig. 25).
Countries in Cluster 1 are statistically significant for LP, PPR and IPR components with low
scores in each category. The same is true for the Gender component and the IPRI-GE. Cluster 1
countries also show low levels in all the dimensions we analyzed, that is, they show poor
performances in Economic outcomes, Human Capabilities, Social Capital, Research and
Innovation, and Ecological Performance. This is the result of lack of policies or inappropriate
ones to improve key elements as entrepreneurship, opportunities and freedom of education,
health and environment, social capital, or research and development.
Using the regional and development criteria of the IMF and the Income criteria of the World
Bank, the Sub-Saharan Africa group and the Low Income group are highly represented in this
cluster.
The Southern African Development Community (5/10 members) is the most common economic
and regional integration agreement in this cluster; followed by Commonwealth of Independent
States (4/6 members); Organization of the Petroleum Exporting (4/10 members) and the
Economic Community of Central African States (all members).
Cluster 2
Cluster 2 is composed of 56 countries with a population of more than 4.38 billion people. The
country closest to its centroid is Romania, followed by Morocco, Ghana, Bulgaria and
Philippines. Israel is the farthest country from the centroid, followed by Oman, Uruguay,
Mauritius and Bahrein. It is important to note that the most populous countries in the world,
China and India, are included in this cluster. India is very close to the centroids’ cluster
(d=0.167639) and China is mid-distance (d=0.342222). While Figure 25 illustrates that Russia,
Mali, El Salvador and Senegal are close to the centroid of Cluster 1; the countries closest to
Cluster 3 are Mauritius, Saudi Arabia, Rwanda and Israel; the last one is the closest to Czech
Republic that belongs to Cluster 3 and is placed in the direction of vectors LP and IPR.
As Cluster 2 is very near to the origin of the factors axes (the distance of the first factor to the
centroid is -0.10188), its results are close to the averages of the different variables used in the
analysis. This gives rise to non-significant results for most of the variables, while some turn out
to be significant in moderately low values. That is the case for Expenditure in R & D, numbers of
researchers, inclusion of minorities, GDP per capita, GDP per capita adjusted by GINI and
Gross Capital Formation per capita.
Using the regional and development criteria of the IMF, Latin America and the Caribbean are
highly represented in this cluster; whereas by the income criteria of the World Bank, the Upper
IPRI - 2016 Levy Carciente, Sary
56
Middle Income countries exhibit the highest frequency in the cluster. Following the perspective
that focuses on economic and regional integration agreements, we can see that the European
Union has the highest frequency in Cluster 2 (with 13/28 members). At a lesser frequency we
find countries of the Pacific Alliance (5/6) and the Economic Community of West African States
(with 5/8 members).
Cluster 3
Cluster 3 is composed of 31 countries showing a population of more than 972 million people.
The country closest to its centroid is Austria, followed by Australia, Germany, United Kingdom
and France. The farthest country of the group is Czech Republic, followed by South Africa,
Malaysia, Portugal and Qatar. Czech Republic and Portugal are the closest countries to Cluster 2.
It’s worth noting that in 2015 Czech Republic belonged to Cluster 2, very close to Portugal
which already was in Cluster 3. In this edition, Czech Republic belongs to Cluster 3. A third
country very close to Portugal and Czech Republic is Israel, but still belongs to Cluster 2. While
Israel improved in LP and IPR it receded a little in PPR.
Compared to Cluster 1, countries belonging to Cluster 3 exhibit the opposite results: all the
variables are significant, but with positive and high values, showing good performances at
Economic outcomes, Human Capabilities, Social Capital, Research and Innovation, and
Ecological Performance, with positive results in human development, liberties and opportunities
for their citizens.
Using the regional and development criteria of the IMF, the Advanced Economies group is
highly represented in this cluster. By the Income criteria of the World Bank, the OECD-High
Income group shows the highest frequency in the cluster. Looking at economic and regional
integration agreements, the European Union is highly represented in Cluster 3 (15/28 members),
particularly those that belong to the OECD (only Malta is a non-OECD EU member), followed
by the Trans-Pacific Partnership (with 8/11 members).
When speaking of economic and regional integration agreements, the following should be noted:
Of the 128 countries included in the IPRI-2016 selection, there are 16 that do not belong to any
of the agreements chosen, 27 countries that are members of two of them, and there are 2
countries that are members of three integration agreements ( Mexico and Peru). Also, there are
some agreements with many members (EU has 28 members) and others with just a few (Pacific
encompasses only Australia and New Zealand).
The Southern African Development Community, Association of Southeast Asian Nations,
Organization of the Petroleum Exporting Countries and Trans-Pacific Partnership have members
in the three clusters. The Economic Community of Central African States and the Central
African Economic and Monetary Community only have members in Cluster 1. The European
Free Trade Association and Pacific only have members in Cluster 3. The rest of the agreements
have members in two clusters in different proportions.
The data suggests that most of the chosen integration agreements demonstrate some level of
heterogeneity in terms of the strength of the property rights systems among their members. In
presence of homogeneity it would be easier for an integration agreement to promote common
policies to enhance the strength of property rights. Heterogeneity could also be seen as an
advantage, as the policies could be targeted to specific members of the agreement.
IPRI - 2016 Levy Carciente, Sary
57
On the other hand, the integration agreements showing members in just one cluster reveal
homogeneity amongst their countries’ property rights systems. Even those agreements
participating in two clusters show members in cluster boundaries and could be seen as a possible
transition from one cluster to the other.
In conclusion, in the cluster analysis we find that:
Each cluster represents more than a grouping by variables directly associated with property
rights; they are groups with common characteristics within them and with different features
among clusters, which confirms the consistency of the IPRI, and the relevance of property
rights systems influencing societies.
Cluster 1 and Cluster 3 are two extreme poles in terms of the performance of their
economies, human capabilities, social capital, research and innovation, ecological
performance, their institutional stability, as well as their IPRI scores.
Cluster 2 statistical values reflected intermediate positions and, depending on the decisions
taken in the present and near future of each country, will be inclined to one of the two polar
classes. Those countries that whose position remains very close to Cluster 1 should reread
their policies regarding property rights, but, as has been shown, also in other dimensions to
improve their performance and the well-being of their citizens.
Countries in Cluster 1 should make particular efforts to strengthen their legal and political
environment to protect physical and intellectual properties, which are still weak, in order to
improve the quality of life in their societies.
Countries in the boundaries between two clusters have to make special efforts to bridge the
gap, which will place them in a higher level.
Specific analyses of countries and of groups of them related to their cluster are a rich open
vein for future investigations.
IPRI - 2016 Levy Carciente, Sary
58
IX. Final Remarks
The 10th edition of the International Property Rights Index – IPRI 2016 - shows consistency with
previous ones, arguing that the index is properly structured. In this sense, its follow-up in years
ahead is a key to monitoring the performance of property rights systems and their relationships to
societies’ prosperity; globally, regionally and by country.
Results suggest that countries with high IPRI scores and their components also show high
income and high development levels, pointing to a positive relationship between a property
rights regime and wellbeing.
In this edition we included a range of dimensions to be examined in conjunction with property
rights. Our results show that the IPRI is strongly associated with economic and political
opportunities within countries, as well as their social cohesion, human capabilities, innovative
research and the ecosystem.
Each of these dimensions was evaluated using different items: production (per capita level and
composition), investment, entrepreneurship ecosystem, human development, freedom of
education, minorities’ inclusion, civic activism, intergroup cohesion, interpersonal safety and
trust, social capital, number of researchers, number of papers, expenses in R&D and
environmental performance. All the items showed a strongly positive association with the IPRI
and its components.
This way, IPRI results can be used as guidelines for policy makers in different countries - as in
multilateral or integration agreements to which they belong - to enhance their policies aimed at
fostering development, defined as a multidimensional and synergic term.
IPRI-2016 includes 128 countries with an average score of 5.45, showing an increase of 0.1
points compared to 2015. This edition includes four countries (Benin, Ecuador, Bosnia &
Herzegovina and Liberia) that were not in the IPRI-2015, although five countries had to be
excluded (Puerto Rico, Angola, Burkina Faso, Libya and Yemen) due to the absence of enough
information. We urge these and other countries not included in the index to increase their efforts
in the availability of information so that in future editions they may be included.
Countries’ performances are quite dissimilar: we find countries with very high scores while
others have very low ones. Once a country grasps a top position it mostly keeps it. However, as
some countries improve, other may show a setback. We are glad to highlight the improvement of
Cote d’Ivore (Ivory Coast). Even though its IPRI score is still low; it showed an increase of
0.509 points, an exceptionally positive change.
IPRI-2016 keeps the calculations of IPRI-GE and IPRI-POP given the importance of showing
the impact of gender equality and countries’ demographic weight in analyzing property rights
systems.
IPRI-GE was calculated for a total of 124 countries and the 2016 average score is 6.93/12 which
results in an increase of 0.17 points compared to 2015.
IPRI - 2016 Levy Carciente, Sary
59
IPRI-POP was calculated for the 128 countries, giving rise to a score of 5.28. This is due to the
fact that 63% of world population lives in 44 countries with an IPRI between 4.5 and 5.4,
insisting on the importance of fostering property rights systems in densely populated countries.
IPRI-2016 also included a cluster analysis, in order to gather countries into groups by their
homogeneity. Therefore, the 128 countries were classified according to their values in the IPRI
and its three components in three clusters. The analysis of clusters’ centroids and the countries
by the boundaries between groups, yields important information about their characteristics and
challenges. Cluster analysis also confirmed the consistency of the IPRI, since the assembled
countries exhibited a high degree of homogeneity, showing the relevance of property rights
systems shaping societies.
The regional and economic integration agreements included in the analysis showed heterogeneity
concerning to property rights systems, as their country members belongs to more than one
cluster. This presents special difficulties and challenges when coordinating or overtaking
multilateral policies on the issue of property rights.
IPRI - 2016 Levy Carciente, Sary
60
X. References
Acemoglu, D., S. Johnson, and J. A. Robinson, 2001. “The colonial origins of comparative
development: an empirical investigation” American Economic Review. Vol.91(5):1369-1401.
Acemoglu, D., S. Johnson, and J. A. Robinson, 2002. “Reversal of Fortune: Geography and
Institutions in the Making of the Modern World Income Distribution” Quarterly Journal of
Economics Vol.117(4):1231-1294.
Acemoglu, D., S. Johnson, and J. A. Robinson, 2005. “Institutions as a fundamental cause of
long run growth” in: Aghion, P. & Durlauf, S. (eds.), Handbook of Economic Growth, Volume
1A, Chapter 6, Elsevier.
Alchian, A. A. and H. Demsetz, 1973. “The Property Right Paradigm” The Journal of Economic
History, Vol. 33 (1-Mar): 16-27
Angeles, L. 2010. “Institutions and economic development: Panel Evidence” Working Paper #
2010-03, Business School-Economics, University of Glasgow.
Barzel, Y. 1997. Economic Analysis of Property Rights, Cambridge: Cambridge University
Press, 2nd Ed.
Buchanan, J.M., 1993. Property as a Guarantor of Liberty. Aldershot, Hants, England: E. Elgar.
David, P. and D. Foray, 2003. “Economic Fundamentals of the Knowledge Society” Policy
Futures in Education, Vol. 1(1):20-49
De Soto, H. and F. Cheneval (eds.) 2006. Realizing Property Rights. Swiss Human Rights Book
Volume 1. Zurich: Ruffer and Rub
De Soto, H. 2000. El misterio del capital: Por qué el capitalismo triunfa en occidente y fracasa
en el resto del mundo. NY: Basic Books, London: Bantam Press/Random House, Lima: El
Comercio
Delong, J.M., 1997. Property Matters. New York: Free Press.
Demsetz, H., 1967: “Toward a theory of property rights” American Economic Review Vol. 57(2-
May): 347-359.
Diwan, I and D. Rodrik. 1991. “Patents, Appropriate Technology, and North-South Trade,”
Journal of International Economics, Vol. 30: 27-47.
Dong B., and B. Torgler. 2011. “Democracy, Property Rights, Income Equality, and Corruption.
Nota Di Lavoro. Global Challenges Series. Fondazione Eni Enrico Mattei.
Easterly, W. and Levine, R. 2003. “Tropics, germs and crops: how endowments influence
economic development” Journal of Monetary Economics. Vol.50:3-39.
Epstein, R. 1985. Takings: Private Property and the Power of Eminent Domain. Cambridge:
Harvard University Press
Epstein, R. 1995. Simple Rules for a Complex World. Cambridge. MA: Harvard. University
Press.
IPRI - 2016 Levy Carciente, Sary
61
Feyrer, J. and Sacerdote, B. 2009. “Colonialism and Modern Income: Islands as Natural
Experiments,” The Review of Economics and Statistics Vol. 91(2):245-262.
Friedman, M., 1962. Capitalism and Freedom. Chicago: University of Chicago Press
Galiani, S. and E. Schargrodsky, 2005.“”Property Rights for the Poor: Effects of Land Titling”
Universidad Torcuato Di Tella, Business School Working Paper # 06/2005.
Ghatak, M. and T. Besley, 2009. “Property Rights and Economic Development” CEPR
Discussion Paper #7243
Glaeser, E. L., La Porta, R., Lopez de Silanes, F. and Shleifer, A., 2004. “Do Institutions cause
growth?” Journal of Economic Growth Vol. 9:271-303
Hall, R. H. and Jones C. 1999. “Why Do Some Countries Produce So Much More Output per
Worker than Others?” NBER Working Paper No. 6564. June 1999
Hansson, G. 2009. “What determines rule of law? An empirical investigation of rival models”
Kyklos Vol.62 (3):371-393.
Hayek, F.A., 1960. The Constitution of Liberty. Chicago: University of Chicago Press
Jaffé, K.; S. Levy-Carciente; W. Zanoni 2007. "The Economic Limits of Trust: The Case of
Latin-American Urban Informal Commerce Sector" Journal of Developmental Entrepreneurship,
Vol.12(Sep-3):339-352.
Johnson, S., J. McMillan and C. Woodruff. 2002. “Property Rights and Finance” American
Economic Review Vol. 92(5):1335-56.
Knack S. and Keefer, P. 1995. “Institutions and Economic Performance” Economics and Politics
Vol 7 (3):207-227
Korenko, G. 1999. “Intellectual Property Protection and Industrial Growth,” Journal of World
Intellectual Property, Vol. 2, No. 1, pp. 47-75.
Machan, T.R., 2002. The Right to Private Property. Stanford: The Hoover Institution Press.
Meinzen-Dick, R. 2009 Property rights for poverty reduction? Economic and Social Affairs
DESA Working Paper No. 91. ST/ESA/2009/DWP/91. December
Meinzen-Dick, R., P. Kameri-Mbote & H. Markelova 2007, “Property Rights for Poverty
Reduction” 2020 Focus Brief on the World’s Poor and Hungry People. Washington, D.C.:
International Food Policy Research Institute
North, D. C. 1981, Structure and change in economic history, New York: W. W. Norton & Co.
North, D. C. 1990, Institutions, Institutional Change and Economic Performance, Cambridge:
Cambridge University Press.
Nozick, R., 1974. Anarchy, State and Utopia, Oxford: Basil Blackwell.
Paldam, M. and E. Gundlach 2007. “Two Views on Institutions and Development: The Grand
Transition vs the Primacy of Institutions” Paper presented at DEGIT XII, Melbourne, Australia,
June 29-30, 2007 [http://degit.sam.sdu.dk/papers/degit_12/C012_004.pdf]
Pipes, R., 1999. Property and Freedom.New York: Alfred A. Knopf and London: The Harvill
Press.
IPRI - 2016 Levy Carciente, Sary
62
Rand, A., 1964. The Virtue of Selfishness. New York: Penguin Books
Rodrik, D., Subramanian, A. and Trebbi, F. 2004. “Institutions rule: the primacy of institutions
over geography and integration in economic development” Journal of Economic Growth Vol. 9:
131-165
Sandefur, T., 2006. Cornerstone of Liberty: Property Rights in 21st century America.
Washington: Cato Institute.
Singh, R. J. and Y. Huang. 2011. “Financial Deepening, Property Rights, and Poverty: Evidence
from Sub-Saharan Africa” IMF Working Papers WP/11/196
Talbott, J. and R. Roll. 2001. “Why Many Developing Countries Just Aren't” The Anderson
School at UCLA, Finance Working Paper No. 19-01. Nov.13, 2001. [http://ssrn.com/abstract=292140]
Taylor, M.S. 1994. “TRIPs, Trade, and Growth” International Economic Review. Vol.
35(2):361-81.
Von Mises, L., 2002. Gobierno Omnipotente. En nombre del Estado. Madrid: Unión Editorial.
Original title: Omnipotent Government: The Rise of the Total State and Total War (New
Rochelle, NY: Arlington House, 1944). Translation of Pedro Elgoibar.
Waldron, J., 2012 “Property and Ownership” The Stanford Encyclopedia of Philosophy (Spring
Edition), Edward N. Zalta (ed.) [http://plato.stanford.edu/archives/spr2012/entries/property/]
Wang, S-Y. 2008. “Credit Constraints, Job Mobility and Entrepreneurship: Evidence from a
Property Reform in China, NYU.
Zhang, J., D. Du and W.G. Park. 2015. “How Private Property Protection Influences the Impact
of Intellectual Property Rights on Economic Growth? Global Economic Review, Vol. 44(1):1–
30, [http://dx.doi.org/10.1080/1226508X.2014.961093]
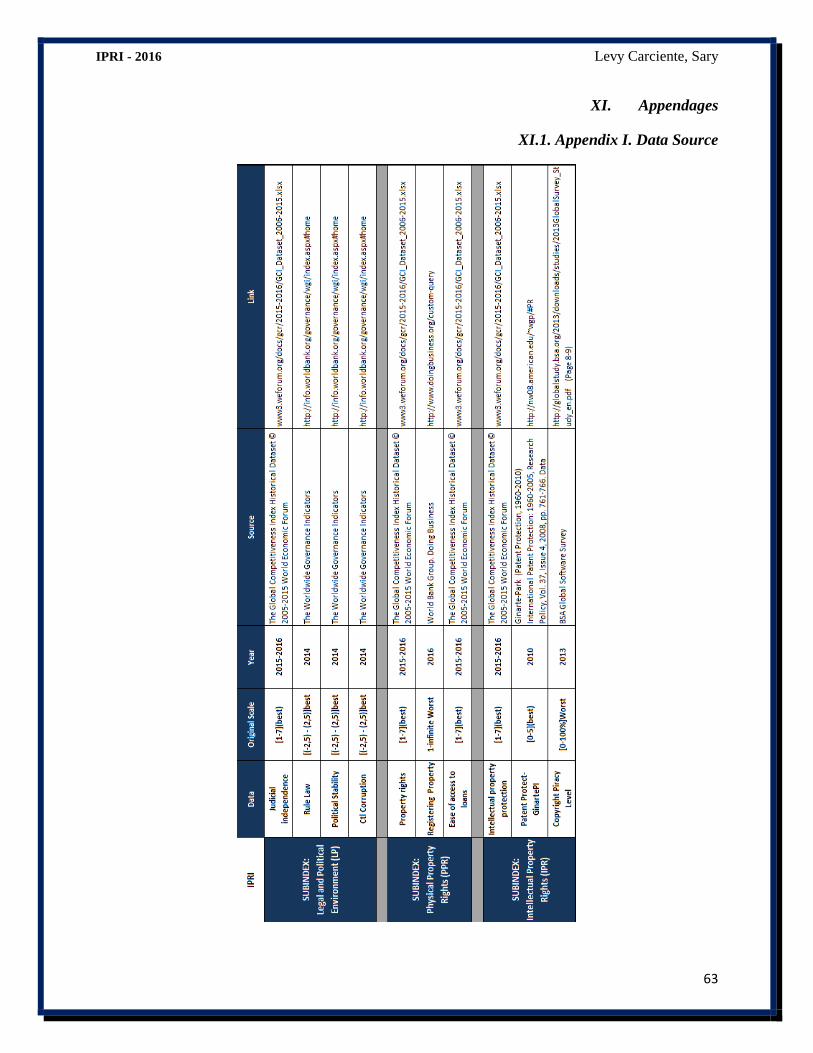
IPRI - 2016 Levy Carciente, Sary
63
XI. Appendages
XI.1. Appendix I. Data Source
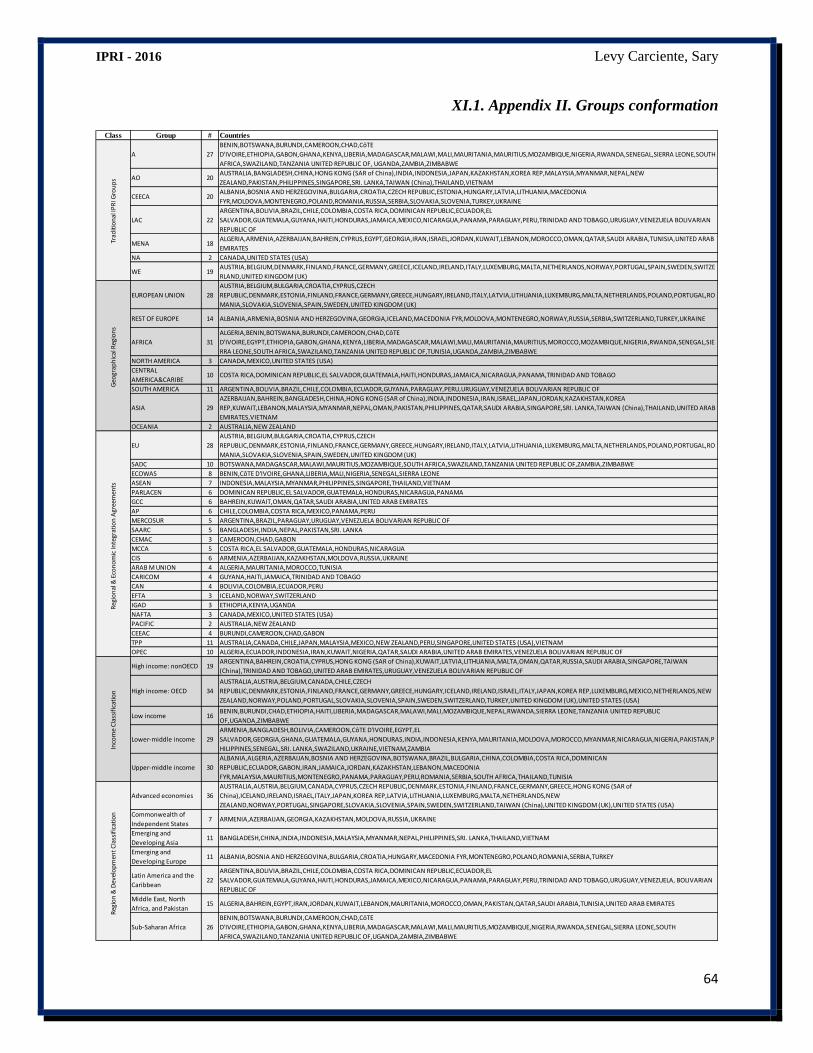
IPRI - 2016 Levy Carciente, Sary
64
XI.1. Appendix II. Groups conformation
Class Group # Countries
A 27
BENIN,BOTSWANA,BURUNDI,CAMEROON,CHAD,CôTE
D'IVOIRE,ETHIOPIA,GABON,GHANA,KENYA,LIBERIA,MADAGASCAR,MALAWI,MALI,MAURITANIA,MAURITIUS,MOZAMBIQUE,NIGERIA,RWANDA,SENEGAL,SIERRA LEONE,SOUTH
AFRICA,SWAZILAND,TANZANIA UNITED REPUBLIC OF, UGANDA,ZAMBIA,ZIMBABWE
AO 20AUSTRALIA,BANGLADESH,CHINA,HONG KONG (SAR of China),INDIA,INDONESIA,JAPAN,KAZAKHSTAN,KOREA REP,MALAYSIA,MYANMAR,NEPAL,NEW
ZEALAND,PAKISTAN,PHILIPPINES,SINGAPORE,SRI. LANKA,TAIWAN (China),THAILAND,VIETNAM
CEECA 20ALBANIA,BOSNIA AND HERZEGOVINA,BULGARIA,CROATIA,CZECH REPUBLIC,ESTONIA,HUNGARY,LATVIA,LITHUANIA,MACEDONIA
FYR,MOLDOVA,MONTENEGRO,POLAND,ROMANIA,RUSSIA,SERBIA,SLOVAKIA,SLOVENIA,TURKEY,UKRAINE
LAC 22
ARGENTINA,BOLIVIA,BRAZIL,CHILE,COLOMBIA,COSTA RICA,DOMINICAN REPUBLIC,ECUADOR,EL
SALVADOR,GUATEMALA,GUYANA,HAITI,HONDURAS,JAMAICA,MEXICO,NICARAGUA,PANAMA,PARAGUAY,PERU,TRINIDAD AND TOBAGO,URUGUAY,VENEZUELA BOLIVARIAN
REPUBLIC OF
MENA 18ALGERIA,ARMENIA,AZERBAIJAN,BAHREIN,CYPRUS,EGYPT,GEORGIA,IRAN,ISRAEL,JORDAN,KUWAIT,LEBANON,MOROCCO,OMAN,QATAR,SAUDI ARABIA,TUNISIA,UNITED ARAB
EMIRATES
NA 2 CANADA,UNITED STATES (USA)
WE 19AUSTRIA,BELGIUM,DENMARK,FINLAND,FRANCE,GERMANY,GREECE,ICELAND,IRELAND,ITALY,LUXEMBURG,MALTA,NETHERLANDS,NORWAY,PORTUGAL,SPAIN,SWEDEN,SWITZE
RLAND,UNITED KINGDOM (UK)
EUROPEAN UNION 28
AUSTRIA,BELGIUM,BULGARIA,CROATIA,CYPRUS,CZECH
REPUBLIC,DENMARK,ESTONIA,FINLAND,FRANCE,GERMANY,GREECE,HUNGARY,IRELAND,ITALY,LATVIA,LITHUANIA,LUXEMBURG,MALTA,NETHERLANDS,POLAND,PORTUGAL,RO
MANIA,SLOVAKIA,SLOVENIA,SPAIN,SWEDEN,UNITED KINGDOM (UK)
REST OF EUROPE 14 ALBANIA,ARMENIA,BOSNIA AND HERZEGOVINA,GEORGIA,ICELAND,MACEDONIA FYR,MOLDOVA,MONTENEGRO,NORWAY,RUSSIA,SERBIA,SWITZERLAND,TURKEY,UKRAINE
AFRICA 31
ALGERIA,BENIN,BOTSWANA,BURUNDI,CAMEROON,CHAD,CôTE
D'IVOIRE,EGYPT,ETHIOPIA,GABON,GHANA,KENYA,LIBERIA,MADAGASCAR,MALAWI,MALI,MAURITANIA,MAURITIUS,MOROCCO,MOZAMBIQUE,NIGERIA,RWANDA,SENEGAL,SIE
RRA LEONE,SOUTH AFRICA,SWAZILAND,TANZANIA UNITED REPUBLIC OF,TUNISIA,UGANDA,ZAMBIA,ZIMBABWE
NORTH AMERICA 3 CANADA,MEXICO,UNITED STATES (USA)
CENTRAL
AMERICA&CARIBE10 COSTA RICA,DOMINICAN REPUBLIC,EL SALVADOR,GUATEMALA,HAITI,HONDURAS,JAMAICA,NICARAGUA,PANAMA,TRINIDAD AND TOBAGO
SOUTH AMERICA 11 ARGENTINA,BOLIVIA,BRAZIL,CHILE,COLOMBIA,ECUADOR,GUYANA,PARAGUAY,PERU,URUGUAY,VENEZUELA BOLIVARIAN REPUBLIC OF
ASIA 29
AZERBAIJAN,BAHREIN,BANGLADESH,CHINA,HONG KONG (SAR of China),INDIA,INDONESIA,IRAN,ISRAEL,JAPAN,JORDAN,KAZAKHSTAN,KOREA
REP,KUWAIT,LEBANON,MALAYSIA,MYANMAR,NEPAL,OMAN,PAKISTAN,PHILIPPINES,QATAR,SAUDI ARABIA,SINGAPORE,SRI. LANKA,TAIWAN (China),THAILAND,UNITED ARAB
EMIRATES,VIETNAM
OCEANIA 2 AUSTRALIA,NEW ZEALAND
EU 28
AUSTRIA,BELGIUM,BULGARIA,CROATIA,CYPRUS,CZECH
REPUBLIC,DENMARK,ESTONIA,FINLAND,FRANCE,GERMANY,GREECE,HUNGARY,IRELAND,ITALY,LATVIA,LITHUANIA,LUXEMBURG,MALTA,NETHERLANDS,POLAND,PORTUGAL,RO
MANIA,SLOVAKIA,SLOVENIA,SPAIN,SWEDEN,UNITED KINGDOM (UK)
SADC 10 BOTSWANA,MADAGASCAR,MALAWI,MAURITIUS,MOZAMBIQUE,SOUTH AFRICA,SWAZILAND,TANZANIA UNITED REPUBLIC OF,ZAMBIA,ZIMBABWE
ECOWAS 8 BENIN,CôTE D'IVOIRE,GHANA,LIBERIA,MALI,NIGERIA,SENEGAL,SIERRA LEONE
ASEAN 7 INDONESIA,MALAYSIA,MYANMAR,PHILIPPINES,SINGAPORE,THAILAND,VIETNAM
PARLACEN 6 DOMINICAN REPUBLIC,EL SALVADOR,GUATEMALA,HONDURAS,NICARAGUA,PANAMA
GCC 6 BAHREIN,KUWAIT,OMAN,QATAR,SAUDI ARABIA,UNITED ARAB EMIRATES
AP 6 CHILE,COLOMBIA,COSTA RICA,MEXICO,PANAMA,PERU
MERCOSUR 5 ARGENTINA,BRAZIL,PARAGUAY,URUGUAY,VENEZUELA BOLIVARIAN REPUBLIC OF
SAARC 5 BANGLADESH,INDIA,NEPAL,PAKISTAN,SRI. LANKA
CEMAC 3 CAMEROON,CHAD,GABON
MCCA 5 COSTA RICA,EL SALVADOR,GUATEMALA,HONDURAS,NICARAGUA
CIS 6 ARMENIA,AZERBAIJAN,KAZAKHSTAN,MOLDOVA,RUSSIA,UKRAINE
ARAB M UNION 4 ALGERIA,MAURITANIA,MOROCCO,TUNISIA
CARICOM 4 GUYANA,HAITI,JAMAICA,TRINIDAD AND TOBAGO
CAN 4 BOLIVIA,COLOMBIA,ECUADOR,PERU
EFTA 3 ICELAND,NORWAY,SWITZERLAND
IGAD 3 ETHIOPIA,KENYA,UGANDA
NAFTA 3 CANADA,MEXICO,UNITED STATES (USA)
PACIFIC 2 AUSTRALIA,NEW ZEALAND
CEEAC 4 BURUNDI,CAMEROON,CHAD,GABON
TPP 11 AUSTRALIA,CANADA,CHILE,JAPAN,MALAYSIA,MEXICO,NEW ZEALAND,PERU,SINGAPORE,UNITED STATES (USA),VIETNAM
OPEC 10 ALGERIA,ECUADOR,INDONESIA,IRAN,KUWAIT,NIGERIA,QATAR,SAUDI ARABIA,UNITED ARAB EMIRATES,VENEZUELA BOLIVARIAN REPUBLIC OF
High income: nonOECD 19ARGENTINA,BAHREIN,CROATIA,CYPRUS,HONG KONG (SAR of China),KUWAIT,LATVIA,LITHUANIA,MALTA,OMAN,QATAR,RUSSIA,SAUDI ARABIA,SINGAPORE,TAIWAN
(China),TRINIDAD AND TOBAGO,UNITED ARAB EMIRATES,URUGUAY,VENEZUELA BOLIVARIAN REPUBLIC OF
High income: OECD 34
AUSTRALIA,AUSTRIA,BELGIUM,CANADA,CHILE,CZECH
REPUBLIC,DENMARK,ESTONIA,FINLAND,FRANCE,GERMANY,GREECE,HUNGARY,ICELAND,IRELAND,ISRAEL,ITALY,JAPAN,KOREA REP,LUXEMBURG,MEXICO,NETHERLANDS,NEW
ZEALAND,NORWAY,POLAND,PORTUGAL,SLOVAKIA,SLOVENIA,SPAIN,SWEDEN,SWITZERLAND,TURKEY,UNITED KINGDOM (UK),UNITED STATES (USA)
Low income 16BENIN,BURUNDI,CHAD,ETHIOPIA,HAITI,LIBERIA,MADAGASCAR,MALAWI,MALI,MOZAMBIQUE,NEPAL,RWANDA,SIERRA LEONE,TANZANIA UNITED REPUBLIC
OF,UGANDA,ZIMBABWE
Lower-middle income 29
ARMENIA,BANGLADESH,BOLIVIA,CAMEROON,CôTE D'IVOIRE,EGYPT,EL
SALVADOR,GEORGIA,GHANA,GUATEMALA,GUYANA,HONDURAS,INDIA,INDONESIA,KENYA,MAURITANIA,MOLDOVA,MOROCCO,MYANMAR,NICARAGUA,NIGERIA,PAKISTAN,P
HILIPPINES,SENEGAL,SRI. LANKA,SWAZILAND,UKRAINE,VIETNAM,ZAMBIA
Upper-middle income 30
ALBANIA,ALGERIA,AZERBAIJAN,BOSNIA AND HERZEGOVINA,BOTSWANA,BRAZIL,BULGARIA,CHINA,COLOMBIA,COSTA RICA,DOMINICAN
REPUBLIC,ECUADOR,GABON,IRAN,JAMAICA,JORDAN,KAZAKHSTAN,LEBANON,MACEDONIA
FYR,MALAYSIA,MAURITIUS,MONTENEGRO,PANAMA,PARAGUAY,PERU,ROMANIA,SERBIA,SOUTH AFRICA,THAILAND,TUNISIA
Advanced economies 36
AUSTRALIA,AUSTRIA,BELGIUM,CANADA,CYPRUS,CZECH REPUBLIC,DENMARK,ESTONIA,FINLAND,FRANCE,GERMANY,GREECE,HONG KONG (SAR of
China),ICELAND,IRELAND,ISRAEL,ITALY,JAPAN,KOREA REP,LATVIA,LITHUANIA,LUXEMBURG,MALTA,NETHERLANDS,NEW
ZEALAND,NORWAY,PORTUGAL,SINGAPORE,SLOVAKIA,SLOVENIA,SPAIN,SWEDEN,SWITZERLAND,TAIWAN (China),UNITED KINGDOM (UK),UNITED STATES (USA)
Commonwealth of
Independent States7 ARMENIA,AZERBAIJAN,GEORGIA,KAZAKHSTAN,MOLDOVA,RUSSIA,UKRAINE
Emerging and
Developing Asia11 BANGLADESH,CHINA,INDIA,INDONESIA,MALAYSIA,MYANMAR,NEPAL,PHILIPPINES,SRI. LANKA,THAILAND,VIETNAM
Emerging and
Developing Europe11 ALBANIA,BOSNIA AND HERZEGOVINA,BULGARIA,CROATIA,HUNGARY,MACEDONIA FYR,MONTENEGRO,POLAND,ROMANIA,SERBIA,TURKEY
Latin America and the
Caribbean22
ARGENTINA,BOLIVIA,BRAZIL,CHILE,COLOMBIA,COSTA RICA,DOMINICAN REPUBLIC,ECUADOR,EL
SALVADOR,GUATEMALA,GUYANA,HAITI,HONDURAS,JAMAICA,MEXICO,NICARAGUA,PANAMA,PARAGUAY,PERU,TRINIDAD AND TOBAGO,URUGUAY,VENEZUELA, BOLIVARIAN
REPUBLIC OF
Middle East, North
Africa, and Pakistan15 ALGERIA,BAHREIN,EGYPT,IRAN,JORDAN,KUWAIT,LEBANON,MAURITANIA,MOROCCO,OMAN,PAKISTAN,QATAR,SAUDI ARABIA,TUNISIA,UNITED ARAB EMIRATES
Sub-Saharan Africa 26
BENIN,BOTSWANA,BURUNDI,CAMEROON,CHAD,CôTE
D'IVOIRE,ETHIOPIA,GABON,GHANA,KENYA,LIBERIA,MADAGASCAR,MALAWI,MALI,MAURITIUS,MOZAMBIQUE,NIGERIA,RWANDA,SENEGAL,SIERRA LEONE,SOUTH
AFRICA,SWAZILAND,TANZANIA UNITED REPUBLIC OF,UGANDA,ZAMBIA,ZIMBABWE
Trad
itio
nal
IPR
I Gro
up
sG
eogr
aph
ical
Reg
ion
sR
egio
n &
Dev
elo
pm
ent
Cla
ssif
icat
ion
Inco
me
Cla
ssif
icat
ion
Reg
ion
al &
Eco
no
mic
Inte
grat
ion
Agr
eem
ents
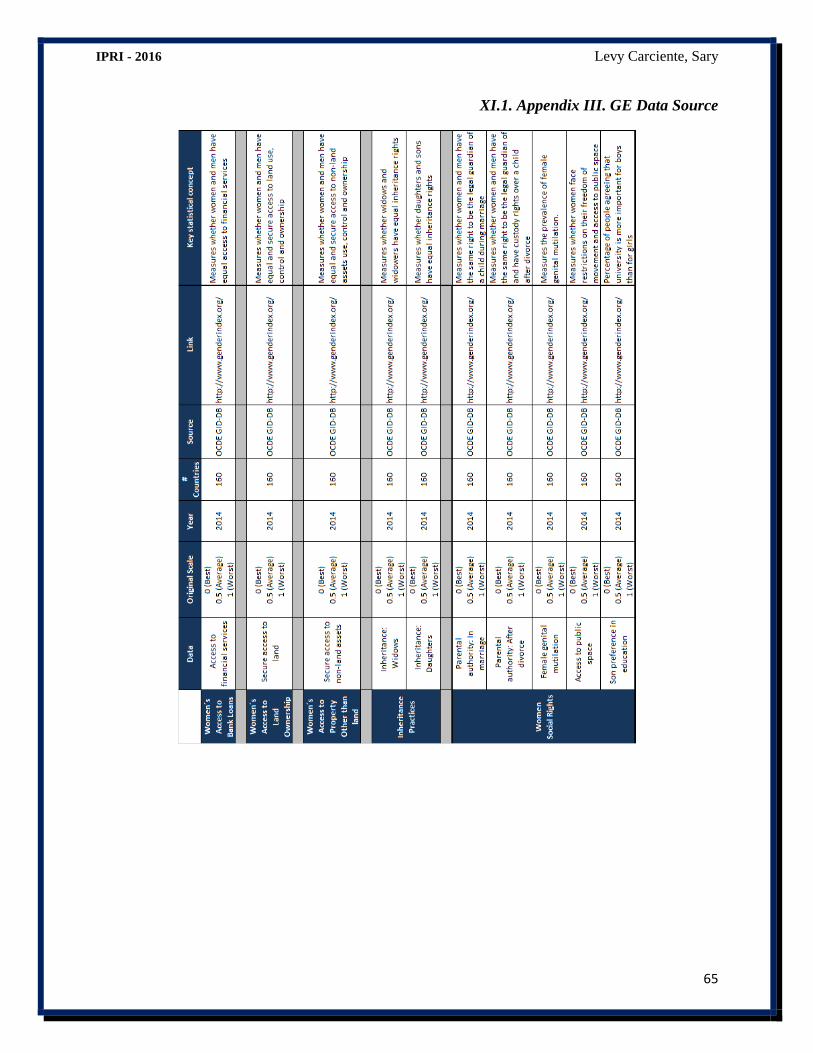
IPRI - 2016 Levy Carciente, Sary
65
XI.1. Appendix III. GE Data Source
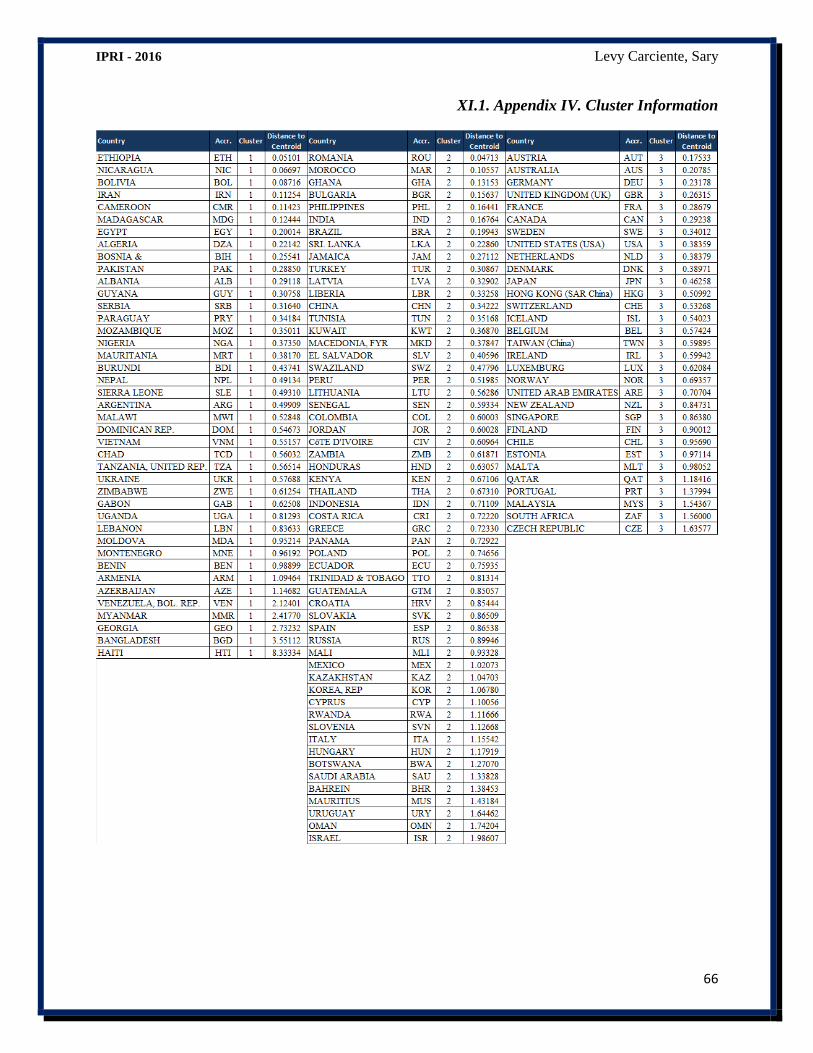
IPRI - 2016 Levy Carciente, Sary
66
XI.1. Appendix IV. Cluster Information