2016 lake superior report - files.dnr.state.mn.us · cisco and rainbow smelt are important forage...
TRANSCRIPT

Minnesota Study 2 Job 4
MINNESOTA DEPARTMENT OF NATURAL RESOURCES
DIVISION OF FISH AND WILDLIFE SECTION OF FISHERIES
COMPLETION REPORT FOR MINNESOTA
WATERS OF LAKE SUPERIOR
2016
by
Josh Blankenheim
Reimbursed under Federal Aid by the Sport Fish Restoration Act

ii
Executive Summary
Sea Lamprey (Petromyzon marinus) wounding rates were above the target level of 5.0 fresh
wounds per 100 Lake Trout (Salvelinus namaycush) in MN-1 (6.8) and MN-3 (10.0), but below the target
level in MN-2 (0.3). The wounding rate in MN-2 was the lowest ever observed. The shorewide
wounding rate was slightly above the target at 5.3 wounds per 100 fish.
The overall catch rate of Lake Trout >17 inches in the May assessment was 11.6 fish per 1,000
feet of net, and 99% were wild fish. CPUE of wild Lake Trout continued to show an increasing trend.
CPUE by management zone was 13.8 in MN-1, 7.3 in MN-2, and 26.0 in MN-3; all were increases over
2015 levels. There were some discrepancies between field-identified Lake Trout and subsequent age
analysis that suggested some were likely Siscowet, primarily from commercially caught samples in MN-
3. Measures should be taken to ensure correct identification of Lake Trout in the May assessment.
In the juvenile Lake Trout assessment (fish less than 17 inches), CPUE was 14.3 fish per 1,000
feet of net. CPUE in the juvenile Lake Trout assessment has remained relatively consistent during the
past decade. Shorewide, 96% of juvenile Lake Trout captured were wild. Even in MN-1 where stocking
has occurred in recent years, 92% of juveniles were wild fish. Stocking was discontinued in MN-1 in
2015 so the percent wild fish in all Lake Trout assessments will continue to increase.
Lake Trout harvest in MN-2 in the summer commercial assessment was 364 fish and the catch
rate was 5.5 fish per 1,000 feet of net. Including Siscowet bycatch (which counts towards the quota), the
harvest in MN-2 was only 20% of the 2,000 fish quota. In contrast, commercial harvest in MN-3 was
2,189 Lake Trout and the catch rate was 37.4 fish per 1,000 feet of net. Including the Siscowet bycatch,
74% of the 3,000 fish quota was harvested in MN-3.
Cisco (Coregonus artedi) abundance in the commercial catch has decreased in recent years,
primarily due to a lack of a strong year-class since 2003. Cisco harvest in the traditional gill net fishery
(all months excluding November) was only 119,822 pounds, which was the lowest harvest since 1987.
The catch rate was 185 Cisco per 1,000 feet of net. Harvest during the November Cisco fishery was

iii
105,514 pounds and the catch rate was 653 pounds per 1,000 feet of net. The 2003 and 2009 year-classes
accounted for 76% of the commercial catch and further illustrates the dire need for a significant year-class
of Cisco.
For the first time in at least 50 years, no commercial operators elected to fish for Rainbow Smelt
(Osmerus mordax). Anecdotal reports suggested dip netters and beach seiners had some success
collecting Rainbow Smelt, but numbers were minimal compared to catches in the 1970s. Rainbow Smelt
remain an important diet item for Lake Trout and other predator species.
A Lake Sturgeon (Acipenser fulvescens) assessment was conducted as part of the lakewide
Cooperative Science and Monitoring Initiative (CSMI) effort to better quantify juvenile/sub-adult Lake
Sturgeon populations. Nine Lake Sturgeon were sampled and CPUE was 1.1 fish per 1,000 feet of net.

iv
Table of Contents
Executive Summary……………………………………………………………………………………ii Table of Contents………………………………………………………………………………………iv List of Tables .......................................................................................................................................... v List of Figures ....................................................................................................................................... vi Introduction ............................................................................................................................................ 1 Methods ................................................................................................................................................. 2 Results & Discussion .............................................................................................................................. 4 Literature Cited .................................................................................................................................... 13

v
Tables Table 1. Number of fresh lamprey wounds per 100 Lake Trout in 4.5 inch May assessment gill nets, by size and statistical district, May 2016 ............................................................... 16 Table 2. Number of Lake Trout per 1,000 feet of 4.5 inch mesh May assessment gill nets, 2016 ..... 16 Table 3. Corrected Lake Trout catch, by station, May assessment, 2016 ........................................... 17 Table 4. Age-length frequency distribution of otolith aged Lake Trout in 4.5 inch gill net, May assessment, 2016 .......................................................................................................... 18 Table 5. Diet composition by weight of Lake Trout prey items in the May, juvenile and summer assessments, 2016………………………..…………………………………………….…...19 Table 6. Summary of fishing effort, catch, percentage of wild Lake Trout and CPUE (number of fish per 1,000 feet of 1.5-2.5 inch gill net) in the juvenile Lake Trout assessment, 2016 .................................................................................................................. 20 Table 7. Historical catch summary of Lake Trout less than 17 inches caught in the juvenile lake trout assessment (1.5 – 2.5 inch stretch measure), CPUE (number of fish per 1,000 feet) and percent wild in the juvenile Lake Trout assessment, Minnesota waters of Lake Superior, 1980-2016 .................................................................................................... 21 Table 8. Trout and salmon stocked in 2016, and proposed stocking for 2017, Minnesota waters of Lake Superior ........................................................................................................ 22

vi
Figures Fig. 1. Sampling stations for adult (L) and juvenile (S) assessments, Minnesota waters of Lake Superior, 2016 ........................................................................................................... 23 Fig. 2. Statistical districts in Minnesota waters of Lake Superior ..................................................... 23 Fig. 3. Number of fresh Sea Lamprey wounds per 100 Lake Trout in the May assessment, by statistical district 1980-2016 ............................................................................................. 24 Fig. 4. Shorewide number of fresh Sea Lamprey wounds per 100 Lake Trout in the May assessment, 1980-2016 ........................................................................................................... 24 Fig. 5. Lake Trout catch rate (number of fish per 1,000 feet of net; CPUE) by statistical district in the May assessment, 1980-2016 ........................................................................... .25 Fig. 6. Catch rate (number of fish per 1,000 feet of net; CPUE) of wild, stocked, and total Lake Trout and percent wild Lake Trout in May assessment, 1980-2016…………………..25 Fig. 7. Catch rate (number of fish per 1,000 feet of net; CPUE) and percent wild Lake Trout in the juvenile Lake Trout assessment, 1980-2016 ................................................................ 26 Fig. 8. Lake Trout harvest and catch rate (number of fish and fish per 1,000 feet of net; CPUE) in the summer commercial assessment, 2007-2016 .................................................. 26 Fig. 9. Cisco year-class strength, 1977-2015, as measured by the relative density of age-1 Cisco that were caught during USGS bottom trawl surveys, and the number of Cisco caught by age-class sampled in commercial and MNDNR surveys, 2015…………………27 Fig. 10. Cisco harvest (thousands of pounds) and rate (pounds per 1,000 feet of net; CPUE) in the commercial gill net fishery, Minnesota waters of Lake Superior, 1965-2016 ............. 27 Fig. 11. Rainbow Smelt harvest (thousands of pounds) and catch rate (pounds per lift; CPUE) in the commercial pound net fishery, Minnesota waters of Lake Superior, 1965-2016 ......... 28 Fig. 12. The location of Lake Sturgeon net sets near the mouth of the St. Louis River. The MNDNR was responsible for net sets 1-3 (inner stratum), 7-9 (middle stratum), and 13-14 (outer stratum). The Wisconsin DNR was responsible for nets near the Superior Entry…………………………………………………………………………...29

1
Introduction
In 1995, the Minnesota Department of Natural Resources (MNDNR), working closely with
stakeholders, developed the Fisheries Management Plan for the Minnesota Waters of Lake Superior
(LSMP) describing specific goals for the Lake Superior fishery and outlining management strategies to
accomplish these goals over the next 10 years (Schreiner 1995). With significant public input, the LSMP
was revised in 2006 (Schreiner et al. 2006) and again in 2016 (Goldsworthy et al. 2016) to reflect both the
progress in achieving previous goals as well as developing new objectives for emerging threats to the lake
and its fishery resources. The LSMP serves as the guiding document for implementing a variety of
management and assessment strategies for fishery management in the Minnesota waters of Lake Superior.
This report summarizes annual assessment work conducted by the Lake Superior Area Office in
Minnesota’s portion of Lake Superior in 2016 including the May Lake Trout (Salvelinus namaycush),
juvenile Lake Trout, summer expanded commercial Lake Trout, forage fish (Cisco Coregonus artedi and
Rainbow Smelt Osmerus mordax), and juvenile/sub-adult Lake Sturgeon (Acipenser fulvescens)
assessments.
Rehabilitation of self-sustaining Lake Trout stocks has been the major goal for agencies around
Lake Superior since the collapse of the Lake Trout fishery due to commercial over-exploitation and
predation by Sea Lamprey (Petromyzon marinus) (Horns et al. 2003). Lake Trout is the primary species
caught by anglers and at present supports a recreational fishery with an average annual harvest of 24,681
fish (2007-2016) in the Minnesota waters of Lake Superior (Reeves 2017). Lake Trout is the dominant
predator species in Lake Superior and have a large influence on prey fish abundance, particularly the non-
native Rainbow Smelt. Chinook Salmon (Oncorhynchus tshawytscha), Coho Salmon (O. kisutch), and
Rainbow Trout (O. mykiss) are not vulnerable to MNDNR assessment gill nets. The status of these
salmonid species is discussed in creel survey reports and reports on the operation of the French and Knife
River traps (Peterson 2017a; Peterson 2017b; Peterson 2017c; Reeves 2017).
The deepwater morphotype of Lake Trout, known as the Siscowet, generally lives in depths
greater than 240 feet, and is the most abundant predator in Lake Superior. For consistency throughout

2
this report, lean Lake Trout will be referred to as “Lake Trout” and Siscowet Lake Trout will be referred
to as “Siscowet”. Trends in Siscowet and other predator populations are monitored by a tri-annual lake-
wide gill net assessment which samples a depth range from near zero to over 600 feet. The goal of
assessing the Siscowet population is to gain insight into their ecological role, determine fish abundance in
offshore waters, and better understand diet, age, and size structure of the population.
Cisco and Rainbow Smelt are important forage species in Lake Superior and both support
commercial fisheries. Population dynamics are monitored by analyzing commercial fishing records,
hydroacoustic surveys, and MNDNR assessment netting. Although Rainbow Smelt abundance has
decreased since the 1960s, they are the primary prey item in the spring diets of Lake Superior predators
(Ray et al. 2007).
Lake Sturgeon has become a species of significant management interest in recent years. As such,
agencies around Lake Superior conduct a lakewide juvenile/sub-adult Lake Sturgeon assessment every
five years which started in 2011 as part of the Cooperative Science Monitoring Initiative (CSMI). The
goal of the survey is to facilitate Lake Sturgeon rehabilitation and objectives include: describe the current
status of juvenile/sub-adult Lake Sturgeon, develop a relative abundance index, and describe the
biological characteristics of juvenile/sub-adult Lake Sturgeon (Schloesser et al. 2014).
Methods
Assessment methods for the May Lake Trout, juvenile Lake Trout, and forage fish populations
have been previously described in Halpern and Schreiner (2003). Locations for May and juvenile Lake
Trout net sets and statistical zones are shown in Figures 1 and 2. Detailed net specifications can be found
in Ebener (2001).
A limited summer expanded commercial Lake Trout assessment fishery was permitted beginning
in 2007 for MN-3 and in 2010 for MN-2. The annual Lake Trout limits are 3,000 fish in MN-3 and 2,000
fish in MN-2 and the season is open from June 1st through September 30th. In 2016, four commercial
operators fished in MN-3 and four commercial operators fished in MN-2. This limited commercial
fishery serves as a surrogate for the September Lake Trout assessment that was discontinued in 2010 due

3
to reduced budgets and staff. Detailed information on the limited commercial Lake Trout fishery can be
found in Blankenheim (2017).
Beginning in 2006, catch per unit effort (CPUE) has been corrected for soak time (i.e., the
numbers of nights the nets were fished). Correction factors for gill-net CPUE developed by G.L. Curtis
(Great Lakes Science Center, unpublished; cited in Hansen et al. 1998) were used to standardize 2- and
≥3-night sets to a uniform base of one night. Thus, the net length was multiplied by 1.52 for 2-night sets
and 1.8 for ≥3-night sets.
Previously in MN-1, Lake Trout CPUE was calculated using an average of individual net
CPUE’s:
nf
C
CPUE i
i
i
∑= ,
where Ci = individual net catch (number of Lake Trout), fi = fishing effort (1,000 feet of gill net), and n
= the number of net sets in a given year. The benefit of this equation is confidence limits can be
calculated for the CPUE value, which we do not utilize in this report. For data clarity, consistency
between statistical districts, and ease of understanding in reporting, the CPUE calculation was changed to:
∑∑=
i
i
fC
CPUE ,
and all previous years CPUE were recalculated for MN-1. Therefore, historical CPUEs in this report may
be slightly different than in previous reports.
The MNDNR Cisco assessment consisted of two gangs of three multi-mesh (2.0-, 2.5-, and 3.0-
inch stretch mesh) net which were each 100 feet long for a total of 300 feet of net per gang. One gang
was set at 12 feet below the surface and the other at 25 feet below the surface. Sampling began in mid-
October with a goal of 100 Cisco samples. Due to the time constraints of otolith aging and reporting, age
data of Cisco sampled in 2016 were not yet available.
The lakewide juvenile/sub-adult Lake Sturgeon survey was conducted near river mouths around
Lake Superior. In the Minnesota waters of Lake Superior, multi-mesh gill nets comprised of 4.5-inch,

4
8.0-inch, and 10.0-inch mesh (extension measure) were deployed in circular strata around the mouth of
the St. Louis River. Net sets were 0 to 6.2 miles from the river mouth and in depths of 10 to 50 feet
(Figure 12). Methods are described thoroughly in Schloesser (2014).
Results and Discussion
May Assessment
The number of fresh Sea Lamprey wounds per 100 Lake Trout, or wounding rate, observed in MN-
1 during the May assessment rose from 2.1 fresh wounds in 2015 to 6.8 wounds in 2016 (Table 1, Figure
3). In MN-2, the zone that typically has the lowest wounding rate, the number of fresh wounds decreased
from 0.7 wounds in 2015 to 0.3 in 2016 and represents the lowest wounding rate ever observed in MN-2.
The wounding rate increased in MN-3, rising from 5.9 to 10.0 wounds per 100 fish. The overall
wounding rate was 5.3 wounds (Figure 4). The target wounding rate for all zones is not more than 5 fresh
wounds per 100 Lake Trout. Lake Trout in the 25.0 to 28.9 inch category had the highest incidence of
wounding, in part due to their older age making them susceptible to attacks longer than smaller, younger
fish (Table 1).
Sea Lamprey control is conducted by the U.S. Fish & Wildlife Service and Fisheries and Oceans
Canada. Control efforts have kept the population at or below 10% of peak abundance. Nevertheless, Sea
Lamprey are still a major cause of Lake Trout mortality in Minnesota waters and in most years kill more
Lake Trout than the sport, commercial, assessment, and tribal fisheries combined. In 2005 and 2006,
increased Sea Lamprey wounding was observed not only in Minnesota waters of Lake Superior, but in
other jurisdictions of Lake Superior as well. Sea lamprey control efforts were intensified and wounding
rates have generally been nearer the target rate of <5% in the Minnesota waters of Lake Superior,
demonstrating the importance of continued control efforts by the U.S. Fish and Wildlife Service.
Overall CPUE of Lake Trout >17 inches was 11.6 fish per 1,000 feet of net in the 2016 May
assessment (Table 2, Figure 5). It is likely that high Lake Trout abundance observed in the 1980s resulted
from stocked fish filling niches made vacant by Sea Lamprey predation and increased availability of

5
forage in the form of extremely high numbers of Rainbow Smelt. Subsequent decreases in overall Lake
Trout abundance were predominantly the result of a decrease in the survival of stocked fish, probably due
to direct predation and competition with wild fish (Hansen et al. 1996), and reflect a fishery approaching
a more sustainable level (Corradin et al. 2008; Negus et al. 2008). Decreases in overall CPUE of Lake
Trout, as well as increases in the proportions of wild and larger Lake Trout, have been observed by other
agencies around Lake Superior as rehabilitation of Lake Trout has progressed.
Wild Lake Trout CPUE was 11.5 fish per 1,000 feet of net which continued the positive trend for
wild Lake Trout abundance, and stocked Lake Trout CPUE was 0.1 fish per 1,000 feet of net (Figure 5).
Lake Trout CPUE was highest for fish in the 17.0-20.9 inch range (Table 2). Lake Trout CPUEs for MN-
1, MN-2, and MN-3 were 13.8, 7.3, and 26.0 fish per 1,000 feet of net (Table 3). Since the mid-2000s, a
positive trend has been observed in Lake Trout CPUE MN-3, whereas CPUE in MN-2 has been lower
and has not displayed a positive trend (Figure 6). CPUE in MN-1 had generally been increasing, but
dropped substantially in 2015 before rebounding in 2016 to a level more representative of CPUEs
observed in the past decade. Wild fish comprised 99% of Lake Trout sampled in the assessment (Table 3,
Figure 5).
Lake Trout ages ranged from age-5 to age-27 (Table 4). By design, the May Assessment typically
captures Lake Trout age-6 to age-10. Thirty-five percent (n=141) of Lake Trout sampled were age-7,
with age-5 through age-11 fish well represented.
The age and growth patterns observed on otoliths help confirm correct species identification from
the calls made in the field by biologists and commercial operators. Age analysis suggested that there may
have been some Siscowet that were mistakenly identified as Lake Trout. There were no discrepancies
with fish in MN-1, meaning that all fish that were called Lake Trout in the field appeared to be so based
on the age and growth characteristics seen on the otoliths. In MN-2 only two fish were discrepancies
where age analysis revealed the specimens were both likely Siscowet. One was a 22.1 inch female that
was age-17 and the other was a 20.0 inch male that was age-23. Overall in MN-2 there was 99%
agreement between the species identification in the field and verification through otolith analysis in a

6
sample size of 169 fish. However, in MN-3 there was only 70% agreement between field identification
and otolith analysis in a sample of 89 fish. This suggests incorrect identification in the field, incorrect age
assignment, or possibly commercial operators in MN-3 caught fish displaying some level of
hybridization. (Commercial operators conduct May Assessment netting in MN-2 and MN-3.) A review
of five years of May Assessment aging data (2012-2016) showed 99-100% agreement between field
identification and age analysis in MN-1, 98-99% in MN-2, and 70-99% in MN-3. Incorrect identification
of Lake Trout could create a variety of problems such as biased CPUEs or poorly functioning Lake Trout
models. Given this information, it is imperative to take measures to ensure proper identification of
specimens occurs in MN-3.
By weight, diet composition of Lake Trout in the 2016 May assessment was Rainbow Smelt
(68.2%), unidentifiable fish remains (26.0%), coregonids (2.0%), Burbot (Lota lota; 1.8%), and other diet
items (2.0%) (Table 5). Rainbow Smelt commonly comprise the greatest weight of diet items in Lake
Trout stomachs during the May Assessment. Thirty percent of Lake Trout (n=138) had no prey items in
their stomachs, which was a greater percentage than in 2012 (12%), 2013 (3%), 2014 (17%), and 2015
(22%).
Juvenile Lake Trout Assessment
In 2016, CPUE of juvenile Lake Trout (less than 17 inches) was 14.3 fish per 1,000 feet of net
and CPUE has been relatively consistent during the past decade (Table 6, Figure 7). CPUE of wild
juveniles was 13.8 Lake Trout per 1,000 feet of net and CPUE of stocked fish was only 0.5 per 1,000 feet.
Ninety-six percent of the juvenile Lake Trout catch was wild (Table 7, Figure 7). CPUEs in MN-1, MN-
2, and MN-3 were 13.3, 9.7, and 23.8 Lake Trout per 1,000 feet of net, respectively. All juveniles
captured in MN-2 and MN-3 were wild as expected due to the discontinuation of stocking in 2003 (MN-
3) and 2007 (MN-2). Despite annual stocking in MN-1 through 2015, 92% of the juvenile Lake Trout
catch in MN-1 was wild fish.
7
By weight, juvenile Lake Trout diets were comprised of Rainbow Smelt (32.8%), Mysis (30.6%),
unidentifiable fish remains (28.5%), various sculpin species (5.5%), aquatic insects (1.1%), and other
prey items (1.5%) (Table 5). Thirty-one percent (n = 85) of juvenile Lake Trout stomachs contained no
prey items in 2016, similar to the 27% observed in 2015.
Lake Trout recruitment may be reaching a level representative of self-sustaining Lake Trout
populations in Lake Superior indicated by high proportions of wild juveniles and plateauing CPUE.
Additionally, there is little expectation for further large increases in the number of Lake Trout that were
observed earlier in rehabilitation (Schreiner et al. 2006; Corradin et al. 2008; Negus et al. 2008). Based
on what was observed with post-rehabilitated Lake Trout populations in eastern Lake Superior, it can be
expected in Minnesota waters that wild Lake Trout abundance will continue to increase to its peak and
subsequently decline to a point of equilibrium more aligned with forage availability, natural population
dynamics, Sea Lamprey predation, and commercial and sport harvest. It is also expected that the increase
in wild Lake Trout abundance will negate any potential negative effect of discontinuing stocking with
little overall impact to the sport fishery. This scenario is similar to what occurred in other jurisdictions
following the discontinuation of stocking. MNDNR will continue Lake Trout assessment activities to
determine whether rehabilitated wild stocks can remain self-sustaining given current and anticipated
future rates of harvest.
Summer Expanded Commercial Assessment
In 2016, the limited commercial fishery for Lake Trout in MN-2 entered its seventh year. The
number of Lake Trout harvested in MN-2 was 364 and CPUE was 5.5 Lake Trout per 1,000 feet of net
(Figure 8). An additional 36 Siscowet were harvested. Commercial netters only harvested 20% of the
total-allowable-catch (TAC) of 2,000 trout (Lake Trout and Siscowet) from MN-2. The estimated
number harvested in the sport fishery in MN-2 was 7,432 Lake Trout, demonstrating that commercial
fishing accounted for only a small percentage (5%) of the total Lake Trout harvest in MN-2.

8
In 2016, the limited commercial fishery for Lake Trout in MN-3 entered its tenth year.
Commercial netters harvested 2,189 Lake Trout in MN-3 and CPUE was 37.4 Lake Trout per 1,000 feet
of net (Figure 8). An additional 42 Siscowet were harvested. Commercial netters harvested 74% of the
3,000 fish TAC. Sport anglers harvested an estimated 3,872 Lake Trout in MN-3 in 2016; therefore
commercial fishing accounted for 37% of the total Lake Trout harvest in MN-3.
Lake Trout diet composition by weight in the summer commercial assessment was unidentifiable
fish remains (32.6%), Mysis (17.3%), coregonids (15.2%), terrestrial insects (11.5%), Rainbow Smelt
(10.1%), various sculpin species (5.4%), Burbot (5.4%), Kiyi (1.0%), and other items (1.5%) (Table 5).
Forty-one percent of Lake Trout stomachs (n = 177) had no diet items, which was similar to 37% in 2015
and 41% in 2014.
Lake Trout Modeling
In 2005, MN DNR developed a Statistical Catch-at-Age (SCAA) model for Lake Trout. This is an
important tool for assessing the status of Lake Trout stocks in Minnesota waters of Lake Superior and will
assist us in determining sport and commercial harvest levels. This type of model is presently used to help
manage the tribal, sport and state commercial fisheries in Wisconsin and Michigan. A description of the
model and discussion of the results from 2005 through 2009 can be found in Halpern (2010).
Lake Trout total annual mortality and spawning stock biomass (SSB) are parameters estimated in
SCAA models. Healey (1978) suggested that a Lake Trout population would decline if it suffered more
than 50% total annual mortality. Other models showed that Lake Trout spawner abundance decreased
when total annual mortality exceeded 45% (Technical Fisheries Review Committee 1992; Ebener et al.
1989), so this figure was used as the maximum acceptable mortality in the A Lake Trout Restoration Plan
for Lake Superior (LTRP; Hansen ed. 1996) and in the LSMP (Schreiner et al. 2006). However, Nieland
et al. (2008) suggested Lake Trout populations in the eastern Wisconsin waters of Lake Superior are
likely to be sustainable when total mortality is 40% or less. Moving forward MN DNR will manage the
Lake Trout fishery using the 40% total mortality threshold, continue to monitor the fishery closely and
9
adjust harvest levels, if appropriate. MN DNR is monitoring SSB and investigating its usefulness as
another criterion for managing the Lake Trout population. Presently, we are updating and evaluating the
Lake Trout SCAA model and investigating various means of assessing it, such as retrospective analysis,
Monte Carlo simulations and others. We are continuing to refine our assessment of fish stocks, and our
models for Lake Trout and Cisco, in order to better understand the population dynamics of these
important fish in Minnesota waters of Lake Superior.
Cisco Assessment
Age data from the 2016 spring and fall Cisco assessments were not yet available at the time of this
writing. Age analysis from the 2015 spring and fall Cisco samples collected from commercial netters (n
= 377) showed that the 2003 and 2009 year-classes accounted for 76% of the total commercial catch and
the 1998 and 2005 year-classes also contributed another 15% to the catch (Figure 9). These Cisco were
age-6 (2009 year-class), age-12 (2003 year-class), and age-17 (1998 year-class), and age-10 (2005 year-
class). Fish up to age-28 (1987 year-class) were captured. The MNDNR fall Cisco assessment uses
multi-mesh nets, and despite having smaller meshes deployed did not detect any younger, smaller fish
that may become available to commercial fishers in the next few years. Furthermore, U.S. Geological
Survey trawling data indicates no significant year-classes have been produced since the 2003 year-class
(Figure 9). There will not be a significant source of Cisco entering the fishery until a strong year-class is
produced. Until then, the Cisco stocks will likely decline as the weak year-classes are fished heavily, so
care must be taken to manage conservatively and avoid collapse of the fishery.
A management strategy to assess forage species as stated in the LSMP is to use hydroacoustic
sampling and trawl surveys to monitor year-class strength and determine biomass of Cisco in Minnesota’s
portion of Lake Superior. In late summer of 2003 a pilot project was initiated to address this objective.
The Lake Superior Area fisheries staff collaborated with Dr. Tom Hrabik from the University of
Minnesota Duluth to develop a hydroacoustic program that would quantify prey fish abundance (Hrabik
et al. 2006). From 2003- 2016, hydroacoustic surveys of Minnesota waters of Lake Superior have been

10
conducted. These surveys have been used to produce estimates of Cisco biomass that are being used to
the TAC for Cisco (Hrabik et al. 2006; Schreiner et al. 2006). In 2014 and 2015 both summer and fall
assessments were conducted to assess differences in biomass estimates by season. Fall sampling was
selected as the best option and only a fall survey was conducted in 2016, which will be the sampling
season moving forward.
Commercial Cisco and Rainbow Smelt Harvest
From the mid-1980s through early 2000s, Cisco harvest by commercial netters gradually increased
from a low of 55,000 pounds to a peak of 450,000 pounds annually, driven largely by strong year-classes
produced in 1984 and 1988-1990, and moderately strong year-classes in 1985, 1998, and 2003 (Figures
10 and 11). In 2001, harvest in November began due to a developing roe fishery but the overall harvest
did not increase; rather, the traditional gill net fishery (all months except November) declined. In 2016,
harvest in the traditional fishery was only 119,822 pounds, which represents the lowest harvest in the
traditional fishery since 1987. Cisco CPUE was 185 fish per 1,000 feet of net, which was up slightly
from 2015 but only half the highest CPUEs seen in the late 1990s. Some caution should be used when
assessing commercial Cisco CPUE data because it is not adjusted for soak time. It is possible that
commercial fishermen could leave their nets in the water for longer periods of time to catch more fish
when fishing is poor, thereby artificially inflating CPUE.
Experimental netting for a potential November roe fishery began in 2001 in Minnesota waters, and
beginning in 2006 harvest was permitted during November using TAC quotas established for each
statistical district (Schreiner et al. 2006). In 2016, the Cisco harvest and CPUE in the November fishery
were 105,514 pounds and 653 fish per 1,000 feet of net (Figure 10). The November roe fishery has
shown a declining trend in CPUE since its peak in 2004, which further indicates that Cisco stocks are
being fished heavily and a strong year-class of Cisco is desperately needed to support the future of the
fishery. Cisco do not fully recruit to commercial gear until age-4, so minimal additional Cisco biomass
will be available at least through 2019, meaning November quotas may have to be reduced until a strong

11
year-class of Cisco recruits to the fishery.
Anecdotal reports suggest the spring Rainbow Smelt run was minimal in 2016 with dip netters and
beach seiners harvesting small quantities of fish compared to the pre-1980 period. From 1980-1990,
commercial harvest had stabilized at approximately 15% of the average harvest during the 1970s. Since
then, harvest has declined further to less than 5% of the average harvest of the 1970s (Figure 11). For the
first time in at least 50 years, no commercial operators elected to fish for Rainbow Smelt. Details on both
the Cisco and Rainbow Smelt fisheries can be found in Blankenheim (2017).
Lake Sturgeon Assessment
A total of 9 Lake Sturgeon were captured in the MNDNR’s portion of the 2016 CSMI Lake
Sturgeon assessment and CPUE was 1.1 fish per 1,000 feet of net. By comparison, 23 Lake Sturgeon
were caught in the 2011 survey and CPUE was 2.9 fish per 1,000 feet of net. In 2016, Lake Sturgeon
ranged from 31.6 inches to 47.4 inches in length. Lake Sturgeon were captured from the inner (0-1.2
miles), middle (1.2-3.1 miles), and outer (3.1-6.2 miles) strata, but all fish were captured on the south side
of the Duluth Entry (Figure 12). Nets that captured Lake Sturgeon were set in areas characterized by
gradual sloping contours and sandy substrate. None of the fish contained tags from previous Lake
Sturgeon work. All fish were released alive, but aging structures were not collected due to warm water
temperatures. Bycatch included Lake Trout, Northern Pike (Esox Lucius), Rainbow Smelt, Rockbass
(Ambloplites rupestris), Silver Redhorse (Moxostoma anisurum), Walleye (Sander vitreus) and White
Sucker (Catostomus commersonii).
Stocking
Stocking played an important role in rehabilitation of Lake Trout in Lake Superior, but has been
discontinued in the Minnesota waters of the lake. Criteria regarding the use of Lake Trout stocking as a
management tool in Lake Superior are discussed in the LTRP (Hansen ed. 1996) and the LSMP
(Goldsworthy et al. 2016). Lake Trout stocking was discontinued in MN-3 in 2003, MN-2 in 2007, and

12
finally in MN-1 in 2016 as criteria for discontinuation of stocking were met in each management zone. A
contingency plan for re-establishing a Lake Trout broodstock was developed in the event that stocking
needs to be utilized in the future.
Two strains of Rainbow Trout were stocked in Minnesota waters of Lake Superior in 2016:
steelhead and Kamloops. Summaries of the 2016 stocking and proposed 2017 stocking are given in Table
8. More information on the return rates of these programs are available in the annual spring creel and trap
reports (Peterson 2017a; Peterson 2017b; Peterson 2017c).

13
Literature Cited
Blankenheim, J. 2017. Commercial fishing summary, Minnesota waters of Lake Superior, 2016.
Minnesota Department of Natural Resources, St. Paul, MN. Corradin, L., M.J. Hansen, D.R. Schreiner, and M.J. Seider. 2008. Recruitment dynamics of Lake Trout
in Western Lake Superior during 1980-1995. North American Journal of Fisheries Management 28: 663-677.
Ebener, M.P., J.H. Selgeby, M.P. Gallinat and M.Donofrio. 1989. Methods for determining total
allowable catch of Lake Trout in the 1842 treaty-ceded area within Michigan waters of Lake Superior, 1990-1994. Great Lakes Indian Fish and Wildlife Commission, Biological Services Division, Administrative Report 89-11.
Ebener, M.P. (Editor). 2001. Sampling and reporting protocols of the Lake Superior Technical
Committee. Report to the Lake Superior Technical Committee. Goldsworthy, C.A., K.A. Reeves, J.E. Blankenheim, and N.R. Peterson. 2016. Fisheries management plan
for the Minnesota waters of Lake Superior. Minnesota Department of Natural Resources, St. Paul, MN.
Halpern, T.N. 2010. Model assessment for Lake Trout management units MN-1, MN-2 and MN-3, 2004-
2008. Minnesota Department of Natural Resources. Halpern, T.N. and D.R. Schreiner. 2003. Completion Report for Minnesota waters of Lake Superior. Minnesota Department of Natural Resources, F-29-R(P)-22, Study 2, Job 4. Hansen, M.J. (Editor). 1996. A Lake Trout restoration plan for Lake Superior. Great Lakes Fishery
Commission. Hansen, M.J., M.P. Ebener, R.G. Schorfhaar, S.T. Schram, D.R. Schreiner, J.H. Selgeby and W.W.
Taylor. 1996. Causes of declining survival of Lake Trout stocked in U.S. waters of Lake Superior in 1963-1986. Transactions of the American Fisheries Society 125(6):831-843.
Hansen, M.J., R.G. Schorfhaar and J.H. Selgeby. 1998. Gill-net saturation by Lake Trout in Michigan
waters of Lake Superior. North American Journal of Fisheries Management 18:847-853. Healey, M.C. 1978. The dynamics of exploited Lake Trout populations and implications for management.
Journal of Wildlife Management 42:307-328. Horns, W.H., C.R. Bronte, T.R. Busiahn, M.P. Ebener, R.L. Eshenroder, T. Gorenflo, N. Kmiecik, W.
Mattes, J.W. Peck, M. Petzold and D.R. Schreiner. 2003. Fish Community Objectives for Lake Superior. Great Lakes Fishery Commission Special Publication 03-01, Ann Arbor, MI.
Hrabik, T., D. Schreiner, M. Balge and S. Geving. 2006. Development of a hydroacoustic survey design
to quantify prey fish abundance in the Minnesota waters of Lake Superior. Minnesota Department of Natural Resources Investigational Report 530.
Negus, M., D.R. Schreiner, T.N. Halpern, S.T. Schram, M.J. Seider and D.M. Pratt. 2008. Bioenergetics
evaluation of the fish community in the western arm of Lake Superior in 2004. North American Journal of Fisheries Management 28(6):1649-1667.
14
Nieland, J. L., M. J. Hansen, M. J. Seider, and J. J. Deroba. 2008. Modeling the sustainability of Lake
Trout fisheries in eastern Wisconsin waters of Lake Superior. Fisheries Research 94:304–314. Peterson, N. 2017a. Results of operating the juvenile and adult fish traps on the French River 2016.
Minnesota Department of Natural Resources. F29R (P) Segment 32 (yr 2), Study 3 Job 3. Peterson, N. 2017b. Results of operating the Juvenile and adult fish trap on the Knife River, 2016.
Minnesota Department of Natural Resources. F29R (P) Segment 32 (yr 2), Study 3 Job 3. Peterson, N. 2017c. Completion Report: Lake Superior Spring Creel Survey 2016. Minnesota Department
of Natural Resources, R29G60F29RP32 Segment 32-2, Study 4 Job 1005. Ray, B.A., Hrabik, T.R., Ebener, M.P., Gorman, O.T., Schreiner, D.R., Schram, S.T., Sitar, S.P., Mattes,
W.P., and Bronte, C.R. 2007. Variability in Lake Superior Lake Trout diet characteristics and selectivity from 1986-2001. Journal of Great Lakes Research 33: 104-113.
Reeves, K. 2017. Completion Report Lake Superior summer creel survey, 2016. Minnesota Department
of Natural Resources, R296G60F29RP32 Segment 32-2, Study 4 Job 1006. Schloesser, J.T., H.R. Quinlan, T.C. Pratt, E.A. Baker, J.V. Adams, W.P. Mattes, S. Greenwood, S.
Chong, E. Berglund, W.M. Gardner, J.P. Lindgren, C. Palvere, P. Stevens, B.D. Borkholder, A.J. Edwards, G. Mensch, E.J. Issac, S.A. Moore, C. Abel, T. Wilson, P. Ripple, A. Ecclestone. 2014. A report of the Lake Superior Lake Sturgeon work group to the Great Lakes Fishery Commission, Lake Superior Technical Committee, and Binational Program Aquatic Community Committee. US Fish and Wildlife Service, Ashland, WI.
Schreiner, D.R. (Editor) 1995. Fisheries management plan for the Minnesota waters of Lake Superior. Minnesota Department of Natural Resources Special Publication 149. Schreiner, D.R., J.J. Ostazeski, T.N. Halpern and S.A. Geving. 2006. Fisheries Management Plan for the
Minnesota waters of Lake Superior. Minnesota Department of Natural Resources Special Publication 163.
Technical Fisheries Review Committee. 1992. Status of the fishery resource-1991, a report by the
Technical Fisheries Review Committee on the assessment of Lake Trout and Lake Whitefish in treaty-ceded waters of the upper Great Lakes: State of Michigan. Mimeo report.


16
Table 1. Number of fresh lamprey wounds per 100 Lake Trout in 4.5 inch stretch mesh May assessment gill nets, by size class and statistical district, 2016. Number of Lake Trout sampled in each length range is listed in parenthesis.
Table 2. Number of Lake Trout by size class per 1,000 feet of 4.5 inch stretch mesh May assessment gill nets, 2016.
432-532 mm (17-20.9 in.)
533-634 mm (21-24.9 in.)
635-736 mm (25-28.9 in.)
737 + mm (29 + in.) Total
MN-1 0.0 (46) 2.5 (81) 27.6 (29) 14.3 (7) 6.8 (163)
MN-2 0.6 (171) 0.0 (128) 0.0 (14) 0.0 (3) 0.3 (316)
MN-3 6.6 (137) 13.4 (127) 15.0 (20) 0.0 (5) 10.0 (289)
TOTALS 2.8 (354) 5.7 (336) 17.5 (63) 6.7 (15) 5.3 (768)
Size Class
<432 mm 432-532 mm 533-634 mm 635-736 mm 737+ mmAssessment (<17 inches) (17-20.9 inches) (21-24.9 inches) (25-28.9 inches) (29 + inches) Overall
May 0.21 5.37 5.10 0.96 0.23 11.87
Size Class
17
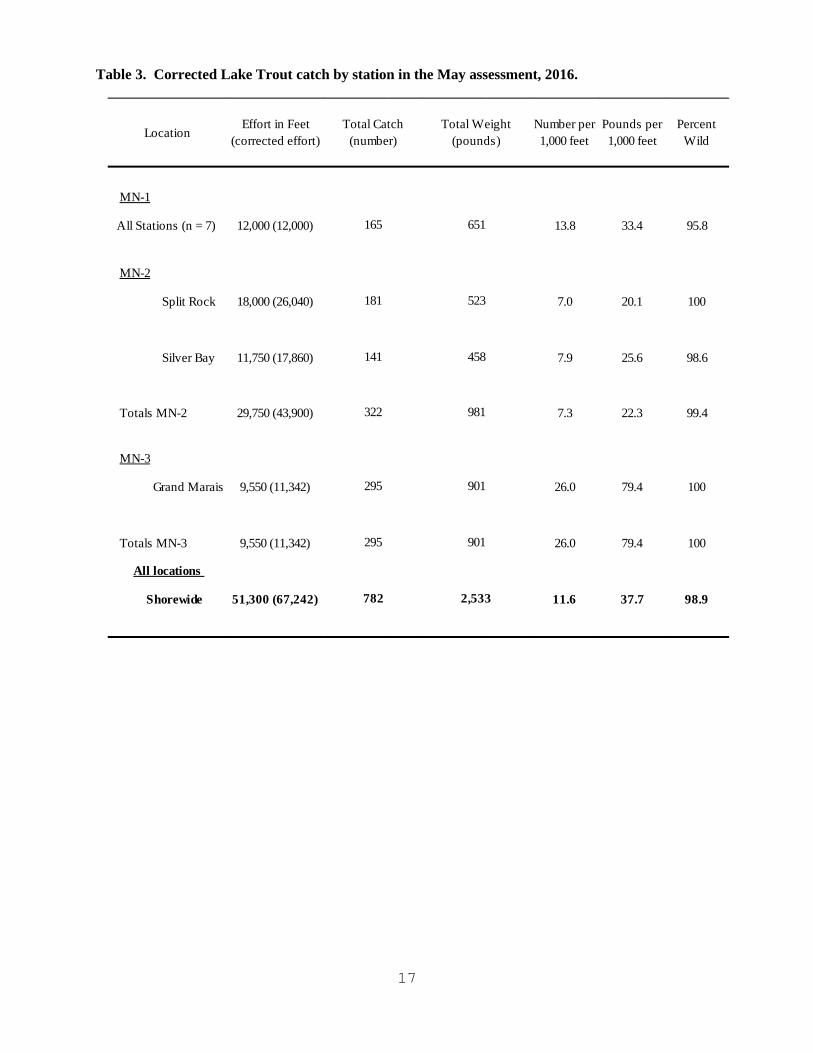
Table 3. Corrected Lake Trout catch by station in the May assessment, 2016.
MN-1
All Stations (n = 7) 12,000 (12,000) 13.8 33.4 95.8
MN-2
Split Rock 18,000 (26,040) 7.0 20.1 100
Silver Bay 11,750 (17,860) 7.9 25.6 98.6
Totals MN-2 29,750 (43,900) 7.3 22.3 99.4
MN-3
Grand Marais 9,550 (11,342) 26.0 79.4 100
Totals MN-3 9,550 (11,342) 26.0 79.4 100
All locations
Shorewide 51,300 (67,242) 11.6 37.7 98.9782 2,533
295 901
295 901
322 981
181 523
141 458
165 651
Percent Wild
Number per 1,000 feet
Pounds per 1,000 feetLocation
Effort in Feet (corrected effort)
Total Catch (number)
Total Weight (pounds)

18
Table 4. Age-length frequency distribution of otolith aged Lake Trout in 4.5 inch stretch measure gill nets, May assessment, 2016. Bold numbers indicate fish that were identified as Lake Trout but age analysis suggested they were Siscowet.
Length (in) IV V VI VII VIII IX X XI XII XIII XIV XV XVI+9.0 - 9.9
10.0 - 10.911.0 - 11.912.0 - 12.913.0 - 13.914.0 - 14.9 215.0 - 15.916.0 - 16.9 4 1 117.0 - 17.9 9 3 1 218.0 - 18.9 15 9 1 2 1 319.0 - 19.9 8 28 6 2 1 3 2 1 320.0 - 20.9 2 54 6 5 1 1 2 121.0 - 21.9 1 31 19 1 3 122.0 - 22.9 1 11 25 4 2 2 1 523.0 - 23.9 3 13 9 1 3 1 124.0 - 24.9 1 6 9 8 4 2 1 125.0 - 25.9 1 2 3 2 2 126.0 - 26.9 1 1 2 6 1 2 227.0 - 27.9 3 1 1 128.0 - 28.9 2 2 1 1 129.0 - 29.9 1 1 330.0 - 30.9 1 131.0 - 31.9 132.0 - 32.9 333.0 - 33.934.0 - 34.935.0 - 35.936.0 - 36.937.0 - 37.938.0 - 38.939.0 - 39.9
Total 0 2 40 141 76 34 21 21 12 10 8 6 29
Average Length 14.2 18.5 20.5 22.0 22.7 23.9 24.4 26.2 24.3 25.3 23.2 23.7

19
Table 5. Diet composition by weight of prey items in Lake Trout stomachs in the May, juvenile, and summer assessments, 2016. The number of stomachs sampled with prey items is shown in parentheses.
Diet itemAquatic insects 0.1% (16) 1.1% (11) 0.3% (10)Burbot 1.8% (4) 5.4% (2)Clam sp. 0.0% (2)Coregonid sp. 1.9% (10) 0.1% (1) 15.2% (20)Deepwater Sculpin 0.5% (8) 0.1% (1) 0.6% (8)Detritus 0.4% (1)Empty (138) (85) (177)Fish eggs 0.0% (2)Kiyi 1.0% (1)Larval fish 0.0% (5)Mysis 0.4% (6) 30.6% (63) 17.3% (62)Ninespine Stickleback 0.0% (2) 0.2% (2)Rainbow Smelt 68.2% (140) 32.8% (22) 10.1% (26)Rocks 0.0% (7) 0.7% (25)Round Whitefish 0.0% (1)Salmonid sp. 0.0% (1)Sculpin sp. 0.3% (14) 3.4% (14) 5.4% (26)Slimy Sculpin 0.0% (1) 1.7% (5) 0.2% (5)Spoonhead Sculpin 0.0% (3) 0.3% (1) 0.1% (3)Stickleback sp. 0.0% (2)Terrestrial insects 0.5% (17) 0.9% (17) 11.5% (46)Unidentifiable fish remains 26.0% (203) 28.5% (80) 32.6% (130)Woody debris 0.1% (14) 0.1% (5) 0.4% (11)
Lake TroutMay Juvenile Summer

20
Table 6. Summary of fishing effort, catch, percentage of wild Lake Trout and CPUE (number of fish per 1,000 feet) in the juvenile Lake Trout (less than 17 inches; 432 mm) assessment, 2016.
Location Effort in Feet
Corrected Effort in
Feet*
Number of lake trout
Percent Wild
CPUE Wild
CPUE Stocked
CPUE Total
MN-1Lester River 1,000 1,520 11 100% 7.2 0.0 7.2
Pumping Station 1,000 1,520 32 75% 15.8 5.3 21.1Stoney Point 1,000 1,520 20 95% 12.5 0.7 13.2
Larsmont 1,000 1,520 23 96% 14.5 0.7 15.1Two Harbors 1,000 1,520 7 100% 4.6 0.0 4.6
Encampment Island 1,000 1,520 28 100% 18.4 0.0 18.4MN-1 Total 6,000 9,120 121 92% 12.2 1.1 13.3
MN-2Split Rock 1,000 1,520 27 100% 17.8 0.0 17.8Silver Bay 1,000 1,520 7 100% 4.6 0.0 4.6
Taconite Harbor 1,000 1,520 19 100% 12.5 0.0 12.5Tofte 1,000 1,520 6 100% 3.9 0.0 3.9
MN-2 Total 4,000 6,080 59 100% 9.7 0.0 9.7MN-3
Grand Marais 1,000 1,520 47 100% 30.9 0.0 30.9Hovland 1,000 1,000 17 100% 17.0 0.0 17.0
Grand Portage 1,000 1,520 32 100% 21.1 0.0 21.1MN-3 Total 3,000 4,040 96 100% 23.8 0.0 23.8
Shorewide Total 13,000 19,240 276 96% 13.8 0.5 14.3*For CPUE calculations fishing effort was corrected for two night sets (1,000 ft. actual effort x 1.52 = 1,520 feet except
for Hovland, which was a one night set).

21
Table 7. Historical catch summary of Lake Trout less than 17 inches caught in small mesh gill nets (1.5-2.5 inch stretch measure), CPUE (number of fish per 1,000 feet) and percent wild in the juvenile Lake Trout assessment, Minnesota waters of Lake Superior, 1980-2016.
Year No. Fish Sampled
Number of Wild Fish Per 1,000
Feet
Number of Stocked Fish Per
1,000 Feet
Total Number
Per 1,000 Feet
Percent Wild
1980 586 1.2 29.6 30.9 4%1981 914 2.2 51.7 54 4%1982 551 1.9 37.7 39.6 5%1983 454 4.5 22.2 26.7 17%1984 585 6.7 33.7 40.4 17%1985 336 4.1 19.9 24 17%1986 404 5.6 22.6 28.2 20%1987 350 6 16.8 22.8 26%1988 271 3.7 12.7 16.4 23%1989 168 2.7 8.6 11.3 24%1990 242 3.7 11.1 14.7 25%1991 384 4.8 15.5 20.3 24%1992 278 5.1 11.7 16.8 31%1993 389 6 18.5 24.5 24%1994 458 6.7 19.4 26.1 26%1995 352 7.3 12.6 20 37%1996 468 10.3 16 26.3 39%1997 439 12 14.9 26.9 45%1998 557 13.5 16.9 30.4 44%1999 640 19 17.2 36.2 53%2000 454 14.4 9.9 24.3 59%2001 370 12.9 6.3 19.2 67%2002 484 20.3 4.5 24.8 82%2003 249 10.5 3.1 13.7 77%2004 334 13.7 3.7 17.4 79%2005 402 14 6.3 20.3 69%2006 306 11 4.9 15.9 69%2007 222 8.4 3.1 11.5 73%2008 282 13 1.6 14.7 89%2009 295 14 1.3 15.3 92%2010 235 11.5 0.7 12.2 94%
2011* - - - - -2012 332 16.6 0.7 17.3 96%2013 219 11.0 0.4 11.4 96%2014 324 16.4 0.5 16.8 97%2015 281 14.1 0.5 14.6 96%2016 276 13.8 0.5 14.3 96%
*No data due to State of Minnesota government shutdown.

22
Table 8. Trout and salmon stocked in 2016 and proposed stocking for 2017, Minnesota waters of Lake Superior.
Species Number Size Fin ClipRainbow Trout
Kamloops 25,071 Yearling Adipose Right Pectoral (ARP)Kamloops 39,947 Yearling Adipose Left Pectoral (ALP)Kamloops 33,891 Yearling Adipose (A)
Total Kamloops 98,909Steelhead 589,269 Fry NoneSteelhead 59 Adults Right Maxillary (RM), T-bar anchor tag, PIT tag
Species Number Size Fin ClipRainbow Trout
Kamloops 60,000 Yearling Adipose Right Ventral (ARV)Kamloops 32,500 Yearling Adipose Left Ventral (ALV)
Total Kamloops 92,500Steelhead 450,000 Fry None
2016 Salmonid Stocking
Proposed 2017 Salmonid Stocking

23
Figure 1. Sampling stations for adult (L) and juvenile (S) assessments, Minnesota waters of Lake Superior.
Figure 2. Statistical districts in Minnesota waters of Lake Superior.

24
Figure 3. Number of fresh Sea Lamprey wounds per 100 Lake Trout in the May assessment, by statistical district, 1980-2016.
Figure 4. Shorewide number of fresh Sea Lamprey wounds per 100 Lake Trout in the May assessment, 1980-2016.
0
5
10
15
20
25
30
1980 1985 1990 1995 2000 2005 2010 2015
Fres
h W
ound
s per
100
Lak
e Tr
out
Year
Target Wounding Rate
MN1
MN2
MN3
0.0
2.0
4.0
6.0
8.0
10.0
12.0
1980 1985 1990 1995 2000 2005 2010 2015
Fres
h w
ound
s per
r 100
Lak
e Tr
out
Year
Lamprey Wounding RateTarget Wounding Rate

25
Figure 5. Catch rate (number of fish per 1,000 feet of net; CPUE) of wild, stocked, and overall Lake Trout, and percentage wild Lake Trout in the May assessment, 1980-2016.
Figure 6. Lake Trout catch rate (number of fish per 1,000 feet of net; CPUE) by statistical district in the May assessment, 1980-2016.
0%
10%
20%
30%
40%
50%
60%
70%
80%
90%
100%
0.0
2.0
4.0
6.0
8.0
10.0
12.0
14.0
16.0
18.0
20.0
1980 1983 1986 1989 1992 1995 1998 2001 2004 2007 2010 2013 2016
Perc
ent W
ild La
ke T
rout
CPU
E (la
ke tr
out p
er 1
,000
feet
of n
et)
Year
Wild CPUEClip CPUEOverall CPUE% Wild
0
5
10
15
20
25
30
35
1980 1985 1990 1995 2000 2005 2010 2015
Num
ber o
f Lak
e Tr
out p
er 1
,000
feet
of n
et
Year
MN-1 Lake Trout CPUEMN-2 Lake Trout CPUEMN-3 Lake Trout CPUE

26
Figure 7. Catch rate (number of fish per 1,000 feet of net; CPUE) and percent wild Lake Trout in the juvenile (<17”) Lake Trout assessment, 1980-2016.
Figure 8. Lake Trout harvest and catch rate (number of fish per 1,000 feet of net; CPUE) in the summer commercial assessment, 2007-2016.
0%
10%
20%
30%
40%
50%
60%
70%
80%
90%
100%
0
10
20
30
40
50
60
1980 1985 1990 1995 2000 2005 2010 2015
Perc
ent W
ild
CPU
E (N
o./1
,000
ft-n
ight
s)
Year
CPUE Total % wild
0
5
10
15
20
25
30
35
40
45
0
500
1000
1500
2000
2500
3000
2007 2008 2009 2010 2011 2012 2013 2014 2015 2016
Num
ber o
f Lak
e Tr
out p
er 1
,000
Feet
of N
et
Num
ber o
f Lak
e Tr
out H
arve
sted
Year
Number of Lake Trout Harvested in MN-2
Number of Lake Trout Harvested in MN-3
Lake Trout CPUE MN-2
Lake Trout CPUE MN-3

27
Figure 9. Cisco year-class strength, 1977-2015, as measured by the relative density of age-1 Cisco that were caught during USGS bottom trawl surveys, and the number of Cisco caught by age-class sampled in commercial and MNDNR surveys, 2015.
Figure 10. Cisco harvest (thousands of pounds) and catch rate (pounds per 1,000 feet of net; CPUE) in the commercial gill net fishery in Minnesota waters of Lake Superior, 1965-2016.
0
20
40
60
80
100
120
140
160
180
0
100
200
300
400
500
600
700
800
1977 1980 1983 1986 1989 1992 1995 1998 2001 2004 2007 2010 2013
Num
ber o
f Cis
co
Recr
uitm
ent i
ndex
(num
ber p
er h
ecta
re)
Year class
MNDNR fall sample
Commercial sample
Age-1 Cisco recruitment
0100200300400500600700800900100011001200
0
100
200
300
400
500
600
700
1965 1970 1975 1980 1985 1990 1995 2000 2005 2010 2015
CPU
E (lb
s per
1,0
00 ft
)
Harv
est (
thou
sand
s of l
bs)
Year
November HarvestFillet HarvestFillet CPUENovember CPUE

28
Figure 11. Rainbow Smelt harvest (thousands of pounds) and catch per unit effort (pounds per lift; CPUE) in the commercial pound net fishery, Minnesota waters of Lake Superior, 1965-2016.
0
1000
2000
3000
4000
5000
6000
7000
8000
0
200
400
600
800
1000
1200
1400
1600
1800
1965 1970 1975 1980 1985 1990 1995 2000 2005 2010 2015
CPU
E (L
bs p
er N
et L
ift)
Harv
est (
Thou
sand
s of l
bs)
Year
Harvest
CPUE

29
Figure 12. The location of Lake Sturgeon net sets near the mouth of the St. Louis River. The MNDNR was responsible for net sets 1-3 (inner stratum), 7-9 (middle stratum), and 13-14 (outer stratum). The Wisconsin DNR was responsible for nets near the Superior Entry.