2016 market & feasibility study part 1: potential user ... -...
TRANSCRIPT
1 | Page
2016 Market & Feasibility Study
Part 1: Potential user characteristics

2 | Page
3 | Page
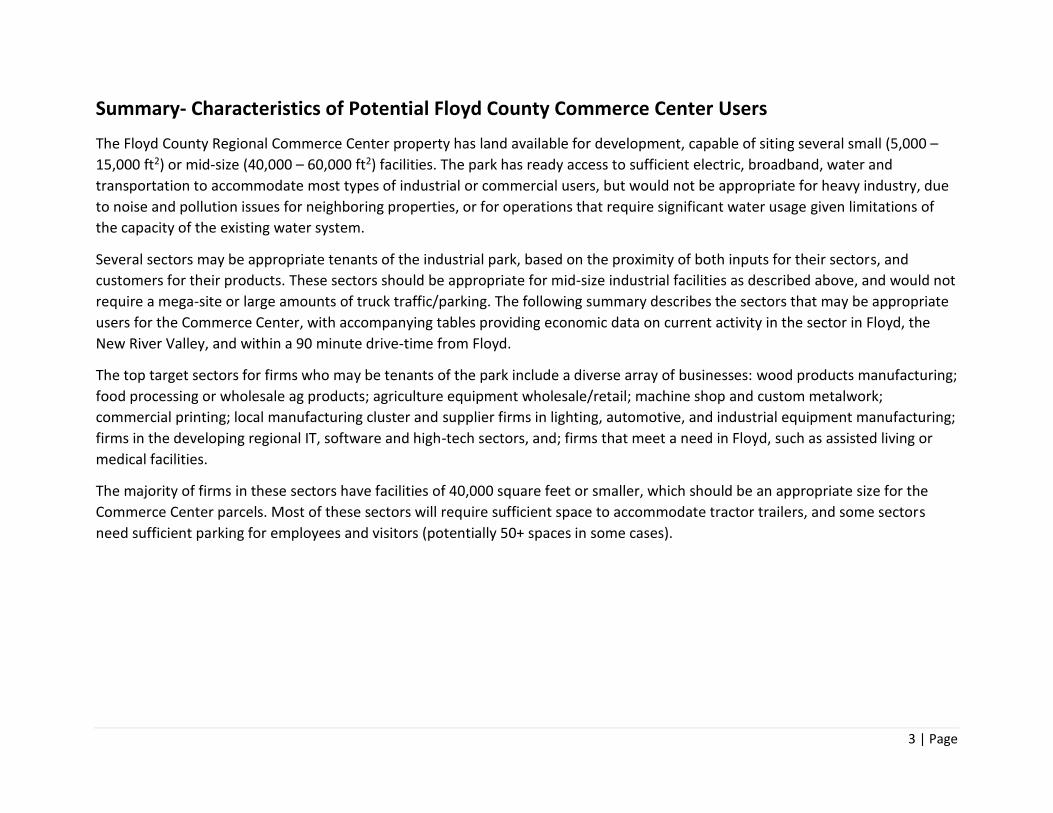
Summary- Characteristics of Potential Floyd County Commerce Center Users
The Floyd County Regional Commerce Center property has land available for development, capable of siting several small (5,000 –
15,000 ft2) or mid-size (40,000 – 60,000 ft2) facilities. The park has ready access to sufficient electric, broadband, water and
transportation to accommodate most types of industrial or commercial users, but would not be appropriate for heavy industry, due
to noise and pollution issues for neighboring properties, or for operations that require significant water usage given limitations of
the capacity of the existing water system.
Several sectors may be appropriate tenants of the industrial park, based on the proximity of both inputs for their sectors, and
customers for their products. These sectors should be appropriate for mid-size industrial facilities as described above, and would not
require a mega-site or large amounts of truck traffic/parking. The following summary describes the sectors that may be appropriate
users for the Commerce Center, with accompanying tables providing economic data on current activity in the sector in Floyd, the
New River Valley, and within a 90 minute drive-time from Floyd.
The top target sectors for firms who may be tenants of the park include a diverse array of businesses: wood products manufacturing;
food processing or wholesale ag products; agriculture equipment wholesale/retail; machine shop and custom metalwork;
commercial printing; local manufacturing cluster and supplier firms in lighting, automotive, and industrial equipment manufacturing;
firms in the developing regional IT, software and high-tech sectors, and; firms that meet a need in Floyd, such as assisted living or
medical facilities.
The majority of firms in these sectors have facilities of 40,000 square feet or smaller, which should be an appropriate size for the
Commerce Center parcels. Most of these sectors will require sufficient space to accommodate tractor trailers, and some sectors
need sufficient parking for employees and visitors (potentially 50+ spaces in some cases).

4 | Page
Strengths in Floyd and the region
Wood products are a traditional strength of southwest Virginia, with ample supplies of timber tracts, numerous sawmills, and a
variety of wood products manufacturing firms. The region has many workers and craftspeople skilled in woodworking techniques.
New opportunities may exist to develop manufacturing or wholesale/distribution operations in restored wood products and
construction materials, wood pellets, or custom wood product manufacturing.
Wood pellet manufacturing involves aggregating wood waste from logging, sawmills or other wood manufacturing
operations and binding/compressing into pellets that serve as fuel for wood stoves.
Wood restoration/wholesale offers an opportunity to rehabilitate or recycle wood from existing buildings for resale to
construction or other wood products manufacturers.
Wood preservation treats wood for various construction and other uses.
Custom wood products manufacturing such as made-to-order furniture, household items, flooring or related construction
materials using new or recycled wood.
Wood panel/millwork wholesale operations may be associated with the above industries, but likely will prefer a location
nearer to major highways/interstates.
Most local firms in this sector have facilities that would be an appropriate size for the Floyd Commerce Center, with two firms with
facilities ranging from 1,500 to 10,000 ft2, two firms with facilities ranging from 10,000 – 20,000 ft2, two firms with facilities ranging
from 20, 000 – 40,000 ft2, and two firms with facilities ranging from 40, 000 – 100,000 ft2. While the Commerce Center can
accommodate facilities of this size, wood products firms may need additional outdoor area for storage of wood/lumber, and
sufficient space for the loading and unloading of timber trucks or tractor trailers. Wood products firms are likely to require
significant electricity, and varying amounts of water depending on the process or product (for instance, steam or chemical
treatments for finished wood products).

5 | Page
WOOD PRODUCTS SECTOR INDUSTRY TRENDS FLOYD NEW RIVER VALLEY 90 minute drive time
Industry Sector Description 2015 Jobs2009 - 2015
% Change
2015
Establish-
ments
2015 Jobs2009 - 2015
% Change
2015
Establish-
ments
2015 Jobs2009 - 2015
% Change
2015
Establish-
ments
Average
employees
per firm
SUPPLIER FIRMS
Logging 26 (19%) 3 40 (9%) 4 468 (4%) 52 9
Support Activities for Forestry <10 0 1 16 0 5 110 38% 12 9
CUSTOMER FIRMS
New Single-Family Housing Construction (except For-Sale Builders) 101 1% 13 322 (34%) 60 1,425 (32%) 318 4
Finish Carpentry Contractors 17 70% 0 57 (15%) 4 463 (31%) 46 10
Roofing Contractors <10 0 2 43 13% 8 455 3% 46 10
Flooring Contractors <10 0 0 36 (50%) 2 308 (29%) 41 7
Lumber, Plywood, Millwork, and Wood Panel Merchant Wholesalers <10 0 0 <10 0 0 214 (2%) 22 10
Furniture Merchant Wholesalers 0 0% 0 19 (10%) 1 132 52% 13 10
Home Furnishing Merchant Wholesalers 0 0% 0 0 0 0 128 (43%) 10 13
Furniture Stores <10 0 0 55 (13%) 8 606 (8%) 61 10
Other Building Material Dealers 0 0 0 80 (19%) 8 589 16% 61 10
Floor Covering Stores <10 0 0 18 (53%) 8 176 (34%) 35 5
POTENTIAL COMMERCE CENTER USERS
Wood Window and Door Manufacturing 0 0% 0 147 (26%) 1 1,489 27% 6 271
Other Millwork (including Flooring) 13 0 1 18 50% 2 934 49% 14 66
Sawmills 0 0 0 <10 0 2 702 10% 32 22
Prefabricated Wood Building Manufacturing <10 0 1 <10 0 2 386 21% 5 77
Reconstituted Wood Product Manufacturing 0 0% 0 0 0% 0 229 50% 3 76
Wood Container and Pallet Manufacturing 0 0% 0 <10 0 2 216 10% 12 18
Wood Preservation 0 0% 0 11 0 1 207 (1%) 4 52
Cut Stock, Resawing Lumber, and Planing 0 0% 0 0 0% 0 78 136% 4 22
Hardwood Veneer and Plywood Manufacturing 0 0% 0 0 0% 0 67 (54%) 2 33
Softwood Veneer and Plywood Manufacturing 0 0% 0 0 0% 0 24 0 1 24
Upholstered Household Furniture Manufacturing 0 0% 0 965 (11%) 3 1,361 14% 11 124
Nonupholstered Wood Household Furniture Manufacturing <10 0 1 17 (50%) 4 1,251 (53%) 22 57
Wood Kitchen Cabinet and Countertop Manufacturing 11 (21%) 2 17 (39%) 2 655 10% 39 17

6 | Page
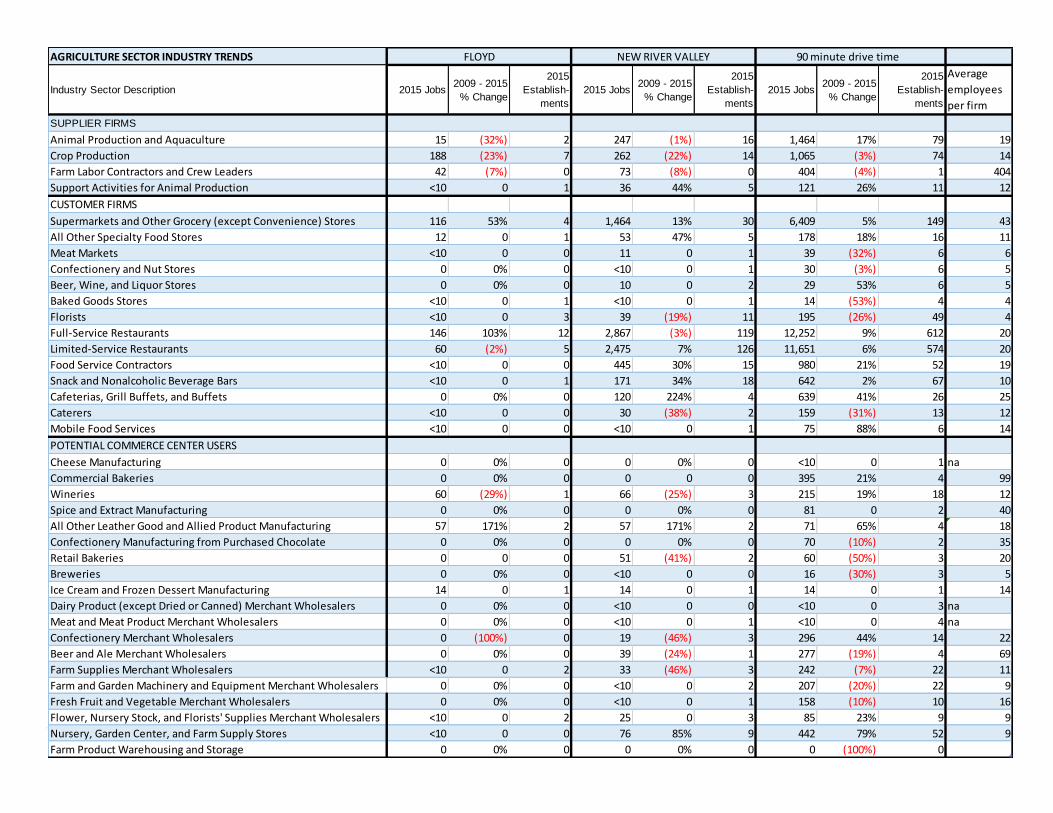
Agricultural products are a strength in the region, with several efforts locally in Floyd to increase the number and profitability of
local farmers, and develop food processing capacity to enable Floyd to capture more of the value from their agricultural produce.
Food processing/packaging/wholesale of local farm produce. Opportunities to create value-added products from local
agricultural commodities, including dairy products, wineries, or frozen/preserved produce products. Opportunities exist to
connect local farmers and food producers to local farmers markets and ‘farm-to-table’ restaurants around the region by
aggregating produce of several farms to meet larger orders.
Agriculture equipment and supplies wholesale/retail provides an opportunity to serve local farmers with farm supplies, or
equipment sales or repair. Similarly, agricultural equipment repair may represent a potential customer base for a
machine/metalworking shop.
Natural and organic products are a specialty sector that has several producers in Floyd as well as a potential customer base
of stores and individual consumers.
Most local firms in this sector have facilities that would be an appropriate size for the Floyd Commerce Center, with 11 firms with
facilities ranging from 1,500 to 5,000 ft2, two firms with facilities ranging from 5,000 – 10,000 ft2, two firms with facilities ranging
from 10,000 – 20,000 ft2, four firms with facilities ranging from 20, 000 – 40,000 ft2, and one firm with a facility over 40,000 ft2. Food
production firms are likely to require significant electricity, especially for refrigeration, and varying amounts of water depending on
the process or product, and sufficient space for the loading and unloading of timber trucks or tractor trailers.
All agricultural production (crop and livestock) establishments had facilities smaller than 5,000 ft2. Of grocery wholesalers in the
region, six had facilities of 10,000 ft2 or less, four had facilities of 20,000 – 40,000 ft2, and one had a facility over 40,000 ft2. In
addition to the facility, wholesalers would need sufficient parking/pavement space to accommodate multiple tractor trailers.
7 | Page
AGRICULTURE SECTOR INDUSTRY TRENDS FLOYD NEW RIVER VALLEY 90 minute drive time
Industry Sector Description 2015 Jobs2009 - 2015
% Change
2015
Establish-
ments
2015 Jobs2009 - 2015
% Change
2015
Establish-
ments
2015 Jobs2009 - 2015
% Change
2015
Establish-
ments
Average
employees
per firm
SUPPLIER FIRMS
Animal Production and Aquaculture 15 (32%) 2 247 (1%) 16 1,464 17% 79 19
Crop Production 188 (23%) 7 262 (22%) 14 1,065 (3%) 74 14
Farm Labor Contractors and Crew Leaders 42 (7%) 0 73 (8%) 0 404 (4%) 1 404
Support Activities for Animal Production <10 0 1 36 44% 5 121 26% 11 12
CUSTOMER FIRMS
Supermarkets and Other Grocery (except Convenience) Stores 116 53% 4 1,464 13% 30 6,409 5% 149 43
All Other Specialty Food Stores 12 0 1 53 47% 5 178 18% 16 11
Meat Markets <10 0 0 11 0 1 39 (32%) 6 6
Confectionery and Nut Stores 0 0% 0 <10 0 1 30 (3%) 6 5
Beer, Wine, and Liquor Stores 0 0% 0 10 0 2 29 53% 6 5
Baked Goods Stores <10 0 1 <10 0 1 14 (53%) 4 4
Florists <10 0 3 39 (19%) 11 195 (26%) 49 4
Full-Service Restaurants 146 103% 12 2,867 (3%) 119 12,252 9% 612 20
Limited-Service Restaurants 60 (2%) 5 2,475 7% 126 11,651 6% 574 20
Food Service Contractors <10 0 0 445 30% 15 980 21% 52 19
Snack and Nonalcoholic Beverage Bars <10 0 1 171 34% 18 642 2% 67 10
Cafeterias, Grill Buffets, and Buffets 0 0% 0 120 224% 4 639 41% 26 25
Caterers <10 0 0 30 (38%) 2 159 (31%) 13 12
Mobile Food Services <10 0 0 <10 0 1 75 88% 6 14
POTENTIAL COMMERCE CENTER USERS
Cheese Manufacturing 0 0% 0 0 0% 0 <10 0 1 na
Commercial Bakeries 0 0% 0 0 0 0 395 21% 4 99
Wineries 60 (29%) 1 66 (25%) 3 215 19% 18 12
Spice and Extract Manufacturing 0 0% 0 0 0% 0 81 0 2 40
All Other Leather Good and Allied Product Manufacturing 57 171% 2 57 171% 2 71 65% 4 18
Confectionery Manufacturing from Purchased Chocolate 0 0% 0 0 0% 0 70 (10%) 2 35
Retail Bakeries 0 0 0 51 (41%) 2 60 (50%) 3 20
Breweries 0 0% 0 <10 0 0 16 (30%) 3 5
Ice Cream and Frozen Dessert Manufacturing 14 0 1 14 0 1 14 0 1 14
Dairy Product (except Dried or Canned) Merchant Wholesalers 0 0% 0 <10 0 0 <10 0 3 na
Meat and Meat Product Merchant Wholesalers 0 0% 0 <10 0 1 <10 0 4 na
Confectionery Merchant Wholesalers 0 (100%) 0 19 (46%) 3 296 44% 14 22
Beer and Ale Merchant Wholesalers 0 0% 0 39 (24%) 1 277 (19%) 4 69
Farm Supplies Merchant Wholesalers <10 0 2 33 (46%) 3 242 (7%) 22 11
Farm and Garden Machinery and Equipment Merchant Wholesalers 0 0% 0 <10 0 2 207 (20%) 22 9
Fresh Fruit and Vegetable Merchant Wholesalers 0 0% 0 <10 0 1 158 (10%) 10 16
Flower, Nursery Stock, and Florists' Supplies Merchant Wholesalers <10 0 2 25 0 3 85 23% 9 9
Nursery, Garden Center, and Farm Supply Stores <10 0 0 76 85% 9 442 79% 52 9
Farm Product Warehousing and Storage 0 0% 0 0 0% 0 0 (100%) 0
8 | Page
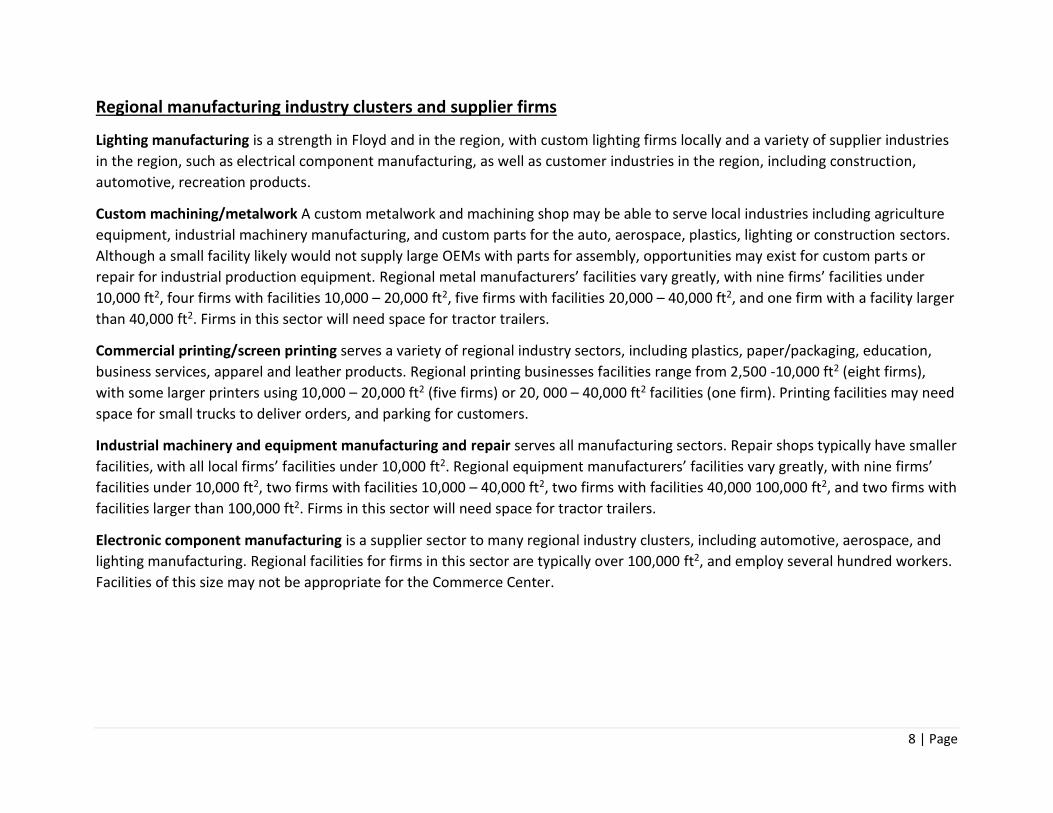
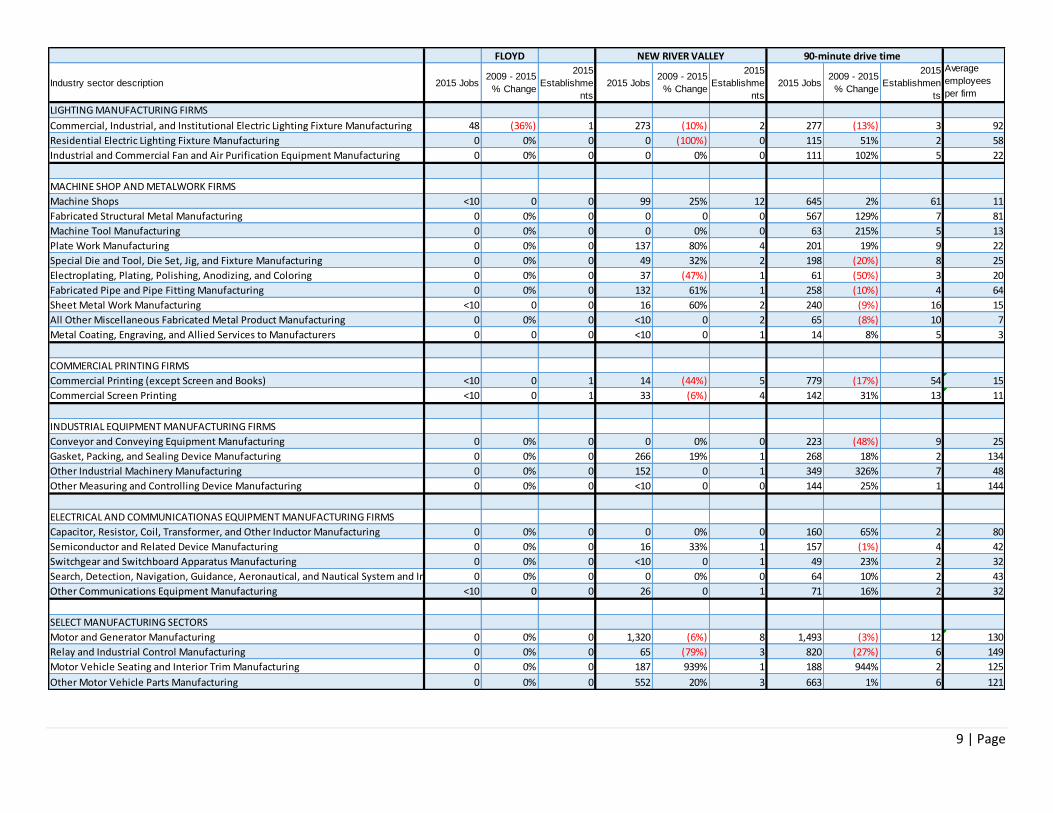
Regional manufacturing industry clusters and supplier firms
Lighting manufacturing is a strength in Floyd and in the region, with custom lighting firms locally and a variety of supplier industries
in the region, such as electrical component manufacturing, as well as customer industries in the region, including construction,
automotive, recreation products.
Custom machining/metalwork A custom metalwork and machining shop may be able to serve local industries including agriculture
equipment, industrial machinery manufacturing, and custom parts for the auto, aerospace, plastics, lighting or construction sectors.
Although a small facility likely would not supply large OEMs with parts for assembly, opportunities may exist for custom parts or
repair for industrial production equipment. Regional metal manufacturers’ facilities vary greatly, with nine firms’ facilities under
10,000 ft2, four firms with facilities 10,000 – 20,000 ft2, five firms with facilities 20,000 – 40,000 ft2, and one firm with a facility larger
than 40,000 ft2. Firms in this sector will need space for tractor trailers.
Commercial printing/screen printing serves a variety of regional industry sectors, including plastics, paper/packaging, education,
business services, apparel and leather products. Regional printing businesses facilities range from 2,500 -10,000 ft2 (eight firms),
with some larger printers using 10,000 – 20,000 ft2 (five firms) or 20, 000 – 40,000 ft2 facilities (one firm). Printing facilities may need
space for small trucks to deliver orders, and parking for customers.
Industrial machinery and equipment manufacturing and repair serves all manufacturing sectors. Repair shops typically have smaller
facilities, with all local firms’ facilities under 10,000 ft2. Regional equipment manufacturers’ facilities vary greatly, with nine firms’
facilities under 10,000 ft2, two firms with facilities 10,000 – 40,000 ft2, two firms with facilities 40,000 100,000 ft2, and two firms with
facilities larger than 100,000 ft2. Firms in this sector will need space for tractor trailers.
Electronic component manufacturing is a supplier sector to many regional industry clusters, including automotive, aerospace, and
lighting manufacturing. Regional facilities for firms in this sector are typically over 100,000 ft2, and employ several hundred workers.
Facilities of this size may not be appropriate for the Commerce Center.
9 | Page
FLOYD NEW RIVER VALLEY 90-minute drive time
Industry sector description 2015 Jobs2009 - 2015
% Change
2015
Establishme
nts
2015 Jobs2009 - 2015
% Change
2015
Establishme
nts
2015 Jobs2009 - 2015
% Change
2015
Establishmen
ts
Average
employees
per firm
LIGHTING MANUFACTURING FIRMS
Commercial, Industrial, and Institutional Electric Lighting Fixture Manufacturing 48 (36%) 1 273 (10%) 2 277 (13%) 3 92
Residential Electric Lighting Fixture Manufacturing 0 0% 0 0 (100%) 0 115 51% 2 58
Industrial and Commercial Fan and Air Purification Equipment Manufacturing 0 0% 0 0 0% 0 111 102% 5 22
MACHINE SHOP AND METALWORK FIRMS
Machine Shops <10 0 0 99 25% 12 645 2% 61 11
Fabricated Structural Metal Manufacturing 0 0% 0 0 0 0 567 129% 7 81
Machine Tool Manufacturing 0 0% 0 0 0% 0 63 215% 5 13
Plate Work Manufacturing 0 0% 0 137 80% 4 201 19% 9 22
Special Die and Tool, Die Set, Jig, and Fixture Manufacturing 0 0% 0 49 32% 2 198 (20%) 8 25
Electroplating, Plating, Polishing, Anodizing, and Coloring 0 0% 0 37 (47%) 1 61 (50%) 3 20
Fabricated Pipe and Pipe Fitting Manufacturing 0 0% 0 132 61% 1 258 (10%) 4 64
Sheet Metal Work Manufacturing <10 0 0 16 60% 2 240 (9%) 16 15
All Other Miscellaneous Fabricated Metal Product Manufacturing 0 0% 0 <10 0 2 65 (8%) 10 7
Metal Coating, Engraving, and Allied Services to Manufacturers 0 0 0 <10 0 1 14 8% 5 3
COMMERCIAL PRINTING FIRMS
Commercial Printing (except Screen and Books) <10 0 1 14 (44%) 5 779 (17%) 54 15
Commercial Screen Printing <10 0 1 33 (6%) 4 142 31% 13 11
INDUSTRIAL EQUIPMENT MANUFACTURING FIRMS
Conveyor and Conveying Equipment Manufacturing 0 0% 0 0 0% 0 223 (48%) 9 25
Gasket, Packing, and Sealing Device Manufacturing 0 0% 0 266 19% 1 268 18% 2 134
Other Industrial Machinery Manufacturing 0 0% 0 152 0 1 349 326% 7 48
Other Measuring and Controlling Device Manufacturing 0 0% 0 <10 0 0 144 25% 1 144
ELECTRICAL AND COMMUNICATIONAS EQUIPMENT MANUFACTURING FIRMS
Capacitor, Resistor, Coil, Transformer, and Other Inductor Manufacturing 0 0% 0 0 0% 0 160 65% 2 80
Semiconductor and Related Device Manufacturing 0 0% 0 16 33% 1 157 (1%) 4 42
Switchgear and Switchboard Apparatus Manufacturing 0 0% 0 <10 0 1 49 23% 2 32
Search, Detection, Navigation, Guidance, Aeronautical, and Nautical System and Instrument Manufacturing0 0% 0 0 0% 0 64 10% 2 43
Other Communications Equipment Manufacturing <10 0 0 26 0 1 71 16% 2 32
SELECT MANUFACTURING SECTORS
Motor and Generator Manufacturing 0 0% 0 1,320 (6%) 8 1,493 (3%) 12 130
Relay and Industrial Control Manufacturing 0 0% 0 65 (79%) 3 820 (27%) 6 149
Motor Vehicle Seating and Interior Trim Manufacturing 0 0% 0 187 939% 1 188 944% 2 125
Other Motor Vehicle Parts Manufacturing 0 0% 0 552 20% 3 663 1% 6 121
10 | Page
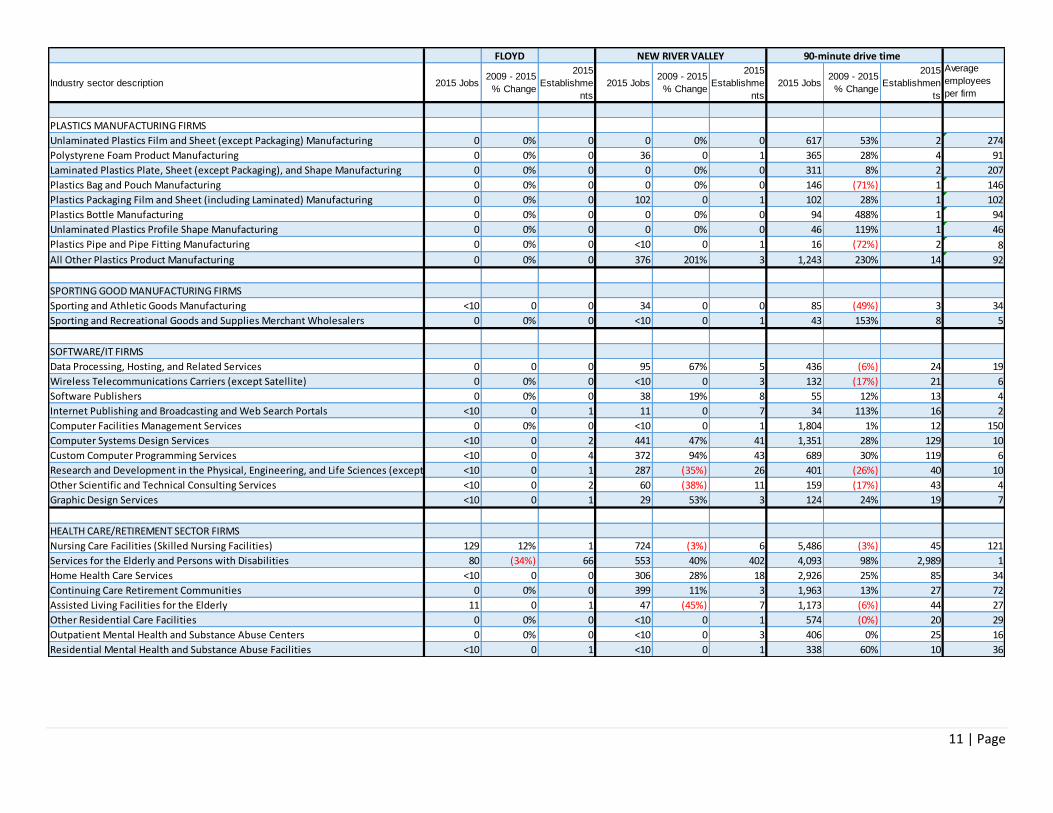
Other manufacturing sectors
Plastics manufacturing supplies many regional clusters, including automotive, food processing, aerospace, electrical equipment, and
recreational equipment. Although this represents a relatively strong cluster in the region surrounding Floyd, the space and transport
needs of plastic manufacturers may not be the most appropriate fit for the Floyd Commerce Center property. Regional facilities for
firms in this sector are typically over 100,000 ft2, and employ several hundred workers. Facilities of this size may not be appropriate
for the Commerce Center.
Firms that meet a need in Floyd
Assisted living facility/home health represent a need in Floyd, which does not have such a facility. Five firms have facilities under
10,000 ft2, three firms have facilities from 10,000 – 20,000 ft2, eight firms have facilities from 20,000 – 40,000 ft2, four firms have
facilities from 40,000 – 100,000 ft2, and four firms have facilities over 100,000 ft2. These facilities will need ample parking for staff
and visitors.
Other emerging opportunities
Software/IT/unmanned systems are a smaller, high-tech, and have a growing presence in the region, mostly located near Virginia
Tech. Firms in this sector have a broad range of facilities based on their number of employees and whether their business requires
significant hardware/data processing. Seven firms have facilities under 10,000 ft2, six firms have facilities from 10,000 – 20,000 ft2,
four firms have facilities from 20,000 – 40,000 ft2, and three firms have facilities from 40,000 – 100,000 ft2.
A variety of other types of businesses show promise based on developments regionally, or based on desired sectors to align with
Floyd economic development planning efforts. While these sectors do not have economic data available, further exploration of
these opportunities may provide an understanding of their facility needs. These sectors include: R&D, prototyping, custom parts
manufacturing (3D printing); ‘green’ building products or alternative energy production or wholesale, and; recreation equipment
manufacturing.
11 | Page
FLOYD NEW RIVER VALLEY 90-minute drive time
Industry sector description 2015 Jobs2009 - 2015
% Change
2015
Establishme
nts
2015 Jobs2009 - 2015
% Change
2015
Establishme
nts
2015 Jobs2009 - 2015
% Change
2015
Establishmen
ts
Average
employees
per firm
PLASTICS MANUFACTURING FIRMS
Unlaminated Plastics Film and Sheet (except Packaging) Manufacturing 0 0% 0 0 0% 0 617 53% 2 274
Polystyrene Foam Product Manufacturing 0 0% 0 36 0 1 365 28% 4 91
Laminated Plastics Plate, Sheet (except Packaging), and Shape Manufacturing 0 0% 0 0 0% 0 311 8% 2 207
Plastics Bag and Pouch Manufacturing 0 0% 0 0 0% 0 146 (71%) 1 146
Plastics Packaging Film and Sheet (including Laminated) Manufacturing 0 0% 0 102 0 1 102 28% 1 102
Plastics Bottle Manufacturing 0 0% 0 0 0% 0 94 488% 1 94
Unlaminated Plastics Profile Shape Manufacturing 0 0% 0 0 0% 0 46 119% 1 46
Plastics Pipe and Pipe Fitting Manufacturing 0 0% 0 <10 0 1 16 (72%) 2 8
All Other Plastics Product Manufacturing 0 0% 0 376 201% 3 1,243 230% 14 92
SPORTING GOOD MANUFACTURING FIRMS
Sporting and Athletic Goods Manufacturing <10 0 0 34 0 0 85 (49%) 3 34
Sporting and Recreational Goods and Supplies Merchant Wholesalers 0 0% 0 <10 0 1 43 153% 8 5
SOFTWARE/IT FIRMS
Data Processing, Hosting, and Related Services 0 0 0 95 67% 5 436 (6%) 24 19
Wireless Telecommunications Carriers (except Satellite) 0 0% 0 <10 0 3 132 (17%) 21 6
Software Publishers 0 0% 0 38 19% 8 55 12% 13 4
Internet Publishing and Broadcasting and Web Search Portals <10 0 1 11 0 7 34 113% 16 2
Computer Facilities Management Services 0 0% 0 <10 0 1 1,804 1% 12 150
Computer Systems Design Services <10 0 2 441 47% 41 1,351 28% 129 10
Custom Computer Programming Services <10 0 4 372 94% 43 689 30% 119 6
Research and Development in the Physical, Engineering, and Life Sciences (except Biotechnology)<10 0 1 287 (35%) 26 401 (26%) 40 10
Other Scientific and Technical Consulting Services <10 0 2 60 (38%) 11 159 (17%) 43 4
Graphic Design Services <10 0 1 29 53% 3 124 24% 19 7
HEALTH CARE/RETIREMENT SECTOR FIRMS
Nursing Care Facilities (Skilled Nursing Facilities) 129 12% 1 724 (3%) 6 5,486 (3%) 45 121
Services for the Elderly and Persons with Disabilities 80 (34%) 66 553 40% 402 4,093 98% 2,989 1
Home Health Care Services <10 0 0 306 28% 18 2,926 25% 85 34
Continuing Care Retirement Communities 0 0% 0 399 11% 3 1,963 13% 27 72
Assisted Living Facilities for the Elderly 11 0 1 47 (45%) 7 1,173 (6%) 44 27
Other Residential Care Facilities 0 0% 0 <10 0 1 574 (0%) 20 29
Outpatient Mental Health and Substance Abuse Centers 0 0% 0 <10 0 3 406 0% 25 16
Residential Mental Health and Substance Abuse Facilities <10 0 1 <10 0 1 338 60% 10 36
12 | Page
2016 Market & Feasibility Study Part 2: Transportation

13 | Page
14 | Page
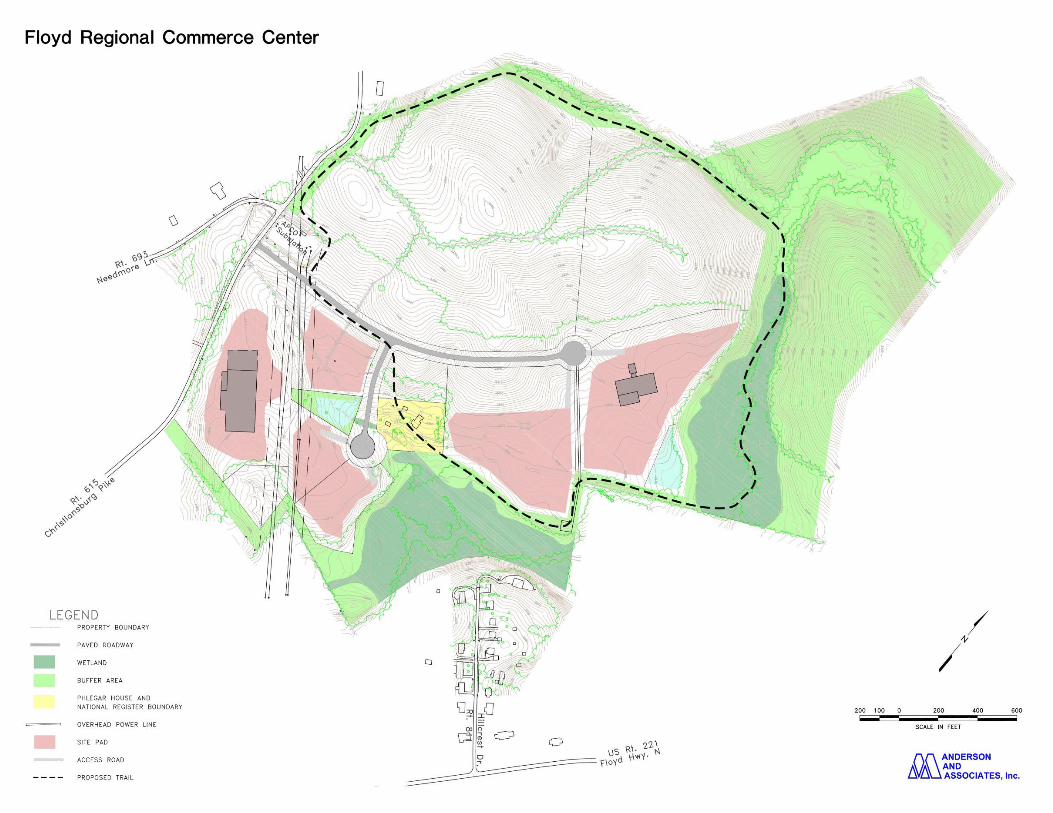
Overview The Floyd County Regional Commerce Center is situated just outside of town limits and is accessible via Route 8 and US Route 221. Commerce
Center Drive is within VDOT right-of-way and provides reasonable access for existing tenants. This study examines the roadway infrastructure
that supports existing businesses and potential improvements to support future industry needs.
As of 2016, only two parcels remain undeveloped within the center. Coincidentally the two parcels are the largest within the center property.
Based on economic trends, further subdividing the larger parcels to support smaller industries and greater business diversity could be
advantageous for Floyd County stakeholders.
Improving the supporting transportation network is two-fold: 1) creating new road frontage and improving circulation within the center; and 2)
improving the connectivity to Route 8 and US Route 221. Creating additional road frontage enables the County to further subdivide the
remaining two large parcels. Improving connectivity to key transportation corridors benefits in-coming/out-going freight and job access. The
image (adjacent) illustrates the original 2007 Commerce Center concept.
15 | Page
16 | Page
Strategies This section highlights strategies developed with local, regional, and statewide partners. May 2015, representatives of the County and County
Board of Supervisors, County Economic Development Alliance, Hollingsworth and Vose, NRV Economic Development Alliance, and NRV Regional
Commission met to discuss transportation and economic development challenges. Strategies shared at the meeting included:
1. Improving access for large vehicles
2. Improving marketability of available property
3. Maximizing benefits of existing infrastructure (100GB Broadband, power, etc.)
4. Identifying additional infrastructure needs to support emerging industries (alternative energies, pedestrian access, water, etc.)
February 2016, representatives of the County and County Economic Development Alliance, Virginia Department of Transportation (VDOT), and
NRV Regional Commission met to discuss potential transportation funding and planning resources. VDOT provided a general overview of federal
and statewide programs that are typically pursued to improve access to industrial properties. The meeting concluded with a field visit to explore
the existing conditions of the supporting infrastructure. Perhaps even more important, the site visits enabled meeting attendees to visualize
each challenge and explore potential solutions.
Following the field visit, the NRV Regional Commission developed conceptual planning drawings to assist the County with determining program
eligibility with grant agencies, specifically programs offered through VDOT and the Appalachian Regional Commission. Each of the planning
concepts were aimed at addressing the strategies identified in May 2015. The image (adjacent) illustrates how the center’s characteristics would
change as a result of the strategies explored during this study process.

17 | Page
18 | Page
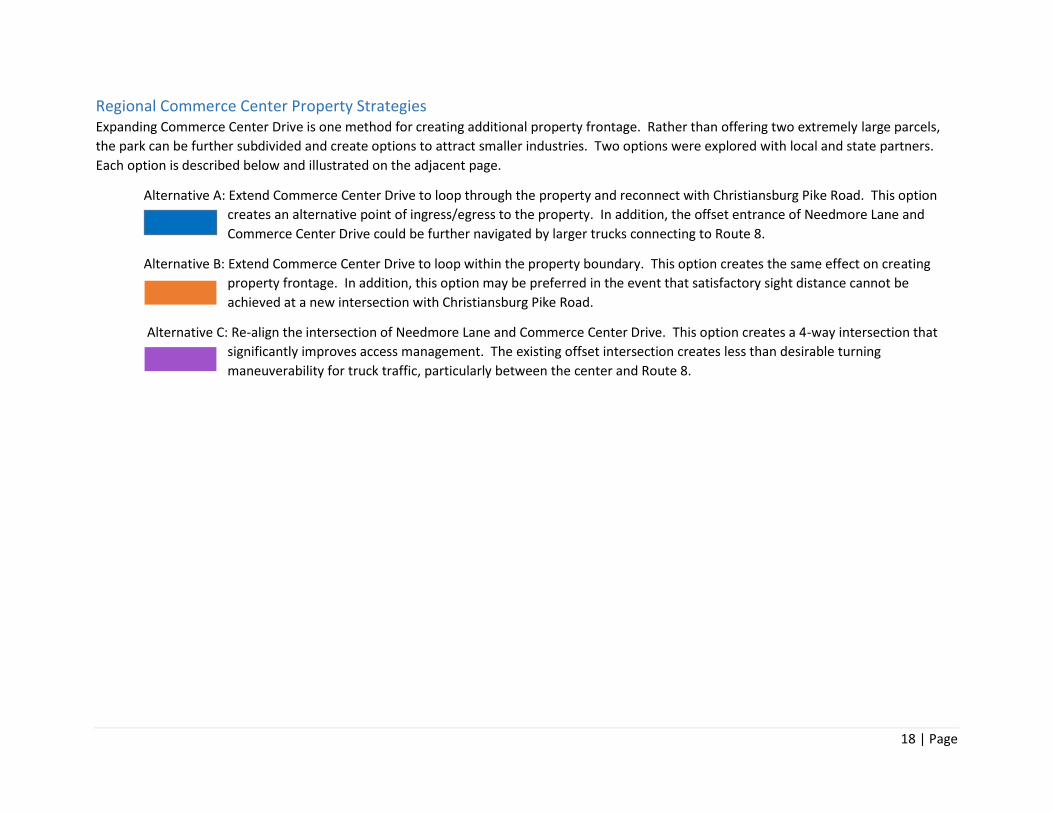
Regional Commerce Center Property Strategies Expanding Commerce Center Drive is one method for creating additional property frontage. Rather than offering two extremely large parcels,
the park can be further subdivided and create options to attract smaller industries. Two options were explored with local and state partners.
Each option is described below and illustrated on the adjacent page.
Alternative A: Extend Commerce Center Drive to loop through the property and reconnect with Christiansburg Pike Road. This option
creates an alternative point of ingress/egress to the property. In addition, the offset entrance of Needmore Lane and
Commerce Center Drive could be further navigated by larger trucks connecting to Route 8.
Alternative B: Extend Commerce Center Drive to loop within the property boundary. This option creates the same effect on creating
property frontage. In addition, this option may be preferred in the event that satisfactory sight distance cannot be
achieved at a new intersection with Christiansburg Pike Road.
Alternative C: Re-align the intersection of Needmore Lane and Commerce Center Drive. This option creates a 4-way intersection that
significantly improves access management. The existing offset intersection creates less than desirable turning
maneuverability for truck traffic, particularly between the center and Route 8.

19 | Page
20 | Page
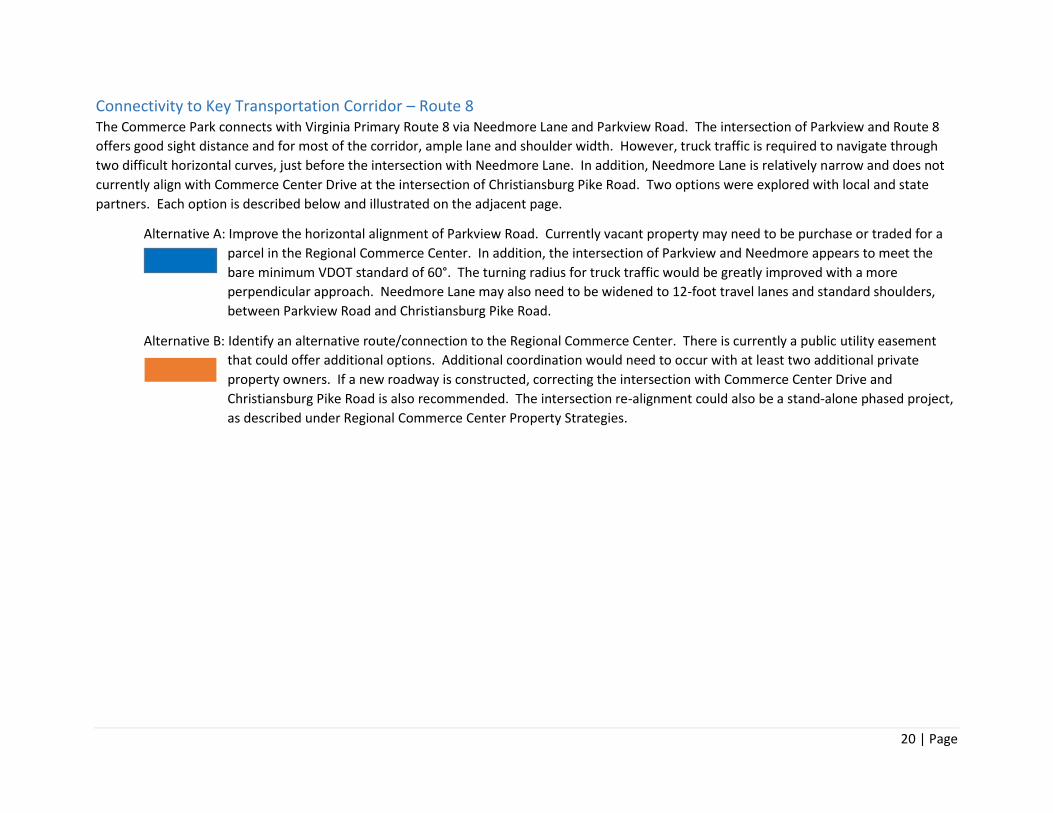
Connectivity to Key Transportation Corridor – Route 8 The Commerce Park connects with Virginia Primary Route 8 via Needmore Lane and Parkview Road. The intersection of Parkview and Route 8
offers good sight distance and for most of the corridor, ample lane and shoulder width. However, truck traffic is required to navigate through
two difficult horizontal curves, just before the intersection with Needmore Lane. In addition, Needmore Lane is relatively narrow and does not
currently align with Commerce Center Drive at the intersection of Christiansburg Pike Road. Two options were explored with local and state
partners. Each option is described below and illustrated on the adjacent page.
Alternative A: Improve the horizontal alignment of Parkview Road. Currently vacant property may need to be purchase or traded for a
parcel in the Regional Commerce Center. In addition, the intersection of Parkview and Needmore appears to meet the
bare minimum VDOT standard of 60°. The turning radius for truck traffic would be greatly improved with a more
perpendicular approach. Needmore Lane may also need to be widened to 12-foot travel lanes and standard shoulders,
between Parkview Road and Christiansburg Pike Road.
Alternative B: Identify an alternative route/connection to the Regional Commerce Center. There is currently a public utility easement
that could offer additional options. Additional coordination would need to occur with at least two additional private
property owners. If a new roadway is constructed, correcting the intersection with Commerce Center Drive and
Christiansburg Pike Road is also recommended. The intersection re-alignment could also be a stand-alone phased project,
as described under Regional Commerce Center Property Strategies.

21 | Page

22 | Page
Connectivity to Key Transportation Corridor – US Route 221 US Route 221 provides the most direct access to a key transportation corridor. The corridor is in relatively good condition, although it could be
brought up to VDOT’s geometric standards (24-foot pavement width and standard shoulders). Perhaps the biggest is the intersection of
Christiansburg Pike Road and US Route 221. With a 46° approach angle and lack of turn lanes, the corridor creates some unique challenges for
truck traffic. Two options were explored with local and state partners. Each option is described below and illustrated on the adjacent page.
Alternative A: Realignment of Christiansburg Pike Road to improve the approach angle to US Route 221. US Route 221 would need to be
widened to incorporate both a north-bound and south-bound right turn lane. I addition, coordination with a minimum of
two private property owners would need to occur. The realignment would significantly improve the turning radius and
sight distance at this intersection.
Alternative B: Construct a round-about at the intersection of Christiansburg Pike Road and US Route 221. There are currently
undeveloped parcels to the north and south of US Route 221 – potentially creating sufficient right-of-way to install a
round-a-bout large enough to accommodate truck traffic. The new round-a-bout would also serve as a traffic calming
device, reducing the speed of traffic entering the town from the north.
23 | Page

24 | Page
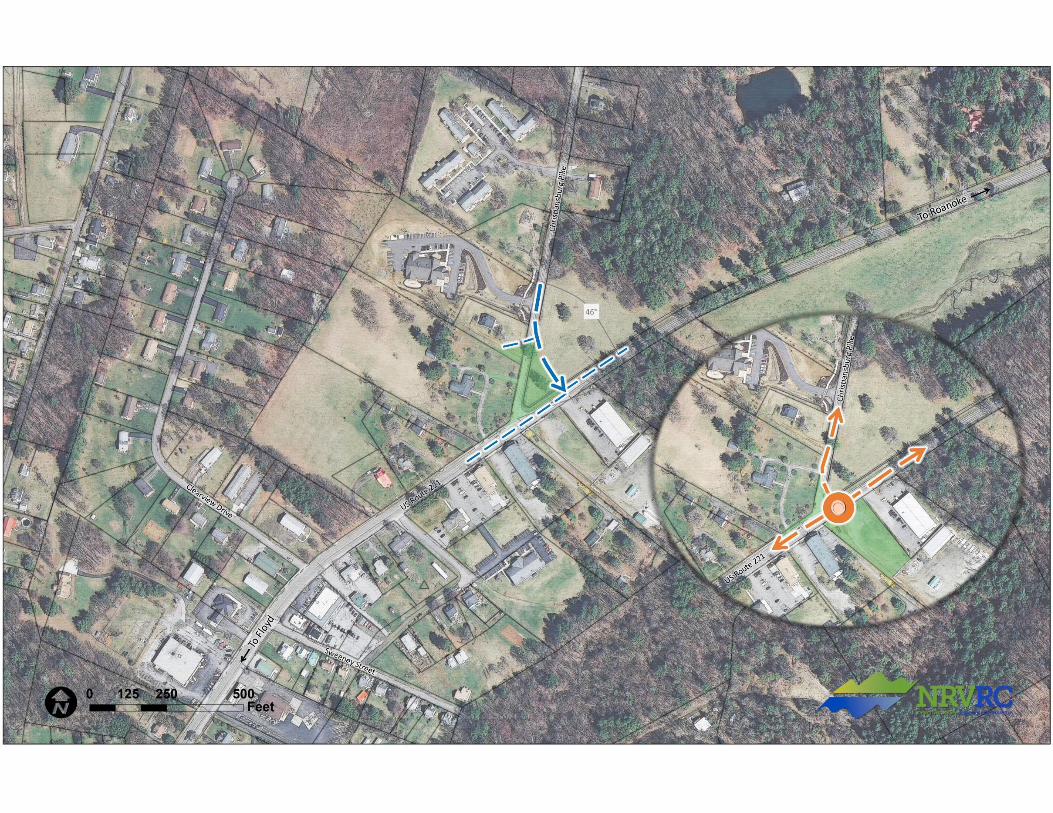
Supporting Data The Regional Commerce Park is one of the largest employment centers in Floyd County. Route 8 and US Route 221 are key regional networks
that support Floyd County’s economy. Both roadways are 2-lane minor-arterials that traverse undulated topography, feature limited turning
and passing lanes, and often present less than desirable sight distance with intersecting roadways. Conditions are amplified by truck traffic that
cannot maintain speed, creating more time following by commuters and visitors. Poor intersection sight distance and turning lanes also leads to
higher volumes of accidents. The map (adjacent) compares 2010 base year and 2035 forecast year the Level-of-Service (LOS).
As a general rule of thumb, 2-Lane roads are typically considered to be performing well up to about 10,000 vehicles per day. Introducing a lack
of turning/passing lanes, mountainous terrain, and high volumes of truck traffic accelerate the level of service depreciation along 2-lane
roadways. According to the Virginia Department of Transportation, daily traffic volumes increased from 6,200 to 7,400 (19%) between 2005 and
2015. Over that same period daily traffic volumes increased from 7,600 to 8,100 (6.5%) on US Route 221. Christiansburg Pike Road daily traffic
also increased from 1,800 to 2,000 (11%).
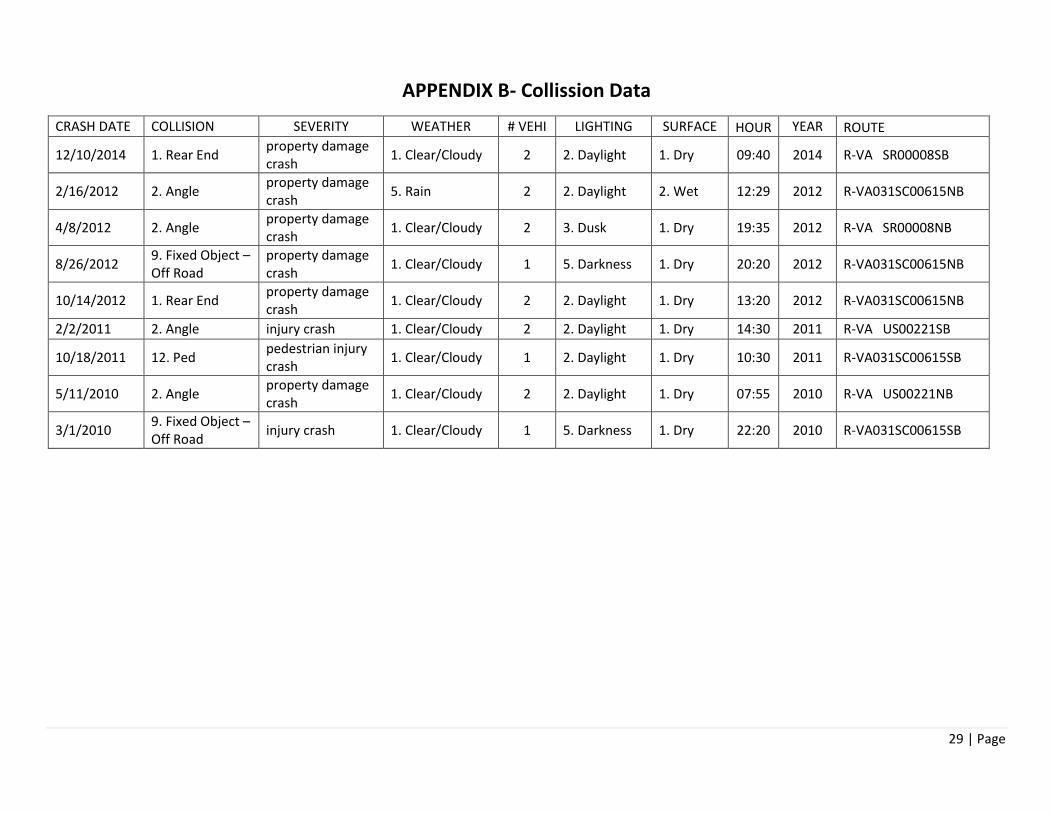
Between 2010 and 2014, ten accidents were reported within close proximity to the Commerce Center. Two accidents along Christiansburg Pike
and US Route 221 involved personal injury. In 2011 a pedestrian was injured at the intersection of US Route 221 and Christiansburg Pike Road.
Other accidents typically occurred during daylight hours, dry conditions, and resulted in property damage (fender-bender).
Description 2015
Route Num
Route Alias Link
Length Start Label End Label AADT
Percent Vehicles
Percent Busses
Percent Trucks
AAWDT
8 South Locust St 0.27 SCL Floyd US 221 Main St 1900 93% 2% 6% 2000
8 North Locust St 0.30 US 221 Main St NCL Floyd 7400 97% 0% 3% 7800
8 Webbs Mill Rd 4.07 NCL Floyd 31-730 Ridge View Rd 7400 97% 0% 3% 7800
221 East Main St 0.33 WCL Floyd SR 8 Floyd C H 3700 96% 1% 3% 3900
221 West Main St 0.61 SR 8 Floyd C H ECL Floyd 8100 97% 0% 3% 8500
221 Floyd Highway North 2.04 ECL Floyd 31-860 Northeast of Floyd CH 8100 97% 0% 3% 8500
615 Christiansburg Pike 0.70 US 221 E, Floyd Hwy North 31-693 Needmore Lane 2000 97% 1% 2% 2100
615 Christiansburg Pike 0.90 31-693 Needmore Lane 31-817 N, Old Mill Rd 1800 97% 1% 2% 1800
693 Needmore Lane 1.00 31-695 Galen Lane 31-615 Christiansburg Pike 850 NA NA 0% 780
748 Parkview Rd 0.70 SR 8 Webbs Mill Rd N 31-693 Needmore Lane 690 NA NA 0% 670
25 | Page
26 | Page
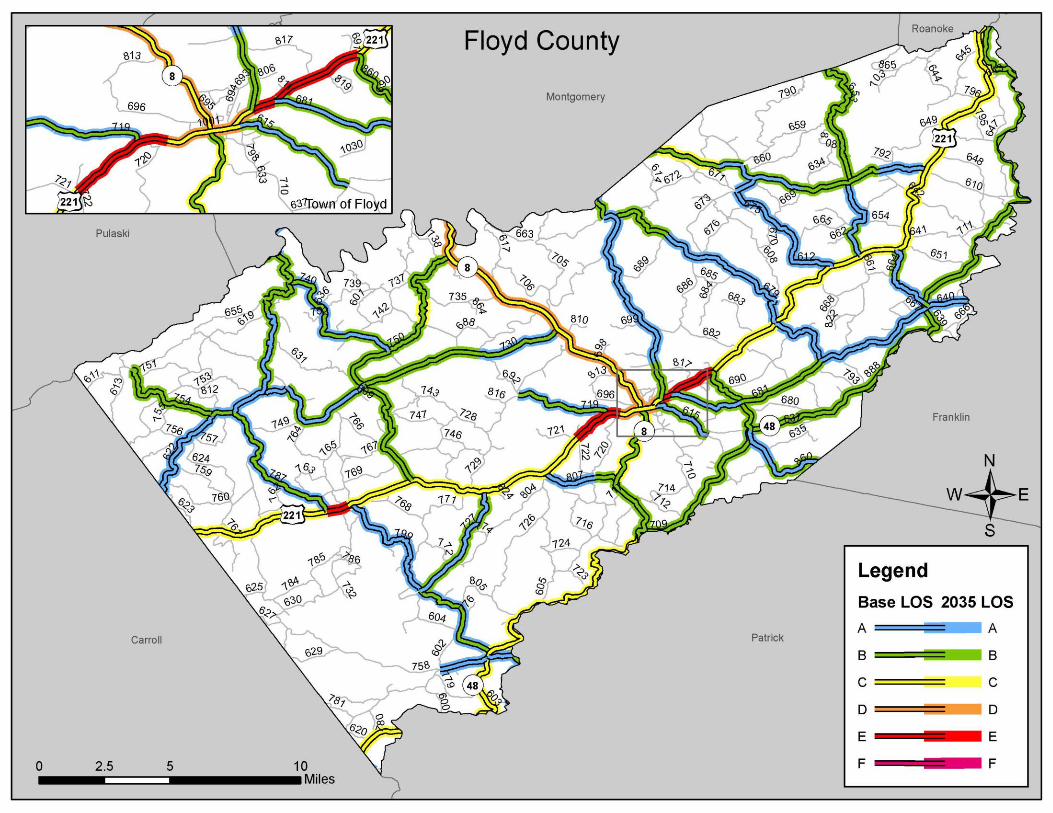
APPENDIX A- INDUSTRY CLUSTER DATA FOR FLOYD, NEW RIVER VALLEY, and ROANOKE ECONOMIC AREA
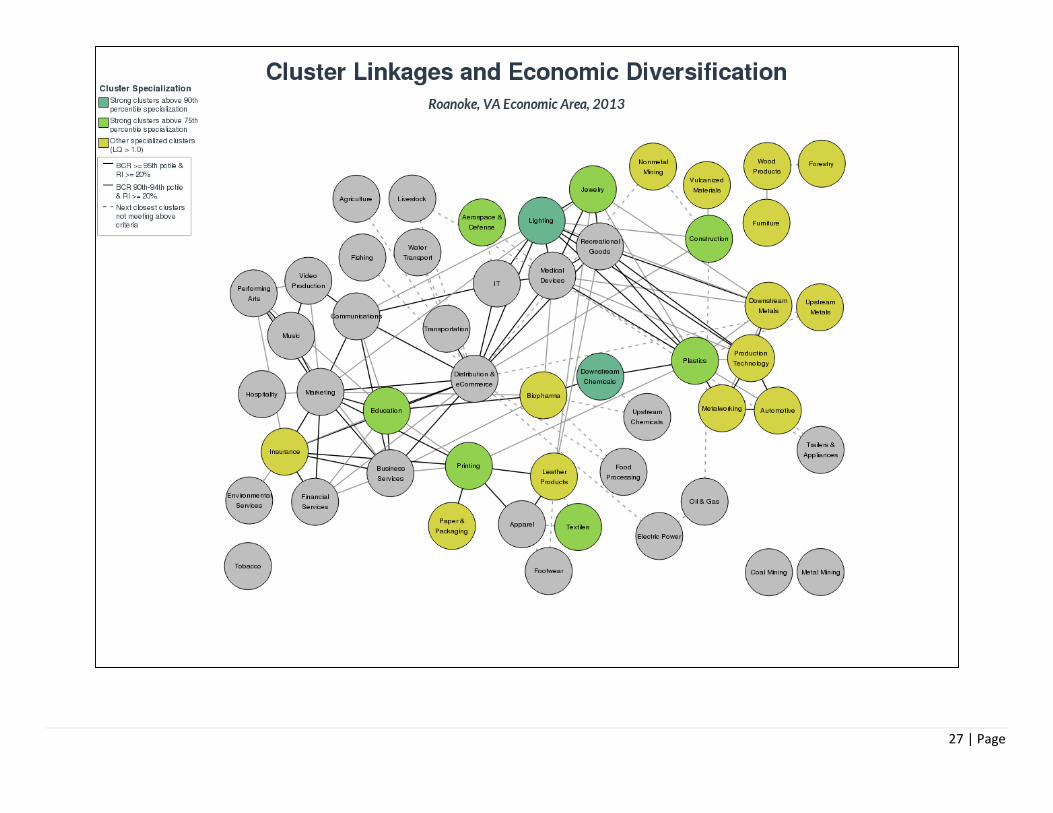
27 | Page
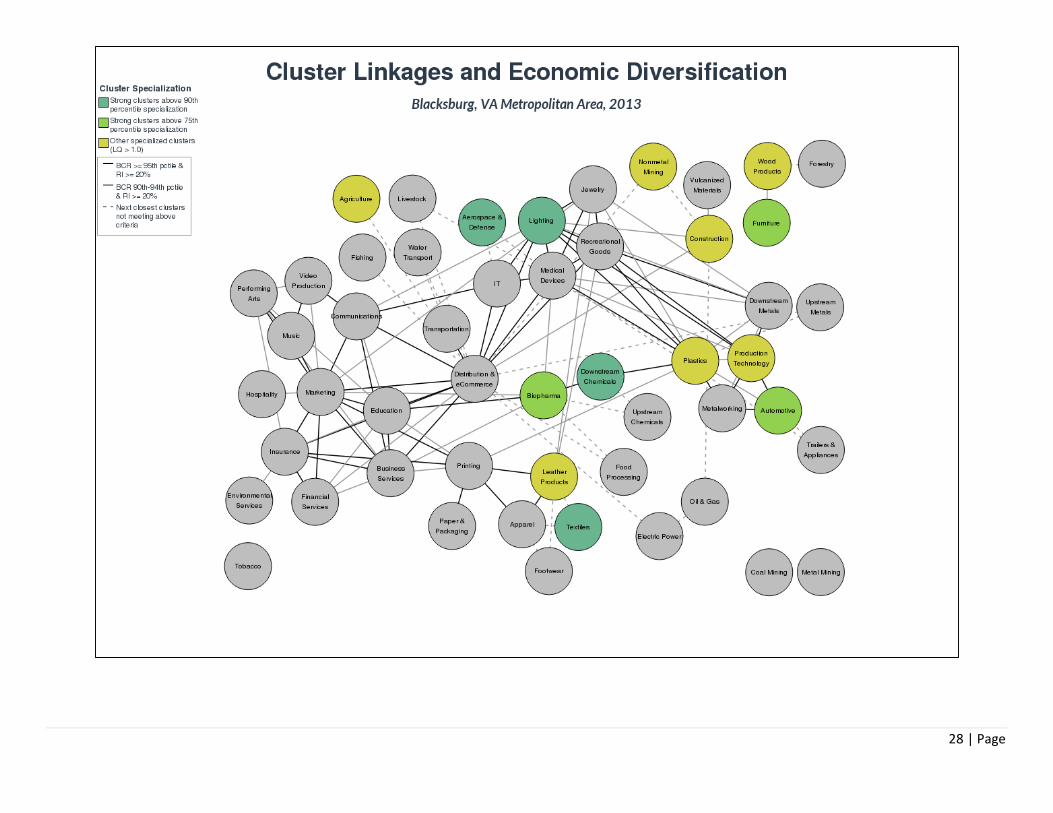
28 | Page
29 | Page
APPENDIX B- Collission Data
CRASH DATE COLLISION SEVERITY WEATHER # VEHI LIGHTING SURFACE HOUR YEAR ROUTE
12/10/2014 1. Rear End property damage crash
1. Clear/Cloudy 2 2. Daylight 1. Dry 09:40 2014 R-VA SR00008SB
2/16/2012 2. Angle property damage crash
5. Rain 2 2. Daylight 2. Wet 12:29 2012 R-VA031SC00615NB
4/8/2012 2. Angle property damage crash
1. Clear/Cloudy 2 3. Dusk 1. Dry 19:35 2012 R-VA SR00008NB
8/26/2012 9. Fixed Object – Off Road
property damage crash
1. Clear/Cloudy 1 5. Darkness 1. Dry 20:20 2012 R-VA031SC00615NB
10/14/2012 1. Rear End property damage crash
1. Clear/Cloudy 2 2. Daylight 1. Dry 13:20 2012 R-VA031SC00615NB
2/2/2011 2. Angle injury crash 1. Clear/Cloudy 2 2. Daylight 1. Dry 14:30 2011 R-VA US00221SB
10/18/2011 12. Ped pedestrian injury crash
1. Clear/Cloudy 1 2. Daylight 1. Dry 10:30 2011 R-VA031SC00615SB
5/11/2010 2. Angle property damage crash
1. Clear/Cloudy 2 2. Daylight 1. Dry 07:55 2010 R-VA US00221NB
3/1/2010 9. Fixed Object – Off Road
injury crash 1. Clear/Cloudy 1 5. Darkness 1. Dry 22:20 2010 R-VA031SC00615SB