2016 national healthcare retention & rn staffing report · nursing solutions, inc. permanent...
TRANSCRIPT
Nursing Solutions, Inc.
Permanent Nurses, Permanent Solutions!
2016 National Healthcare
Retention & RN Staffing Report
Published by: NSI Nursing Solutions, Inc.
www.nsinursingsolutions.com.
© NSI Nursing Solutions, Inc 2016 Nursing Solutions, Inc.
Preface
We are proud to present the annual National Healthcare Retention and RN Staffing Report. In
January, 2016, NSI Nursing Solutions Inc., the industry leader in high volume recruitment for
American experienced nurses, invited hospitals all across the country to participate in the nation’s
most comprehensive survey on hospital turnover, retention programs & their strategic value,
nurse vacancy and recruitment metrics.
Healthcare is the shining light in the jobs market where demand for nurses and allied
professionals continues to outpace the market. As competition for these key contributors heats
up, hospitals will need to be creative in their talent acquisition efforts and in protecting their
human capital investment.
At The Retention Institute at NSI Nursing Solutions, we provide industry insight to help you
benchmark performance, identify best practices and understand emerging trends. We sincerely
extend our appreciation to all 138 facilities which participated and have helped to make this
report possible. Your feedback and suggestions were encouraging and valuable. As promised, all
information is provided in the aggregate to maintain the confidential and sensitive nature of the
data provided.
Should you have any questions or recommendations on expanding the scope or depth of this
survey, please feel free to contact me at [email protected]. We request your
participation in future studies conducted by The Retention Institute at NSI Nursing Solutions.
Brian Colosi, BA, MBA, SPHR
NSI Nursing Solutions, Inc.
President
March 2016
About NSI Nursing Solutions, Inc.
NSI Nursing Solutions, Inc. is a national high volume nurse recruitment and retention firm.
We only recruit U.S. experienced RNs (averaging 14 years) as your employees, who fit your
culture, and do so in an average time-to-fill of 34 days. At NSI, we provide an industry leading
one (1) year guarantee and the best part is that our services are risk-free… since you must hire the
nurses before we are paid.
We have helped many clients and can help you! I encourage you to call Michael at (717) 560-
3863 to learn how NSI can improve your bottom line results.
i
© NSI Nursing Solutions, Inc 2016 Nursing Solutions, Inc.
Table of Contents
Executive Summary 1
Overview of Survey Participants 2
Survey Findings – Hospital Turnover 4
Survey Findings – RN Vacancy 6
Survey Findings – RN Recruitment Difficulty Index 7
Survey Findings – Bedside RN Turnover 8
Survey Findings – RN Turnover by Specialty 10
Survey Findings – Advanced Practice and Allied Health Turnover 11
Survey Findings – Turnover by Tenure 12
Conclusion 13
ii
© NSI Nursing Solutions, Inc 2016 Nursing Solutions, Inc.
Executive Summary
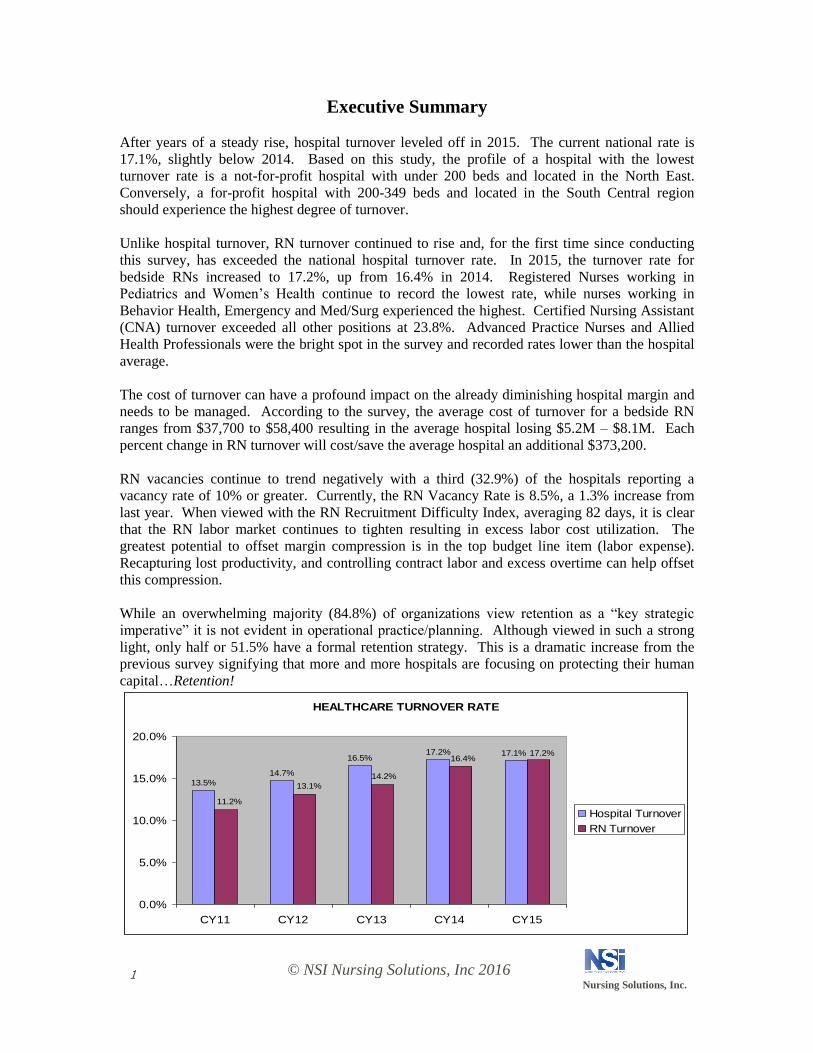
After years of a steady rise, hospital turnover leveled off in 2015. The current national rate is
17.1%, slightly below 2014. Based on this study, the profile of a hospital with the lowest
turnover rate is a not-for-profit hospital with under 200 beds and located in the North East.
Conversely, a for-profit hospital with 200-349 beds and located in the South Central region
should experience the highest degree of turnover.
Unlike hospital turnover, RN turnover continued to rise and, for the first time since conducting
this survey, has exceeded the national hospital turnover rate. In 2015, the turnover rate for
bedside RNs increased to 17.2%, up from 16.4% in 2014. Registered Nurses working in
Pediatrics and Women’s Health continue to record the lowest rate, while nurses working in
Behavior Health, Emergency and Med/Surg experienced the highest. Certified Nursing Assistant
(CNA) turnover exceeded all other positions at 23.8%. Advanced Practice Nurses and Allied
Health Professionals were the bright spot in the survey and recorded rates lower than the hospital
average.
The cost of turnover can have a profound impact on the already diminishing hospital margin and
needs to be managed. According to the survey, the average cost of turnover for a bedside RN
ranges from $37,700 to $58,400 resulting in the average hospital losing $5.2M – $8.1M. Each
percent change in RN turnover will cost/save the average hospital an additional $373,200.
RN vacancies continue to trend negatively with a third (32.9%) of the hospitals reporting a
vacancy rate of 10% or greater. Currently, the RN Vacancy Rate is 8.5%, a 1.3% increase from
last year. When viewed with the RN Recruitment Difficulty Index, averaging 82 days, it is clear
that the RN labor market continues to tighten resulting in excess labor cost utilization. The
greatest potential to offset margin compression is in the top budget line item (labor expense).
Recapturing lost productivity, and controlling contract labor and excess overtime can help offset
this compression.
While an overwhelming majority (84.8%) of organizations view retention as a “key strategic
imperative” it is not evident in operational practice/planning. Although viewed in such a strong
light, only half or 51.5% have a formal retention strategy. This is a dramatic increase from the
previous survey signifying that more and more hospitals are focusing on protecting their human
capital…Retention!
HEALTHCARE TURNOVER RATE
13.5%
14.7%
16.5%17.2% 17.1% 17.2%
16.4%
14.2%
13.1%
11.2%
0.0%
5.0%
10.0%
15.0%
20.0%
CY11 CY12 CY13 CY14 CY15
Hospital Turnover
RN Turnover
1
© NSI Nursing Solutions, Inc 2016 Nursing Solutions, Inc.
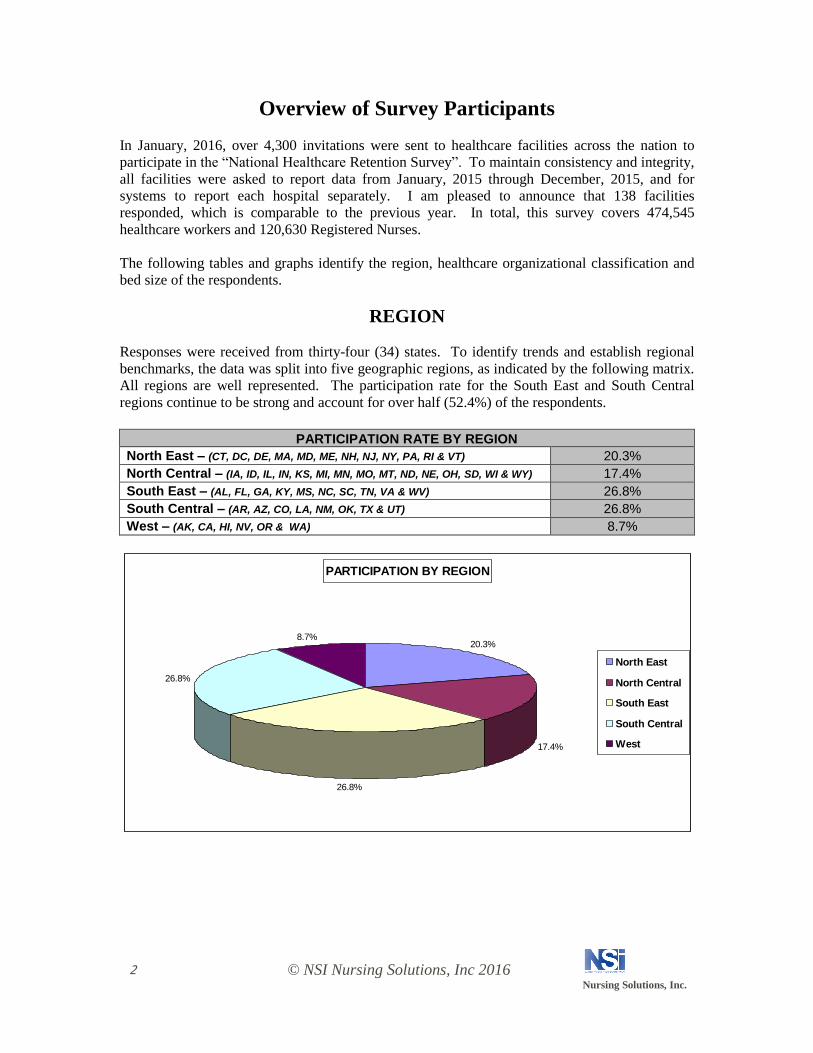
Overview of Survey Participants
In January, 2016, over 4,300 invitations were sent to healthcare facilities across the nation to
participate in the “National Healthcare Retention Survey”. To maintain consistency and integrity,
all facilities were asked to report data from January, 2015 through December, 2015, and for
systems to report each hospital separately. I am pleased to announce that 138 facilities
responded, which is comparable to the previous year. In total, this survey covers 474,545
healthcare workers and 120,630 Registered Nurses.
The following tables and graphs identify the region, healthcare organizational classification and
bed size of the respondents.
REGION
Responses were received from thirty-four (34) states. To identify trends and establish regional
benchmarks, the data was split into five geographic regions, as indicated by the following matrix.
All regions are well represented. The participation rate for the South East and South Central
regions continue to be strong and account for over half (52.4%) of the respondents.
PARTICIPATION RATE BY REGION
North East – (CT, DC, DE, MA, MD, ME, NH, NJ, NY, PA, RI & VT) 20.3%
North Central – (IA, ID, IL, IN, KS, MI, MN, MO, MT, ND, NE, OH, SD, WI & WY) 17.4%
South East – (AL, FL, GA, KY, MS, NC, SC, TN, VA & WV) 26.8%
South Central – (AR, AZ, CO, LA, NM, OK, TX & UT) 26.8%
West – (AK, CA, HI, NV, OR & WA) 8.7%
PARTICIPATION BY REGION
20.3%
17.4%
26.8%
26.8%
8.7%
North East
North Central
South East
South Central
West
2
© NSI Nursing Solutions, Inc 2016 Nursing Solutions, Inc.
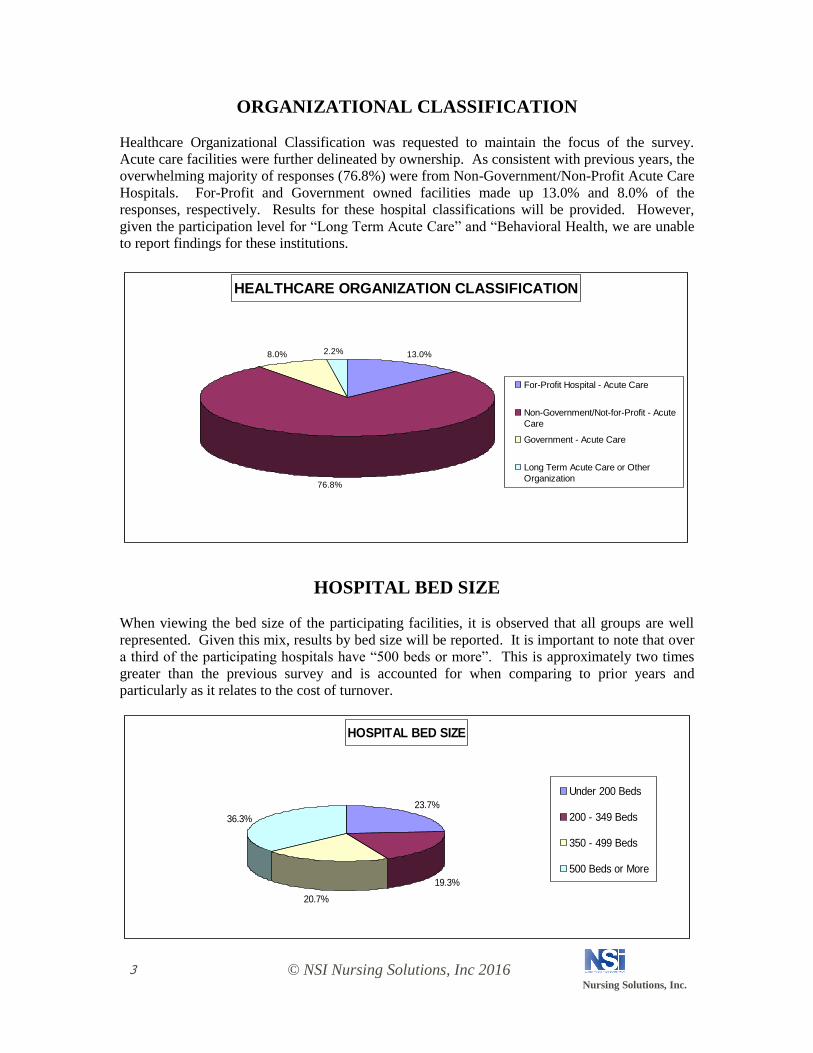
ORGANIZATIONAL CLASSIFICATION
Healthcare Organizational Classification was requested to maintain the focus of the survey.
Acute care facilities were further delineated by ownership. As consistent with previous years, the
overwhelming majority of responses (76.8%) were from Non-Government/Non-Profit Acute Care
Hospitals. For-Profit and Government owned facilities made up 13.0% and 8.0% of the
responses, respectively. Results for these hospital classifications will be provided. However,
given the participation level for “Long Term Acute Care” and “Behavioral Health, we are unable
to report findings for these institutions.
HEALTHCARE ORGANIZATION CLASSIFICATION
13.0%
76.8%
8.0% 2.2%
For-Profit Hospital - Acute Care
Non-Government/Not-for-Profit - Acute
Care
Government - Acute Care
Long Term Acute Care or Other
Organization
HOSPITAL BED SIZE
When viewing the bed size of the participating facilities, it is observed that all groups are well
represented. Given this mix, results by bed size will be reported. It is important to note that over
a third of the participating hospitals have “500 beds or more”. This is approximately two times
greater than the previous survey and is accounted for when comparing to prior years and
particularly as it relates to the cost of turnover.
HOSPITAL BED SIZE
23.7%
19.3%
20.7%
36.3%
Under 200 Beds
200 - 349 Beds
350 - 499 Beds
500 Beds or More
3
© NSI Nursing Solutions, Inc 2016 Nursing Solutions, Inc.
Survey Findings - TURNOVER
This section records the results of the survey. All findings are reported in the aggregate, with no
individual hospital identifying information provided. Since organizations track and report
turnover differently, it is important to establish a consistent methodology. To this end, raw data
was collected on all employee terminations, whether voluntary or involuntary. Temporary,
agency and travel staff were specifically excluded. Also, this survey does not measure “internal
terminations” or transfers.
According to the findings, hospitals continue to be split on which employment classifications are
included when calculating turnover. By a slight majority, 51.4% of hospitals include all
employment classifications, such as full time, part time, per diem, prn, casual, occasional, etc.
when reporting turnover. The remaining hospitals only include full time and part time
employment classifications when reporting turnover. Given this even split, respondents provided
data on all employees and for full/part time staff only. For comparative purposes, we will adjust
for this distinction and report “TOTAL Turnover”, which includes all employee classifications,
and we will report “FULL/PART TIME Turnover”, which only includes these two classifications.
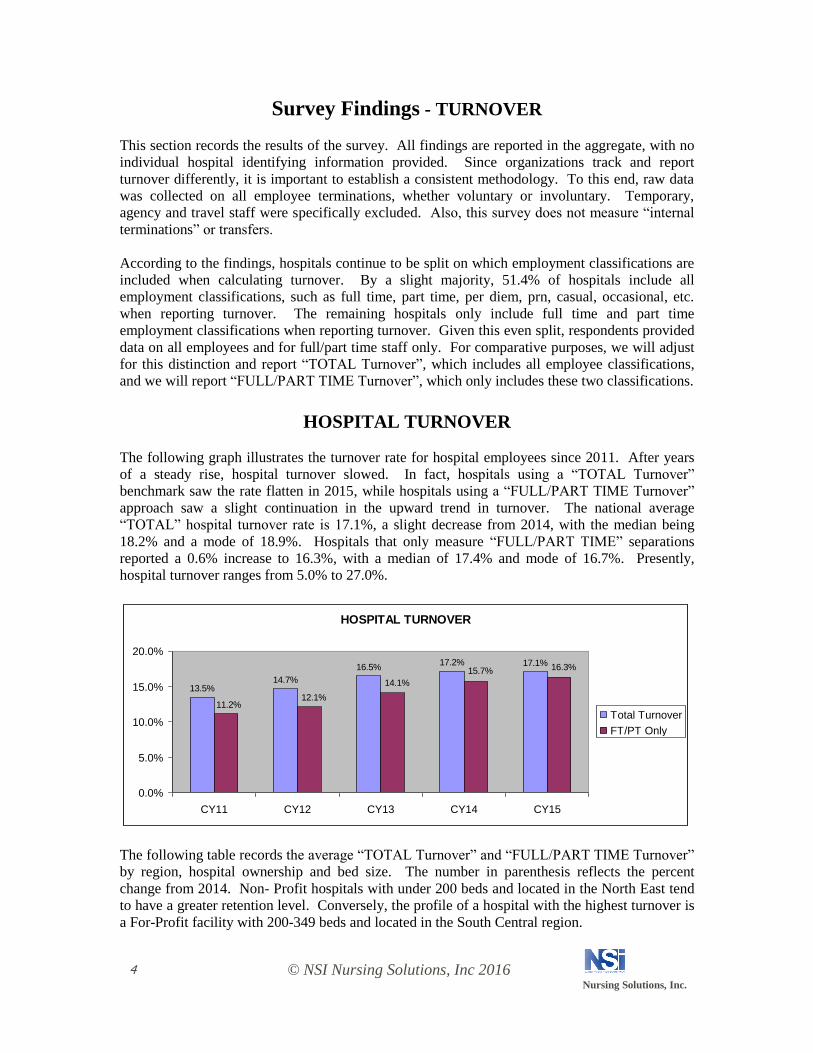
HOSPITAL TURNOVER
The following graph illustrates the turnover rate for hospital employees since 2011. After years
of a steady rise, hospital turnover slowed. In fact, hospitals using a “TOTAL Turnover”
benchmark saw the rate flatten in 2015, while hospitals using a “FULL/PART TIME Turnover”
approach saw a slight continuation in the upward trend in turnover. The national average
“TOTAL” hospital turnover rate is 17.1%, a slight decrease from 2014, with the median being
18.2% and a mode of 18.9%. Hospitals that only measure “FULL/PART TIME” separations
reported a 0.6% increase to 16.3%, with a median of 17.4% and mode of 16.7%. Presently,
hospital turnover ranges from 5.0% to 27.0%.
HOSPITAL TURNOVER
13.5%14.7%
16.5%17.2% 17.1% 16.3%15.7%
14.1%
12.1%11.2%
0.0%
5.0%
10.0%
15.0%
20.0%
CY11 CY12 CY13 CY14 CY15
Total Turnover
FT/PT Only
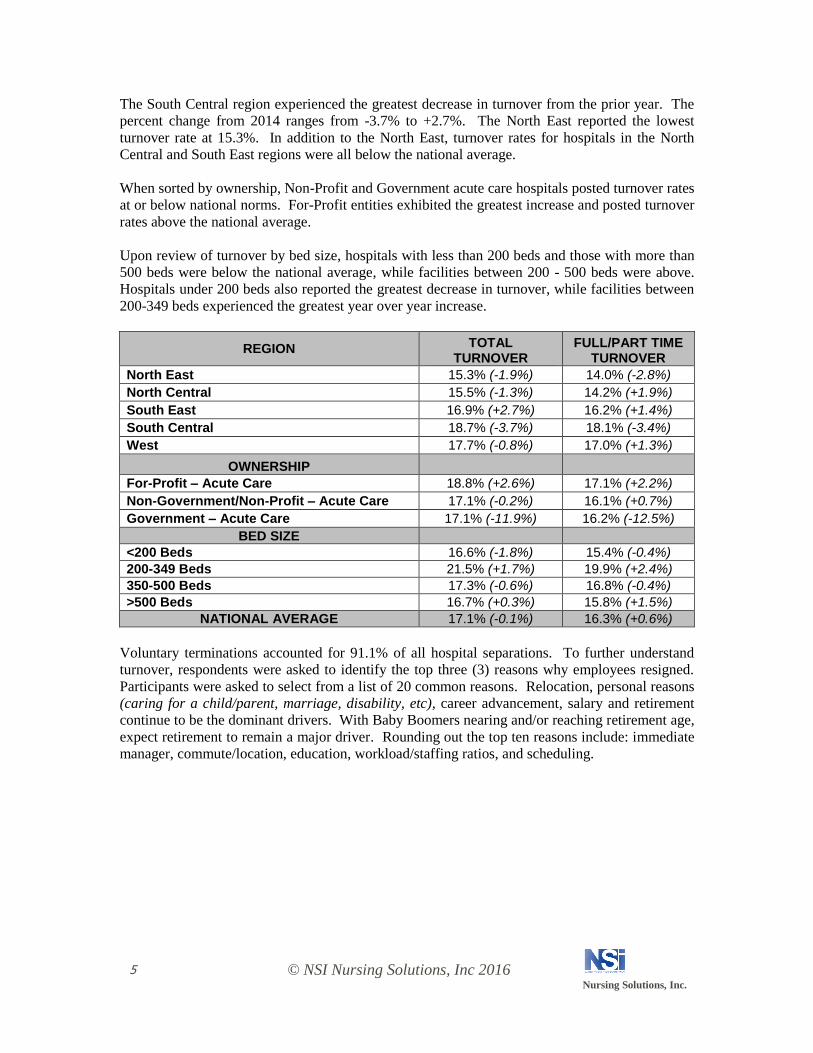
The following table records the average “TOTAL Turnover” and “FULL/PART TIME Turnover”
by region, hospital ownership and bed size. The number in parenthesis reflects the percent
change from 2014. Non- Profit hospitals with under 200 beds and located in the North East tend
to have a greater retention level. Conversely, the profile of a hospital with the highest turnover is
a For-Profit facility with 200-349 beds and located in the South Central region.
4
© NSI Nursing Solutions, Inc 2016 Nursing Solutions, Inc.
The South Central region experienced the greatest decrease in turnover from the prior year. The
percent change from 2014 ranges from -3.7% to +2.7%. The North East reported the lowest
turnover rate at 15.3%. In addition to the North East, turnover rates for hospitals in the North
Central and South East regions were all below the national average.
When sorted by ownership, Non-Profit and Government acute care hospitals posted turnover rates
at or below national norms. For-Profit entities exhibited the greatest increase and posted turnover
rates above the national average.
Upon review of turnover by bed size, hospitals with less than 200 beds and those with more than
500 beds were below the national average, while facilities between 200 - 500 beds were above.
Hospitals under 200 beds also reported the greatest decrease in turnover, while facilities between
200-349 beds experienced the greatest year over year increase.
REGION TOTAL TURNOVER
FULL/PART TIME TURNOVER
North East 15.3% (-1.9%) 14.0% (-2.8%)
North Central 15.5% (-1.3%) 14.2% (+1.9%)
South East 16.9% (+2.7%) 16.2% (+1.4%)
South Central 18.7% (-3.7%) 18.1% (-3.4%)
West 17.7% (-0.8%) 17.0% (+1.3%)
OWNERSHIP
For-Profit – Acute Care 18.8% (+2.6%) 17.1% (+2.2%)
Non-Government/Non-Profit – Acute Care 17.1% (-0.2%) 16.1% (+0.7%)
Government – Acute Care 17.1% (-11.9%) 16.2% (-12.5%)
BED SIZE
<200 Beds 16.6% (-1.8%) 15.4% (-0.4%)
200-349 Beds 21.5% (+1.7%) 19.9% (+2.4%)
350-500 Beds 17.3% (-0.6%) 16.8% (-0.4%)
>500 Beds 16.7% (+0.3%) 15.8% (+1.5%)
NATIONAL AVERAGE 17.1% (-0.1%) 16.3% (+0.6%)
Voluntary terminations accounted for 91.1% of all hospital separations. To further understand
turnover, respondents were asked to identify the top three (3) reasons why employees resigned.
Participants were asked to select from a list of 20 common reasons. Relocation, personal reasons
(caring for a child/parent, marriage, disability, etc), career advancement, salary and retirement
continue to be the dominant drivers. With Baby Boomers nearing and/or reaching retirement age,
expect retirement to remain a major driver. Rounding out the top ten reasons include: immediate
manager, commute/location, education, workload/staffing ratios, and scheduling.
5
© NSI Nursing Solutions, Inc 2016 Nursing Solutions, Inc.
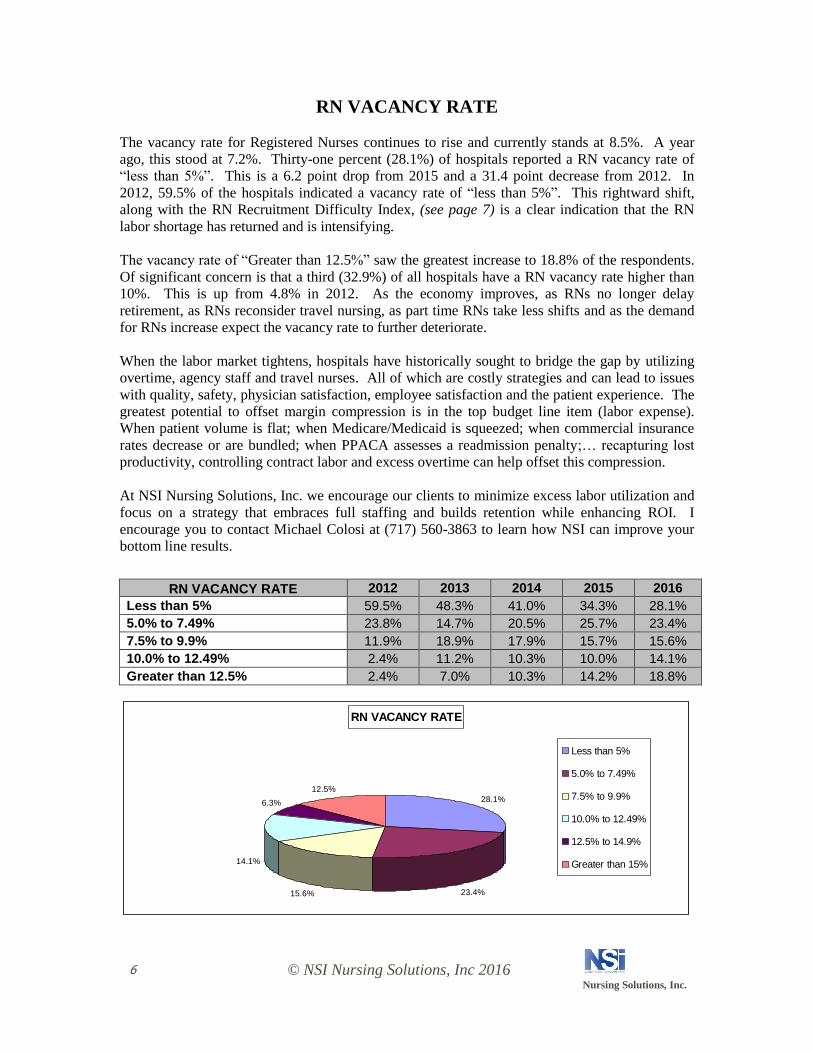
RN VACANCY RATE
The vacancy rate for Registered Nurses continues to rise and currently stands at 8.5%. A year
ago, this stood at 7.2%. Thirty-one percent (28.1%) of hospitals reported a RN vacancy rate of
“less than 5%”. This is a 6.2 point drop from 2015 and a 31.4 point decrease from 2012. In
2012, 59.5% of the hospitals indicated a vacancy rate of “less than 5%”. This rightward shift,
along with the RN Recruitment Difficulty Index, (see page 7) is a clear indication that the RN
labor shortage has returned and is intensifying.
The vacancy rate of “Greater than 12.5%” saw the greatest increase to 18.8% of the respondents.
Of significant concern is that a third (32.9%) of all hospitals have a RN vacancy rate higher than
10%. This is up from 4.8% in 2012. As the economy improves, as RNs no longer delay
retirement, as RNs reconsider travel nursing, as part time RNs take less shifts and as the demand
for RNs increase expect the vacancy rate to further deteriorate.
When the labor market tightens, hospitals have historically sought to bridge the gap by utilizing
overtime, agency staff and travel nurses. All of which are costly strategies and can lead to issues
with quality, safety, physician satisfaction, employee satisfaction and the patient experience. The
greatest potential to offset margin compression is in the top budget line item (labor expense).
When patient volume is flat; when Medicare/Medicaid is squeezed; when commercial insurance
rates decrease or are bundled; when PPACA assesses a readmission penalty;… recapturing lost
productivity, controlling contract labor and excess overtime can help offset this compression.
At NSI Nursing Solutions, Inc. we encourage our clients to minimize excess labor utilization and
focus on a strategy that embraces full staffing and builds retention while enhancing ROI. I
encourage you to contact Michael Colosi at (717) 560-3863 to learn how NSI can improve your
bottom line results.
RN VACANCY RATE 2012 2013 2014 2015 2016
Less than 5% 59.5% 48.3% 41.0% 34.3% 28.1%
5.0% to 7.49% 23.8% 14.7% 20.5% 25.7% 23.4%
7.5% to 9.9% 11.9% 18.9% 17.9% 15.7% 15.6%
10.0% to 12.49% 2.4% 11.2% 10.3% 10.0% 14.1%
Greater than 12.5% 2.4% 7.0% 10.3% 14.2% 18.8%
RN VACANCY RATE
28.1%
23.4%15.6%
14.1%
6.3%
12.5%
Less than 5%
5.0% to 7.49%
7.5% to 9.9%
10.0% to 12.49%
12.5% to 14.9%
Greater than 15%
6
© NSI Nursing Solutions, Inc 2016 Nursing Solutions, Inc.
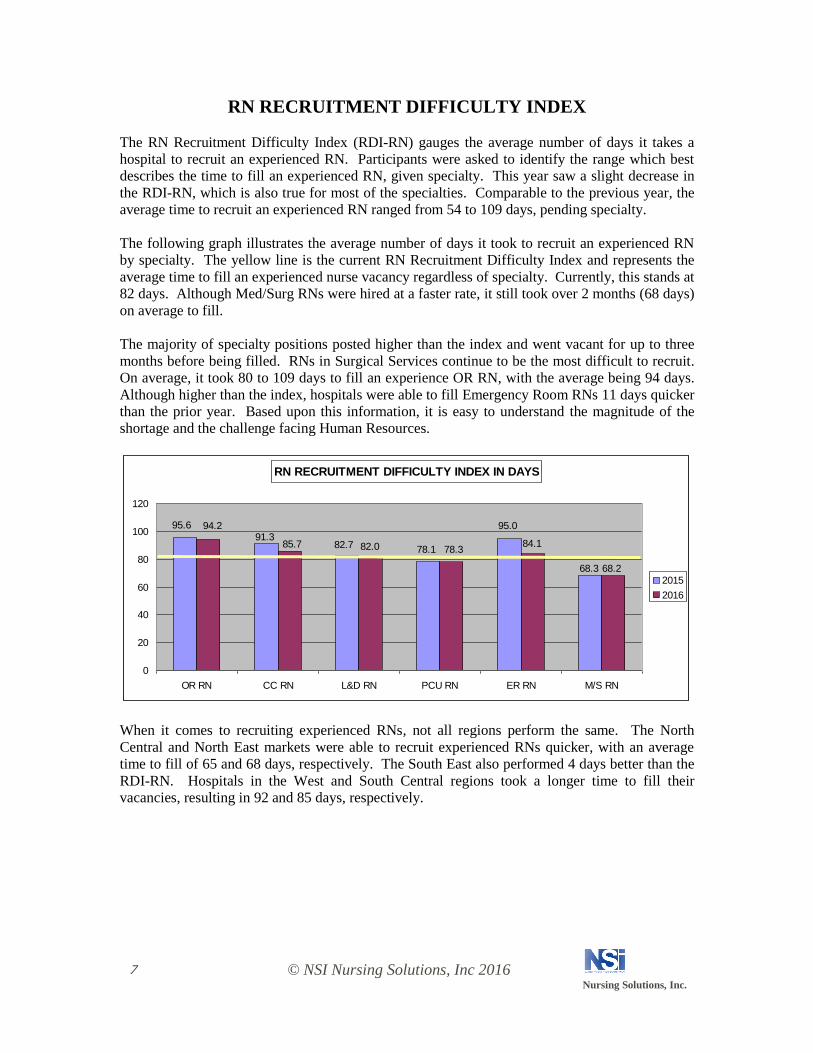
RN RECRUITMENT DIFFICULTY INDEX
The RN Recruitment Difficulty Index (RDI-RN) gauges the average number of days it takes a
hospital to recruit an experienced RN. Participants were asked to identify the range which best
describes the time to fill an experienced RN, given specialty. This year saw a slight decrease in
the RDI-RN, which is also true for most of the specialties. Comparable to the previous year, the
average time to recruit an experienced RN ranged from 54 to 109 days, pending specialty.
The following graph illustrates the average number of days it took to recruit an experienced RN
by specialty. The yellow line is the current RN Recruitment Difficulty Index and represents the
average time to fill an experienced nurse vacancy regardless of specialty. Currently, this stands at
82 days. Although Med/Surg RNs were hired at a faster rate, it still took over 2 months (68 days)
on average to fill.
The majority of specialty positions posted higher than the index and went vacant for up to three
months before being filled. RNs in Surgical Services continue to be the most difficult to recruit.
On average, it took 80 to 109 days to fill an experience OR RN, with the average being 94 days.
Although higher than the index, hospitals were able to fill Emergency Room RNs 11 days quicker
than the prior year. Based upon this information, it is easy to understand the magnitude of the
shortage and the challenge facing Human Resources.
RN RECRUITMENT DIFFICULTY INDEX IN DAYS
82.0 84.1
95.0
68.3
91.382.7
78.1
95.6
68.2
78.385.7
94.2
0
20
40
60
80
100
120
OR RN CC RN L&D RN PCU RN ER RN M/S RN
2015
2016
When it comes to recruiting experienced RNs, not all regions perform the same. The North
Central and North East markets were able to recruit experienced RNs quicker, with an average
time to fill of 65 and 68 days, respectively. The South East also performed 4 days better than the
RDI-RN. Hospitals in the West and South Central regions took a longer time to fill their
vacancies, resulting in 92 and 85 days, respectively.
7
© NSI Nursing Solutions, Inc 2016 Nursing Solutions, Inc.
BEDSIDE REGISTERED NURSE TURNOVER
This section will follow the same format as “Hospital Turnover”. The following graph illustrates
the turnover range for bedside RNs since 2011. Last year saw a continuation in the upward trend
in RN turnover and for the first time, since conducting this survey, RN turnover has exceeded the
hospital average. This upward trend has not let up and is expected to continue, signifying a
further tightening of the RN labor market.
Currently, turnover for bedside RNs ranges from 8.8% to 37.0%. The national average “TOTAL”
RN turnover rate is 17.2%, a 0.8% increase from 2014, with the median being 16.9% and a mode
of 17.8%. Hospitals that only measure “FULL/PART TIME” separations reported a 1.8%
increase to 15.8%, with a median of 16.2% and a mode of 14.3%.
RN TURNOVER
11.2%
13.1%14.2%
16.4%17.2%
15.8%
14.0%12.5%
9.5%8.7%
0.0%
5.0%
10.0%
15.0%
20.0%
CY11 CY12 CY13 CY14 CY15
Total Turnover
FT/PT Only
The cost of turnover can have a profound impact on the already diminishing hospital margin. The
overwhelming majority (91%) do not track this cost. Based upon feedback, the average cost of
turnover for a bedside RN ranges from $37,700 to $58,400 resulting in the average hospital losing
$6.6M. RN turnover will cost a hospital from $5.2M – $8.1M. Each percent change in RN
turnover will cost the average hospital an additional $373,200. Whereas the cost of turnover can
range to two times annual salary for professional positions, this conservative figure represents a
tremendous drain on profit.
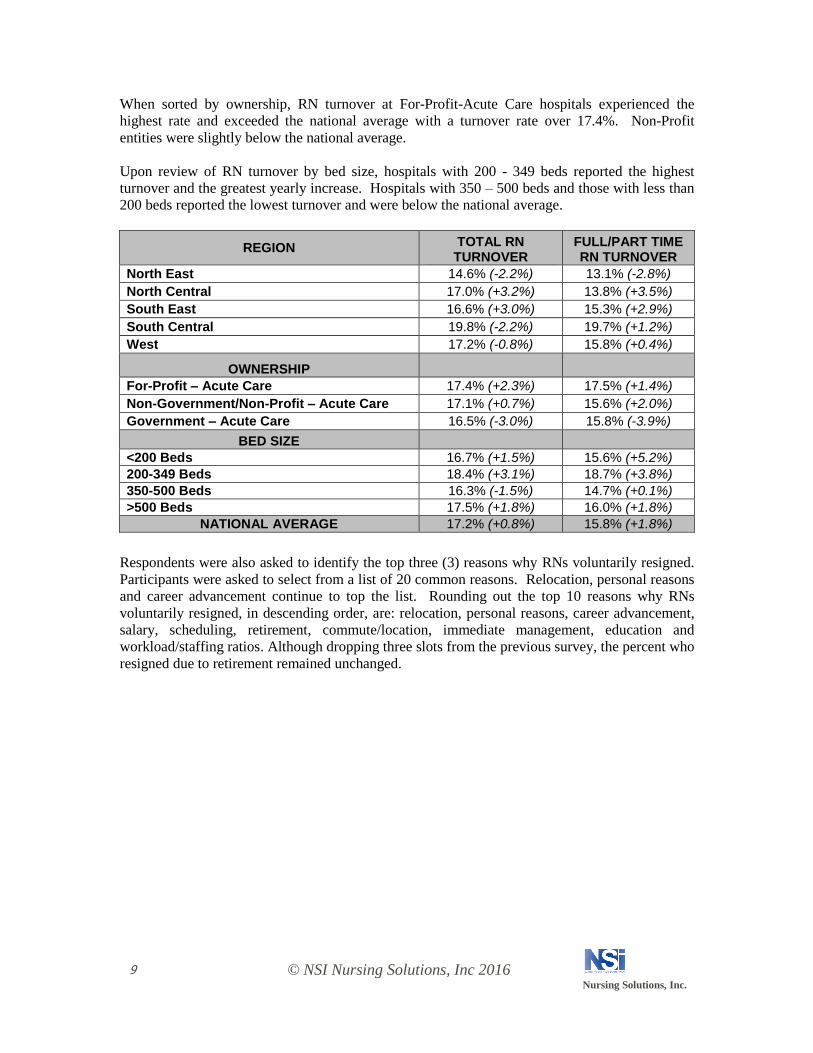
The following table records the average “TOTAL” and “FULL/PART TIME” turnover by region,
hospital ownership and bed size for staff RNs. The number in parenthesis reflects the percent
change from 2014. From a national perspective, “Total RN” turnover increased to 17.2%, while
“Full/Part Time RN” turnover increased to 15.8%. Hospitals located in the North East and with
350 - 500 beds experienced the lowest turnover. The profile of a hospital with the greatest RN
turnover is a For-Profit hospital with 200 – 349 beds and located in the South Central region.
Compared to the previous survey, the North East region realized the greatest decrease in turnover,
while the North Central reported the highest increase. Both of these regions, along with the South
East, are below the national average, while the West mirrors the nation. The South Central
continues to experience the highest RN turnover rate and is the only region above the national
average.
8
© NSI Nursing Solutions, Inc 2016 Nursing Solutions, Inc.
When sorted by ownership, RN turnover at For-Profit-Acute Care hospitals experienced the
highest rate and exceeded the national average with a turnover rate over 17.4%. Non-Profit
entities were slightly below the national average.
Upon review of RN turnover by bed size, hospitals with 200 - 349 beds reported the highest
turnover and the greatest yearly increase. Hospitals with 350 – 500 beds and those with less than
200 beds reported the lowest turnover and were below the national average.
REGION TOTAL RN TURNOVER
FULL/PART TIME RN TURNOVER
North East 14.6% (-2.2%) 13.1% (-2.8%)
North Central 17.0% (+3.2%) 13.8% (+3.5%)
South East 16.6% (+3.0%) 15.3% (+2.9%)
South Central 19.8% (-2.2%) 19.7% (+1.2%)
West 17.2% (-0.8%) 15.8% (+0.4%)
OWNERSHIP
For-Profit – Acute Care 17.4% (+2.3%) 17.5% (+1.4%)
Non-Government/Non-Profit – Acute Care 17.1% (+0.7%) 15.6% (+2.0%)
Government – Acute Care 16.5% (-3.0%) 15.8% (-3.9%)
BED SIZE
<200 Beds 16.7% (+1.5%) 15.6% (+5.2%)
200-349 Beds 18.4% (+3.1%) 18.7% (+3.8%)
350-500 Beds 16.3% (-1.5%) 14.7% (+0.1%)
>500 Beds 17.5% (+1.8%) 16.0% (+1.8%)
NATIONAL AVERAGE 17.2% (+0.8%) 15.8% (+1.8%)
Respondents were also asked to identify the top three (3) reasons why RNs voluntarily resigned.
Participants were asked to select from a list of 20 common reasons. Relocation, personal reasons
and career advancement continue to top the list. Rounding out the top 10 reasons why RNs
voluntarily resigned, in descending order, are: relocation, personal reasons, career advancement,
salary, scheduling, retirement, commute/location, immediate management, education and
workload/staffing ratios. Although dropping three slots from the previous survey, the percent who
resigned due to retirement remained unchanged.
9
© NSI Nursing Solutions, Inc 2016 Nursing Solutions, Inc.
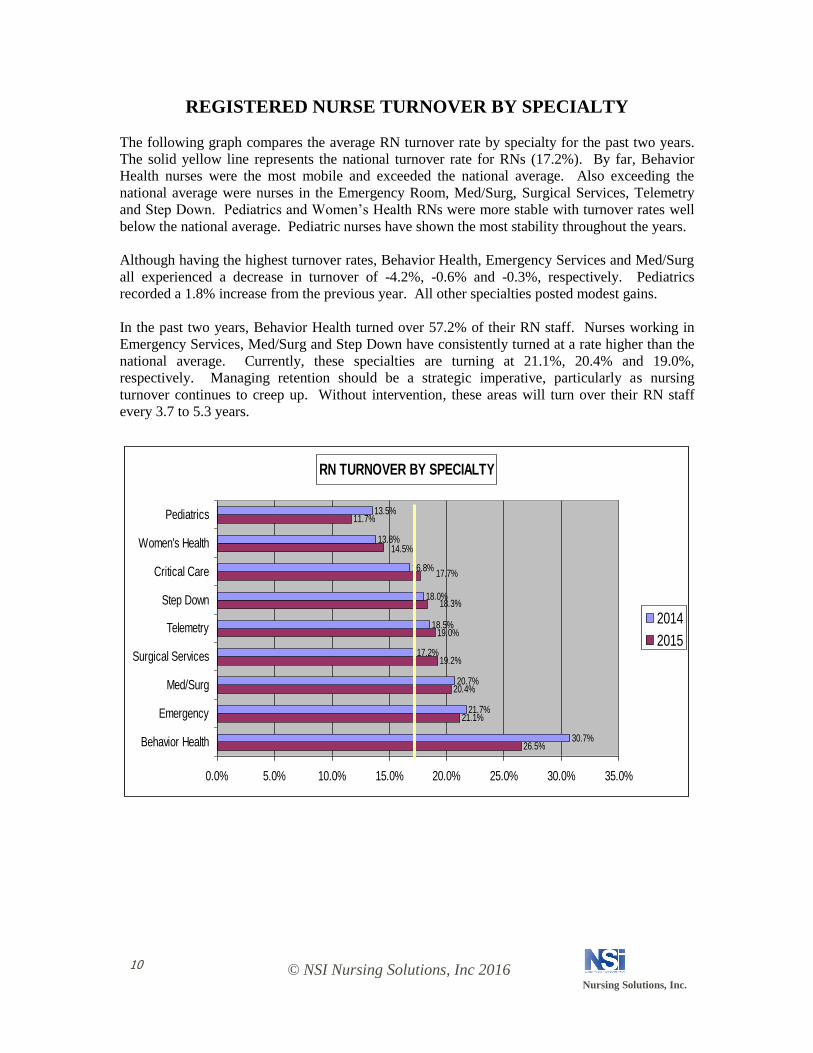
REGISTERED NURSE TURNOVER BY SPECIALTY
The following graph compares the average RN turnover rate by specialty for the past two years.
The solid yellow line represents the national turnover rate for RNs (17.2%). By far, Behavior
Health nurses were the most mobile and exceeded the national average. Also exceeding the
national average were nurses in the Emergency Room, Med/Surg, Surgical Services, Telemetry
and Step Down. Pediatrics and Women’s Health RNs were more stable with turnover rates well
below the national average. Pediatric nurses have shown the most stability throughout the years.
Although having the highest turnover rates, Behavior Health, Emergency Services and Med/Surg
all experienced a decrease in turnover of -4.2%, -0.6% and -0.3%, respectively. Pediatrics
recorded a 1.8% increase from the previous year. All other specialties posted modest gains.
In the past two years, Behavior Health turned over 57.2% of their RN staff. Nurses working in
Emergency Services, Med/Surg and Step Down have consistently turned at a rate higher than the
national average. Currently, these specialties are turning at 21.1%, 20.4% and 19.0%,
respectively. Managing retention should be a strategic imperative, particularly as nursing
turnover continues to creep up. Without intervention, these areas will turn over their RN staff
every 3.7 to 5.3 years.
RN TURNOVER BY SPECIALTY
26.5%
21.1%
20.4%
19.2%
19.0%
11.7%
30.7%
21.7%
20.7%
17.2%
18.5%
18.0%
16.8%
13.8%
13.5%
18.3%
17.7%
14.5%
0.0% 5.0% 10.0% 15.0% 20.0% 25.0% 30.0% 35.0%
Behavior Health
Emergency
Med/Surg
Surgical Services
Telemetry
Step Down
Critical Care
Women's Health
Pediatrics
2014
2015
10
© NSI Nursing Solutions, Inc 2016 Nursing Solutions, Inc.
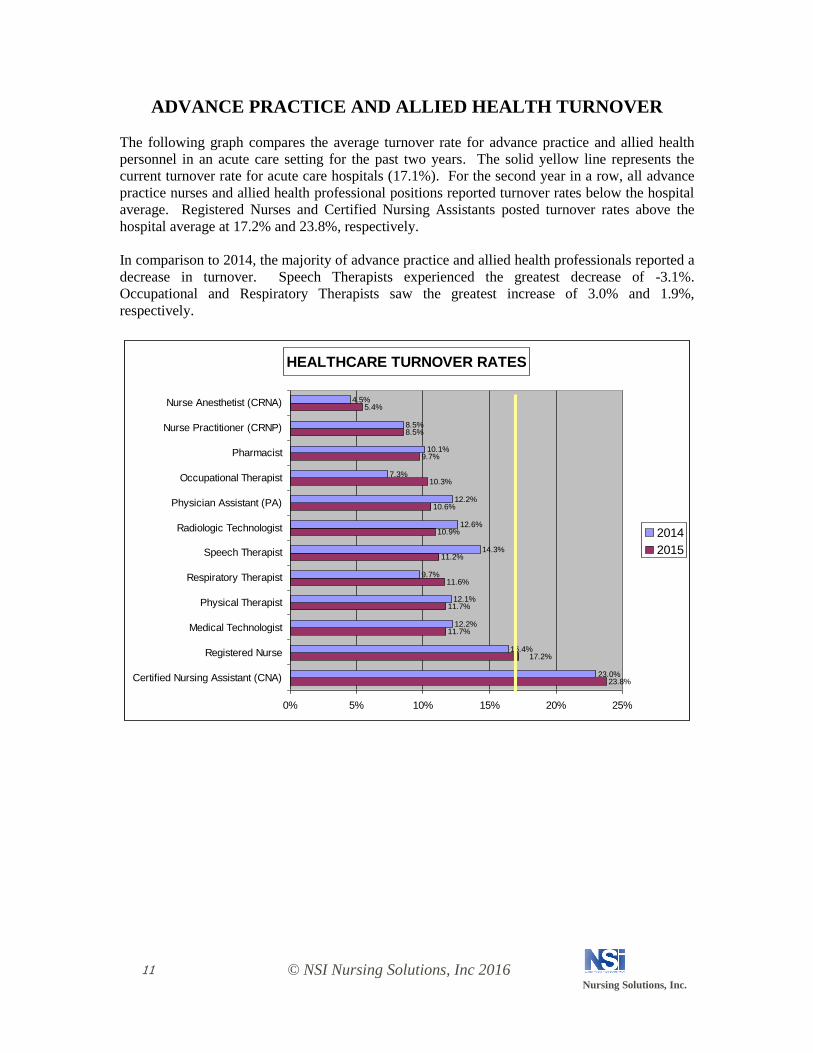
ADVANCE PRACTICE AND ALLIED HEALTH TURNOVER
The following graph compares the average turnover rate for advance practice and allied health
personnel in an acute care setting for the past two years. The solid yellow line represents the
current turnover rate for acute care hospitals (17.1%). For the second year in a row, all advance
practice nurses and allied health professional positions reported turnover rates below the hospital
average. Registered Nurses and Certified Nursing Assistants posted turnover rates above the
hospital average at 17.2% and 23.8%, respectively.
In comparison to 2014, the majority of advance practice and allied health professionals reported a
decrease in turnover. Speech Therapists experienced the greatest decrease of -3.1%.
Occupational and Respiratory Therapists saw the greatest increase of 3.0% and 1.9%,
respectively.
HEALTHCARE TURNOVER RATES
23.8%
11.7%
11.7%
11.6%
11.2%
10.9%
10.6%
10.3%
9.7%
8.5%
5.4%
23.0%
16.4%
12.2%
12.1%
9.7%
14.3%
12.6%
12.2%
7.3%
10.1%
8.5%
4.5%
17.2%
0% 5% 10% 15% 20% 25%
Certified Nursing Assistant (CNA)
Registered Nurse
Medical Technologist
Physical Therapist
Respiratory Therapist
Speech Therapist
Radiologic Technologist
Physician Assistant (PA)
Occupational Therapist
Pharmacist
Nurse Practitioner (CRNP)
Nurse Anesthetist (CRNA)
2014
2015
1110
© NSI Nursing Solutions, Inc 2016 Nursing Solutions, Inc.
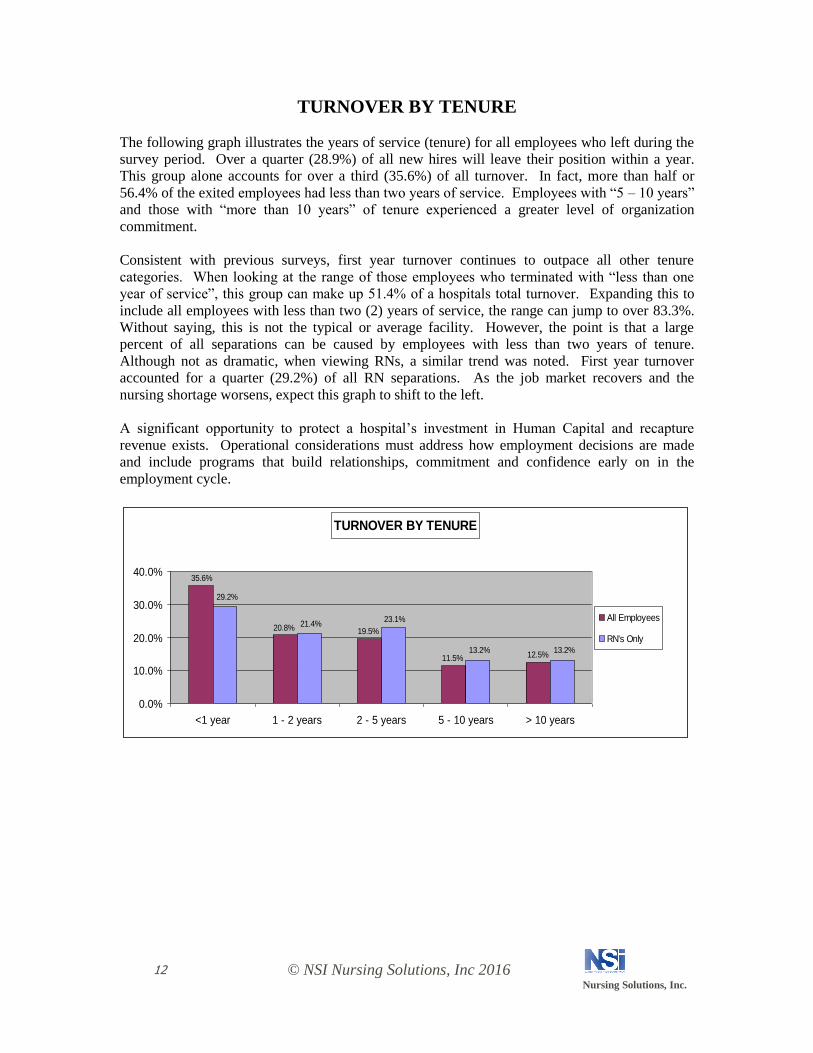
TURNOVER BY TENURE
The following graph illustrates the years of service (tenure) for all employees who left during the
survey period. Over a quarter (28.9%) of all new hires will leave their position within a year.
This group alone accounts for over a third (35.6%) of all turnover. In fact, more than half or
56.4% of the exited employees had less than two years of service. Employees with “5 – 10 years”
and those with “more than 10 years” of tenure experienced a greater level of organization
commitment.
Consistent with previous surveys, first year turnover continues to outpace all other tenure
categories. When looking at the range of those employees who terminated with “less than one
year of service”, this group can make up 51.4% of a hospitals total turnover. Expanding this to
include all employees with less than two (2) years of service, the range can jump to over 83.3%.
Without saying, this is not the typical or average facility. However, the point is that a large
percent of all separations can be caused by employees with less than two years of tenure.
Although not as dramatic, when viewing RNs, a similar trend was noted. First year turnover
accounted for a quarter (29.2%) of all RN separations. As the job market recovers and the
nursing shortage worsens, expect this graph to shift to the left.
A significant opportunity to protect a hospital’s investment in Human Capital and recapture
revenue exists. Operational considerations must address how employment decisions are made
and include programs that build relationships, commitment and confidence early on in the
employment cycle.
TURNOVER BY TENURE
12.5%11.5%
19.5%20.8%
35.6%
13.2%13.2%
23.1%21.4%
29.2%
0.0%
10.0%
20.0%
30.0%
40.0%
<1 year 1 - 2 years 2 - 5 years 5 - 10 years > 10 years
All Employees
RN's Only
1210
© NSI Nursing Solutions, Inc 2016 Nursing Solutions, Inc.
Conclusion
The healthcare industry is experiencing a paradigm shift. The expanding healthcare rolls, the
aging population, the mandate on quality & safety, the squeeze in reimbursements, the
competition for patient volume, the shift in the delivery of care, the shortage of physicians, nurses
& allied professionals, and the PPACA are all stressing the industry.
In this flux state, the labor force has responded. 2015 saw mixed results. Hospital turnover
leveled off, while RN turnover continued to rise, exceeding the hospital average. Healthcare
workers have become more mobile and as the labor market expands expect retention rates to
further deteriorate. Compounded by the RN Recruitment Difficulty Index, CNOs and CHROs
will experience even higher RN vacancy rates. Each of which are a drain on hospital resources
and the already diminishing margin. A bright spot in the survey was the higher commitment level
for advance practice RNs and allied health professionals.
The value hospitals place on their people will have a direct correlation to their commitment,
confidence and engagement. Enhancing culture and building programs to reinforce these values
is critical to driving retention. Hospitals believe that retention is a “key strategic imperative”, yet
are slow to translate this into a formal strategic plan. Focus on strategies that enhance culture and
eliminate those that do not.
To strengthen the bottom line, hospitals need to build retention capacity, manage vacancy rates,
bolster recruitment initiatives and control labor expenses. Breaking through the myopic ways of
hiring travel and agency staff to band-aid the issue or utilizing excessive overtime which taxes the
staff, the quality and the patient experience is a start. Building and retaining a quality workforce
is paramount to navigate the shifting paradigm. NSI Nursing Solutions, Inc can help.
CLOSE
13