2016 odot sustainability progress report documents/odot... · 2020-01-22 · 2016 odot...
TRANSCRIPT
SUSTAINABILITY
2016 ODOT Sustainability Progress Report
2016 ODOT Sustainability Progress Report 2
SUSTAINABILITY
Thank you to all employees who are helping to make ODOT sustainable!
If you have any questions regarding this report or any other sustainability related question, please contact the Sustainability Program or a member of the ODOT Sustainability Council.
Sustainability Council Jerri Bohard Transportation Development Division Administrator
Gary Farnsworth Region 4 Area Manager
Susan Haupt Geo-Environmental Section Manager
Luci Moore State Maintenance and Operations Engineer
Hal Gard Rail Division Administrator
Randy Gengler Facilities Services Manager
Kristen LaLonde Facilities Energy Analyst
Rob Dibble Facilities Construction Crew Manager
Diana Koppes Human Resources Organizational Development Manager
Mac Lynde Active Transportation Section Manager
Lynn Averbeck Environmental Policy and Program Advisor
Mary Wandell Procurement Training Coordinator, Procurement Office
Debbie Benavidez Program Coordinator, Planning and Implementation Unit
Geoff Crook
ODOT Sustainability Program Manager
(503) 986-3425
2016 ODOT Sustainability Progress Report 3
SUSTAINABILITY
Integrating Sustainability
The Oregon Department of Transportation (ODOT) is a leader in sustainability. Sustainability is a core ODOT value that guides our decision-making in implementing our mission and goals. Sustainable decisions are those that balances economic, environmental, and community well-being in a manner that protects the needs of current and future generations.
The Sustainability Program provides leadership, policy analysis and technical support on a wide-range of issues affecting internal operations and how ODOT manages and maintains the transportation system. The Program was put into place upon passage of the 2001 Oregon Sustainability Act (ORS 184.421) and a series of Governor’s Executive Orders focused on enhancing sustainable practices in state agency operations. Another driver for ODOT’s sustainability efforts is Goal 4 of the Oregon Transportation Plan—(Sustainability). Goal 4 policies call for providing a transportation system that…“meets present needs without compromising the ability of future generations to meet their needs, distributes benefits and burdens fairly, and is operated, maintained and improved to be sensitive to both the natural and built environments.”
The Sustainability Program works with managers and lead work groups across the agency to implement sustainability initiatives and report on performance under ODOT’s Sustainability Plan. This aspect of the Program involves regular Sustainability Plan updates and annual reporting on a range of performance metrics. The Program conducts research and pilot projects, manages grants, and provides leadership in resource conservation, best practices, and communications. The Program is also the agency’s lead on Climate Change Adaptation planning and research. Program activities are guided by several committees, including the Sustainability Council, and Climate Change Adaptation Work Group.
Volume II of the Sustainability Plan sets the goals, strategies, and performance measures for ODOT’s internal operations, such as for Facilities, Procurement, and Fleet Services. ODOT’s Sustainability Plan is used by management and staff in planning, decision-making, purchasing, construction, and maintenance and operations of facilities across the agency. The ODOT Sustainability Council provides guidance for sustainability practices however, without the commitment and day to day efforts of ODOT employees, these projects and programs would have little ability to make real positive change.
This 2016 edition of the Progress Report highlights projects and initiatives implemented through ODOT’s internal operations and reports on the agency’s progress towards meeting its sustainability goals.
There is inherent difficulty collecting data in a diverse organization of 4,600 employees statewide, 3,000 motorized vehicles and more than 1,000 buildings. Specific actions for implementing sustainability strategies and their budget impacts will vary by year, region, and program. Where statewide data collection is challenging, our performance tracking focuses on the agency’s Major Facilities. These are the largest (square footage) and most populated facilities (with over 50 employees).
Volume II of the Sustainability Plan - Sustainability Management Framework for ODOT’s Internal Operations, sets the goals, strategies, and performance measures for ODOT’s internal operations.
2016 ODOT Sustainability Progress Report 4
SUSTAINABILITY
Energy Fuel Use and Climate Change
ODOT is working to reduce the amount of greenhouse gas emissions emitted by its operations and the transportation sector. This work involves collaboration with others to develop innovative responses, minimizing energy use in facilities, increasing fuel efficiency in our fleet, and encouraging employees to reduce their vehicle commutes.
Performance Measures: 1. Total greenhouse gas (GHG) emissions from ODOT’s building, energy, transportation (fuel) sources.
ODOT’s operations release GHG into the atmosphere, however the agency is committed to minimizing its impact on the environment through the reduction of emissions from all activities and sources. Reducing energy use and using alternative fuels will help ODOT reach its goals for reducing GHG emissions.
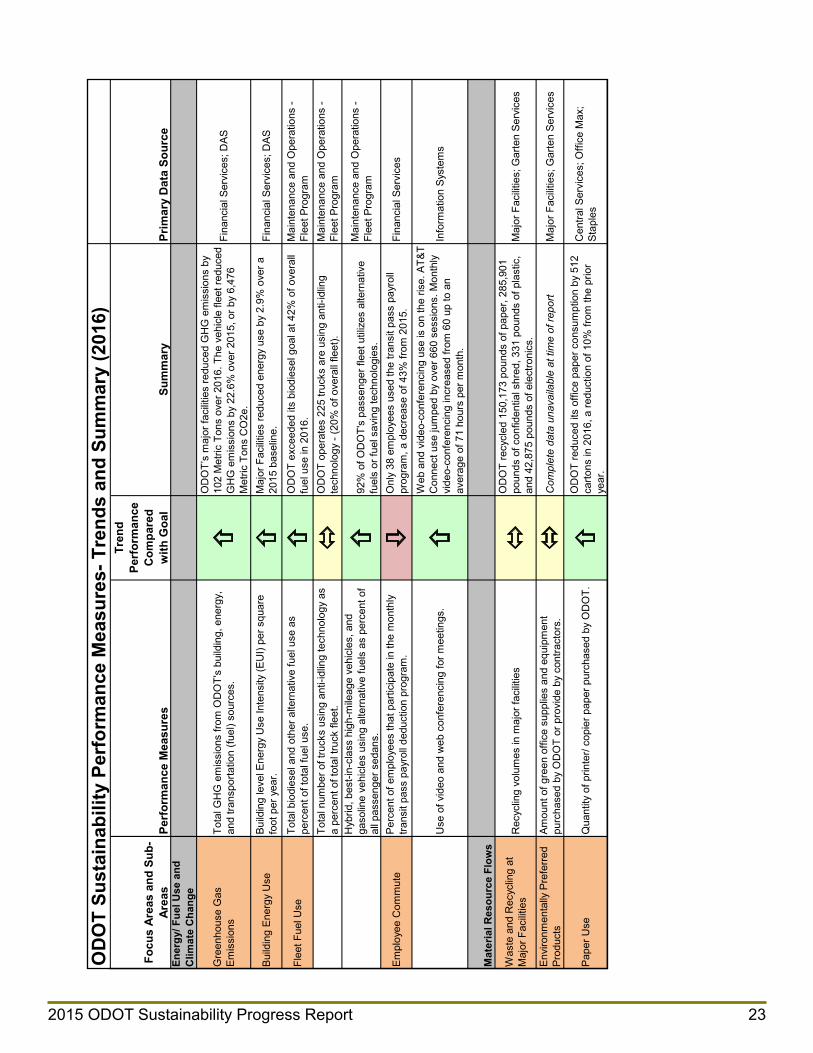
In 2016, lowering energy usage at ODOT’s major facilities reduced GHG emissions by 102 Metric Tons compared with 2015. This data was based on energy tracking at ODOT’s 12 largest facilities, including the headquarters buildings in each Region.
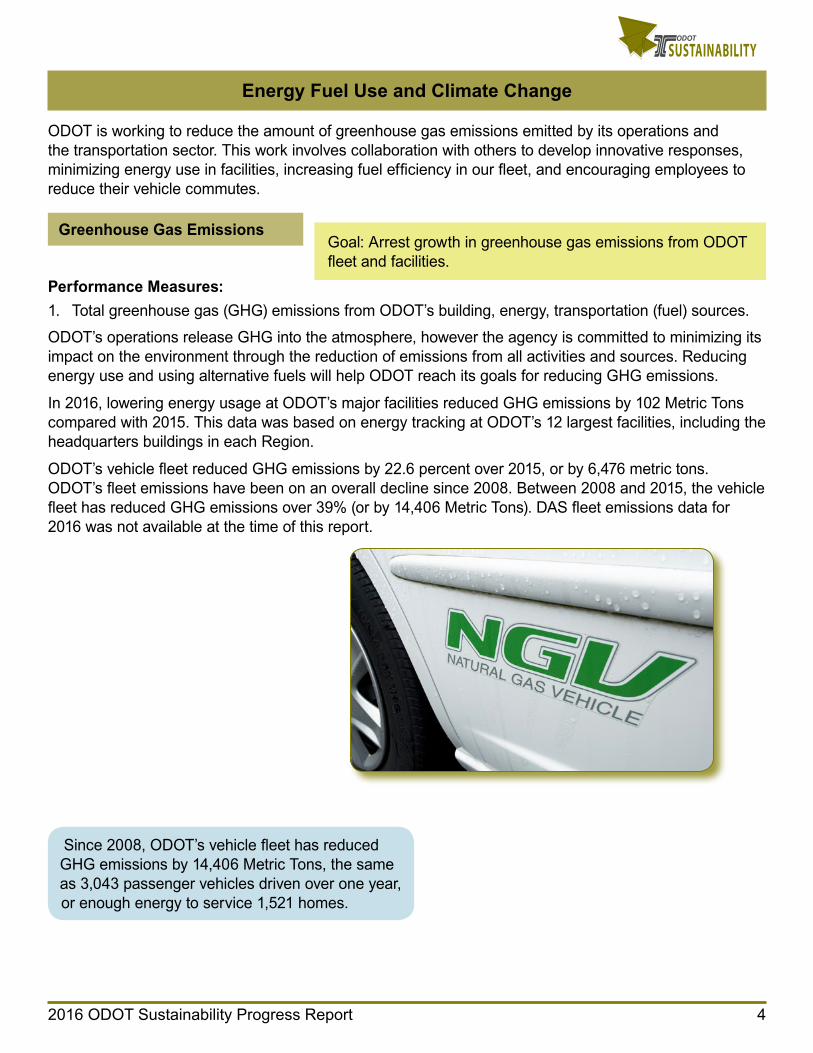
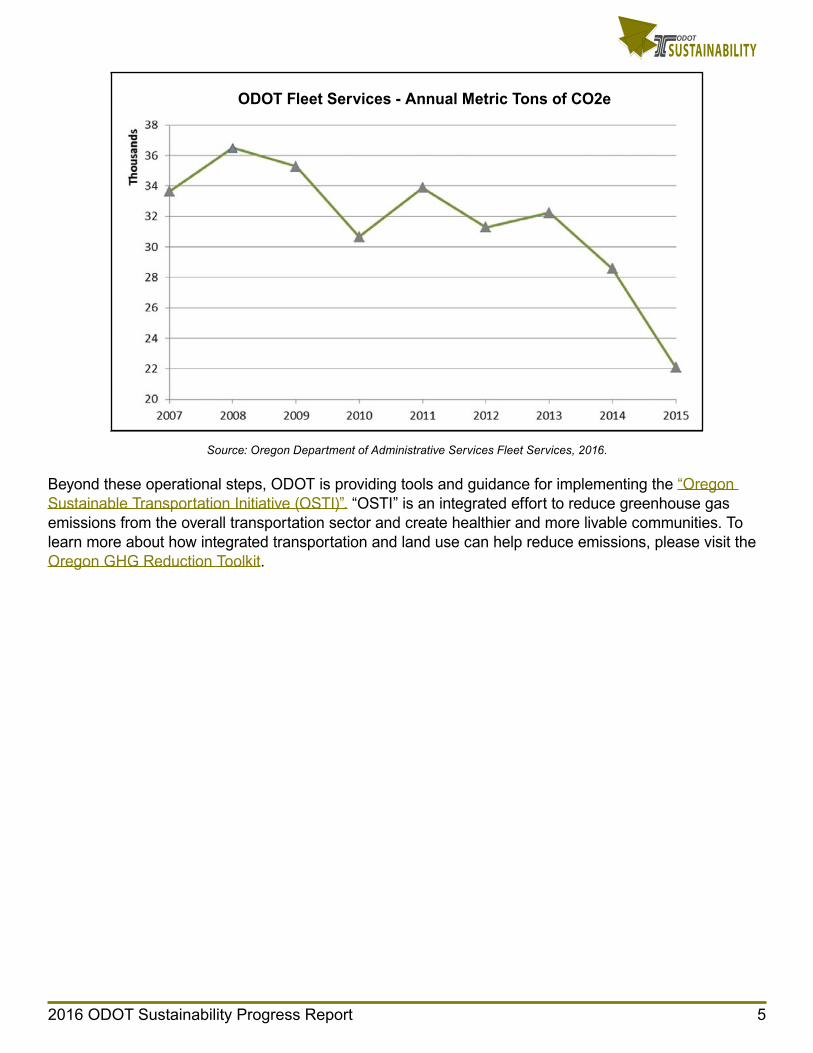
ODOT’s vehicle fleet reduced GHG emissions by 22.6 percent over 2015, or by 6,476 metric tons. ODOT’s fleet emissions have been on an overall decline since 2008. Between 2008 and 2015, the vehicle fleet has reduced GHG emissions over 39% (or by 14,406 Metric Tons). DAS fleet emissions data for 2016 was not available at the time of this report.
Greenhouse Gas Emissions Goal: Arrest growth in greenhouse gas emissions from ODOT fleet and facilities.
Since 2008, ODOT’s vehicle fleet has reduced GHG emissions by 14,406 Metric Tons, the same as 3,043 passenger vehicles driven over one year, or enough energy to service 1,521 homes.
2016 ODOT Sustainability Progress Report 5
SUSTAINABILITY
ODOT Fleet Services - Annual Metric Tons of CO2e
Source: Oregon Department of Administrative Services Fleet Services, 2016.
Beyond these operational steps, ODOT is providing tools and guidance for implementing the “Oregon Sustainable Transportation Initiative (OSTI)”. “OSTI” is an integrated effort to reduce greenhouse gas emissions from the overall transportation sector and create healthier and more livable communities. To learn more about how integrated transportation and land use can help reduce emissions, please visit the Oregon GHG Reduction Toolkit.
2016 ODOT Sustainability Progress Report 6
SUSTAINABILITY
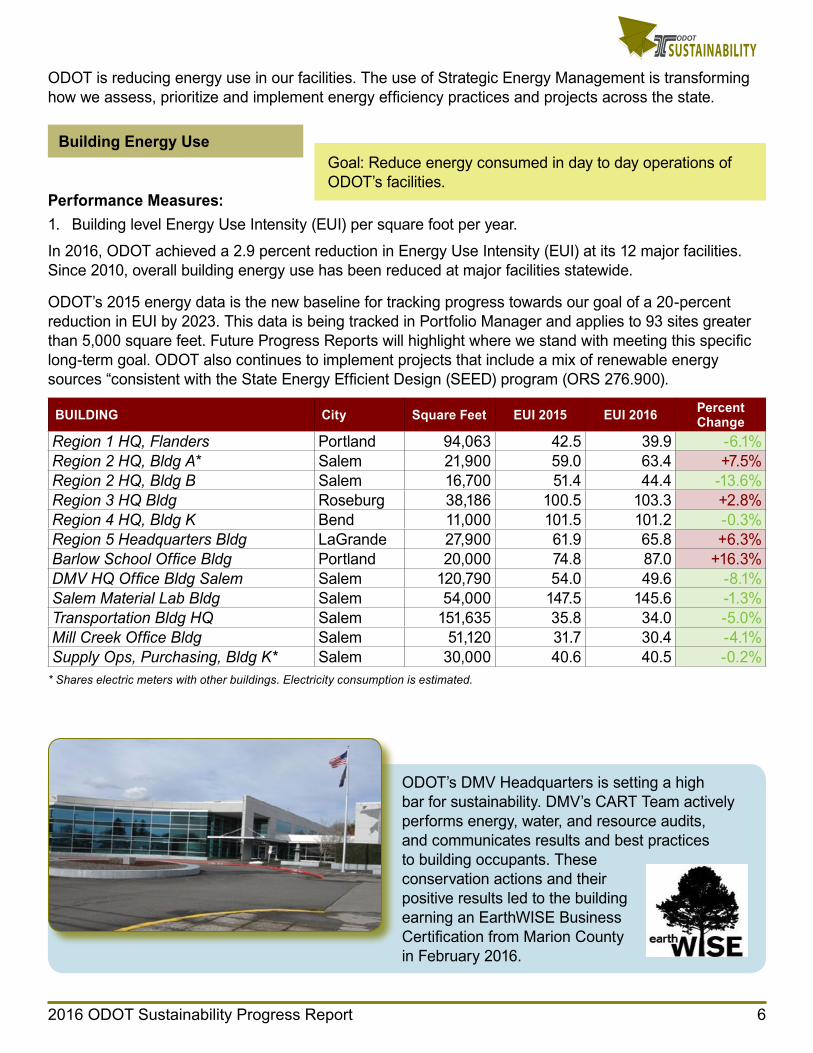
ODOT’s DMV Headquarters is setting a high bar for sustainability. DMV’s CART Team actively performs energy, water, and resource audits, and communicates results and best practices to building occupants. These conservation actions and their positive results led to the building earning an EarthWISE Business Certification from Marion County in February 2016.
ODOT’s 2015 energy data is the new baseline for tracking progress towards our goal of a 20-percent reduction in EUI by 2023. This data is being tracked in Portfolio Manager and applies to 93 sites greater than 5,000 square feet. Future Progress Reports will highlight where we stand with meeting this specific long-term goal. ODOT also continues to implement projects that include a mix of renewable energy sources “consistent with the State Energy Efficient Design (SEED) program (ORS 276.900).
BUILDING City Square Feet EUI 2015 EUI 2016 Percent Change
Region 1 HQ, Flanders Portland 94,063 42.5 39.9 -6.1%Region 2 HQ, Bldg A* Salem 21,900 59.0 63.4 +7.5%Region 2 HQ, Bldg B Salem 16,700 51.4 44.4 -13.6%Region 3 HQ Bldg Roseburg 38,186 100.5 103.3 +2.8%Region 4 HQ, Bldg K Bend 11,000 101.5 101.2 -0.3%Region 5 Headquarters Bldg LaGrande 27,900 61.9 65.8 +6.3%Barlow School Office Bldg Portland 20,000 74.8 87.0 +16.3%DMV HQ Office Bldg Salem Salem 120,790 54.0 49.6 -8.1%Salem Material Lab Bldg Salem 54,000 147.5 145.6 -1.3%Transportation Bldg HQ Salem 151,635 35.8 34.0 -5.0%Mill Creek Office Bldg Salem 51,120 31.7 30.4 -4.1%Supply Ops, Purchasing, Bldg K* Salem 30,000 40.6 40.5 -0.2%
* Shares electric meters with other buildings. Electricity consumption is estimated.
Building Energy UseGoal: Reduce energy consumed in day to day operations of ODOT’s facilities.
Performance Measures: 1. Building level Energy Use Intensity (EUI) per square foot per year.
In 2016, ODOT achieved a 2.9 percent reduction in Energy Use Intensity (EUI) at its 12 major facilities. Since 2010, overall building energy use has been reduced at major facilities statewide.
ODOT is reducing energy use in our facilities. The use of Strategic Energy Management is transforming how we assess, prioritize and implement energy efficiency practices and projects across the state.
2016 ODOT Sustainability Progress Report 7
SUSTAINABILITY
Fuel Use
Performance Measures:1. Total biodiesel and other alternative fuel use as a percent of total fuel use.
2. Total number of trucks using anti-idling technology as a percent of total truck fleet.
3. Hybrid, best-in-class high-mileage vehicles, and gasoline vehicles using alternative fuels as percent of all passenger sedans.
ODOT’s Fleet Section and crews continue to meet and exceed the agency’s goals for alternative vehicles and fleet fuels.
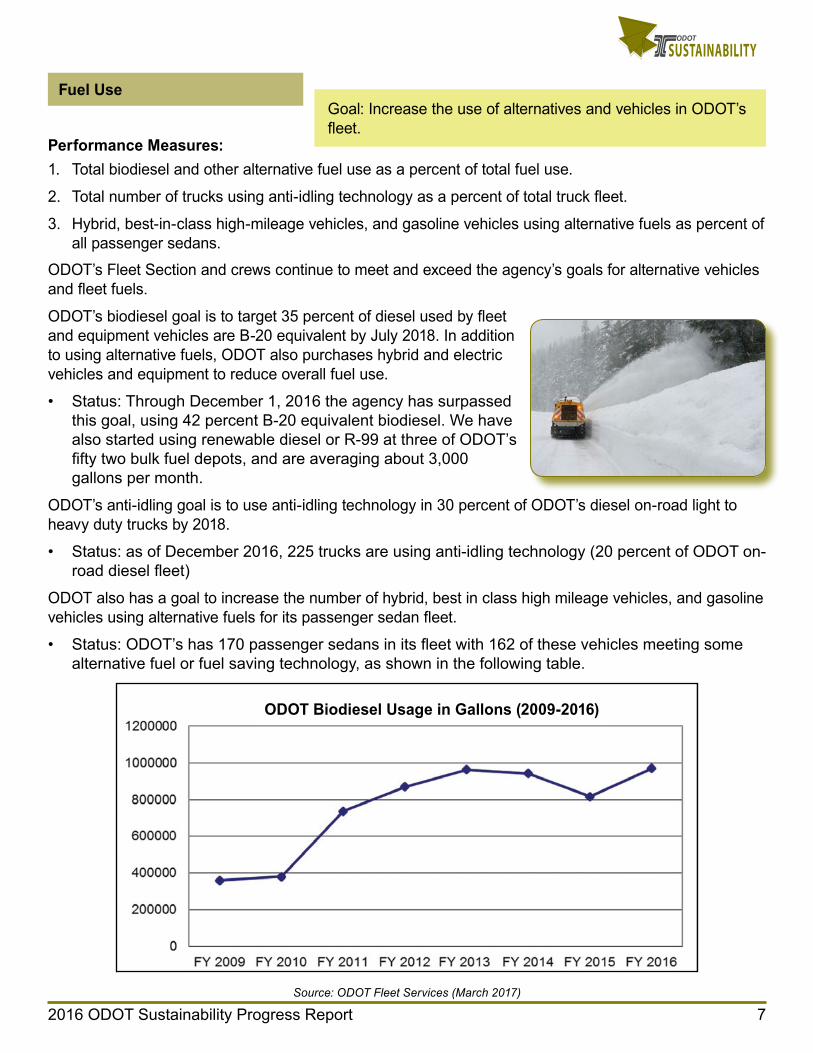
ODOT’s biodiesel goal is to target 35 percent of diesel used by fleet and equipment vehicles are B-20 equivalent by July 2018. In addition to using alternative fuels, ODOT also purchases hybrid and electric vehicles and equipment to reduce overall fuel use.
• Status: Through December 1, 2016 the agency has surpassed this goal, using 42 percent B-20 equivalent biodiesel. We have also started using renewable diesel or R-99 at three of ODOT’s fifty two bulk fuel depots, and are averaging about 3,000 gallons per month.
ODOT’s anti-idling goal is to use anti-idling technology in 30 percent of ODOT’s diesel on-road light to heavy duty trucks by 2018.
• Status: as of December 2016, 225 trucks are using anti-idling technology (20 percent of ODOT on-road diesel fleet)
ODOT also has a goal to increase the number of hybrid, best in class high mileage vehicles, and gasoline vehicles using alternative fuels for its passenger sedan fleet.
• Status: ODOT’s has 170 passenger sedans in its fleet with 162 of these vehicles meeting some alternative fuel or fuel saving technology, as shown in the following table.
ODOT Biodiesel Usage in Gallons (2009-2016)
Source: ODOT Fleet Services (March 2017)
Goal: Increase the use of alternatives and vehicles in ODOT’s fleet.
2016 ODOT Sustainability Progress Report 8
SUSTAINABILITYOverall the agency owns 212 E-85 vehicles and 18 hybrid or Plug in Hybrid Electric Vehicles (PHEV’S) which includes (1) Chevy Volt and (1) Converted Prius. ODOT currently owns (5) Nissan Leaf all electric sedans and (1) Ford Transit Van, and operates a total of 10 Level II charging stations for electric vehicles. Fleet Services is also working with DAS and other agencies to move forward on SB 536 which allows state agencies to install Electric Vehicle supply equipment (EVSE) at state owned or controlled facilities.
Vehicle Type Number Percent of Fleet
Alternative Fuel Sedans 81 48%All Electric 5 3%Electric Hybrid Vehicles 13 8%Compressed Natural Gas 1 1%E85 ethanol 62 37%
Source: ODOT Fleet Services, February 2017.
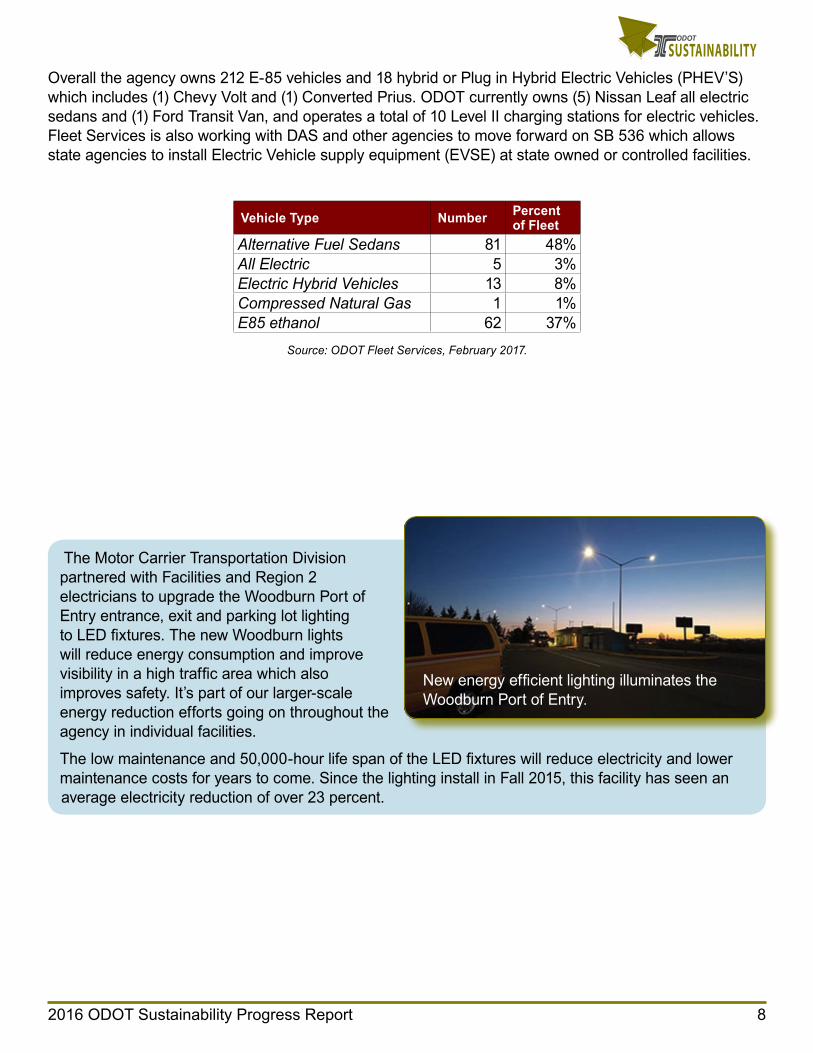
The Motor Carrier Transportation Division partnered with Facilities and Region 2 electricians to upgrade the Woodburn Port of Entry entrance, exit and parking lot lighting to LED fixtures. The new Woodburn lights will reduce energy consumption and improve visibility in a high traffic area which also improves safety. It’s part of our larger-scale energy reduction efforts going on throughout the agency in individual facilities.
The low maintenance and 50,000-hour life span of the LED fixtures will reduce electricity and lower maintenance costs for years to come. Since the lighting install in Fall 2015, this facility has seen an average electricity reduction of over 23 percent.
New energy efficient lighting illuminates the Woodburn Port of Entry.
2016 ODOT Sustainability Progress Report 9
SUSTAINABILITY
Employee CommuteGoal: Reduce single-occupancy vehicle trips.
Performance Measures:1. Percent of employees that participate in the monthly transit
pass payroll deduction program.
2. Use of video and web conferencing for meetings.
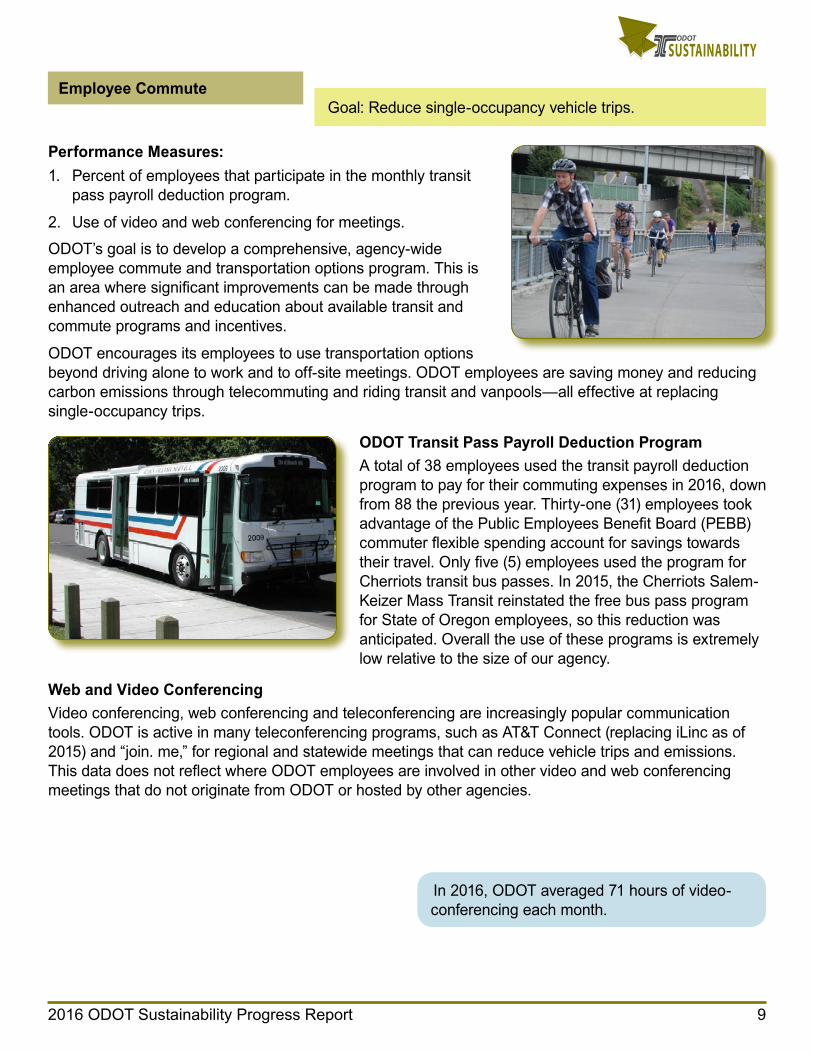
ODOT’s goal is to develop a comprehensive, agency-wide employee commute and transportation options program. This is an area where significant improvements can be made through enhanced outreach and education about available transit and commute programs and incentives.
ODOT encourages its employees to use transportation options beyond driving alone to work and to off-site meetings. ODOT employees are saving money and reducing carbon emissions through telecommuting and riding transit and vanpools—all effective at replacing single-occupancy trips.
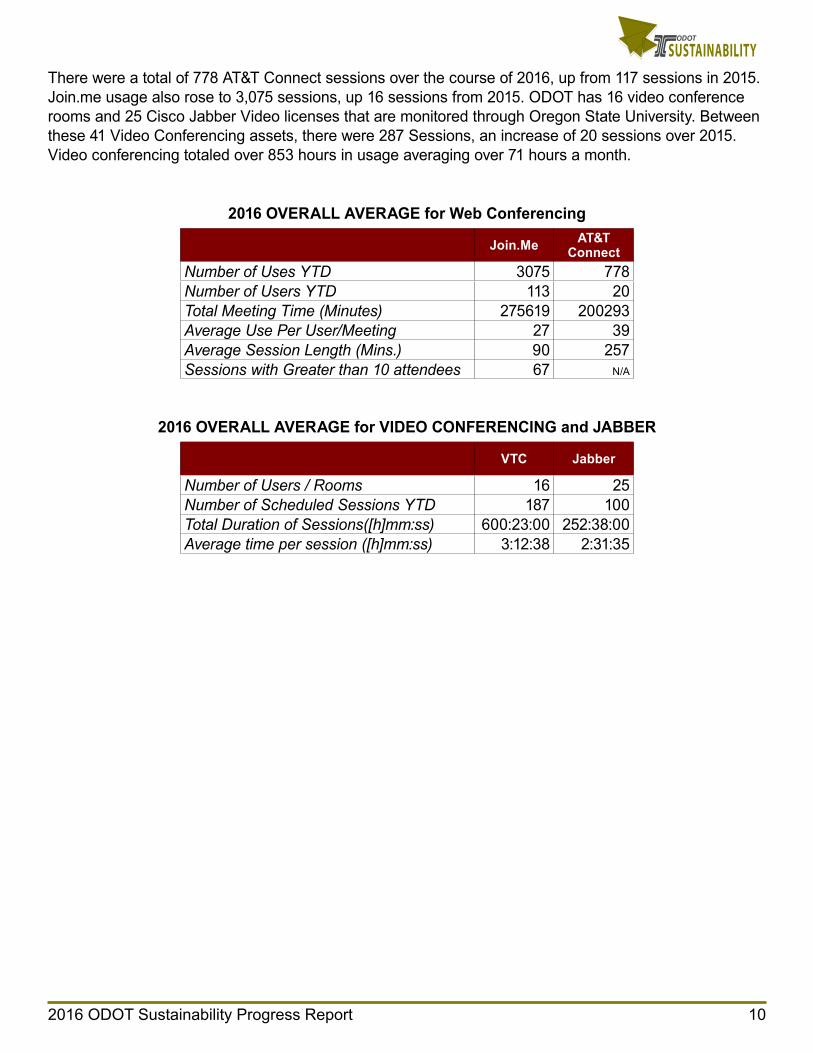
ODOT Transit Pass Payroll Deduction ProgramA total of 38 employees used the transit payroll deduction program to pay for their commuting expenses in 2016, down from 88 the previous year. Thirty-one (31) employees took advantage of the Public Employees Benefit Board (PEBB) commuter flexible spending account for savings towards their travel. Only five (5) employees used the program for Cherriots transit bus passes. In 2015, the Cherriots Salem-Keizer Mass Transit reinstated the free bus pass program for State of Oregon employees, so this reduction was anticipated. Overall the use of these programs is extremely low relative to the size of our agency.
Web and Video ConferencingVideo conferencing, web conferencing and teleconferencing are increasingly popular communication tools. ODOT is active in many teleconferencing programs, such as AT&T Connect (replacing iLinc as of 2015) and “join. me,” for regional and statewide meetings that can reduce vehicle trips and emissions. This data does not reflect where ODOT employees are involved in other video and web conferencing meetings that do not originate from ODOT or hosted by other agencies.
In 2016, ODOT averaged 71 hours of video-conferencing each month.
2016 ODOT Sustainability Progress Report 10
SUSTAINABILITYThere were a total of 778 AT&T Connect sessions over the course of 2016, up from 117 sessions in 2015. Join.me usage also rose to 3,075 sessions, up 16 sessions from 2015. ODOT has 16 video conference rooms and 25 Cisco Jabber Video licenses that are monitored through Oregon State University. Between these 41 Video Conferencing assets, there were 287 Sessions, an increase of 20 sessions over 2015. Video conferencing totaled over 853 hours in usage averaging over 71 hours a month.
2016 OVERALL AVERAGE for Web Conferencing
Join.Me AT&T Connect
Number of Uses YTD 3075 778Number of Users YTD 113 20Total Meeting Time (Minutes) 275619 200293Average Use Per User/Meeting 27 39Average Session Length (Mins.) 90 257Sessions with Greater than 10 attendees 67 N/A
2016 OVERALL AVERAGE for VIDEO CONFERENCING and JABBER
VTC Jabber
Number of Users / Rooms 16 25Number of Scheduled Sessions YTD 187 100Total Duration of Sessions([h]mm:ss) 600:23:00 252:38:00Average time per session ([h]mm:ss) 3:12:38 2:31:35
2016 ODOT Sustainability Progress Report 11
SUSTAINABILITY
Material Resource Flows
The Sustainability Council in consultation with Central Services decided to focus the agency’s performance measure tracking on ODOT’s largest and most populated facilities. ODOT’s goal is to establish baselines and track sustainability measures at its Major Facilities, including water use, waste and recycling rates, energy use, and paper use.
Waste Minimization and Recycling Goal: Reduce total waste produced at ODOT facilities and
increase recycling. Performance Measures:
1. Recycling volumes in major facilities.
ODOT works to reuse and recycle all materials from its operations, including paper, plastics, electronics and metals. There are many difficulties inherent in waste volume data collection at a large and decentralized organization like ODOT. For example, we use many different waste haulers throughout the state which often differ in the type of client and account information gathered. Tracking the actual volume or weight of waste disposal is also a challenge.
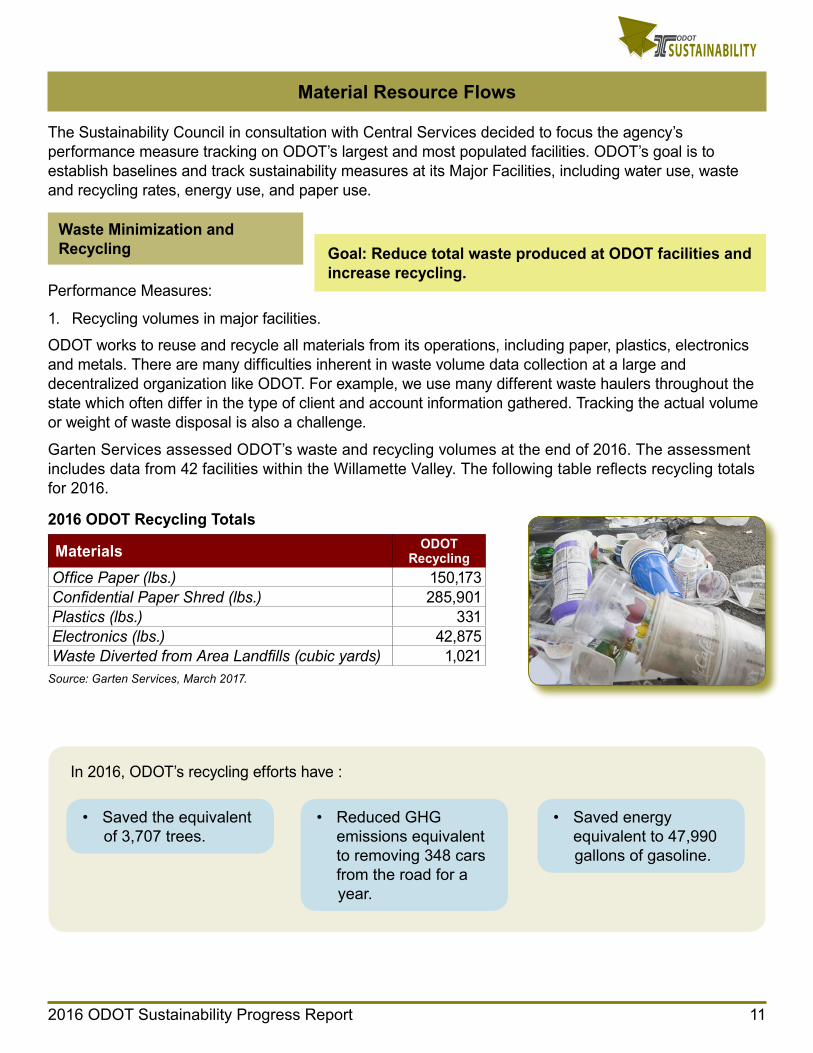
Garten Services assessed ODOT’s waste and recycling volumes at the end of 2016. The assessment includes data from 42 facilities within the Willamette Valley. The following table reflects recycling totals for 2016.
2016 ODOT Recycling Totals
Materials ODOT Recycling
Office Paper (lbs.) 150,173Confidential Paper Shred (lbs.) 285,901Plastics (lbs.) 331Electronics (lbs.) 42,875Waste Diverted from Area Landfills (cubic yards) 1,021
Source: Garten Services, March 2017.
• Saved the equivalent of 3,707 trees.
• Reduced GHG emissions equivalent to removing 348 cars from the road for a year.
• Saved energy equivalent to 47,990 gallons of gasoline.
In 2016, ODOT’s recycling efforts have :
2016 ODOT Sustainability Progress Report 12
SUSTAINABILITY
Environmentally Preferred Products
Goal: Reduce amount of paper waste and increase the recycled content of the paper products ODOT purchases.
Performance Measures: 1. Quantity of printer/ copier paper purchased by ODOT
2. The weighted average of post-consumer recycled content of printer/ copier paper purchased.
3. Annual total for DAS Copy Center costs.
4. Amount of green office supplies and equipment purchased by ODOT or provided by contractors.
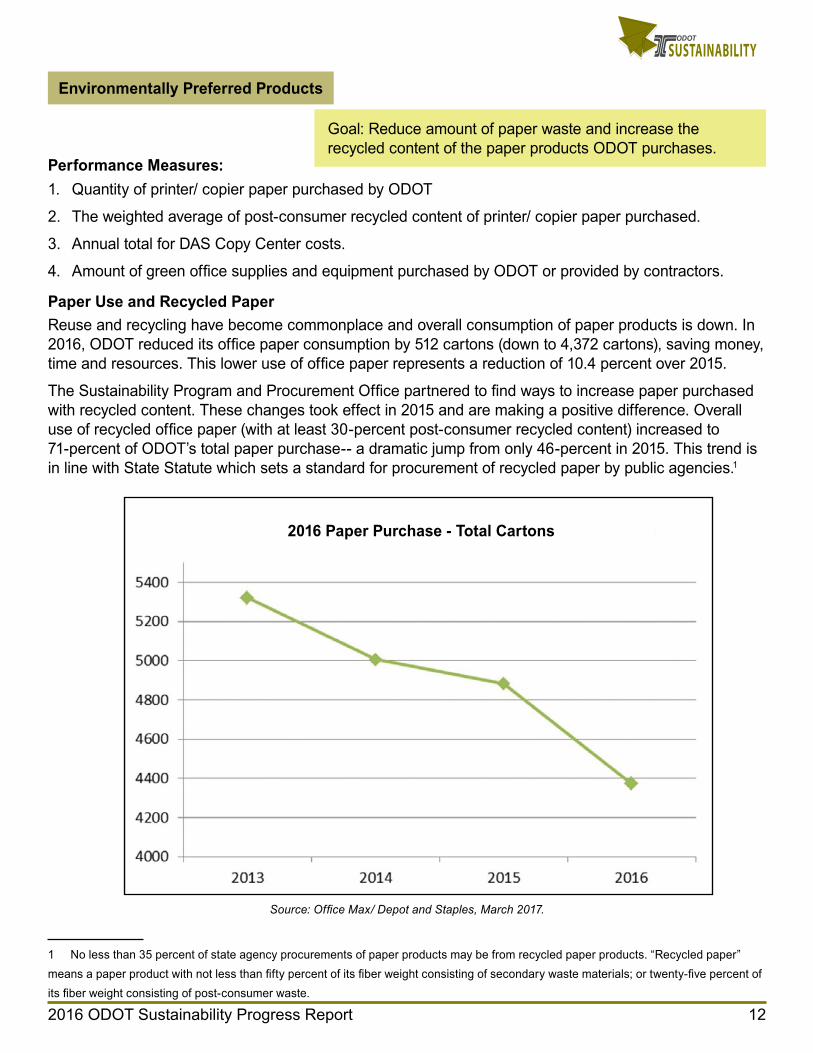
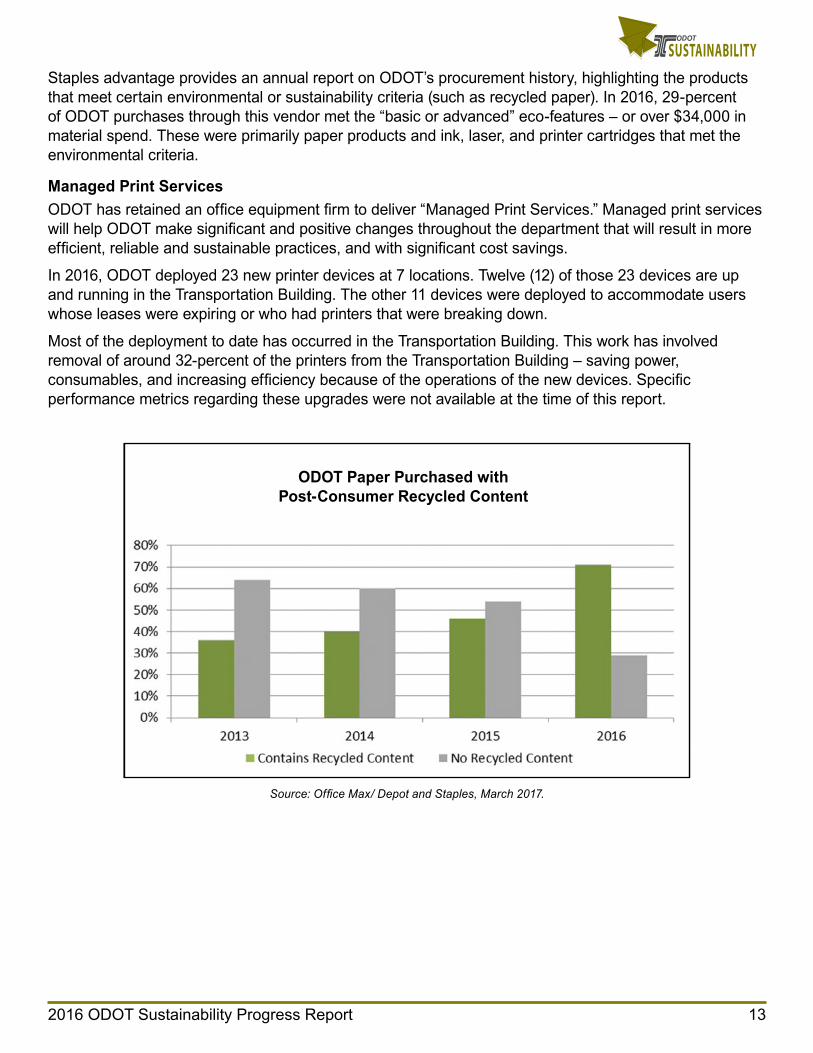
Paper Use and Recycled Paper Reuse and recycling have become commonplace and overall consumption of paper products is down. In 2016, ODOT reduced its office paper consumption by 512 cartons (down to 4,372 cartons), saving money, time and resources. This lower use of office paper represents a reduction of 10.4 percent over 2015.
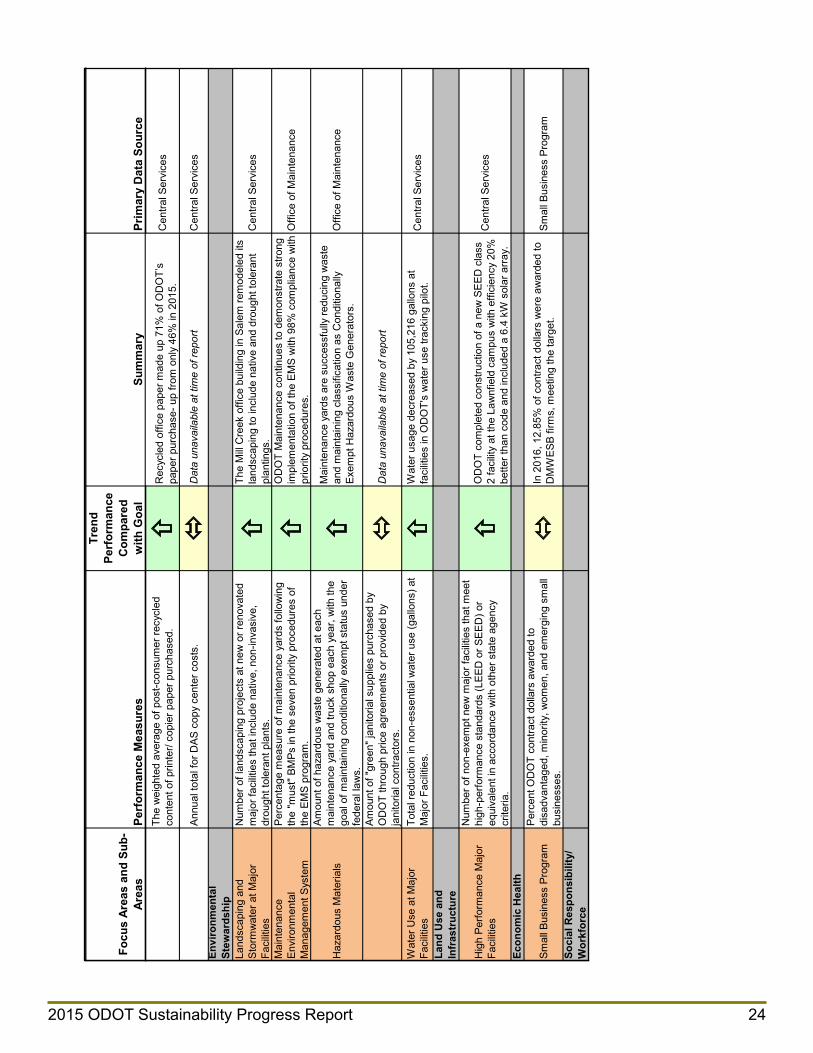
The Sustainability Program and Procurement Office partnered to find ways to increase paper purchased with recycled content. These changes took effect in 2015 and are making a positive difference. Overall use of recycled office paper (with at least 30-percent post-consumer recycled content) increased to 71-percent of ODOT’s total paper purchase-- a dramatic jump from only 46-percent in 2015. This trend is in line with State Statute which sets a standard for procurement of recycled paper by public agencies.1
1 No less than 35 percent of state agency procurements of paper products may be from recycled paper products. “Recycled paper” means a paper product with not less than fifty percent of its fiber weight consisting of secondary waste materials; or twenty-five percent of its fiber weight consisting of post-consumer waste.
2016 Paper Purchase - Total Cartons
Source: Office Max/ Depot and Staples, March 2017.
2016 ODOT Sustainability Progress Report 13
SUSTAINABILITYStaples advantage provides an annual report on ODOT’s procurement history, highlighting the products that meet certain environmental or sustainability criteria (such as recycled paper). In 2016, 29-percent of ODOT purchases through this vendor met the “basic or advanced” eco-features – or over $34,000 in material spend. These were primarily paper products and ink, laser, and printer cartridges that met the environmental criteria.
Managed Print Services ODOT has retained an office equipment firm to deliver “Managed Print Services.” Managed print services will help ODOT make significant and positive changes throughout the department that will result in more efficient, reliable and sustainable practices, and with significant cost savings.
In 2016, ODOT deployed 23 new printer devices at 7 locations. Twelve (12) of those 23 devices are up and running in the Transportation Building. The other 11 devices were deployed to accommodate users whose leases were expiring or who had printers that were breaking down.
Most of the deployment to date has occurred in the Transportation Building. This work has involved removal of around 32-percent of the printers from the Transportation Building – saving power, consumables, and increasing efficiency because of the operations of the new devices. Specific performance metrics regarding these upgrades were not available at the time of this report.
ODOT Paper Purchased with Post-Consumer Recycled Content
Source: Office Max/ Depot and Staples, March 2017.
2016 ODOT Sustainability Progress Report 14
SUSTAINABILITY
Environmental Stewardship
This focus area goes to the heart of ODOT’s responsibility and commitment to maintaining and operating the agency’s facilities in a sustainable and environmentally-sensitive manner.
Landscaping and Stormwater at Major Facilities Goal: Use non-invasive and low-maintenance plants for new
site landscaping at ODOT facilities; Minimize storm water contaminants from ODOT facilities.
Performance Measures: 1. Number of landscaping projects at new major facilities that include native, non-invasive, drought
tolerant plants.
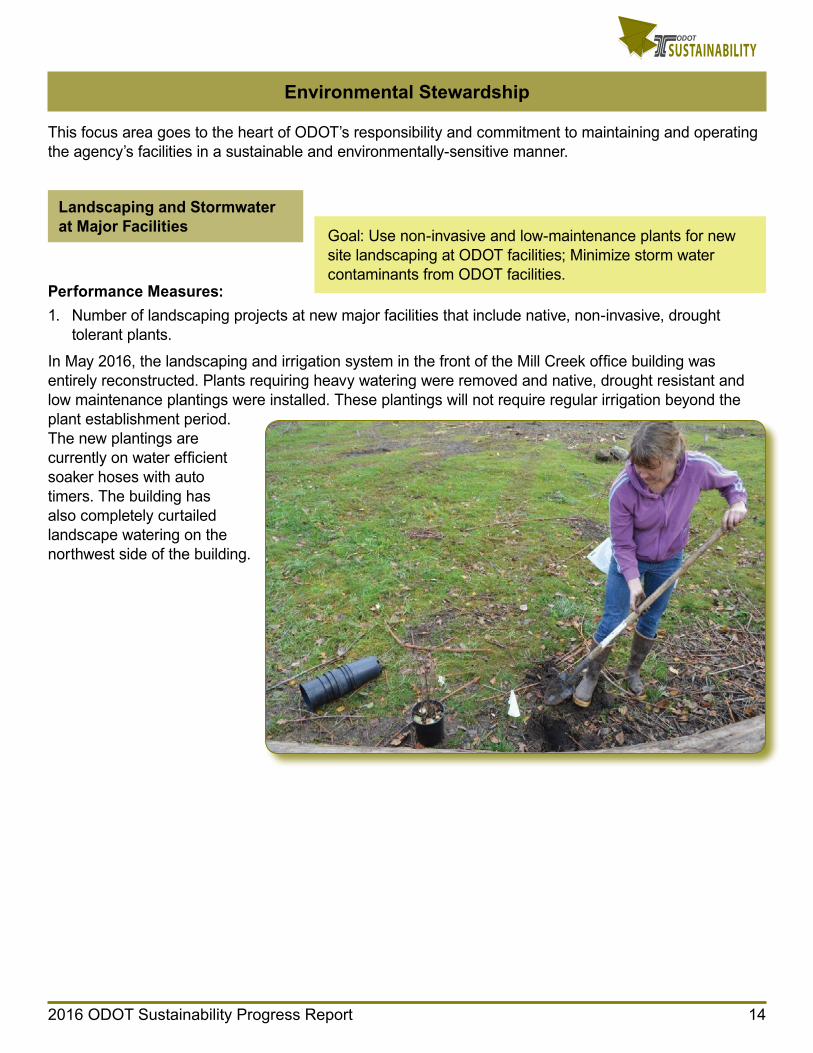
In May 2016, the landscaping and irrigation system in the front of the Mill Creek office building was entirely reconstructed. Plants requiring heavy watering were removed and native, drought resistant and low maintenance plantings were installed. These plantings will not require regular irrigation beyond the plant establishment period. The new plantings are currently on water efficient soaker hoses with auto timers. The building has also completely curtailed landscape watering on the northwest side of the building.
2016 ODOT Sustainability Progress Report 15
SUSTAINABILITY
Environmental Management System Goal: Fully implement the Environmental Management System
(EMS) standards at ODOT maintenance yards.Performance Measure: 1. Percentage measure of maintenance yards following the “must” BMP’s in the seven priority
procedures of the EMS.
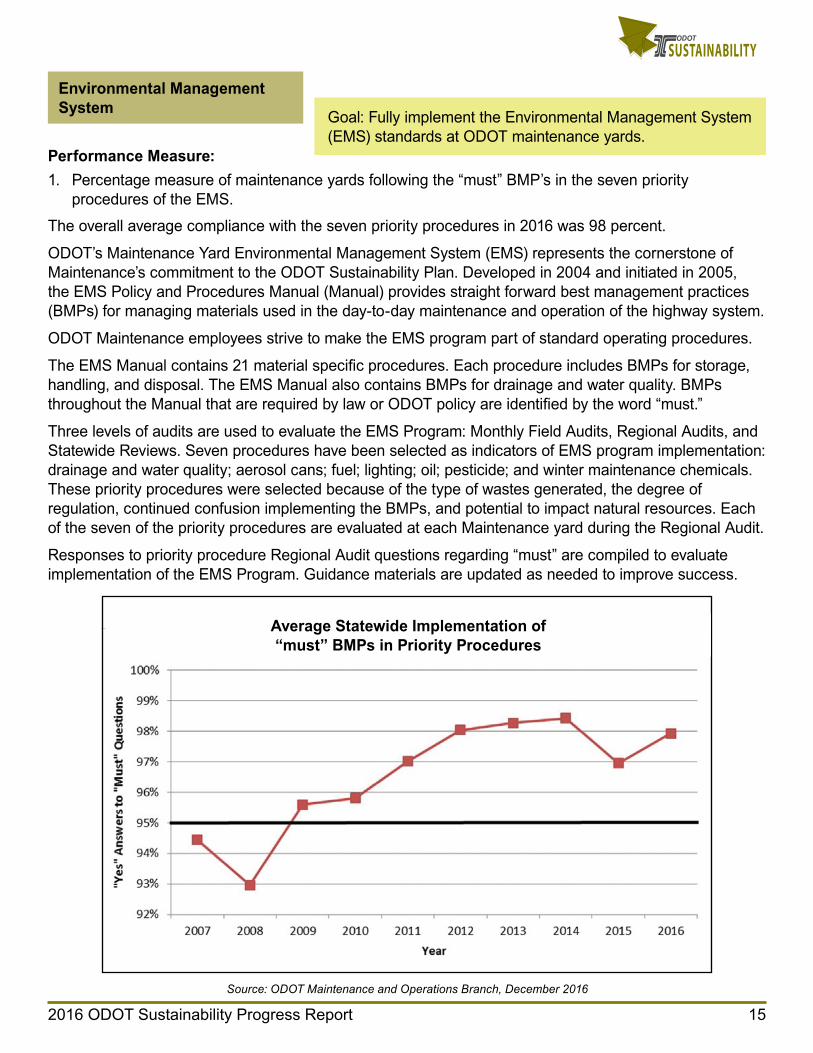
The overall average compliance with the seven priority procedures in 2016 was 98 percent.
ODOT’s Maintenance Yard Environmental Management System (EMS) represents the cornerstone of Maintenance’s commitment to the ODOT Sustainability Plan. Developed in 2004 and initiated in 2005, the EMS Policy and Procedures Manual (Manual) provides straight forward best management practices (BMPs) for managing materials used in the day-to-day maintenance and operation of the highway system.
ODOT Maintenance employees strive to make the EMS program part of standard operating procedures.
The EMS Manual contains 21 material specific procedures. Each procedure includes BMPs for storage, handling, and disposal. The EMS Manual also contains BMPs for drainage and water quality. BMPs throughout the Manual that are required by law or ODOT policy are identified by the word “must.”
Three levels of audits are used to evaluate the EMS Program: Monthly Field Audits, Regional Audits, and Statewide Reviews. Seven procedures have been selected as indicators of EMS program implementation: drainage and water quality; aerosol cans; fuel; lighting; oil; pesticide; and winter maintenance chemicals. These priority procedures were selected because of the type of wastes generated, the degree of regulation, continued confusion implementing the BMPs, and potential to impact natural resources. Each of the seven of the priority procedures are evaluated at each Maintenance yard during the Regional Audit.
Responses to priority procedure Regional Audit questions regarding “must” are compiled to evaluate implementation of the EMS Program. Guidance materials are updated as needed to improve success.
Average Statewide Implementation of “must” BMPs in Priority Procedures
Source: ODOT Maintenance and Operations Branch, December 2016
2016 ODOT Sustainability Progress Report 16
SUSTAINABILITY
Hazardous MaterialsGoal: Reduce the use of hazardous chemicals and materials in facilities.
Performance Measure: 1. Amount of hazardous waste generated at each maintenance yard and truck shop each year, with the
goal of maintaining Conditionally Exempt Status under federal laws.
2. Amount of “green” janitorial supplies purchased by ODOT through price agreements or provided by janitorial contractors.
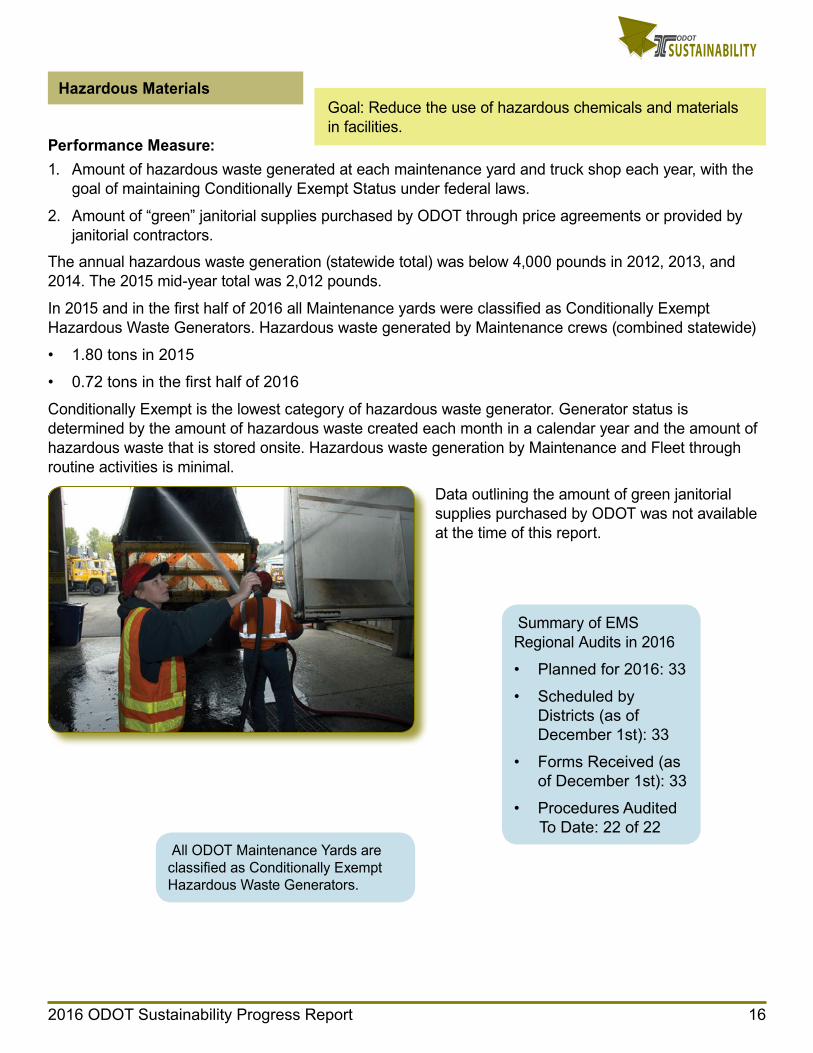
The annual hazardous waste generation (statewide total) was below 4,000 pounds in 2012, 2013, and 2014. The 2015 mid-year total was 2,012 pounds.
In 2015 and in the first half of 2016 all Maintenance yards were classified as Conditionally Exempt Hazardous Waste Generators. Hazardous waste generated by Maintenance crews (combined statewide)
• 1.80 tons in 2015
• 0.72 tons in the first half of 2016
Conditionally Exempt is the lowest category of hazardous waste generator. Generator status is determined by the amount of hazardous waste created each month in a calendar year and the amount of hazardous waste that is stored onsite. Hazardous waste generation by Maintenance and Fleet through routine activities is minimal.
Data outlining the amount of green janitorial supplies purchased by ODOT was not available at the time of this report.
All ODOT Maintenance Yards are classified as Conditionally Exempt Hazardous Waste Generators.
Summary of EMS Regional Audits in 2016
• Planned for 2016: 33
• Scheduled by Districts (as of December 1st): 33
• Forms Received (as of December 1st): 33
• Procedures Audited To Date: 22 of 22
2016 ODOT Sustainability Progress Report 17
SUSTAINABILITY
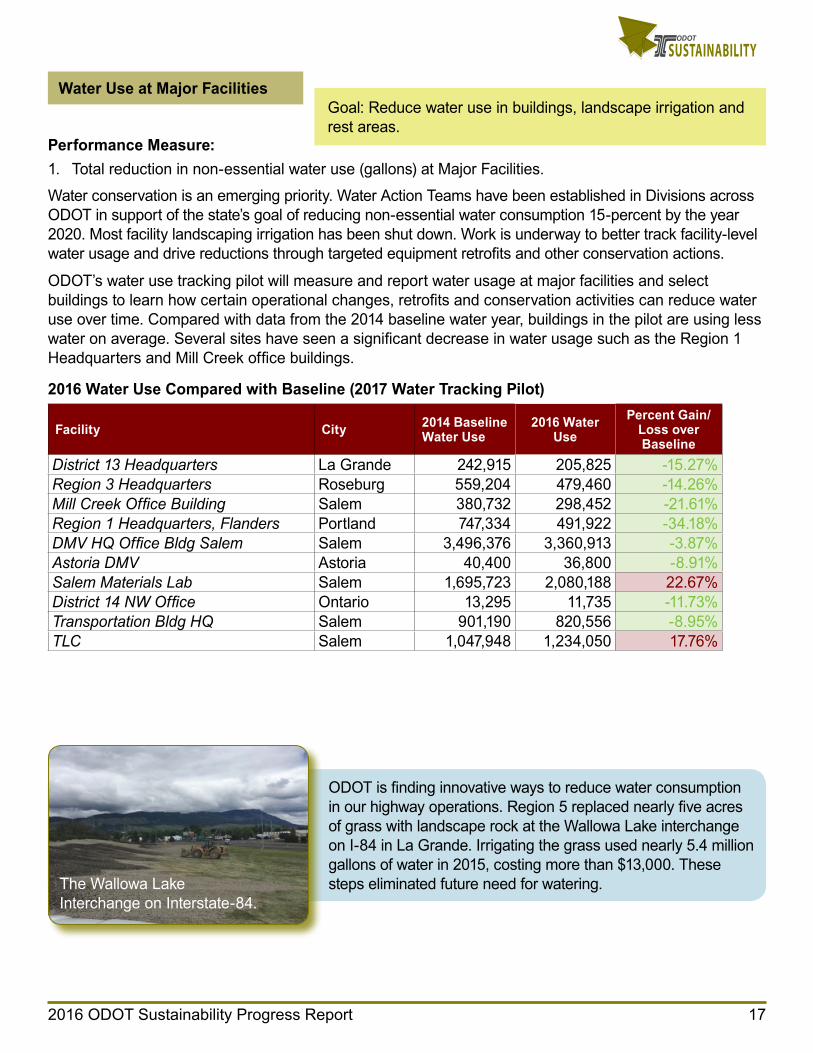
Water Use at Major Facilities Goal: Reduce water use in buildings, landscape irrigation and rest areas.
Performance Measure: 1. Total reduction in non-essential water use (gallons) at Major Facilities.
Water conservation is an emerging priority. Water Action Teams have been established in Divisions across ODOT in support of the state’s goal of reducing non-essential water consumption 15-percent by the year 2020. Most facility landscaping irrigation has been shut down. Work is underway to better track facility-level water usage and drive reductions through targeted equipment retrofits and other conservation actions.
ODOT’s water use tracking pilot will measure and report water usage at major facilities and select buildings to learn how certain operational changes, retrofits and conservation activities can reduce water use over time. Compared with data from the 2014 baseline water year, buildings in the pilot are using less water on average. Several sites have seen a significant decrease in water usage such as the Region 1 Headquarters and Mill Creek office buildings.
2016 Water Use Compared with Baseline (2017 Water Tracking Pilot)
Facility City 2014 Baseline Water Use
2016 Water Use
Percent Gain/Loss over Baseline
District 13 Headquarters La Grande 242,915 205,825 -15.27%Region 3 Headquarters Roseburg 559,204 479,460 -14.26%Mill Creek Office Building Salem 380,732 298,452 -21.61%Region 1 Headquarters, Flanders Portland 747,334 491,922 -34.18%DMV HQ Office Bldg Salem Salem 3,496,376 3,360,913 -3.87%Astoria DMV Astoria 40,400 36,800 -8.91%Salem Materials Lab Salem 1,695,723 2,080,188 22.67%District 14 NW Office Ontario 13,295 11,735 -11.73%Transportation Bldg HQ Salem 901,190 820,556 -8.95%TLC Salem 1,047,948 1,234,050 17.76%
ODOT is finding innovative ways to reduce water consumption in our highway operations. Region 5 replaced nearly five acres of grass with landscape rock at the Wallowa Lake interchange on I-84 in La Grande. Irrigating the grass used nearly 5.4 million gallons of water in 2015, costing more than $13,000. These steps eliminated future need for watering.The Wallowa Lake
Interchange on Interstate-84.
2016 ODOT Sustainability Progress Report 18
SUSTAINABILITY
Performance Measure: 1. Number of non-exempt new major new Major Facilities that meet high-performance standards (LEED
or SEED) or equivalent in accordance with other state agency criteria.
ODOT completed construction of a new facility at the Lawnfield campus that went through the State Energy Efficient Design (SEED) process and will be reported to Department of Energy as part of our annual reporting under that program. We installed a 6.4 kW solar array in August 2016 at the Lawnfield Crew/Storage Building. This was new construction of a 9,852 square-foot facility. Due to the size, this facility qualified as SEED class 2 and was built 20-percent more energy efficient than code requirements.
ODOT completed these other note-worthy energy efficiency projects in 2016:
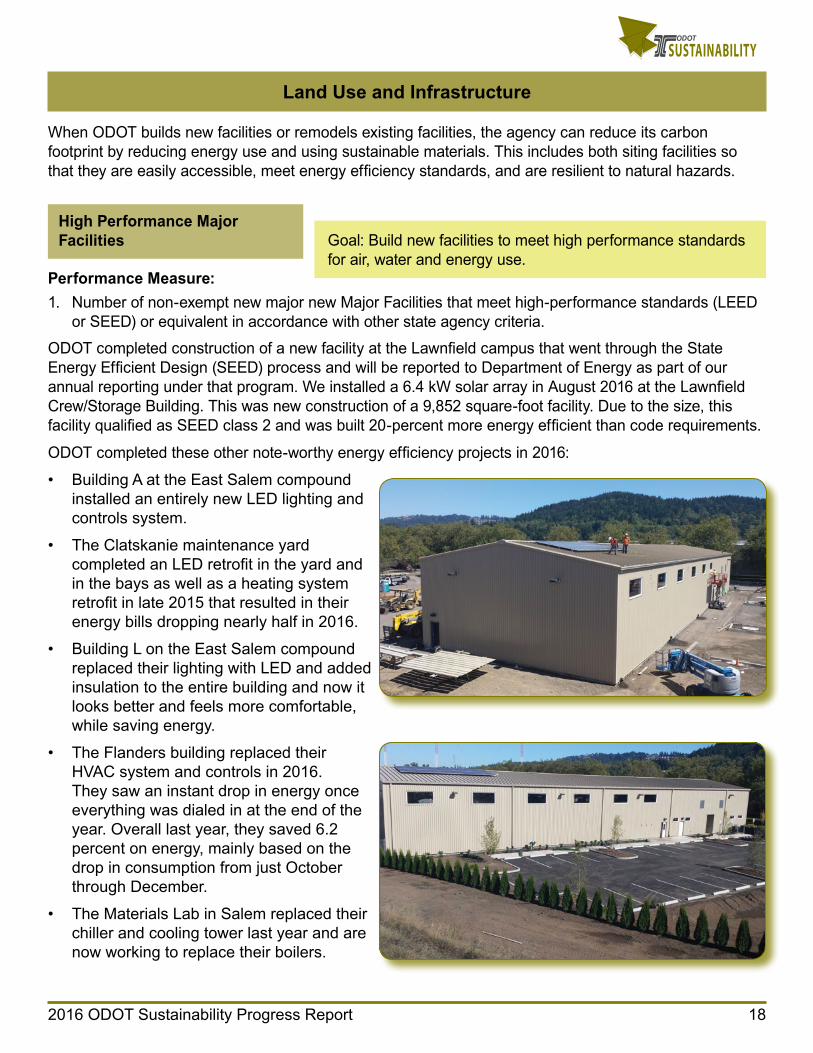
• Building A at the East Salem compound installed an entirely new LED lighting and controls system.
• The Clatskanie maintenance yard completed an LED retrofit in the yard and in the bays as well as a heating system retrofit in late 2015 that resulted in their energy bills dropping nearly half in 2016.
• Building L on the East Salem compound replaced their lighting with LED and added insulation to the entire building and now it looks better and feels more comfortable, while saving energy.
• The Flanders building replaced their HVAC system and controls in 2016. They saw an instant drop in energy once everything was dialed in at the end of the year. Overall last year, they saved 6.2 percent on energy, mainly based on the drop in consumption from just October through December.
• The Materials Lab in Salem replaced their chiller and cooling tower last year and are now working to replace their boilers.
Land Use and Infrastructure
When ODOT builds new facilities or remodels existing facilities, the agency can reduce its carbon footprint by reducing energy use and using sustainable materials. This includes both siting facilities so that they are easily accessible, meet energy efficiency standards, and are resilient to natural hazards.
High Performance Major Facilities Goal: Build new facilities to meet high performance standards
for air, water and energy use.
2016 ODOT Sustainability Progress Report 19
SUSTAINABILITY
Performance Measures:1. Percent of ODOT contract dollars awarded to disadvantaged, minority, women, and emerging small
businesses.
The primary goal of the Small Contracting Program (SCP) is to increase contracting opportunities for small firms and emerging businesses, including disadvantaged, minority, and women-owned businesses. Our engagement builds effective working relationships with these firms who can benefit from the experience of working as prime contractors and consultants on ODOT projects. ODOT also provides a mentor relationship with these companies, working with them to gain the skills required to be successful in working on ODOT contracts.
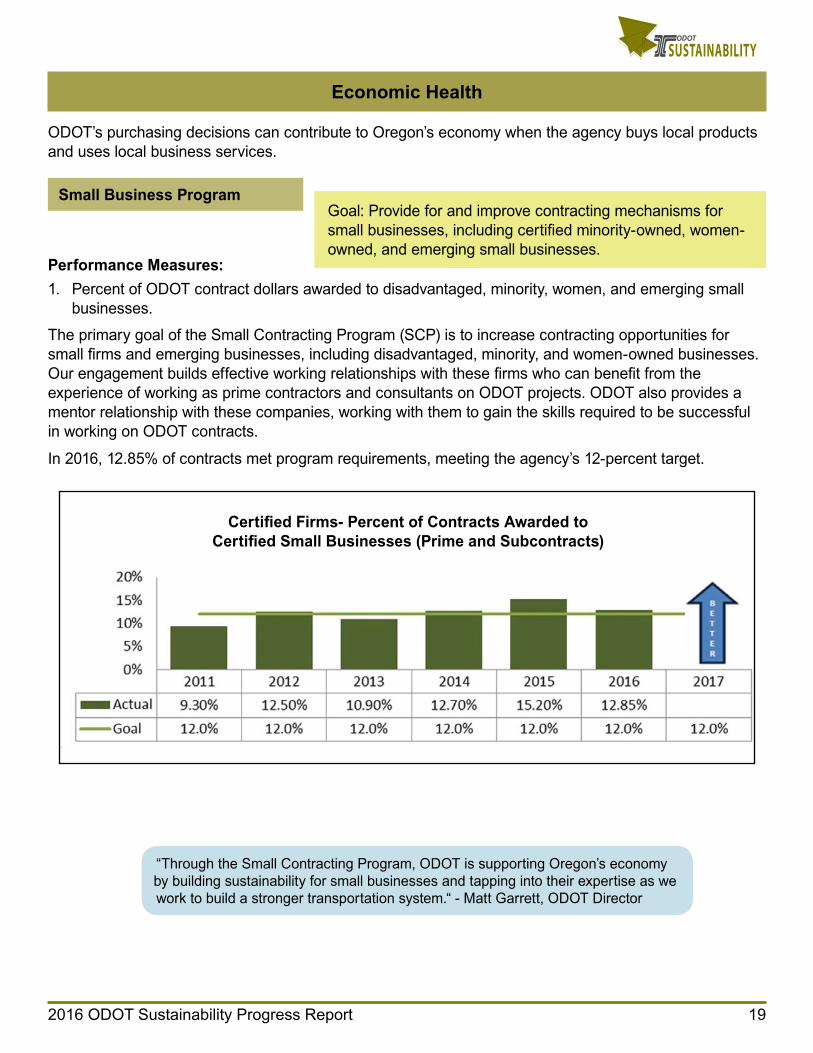
In 2016, 12.85% of contracts met program requirements, meeting the agency’s 12-percent target.
Certified Firms- Percent of Contracts Awarded to Certified Small Businesses (Prime and Subcontracts)
Small Business ProgramGoal: Provide for and improve contracting mechanisms for small businesses, including certified minority-owned, women-owned, and emerging small businesses.
Economic Health
ODOT’s purchasing decisions can contribute to Oregon’s economy when the agency buys local products and uses local business services.
“Through the Small Contracting Program, ODOT is supporting Oregon’s economy by building sustainability for small businesses and tapping into their expertise as we work to build a stronger transportation system.“ - Matt Garrett, ODOT Director
2016 ODOT Sustainability Progress Report 20
SUSTAINABILITY
Social Responsibility
ODOT must have a fully skilled, competent and diverse workforce to carry out its mission. As the number of retirements increase, ODOT must recruit employees with diverse backgrounds, retain the expertise of experienced employees, and develop employee skills to meet new challenges to the agency and the transportation system.
Work Force Diversity
Performance Measure: 1. Employment demographics (age, race, sex, ethnic origin) compared to county workforce demographics.
Diversity makes good business sense and is part of the agency’s social responsibility to value diversity and actively pursue equity and equality in all employment and contractual opportunities offered by ODOT. ODOT will continue to employ and develop positive, creative, and innovative tools for recruiting, achieving and supporting a diverse workforce to sustain its ability to carry out its transportation mission.
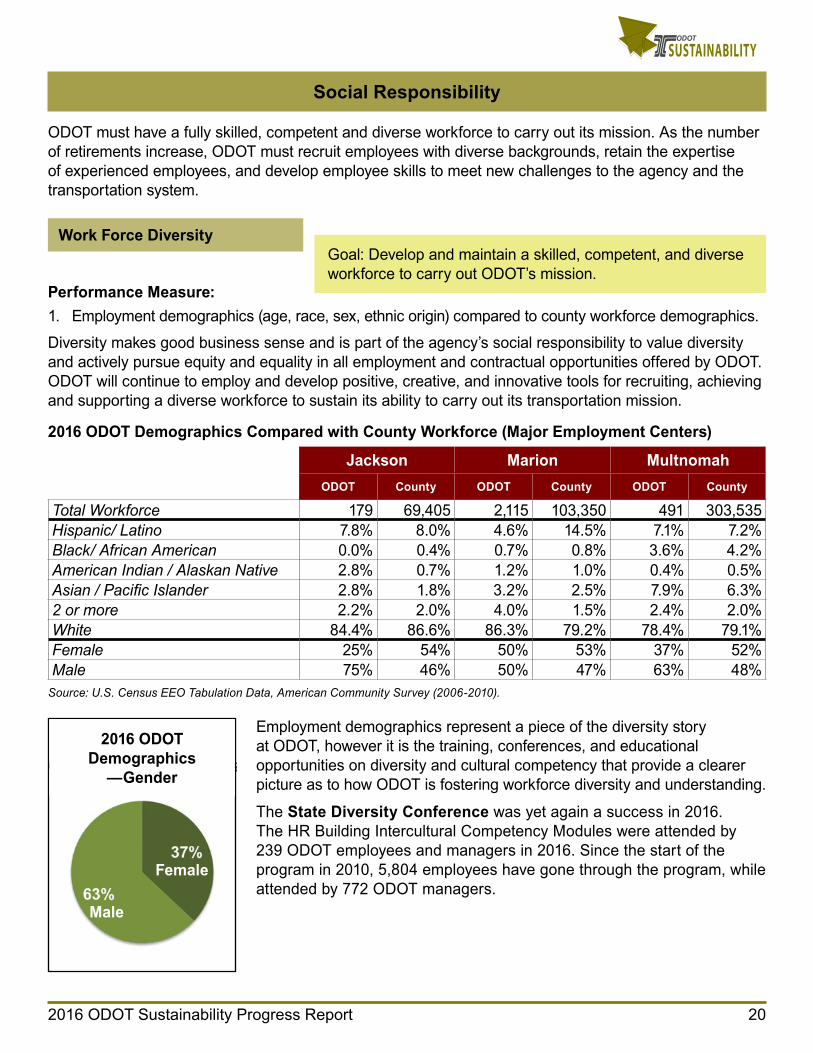
2016 ODOT Demographics Compared with County Workforce (Major Employment Centers)
Jackson Marion MultnomahODOT County ODOT County ODOT County
Total Workforce 179 69,405 2,115 103,350 491 303,535Hispanic/ Latino 7.8% 8.0% 4.6% 14.5% 7.1% 7.2%Black/ African American 0.0% 0.4% 0.7% 0.8% 3.6% 4.2%American Indian / Alaskan Native 2.8% 0.7% 1.2% 1.0% 0.4% 0.5%Asian / Pacific Islander 2.8% 1.8% 3.2% 2.5% 7.9% 6.3%2 or more 2.2% 2.0% 4.0% 1.5% 2.4% 2.0%White 84.4% 86.6% 86.3% 79.2% 78.4% 79.1%Female 25% 54% 50% 53% 37% 52%Male 75% 46% 50% 47% 63% 48%
Source: U.S. Census EEO Tabulation Data, American Community Survey (2006-2010).
Employment demographics represent a piece of the diversity story at ODOT, however it is the training, conferences, and educational opportunities on diversity and cultural competency that provide a clearer picture as to how ODOT is fostering workforce diversity and understanding.
The State Diversity Conference was yet again a success in 2016. The HR Building Intercultural Competency Modules were attended by 239 ODOT employees and managers in 2016. Since the start of the program in 2010, 5,804 employees have gone through the program, while attended by 772 ODOT managers.
Goal: Develop and maintain a skilled, competent, and diverse workforce to carry out ODOT’s mission.
2016 ODOT Demographics
—Gender
Female
Male
2016 ODOT Sustainability Progress Report 21
SUSTAINABILITY
Performance Measures1. Percent of non-seasonal employees leaving the agency with less than five years of service.
The case for talent retention includes several factors, perhaps most importantly maintaining institutional knowledge, bolstering in-house training resources, long-term cost reduction to the taxpayer, and mentoring opportunities for new employees. By sustaining employment, ODOT inherently becomes more sustainable.
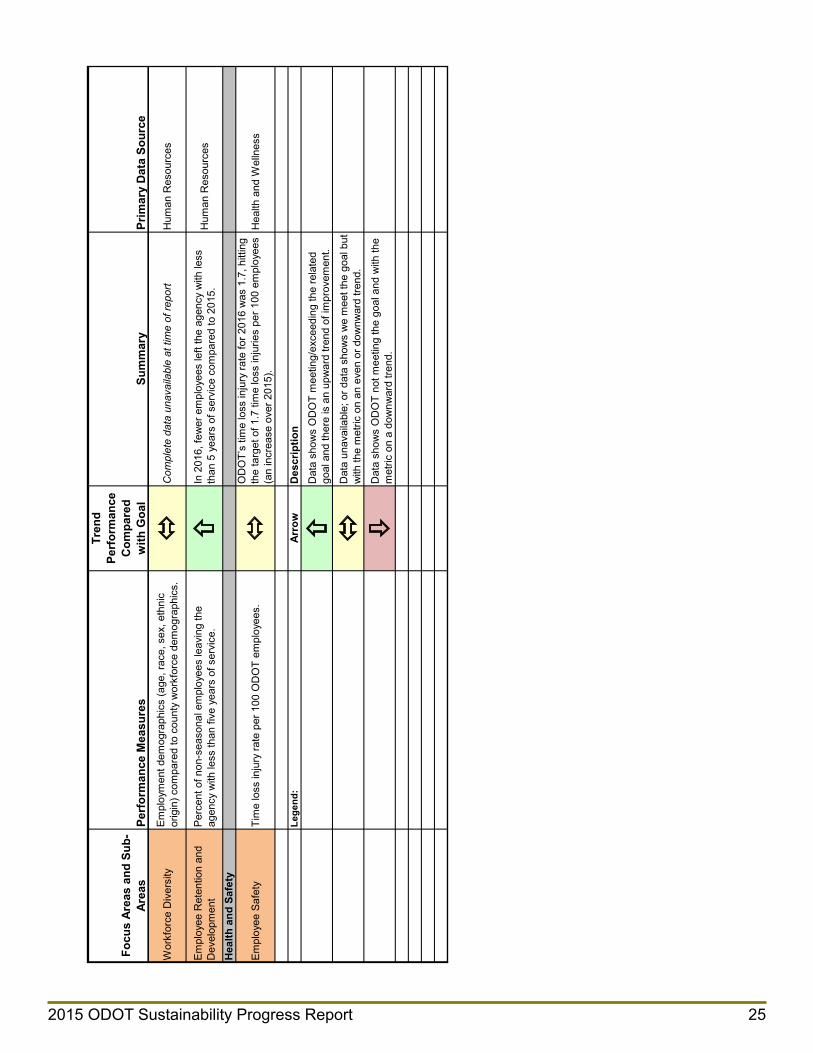
A fewer number of non-seasonal employees left the agency with less than five years of service as compared to Fiscal Year 2015.
Employee Retention and Development Goal: Provide opportunities for career development in order to
retain a fully-skilled and engaged workforce.
Number of Non-Season Employees Leaving ODOT with Less than 5-years of Service (Fiscal Year)
Source: ODOT Human Resources, March 2017

2016 ODOT Sustainability Progress Report 22
SUSTAINABILITY
Health and Safety
To carry out its mission, ODOT relies on a healthy workforce. Its employees, in return, depend on a safe work environment that consistently reduces risk of injury. Health and safety are the basis for maintaining a sustainable workforce.
Performance Measure: 1. Time loss injury rate per 100 ODOT employees.
ODOT’s time loss injury rate for 2016 was 1.7, hitting the target of 1.7 time loss injuries per 100 employees. This is slightly lower than the average of rates for the previous ten years . According to the U.S. Bureau of Labor Statistics, in 2014 the comparable rate for both state and local governments was 1.7. This reflects the injury experience of all state and local government employees, not just Departments of Transportation, which would tend to have a higher exposure to injury risk.
ODOT employees need to be able to rely on a safe work environment that continuously reduces risk of injury. Division and Region Safety Action Plans identify specific activities and expectations related to safety, health, and risk management.
ODOT is committed to a safe and healthy workplace through continuous improvement in safety and workforce management practices, incident prevention strategies and compliance with all state and federal regulations.
Employee Safety Goal: Work towards having zero injuries on the job at ODOT.
Employee Safety - Time loss injury rate per 100 ODOT Employees
2015 ODOT Sustainability Progress Report 23
OD
OT
Sust
aina
bilit
y Pe
rfor
man
ce M
easu
res-
Tre
nds
and
Sum
mar
y (2
016)
Focu
s Ar
eas
and
Sub-
Area
sPe
rfor
man
ce M
easu
res
Tren
d Pe
rfor
man
ce
Com
pare
d w
ith G
oal
Sum
mar
yPr
imar
y D
ata
Sour
ce
Ener
gy/ F
uel U
se a
nd
Clim
ate
Cha
nge
Gre
enho
use
Gas
Em
issi
ons
Tota
l GH
G e
mis
sion
s fro
m O
DO
T's
build
ing,
ene
rgy,
an
d tra
nspo
rtatio
n (fu
el) s
ourc
es.
O
DO
T’s
maj
or fa
cilit
ies
redu
ced
GH
G e
mis
sion
s by
10
2 M
etric
Ton
s ov
er 2
016.
The
veh
icle
flee
t red
uced
G
HG
em
issi
ons
by 2
2.6%
ove
r 201
5, o
r by
6,47
6 M
etric
Ton
s C
O2e
.
Fina
ncia
l Ser
vice
s; D
AS
Build
ing
Ener
gy U
seBu
ildin
g le
vel E
nerg
y U
se In
tens
ity (E
UI)
per s
quar
e fo
ot p
er y
ear.
M
ajor
Fac
ilitie
s re
duce
d en
ergy
use
by
2.9%
ove
r a
2015
bas
elin
e.
Fina
ncia
l Ser
vice
s; D
AS
Flee
t Fue
l Use
Tota
l bio
dies
el a
nd o
ther
alte
rnat
ive
fuel
use
as
perc
ent o
f tot
al fu
el u
se.
O
DO
T ex
ceed
ed it
s bi
odie
sel g
oal a
t 42%
of o
vera
ll fu
el u
se in
201
6.M
aint
enan
ce a
nd O
pera
tions
- Fl
eet P
rogr
amTo
tal n
umbe
r of t
ruck
s us
ing
anti-
idlin
g te
chno
logy
as
a pe
rcen
t of t
otal
truc
k fle
et.
O
DO
T op
erat
es 2
25 tr
ucks
are
usi
ng a
nti-i
dlin
g te
chno
logy
- (2
0% o
f ove
rall
fleet
). M
aint
enan
ce a
nd O
pera
tions
- Fl
eet P
rogr
amH
ybrid
, bes
t-in-
clas
s hi
gh-m
ileag
e ve
hicl
es, a
nd
gaso
line
vehi
cles
usi
ng a
ltern
ativ
e fu
els
as p
erce
nt o
f al
l pas
seng
er s
edan
s.
92%
of O
DO
T's
pass
enge
r fle
et u
tiliz
es a
ltern
ativ
e fu
els
or fu
el s
avin
g te
chno
logi
es.
Mai
nten
ance
and
Ope
ratio
ns -
Flee
t Pro
gram
Empl
oyee
Com
mut
ePe
rcen
t of e
mpl
oyee
s th
at p
artic
ipat
e in
the
mon
thly
tra
nsit
pass
pay
roll
dedu
ctio
n pr
ogra
m.
O
nly
38 e
mpl
oyee
s us
ed th
e tra
nsit
pass
pay
roll
prog
ram
, a d
ecre
ase
of 4
3% fr
om 2
015.
Fina
ncia
l Ser
vice
s
Use
of v
ideo
and
web
con
fere
ncin
g fo
r mee
tings
.
Web
and
vid
eo-c
onfe
renc
ing
use
is o
n th
e ris
e. A
T&T
Con
nect
use
jum
ped
by o
ver 6
60 s
essi
ons.
Mon
thly
vi
deo-
conf
eren
cing
incr
ease
d fro
m 6
0 up
to a
n av
erag
e of
71
hour
s pe
r mon
th.
Info
rmat
ion
Syst
ems
Mat
eria
l Res
ourc
e Fl
ows
Was
te a
nd R
ecyc
ling
at
Maj
or F
acilit
ies
Rec
yclin
g vo
lum
es in
maj
or fa
cilit
ies
O
DO
T re
cycl
ed 1
50,1
73 p
ound
s of
pap
er, 2
85,9
01
poun
ds o
f con
fiden
tial s
hred
, 331
pou
nds
of p
last
ic,
and
42,8
75 p
ound
s of
ele
ctro
nics
.M
ajor
Fac
ilitie
s; G
arte
n Se
rvic
es
Envi
ronm
enta
lly P
refe
rred
Pr
oduc
ts
Amou
nt o
f gre
en o
ffice
sup
plie
s an
d eq
uipm
ent
purc
hase
d by
OD
OT
or p
rovi
de b
y co
ntra
ctor
s.
C
ompl
ete
data
una
vaila
ble
at ti
me
of re
port
Maj
or F
acilit
ies;
Gar
ten
Serv
ices
Pape
r Use
Qua
ntity
of p
rinte
r/ co
pier
pap
er p
urch
ased
by
OD
OT.
OD
OT
redu
ced
its o
ffice
pap
er c
onsu
mpt
ion
by 5
12
carto
ns in
201
6, a
redu
ctio
n of
10%
from
the
prio
r ye
ar.
Cen
tral S
ervi
ces;
Offi
ce M
ax;
Stap
les
2015 ODOT Sustainability Progress Report 24
Focu
s Ar
eas
and
Sub-
Area
sPe
rfor
man
ce M
easu
res
Tren
d Pe
rfor
man
ce
Com
pare
d w
ith G
oal
Sum
mar
yPr
imar
y D
ata
Sour
ce
The
wei
ghte
d av
erag
e of
pos
t-con
sum
er re
cycl
ed
cont
ent o
f prin
ter/
copi
er p
aper
pur
chas
ed.
R
ecyc
led
offic
e pa
per m
ade
up 7
1% o
f OD
OT’
s pa
per p
urch
ase-
up
from
onl
y 46
% in
201
5.C
entra
l Ser
vice
s
Annu
al to
tal f
or D
AS c
opy
cent
er c
osts
.
Dat
a un
avai
labl
e at
tim
e of
repo
rtC
entra
l Ser
vice
s
Envi
ronm
enta
l St
ewar
dshi
pLa
ndsc
apin
g an
d St
orm
wat
er a
t Maj
or
Faci
litie
s
Num
ber o
f lan
dsca
ping
pro
ject
s at
new
or r
enov
ated
m
ajor
faci
litie
s th
at in
clud
e na
tive,
non
-inva
sive
, dr
ough
t tol
eran
t pla
nts.
Th
e M
ill C
reek
offi
ce b
uild
ing
in S
alem
rem
odel
ed it
s la
ndsc
apin
g to
incl
ude
nativ
e an
d dr
ough
t tol
eran
t pl
antin
gs.
Cen
tral S
ervi
ces
Mai
nten
ance
En
viro
nmen
tal
Man
agem
ent S
yste
m
Perc
enta
ge m
easu
re o
f mai
nten
ance
yar
ds fo
llow
ing
the
"mus
t" BM
Ps in
the
seve
n pr
iorit
y pr
oced
ures
of
the
EMS
prog
ram
.
OD
OT
Mai
nten
ance
con
tinue
s to
dem
onst
rate
stro
ng
impl
emen
tatio
n of
the
EMS
with
98%
com
plia
nce
with
pr
iorit
y pr
oced
ures
. O
ffice
of M
aint
enan
ce
Haz
ardo
us M
ater
ials
Amou
nt o
f haz
ardo
us w
aste
gen
erat
ed a
t eac
h m
aint
enan
ce y
ard
and
truck
sho
p ea
ch y
ear,
with
the
goal
of m
aint
aini
ng c
ondi
tiona
lly e
xem
pt s
tatu
s un
der
fede
ral l
aws.
M
aint
enan
ce y
ards
are
suc
cess
fully
redu
cing
was
te
and
mai
ntai
ning
cla
ssifi
catio
n as
Con
ditio
nally
Ex
empt
Haz
ardo
us W
aste
Gen
erat
ors.
O
ffice
of M
aint
enan
ce
Amou
nt o
f "gr
een"
jani
toria
l sup
plie
s pu
rcha
sed
by
OD
OT
thro
ugh
pric
e ag
reem
ents
or p
rovi
ded
by
jani
toria
l con
tract
ors.
Dat
a un
avai
labl
e at
tim
e of
repo
rt
Wat
er U
se a
t Maj
or
Faci
litie
s To
tal r
educ
tion
in n
on-e
ssen
tial w
ater
use
(gal
lons
) at
Maj
or F
acilit
ies.
W
ater
usa
ge d
ecre
ased
by
105,
216
gallo
ns a
t fa
cilit
ies
in O
DO
T's
wat
er u
se tr
acki
ng p
ilot.
Cen
tral S
ervi
ces
Land
Use
and
In
fras
truc
ture
Hig
h Pe
rform
ance
Maj
or
Faci
litie
s
Num
ber o
f non
-exe
mpt
new
maj
or fa
cilit
ies
that
mee
t hi
gh-p
erfo
rman
ce s
tand
ards
(LEE
D o
r SEE
D) o
r eq
uiva
lent
in a
ccor
danc
e w
ith o
ther
sta
te a
genc
y cr
iteria
.
OD
OT
com
plet
ed c
onst
ruct
ion
of a
new
SEE
D c
lass
2
faci
lity
at th
e La
wnf
ield
cam
pus
with
effi
cien
cy 2
0%
bette
r tha
n co
de a
nd in
clud
ed a
6.4
kW
sol
ar a
rray
.
Cen
tral S
ervi
ces
Econ
omic
Hea
lth
Smal
l Bus
ines
s Pr
ogra
m
Perc
ent O
DO
T co
ntra
ct d
olla
rs a
war
ded
to
disa
dvan
tage
d, m
inor
ity, w
omen
, and
em
ergi
ng s
mal
l bu
sine
sses
.
In 2
016,
12.
85%
of c
ontra
ct d
olla
rs w
ere
awar
ded
to
DM
WES
B fir
ms,
mee
ting
the
targ
et.
Smal
l Bus
ines
s Pr
ogra
m
Soci
al R
espo
nsib
ility
/ W
orkf
orce
2015 ODOT Sustainability Progress Report 25
Focu
s Ar
eas
and
Sub-
Area
sPe
rfor
man
ce M
easu
res
Tren
d Pe
rfor
man
ce
Com
pare
d w
ith G
oal
Sum
mar
yPr
imar
y D
ata
Sour
ce
Wor
kfor
ce D
iver
sity
Empl
oym
ent d
emog
raph
ics
(age
, rac
e, s
ex, e
thni
c or
igin
) com
pare
d to
cou
nty
wor
kfor
ce d
emog
raph
ics.
C
ompl
ete
data
una
vaila
ble
at ti
me
of re
port
Hum
an R
esou
rces
Empl
oyee
Ret
entio
n an
d D
evel
opm
ent
Perc
ent o
f non
-sea
sona
l em
ploy
ees
leav
ing
the
agen
cy w
ith le
ss th
an fi
ve y
ears
of s
ervi
ce.
In
201
6, fe
wer
em
ploy
ees
left
the
agen
cy w
ith le
ss
than
5 y
ears
of s
ervi
ce c
ompa
red
to 2
015.
Hum
an R
esou
rces
Hea
lth a
nd S
afet
y
Empl
oyee
Saf
ety
Tim
e lo
ss in
jury
rate
per
100
OD
OT
empl
oyee
s.
OD
OT’
s tim
e lo
ss in
jury
rate
for 2
016
was
1.7
, hitt
ing
the
targ
et o
f 1.7
tim
e lo
ss in
jurie
s pe
r 100
em
ploy
ees
(an
incr
ease
ove
r 201
5).
Hea
lth a
nd W
elln
ess
Lege
nd:
Arro
wD
escr
iptio
n
D
ata
show
s O
DO
T m
eetin
g/ex
ceed
ing
the
rela
ted
goal
and
ther
e is
an
upw
ard
trend
of i
mpr
ovem
ent.
D
ata
unav
aila
ble;
or d
ata
show
s w
e m
eet t
he g
oal b
ut
with
the
met
ric o
n an
eve
n or
dow
nwar
d tre
nd.
D
ata
show
s O
DO
T no
t mee
ting
the
goal
and
with
the
met
ric o
n a
dow
nwar
d tre
nd.