2016 results and 2017-2020 strategy - eni...johan castberg k a z a k h s t a n-kashagan cc01 -...
TRANSCRIPT
2016 results and 2017-2020 strategyA year of records Our path to long term value
1 M A R C H 2 0 1 7

Goliat FPSO
3
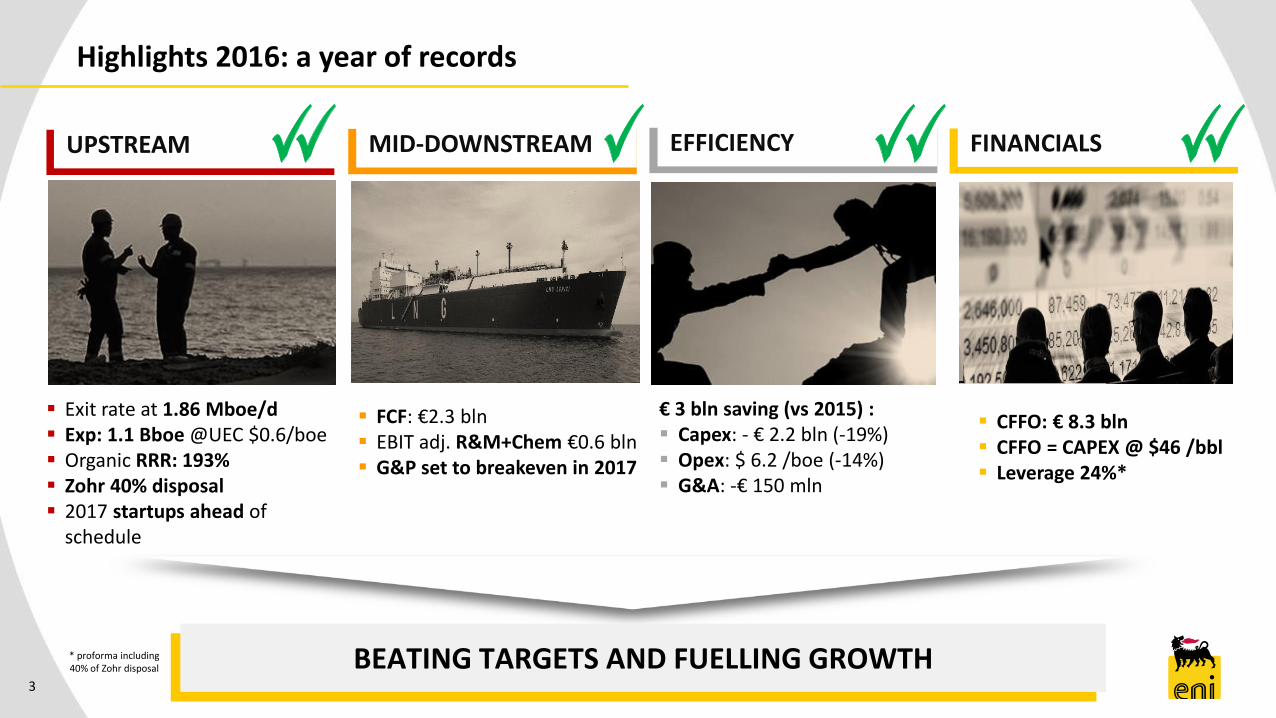
Highlights 2016: a year of records
Exit rate at 1.86 Mboe/d Exp: 1.1 Bboe @UEC $0.6/boe Organic RRR: 193% Zohr 40% disposal 2017 startups ahead of
schedule
MID-DOWNSTREAM
BEATING TARGETS AND FUELLING GROWTH
FINANCIALSUPSTREAM MID-DOWNSTREAM FINANCIALS
FCF: €2.3 bln EBIT adj. R&M+Chem €0.6 bln G&P set to breakeven in 2017
CFFO: € 8.3 bln CFFO = CAPEX @ $46 /bbl Leverage 24%*
EFFICIENCY
€ 3 bln saving (vs 2015) : Capex: - € 2.2 bln (-19%) Opex: $ 6.2 /boe (-14%) G&A: -€ 150 mln
* proforma including40% of Zohr disposal

0
2,000
4,000
6,000
8,000
10,000
2007 2008 2009 2010 2011 2012 2013 2014 2015 2016
0
1
2
3
4
5
2007 2008 2009 2010 2011 2012 2013 2014 2015 2016
4
HSE performance
Upstream Methane Emissions|MtCO2 eq. Flaring down | MSmc
-57%
2016 vs. 2007
-73%
2016 vs. 2007
0
1
2
3
2009 2010 2011 2012 2013 2014 2015 2016
Industryaverage
People Safety – TRIR
-21%2016 vs 2015
Eni top performer since 2013 -9% TCO2eq/Tep: on track to reach 2025 target (-43% since 2014)
HSE OUR TOP PRIORITY
5
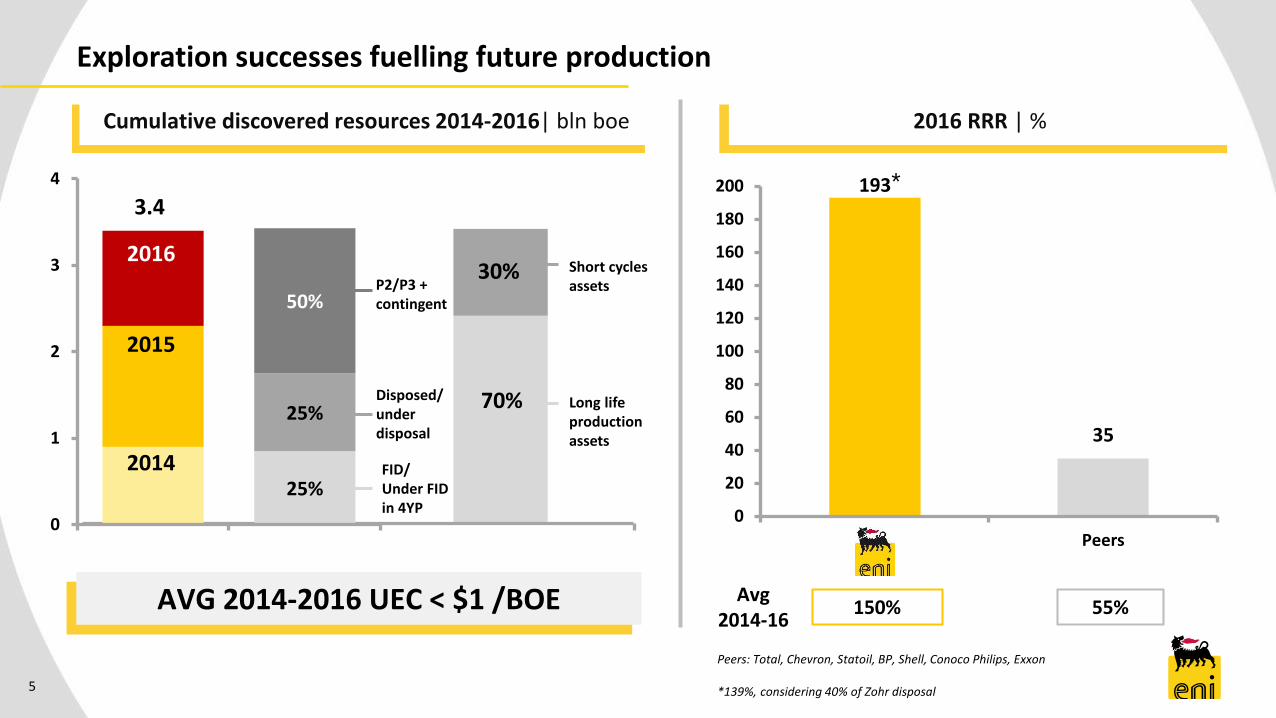
Exploration successes fuelling future production
AVG 2014-2016 UEC < $1 /BOE
Long life production assets
Short cycles assets
70%
30%
Cumulative discovered resources 2014-2016| bln boe 2016 RRR | %
25%
25%
50%
0
1
2
3
4
2014
2015
2016
FID/Under FIDin 4YP
Disposed/under disposal
P2/P3 + contingent
193
35
0
20
40
60
80
100
120
140
160
180
200
eni Peers
*
Avg2014-16
150% 55%
*139%, considering 40% of Zohr disposal
Peers: Total, Chevron, Statoil, BP, Shell, Conoco Philips, Exxon
3.4

100% 95%85%
2017 start ups ahead of schedule
Execution Time 39 months
FIDFID Start-up
IN PRODUCTION 8th February 2017
Project details
Eni working interest: 37% Hydrocarbon: oil Gross Volumes in place Block 15/06
(West + East) > 1.2 bln boe Peak production Bl 15/06 (West + East)
100%: 150 kboe/d
Execution Time 30 months
FIDFID Start-up
June 2017
Project details
Eni working interest: 44% Hydrocarbon: oil & gas Gross Volumes in place: 750 mln boe Peak production 100%: 85 kboe/d
Execution Time 42 months
FIDFID Start-up
June 2017
Project details
Eni working interest: 55% Hydrocarbon: gas Gross Volumes in place: 470 mln boe Peak production 100%: 80 kboe/d
East Hub – Angola OCTP – Ghana JANGKRIK - Indonesia
6

7
Zohr: countdown to first gasDecember
2017
2.3 years from discovery
Aug. 2015
FIRST GAS
Feb. 2016
Zohr 1 Zohr 2 Zohr 3 Zohr 4 Zohr 5 Zohr 6
Exploration & development
FIDDiscovery
Feb. 2016 – Site preparation
Feb. 2017
Zohr 7
Feb. 2017 – Onshore Plant Feb. 2017 – Platform
Site
preparation
Start
piling
Long Lead Items
Progress 50%
Engineering & Proc.
Construction & Installation
Reservoir studies
Start
sealine
laying
Onshore

8
Strong cash generation from mid-downstream
2015 2016
CFFO| € blnEBIT adj| € mln
0
1
2
3
4
2015 2016
G&P Chemicals R&M
569 1933.1 3.0
R&M
Chemicals
G&P
Mid-downstream
ALL BUSINESSES FREE CASH FLOW POSITIVE

9
Relentless focus on cost efficiency
11.5
9.3
2015 2016
-19%
1296
2015 2016
-10%
1445
OVERALL COST OPTIMISATION 2016 vs 2015 € 3 BLN
7.2
6.2
2015 2016
-14%
* Including JV financing
Group Capex*| € bln Opex| $/boe G&A| € Mln

10
2016 leverage and change vs 2013
-5
0
5
10
15
20
25
30
35
40
45
20 30 40 50 60 70
Ch
ange
sin
ce 2
01
3 (
% p
oin
ts)
2016 Leverage [%]
Eni
11.7
13.0
1.02.6 2.9
0
2
4
6
8
10
12
14
16
YE 2015pro-forma
Saipem
YE 2016pro-forma
Zohr
Net debt| € bln
Net Cash Flow Dividends
Disposals pre tax
(incl Zohr)
24%24%22%Leverage
24
Peers adopting scrip dividend
Peers: Total, Chevron, Statoil, BP, Shell, Conoco Philips,Exxon
Best-in-class for financial discipline

11
An outstanding result in 2016
CFFO = CAPEX$ 46 /bbl
CFFO* Capex*
8.3
8.7
* pro-forma, considering the sale of 40% of Zohr and Val d’Agri effect
2016 Cash balance| € bln
vs targets $ 50 /bbl
SLASHING CASH NEUTRALITY SINCE 2013

12

FPSO Angola13

Exploration and long term organic growth are the engine of our strategy
Resources Operations
BUILDING A HIGH MARGIN PORTFOLIO
High impact and conventional exploration
Long term organic growth
Integrated with E&P assets and close to final market
Value
Upstream and G&P integration
Enhancement in the downstream
Active portfolio management
High level of operatorship
Design to cost
Fast track
14

Best positioned to capture upside
Upstream
Production growth CAGR 3%
Exploration resources 2-3 bln boe
2016 Avg. 2017-2020
46
Free cash flow
<45
Capex cash neutrality*
7070
Mid downstream
G&P breakeven in 2017
Refining breakeven at $3/bbl margin in 2018
Efficiency
Capex vs previous plan: -8%
New projects BEP around $30/bbl
Financials
New 4YP disposal target ~€ 5-7 bln
4YP CFFO € 47 bln
*CFFO capex coverage
4YP avgcapex cash neutrality
< $ 45 /bbl
20
17
-20
20
tar
gets
70Brent $/Bl 43.7
*
2020201615

A rich set of exploration opportunities
Gas – 55%
Oil – 45%
Organic growth and replacement
Flexibility and
low break-even
Early monetization
EXPLORATION
2-3 BLN BOE EQUITY RESOURCES
16
17
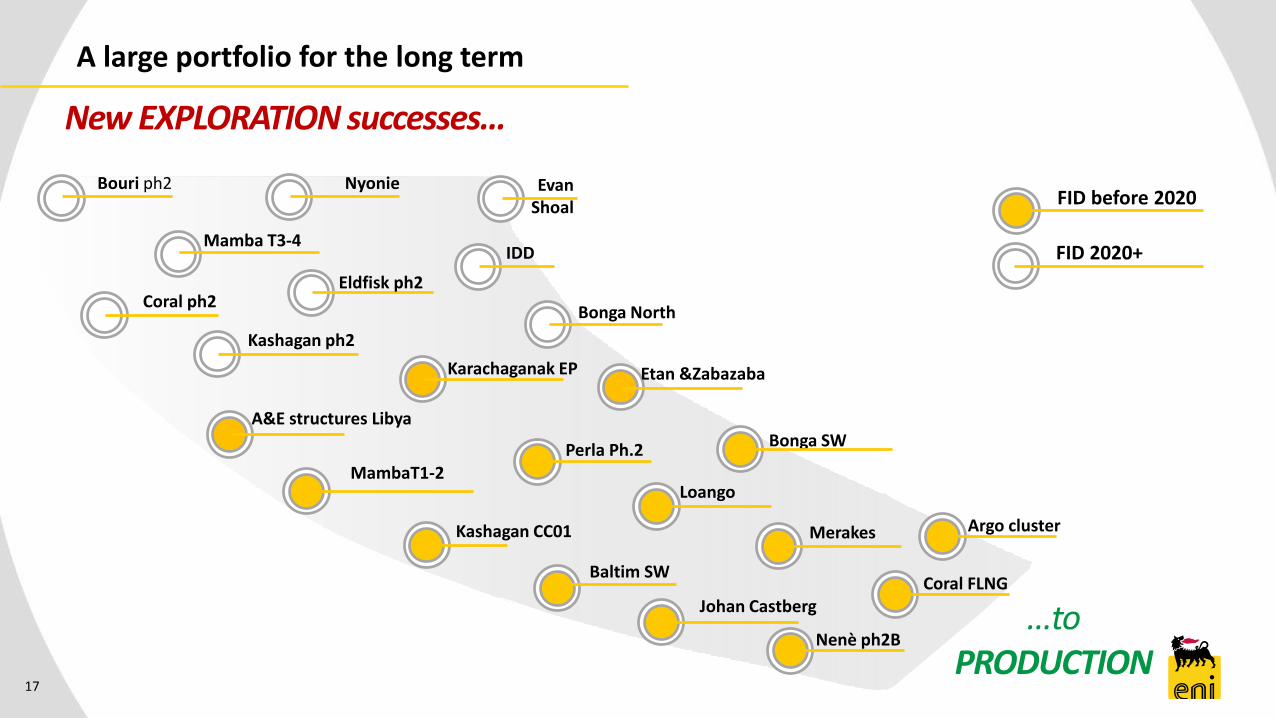
A large portfolio for the long term
New EXPLORATION successes…
FID before 2020
…toPRODUCTION
FID 2020+
Bouri ph2 EvanShoal
Nyonie
Kashagan ph2
Coral ph2
Karachaganak EP
Baltim SW
Merakes
Etan &Zabazaba
Eldfisk ph2
Bonga North
Bonga SWPerla Ph.2
Johan Castberg
Loango
A&E structures Libya
Kashagan CC01
Nenè ph2B
MambaT1-2
Coral FLNG
Argo cluster
Mamba T3-4IDD

L i b y a
Bahr Essalam Ph.2
A&E structures
18
An unrivalled inventory
I t a l y
Argo Cluster
N o r w a y
Johan Castberg
K a z a k h s t a n
- Kashagan CC01
- Karachaganak Ph. 3
I n d o n e s i a
Jangkrik
MerakesM o z a m b i q u e
- Coral
- Mamba T1-T2
- Coral & Mamba
future phases
E g y p t
- Zohr
- Baltim SW
C o n g o
Nenè Ph.2AG h a n a
OCTPV e n e z u e l a
Perla Ph.2
CAGR 2016-2020 3%
CAGR 2020-2025 3%
2016 2017 2020 2025
New projects/ramp ups
A n g o l a
- West hub
- Ochigufu
- Vandumbu
- East hub

11
15
20
5
10
15
20
25
30
2016 2017-18 2019-20
19
High quality long term cash flow
Cash flow per barrel| $/boe4YP
start up29 $/boe
Legacy16 $/boe
Legacy12 $/boe
4YP start up
27 $/boe
57.5 67.5Brent $/Bl 43.7
20
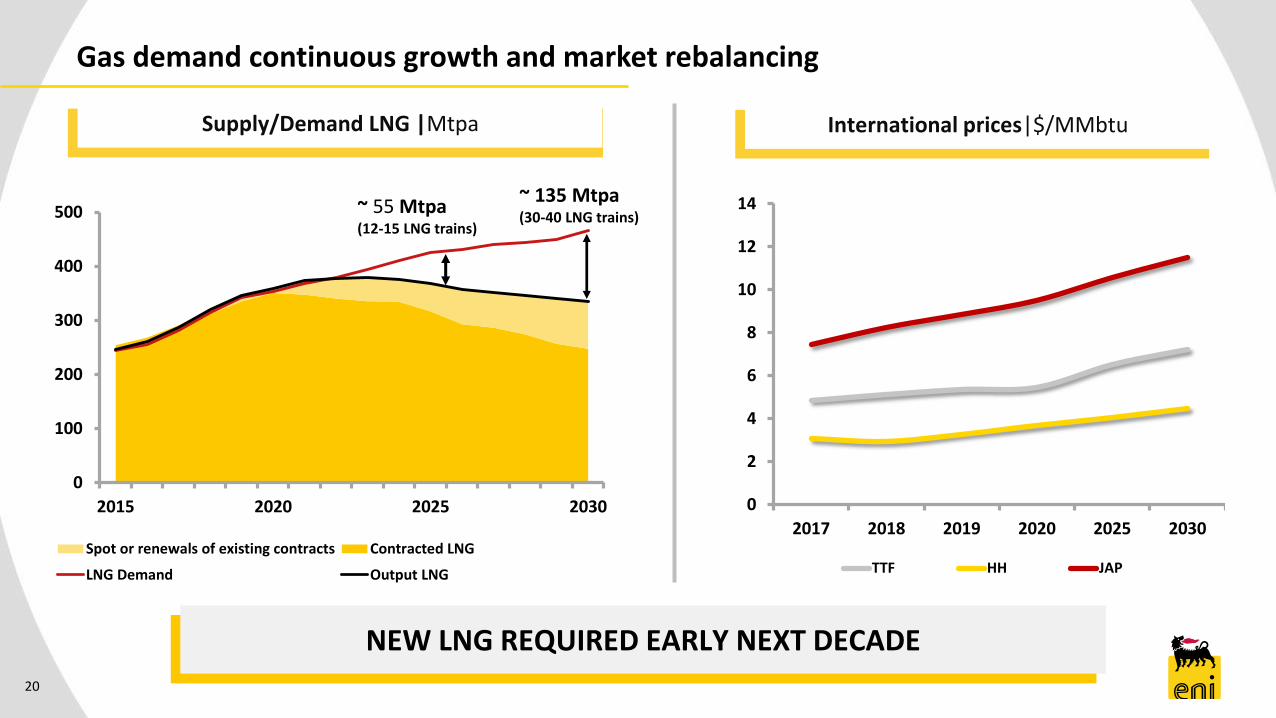
Gas demand continuous growth and market rebalancing
0
100
200
300
400
500
2015 2020 2025 2030
Spot or renewals of existing contracts Contracted LNG
LNG Demand Output LNG
~ 55 Mtpa(12-15 LNG trains)
~ 135 Mtpa(30-40 LNG trains)
0
2
4
6
8
10
12
14
2017 2018 2019 2020 2025 2030
TTF HH JAP
Supply/Demand LNG |Mtpa International prices|$/MMbtu
NEW LNG REQUIRED EARLY NEXT DECADE

21
A turning point for G&P
avg 2017-18 avg 2019-20 2025
~300
> 600 Gas supply contracts aligned to the market
Logistic costs reduction
Equity gas/LNG monetization
Ebit adj| € mln 4YP Action plan
CUMULATIVE CFFO € 2.6 BLN IN THE 4YP

Extracting value from integration
A PORTFOLIO PLAYER INTEGRATED WITH UPSTREAM
3.5
10
2017 2025
Upstream gas productions
22
Midstream Positions
Maximizing value of equity gas
Developing a competitive LNG
portfolio
Leadership position in European
and emerging markets
TargetsFocus on LNG sales | Mtpa

23
Downstream: building on the restructuring
2016 4YP avg./y2016 4YP avg
300
300
600
2016 2020
3
7.5
2013 2018 onwards
2016
4.2
Scenarioupside
Breakeven Refining margin | $/bl
EBIT +€ 300 Mln
self help
@ constant scenario
300
EBIT 2020 € 900 Mln
4.2 5.5SERM
Refining & Marketing EBIT Chemicals | € Mln
4YP CUMULATIVE CFFO > € 4.5 BLN

Capex plan
-8%
0
5
10
15
20
25
30
35
plan 2016-2019 plan 2017-2020
Other
E&P**
34.4*31.6
Other
E&P
€ Bln
Upstream-13%
Production optimizationMandatory
Development of new production
Exploration
IRR (%)
average 2017-20
> 20
15-20
* Excluding JV financing and post SEM application @ constant FX;
** E&P post portfolio
Mid-downstream + New energies
≈10
Capex allocation 2017-20
CAPEX 2017 VS 2016 -18% 55% UNSANCTIONED IN 2019-20
24
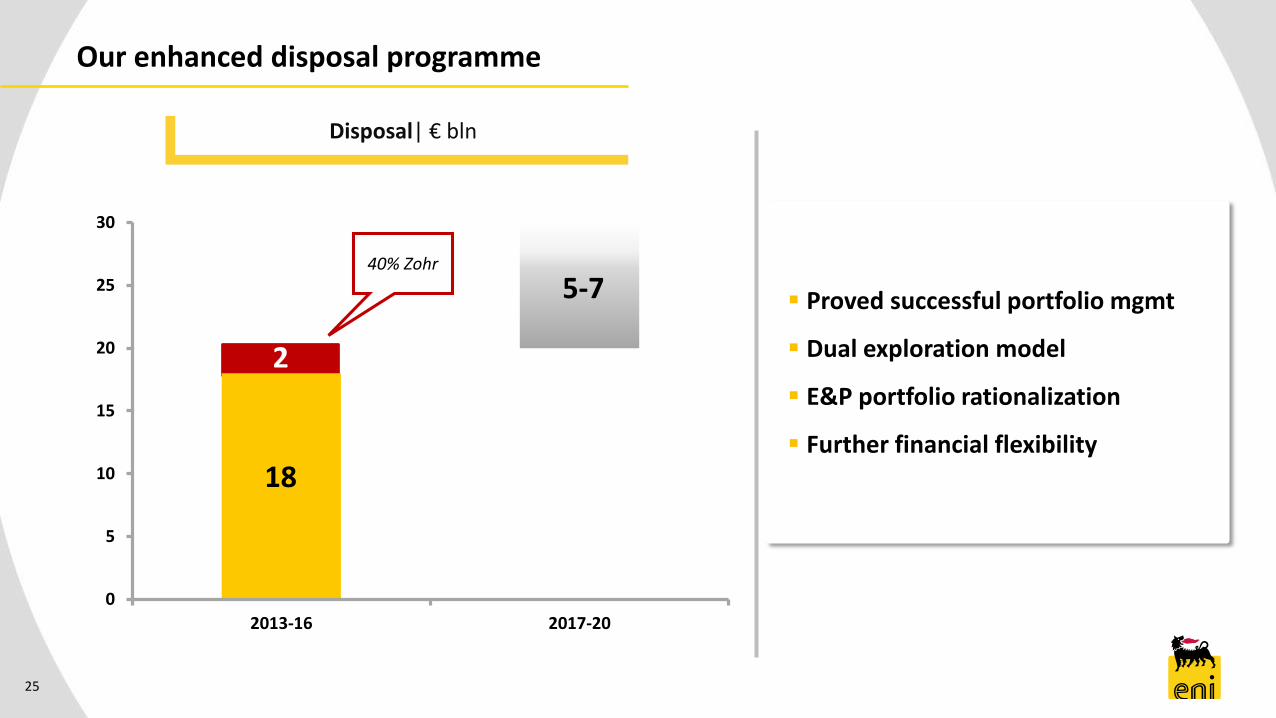
Proved successful portfolio mgmt
Dual exploration model
E&P portfolio rationalization
Further financial flexibility
25
Our enhanced disposal programme
0
5
10
15
20
25
30
2013-16 2017-20
5-740% Zohr
2
18
Disposal| € bln

0,0
2,0
4,0
6,0
8,0
10,0
12,0
14,0
16,0
avg 17-18 avg 19-20
26
Cash Flow plan
CAPEX
scenario
Growth& efficiency
disposal
disposal
other
E&P
other
E&P
€ Bln
57 67Brent $/Bl
27
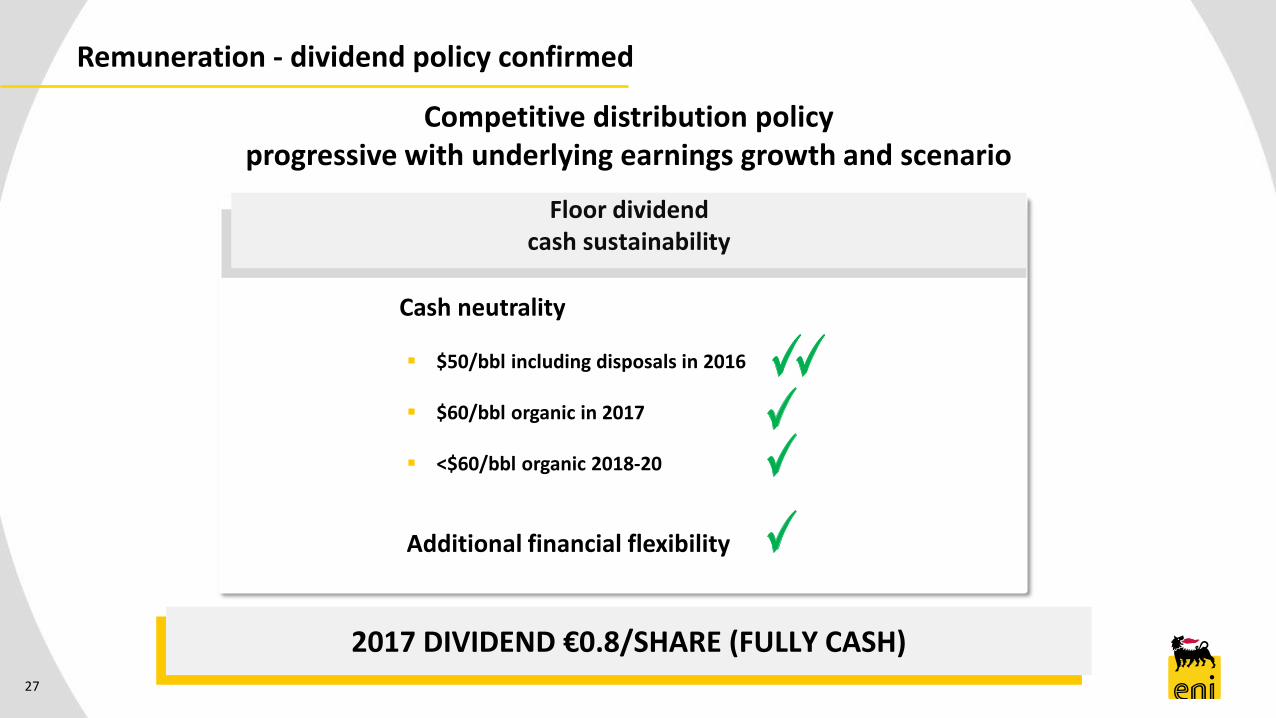
Remuneration - dividend policy confirmed
Competitive distribution policyprogressive with underlying earnings growth and scenario
Cash neutrality
$50/bbl including disposals in 2016
$60/bbl organic in 2017
<$60/bbl organic 2018-20
Additional financial flexibility
Floor dividend cash sustainability
2017 DIVIDEND €0.8/SHARE (FULLY CASH)

Unrivalled exploration
Fast cash generation
Low breakeven portfolio
Strong balance sheet
Highly leveraged to oil price

BACK UP
29

30
New energy solutions
Significant growth of installed capacity
Technology neutral, with focus on hybrid projects
Technological and geographical synergy with other Eni business lines
0
100
200
300
400
500
2017 2018 2019 2020
Energy Solutions installed capacity
2017-2030 Guidelines
MW

Assumptions and sensitivity
31
Ebit adj (bln €) Net adj (bln €) FCF (bln €)
Brent (-1$/bl) -0.3 -0.2 -0.2
Std. Eni Refining Margin (+1$/bl) +0.2 +0.1 +0.2
Exchange rate €/$ (+0.05 $/euro) -0.4 -0.2 -0.2
2017 2018 2019 2020
Brent dated ($/bl) 55 60 65 70
FX avg (€/$) 1.08 1.13 1.15 1.20
Std. Eni Refining Margin ($/bl) 4.0 4.0 4.3 5.5
NBP ($/mmbtu) 5.2 5.3 5.5 5.5
Cracker Contribution Margin (€/ton) 270 260 254 255
4YP Scenario
4YP sensitivity*

32
Main start ups
Main start ups 2017-2018 country op start upEquity peak in 4 YP Working Liquids/Gas
(kboed) Interest
Nenè Ph.2A Congo yes Achieved 20 65% Liquids
Block 15-16 East Hub Angola yes Achieved 20 37% Liquids
OCTP Oil Ghana yes 1H17 20 56% Liquids
Jangkrik Indonesia yes 2H17 45 55% Gas
Zohr Egypt yes 2H17 175 60% Gas
OCTP Gas Ghana yes 1H18 20 56% Gas
West Hub (Ochigufu) Angola yes 1H18 <10 37% Liquids
Bahr Essalam Ph. 2 Libya yes 2H18 70 50% Liquids/gas
Baltim SW (Barakish) Egypt yes 2H19 20 50% Gas
West Hub (Vandumbu) Angola yes 2H19 <10 37% Liquids
Start ups post 2020 country op start upEquity peak Working Liquids/Gas
(kboed) InterestArgo Cluster Italy yes >2020 <10 60% Gas
Marine XII Full Field Congo yes >2020 30 65% Liquids
Coral FLNG Mozambique yes >2020 50 50% Gas
Johan Castberg Norway no >2020 55 30% Liquids
Mamba T1-T2 Mozambique yes >2020 135 50% Gas
Merakes Indonesia yes >2020 30 85% Gas
Bonga SW Nigeria no >2020 20 10% Liquids
Karachaganak EP Kazakhstan yes >2020 40 29% Liquids/Gas
Kashagan CC01 Kazakhstan no >2020 15 17% Liquids/Gas
Loango Congo yes >2020 <10 43% Liquids
A-E structures Libya yes >2020 70 50% Liquids/Gas
Perla ph2 Venezuela yes >2020 85 50% Gas
Mamba next trains Mozambique yes >2020 >100 50% Gas
Coral Phase 2 Mozambique yes >2020 50 50% Gas