2016 revised new voices opperman manuscript complete with authors and tables at end final
TRANSCRIPT
Predicting average marks in tertiary education using cognitive testing and secondary
education performance
Author: Ms Ingrid Opperman
University of the Witwatersrand
+27780679927
PO Box 1220 Lanseria 1748
Co-author: Mr Michael Greyling
Formerly University of the Witwatersrand
Abstract
South Africa faces several challenges in higher education including numbers of graduates
following drives for mass participation. This is a complex problem of which selections are
one component. This institution uses the PIBSpEEx as an adjunct to grade 12 results in
selections. The predictive power of this instrument and secondary schooling results was
investigated in relation to ‘success’ in the form of average marks as well as a pass-fail model.
Results indicated statistical significance for secondary schooling and sub-tests of the
PIBSpEEx although effect sizes were not as expected given international research. This
questions which aspects of cognition, education and selection procedures should be
considered to select students with a higher likelihood of success in the South African context.
Keywords: cognitive assessment, higher education, intelligence, PIBSpEEx, predicting
tertiary education performance
Introduction
In 2009, approximately 521,430 students were enrolled in contact classes in their first year of
study at one of South Africa’s Higher Education Institutions (HEI’s) (Department of Basic
Education, 2010). By 2011 the number of enrolled students had risen to around 556,695
(Department of Higher Education and Training, 2013). In 2011, approximately one half of
tertiary education students were enrolled for degree programs, with around one third being
enrolled at Universities of Technology for National Diploma or Higher Certificate training
programs of a more practical nature. The remaining students were enrolled for post-graduate
Masters and Doctoral courses. This number approximately reflected the previous year’s
enrolment target (Bunting, Sheppard, Cloete, & Belding, 2010). The enrolment target was
specified in line with the promotion of mass participation relevant to students carrying a full
credit load. Despite these efforts, and a doubling of the number of institutions over the 20
years, sub-Saharan Africa evidenced considerably lower enrolment rates than World averages
reflecting enrolments of 6% of the population versus 26% respectively (Montanini, 2013).
Success and graduation rates at South African HEI’s may be reported in a variety of ways.
Bunting et al. (2010) report success rates based on accumulated credits divided by headcount.
These authors report a success rate of 80% at contact institutions in the year 2000. This
represents an increase of 7% since the year 2000 and is in line with the national targets.
However, Letseka and Malle (2008) reported that approximately 16% of students enrolled for
the first year of undergraduate study (degree or diploma) had successfully graduated within
three years. In this case only three year courses were considered. Around 30% of the studied
students had dropped out prior to completion of their first year of study. In their report
regarding the transformation of higher education for the Centre for Higher Education
Transformation, Bunting et al. (2010) reported enrolment and success rates between the years
2000 and 2008. Examination of these figures indicated that the balance of graduates to
enrolments was generally around 10%-12% across any given time period. Both graduate and
enrolment rates had increased in number between 2000 and 2008. However, Bunting et al.
(2010) caution that post-graduate studies, which can take a considerable length of time, were
included in these numbers. Furthermore, in 2011, the South African Department of Higher
Education and Training reported on graduation rates for that time period. In that year,
approximately 160,000 students received a Degree or Diploma from a public HEI, evidencing
a graduation rate of approximately 25% for the 2011 cohort.
From these figures, it would appear that certain aspects of promotion of access to Higher
Education have been met. The national figures appear to match demographic profiles of the
country, despite histories of disadvantage and lack of access to tertiary education (Bunting,
Sheppard, Cloete, & Belding, 2010). However, graduation rates evidenced between different
demographic groups are still notable. Clear inequalities appear to exist in likelihood of
success dependent upon demographic groupings (Department of Higher Education and
Training, 2013). The root cause(s) of this issue are a complex topic which is likely to impact
all facets of higher education functions, including support methods, learning tools, financial
factors and even selection methods utilised in admissions. Additional factors such as
deliberate streaming to foundation programs and identifying support needs may also
contribute to likelihood of success.
South African public HEI’s currently focus primarily on secondary schooling results
(Academic Points Scores or APS) as the primary method of selection into Higher Education
Institutions. In some cases these scores are also utilised to stream students into foundation
(additional year) programs designed to remediate any inequalities in secondary education
schooling. The success of secondary schooling education as an indicator of success in tertiary
education is influenced by additional factors such as teaching quality, curriculum
developments and the ward in which a school is located. Such factors make APS a potentially
unreliable indicator of later achievement, particularly since selection is complicated by large
numbers of students with similar scores. Cognitive assessments may provide an effective
adjunct to APS in identifying potential in applicants, allowing clearer differentiation between
students with similar secondary schooling results or who have received sub-standard
secondary schooling. Institutions in a variety of countries are investigating additional or
adjunct selection methods. For example, English language assessments which have been
demonstrated as influential in multi-lingual countries (Al-Nasir & Robertson, 2001; Ross,
2010; Karakaya & Tavsancil, 2008). Cognitive and learning potential assessments, as well as
academic-type assessments have also been considered as potential predictors of higher
education success (Hartas, Lindsay, & Daniel, 2008). Although some international research
exists to support the use of adjunct assessments, the use of cognitive assessment procedures
for selection in developing countries has not been as thoroughly explored. Differential
qualities of schooling in countries such as South Africa (Cliff & Hanslo, 2009), and
difficulties in the interpretation of cognitive assessments for selection in developing countries
given socio-economic and educational factors (Nettle, 2003), make such interpretations
difficult and in need of further discussion. It is difficult to disentangle the multitude of
relevant variables in order to come to a definitive conclusion as to the most effective method
of selection. Discussion of the components which may be involved in selection, in this case
cognitive testing, should be discussed in light of a number of extraneous and contributing
variables. Discussions should bear in mind the unique challenges experienced by many South
African institutions and students. However, when selecting for limited space in HEI’s,
selection criteria, and potential adjuncts for the improvement of selection procedures, cannot
be ignored. The efficacy of traditional and adjunct selection criteria (such as cognitive
assessments) needs to be scrutinised whilst holding for demographic factors which may also
impact success rates. The question as to the efficacy of cognitive instruments in the South
African context specifically is a complex one which requires investigation of each component
of success individually and interactively.
Literature Review
Tertiary study acts as a valuable tool in social and economic development on both the micro
and macro levels (Kongolo & Imenda, 2012). Education acts as a certification method
allowing entry into the global economy through pursuit of specific careers (Herman, 2010).
In South Africa, a shortage of skills in the labour market has been identified (Letseka &
Malle, 2008). Shortages are compounded by difficulties in breadth of access to higher
education, particularly for previously disadvantaged groupings (Boughey, 2003). A large
number of factors have been identified as impacting both the likelihood of students entering
tertiary education and the likelihood of students exiting HEI’s with a qualification.
Predicting success in tertiary education is challenging, partially due to varying selection foci
and factors impacting success. International studies of a wide variety of environmental and
intrapersonal factors have found only around 4% to 6.5% of variance in academic
performance has been explicable (Bauer & Liang, 2003). Factors have included family
background (Chapman, Lambourne, & Silva, 1990; Hoogerheide, Block, & Thurik, 2012),
culture, gender and socio-economic status (controlling for ability) (Cronbach, 1984; Sewell,
1971). In South Africa and Southern Africa language of instruction and career choice have
also been identified in addition to the factors emerging from international research (Mdepa &
Tshiwula, 2012). Various intrapersonal factors such as personality, conscientiousness and
cognitive ability have also been considered (Busato, Prins, Elshout, & Hamaker, 2000).
International studies focusing on low socio-economic children have identified factors such as
attention, working memory and meta-cognitive control as being less developed. This may
potentially result in the poorer academic performance seen in both secondary and tertiary
study. However, concomitant underdevelopment in language skills was also noted as an
important factor, leading to questions as to which variables play a larger role in educational
outcomes (Jednoro, et al., 2012). Cognitive factors are often cultivated through home and
educational environments, creating a dissimilar expression of similar base levels in
achievement and academic testing (Busato, Prins, Elshout, & Hamaker, 2000). This is
compounded by additional factors specific to the South African context which also have a
strong impact on likelihood of success. However, a comprehensive exploration of the
experiences of previously disadvantaged students in tertiary education did not lead to
conclusive findings. This research, conducted by Malefo (2000), examined stress and coping
as primary variables, as well as considering the impact of family environments of previously
disadvantaged students who were enrolled at historically disadvantaged institutions. Despite
these inconclusive findings, Malefo (2000) did identify a number of important and significant
factors in educational outcomes. Older students achieved better, for example, as did students
with clearly defined limits within the home environment. Additionally, students with a
tendency to use problem-solving focused coping mechanisms were more likely to succeed.
Contrary to much international research, the Malefo (2000) research did not find a
statistically significant relationship between either socio-economic status or occupational
status of parents with academic success. Other research focusing on lecturer perceptions and
student perceptions of factors intrinsic to success has also provided valuable information,
particularly when pre-enrolment and post-enrolment factors are examined. Findings that
strong correlations exist between student and lecturer perceptions of reasons for success,
whilst weak correlations exist as to reasons for failure point to additional factors impacting
success once within the institution. Whilst perceptions of the “successful” student pointed
towards a self-motivated, hardworking and independent student with a satisfactory career
choice, lecturers’ perceptions of a student likely to fail differed to that of the students’ own
perceptions. Lecturers’ perceptions of failure seemed to relate primarily to student
characteristics such as the lack of ability to perform in exams, failure to balance study and
social commitments and an over-commitment to family and work demands. Some aspects
contributing to failure were agreed upon by both groups and reflected in other international
and South African literature, namely, language of instruction/textbooks and career choice
(Fraser & Killen, 2005; Mdepa & Tshiwula, 2012).
It is clear that success in tertiary education is related to a broad variety of factors of which
previous academic performance and current cognitive function are only two. However, a
number of arguments have been put forward for recognition of cognitive potential as a
predictor of academic success, particularly in countries like South Africa with differential
qualities of secondary schooling and university preparation (Cliffordson, 2008; Cliff &
Hanslo, 2009). Some organisations, such as the United Kingdom’s Sutton Trust, have argued
for academic and non-academic assessments. These include interviews, cognitive testing,
additional achievement tests and similar techniques with a focus on admissions and
developmental purposes (West & Gibbs, 2004). Some institutions have found this method to
be marginally more successful in predicting success than the traditional use of Grade 12 or
matriculate results alone. This is particularly true for multi-lingual countries if these types of
predictors are used alongside assessments of English for Academic Purposes (Al-Nasir &
Robertson, 2001; Ross, 2010; Karakaya & Tavsancil, 2008).
Both academic achievement and cognitive assessments have been used successfully in
predicting academic performance and/or potential (Hartas, Lindsay, & Daniel, 2008).
However, cognitive intelligence tests are often inappropriately used as a primary indicator of
potential for success, failing to account for cultural experience and opportunity to develop
required skills (Callahan, 2005). Assessments of skills and abilities, particularly English for
Educational Purposes, have been utilised in South Africa, and elsewhere, fairly successfully
(Cliff & Hanslo, 2009). In multi-lingual countries, non-verbal assessments and ‘learning
potential’ assessments have proven fairly effective (Lohman, 2005). The concepts of
cognition, intelligence and learning potential are somewhat intertwined and may be useful as
an adjunct to purely academic selection criteria, as has been considered in some research.
Intelligence testing is often utilised for selection into elite educational programs, bursary
allocations and developmental opportunities (White, n.d.). However, relationships between
academic success and intelligence may also be a by-product of selection on the basis of
cognitive testing (Neisser, 1997). There is a lack of a clear understanding of the relationship
between academic success and cognitive assessment results, particularly in light of
environmental influences such as familial motivation, parenting, test-wiseness and teaching
methods. For example, higher intelligence parents may produce children with higher
achievement orientations. This orientation correlates with the acceptance of more productive
educational opportunities and, by extension, may increase scoring on intelligence tests. It
remains unclear whether measurable cognitive conceptualisations of intelligence truly play a

role in schooling achievement. Therefore, this method is subject to similar limitations as
previously mentioned factors in predicting academic success. For example, parental
socioeconomic status is often related to intelligence assessment scores, social class and
offspring’s academic achievement (Nettle, 2003) and educational background and schooling
can influence performance on standardised cognitive assessments (Klein, Pohl, &
Ndagijimana, 2007) creating difficulties in predicting academic performance in groupings
with diverse backgrounds.
In the South African context, concepts of culture fairness, in both ability/achievement tests
and cognitive assessments, have been at the forefront particularly regarding issues of
language and test-familiarity impacting the potential placement of students in institutions.
Nevertheless, concrete evidence of cultural bias is difficult to obtain, despite observations of
performance discrepancies between cultural groups (Verney, Granholm, Marshall, Malcame,
& Saccuzzo, 2005). The same applies to members of the different socio-economic groupings
(Nettle, 2003). Since a large number of factors, both intra- and inter-personal, impact
performance on both cognitive assessments and academic study, the debate is likely to
continue. However, the majority of modern cognitive assessments are applicable in a variety
of contexts, including educational, for persons from a variety of cultural and socio-economic
backgrounds (Serpell, 2000; Foxcroft & Roodt, 2005). This research considers the efficacy of
the PIBSpEEx (a cognitive instrument) as a potential cognitive/intelligence predictor of
tertiary education attainment along with the traditional secondary schooling results (APS).
Despite difficulties in test design and usage, cognitive assessments remain a popular method
of identifying potential in modern society.
Although cognitive assessments are grounded in empirical methodologies, a number of
theories and perspectives exist. These perspectives primarily relate to the definition of the
global concepts of verbal and non-verbal intelligence, memory and working memory as
interrelated concepts (Azarmi, Jahangard, & Movassagh, 2012). In line with attempts to
eliminate the aforementioned biases, the PIBSpEEx instrument is designed to assess verbal
and non-verbal concepts without the interference of cultural bias or educational level
(Erasmus, 2004). This instrument reflects a number of factors common to the majority of
cognitive intelligence assessments. These include the capacity to learn and apply new
information (Sternberg & Pretz, 2005), mathematical-logical abilities (Gardner in Azarmi et
al., 2012), encoding of information and eduction of correlates (application of inferred rules)
(Sternberg & Pretz, 2005) as well as meta-cognition, the overarching monitoring of
information, decision making and logical rules (Azarmi, Jahangard, & Movassagh, 2012).
Although definitions of cognitive intelligence are often grounded in psychometric statistical
methods, in other words, intelligence is what intelligence tests measure (Cronbach, 1984),
general application of measures such as the PIBSpEEx have been demonstrated statistically
to be applicable in predicting performance in a variety of contexts based on learning potential
(Erasmus, 2004; Anastasi & Urbina, 1997; Foxcroft & Roodt, 2005).
Concepts of ‘learning potential’ have permeated intelligence and cognitive testing in an effort
to identify individuals able to profit fully from focused training (Cronbach, 1984). The
cognitive processes adopted during tests of cognitive ability rely on the learning of new
concepts and information during the test. This learning may reflect maturity of cognition, a
characteristic desirable in selecting high-potential candidates (Dillon & Schmeck, 1983).
Tests of cognitive potential may be useful in selecting high ‘learning potential’ candidates for
tertiary education – a concept which may encompass both intelligence and cognitive maturity
in both the verbal and non-verbal spheres. These relationships may be, in part, due to more
advanced meta-cognitive skills seen in high potential candidates. In addition to meta-
cognition, studies have demonstrated that verbal and non-verbal intelligence are related to
successful performance despite being prone to language proficiency biases (Lohman, 2005).
Verbal and numerical items have demonstrated higher correlations with academic success
than non-verbal items (Lohman, 2005). Regardless of the type of items used in cognitive
assessments, it is also clear that the assessment of potential for academic study cannot be
separated from necessary minimum levels of academic proficiency, complicating tasks of
attempting to separate poor quality of secondary schooling from potential for further study
(Haeck, Yeld, Conradie, Robertson, & Shall, 1997)
Currently, the important aptitudes for future success in education systems are current
achievement in the relevant domain (as reflected by final secondary school results) and the
ability to reason using a symbol system within which the new knowledge will be
communicated (this ability is related to complex verbal and numerical abilities as well as
‘fluid’ or de-contextualised intelligence) (Lohman, 2005). In this investigation, the
PIBSpEEx and APS were focused on as individual predictors and dual predictors. The APS
alone or alongside the PIBSpEEx are used by this institution in the selection of students for
admission. It is essential to understand whether or not the two types of assessment are able to
statistically predict tertiary results effectively and, if so, to what extent. Therefore, the
primary focus of the study was an analysis of the psychometric properties and potential
statistical predictive power of the instrument and APS. A statistical focus is typical of studies
in this area and is generally followed by more qualitative consideration of the instrument’s
scales (Cronbach, 1984; Anastasi & Urbina, 1997). Follow up theoretical considerations of an
instrument’s items and scales are useful in assessing the importance of specific skills inherent
in the instrument. The complete statistical investigation rested on a basic research question:
Can APS and PIBSpEEx scores predict tertiary education outcomes in National Diploma
students at a University of Technology? Consideration of the content of the scales, along with
emerging extraneous variables, was intended to be the focus of a discussion of the statistical
findings. This aim was intended to facilitate understanding of the statistical findings and to
identify potentially useful additional predictors.
Methods
The study was grounded in an empirical quantitative design and data type. As a descriptive
and correlational study, archival data was collected and analysed without manipulation or
alteration except in the respect of missing data (see “Data and Sampling”). Prior to
commencement of the study, ethical clearance was obtained from the relevant institutional
ethics committees (departmental and institutional). In addition, permission was obtained from
the Registrar for the use of institutional data. All students who completed the assessment
underwent a verbal informed consent procedure. During the informed consent procedure, the
possibility of utilisation of results in research was discussed and agreed to. All data utilised
was archival and remained confidential and in the care of the researcher with limited access.
The data was anonymised prior to analyses and no personal information was utilised for
reporting purposes.
Data and Sampling
The final sample consisted of National Diploma students and applicants at a University of
Technology in South Africa. Archival data from the 2010 and 2011 intake applications was
obtained, consisting of students who were : (a) enrolled at the institution; (b) had written the
PIBSpEEx assessment but were not accepted or had not enrolled or; (c) had written the
PIBSpEEx assessment and enrolled at the institution. Since not all students or applicants had
written the assessment for admissions and not all of those who wrote the assessment were
admitted, a multiple imputation procedure (Rubin’s) with five iterations was utilised in order
to compensate for missing data in the independent variables. Missing demographic data was
not imputed. In this case, approximately two-thirds of the PIBSpEEx scores were missing
within the total sample. Rubin’s multiple imputations allows for the imputing of m number of
missing values (in this case for five iterations). The data set is then complete and allows for
full statistical analysis without the shortfalls involved in uneven group numbers or large
amounts of missing data (Hunt, Lunneborg, & Lewis, 1975). Unfortunately, this method has
several short-falls. Firstly, the accuracy of the imputed data, despite being within the required
ranges, is unknown. Although the imputed model should fit the aspects of the various
distributions relevant for analysis, the data will still be subject to sampling variability (von
Hippel, 2012). This is likely to reduce the statistical power evidenced making it less likely
that a ‘real world’ effect will be evidenced. It is possible that a study utilising imputed data
may produce lower effect sizes than a similar study consisting of a full original data set. As a
result, the weaknesses involved in utilising multiple imputations in this study were fairly
evident during analysis and discussion. The interpretation of correlation coefficient and effect
sizes produced should be examined bearing in mind the aforementioned limitation. Multiple
imputation procedures do account for missing data from a statistical perspective but fail to
account for range restriction. Range restriction was an unavoidable by-product of the sample
obtained. This is as a result of applicants and accepted students being required to meet the
institution’s minimum requirements. Additionally, only a limited number of students, often
within a restricted APS bracket, were required to write the PIBSpEEx assessment. Range
restrictions may impact the strength of correlation coefficients and the magnitude of effect
sizes. Generally these statistics are likely to be less accurate in either direction when range
restriction is present (Howitt & Cramer, 2011).
Demographic data was only obtainable for groups (a) and (c), indicating a fairly equal split
between Males (54.40%) and females (45.60%) and the majority of students (>45% in total)
belonging to the North Sotho, Tswana and Zulu ethnic groups. These same languages were
spoken by the majority of students. Sample sizes varied depending upon the variable
examined producing a grand total of over 4000 cases. Tables 1 and 2 summarise the
demographic profile of the sample.
Table 1 here
Table 2 here
Instruments
PIBSpEEx battery
The Potential Index Batteries and Situation Specific Evaluation Expert scales (PIBSpEEx)
provide a comprehensive assessment package for assessing human potential in a culture fair
manner and allowing for secondary education levels of less than Grade 12 (Erasmus, 2004).
The cognitive scales utilised in this study consider constructs of potential divided into broad
areas of intelligence, namely, Conceptualisation (integration on visual information), Mental
Alertness (understanding of implied differences in English words), Calculations (based on
word and series problems), Observance (understanding of implied differences in pictorial
information), Reading Comprehension with a memorisation component, Insight (the ability to
infer and manipulate verbal information) and Object Assembly (spatial reasoning and
manipulation). The assessment consists of forced choice options with a timed component,
each sub-test being timed separately for a total of approximately 1 ½ hours of testing. When
first instituted at this institution the instrument accounted for between 60% and 90% of
variance in academic performance of National Diploma students. Criterion validity
coefficients at this time ranged between .34 and .68 being significant at either the .05 or .01
level. Inter-item consistency reliability coefficients utilising the Kuder-Richardson formula
ranged from .68 to .87 (Kriel, 2002).
Academic points scores
Academic point scores are based on levels of achievement in Grade 12 subjects. The scores
are based on the percentages achieved in specific subjects during final Grade 12 exams and
calculated as follows: Scores are added together for the highest six subjects taken (excluding
Life Orientation) to provide a total APS. Candidates must have taken English as a language
(home or 1st additional) and either Mathematics or Mathematical Literacy dependent upon the
course of study applied for. Points are calculated as follows: 0%-29% = 1; 30%-39% = 2;
40%-49% = 3; 50%-59% = 4; 60%-69% = 5; 70%-79% = 6 80%-100% = 7.
Average results
Exam averages were calculated based on all subjects taken by the student as an average.
Therefore, mid-year and end of year exam results comprised part of the average score. Exam
papers are set and marked by the academic departments and lecturers concerned, under the
control of the University of Technology. Marks are assigned and averages reflected as a
grade out of 100 in the form of a percentage.
Results
Preliminary analyses of instruments
The 2010 and 2011 intakes were analysed separately for the purposes of inferential statistics
to better understand potential differences due to year of intake given changing secondary
educational standards or other factors.
The PIBSpEEx subscales yield a minimum possible score of 1 with a maximum possible
score of 10. The Total Scale is the culmination of the 7 sub scales with a possible range of 7
to 70. The majority of scales fell within normal levels of skewness and kurtosis with only
minor deviations from the -1.000 to +1.000 value range in a few cases.
Table 3 here
Reliablity analyses provided Cronbach’s Alpha values of α=.697 in the 2010 intake and α=
.733 in the 2011 intake. These figures are somewhat lower than generally reported in most
studies of the reliability of cognitive assessments (Anastasi & Urbina, 1997). No scale
deletions would have caused the values to increase for the Total scale. Item-Total correlations
were similar across the seven scales indicated - none appears to be insignificant or over-
contributing.
Some differences were observed between the 2010 and 2011 imputed data sets in terms of
APS scores. The following table of descriptive statistics was obtained for the pooled results.
Some APS scores are below the published level of entry for National Diploma courses but
were present in the data obtained from institutional records.
Table 4 here
For both intakes, the majority of cases fell within the 20-28 points bracket. A Log10
transformation produced skewness values closer to normal limits than originally evidenced.
Statistics of kurtosis demonstrated a leptokurtic distribution with the majority of values
truncated towards the central and lower points of the distribution. This was most probably a
product of the range restriction alluded to earlier.
Academic results are the cumulative average of all modules/subjects averaged over all years
of study regardless of whether the student has passed or failed. The descriptive statistics
produced here apply to the pooled results.
Table 5 Here
Demographic differences in the dependent variables
Significant (p<.05) differences were found in APS, PIBSpEEx scores and average marks for
almost all demographic variables. It is unclear as to whether these differences were due to
sampling size, error or random fluctuations. In most cases the effect sizes and PS (probability
of superiority) values obtained were small or approaching 50% in the case of PS values.
Three specific differences are worth noting as they produced larger effect sizes and PS
values. Firstly, students who had obtained a Bursary or NSFAS funding were more likely to
have higher APS scores and perform better in their first year of tertiary study. The same is
true of students living in the residences. These differences held across both the 2010 and
2011 intake for the pooled results. English and Afrikaans students also exhibited higher APS
and PIBSpEEx scores. This language difference, however, was only present for the 2011
intake. For the language variable, effect sizes remained small (𝜂𝑃𝐴𝑅𝑇𝐼𝐴𝐿2 =0.017) indicating a
possibility that differences were due to sampling or random error.
Prediction of average mark: linear, multiple, stepwise and logistic regressions
Initial correlational analyses (Pearson’s r) between the variables produced significant
coefficients (p<.05) but relatively small coefficients of determination (<5% in most cases).
The initial multiple regression models examined the seven PIBSpEEx scales utilised. These
scales were combined as predictors per year of intake producing a significant model for both
2010 (F=13.692, p<.001) and 2011 (F=16.217, p<.001) intakes. Examination of standardised
regression coefficients (β) indicated the relative strength of relationship for each predictor in
the model with the strongest emerging being the Insight, Observance, Conceptualisation and
Reading Comprehension scales. These variables formed the basis for stepwise regression
models for both the 2010 and 2011 intakes. The order of entry for the variables was obtained
by the creation of multiple regression models with two independent variables in order to
ascertain the order of ‘contribution’ and identify the strongest predictors. Note that when APS
was utilised, the Log10 transformed variable was used unless otherwise stated.
The stepwise regression model for the 2010 intake achieved statistical significance
(F=26.436, p<.001).
Table 6 Here
The following standardised regression β values and their relative significance in the
predictive model were produced:
Table 7 Here
In 2011, the following model achieved statistical significance (F=34.729, p<.001):
Table 8 here
The following standardised β weights and their associated significance were produced for this
stepwise model.
Table 9 here
The results indicate that the addition of the new variables did provide a significant increase to
the predictive power of the models (note that Conceptualisation was replaced by Reading
Comprehension in the 2011 intake). The remaining four variables (not included in the
stepwise models) did not account for much more than an additional 0.3% of variance in either
intake. Only the Observance scale achieved statistical significance in the 2011 model.
It appears that the Observance and Insight scales, used as combined predictors, are the
strongest predictive variables in the PIBSpEEx instrument when accounting for variance in
average mark. Both appear to contribute to the power of the stepwise model in predicting
average mark and were therefore utilised as part of the basis when creating a stepwise model
which included APS as a predictor variable. Additional variables were then re-selected
holding APS as the initial variable with the process of many regression models being re-
analysed to again ascertain which variables explained the largest amount of variance and
should be included in the second set of models.
Stepwise regression: best predictors of average marks.
Stepwise regression models were created using APS as the initial variable (entered first). The
remaining variables were selected by examination of a series of multiple (two predictor)
regression models, each adding one PIBSpEEx scale individually (i.e. a series of two variable
regression models). The scales explaining the most additional variance in combination with
APS were utilised in order of amount of variance explained. For the 2010 intake, the full
model was statistically significant (F=46.008, p<.001). The following changes in variance
were observed:
Table 10 here
The individual predictors produced the following standardised regression coefficients and
associated levels of significance:
Table 11 here
The full model explained a total of 4.7% of variance in average mark. Academic points score
alone explained 3.0% of the total variance. The introduction of the Insight scale was
significant (F=43.862, p<.001), explaining a further 1.1% of variance. Further addition of the
Observance scale to the model was also significant (F=18.746, p=.023), albeit at the 5%
rather than 1% level and only explaining a further 0.5% of variance. Introduction of the
Conceptualisation scale did produce significant change (F=6.364, p=.048), accounting for a
further 0.2% of variance. It appears, in the case of this model, that the introduction of the
Insight scale alongside APS was fairly useful but introduction of the Observance and
Conceptualisation scales did not produce particularly impressive results in terms of
percentage of variance explained. Despite the significance of the model and changes in
variance explained, only the APS predictor proved statistically significant in this model.
In the 2011 year of entry, the full model utilised APS score, Observance, Insight and Reading
Comprehension in that order of priority. The model was statistically significant (F=58.461,
p<.001). The following coefficients of determination and changes in variance explained with
the introduction of additional predictors were found:
Table 12 here
Academic points score described approximately 3.0% of a total of 4.8% of variance.
Introduction of the Observance variable was significant (F=28.706, p<.001), explaining a
further 0.7% of variance. Introduction of the Insight scale explained an additional 0.9% of
variance and was significant (F=33.861, p=.005). However, introducing the Reading
Comprehension scale did not produce significant change (F=7.663, p=.157), explaining a
further 0.2% of variance. The individual predictors produced the following standardised
regression coefficients and associated significance levels:
Table 13 here
The APS variable proved significant. The Observance scale also proved significant at the 1%
level. Based on this information, it appears that variance in average mark is attributable
primarily to APS and the Observance scale. This is of interest in comparison to the 2010
intake model, in which the introduction of first Insight and then Observance scales were both
significant.
In order to understand such complex relationships in a more practical fashion, logistic
regression was conducted to better understand increased likelihoods of simple pass versus fail
outcomes. A variety of predictors were considered in relation to pass versus fail as a
dichotomous variable.
Logistic regressions
APS as a predictor of likelihood pass/fail.
Since logistic regression does not assume normal distribution in continuous predictor
variables (Burns & Burns, 2009), the non-transformed APS variable was utilised for an
accurate result in terms of specific increases in units. The results of the analysis for the 2010
intake produced a significant model (χ2=115.509, p<.001) indicating a significant difference
after the introduction of the predictor variable. Each unit increase in APS (i.e. each point of
score) was associated with an increase of 1.081 (8.1%) in likelihood of passing or failing
which, despite being statistically significant (W=108.633, p<.001) does not seem particularly
impressive on a practical level. In the 2011 intake, a similarly significant model was
produced (χ2=87.216, p<.001). The result observed was a likely increase of 1.063 (6.3%)
(W=79.292, p<.001) being associated with every one point increase in APS.
Specific PIBSpEEx scales as predictors of likelihood of pass/fail.
The results of the logistic regression models as per PIBSpEEx scale are presented in the
following table.
Table 14 here
The results indicate that increases in the Observance scale produce a higher likelihood of
passing than increases in the Insight scale. While examination of the PIBSpEEx Total scale
demonstrated a 3.2% (2010) and 3.5% (2011) increase in likelihood to pass with each unit
increase, the individual scales Observance and Insight seem to function somewhat better. In
neither intake did the Insight scale achieve statistical significance (p>.05) as a predictor.
Potentially, for practical purposes, the PIBSpEEx scale Observance may be more impressive
than APS if non-normal distributions are considered, as is the case when range restrictions
are unavoidable. It is possible that the simplification of the average mark variable into a
binary variable reduced the effects of outliers, altering the predictive power of the PIBSpEEx
scales.
Discussion
Although cognitive assessments have been strongly correlated to schooling success in the
past, primarily in developed countries (Neisser, 1997), it is worth noting that wide variation
exists in type of cognitive assessment used and the underlying measurable skills (Anastasi &
Urbina, 1997). It has previously been suggested that cognitive skills may develop only in
specific contexts and their effects on education may be masked by differences in socio-
economic status, quality of schooling and other factors (Wagner, 1978). However, certain
skills may be ‘released’ by appropriate education, potentially providing a conceptual link
between underlying cognitive ability and its ability to predict educational outcomes. For
example, improvement in academic results following study skills improvement has been
linked to increased meta-cognitive skills and problem solving styles (Villares, Frain,
Brigman, Webb, & Peluso, 2012).
Prior to discussion, a number of barriers to full interpretation of the results of this study
should be discussed. Firstly, cognitive skills development and expression is influenced by a
variety of factors. Although these are global factors, more unique South African factors may
contribute to incongruence with international findings. These factors include large cohorts of
previously disadvantaged students from low socio-economic status backgrounds, differing
perspectives regarding the impact of certain skills on the likelihood to fail and a potentially
poor grasp of the English language (not explored here). In this case, although correlations and
models achieved statistical significance, the effect sizes of the results were somewhat lower
than those seen in similar international studies. This may be partially due to the pre-selection
of the majority of sample within the institution’s requirements along with the lack of
PIBSpEEx data for a large number of admitted students, resulting in the necessity to impute
missing data. Imputed data is well known to increase sampling variability, thereby producing
lower effect sizes than if a full data set had be utilised (von Hippel, 2012). As a result, should
a full data set have been present, it is possible that the statistical significance evidenced may
have been accompanied by stronger effect sizes. This would have provided a more conclusive
feel to the findings. Although it is not possible to say whether the lower predictive power and
effect sizes evidenced here were due to range restriction, imputation procedures or effect
sizes, it does appear that the instruments may have some real world significance as part of a
predictive model.
Since the PIBSpEEx purports to measure underlying skill sets, free of schooling, a logical
path of enquiry leads to the question of what cognitive constructs are important for secondary
and tertiary study but are not necessarily formally examinable in terms of achievement
outcomes. Since the Observance and Insight scales appear to be better predictors,
investigation of this relationship should almost certainly begin there. As indicated previously,
both these scales appear to deal with the capacity to draw conclusions from detailed, complex
observation as well as tapping into logical reasoning and abstract conceptualisation skills.
Unlike other scales, the Observance scale does not rely heavily on English language ability
since no unusual or out of context language was utilised. Therefore, this scale is likely to
measure learning potential in terms of the ability to identify new processes, syntheses and
solutions rather than through skills reliant upon English language abilities.
It can be reasonably hypothesised that cognitive processes such as attention to detail, logical
reasoning, inference of missing information and abstraction through focused attention are
important for tertiary study. International studies have noted similar relationships utilising a
variety of cognitive and reasoning assessments, particularly involving reasoning utilising
some form of symbol system in non-verbal assessments (Lohman, 2005). The PIBSpEEx,
like other cognitive assessments, purports to utilise the ability to grasp new skills and
concepts (Erasmus, 2004). The focus of most cognitive assessments is on problem solving
and reasoning to better understand potential for academic success, amongst other areas
(Matarazzo, 1972; Sternberg & Pretz, 2005). The value of the Observance and Insight scales
as predictors seems to lie in problem solving ability, reasoning skills and concept formations.
In the case of the Insight scale, knowledge and comprehension of semantics does not appear
as prominent as in the Mental Alertness scale or, indeed, the Calculations scale. Since the
Insight scale primarily consists of reasoning utilising deduction, inferences, reconstruction of
words and letters and in-depth interpretation of the consequences of reversals and re-
arrangements, it appears that these are more important skills in predicting academic success.
Speed and time limit considerations are important in understanding the predictive capacity of
the Observance and Insight scales. General observation of the testing processes indicated that
students were able to finish all questions on these two scales well within the time limit.
Studies on the Scholastic Aptitude Test, utilised in the United States of America for college
entry, indicated that additional time was only advantageous to lower ability students and,
even then, only up to a limited point. After this point, the length of testing without breaks
made a lengthened time limit disadvantageous (Mandinach, Bridgeman, Cahalan-Laitusis, &
Trapani, 2005). However, in an examination of a specific cognitive assessment, a Canadian
study found that removal of time limits improved performance. This was most marked in
students with poor understanding of the language in which the assessment was conducted
(Mullane & McKelvie, 2001). Given that the majority of the students did not cite English as
their home language, it is certainly possible that a combination of potentially poor English
skills or forward and back translation during the assessment along with the strict time limits
impacted the assessment results, particularly for the poorly operating scales (Mental
Alertness, Calculations, etc.).
Grade 12 examinable material is fairly loaded on English language skills, with the exception
of language specific papers. The PIBSpEEx purports to assess functionality in cognitive skill
for a specific context and, therefore, instructions and tests are presented in English. This is
due to the fact that the language of learning in tertiary education at this particular institution
is exclusively English. From this alone, it is reasonable to conclude that the English language
skills of the student have a bearing on later success. If language of instruction is used,
throughout schooling, to construct cognitive concepts and skills, it is clear that lack of
proficiency in such a language (or proficiency being acquired in a different language) will
impact schooling results (Cantoni, 2007). However, the two concepts are interlinked,
whereby improvement in literacy and reading is often tied to improvement of cognitive and
meta-cognitive skills such as awareness, monitoring and regulating (Torgerson, 2007). It is
almost impossible to disentangle the separate effects of English proficiency and cognitive
ability. This problem is evidenced by difficulties in producing and understanding language
and culture fair testing even when non-verbal assessments are used. The impact of English
skills on the PIBSpEEx assessment and other facets was, in this study, relatively unknown
since English proficiency was not directly measured. It is worth noting that requiring more
complex understanding of vocabulary or meaning (e.g. Mental Alertness, word problems in
Calculations) provided weaker correlations with both APS and average mark. This is a
curious artefact since one would expect that if a scale were loaded in English and study was
loaded in English a common denominator would provide a stronger relationship. From this it
appears fairly clear that other factors are at play in success during studies although English
language may be a limiting or overarching factor. In addition, it is possible that this factor
contributed to the lower than the norm alpha values exhibited in this instrument.
Conclusion and Recommendations
Based on the results of this study, it appears that the PIBSpEEx does contribute significantly
to a base predictor of APS value in predicting average mark in tertiary study at a University
of Technology. Despite limitations and relatively small effect sizes, it appears that cognitive
assessments may be a valuable adjunct to the traditional Grade 12 results in selecting high
potential students who are likely to succeed in National Diploma courses. However, this
cognitive assessment should certainly not be used in isolation. Based on these findings, it is
noteworthy that neither of these selection criteria performed as well as expected within the
models utilised. As a result, the consideration of additional procedures such as interviews as
well as identification of student needs, developmental areas and support requirements within
the institutions may be essential. Further research into the cause of lower than expected
predictive power of Grade 12 results as well as the potential predictive power of specific
Grade 12 results may provide clarity on this issue, particularly as regards English language
ability. It is not useful to promote elite selection in a country identified for the promotion of
mass participation, although the necessity of some form of selection for students most likely
to succeed should be attended to, particularly given the strong dependence on external
funding for studies.
Given the challenges South Africa, and other developing countries, face in HEI’s, selection is
only one component of a larger scale focus in ensuring student success. In this case, this
particular cognitive assessment demonstrated some value although it was insufficient to draw
firm conclusions and further investigation is required. This is at odds with aforementioned
literature indicating stronger statistically predictive values in cognitive assessments as part of
selection criteria. Although promotion of mass participation was in reaction to low skills
bases within the country, tertiary institutions are currently still facing challenges in producing
the numbers of graduates required. In order to rectify this, a number of factors as outlined
require consideration in order to effectively stream students and increase chances of success
to benefit both the individual and the broader economy.
References
Al-Nasir, F. A., & Robertson, A. S. (2001). Can selection assessments predict students'
achievements in the premedical year?: A study at Arabian Gulf University. Education
for Health, 14(2), 277-286.
Anastasi, A., & Urbina, S. (1997). Psychological Testing (7th ed.). New Jersey: Prentice-
Hall, Inc.
Azarmi, B., Jahangard, A., & Movassagh, H. (2012). Learner's test performance and
Gardner's multiple intelligence theory: Intercorrelation in a bilingual context. Broad
Research in Artificial Intelligence and Neuroscience, 3(4), 51-55.
Bauer, K., & Liang, Q. (2003). The effect of personality and precollege characteristics on
first year activities and academic performance. Journal of College Student
Development, 44(3), 277-290.
Boughey, C. (2003). From equity to efficiency: Access to higher education in South Africa.
Arts and Humanities in Higher Education, 2(1), 65-71.
Bunting, I., Sheppard, C., Cloete, N., & Belding, L. (2010). Performance Indicators in South
African Higher Education 2000-2008. Centre for Higher Education Transformation.
Burns, R. P., & Burns, R. (2009). Business Research Methods and Statistics Using SPSS.
Sage Publications Ltd.
Busato, V. V., Prins, F. J., Elshout, J. J., & Hamaker, C. (2000). Intellectual ability, learning
style, personality, achievement motivation and academic success of psychology
students in higher education. Personality and individual differences, 29(6), 1057-
1068.
Callahan, C. M. (2005). Identifying gifted students from underrepresented populations.
Theory Into Practice, 44(2), 98-104.
Cantoni, M. (2007). What role does the language of instruction play for a successful
education? A case study of the impact of language choice in a Namibian school.
Vaxjo Universitet.
Chapman, J. W., Lambourne, R., & Silva, P. A. (1990). Some antecedents of academic self-
concept: A longitudinal study. British Journal of Educational Psychology, 60(2), 142-
152.
Cliff, A., & Hanslo, M. (2009). The design and use of 'alternate' assessments of academic
literacy as selection methods in higher education. Southern African Linguistics and
Applied Language Studies, 27(3), 265-276.
Cliffordson, C. (2008). Differential prediction of study success across academic programmes
in the Swedish context: The validity of grades and tests as selection instruments for
higher education. Educational Assessment, 13, 56-75.
Cronbach, L. J. (1984). Essentials of Psychological Testing. New York: Harper & Row,
Publishers, Inc.
Das, J. P. (1986). On Definition of Intelligence. In R. J. Sternberg, & D. K. Detterman (Eds.),
What is Intelligence? Contemporary viewpoints on its nature and definition (pp. 55-
56). New Jersey: Ablex Publishing Corporation.
Department of Basic Education. (2010). Education statistics in South Africa 2009.
Department of Higher Education and Training. (2013). Statistics on Post-School Education
and Training in South Africa: 2011. Department of Higher Education and Training.
Retrieved from http://www.dhet.gov.za/
Dillon, R. F., & Schmeck, R. R. (1983). Individual Differences in Cognition (Vol. 1). New
York: Academic Press.
Erasmus, P. F. (2004). JP Expert / PIBSpEEx 2100: The new generation situation-specific
job-profiling and assessment system (2nd Revised ed.). Johannesburg: Potential Index
Associates.
Foxcroft, C., & Roodt, G. (2005). An introduction to Psychological Assessment in the South
African Context (2nd ed.). Cape Town: Oxford University Press Southern Africa.
Fraser, W., & Killen, R. (2005). The perceptions of students and lecturers of some factors
influencing academic performance at two South African universities. Perspectives in
Education, 23(1), 25-40.
Haeck, W., Yeld, N., Conradie, J., Robertson, N., & Shall, A. (1997). A developmental
approach to mathematics testing for University admissions and course placement.
Educational Studies in Mathematics, 33, 71-91.
Hartas, D., Lindsay, G., & Daniel, M. (2008). Identifying and selecting able students for the
NAGTY summer school: Emerging issues and future considerations. High Ability
Studies, 19(1), 5-18.
Herman, H. D. (2010). School-leaving examinations, selection and equity in Higher
Education in South Africa. Comparative Education, 31(2), 261-274.
Hoogerheide, L., Block, J. H., & Thurik, R. (2012). Family background variables as
instruments for education in income regressions: A Bayesian analysis. Economics of
Education Review, 31(5), 515-523.
Howitt, D., & Cramer, D. (2011). Introduction to Statistics in Psychology (5th ed.). Pearson
Education Limited.
Hunt, E., Lunneborg, C., & Lewis, J. (1975). What does it mean to be high verbal? Cognitive
Psychology, 7, 194-227.
Jednoro, K., Altarelli, I., Monzalvo, K., Fluss, J., Dubois, J., Billard, C., . . . Ramus, F.
(2012). The influence of socioeconomic status on childrens' brain structure. PLoS
ONE, 7(8), 1-9.
Karakaya, I., & Tavsancil, E. (2008). The predictive validity of the university student
selection examination. Educational Sciences: Theory and Practice, 8(3), 1011-1019.
Klein, O., Pohl, S., & Ndagijimana, C. (2007). The influence of intergroup comparisons on
Africans' intelligence test performance in the job selection context. The Journal of
Psychology, 141(5), 453-467.
Kongolo, M., & Imenda, S. N. (2012). Institutional type preferences of South African higher
education students. Research in Higher Education Journal, 15, 1-18.
Kriel, H. (2002). The predictive validity of SpEEx in potential assessment in an academic
institution. Technikon Pretoria.
Letseka, M., & Malle, S. (2008). Human Sciences Research Council. Retrieved April 01,
2012, from Human Sciences Research Council: http://www.hsrc.ac.za/Document-
2717.phtml
Lohman, D. F. (2005). The role of nonverbal ability tests in identifying academically gifted
students: An aptitude perspective. The Gifted Child Quarterly, 49(2), 111-138.
Malefo, V. (2000). Psycho-social factors and academic performance among African women
students at a predominantly white university in South Africa. South African Journal of
Psychology, 30(4), 40-45.
Mandinach, E. B., Bridgeman, B., Cahalan-Laitusis, C., & Trapani, C. (2005). The Impact of
Extended Time on SAT® Test Performance. New York: The College Board.
Matarazzo, J. D. (1972). Wechsler's Measurement and Appraisal of Adult Intelligence.
Baltimore: Waverly Press, Inc.
Mdepa, W., & Tshiwula, L. (2012). Student diversity in South African Higher Education.
Widening Participation and Lifelong Learning, 13(Special Issue), 19-33.
Montanini, M. (2013). Supporting tertiary education, enhancing economic development:
Strategies for effective Higher Education funding in sub-Saharan Africa. Instituto per
Gli Study di Politica Internazionale.
Mullane, J., & McKelvie, S. J. (2001). Effects of removing the time limit on first and second
language intelligence test performance. Practical Assessment, Research &
Evaluation, 7(23).
Murphy, K. R., & Davidshofer, C. O. (1998). Psychological Testing: Principles and
Applications (4th ed.). New Jersey: Prentice-Hall.
Necka, E., & Orzechowski, J. (2005). Higher Order Cognition and Intelligence. In R. J.
Sternberg, & J. E. Pretz (Eds.), Cognition and Intelligence: Identiifying the
mechanisms of the mind (pp. 122-141). Cambridge: Cambridge University Press.
Neisser, U. (1997). Rising scores on intelligence tests. American Scientist, 85(5), 440-447.
Nettle, D. (2003). Intelligence and class mobility in the British population. British Journal of
Psychology(94), 551-561.
Ross, E. (2010). Selection tests and social justice: A profile of applicants seeking admission
to the Social Work undergraduate degree at a South African university. Social Work
Education, 29(5), 459-474.
Rubin, D. B. (1987). Multiple Imputation for Nonresponse in Surveys. New York: John Wiley
& Sons.
Rubin, D. B. (1987). Multiple Imputation for Nonresponse in Surveys. New York: John Wiley
& Sons.
Serpell, R. (2000). Intelligence and Culture. In R. J. Sternberg (Ed.), Handbook of
Intelligence (pp. 549-577). New York: Cambridge University Press.
Sewell, W. H. (1971). Inequality of opportunity for higher education. American Sociological
Review, 36(5), 793-809.
Sternberg, R. J., & Pretz, J. E. (2005). Cognition and Intelligence: Identifying Mechanisms of
the Mind. New York: Cambridge University Press.
Sternberg, R. J., & Pretz, J. E. (2005). Preface. In R. J. Sternberg, & J. E. Pretz (Eds.),
Cognition and Intelligence: Identifying mechanisms of the Mind (pp. vii-xii). New
York: Cambridge University Press.
Torgerson, C. J. (2007). The quality of systematic reviews of effectiveness in literacy
learning in English: a 'tertiary' review. Journal of Research in Reading, 30(3), 287-
315.
Verney, S. P., Granholm, E., Marshall, S. P., Malcame, V. L., & Saccuzzo, D. P. (2005).
Culture fair cognitive ability assessment: Information processing and
psychobiological approaches. Assessment, 12(3), 303-319.
Villares, E., Frain, M., Brigman, G., Webb, L., & Peluso, P. (2012). The impact of student
success skills on standardized test scores: A meta-analysis. Counseling Outcome
Research and Evaluation, 3(1), 3-16.
von Hippel, P. (2012). Should a normal imputation model be modified to impute skewed
variables? Sociological Methods and Research, 42(1), 105-138.
Wagner, D. A. (1978). The effects of formal schooling on cognitive style. The Journal of
Social Psychology, 106, 145-151.
West, A., & Gibbs, R. (2004). Selecting undergraduate students: What can the UK learn from
the American SAT? Higher Education Quarterly, 58(1), 63-67.
White, J. (n.d.). Intelligence testing in education. Education Journal(97), 15.
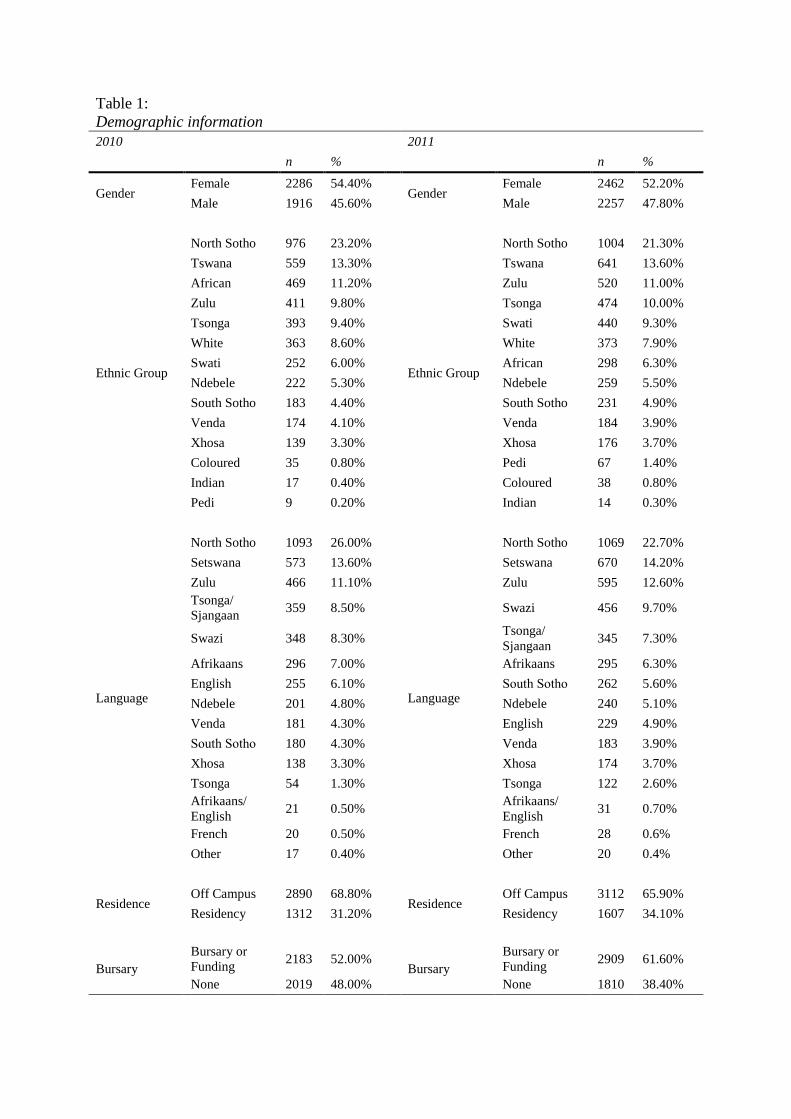
Table 1:
Demographic information
2010
2011
n %
n %
Gender Female 2286 54.40%
Gender Female 2462 52.20%
Male 1916 45.60%
Male 2257 47.80%
Ethnic Group
North Sotho 976 23.20%
Ethnic Group
North Sotho 1004 21.30%
Tswana 559 13.30%
Tswana 641 13.60%
African 469 11.20%
Zulu 520 11.00%
Zulu 411 9.80%
Tsonga 474 10.00%
Tsonga 393 9.40%
Swati 440 9.30%
White 363 8.60%
White 373 7.90%
Swati 252 6.00%
African 298 6.30%
Ndebele 222 5.30%
Ndebele 259 5.50%
South Sotho 183 4.40%
South Sotho 231 4.90%
Venda 174 4.10%
Venda 184 3.90%
Xhosa 139 3.30%
Xhosa 176 3.70%
Coloured 35 0.80%
Pedi 67 1.40%
Indian 17 0.40%
Coloured 38 0.80%
Pedi 9 0.20%
Indian 14 0.30%
Language
North Sotho 1093 26.00%
Language
North Sotho 1069 22.70%
Setswana 573 13.60%
Setswana 670 14.20%
Zulu 466 11.10%
Zulu 595 12.60%
Tsonga/
Sjangaan 359 8.50%
Swazi 456 9.70%
Swazi 348 8.30%
Tsonga/
Sjangaan 345 7.30%
Afrikaans 296 7.00%
Afrikaans 295 6.30%
English 255 6.10%
South Sotho 262 5.60%
Ndebele 201 4.80%
Ndebele 240 5.10%
Venda 181 4.30%
English 229 4.90%
South Sotho 180 4.30%
Venda 183 3.90%
Xhosa 138 3.30%
Xhosa 174 3.70%
Tsonga 54 1.30%
Tsonga 122 2.60%
Afrikaans/
English 21 0.50%
Afrikaans/
English 31 0.70%
French 20 0.50%
French 28 0.6%
Other 17 0.40%
Other 20 0.4%
Residence Off Campus 2890 68.80%
Residence Off Campus 3112 65.90%
Residency 1312 31.20%
Residency 1607 34.10%
Bursary
Bursary or
Funding 2183 52.00%
Bursary
Bursary or
Funding 2909 61.60%
None 2019 48.00%
None 1810 38.40%
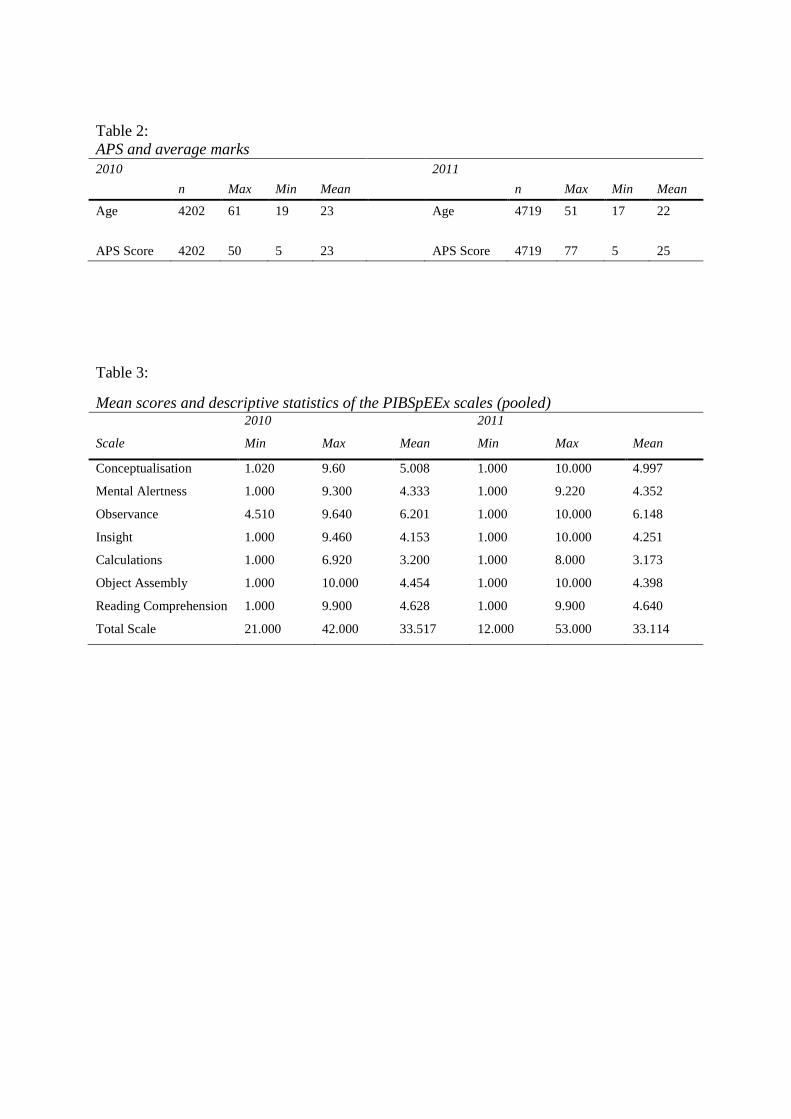
Table 2:
APS and average marks
2010
2011
n Max Min Mean
n Max Min Mean
Age 4202 61 19 23
Age 4719 51 17 22
APS Score 4202 50 5 23
APS Score 4719 77 5 25
Table 3:
Mean scores and descriptive statistics of the PIBSpEEx scales (pooled) 2010 2011
Scale Min Max Mean Min Max Mean
Conceptualisation 1.020 9.60 5.008 1.000 10.000 4.997
Mental Alertness 1.000 9.300 4.333 1.000 9.220 4.352
Observance 4.510 9.640 6.201 1.000 10.000 6.148
Insight 1.000 9.460 4.153 1.000 10.000 4.251
Calculations 1.000 6.920 3.200 1.000 8.000 3.173
Object Assembly 1.000 10.000 4.454 1.000 10.000 4.398
Reading Comprehension 1.000 9.900 4.628 1.000 9.900 4.640
Total Scale 21.000 42.000 33.517 12.000 53.000 33.114
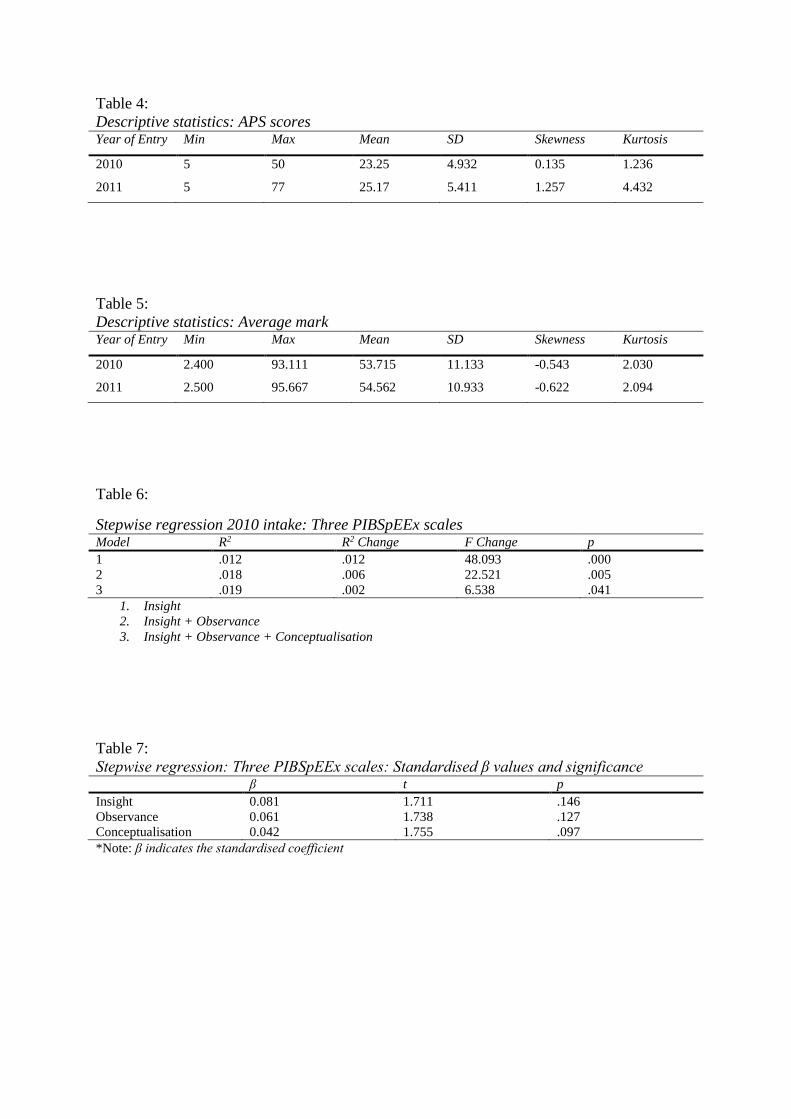
Table 4:
Descriptive statistics: APS scores Year of Entry Min Max Mean SD Skewness Kurtosis
2010 5 50 23.25 4.932 0.135 1.236
2011 5 77 25.17 5.411 1.257 4.432
Table 5:
Descriptive statistics: Average mark Year of Entry Min Max Mean SD Skewness Kurtosis
2010 2.400 93.111 53.715 11.133 -0.543 2.030
2011 2.500 95.667 54.562 10.933 -0.622 2.094
Table 6:
Stepwise regression 2010 intake: Three PIBSpEEx scales Model R2 R2 Change F Change p
1 .012 .012 48.093 .000
2 .018 .006 22.521 .005
3 .019 .002 6.538 .041
1. Insight
2. Insight + Observance
3. Insight + Observance + Conceptualisation
Table 7:
Stepwise regression: Three PIBSpEEx scales: Standardised β values and significance β t p
Insight 0.081 1.711 .146
Observance 0.061 1.738 .127
Conceptualisation 0.042 1.755 .097
*Note: β indicates the standardised coefficient
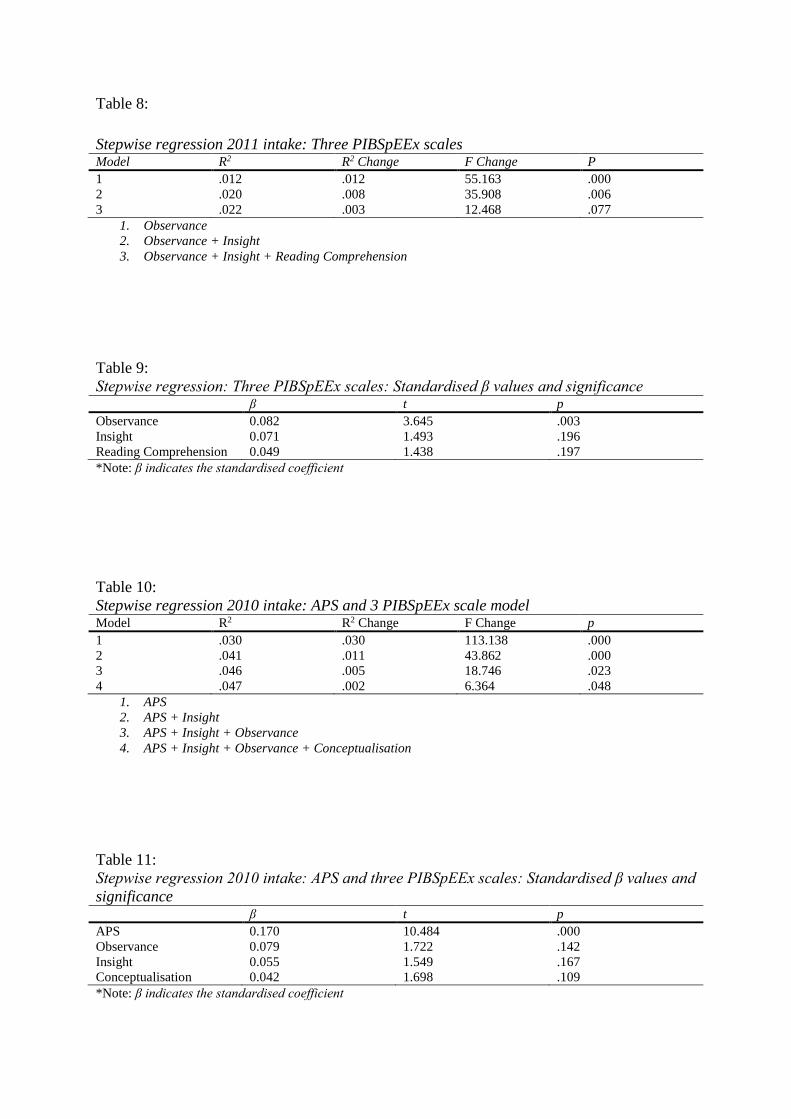
Table 8:
Stepwise regression 2011 intake: Three PIBSpEEx scales Model R2 R2 Change F Change P
1 .012 .012 55.163 .000
2 .020 .008 35.908 .006
3 .022 .003 12.468 .077
1. Observance
2. Observance + Insight
3. Observance + Insight + Reading Comprehension
Table 9:
Stepwise regression: Three PIBSpEEx scales: Standardised β values and significance β t p
Observance 0.082 3.645 .003
Insight 0.071 1.493 .196
Reading Comprehension 0.049 1.438 .197
*Note: β indicates the standardised coefficient
Table 10:
Stepwise regression 2010 intake: APS and 3 PIBSpEEx scale model Model R2 R2 Change F Change p
1 .030 .030 113.138 .000
2 .041 .011 43.862 .000
3 .046 .005 18.746 .023
4 .047 .002 6.364 .048
1. APS
2. APS + Insight
3. APS + Insight + Observance
4. APS + Insight + Observance + Conceptualisation
Table 11:
Stepwise regression 2010 intake: APS and three PIBSpEEx scales: Standardised β values and
significance β t p
APS 0.170 10.484 .000
Observance 0.079 1.722 .142
Insight 0.055 1.549 .167
Conceptualisation 0.042 1.698 .109
*Note: β indicates the standardised coefficient
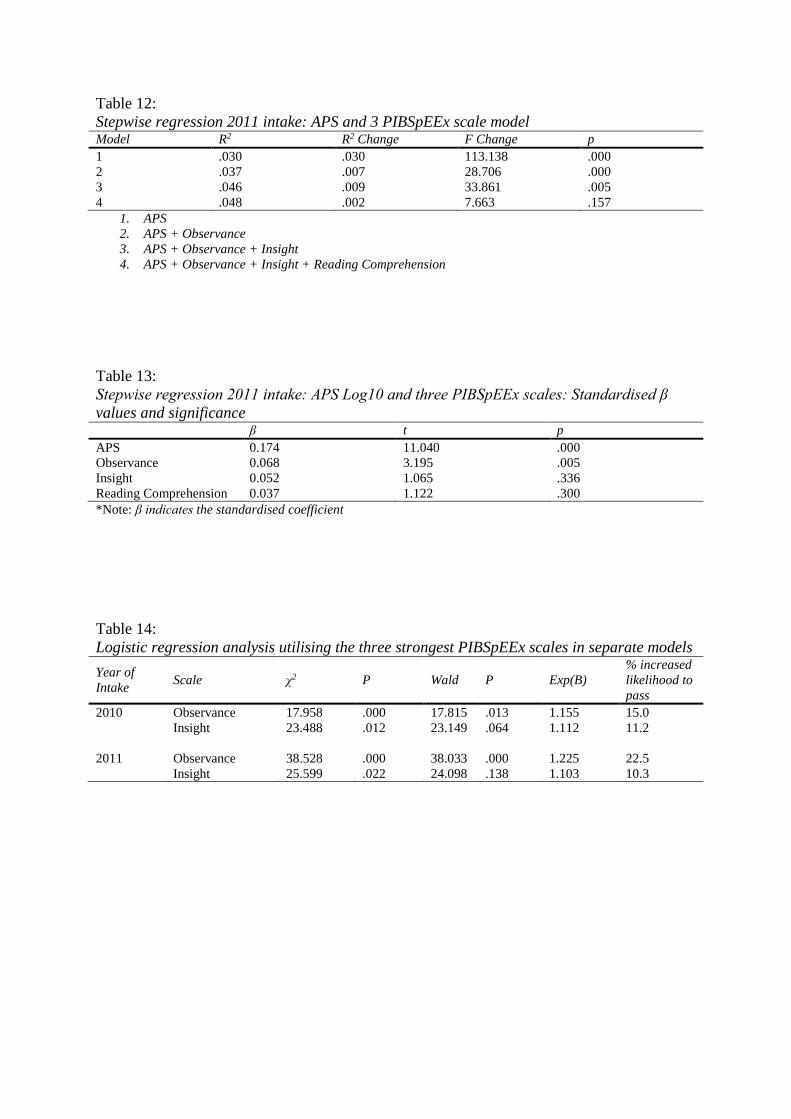
Table 12:
Stepwise regression 2011 intake: APS and 3 PIBSpEEx scale model Model R2 R2 Change F Change p
1 .030 .030 113.138 .000
2 .037 .007 28.706 .000
3 .046 .009 33.861 .005
4 .048 .002 7.663 .157
1. APS
2. APS + Observance
3. APS + Observance + Insight
4. APS + Observance + Insight + Reading Comprehension
Table 13:
Stepwise regression 2011 intake: APS Log10 and three PIBSpEEx scales: Standardised β
values and significance β t p
APS 0.174 11.040 .000
Observance 0.068 3.195 .005
Insight 0.052 1.065 .336
Reading Comprehension 0.037 1.122 .300
*Note: β indicates the standardised coefficient
Table 14:
Logistic regression analysis utilising the three strongest PIBSpEEx scales in separate models
Year of
Intake Scale χ2 P Wald P Exp(B)
% increased
likelihood to
pass
2010 Observance 17.958 .000 17.815 .013 1.155 15.0
Insight 23.488 .012 23.149 .064 1.112 11.2
2011 Observance 38.528 .000 38.033 .000 1.225 22.5
Insight 25.599 .022 24.098 .138 1.103 10.3