2016 september-investor-presentation
TRANSCRIPT

1
September 2016 Investor Presentation
Lisa Micou Meers, CFA Vice President – Investor Relations 224-521-8895 [email protected]
© 2016 Anixter Inc.
Safe Harbor Statement and
Non-GAAP Financial Measures Safe Harbor Statement
The statements in this release other than historical facts are forward-looking statements made in reliance upon the safe harbor of the Private Securities Litigation Reform Act of 1995. These
forward-looking statements are subject to a number of factors that could cause our actual results to differ materially from what is indicated here. These factors include but are not limited to
general economic conditions, the level of customer demand particularly for capital projects in the markets we serve, changes in supplier relationships or in supplier sales strategies or financial
viability, risks associated with the sale of nonconforming products and services, political, economic or currency risks related to foreign operations, inventory obsolescence, copper price
fluctuations, customer viability, risks associated with accounts receivable, the impact of regulation and regulatory, investigative and legal proceedings and legal compliance risks, information
security risks, risks associated with substantial debt and restrictions contained in financial and operating covenants in our debt agreements, the impact and the uncertainty concerning the timing
and terms of the withdrawal by the United Kingdom from the European Union, and risks associated with integration of acquired companies, including, but not limited to, the risk that the
acquisitions may not provide us with the synergies or other benefits that were anticipated. These uncertainties may cause our actual results to be materially different than those expressed in any
forward looking statements. We do not undertake to update any forward looking statements. Please see our Securities and Exchange Commission (“SEC”) filings for more information.
Non-GAAP Financial Measures
In addition to the results provided in accordance with U.S. Generally Accepted Accounting Principles (“GAAP”) above, this release includes certain financial measures computed using non-
GAAP components as defined by the SEC. Specifically, net sales comparisons to the prior corresponding period, both worldwide and in relevant segments, are discussed in this release both on
a GAAP and non-GAAP basis. We believe that by providing non-GAAP organic growth, which adjusts for the impact of acquisitions (when applicable), foreign exchange fluctuations and copper
prices, both management and investors are provided with meaningful supplemental sales information to understand and analyze our underlying trends and other aspects of our financial
performance. We calculate the year-over-year organic sales growth and operating expenses impact relating to the Power Solutions acquisition by including its 2015 comparable period results
prior to the acquisition with our results (on a "pro forma" basis) as we believe this represents the most accurate representation of organic growth, considering the nature of the company we
acquired and the synergistic revenues that have been or will be achieved. Historically and from time to time, we may also exclude other items from reported financial results (e.g., impairment
charges, inventory adjustments, restructuring charges, tax items, currency devaluations, pension settlements, etc.) in presenting adjusted net income so that both management and financial
statement users can use these non-GAAP financial measures to better understand and evaluate our performance period over period and to analyze the underlying trends of our business. As a
result of the recent acquisitions we have also excluded amortization of intangible assets associated with purchase accounting from acquisitions from the adjusted amounts discussed below as
non-GAAP financial measures to provide comparable period over period comparisons.
EBITDA is defined as net income from continuing operations before interest, income taxes, depreciation and amortization. Adjusted EBITDA is defined as EBITDA before foreign exchange and
other non-operating expense and non-cash stock-based compensation, excluding the other items from reported financial results, as defined above. We believe that adjusted operating income,
EBITDA and Adjusted EBITDA provide relevant and useful information, which is widely used by analysts, investors and competitors in our industry as well as by our management in assessing
both consolidated and business segment performance. Adjusted operating income provides an understanding of the results from the primary operations of our business by excluding the effects
of certain items that do not reflect the ordinary earnings of our operations. We use adjusted operating income to evaluate our period-over-period operating performance because we believe this
provides a more comparable measure of our continuing business excluding certain items that are not reflective of expected ongoing operations. This measure may be useful to an investor in
evaluating the underlying performance of our business. EBITDA provides us with an understanding of earnings before the impact of investing and financing charges and income taxes. Adjusted
EBITDA further excludes the effects of foreign exchange and other non-cash stock-based compensation, and certain items that do not reflect the ordinary earnings of our operations and that are
also excluded for purposes of calculating adjusted net income, adjusted earnings per share and adjusted operating income. EBITDA and Adjusted EBITDA are used by our management for
various purposes including as measures of performance of our operating entities and as a basis for strategic planning and forecasting. Adjusted EBITDA may be useful to an investor in
evaluating our operating performance because this measure is widely used to evaluate a company’s operating performance without regard to items excluded from the calculation of such
measure, which can vary substantially from company to company depending on the accounting methods, book value of assets, capital structure and the method by which the assets were
acquired, among other factors. They are not, however, intended as an alternative measure of operating results or cash flow from operations as determined in accordance with generally
accepted accounting principles.
Non-GAAP financial measures provide insight into selected financial information and should be evaluated in the context in which they are presented. These non-GAAP financial measures have
limitations as analytical tools, and should not be considered in isolation from, or as a substitute for, financial information presented in compliance with GAAP, and non-GAAP financial measures
as reported by us may not be comparable to similarly titled amounts reported by other companies. The non-GAAP financial measures should be considered in conjunction with the Condensed
Consolidated Financial Statements, including the related notes, and Management’s Discussion and Analysis of Financial Condition and Results of Operations included in this release.
Management does not use these non-GAAP financial measures for any purpose other than the reasons stated above.
2
© 2016 Anixter Inc.
August 2016 Investor Presentation
Table of Contents
I. 2Q 2016 Highlights and Operating Results
II. Investor Overview
3
© 2016 Anixter Inc.
August 2016 Investor Presentation
2Q 2016 Highlights and Operating Results
2Q 2016 Highlights and Operating Results
1) Sales overview
2) NSS overview
3) EES overview
4) UPS overview
5) Financial performance trends
6) Leverage metrics
7) Financial details
8) Outlook
4
© 2016 Anixter Inc.
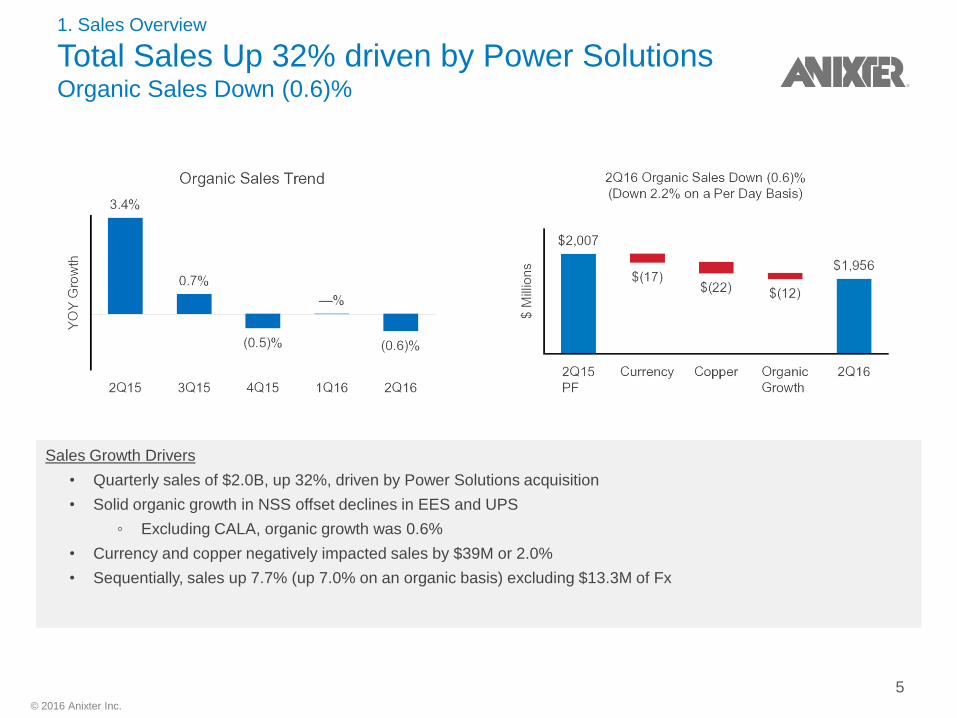
Sales Growth Drivers
• Quarterly sales of $2.0B, up 32%, driven by Power Solutions acquisition
• Solid organic growth in NSS offset declines in EES and UPS
◦ Excluding CALA, organic growth was 0.6%
• Currency and copper negatively impacted sales by $39M or 2.0%
• Sequentially, sales up 7.7% (up 7.0% on an organic basis) excluding $13.3M of Fx
1. Sales Overview
Total Sales Up 32% driven by Power Solutions Organic Sales Down (0.6)%
5
© 2016 Anixter Inc.
1. Sales Overview
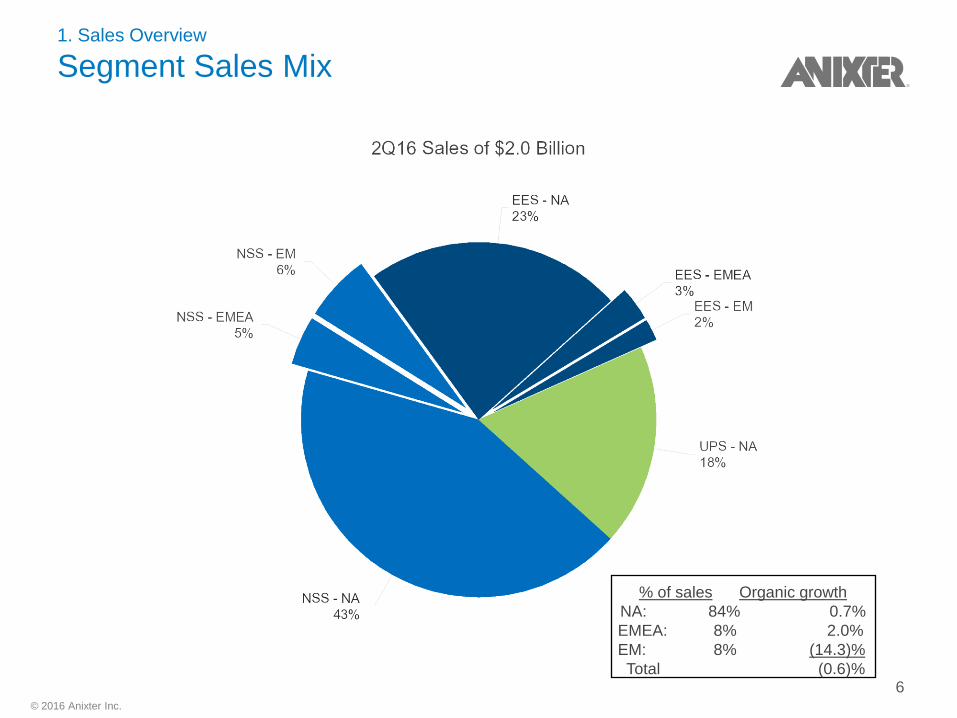
Segment Sales Mix
% of sales Organic growth
NA: 84% 0.7%
EMEA: 8% 2.0%
EM: 8% (14.3)%
Total (0.6)% 6
© 2016 Anixter Inc.
2. NSS Overview
Network & Security Solutions Sales Overview
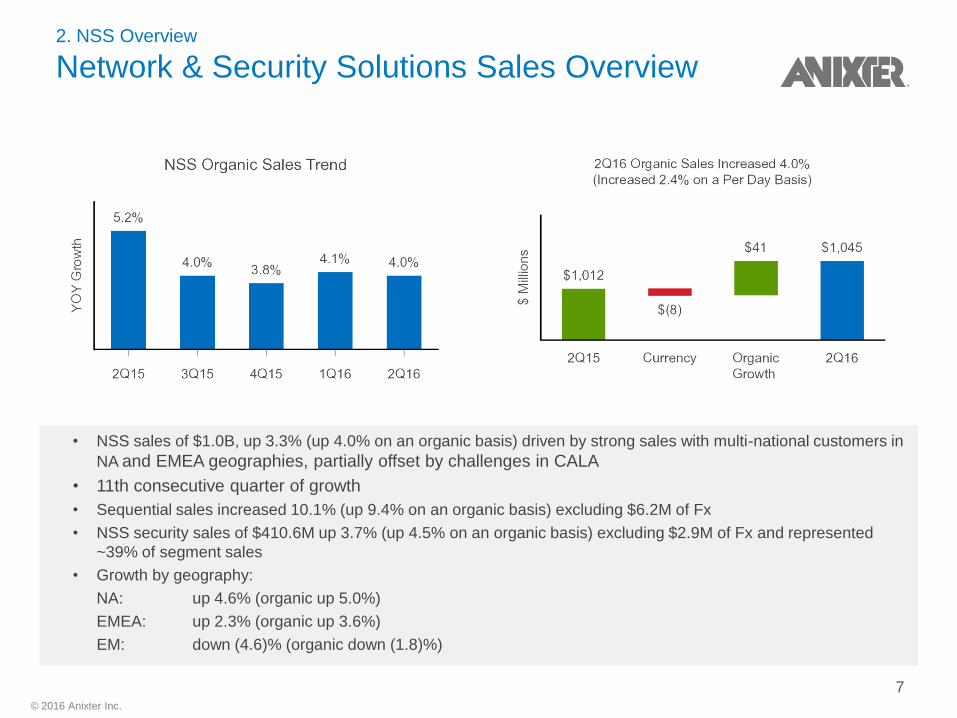
• NSS sales of $1.0B, up 3.3% (up 4.0% on an organic basis) driven by strong sales with multi-national customers in
NA and EMEA geographies, partially offset by challenges in CALA
• 11th consecutive quarter of growth
• Sequential sales increased 10.1% (up 9.4% on an organic basis) excluding $6.2M of Fx
• NSS security sales of $410.6M up 3.7% (up 4.5% on an organic basis) excluding $2.9M of Fx and represented
~39% of segment sales
• Growth by geography:
NA: up 4.6% (organic up 5.0%)
EMEA: up 2.3% (organic up 3.6%)
EM: down (4.6)% (organic down (1.8)%)
7
© 2016 Anixter Inc.
2. NSS Overview
Operating Income and Adjusted EBITDA Trends
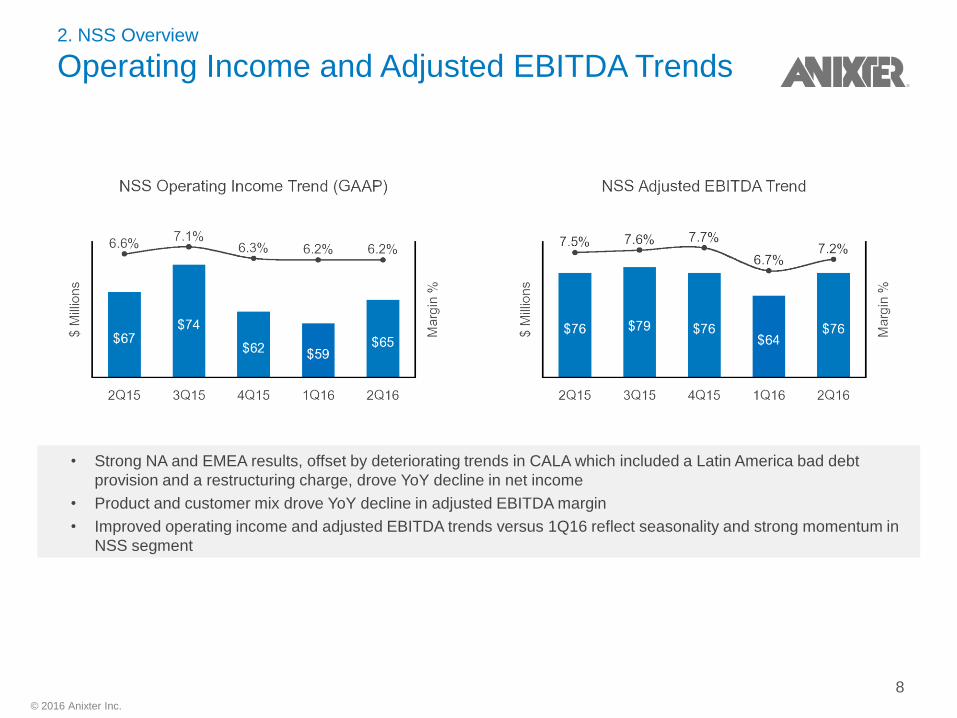
• Strong NA and EMEA results, offset by deteriorating trends in CALA which included a Latin America bad debt
provision and a restructuring charge, drove YoY decline in net income
• Product and customer mix drove YoY decline in adjusted EBITDA margin
• Improved operating income and adjusted EBITDA trends versus 1Q16 reflect seasonality and strong momentum in
NSS segment
8
© 2016 Anixter Inc.
3. EES Overview
Electrical & Electronic Solutions Sales Overview
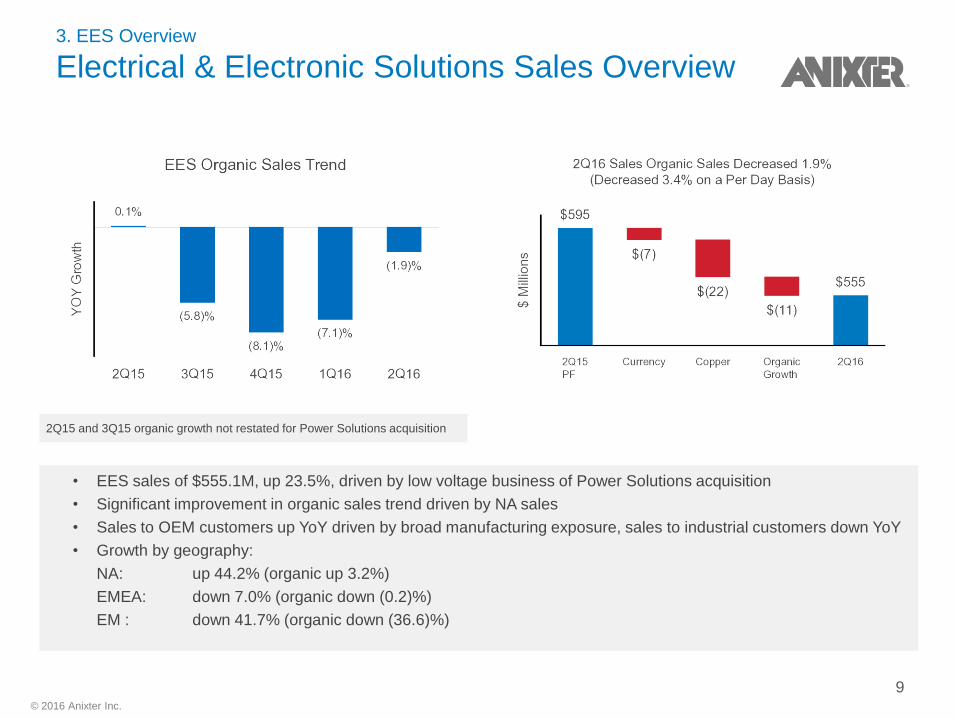
• EES sales of $555.1M, up 23.5%, driven by low voltage business of Power Solutions acquisition
• Significant improvement in organic sales trend driven by NA sales
• Sales to OEM customers up YoY driven by broad manufacturing exposure, sales to industrial customers down YoY
• Growth by geography:
NA: up 44.2% (organic up 3.2%)
EMEA: down 7.0% (organic down (0.2)%)
EM : down 41.7% (organic down (36.6)%)
2Q15 and 3Q15 organic growth not restated for Power Solutions acquisition
9
© 2016 Anixter Inc.
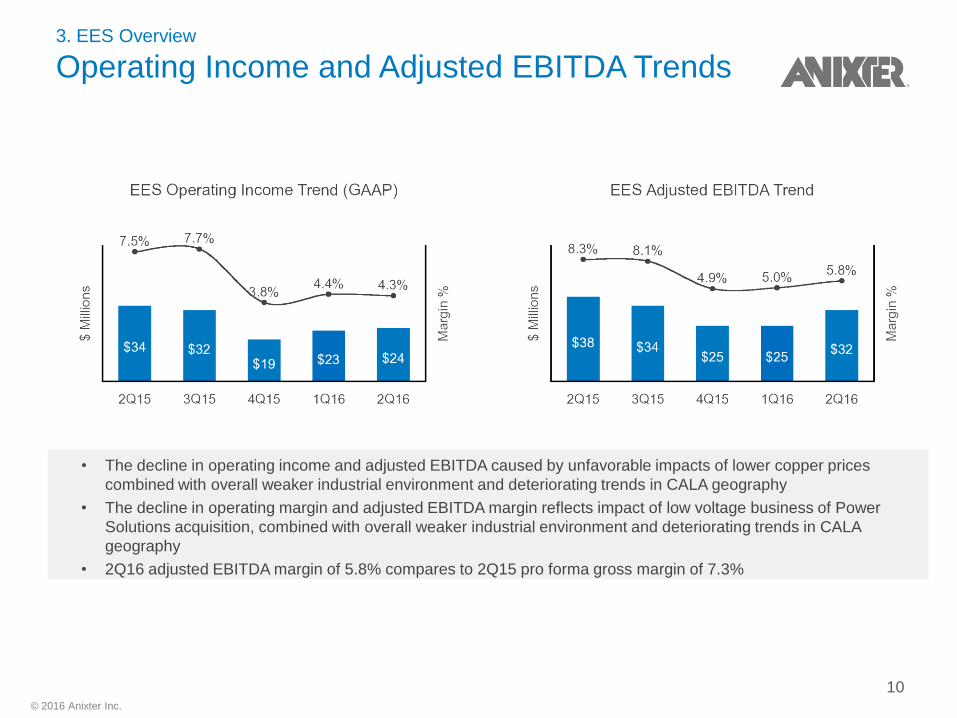
3. EES Overview
Operating Income and Adjusted EBITDA Trends
• The decline in operating income and adjusted EBITDA caused by unfavorable impacts of lower copper prices
combined with overall weaker industrial environment and deteriorating trends in CALA geography
• The decline in operating margin and adjusted EBITDA margin reflects impact of low voltage business of Power
Solutions acquisition, combined with overall weaker industrial environment and deteriorating trends in CALA
geography
• 2Q16 adjusted EBITDA margin of 5.8% compares to 2Q15 pro forma gross margin of 7.3%
10
© 2016 Anixter Inc.
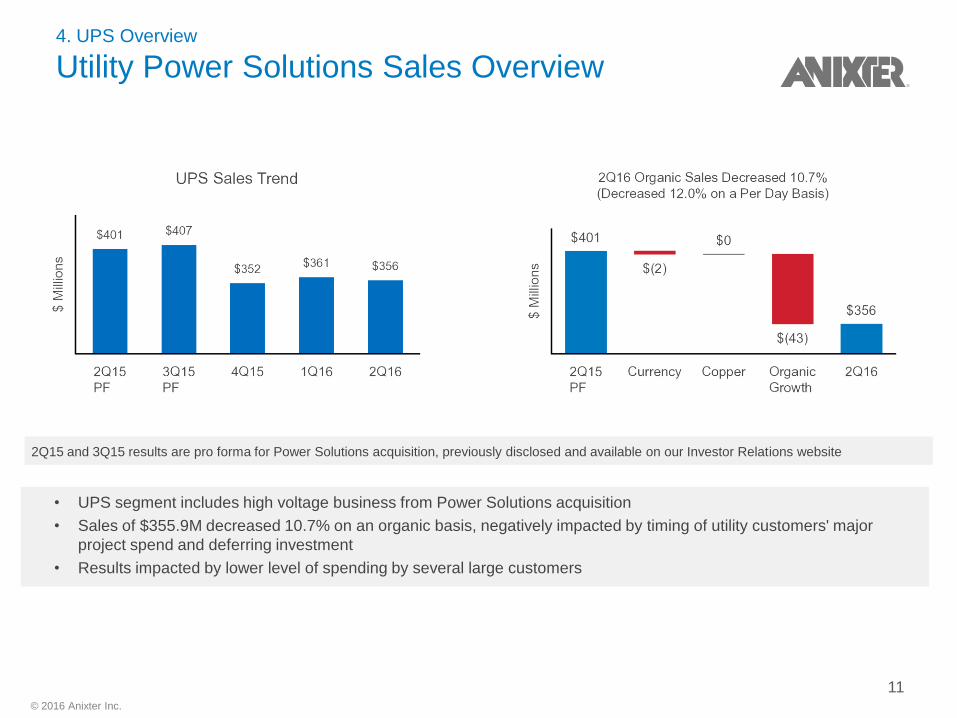
• UPS segment includes high voltage business from Power Solutions acquisition
• Sales of $355.9M decreased 10.7% on an organic basis, negatively impacted by timing of utility customers' major
project spend and deferring investment
• Results impacted by lower level of spending by several large customers
4. UPS Overview
Utility Power Solutions Sales Overview
2Q15 and 3Q15 results are pro forma for Power Solutions acquisition, previously disclosed and available on our Investor Relations website
11
© 2016 Anixter Inc.
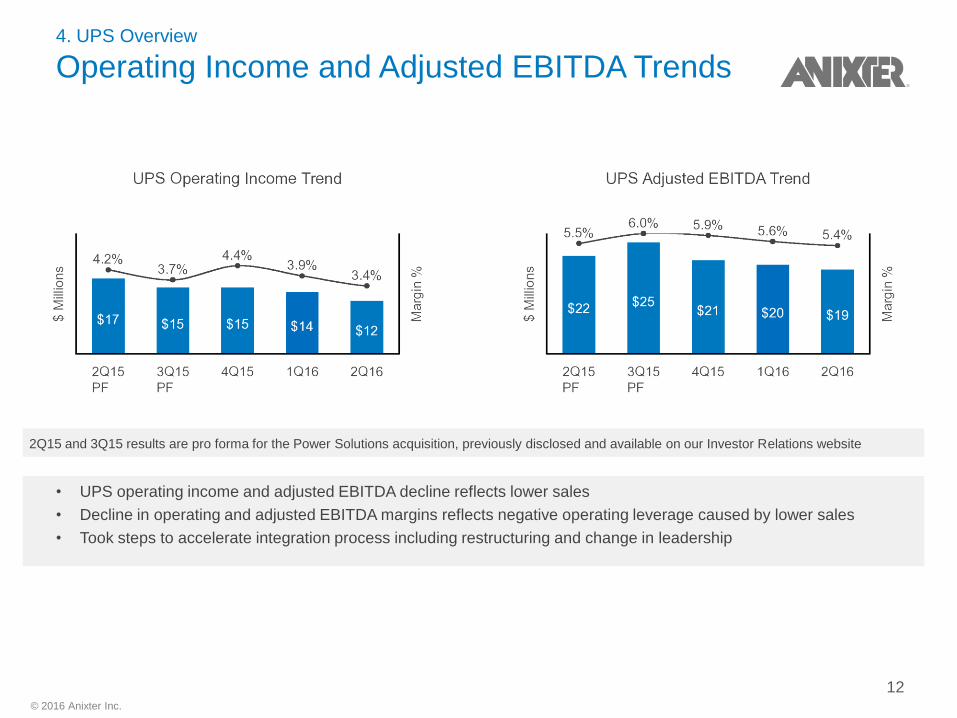
• UPS operating income and adjusted EBITDA decline reflects lower sales
• Decline in operating and adjusted EBITDA margins reflects negative operating leverage caused by lower sales
• Took steps to accelerate integration process including restructuring and change in leadership
4. UPS Overview
Operating Income and Adjusted EBITDA Trends
2Q15 and 3Q15 results are pro forma for the Power Solutions acquisition, previously disclosed and available on our Investor Relations website
12
© 2016 Anixter Inc.
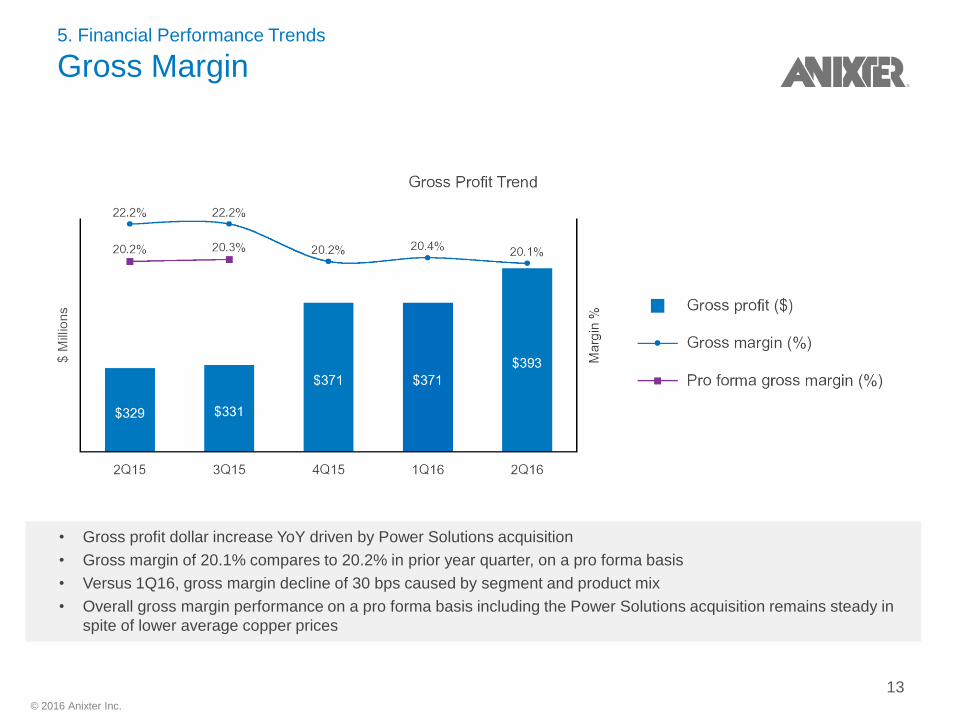
5. Financial Performance Trends
Gross Margin
• Gross profit dollar increase YoY driven by Power Solutions acquisition
• Gross margin of 20.1% compares to 20.2% in prior year quarter, on a pro forma basis
• Versus 1Q16, gross margin decline of 30 bps caused by segment and product mix
• Overall gross margin performance on a pro forma basis including the Power Solutions acquisition remains steady in
spite of lower average copper prices
13
© 2016 Anixter Inc.
5. Financial Performance Trends
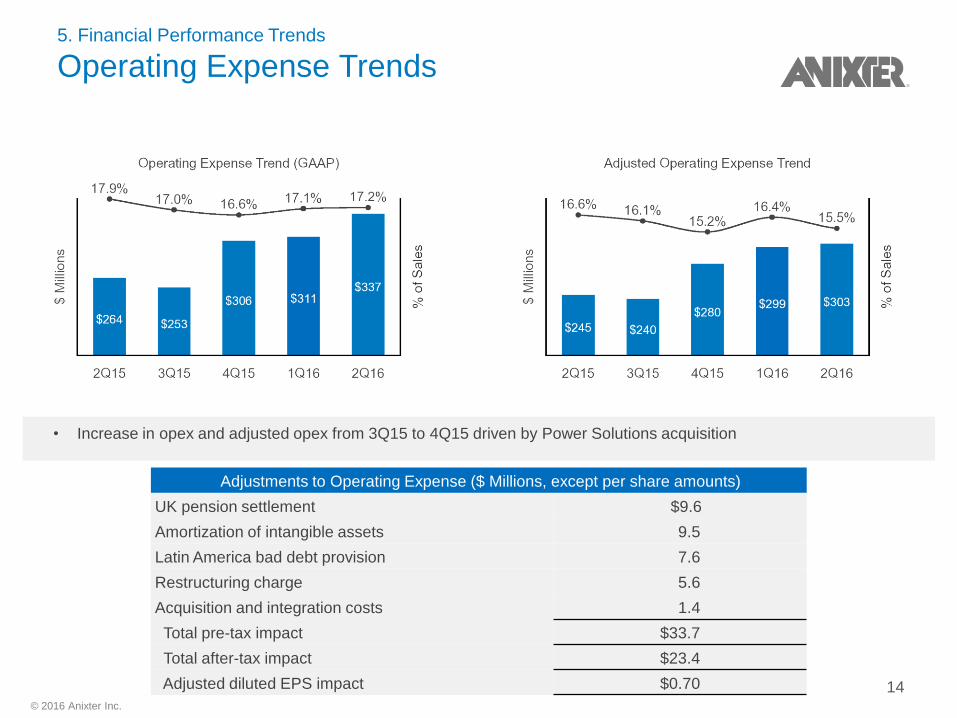
Operating Expense Trends
Adjustments to Operating Expense ($ Millions, except per share amounts)
UK pension settlement $9.6
Amortization of intangible assets 9.5
Latin America bad debt provision 7.6
Restructuring charge 5.6
Acquisition and integration costs 1.4
Total pre-tax impact $33.7
Total after-tax impact $23.4
Adjusted diluted EPS impact $0.70
• Increase in opex and adjusted opex from 3Q15 to 4Q15 driven by Power Solutions acquisition
14
© 2016 Anixter Inc.
5. Financial Performance Trends
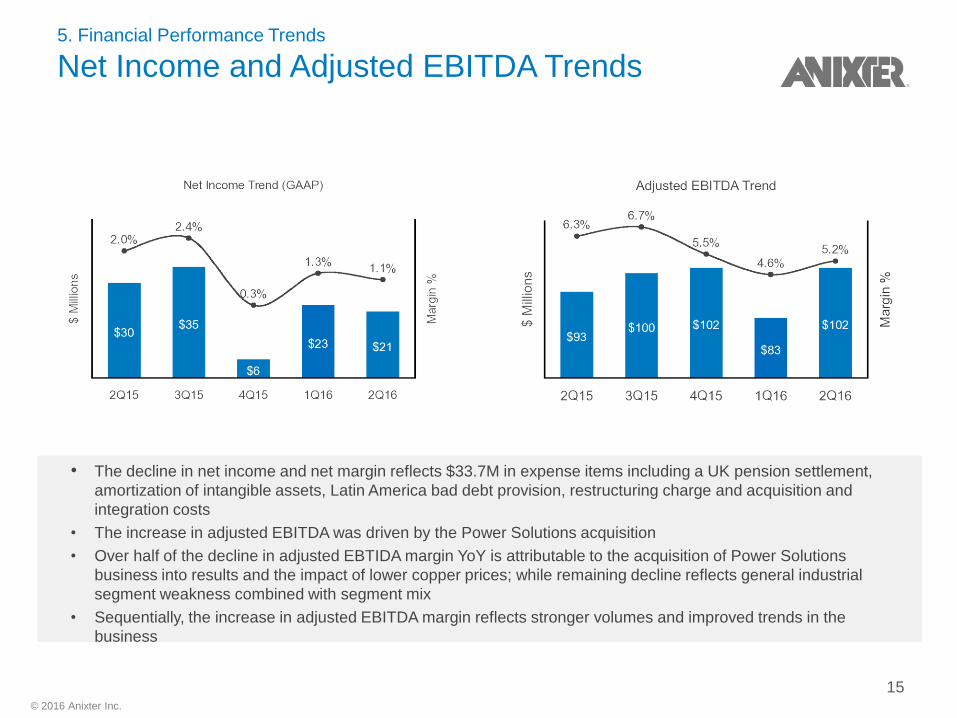
Net Income and Adjusted EBITDA Trends
• The decline in net income and net margin reflects $33.7M in expense items including a UK pension settlement,
amortization of intangible assets, Latin America bad debt provision, restructuring charge and acquisition and
integration costs
• The increase in adjusted EBITDA was driven by the Power Solutions acquisition
• Over half of the decline in adjusted EBTIDA margin YoY is attributable to the acquisition of Power Solutions
business into results and the impact of lower copper prices; while remaining decline reflects general industrial
segment weakness combined with segment mix
• Sequentially, the increase in adjusted EBITDA margin reflects stronger volumes and improved trends in the
business
15
© 2016 Anixter Inc.
5. Financial Performance Trends
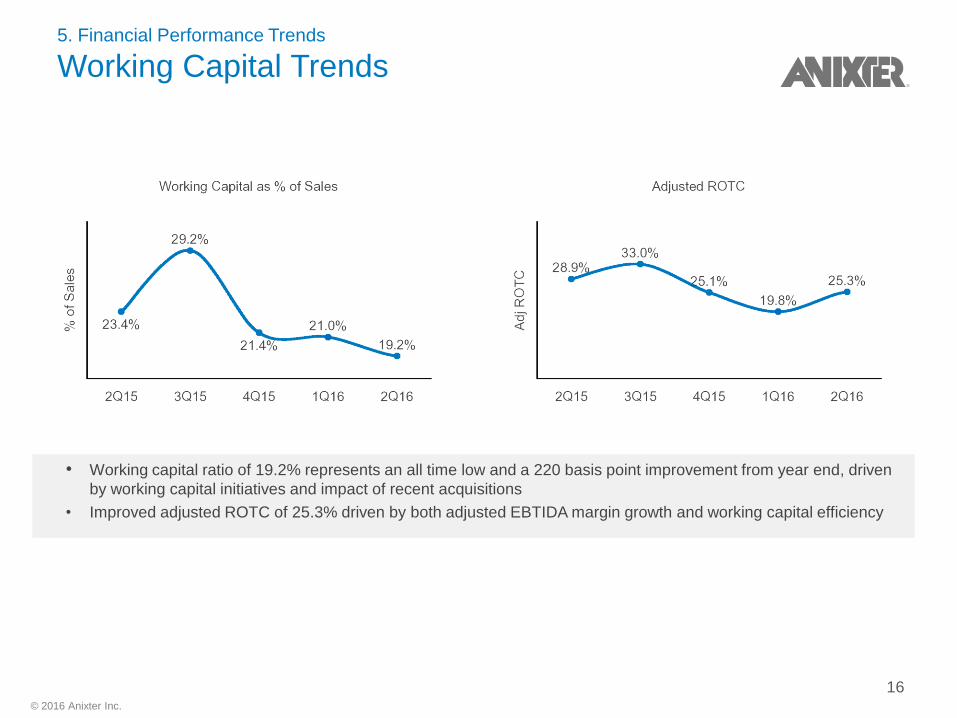
Working Capital Trends
• Working capital ratio of 19.2% represents an all time low and a 220 basis point improvement from year end, driven
by working capital initiatives and impact of recent acquisitions
• Improved adjusted ROTC of 25.3% driven by both adjusted EBTIDA margin growth and working capital efficiency
16
© 2016 Anixter Inc.
5. Financial Performance Trends
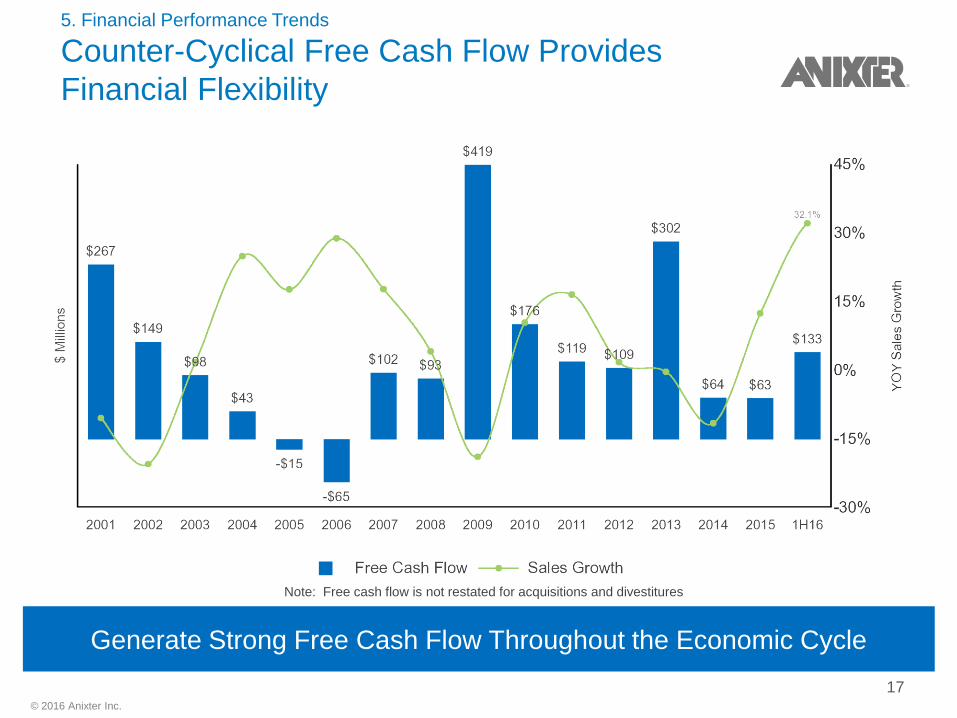
Counter-Cyclical Free Cash Flow Provides
Financial Flexibility
Generate Strong Free Cash Flow Throughout the Economic Cycle
Note: Free cash flow is not restated for acquisitions and divestitures
17
© 2016 Anixter Inc.
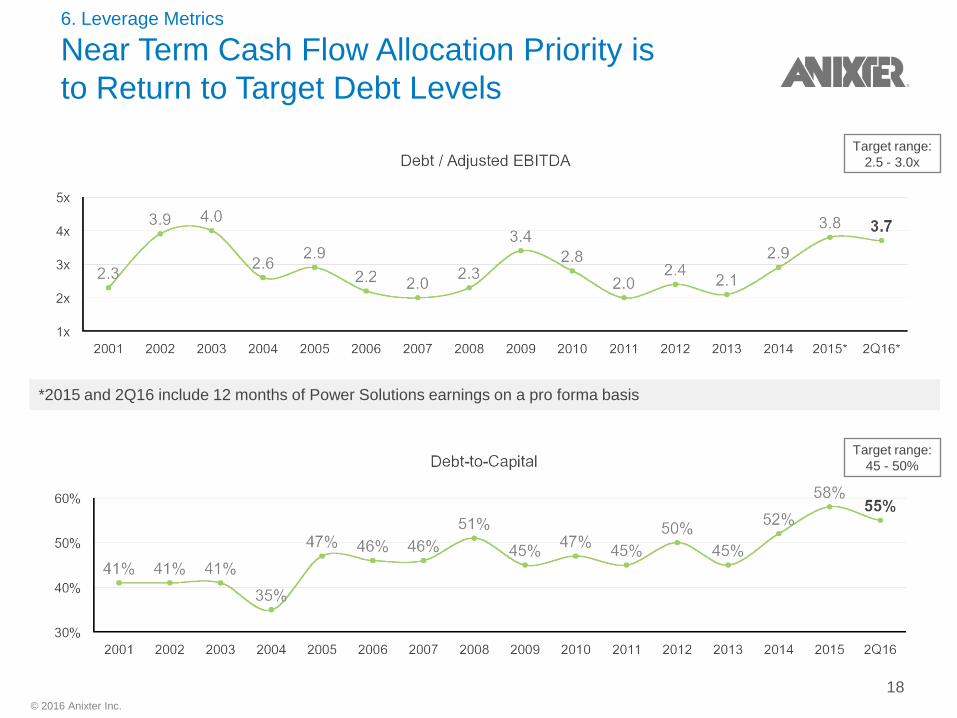
6. Leverage Metrics
Near Term Cash Flow Allocation Priority is
to Return to Target Debt Levels
*2015 and 2Q16 include 12 months of Power Solutions earnings on a pro forma basis
Target range:
2.5 - 3.0x
Target range:
45 - 50%
18
© 2016 Anixter Inc.
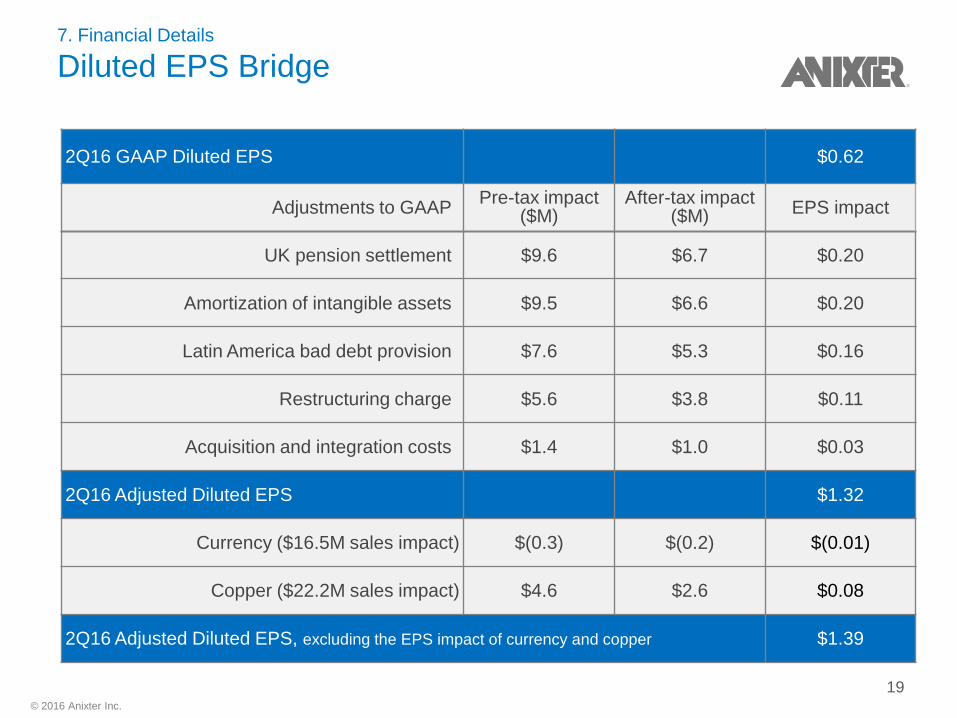
7. Financial Details
Diluted EPS Bridge
2Q16 GAAP Diluted EPS $0.62
Adjustments to GAAP Pre-tax impact
($M) After-tax impact
($M) EPS impact
UK pension settlement $9.6 $6.7 $0.20
Amortization of intangible assets $9.5 $6.6 $0.20
Latin America bad debt provision $7.6 $5.3 $0.16
Restructuring charge $5.6 $3.8 $0.11
Acquisition and integration costs $1.4 $1.0 $0.03
2Q16 Adjusted Diluted EPS $1.32
Currency ($16.5M sales impact) $(0.3) $(0.2) $(0.01)
Copper ($22.2M sales impact) $4.6 $2.6 $0.08
2Q16 Adjusted Diluted EPS, excluding the EPS impact of currency and copper $1.39
19
© 2016 Anixter Inc.
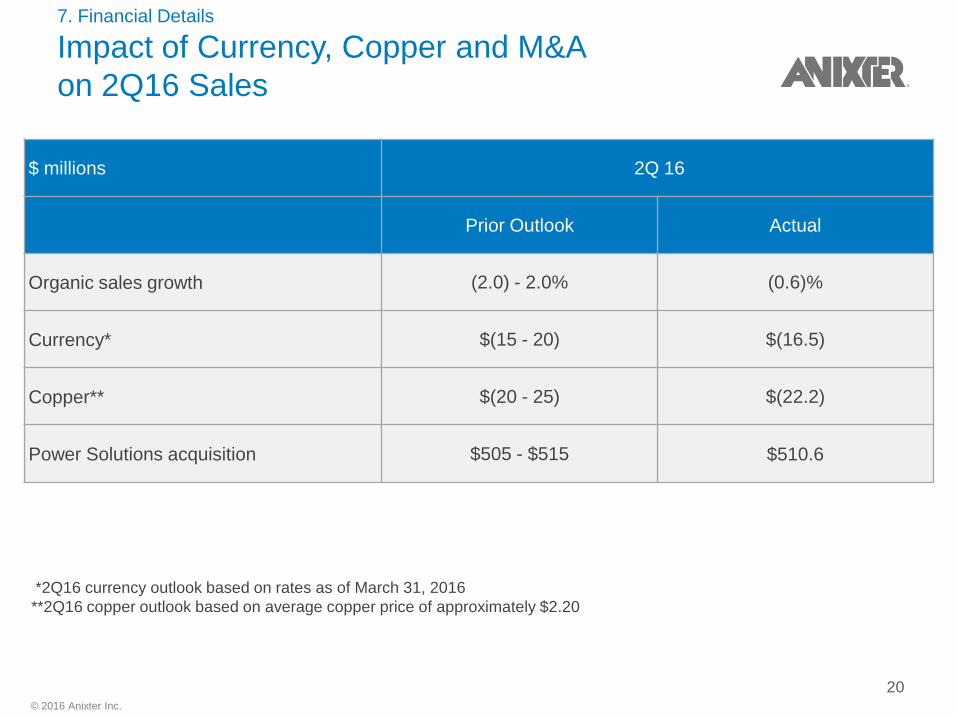
7. Financial Details
Impact of Currency, Copper and M&A
on 2Q16 Sales
$ millions 2Q 16
Prior Outlook Actual
Organic sales growth (2.0) - 2.0% (0.6)%
Currency* $(15 - 20) $(16.5)
Copper** $(20 - 25) $(22.2)
Power Solutions acquisition $505 - $515 $510.6
*2Q16 currency outlook based on rates as of March 31, 2016
**2Q16 copper outlook based on average copper price of approximately $2.20
20
© 2016 Anixter Inc.
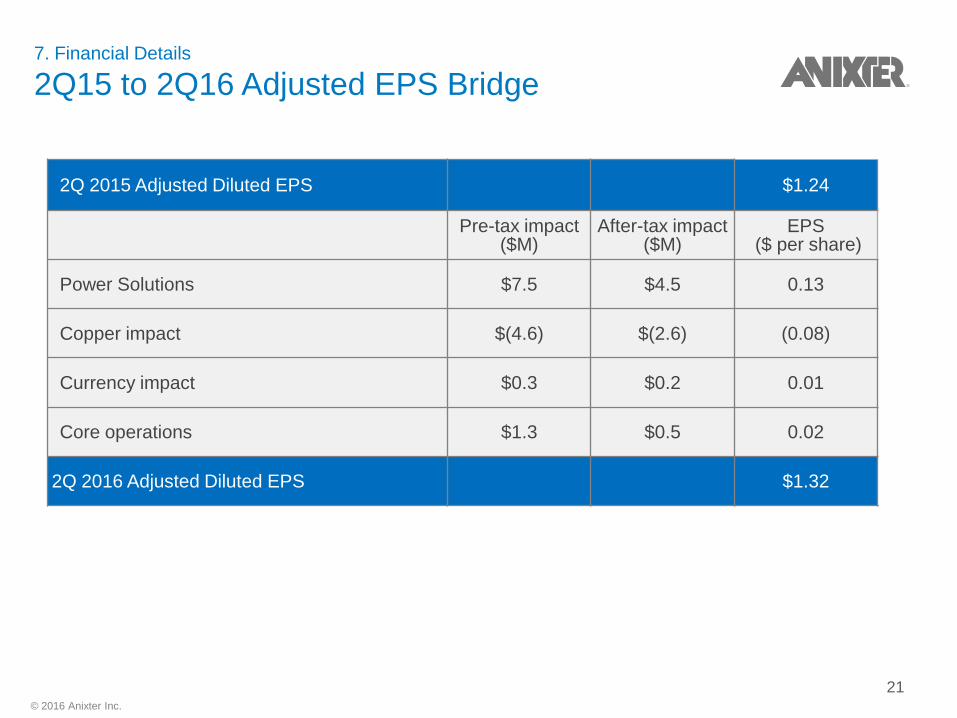
7. Financial Details
2Q15 to 2Q16 Adjusted EPS Bridge
2Q 2015 Adjusted Diluted EPS $1.24
Pre-tax impact ($M)
After-tax impact ($M)
EPS ($ per share)
Power Solutions $7.5 $4.5 0.13
Copper impact $(4.6) $(2.6) (0.08)
Currency impact $0.3 $0.2 0.01
Core operations $1.3 $0.5 0.02
2Q 2016 Adjusted Diluted EPS $1.32
21
© 2016 Anixter Inc.
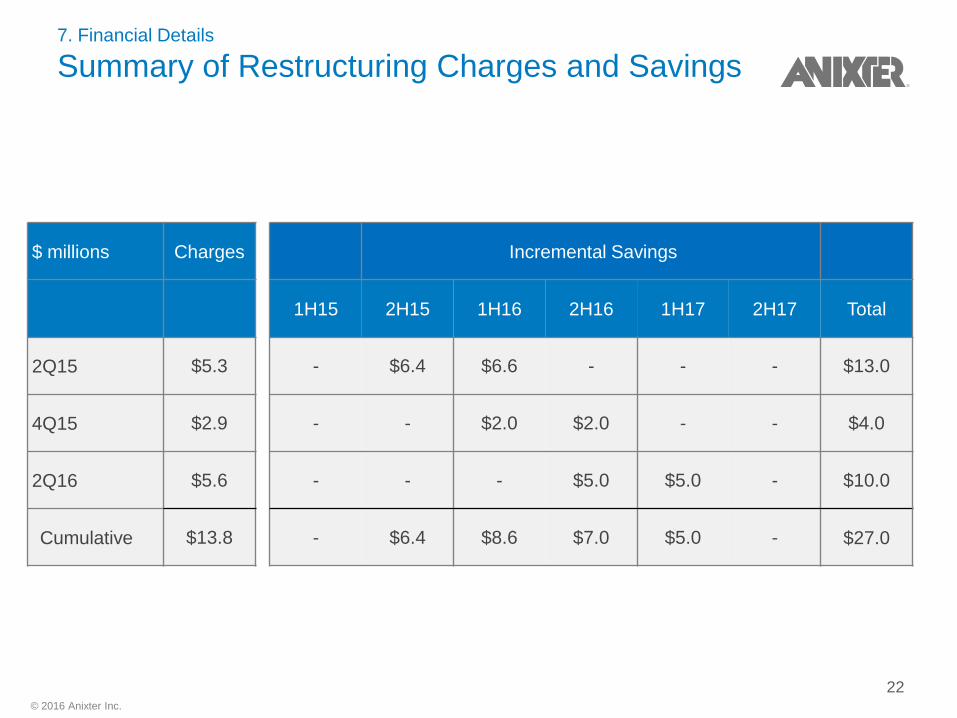
7. Financial Details
Summary of Restructuring Charges and Savings
$ millions Charges Incremental Savings
1H15 2H15 1H16 2H16 1H17 2H17 Total
2Q15 $5.3 - $6.4 $6.6 - - - $13.0
4Q15 $2.9 - - $2.0 $2.0 - - $4.0
2Q16 $5.6 - - - $5.0 $5.0 - $10.0
Cumulative $13.8 - $6.4 $8.6 $7.0 $5.0 - $27.0
22
© 2016 Anixter Inc.
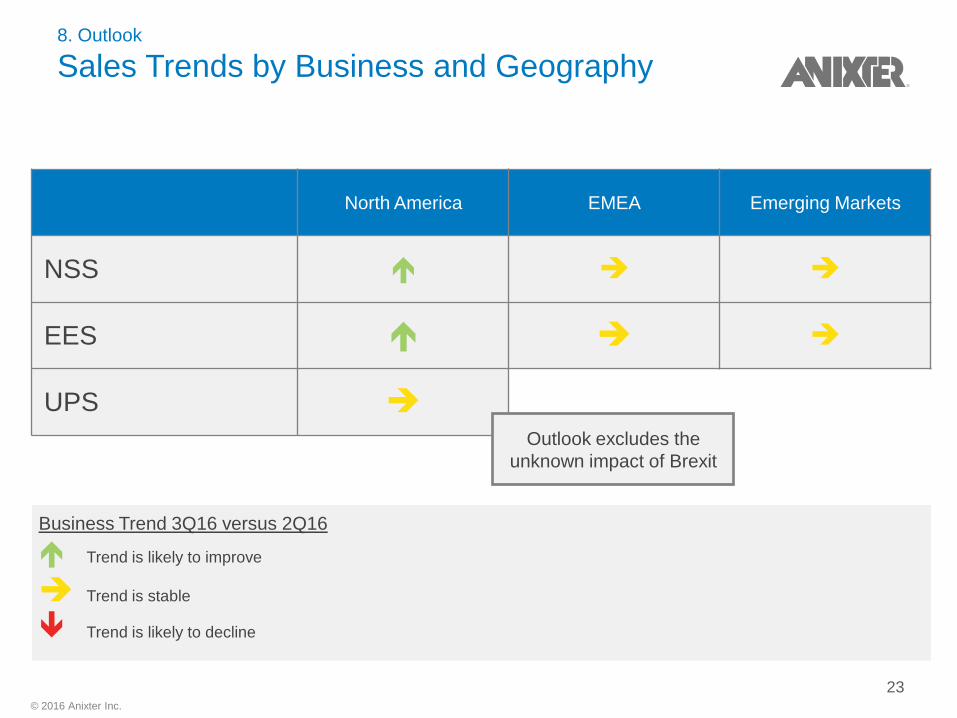
8. Outlook
Sales Trends by Business and Geography
North America EMEA Emerging Markets
NSS
EES
UPS
Business Trend 3Q16 versus 2Q16
Trend is likely to improve
Trend is stable
Trend is likely to decline
Outlook excludes the
unknown impact of Brexit
23
© 2016 Anixter Inc.
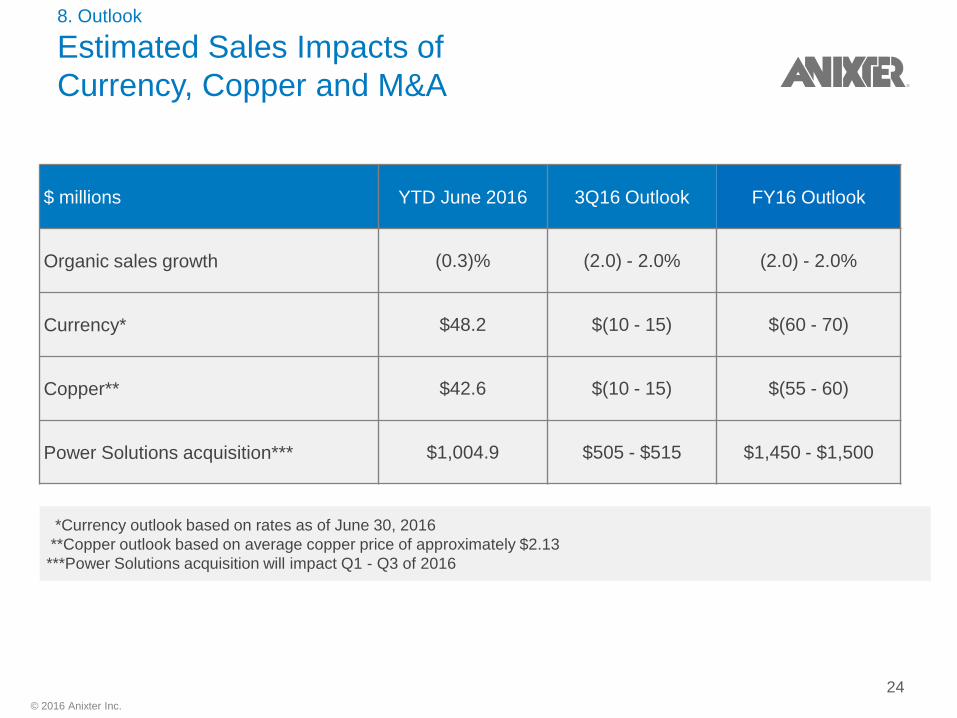
8. Outlook
Estimated Sales Impacts of
Currency, Copper and M&A
$ millions YTD June 2016 3Q16 Outlook FY16 Outlook
Organic sales growth (0.3)% (2.0) - 2.0% (2.0) - 2.0%
Currency* $48.2 $(10 - 15) $(60 - 70)
Copper** $42.6 $(10 - 15) $(55 - 60)
Power Solutions acquisition*** $1,004.9 $505 - $515 $1,450 - $1,500
*Currency outlook based on rates as of June 30, 2016
**Copper outlook based on average copper price of approximately $2.13
***Power Solutions acquisition will impact Q1 - Q3 of 2016
24
© 2016 Anixter Inc.
August Investor Presentation
Investor Overview
1) Repositioned and Strengthened Business
2) Business Model Overview
3) Cash Flow and Capital Allocation Priorities
4) Driving Excellence in Execution
25
© 2016 Anixter Inc.
Q3 2014
Q2 2015
Q3 2015
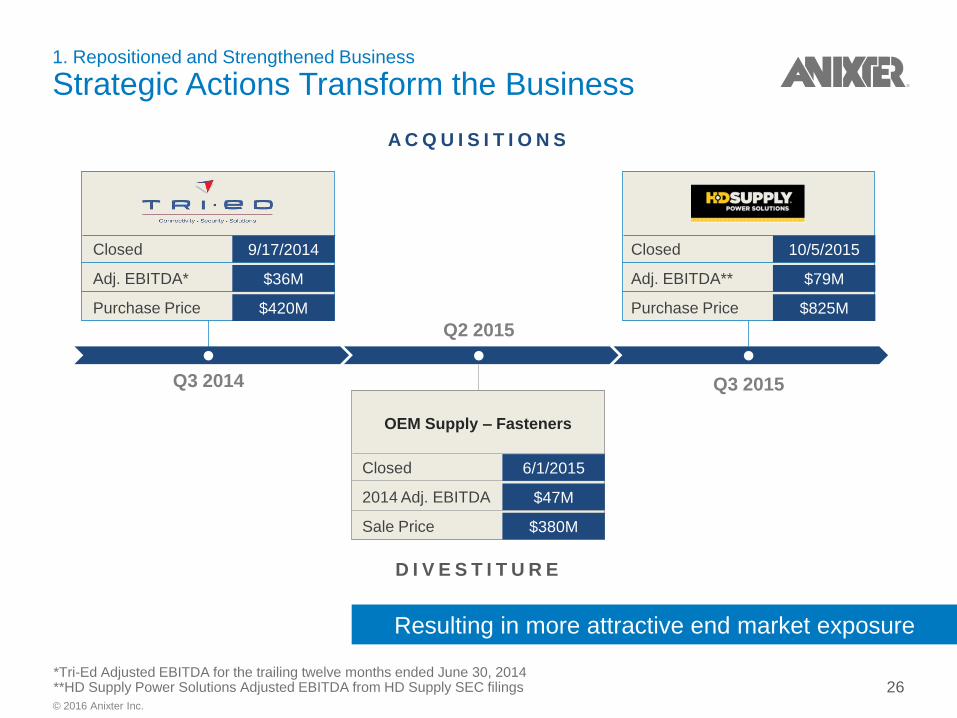
Resulting in more attractive end market exposure
1. Repositioned and Strengthened Business
Strategic Actions Transform the Business
Closed 9/17/2014
Adj. EBITDA* $36M
Purchase Price $420M
A C Q U I S I T I O N S
D I V E S T I T U R E
Closed 10/5/2015
Adj. EBITDA** $79M
Purchase Price $825M
Closed 6/1/2015
2014 Adj. EBITDA $47M
Sale Price $380M
OEM Supply – Fasteners
*Tri-Ed Adjusted EBITDA for the trailing twelve months ended June 30, 2014 **HD Supply Power Solutions Adjusted EBITDA from HD Supply SEC filings 26
© 2016 Anixter Inc.
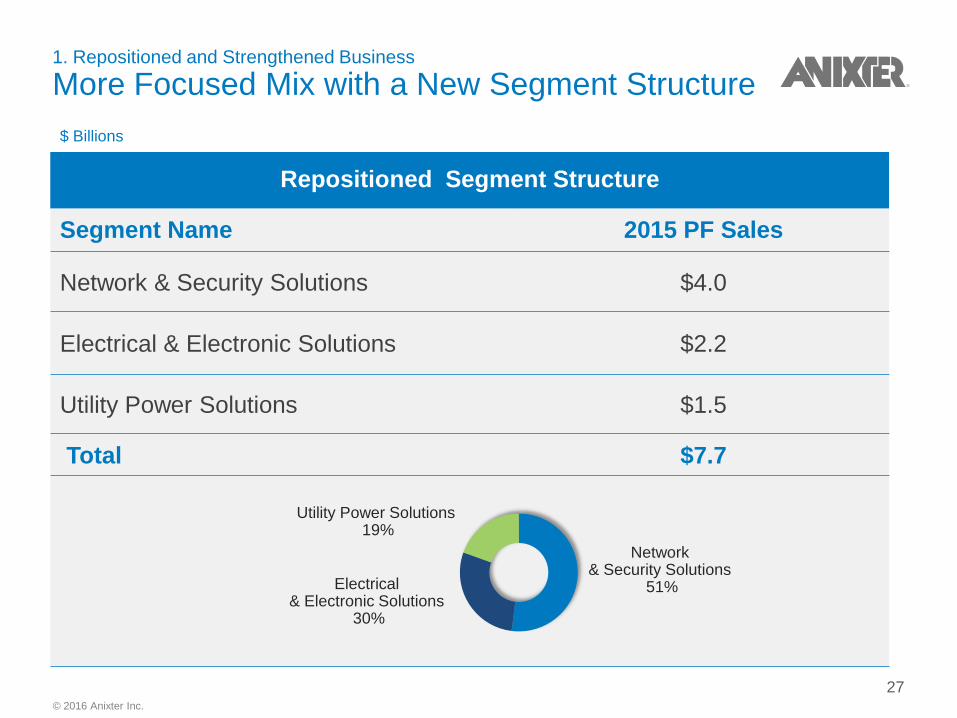
1. Repositioned and Strengthened Business
More Focused Mix with a New Segment Structure
Repositioned Segment Structure
Segment Name 2015 PF Sales
Network & Security Solutions $4.0
Electrical & Electronic Solutions $2.2
Utility Power Solutions $1.5
Total $7.7
$ Billions
Network & Security Solutions
51%
Utility Power Solutions 19%
Electrical & Electronic Solutions
30%
27
© 2016 Anixter Inc.
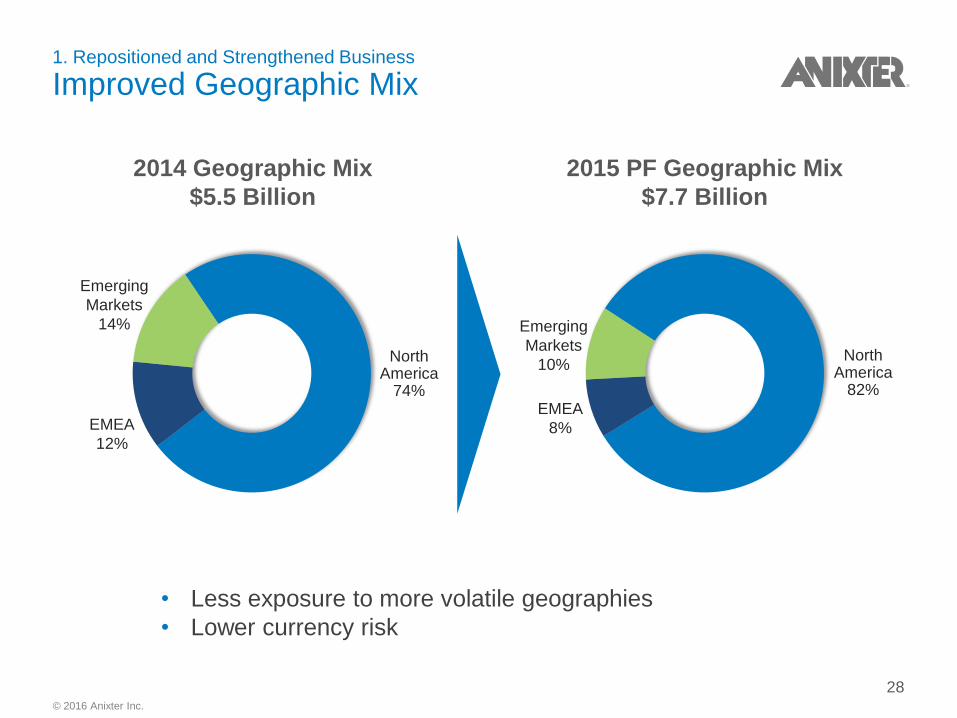
• Less exposure to more volatile geographies
• Lower currency risk
1. Repositioned and Strengthened Business
Improved Geographic Mix
2014 Geographic Mix
$5.5 Billion
2015 PF Geographic Mix
$7.7 Billion
North America
74%
EMEA
12%
Emerging
Markets
14%
North America
82%
Emerging
Markets
10%
EMEA
8%
28
© 2016 Anixter Inc.
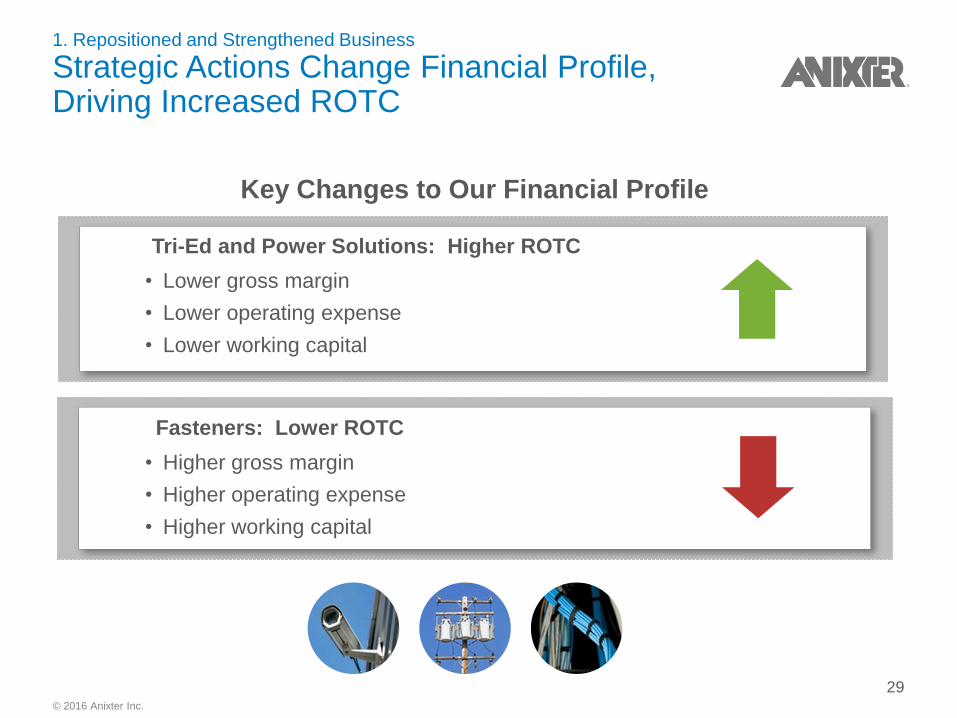
1. Repositioned and Strengthened Business
Strategic Actions Change Financial Profile, Driving Increased ROTC
Tri-Ed and Power Solutions: Higher ROTC
• Lower gross margin
• Lower operating expense
• Lower working capital
Key Changes to Our Financial Profile
Fasteners: Lower ROTC
• Higher gross margin
• Higher operating expense
• Higher working capital
29
© 2016 Anixter Inc.
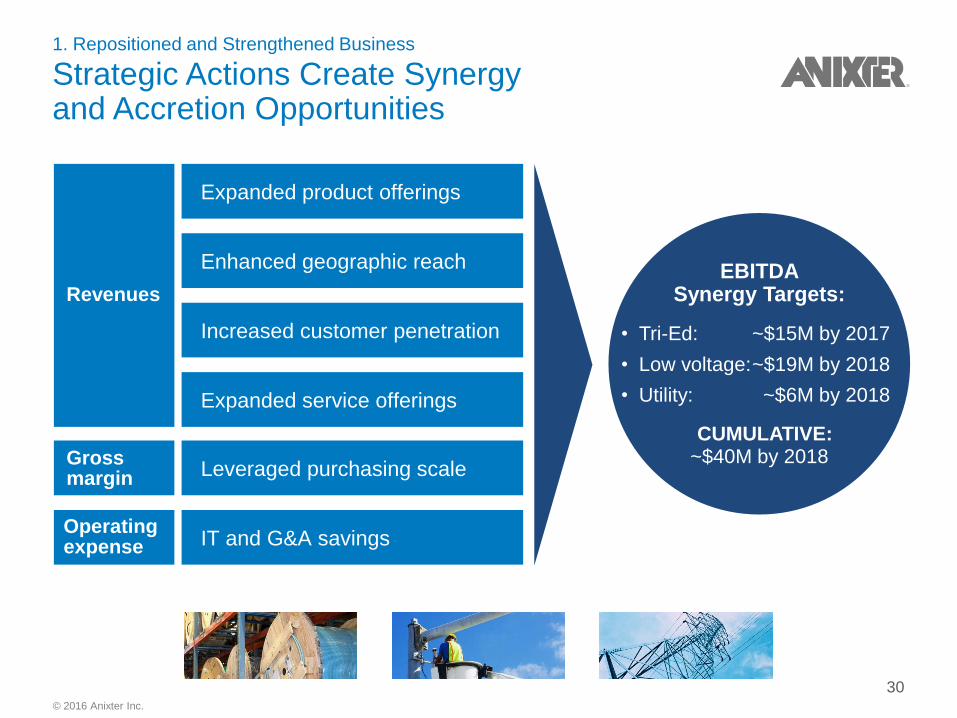
Enhanced geographic reach
Increased customer penetration
Leveraged purchasing scale
IT and G&A savings
Expanded service offerings
Expanded product offerings
1. Repositioned and Strengthened Business Strategic Actions Create Synergy and Accretion Opportunities
Revenues
Gross margin
Operating expense
EBITDA Synergy Targets:
• Tri-Ed: ~$15M by 2017
• Low voltage: ~$19M by 2018
• Utility: ~$6M by 2018
CUMULATIVE: ~$40M by 2018
30
© 2016 Anixter Inc.
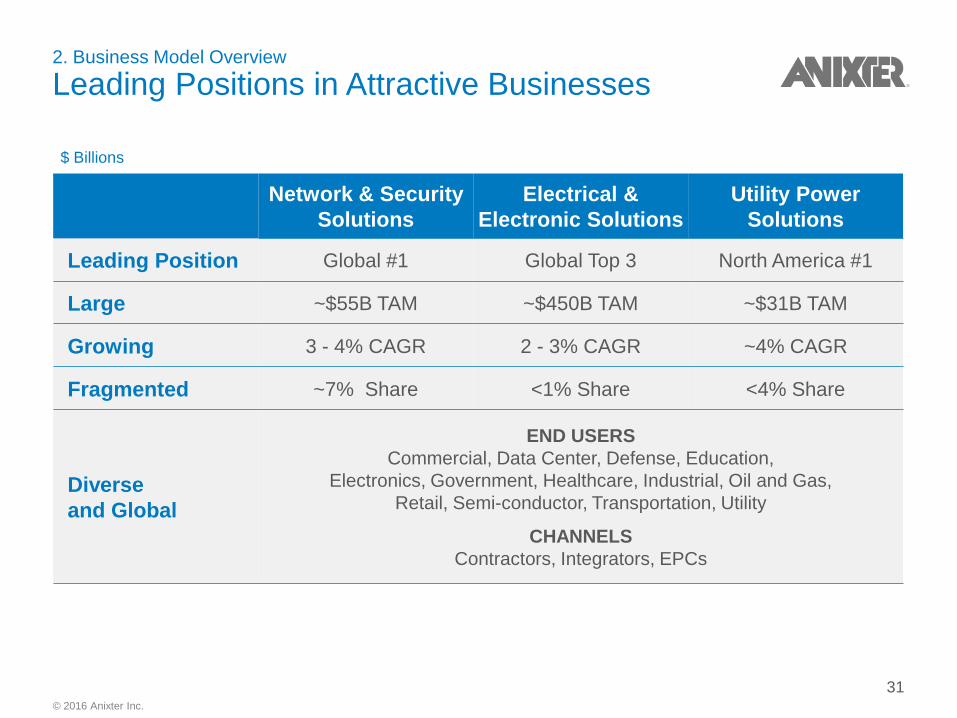
2. Business Model Overview
Leading Positions in Attractive Businesses
Network & Security
Solutions
Electrical &
Electronic Solutions
Utility Power
Solutions
Leading Position Global #1 Global Top 3 North America #1
Large ~$55B TAM ~$450B TAM ~$31B TAM
Growing 3 - 4% CAGR 2 - 3% CAGR ~4% CAGR
Fragmented ~7% Share <1% Share <4% Share
Diverse
and Global
END USERS
Commercial, Data Center, Defense, Education,
Electronics, Government, Healthcare, Industrial, Oil and Gas,
Retail, Semi-conductor, Transportation, Utility
CHANNELS
Contractors, Integrators, EPCs
$ Billions
31
© 2016 Anixter Inc.
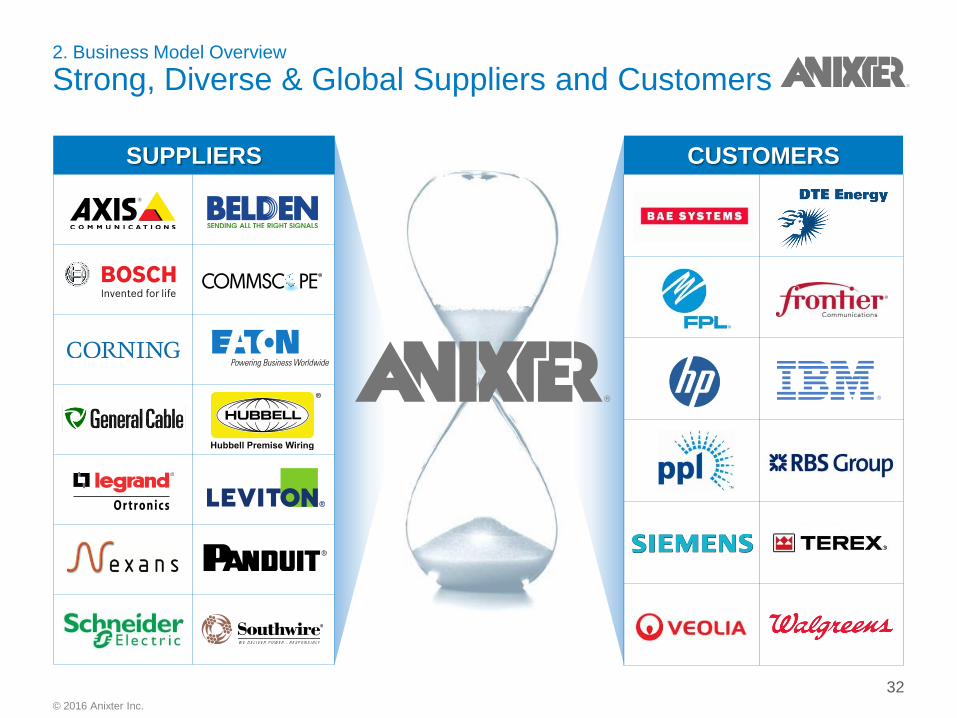
2. Business Model Overview
Strong, Diverse & Global Suppliers and Customers
CUSTOMERS SUPPLIERS
32
© 2016 Anixter Inc.
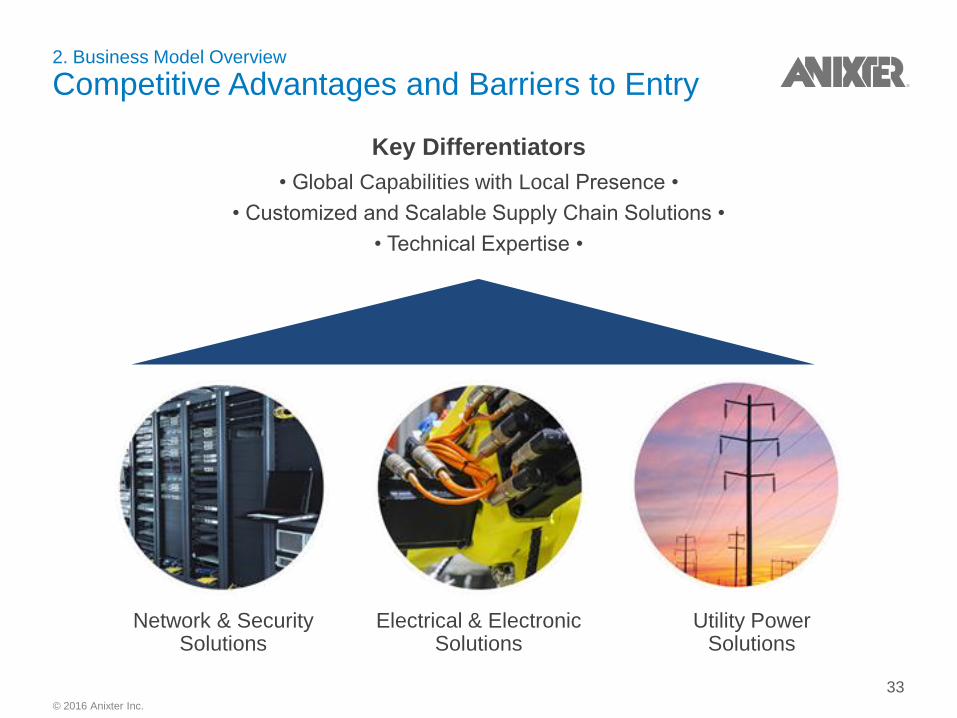
2. Business Model Overview
Competitive Advantages and Barriers to Entry
Key Differentiators
• Global Capabilities with Local Presence •
• Customized and Scalable Supply Chain Solutions •
• Technical Expertise •
Network & Security Solutions
Electrical & Electronic Solutions
Utility Power Solutions
33
© 2016 Anixter Inc.
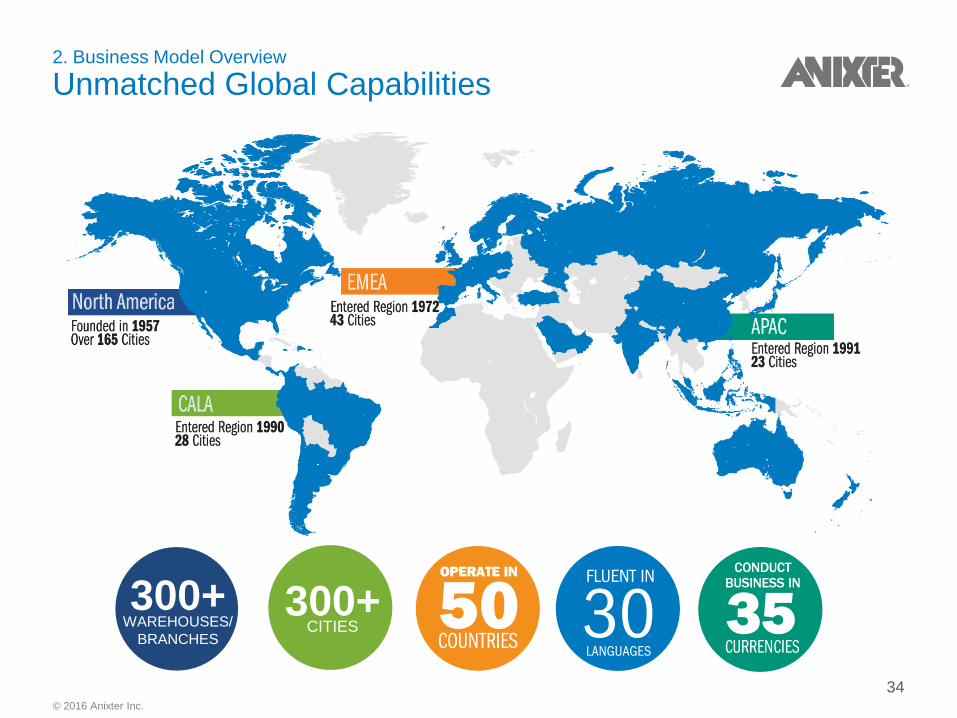
2. Business Model Overview
Unmatched Global Capabilities
34
300+ WAREHOUSES/
BRANCHES
300+ CITIES
34
© 2016 Anixter Inc.
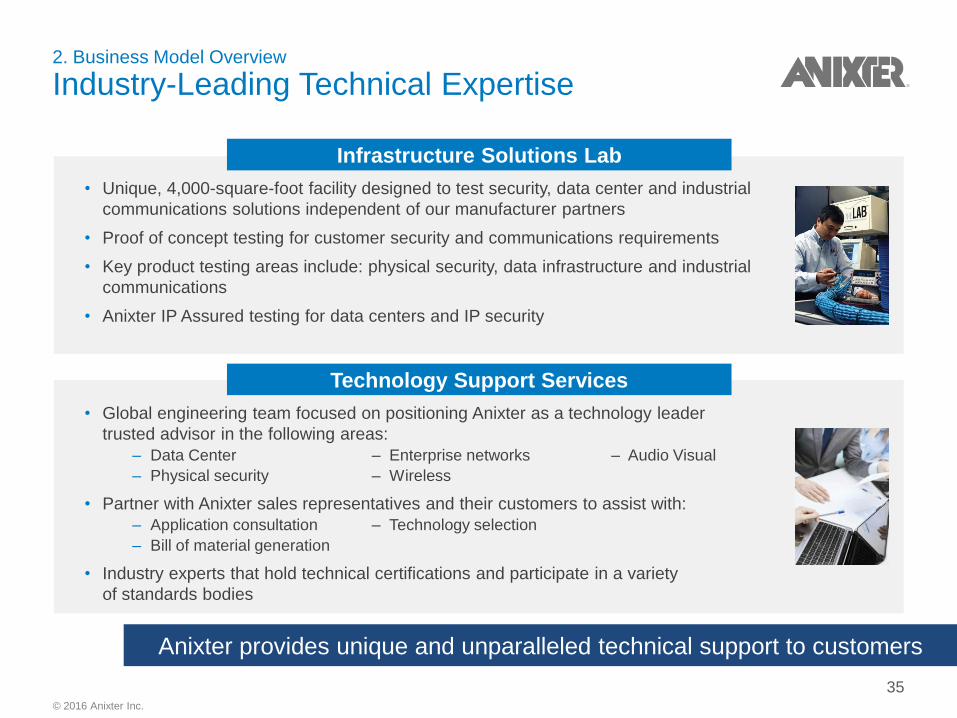
• Unique, 4,000-square-foot facility designed to test security, data center and industrial
communications solutions independent of our manufacturer partners
• Proof of concept testing for customer security and communications requirements
• Key product testing areas include: physical security, data infrastructure and industrial
communications
• Anixter IP Assured testing for data centers and IP security
2. Business Model Overview
Industry-Leading Technical Expertise
Infrastructure Solutions Lab
Technology Support Services
• Global engineering team focused on positioning Anixter as a technology leader
trusted advisor in the following areas:
– Data Center – Enterprise networks – Audio Visual
– Physical security – Wireless
• Partner with Anixter sales representatives and their customers to assist with:
– Application consultation – Technology selection
– Bill of material generation
• Industry experts that hold technical certifications and participate in a variety
of standards bodies
Anixter provides unique and unparalleled technical support to customers
35
© 2016 Anixter Inc.
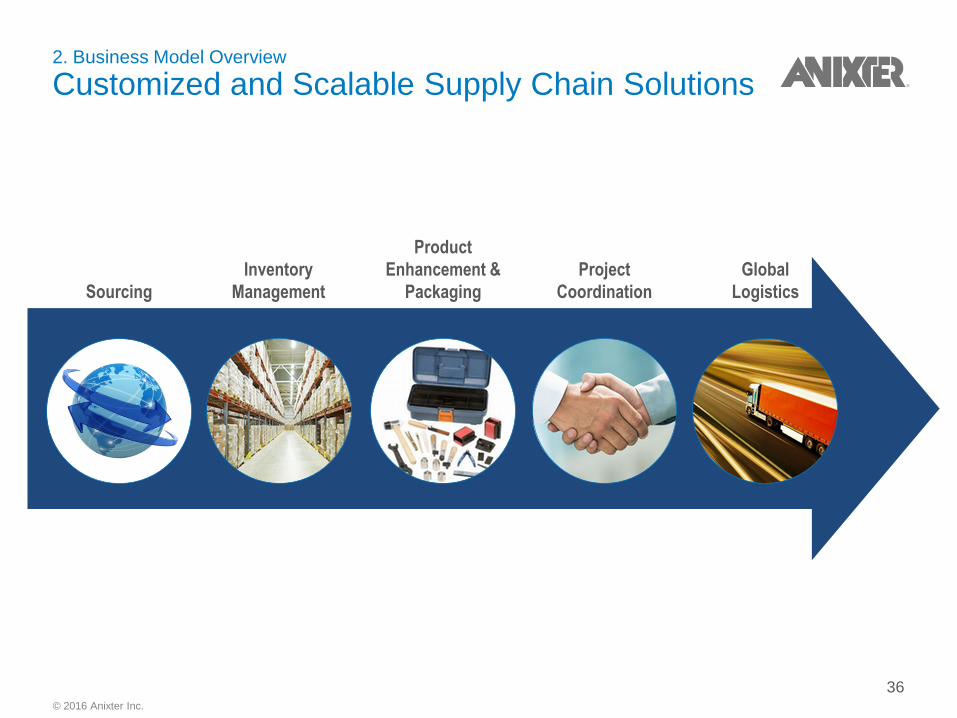
2. Business Model Overview
Customized and Scalable Supply Chain Solutions
Sourcing
Inventory
Management
Product
Enhancement &
Packaging
Project
Coordination
Global
Logistics
36

© 2016 Anixter Inc.
37
$390.0
$155.2
$134.2
$173.0
$15.6
$350.0 $400.0
$41.1
$350.0
$0
$250
$500
$750
$1,000
2016 2017 2018 2019 2020 2021 2022 2023 2024
5.50% Senior Notes due 2023 Undrawn European Facilities 5.125% Senior Notes due 2021
5.625% Senior Notes due 2019 Undrawn CAD Revolver CAD Term Loan
Undrawn Inventory Revolver Undrawn A/R Revolver $600MM A/R Revolver
*As of January 1, 2016, borrowing base on A/R Revolver is $546 million **Undrawn facilities are shown net of Letters of Credit that are backed by the respective revolvers and facilities
($ in Millions)
3. Cash Flow and Capital Allocation Priorities
Debt Maturity Schedule
© 2016 Anixter Inc.
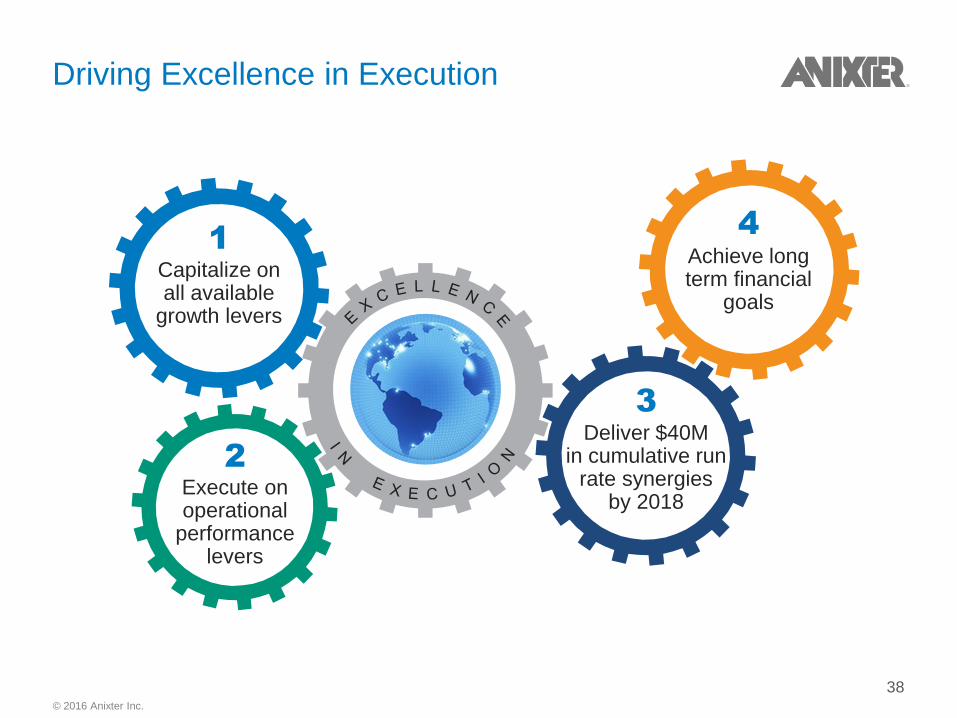
Driving Excellence in Execution
Capitalize on all available
growth levers
Deliver $40M in cumulative run
rate synergies by 2018
Achieve long term financial
goals
Execute on operational
performance levers
1
2
3
4
38
© 2016 Anixter Inc.
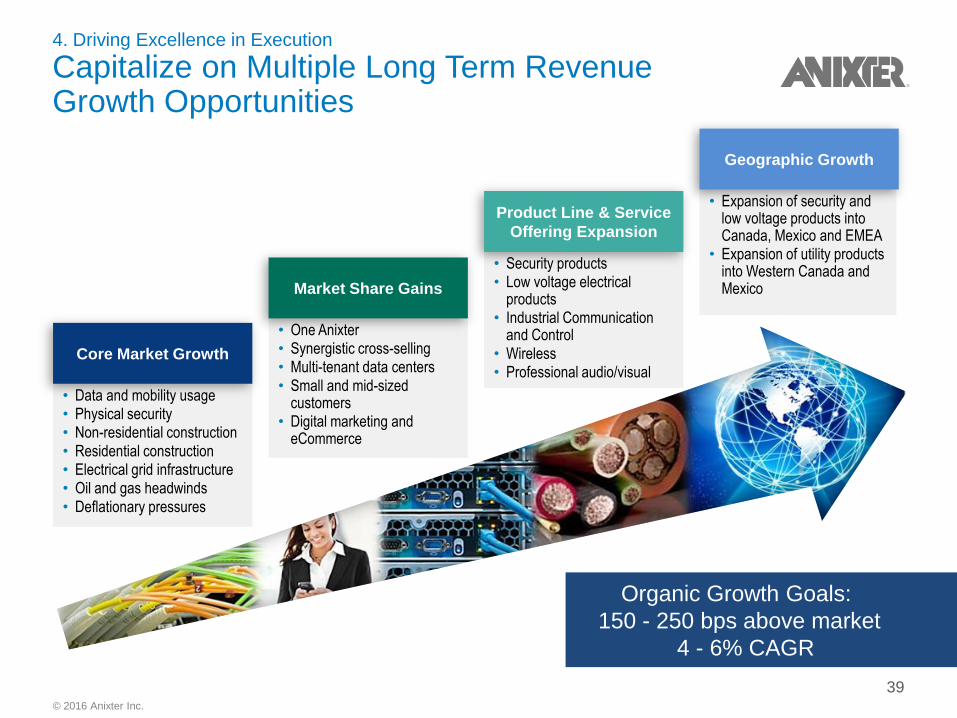
4. Driving Excellence in Execution
Capitalize on Multiple Long Term Revenue Growth Opportunities
• Security products • Low voltage electrical
products • Industrial Communication
and Control • Wireless • Professional audio/visual
• Data and mobility usage • Physical security • Non-residential construction • Residential construction • Electrical grid infrastructure • Oil and gas headwinds • Deflationary pressures
• One Anixter • Synergistic cross-selling • Multi-tenant data centers • Small and mid-sized
customers • Digital marketing and
eCommerce
Core Market Growth
Product Line & Service
Offering Expansion
Market Share Gains
• Expansion of security and low voltage products into Canada, Mexico and EMEA
• Expansion of utility products into Western Canada and Mexico
Geographic Growth
Organic Growth Goals:
150 - 250 bps above market
4 - 6% CAGR
39
© 2016 Anixter Inc.
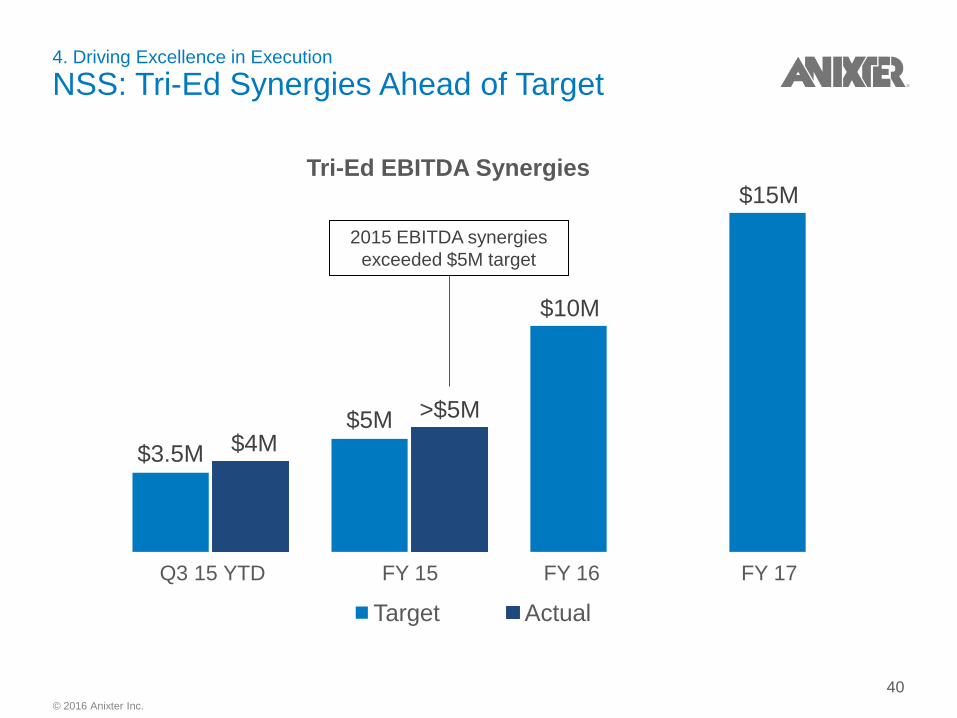
4. Driving Excellence in Execution
NSS: Tri-Ed Synergies Ahead of Target
$3.5M
$5M
$10M
$15M
$4M
>$5M
Target Actual
Tri-Ed EBITDA Synergies
2015 EBITDA synergies
exceeded $5M target
Q3 15 YTD FY 15 FY 16 FY 17
40
© 2016 Anixter Inc.
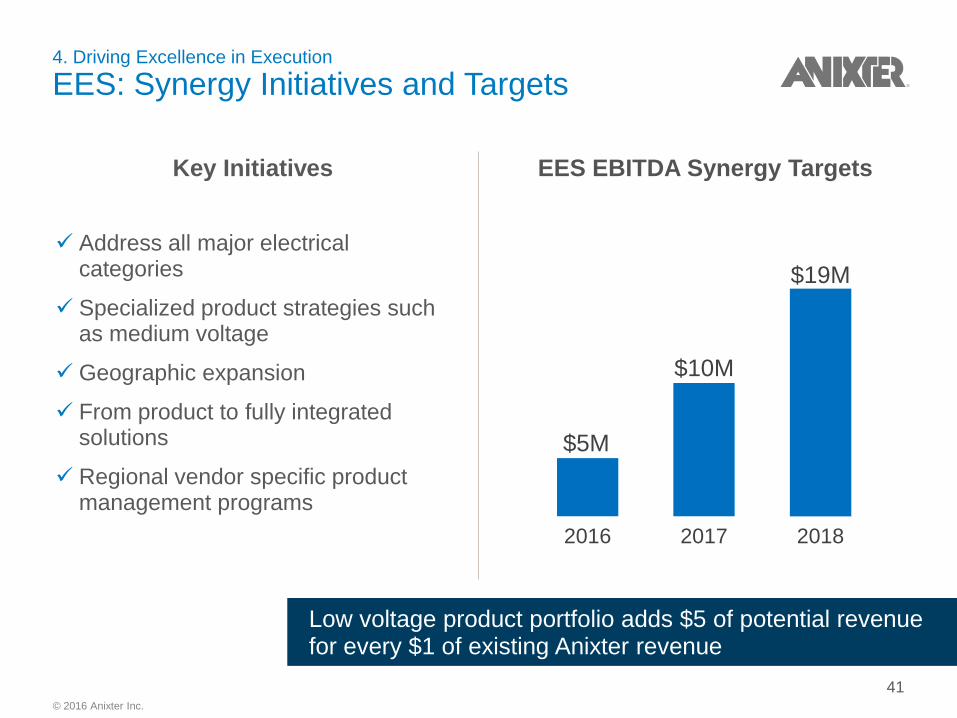
Address all major electrical categories
Specialized product strategies such as medium voltage
Geographic expansion
From product to fully integrated solutions
Regional vendor specific product management programs
Key Initiatives
$5M
$10M
$19M
2016 2017 2018
EES EBITDA Synergy Targets
4. Driving Excellence in Execution
EES: Synergy Initiatives and Targets
Low voltage product portfolio adds $5 of potential revenue for every $1 of existing Anixter revenue
41
© 2016 Anixter Inc.
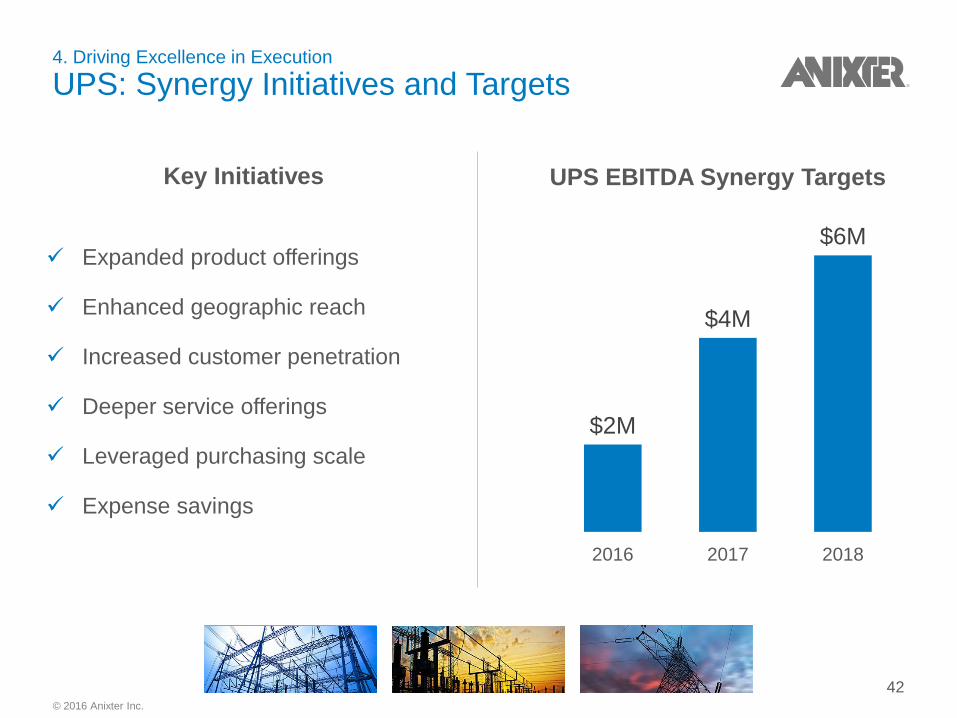
4. Driving Excellence in Execution
UPS: Synergy Initiatives and Targets
UPS EBITDA Synergy Targets
Expanded product offerings
Enhanced geographic reach
Increased customer penetration
Deeper service offerings
Leveraged purchasing scale
Expense savings
$2M
$4M
$6M
2016 2017 2018
Key Initiatives
42
© 2016 Anixter Inc.
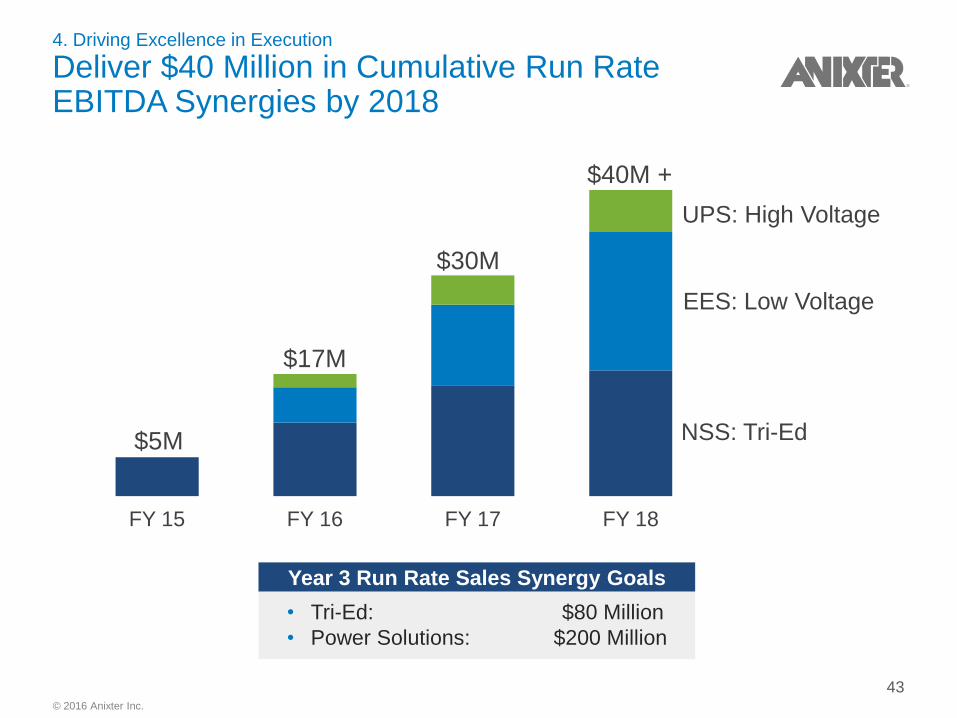
FY 15 FY 16 FY 17 FY 18
4. Driving Excellence in Execution
Deliver $40 Million in Cumulative Run Rate EBITDA Synergies by 2018
NSS: Tri-Ed
EES: Low Voltage
UPS: High Voltage
$40M +
$30M
$17M
$5M
• Tri-Ed: $80 Million
• Power Solutions: $200 Million
Year 3 Run Rate Sales Synergy Goals
43
© 2016 Anixter Inc.
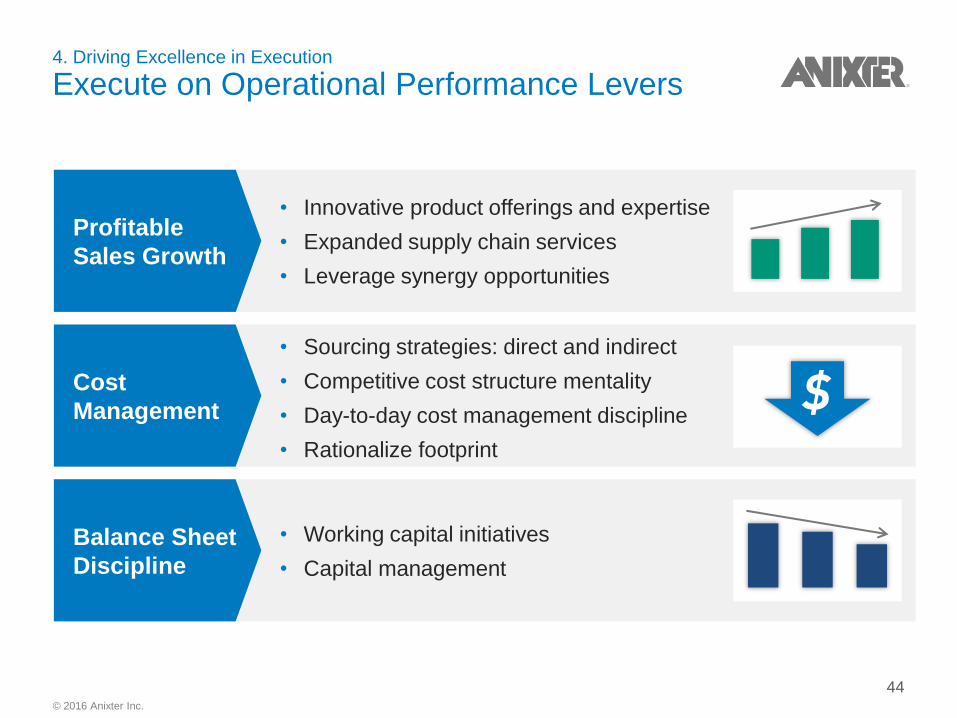
Balance Sheet
Discipline
4. Driving Excellence in Execution
Execute on Operational Performance Levers
Profitable
Sales Growth
Cost
Management
• Innovative product offerings and expertise
• Expanded supply chain services
• Leverage synergy opportunities
• Sourcing strategies: direct and indirect
• Competitive cost structure mentality
• Day-to-day cost management discipline
• Rationalize footprint
• Working capital initiatives
• Capital management
44
© 2016 Anixter Inc.
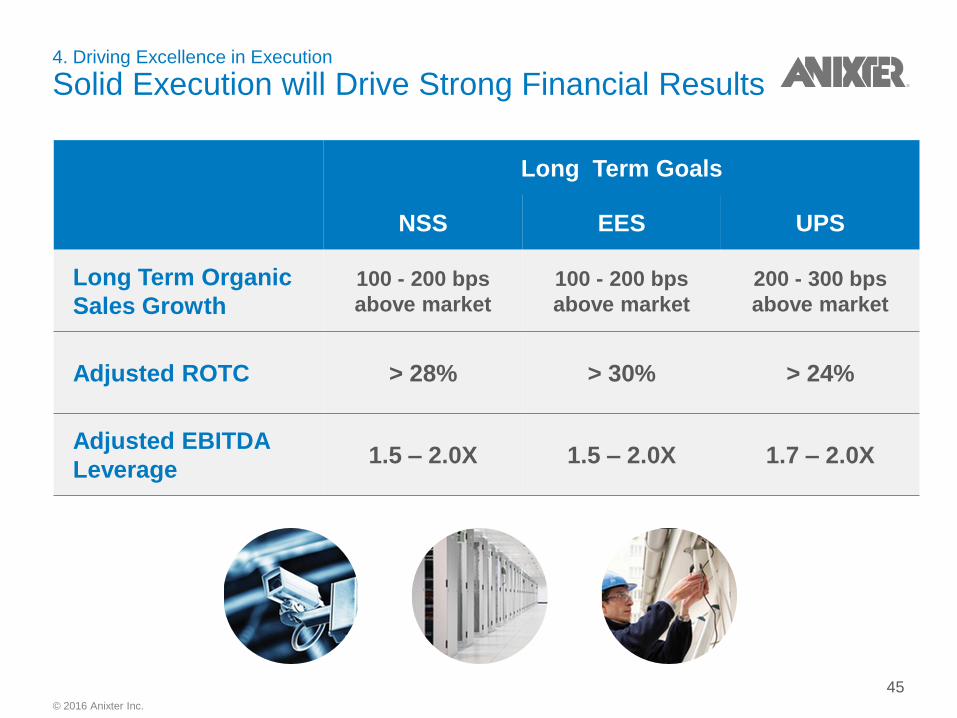
4. Driving Excellence in Execution
Solid Execution will Drive Strong Financial Results
Long Term Goals
NSS EES UPS
Long Term Organic
Sales Growth
100 - 200 bps
above market
100 - 200 bps
above market
200 - 300 bps
above market
Adjusted ROTC > 28% > 30% > 24%
Adjusted EBITDA
Leverage 1.5 – 2.0X 1.5 – 2.0X 1.7 – 2.0X
45
© 2016 Anixter Inc.
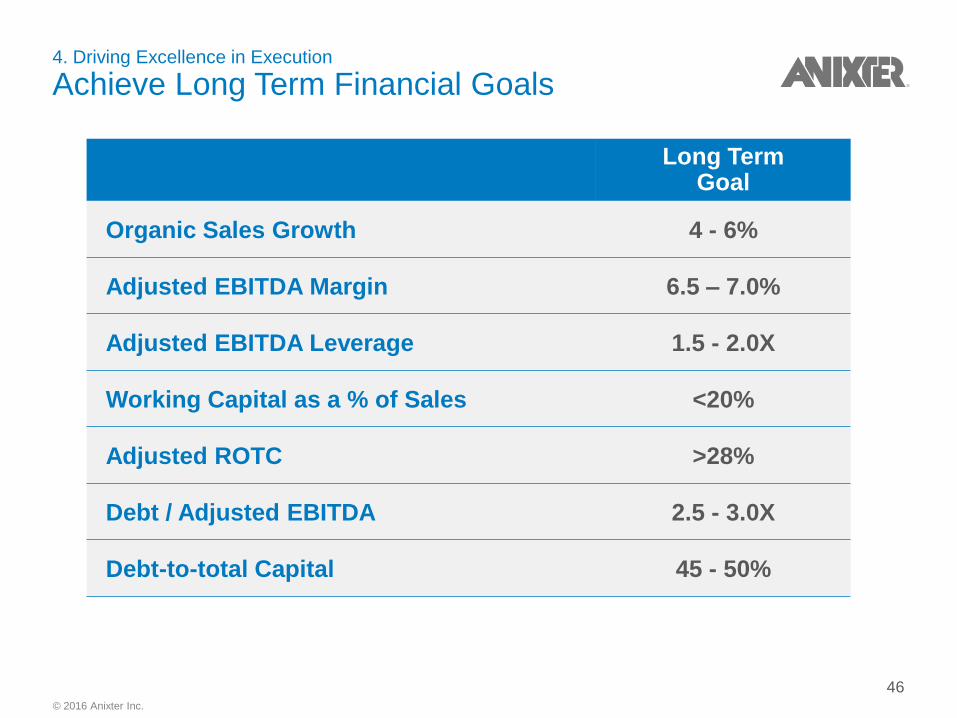
4. Driving Excellence in Execution
Achieve Long Term Financial Goals
Long Term Goal
Organic Sales Growth 4 - 6%
Adjusted EBITDA Margin 6.5 – 7.0%
Adjusted EBITDA Leverage 1.5 - 2.0X
Working Capital as a % of Sales <20%
Adjusted ROTC >28%
Debt / Adjusted EBITDA 2.5 - 3.0X
Debt-to-total Capital 45 - 50%
46
© 2016 Anixter Inc.
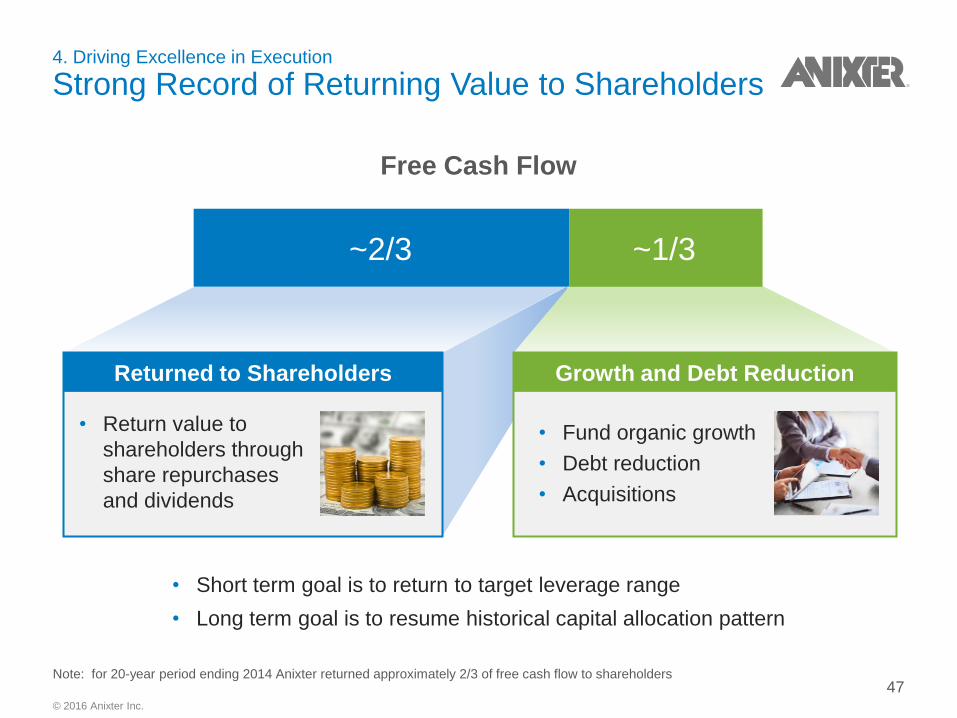
Free Cash Flow
4. Driving Excellence in Execution
Strong Record of Returning Value to Shareholders
Growth and Debt Reduction Returned to Shareholders
• Fund organic growth
• Debt reduction
• Acquisitions
• Return value to
shareholders through
share repurchases
and dividends
• Short term goal is to return to target leverage range
• Long term goal is to resume historical capital allocation pattern
~2/3 ~1/3
Note: for 20-year period ending 2014 Anixter returned approximately 2/3 of free cash flow to shareholders 47
© 2016 Anixter Inc.
In Summary
Compelling Investor Value Proposition Results from our Compelling Customer Value Proposition
• Customer value proposition
− Reduce cost, complexity and risk in our customers’ supply chains
− Key Competitive Differentiators:
• Global capabilities with local presence
• Customized and scalable supply chain solutions
• Technical expertise
• Investor value proposition
− Leading positions in attractive businesses
− Competitive advantage and barriers to entry
− Globally scalable business model
− Financial strength and capital efficiency
− Visibility to growth, ability to deliver synergies
48