2016 shelter retrofit report -...
TRANSCRIPT

2016 Shelter Retrofit Report
November 2016
Rick Scott Bryan W. Koon Governor Director

State of Florida Shelter Retrofit Report
TABLE OF CONTENTS
EXECUTIVE SUMMARY………………………………………………………... i I. INTRODUCTION…………………………………………………………. 1-1 Purpose……………………………………………………………………… 1-1 Shelter Retrofit Project Identification Procedure………………………………. 1-1 Summary of Annual Reports…………………………………………………. 1-3 II. CURRENT SITUATION………………………………..…………………. 2-1 Statewide Progress in Shelter Retrofitting and Enhanced Hurricane
Protection Area (EHPA) Construction………………………………………… 2-1 III. SUMMARY OF PROJECT RECOMMENDATIONS……………………. 3-1 IV. STRATEGY FOR PUBLIC SHELTER DEFICIT REDUCTION………… 4-1 V. CONCLUSION…………………………………………………………….. 5-1

APPENDIX A. List of Abbreviations
B. Glossary
C. American Red Cross Hurricane Shelter Selection Standards (ARC 4496)
D. Methodology for Recommendation of Projects for Funding
E. Prioritized List of Projects
(1) Prioritized List of Recommended Construction-Related Projects (2) List of Projects Offered for Specific Appropriation 1515A FY 2011/2012
List of Projects Offered for Specific Appropriation 2624 FY 2012/2013 List of Projects Offered for Specific Appropriation 2571 FY 2013/2014 List of Projects Offered for Specific Appropriation 2593 FY 2014/2015 List of Projects Offered for Specific Appropriation 2593 FY 2015/2016
F. List of Recommended Projects-Generators
G. List of Projects Not Yet Recommended (1) Retrofit Projects Not Yet Recommended (2) Generator Projects Not Yet Recommended
H. Data Forms and Worksheets
(1) 2016 Shelter Retrofit Proposal Submittal Form (2) 2016 Project Priority Worksheet
List of Tables Table 1.1 Historical Summary of Shelter Retrofit Report Program……………1-3 Table 2.1 2016 Hurricane Evacuation Shelter Deficit Reduction Progress……2-2 Table 3.1 2016 Shelter Retrofit Report Recommended Project Totals...………3-1 List of Figures Figure 1.1 Regional Planning Council map …………………………..…………1-2 Figure 4.1 Graph of Florida’s progress in reducing the hurricane shelter deficit...4-3

Division of Emergency Management 2016 Shelter Retrofit Report
i Executive Summary
EXECUTIVE SUMMARY
The Division of Emergency Management (Division), as directed by section 252.385, Florida Statutes, publishes a shelter retrofit report annually. The report provides a list of facilities recommended to be retrofitted for use as public hurricane evacuation shelters. Retrofitting is the modification of an existing structure to make it stronger and more disaster resistant. For example, installing hurricane shutters on an existing building protects doors and windows from wind-borne debris. Such measures bring the safety of public shelters up to established safety criteria and increase the availability of public hurricane evacuation shelter spaces in the State of Florida.
Since 1999 significant progress has been made toward reducing the deficit of safe public hurricane shelter space and meeting the American Red Cross’s Standards for Hurricane Evacuation Shelter Selection (ARC 4496, January 2002). A combination of existing building surveys, retrofitting and application of enhanced hurricane design and construction standards has increased available hurricane shelter spaces to a total of 1,022,801. Another 23,861 spaces (meeting ARC 4496 safety standards) are estimated to be available to the public by August 2017.
In preparation of the 2016 Shelter Retrofit Report, the Division reviewed a total of 668 projects submitted by county emergency management agencies in collaboration with other partner organizations (local American Red Cross chapters and school boards) that participate in hurricane shelter planning and operations. After careful evaluation of the proposed projects, the Division, by priority, recommends 203 projects for retrofitting. These projects alone will create an additional 78,041 ARC 4496 hurricane shelter spaces statewide at an estimated cost of $16,360,523.
A significant increase in public hurricane shelter capacity has been achieved over the past 16 years. This is largely due to the availability of retrofit and mitigation-related dollars to fund these projects. Prior to 1999, the State lacked a dedicated funding source to meet the demands for public shelter space. Since 1999, however, the Governor and the Legislature have committed to fund the State’s retrofit program on a recurring basis. Per section 215.559(1)(b), Florida Statutes, the Division is provided $3 million per year to retrofit hurricane shelters as prioritized in the published Shelter Retrofit Reports. The Federal Emergency Management Agency’s (FEMA) Hazard Mitigation Grant Program (HMGP) has provided approximately $39 million to harden or retrofit public hurricane shelters during the history of the program. Table 1.1 summarizes the State’s progress in creating needed public hurricane shelter space through retrofit of appropriate buildings.

Division of Emergency Management 2016 Shelter Retrofit Report
ii Executive Summary
The Division’s public hurricane shelter deficit reduction strategy focuses on five major components: 1) surveying hurricane shelter facilities in existing local inventories to identify unused space; 2) surveying facilities not currently listed in local inventories to identify additional capacity; 3) providing funding for cost-effective retrofit or other mitigation measures on existing buildings that can provide additional shelter capacity; 4) incorporating hurricane shelter design criteria into new public building construction projects; and 5) reducing hurricane shelter demand through improved public information, education and behavioral analysis, and decreased evacuation need.
A significant component of the strategy to increase the availability of “safe” hurricane shelter space is construction of new school facilities to comply with the Enhanced Hurricane Protection Area (EHPA) requirements. Through construction of EHPA facilities, 495,537 (See Table 2.1) hurricane shelter spaces have been added to the state’s inventory since 1995. As deficits in planning regions have disappeared, the requirement to fund school construction at the EHPA level decreased so that no new EHPA schools are anticipated in the 2016-2017 cycle. Since 1995 the State has made significant progress toward improving the safety and availability of public hurricane shelter space. On a statewide cumulative basis, the current capacity is about 13 percent greater than the estimated demand calculated in Table 2.1. The metrics are evidence that the comprehensive strategy is an effective means to eliminate shelter deficits.
At publication of the 2016 Shelter Retrofit Report, Florida had 40 counties with an adequate capacity of general population public hurricane shelter spaces (see Table 2.1). The state and local efforts and commitment to reduce the shelter deficit resulted in all but two of the State’s Regional Planning Council (RPC) regions reporting adequate capacity at this time. The two RPC regions with a current deficit per data from the 2016 Statewide Emergency Shelter Plan are regions 6 and 8. However, changes in Federal Emergency Management Agency flood and storm surge maps coupled with recent population and demographic trends reflected in evacuation studies, created a significant overall increase in shelter demand for fiscal year 2016 -2017. Forecasting for the five-year period indicates higher demand for special needs shelters, specifically. These demand figures do not take into account the aging of the current stock of public shelters nor the approaching end of the useful life of some of the original retrofit projects. As existing buildings constructed to older building codes continue to age, replacement facilities, such as new construction or retrofit of recently constructed facilities, will be needed to ensure that state shelter capacities meet both current and future needs.
In summary, as the number of Floridians in areas vulnerable to hurricanes continues to grow, it is vitally important that construction of hurricane shelters and retrofitting of existing buildings continue. Full implementation of the Division’s shelter deficit reduction strategy will create a greater level of preparedness, a more efficient capability for responding to incidents and an increased ability to meet the needs of disaster survivors.

Division of Emergency Management 2016 Shelter Retrofit Report
1-1 Introduction
I. INTRODUCTION Purpose
In an effort to continue to reduce the State’s public hurricane shelter deficit, the Division of Emergency Management (Division) annually issues a Shelter Retrofit Report, which provides a list
of facilities recommended to be retrofitted using state funds. See Sec.252.385, Florida Statutes. Each year this report is provided to the President of the Senate, the Speaker of the House of Representatives and the Governor. This report prioritizes and recommends which facilities should be retrofitted based on each region’s public hurricane evacuation shelter deficit. The report’s objective is to improve relative safety and reduce the hurricane shelter space deficit in the state. Shelter Retrofit Project Identification Procedure
In collaboration with local American Red Cross (ARC) Chapters, school boards, and other public and private agencies, county emergency management agencies provided the data used for the 2016 Shelter Retrofit Report. The Division recognizes that local officials are aware of underutilized facilities and are in a position to make recommendations that will best serve their communities. In order to identify potential shelter retrofit projects for inclusion in the 2016 Shelter Retrofit Report, the Division provided general guidance for the development of proposals in a questionnaire-type format that the counties could use for project submittal. Accurate and thorough completion of the questionnaire (see Appendix H) guided those that prepared the project proposals through the shelter selection and retrofit proposal development process.
The questionnaire was formulated to include sufficient information to determine if the facility could meet the American Red Cross’ hurricane hazard safety guidelines, clearly define the project(s) to be undertaken and their impact upon hurricane shelter capacity and safety, and explain the interrelationship of the proposed project(s) and local and regional shelter strategies. The hurricane safety guidelines are found in Standards for Hurricane Evacuation Shelter Selection (ARC 4496, 2002). The cost estimates were generally provided by local agencies, commercial contractors, “rough orders of magnitude” (ROM), or in some cases, past experience in the retrofit program projects. Division staff then reviewed and ranked the projects.
This Report also includes projects originally submitted in previous Shelter Retrofit Reports. Those projects were re-evaluated along with new projects submitted in 2016. In some cases, projects evaluated in the previous reports received different rankings in the 2016 report. This is due primarily to changes in the criteria used to prioritize projects (e.g., changing regional/county demand numbers or updated costs).
The State’s criteria consist of the following:
Regional and Local Shelter Deficit Reduction Structural and Hazards Vulnerability Review (ARC 4496) Shelter Capacity Increase, Building Ownership and Availability, and Cost-

Division of Emergency Management 2016 Shelter Retrofit Report
1-2 Introduction
Effectiveness Considerations
Other Considerations / Demonstration of Impact Upon the State and Regional ShelterDeficit Situation
For more details on each criteria item please review Methodology for Recommendation of Projects for Funding attached hereto as Appendix D. Figure 1.1 below shows a map of the Regional Planning Council (RPC) regions across the State of Florida. These RPC regions are established to coordinate planning for economic development, growth management, emergencies, and other regional impacts.
Figure 1.1 – Regional Planning Councils

Division of Emergency Management 2016 Shelter Retrofit Report
1-3 Introduction
Summary of Annual Reports
The retrofit projects recommended for consideration in this Report will, if funded, substantially improve state and local hurricane preparedness. As Table 1.1 illustrates, the
Governor and the State Legislature have demonstrated a sustained commitment to reduce the deficit of safe public hurricane shelter space. From 1999 to 2016, approximately $89.87 million in federal and state funds have been committed towards retrofitting suitable facilities. An estimated total of 536,300 hurricane shelter spaces will have been funded during this period.
Table 1.1 Historical Summary of Florida's Hurricane Shelter Retrofit Program
Shelter Retrofit Report Year
Annual Shelter Retrofit Report Recommended Budget Cost $
(without generators)
Annual Shelter Retrofit Report
Projected Number of
Spaces Gained
Federal and State Funds Allocated to
Shelter Retrofit Report
Recommended Projects
Shelter Retrofit Report Spaces gained
Cumulative Shelter Retrofit Report Spaces gained
1999 $16,185,193 88,679 $8,473,341 72,230 72,230
2000 $36,399,457 250,362 $25,572,795 119,087 191,317
2001 $26,943,516 119,905 $5,233,731 20,574 211,891
2002 $26,959,668 157,326 $4,735,113 41,710 253,601
2003 $23,349,714 137,985 $3,000,000 33,381 286,982
2004 $13,457,737 93,967 $7,500,000 68,765 355,747
2005 $11,882,722 68,882 $3,000,000 24,481 380,228
2006 $8,683,049 54,415 $3,000,000 13,820 394,048
2007 $10,956,377 82,930 b $6,607,263 a 25,645 419,693
2008 $13,432,213 85,997 $0 c 0 419,693
2009 $11,777,884 69,465 $3,000,000 d 13,055 432,748
2010 $15,634,282 120,447 $1,750,000 e 4,861 437,609
2011 $20,337,203 109,308 $3,000,000 f 23,881 461,490
2012 $14,707,717 110,394 $3,000,000 g 14,810 476,300
2013 $12,745,072 87,150 $3,000,000 h 15,000 491,300
2014 $13,994,180 107,236 $3,000,000 j 15,000 506,300
2015 $15,188,945 117,609 $3,000,000 k 15,000 521,300
2016 $3,000,000 l 15,000 536,300
TOTAL N/A N/A $89,872,243 536,300

Division of Emergency Management 2016 Shelter Retrofit Report
1-4 Introduction
a – 25,645 spaces were gained from HB 7121 & 1621X shelter retrofit projects. b – $6,607,263 was based on federal funds plus state funds match for HB7121 and non-federal matched projects from Special Appropriation 1621X. c – For Fiscal Year 08-09 no funds were appropriated for the Shelter Retrofit Report list. d – 13,055 reflects estimated gain from Specific Appropriation 1496 (FY 2009-2010) e – 4,861 reflects estimated gain from Specific Appropriation 1617 (FY 2010-2011) f – 23,881 reflects Spaces completed / under contract from Specific Appropriation 1515A (FY2011-2012) g– 14,810 reflects Spaces under contract / offered to be gained from Specific Appropriation 2624 (FY2012-2013) h– 15,000 is preliminary estimate of spaces to be gained from accepted & offered + remaining funds averaged at rate based upon $200 a space from Specific Appropriation 2571 (FY2013-2014)
j– 15,000 is preliminary estimate of spaces to be gained from offered + remaining funds averaged at rate based upon 2013 & 2014 from Specific Appropriation 2593 (FY2014-2015)
k– 15,000 is preliminary estimate of spaces to be gained from Specific Appropriation 2021 (FY2015-2016)
l– 15,000 is preliminary estimate of spaces to be gained from an average rate based upon 2012, 2013 & 2014 for 2015-2016 Appropriation

Division of Emergency Management 2016 Shelter Retrofit Report
2-1 Current Situation
II. CURRENT SITUATION
During the last two decades, Florida has experienced major disasters with loss of life and property due to tropical storms, hurricanes and a wide array of other disasters. Of the state’s sixty-seven (67)
counties, thirty-five (35) of them lie along 8,426 miles of coastline, including tidal inlets, bays, and other waterways. The National Hurricane Center asserts that 40 percent of Florida residents live in areas vulnerable to storm surge (http://www.nhc.noaa.gov/news/20141106_pa_natlSurgeMap). The proximity of population concentrations along the Gulf of Mexico and the Atlantic Ocean, coupled with generally low coastal elevations, significantly increase the state’s vulnerability to hurricane damage, tidal surges, and storm-related flooding. This vulnerability has manifested itself in the need for thousands of safe public hurricane shelter spaces.
The need for safe public shelter space is critical. Nearly 80 percent of Florida’s population has settled in coastal areas which are susceptible to hurricane force winds and damage caused by storm surge. The statewide sheltering deficit situation is not just a coastal phenomenon. The future safety of all our vulnerable citizens prior to and during a hurricane will require additions to the statewide public hurricane shelter inventory. Improved methodology in evacuation studies and a renewed emphasis on registration for persons with special needs created in 2016 an increase in demand for risk shelters that can accommodate persons with a variety of special needs. Risk shelters for special needs require electrical generation capability and more space per client, so the retrofit process is more expensive and the resulting spaces do not contribute to deficit reduction as efficiently.
Since recognizing the American Red Cross guidance standard 4496 as the minimum hurricane safety criteria, the Division has endeavored to eliminate the shelter deficit using a multifaceted approach. This approach includes: 1) surveying hurricane shelter facilities in existing local inventories to identify additional spaces 2) surveying facilities not currently listed in local inventories to identify unused capacity; 3) providing funding for cost-effective retrofit or other mitigation measures on existing buildings that can provide additional shelter spaces; 4) incorporating hurricane shelter design criteria into new public building construction projects; and 5) reducing hurricane shelter demand through improved public information, education and behavioral analysis, and decreased evacuation need.
Statewide Progress in Shelter Retrofitting and Enhanced Hurricane Protection Area Construction Each spring county emergency management offices are polled for information on their retrofit projects and/or new school facility Enhanced Hurricane Protection Area (EHPA) construction projects. Table 2.1 shows listings of retrofitted spaces, EHPA spaces created through June 2016, and projected gains (contracted or under construction) between September 2015 and August 2016. Additionally, Table 2.1 shows the estimated shelter demand for 2016-2017 (provided by the Division’s evacuation studies), the hurricane shelter space adequacy/deficit in each county, and for the state as a whole. Thus, while significant progress has been made, there is still need for further effort statewide.

Division of Emergency Management 2016 Shelter Retrofit Report
2-2 Current Situation
Table 2.1Hurricane Evacuation Shelter Deficit Reduction Progress
2016-2017
Shelter Capacity That Meets ARC 4496 Guidelines "Post - 1995 Success Stories"
RPC Region Deficit
County Name
1995- August 2016 September 2016 -
August 2017 1995-2016
Fiscal year 2016-2017 Estimated Fiscal
Year 2016-2017
Sufficient Capacity / (Deficit)
Retrofit & AS-IS
Shelter Capacity
New School EHPA
Capacity
Projected Retrofit Shelter
Capacity
Projected New
School EHPA
Capacity
Total Hurricane
Shelter Capacity
Category 5 Demand (General
Population and SpNS)
3 No Alachua 9,733 1,600 122 0 11,455 11,864 (409)
4 No Baker 1,675 1,612 0 3,287 2,618 669
1 No Bay 14,944 956 0 15,900 6,443 9,457
3 No Bradford 1,695 0 0 1,695 1,287 408
5 No Brevard 30,381 12,063 0 42,444 31,469 10,975
10 No Broward 500 60,005 0 60,505 28,299 32,206
2 No Calhoun 1,810 172 1,599 0 3,581 1,019 2,562
8 Yes Charlotte 0 0 0 0 12,089 (12,089)
7 No Citrus 3,647 208 0 3,855 13,314 (9,459)
4 No Clay 4,613 2,985 0 7,598 11,281 (3,683)
8 Yes Collier 5,784 0 0 5,784 29,964 (24,180)
3 No Columbia 1,531 4,105 1,518 0 7,154 4,661 2,493
6 Yes Desoto 2,602 151 0 2,753 3,159 (406)
3 No Dixie 826 0 0 826 1,832 (1,006)
4 No Duval 32,036 15,343 0 47,379 40,802 6,577
1 No Escambia 25,510 1,803 0 27,313 10,680 16,633
4 No Flagler 9,272 725 1,200 0 8,320 6,227 1,139
2 No Franklin 0 0 0 0 319 (319)
2 No Gadsden 1,917 5,732 0 7,649 3,272 4,377
3 No Gilchrist 3,129 0 0 3,129 1,123 2,006
8 Yes Glades 408 388 0 796 1,594 (798)
2 No Gulf 232 228 0 460 532 (72)
3 No Hamilton 0 1,196 0 1,196 1,038 158
6 Yes Hardee 139 4,623 0 4,762 2,167 2,595
8 Yes Hendry 5,263 1,000 0 6,263 3,285 2,978
7 No Hernando 1,416 8,051 1,793 0 11,260 11,565 (305)
6 Yes Highlands 2,451 6,137 0 8,588 11,553 (2,965)
7 No Hillsborough 27,004 65,699 647 0 93,350 52,316 41,034
1 No Holmes 179 1,191 0 1,370 991 379
9 No Indian River 10,507 0 0 10,507 5,805 4,702
2 No Jackson 499 3,365 0 3,864 1,757 2,107
2 No Jefferson 0 809 0 809 664 145
3 No Lafayette 647 0 213 0 860 609 251
5 No Lake 3,414 24,546 0 27,959 24,960 2,999
8 Yes Lee 500 0 0 500 71,410 (70,910)
2 No Leon 21,858 1,245 1,134 0 24,237 3,987 20,250
3 No Levy 2,349 354 0 2,703 4,184 (1,481)
2 No Liberty 836 822 219 0 1,877 467 1,410

Division of Emergency Management 2016 Shelter Retrofit Report
2-3 Current Situation
Note: For simplicity, all general population hurricane Shelter capacities are calculated based on 20 sq.ft. per evacuee.
Table 2.1 continuedHurricane Evacuation Shelter Deficit Reduction Progress
2016-2017
Shelter Capacity That Meets ARC 4496 Guidelines "Post - 1995 Success Stories"
RPC
Region Deficit
County Name
1995- August 2016
September 2016 - August 2017
1995-2016
Fiscal year 2016-2017 Estimated
Fiscal Year 2016-2017
Sufficient Capacity / (Deficit
Retrofit &
AS-IS Shelter
Capacity
New
School EHPA
Capacity
Projected Retrofit Shelter
Capacity
Projected New
School EHPA
Capacity
Total
Hurricane Shelter
Capacity
Category 5 Demand (General
Population and SpNS)
3 No Madison 4,236 0 0 4,236 1,259 2,977
7 No Manatee 9,735 21,702 0 31,437 24,060 7,377
3 Yes Marion 7,039 10,257 0 17,296 18,166 (870)
9 No Martin 11,383 10,047 0 21,430 5,331 16,099
10 No Miami-Dade 73,448 22,499 0 95,946 97,855 (1,909)
10 No Monroe 723 0 0 723 2,590 (1,867)
4 No Nassau 326 4,081 2,162 0 6,569 5,318 1,251
1 No Okaloosa 11,574 2,025 0 13,599 5,927 7,672
6 Yes Okeechobee 811 1,011 0 1,822 7,342 (5,520)
5 No Orange 2,530 28,678 0 31,208 27,952 3,256
5 No Osceola 18,001 7,982 716 0 26,699 10,151 16,548
9 No Palm Beach 22,793 48,355 0 71,148 29,754 41,394
7 No Pasco 10,199 17,556 0 27,756 31,294 (3,538)
7 No Pinellas 24,250 10,150 0 34,400 42,178 (7,778)
6 Yes Polk 2,423 33,157 0 35,580 45,257 (9,677)
4 No Putnam 3,495 1,196 0 4,691 4,748 (57)
4 No Saint Johns 10,437 7,198 3,728 0 21,363 5,875 15,488
9 No Saint Lucie 12,997 4,388 0 17,385 29,826 (12,441)
1 No Santa Rosa 7,536 5,471 0 13,007 11,445 1,562
8 Yes Sarasota 4,597 9,296 0 13,893 11,325 2,568
5 No Seminole 30,220 1,206 4,244 0 35,670 7,833 27,837
5 No Sumter 711 200 1,624 0 2,535 9,786 (7,251)
3 No Suwannee 50 3,484 0 3,534 3,780 (246)
3 No Taylor 4,144 2,424 2,942 0 9,510 1,713 7,797
3 No Union 1,371 345 0 1,716 708 1,008
5 No Volusia 15,291 8,879 0 24,170 39,238 (15,068)
2 No Wakulla 0 800 0 800 844 (44)
1 No Walton 4,028 5,269 0 9,297 1,807 7,490
1 No Washington 3,609 1,171 0 4,780 1,530 3,250 Subtotals: 527,264 495,537 23,861 0
905,499
137,735 Totals: 1,022,801 23,861
Grand Totals: 1,046,662

Division of Emergency Management 2016 Shelter Retrofit Report
3-1 Summary of Retrofit Recommendations
III. SUMMARY OF PROJECT RECOMMENDATIONS
In March 2016, the Division requested county emergency managers to submit new shelterretrofit projects and confirm or delete any shelter retrofit projects on the current Shelter Retrofit Report lists. Each proposed retrofit project is required to meet ARC 4496 upon completion. The Division identified 203 (203 constructed/structural retrofits plus 84 generator projects) projects that would meet the standard after retrofitting. All projects were ranked using the following factors: local and regional shelter space deficit; greatest provision of space; cost efficiency per space; and vulnerability to winds and surge. See Appendices E and F for lists of recommended projects.
Table 3.1 provides a summary of the proposed shelter retrofit projects, the region served, the construction-related costs and the generator-related costs of the proposed projects, and the total hurricane shelter space capacity that will be created after completion of retrofits. “Region” refers to Regional Planning Council (RPC) regions. These RPC regions are established to coordinate planning for economic development, growth management, emergencies, and other regional impacts. See Figure 1.1 for a map of the State’s RPC regions.
Table 3.1 2016 Shelter Retrofit Report County and Regional Recommended Project Totals
As of September 30, 2016
Region County Construction-related
Costs, $
Hurricane Shelter Capacity Gained,
spaces
Generator-related Costs, $
1 BAY $20,000 200 $0 1 ESCAMBIA $211,500 822 $1,280,028 1 HOLMES $0 0 $20,000 1 OKALOOSA $0 0 $50,000 1 SANTA ROSA $0 0 $0 1 WALTON $0 0 $0 1 WASHINGTON $0 0 $0
Region 1 Totals: $231,500 1,022 $1,350,028 2 CALHOUN $0 0 $0 2 FRANKLIN $0 0 $0 2 GADSDEN $518,482 2,133 $0 2 GULF $0 0 $0 2 JACKSON $0 0 $72,318 2 JEFFERSON $0 0 $0 2 LEON $0 0 $0 2 LIBERTY $51,250 257 $0 2 WAKULLA $0 0 $0
Region 2 Totals: $569,732 2,390 $72,318 3 ALACHUA $1,904,806 4,146 $0 3 BRADFORD $0 0 $0 3 COLUMBIA $1,154,799 4,072 $0

Division of Emergency Management 2016 Shelter Retrofit Report
3-2 Summary of Retrofit Recommendations
Table 3.1 2016 Shelter Retrofit Report County and Regional Recommended Project Totals
As of September 30, 2016
Region County Construction-related
Costs, $
Hurricane Shelter Capacity Gained,
spaces
Generator-related Costs, $
3 DIXIE $0 0 $0 3 GILCHRIST $0 0 $0 3 HAMILTON $0 0 $0 3 LAFAYETTE $0 0 $0 3 LEVY $0 0 $0 3 MADISON $160,000 300 $0 3 MARION $0 0 $0 3 SUWANNEE $0 0 $0 3 TAYLOR $0 0 $0 3 UNION $341,250 1,107 $0 Region 3 Totals: $3,560,855 9,625 $0 4 BAKER $0 0 $0 4 CLAY $800,000 1,834 $0 4 DUVAL $325,000 4,993 $4,250 4 FLAGLER $599,443 2,245 $0 4 NASSAU $744,450 5,003 $405,000 4 PUTNAM $355,809 1,544 $0 4 SAINT JOHNS $732,794 5,845 $0 Region 4 Totals: $3,557,496 21,464 $409,250 5 BREVARD $160,000 600 $3,796,377 5 LAKE $0 0 $193,700 5 ORANGE $3,310,922 19,367 $0 5 OSCEOLA 180,895 1,014 $1,004,750 5 SEMINOLE $360,000 1,590 $0 5 SUMTER $29,160 504 $287,517 5 VOLUSIA $616,565 5,078 $40,000 Region 5 Totals: $4,657,542 28,153 $5,322,344 6 DESOTO $0 0 $40,000 6 HARDEE $28,730 292 $144,168 6 HIGHLANDS $0 0 $0 6 OKEECHOBEE $175,000 224 $25,650 6 POLK $222,870 820 $124,000 Region 6 Totals: $426,600 1,336 $333,818 7 CITRUS $160,000 1,146 $0 7 HERNANDO $921,017 4,486 $0 7 HILLSBOROUGH $362,085 675 $0 7 MANATEE $1,711,421 3,971 $0 7 PASCO $0 0 $1,535,171 7 PINELLAS $0 0 $0 Region 7 Totals: $3,154,523 10,278 $1,535,171

Division of Emergency Management 2016 Shelter Retrofit Report
3-3 Summary of Retrofit Recommendations
Table 3.12016 Shelter Retrofit Report County and Regional Recommended Project Totals
As of September 30, 2016
Region County Construction-related Costs, $
Hurricane Shelter Capacity Gained,
spaces
Generator-related Costs, $
8 CHARLOTTE $0 0 $101,000 8 COLLIER $10,000 518 $25,000 8 GLADES $2,000 1,379 $0 8 HENDRY $0 0 $0 8 LEE $0 0 $0 8 SARASOTA $0 0 $0
Region 8 Totals: $12,000 1,897 $126,000 9 INDIAN RIVER $0 0 $0 9 MARTIN $0 0 $568,255 9 PALM BEACH $0 0 $1,290,000 9 SAINT LUCIE $0 0 $972,404
Region 9 Totals: $0 0 $2,830,659 10 BROWARD $75,000 600 $0 10 MIAMI-DADE $115,275 1,276 $0 10 MONROE $0 0 $0
Region 10 Totals: $190,275 1,876 $0
Totals: $16,360,523 78,041 $11,979,588
If funded, the projects listed in this report will provide an estimated increase of 78,041 hurricane shelter spaces at a cost of $15,309,912 (construction-related costs). Costs reflected in the “Generator-related Costs” column usually reflect only generator purchase and installation costs. Projects that include a generator for emergency or standby electric power add to the overall functionality and sustainability of a shelter, but do not singularly increase shelter space capacity.

Division of Emergency Management 2016 Shelter Retrofit Report
4-1 Strategy For Public Shelter Deficit Reduction.
IV. STRATEGY FOR PUBLIC SHELTER DEFICIT REDUCTION
The Division is responsible for developing a strategy to eliminate the deficit of “safe” public hurricane shelter space in Florida Statutes See Secs. 252.35(2)(a)2 and 252.385(1), (2) and (3), Florida Statutes. The Division’s strategy includes the following components: Component 1 –Develop and Implement Model Shelter Survey and Selection Guidelines
The Division is responsible for administering a survey program of existing schools, universities, community colleges, and other state, county and municipally-owned public buildings. Also, the Division is responsible annually for providing a list of facilities recommended to be retrofitted using state funds. To accomplish these tasks, the Division recognized the American Red Cross’s Standards for Hurricane Evacuation Shelter Selection (ARC 4496, 2002) as minimum safety criteria; See Appendix C. ARC 4496 provides safety criteria for storm surge, rainfall flooding and wind hazards, plus a basic least-risk decision making process. However, to apply the criteria to field conditions and typical building stock, the Division expanded its interpretation of ARC 4496 into a descriptive least-risk decision making model. The model is qualitative and based largely upon building performance assessments following Hurricane Andrew. The performance assessments give preference to building qualities, or characteristics that performed well in Hurricane Andrew and avoid (or mitigate) those that performed poorly, and have been updated to accommodate modern building codes and practices. A condensed version of the model can be viewed at the following URL address: http://www.floridadisaster.org/Response/engineers/HES/Manual/ARC4496-Prescriptve-Summary-Table.pdf
Component 2 – Implement Shelter Survey Program
To date, the Division has completed the first statewide baseline survey, and initiated a second baseline survey to improve accuracy and capture changes in the statewide inventory. The results of the surveys are used by state and local agencies to prepare and implement strategies to reduce, and ultimately eliminate, the deficit of recognized ARC 4496 hurricane shelter space. Between 1999 and 2016, more than 5,423 buildings were surveyed utilizing in house surveyors and private-sector consultants. The survey program has not only identified about 85,966 “as-is” spaces, but also directly, or in some cases indirectly, led to creation of more than 527,264 retrofitted shelter spaces. These totals combined with the EHPA construction of 495,537 spaces results in a total capacity of 1,046,622 spaces for this period.
Component 3 – Retrofit appropriate facilities to meet Guidelines
Since 1999, the State Legislature has annually provided funds for retrofit projects listed in the annual Shelter Retrofit Report. The retrofit projects are identified through the survey program, and are only recommended when the retrofit can create spaces that meet ARC 4496.
For Fiscal Year 2016-2017, the State Legislature appropriated $3 million to structurally
enhance or retrofit public hurricane evacuation shelters. Funding will create an estimated 15,000

Division of Emergency Management 2016 Shelter Retrofit Report
4-2 Strategy For Public Shelter Deficit Reduction.
spaces during the life of the appropriation.
Component 4 – New construction of public school facilities as Shelters
Florida Department of Education (FDOE) appointed a committee to develop a public shelter design criterion for use in new school facility construction projects. The committee included representatives from many stakeholder agencies (e.g., state and local emergency management, school board, community college and university officials, ARC, architects, engineers, etc.). The charge to the committee was to develop a set of practical and cost-effective design criteria to ensure that appropriate new educational facilities can serve as public shelters for emergency management purposes. The final criterion recommended by the committee was consistent with the hurricane safety criteria of ARC 4496.
The recommended wind design criterion was the American Society of Civil Engineers Standard 7 (ASCE 7) with a 40 mile per hour increase in basic map wind speed and an importance factor I=1.00. In addition, the hurricane shelter’s exterior envelope (walls, roofs, windows, doors, louvers, etc.) must all meet a basic wind-borne debris impact standard (i.e., SSTD 12; 9lb 2x4 @ 34 mph). However, school board officials successfully protested the increase in base wind speed, so the minimum wind design criterion was reduced to ASCE 7 at basic map wind speed with an essential facility importance factor I=1.15. The 40 mile per hour increase in base wind speed is still recommended within the code, but not required. The criteria were promulgated into the State Requirements for Educational Facilities in April, 1997. The Division’s model hurricane shelter evaluation criteria’s preferred rankings were adjusted to be consistent with FDOE’s public shelter design criteria (also known as the Enhanced Hurricane Protection Area or EHPA criteria).
Schools are funded primarily by state and local capital outlay funds, and school districts are generally reporting that the EHPA construction cost premium is about three to seven percent. Since 1997, EHPA construction has created 495,537 spaces (Table 2.1), which accounts for about 49 percent of the statewide ARC 4496 space inventory.
Component 5 – Shelter demand reduction through improved public information and education and through decreased evacuation
Hurricane evacuation studies have historically indicated that at least 25 percent of a vulnerable population would seek public shelter during an evacuation event. However, recent studies indicate that only about 15 percent will actually seek public shelter. This is consistent with the findings of recent post-storm assessments that indicate less than 10 percent of vulnerable populations seek public shelter.
The public shelter demand resulting from hurricane evacuation was significantly reduced from 1995 to 2016 due to improvements in public education and information, and more accurate storm surge/evacuation zone modeling with the use of the LiDAR (Light Detection and Ranging). However, changes in Federal Emergency Management Agency flood and storm surge maps coupled with recent population and demographic trends reflected in evacuation studies, created a significant increase in shelter demand for 2016. Forecasting for the five-year period indicates higher demand for special needs shelters, specifically. These demand figures do not

Division of Emergency Management 2016 Shelter Retrofit Report
4-3 Strategy For Public Shelter Deficit Reduction.
take into account the aging of the current stock of public shelters nor the approaching end of the useful life of the original retrofit projects. The 2016 Statewide Regional Evacuation Studies (SRES) resulted in a statewide aggregate hurricane evacuation shelter space demand reduction of 607,428 spaces. Florida’s projected statewide hurricane evacuation shelter space demand for 2016 is 905,499.
Statewide Progress in Shelter Deficit Reduction
Since 1995, Florida has made significant progress toward improving the safety and availability of public hurricane shelter space. A comprehensive strategy of surveys, retrofitting, new construction, evacuation studies and public education is the basis for the success. An expansion in storm surge/evacuation zones, aging building stock and consequent decommissioned buildings plus changes in Planned Local Use has resulted in a decrease of nearly 20 percent. Losing hard won space is difficult when the State of Florida has made so much progress in increasing the overall state capacity. However, the usable life of buildings and the retrofits provided is a factor which should be expected to materialize 20 plus years into the program. For example, the minimum useful life of storm screen retrofits was determined to be 15 years. As the retrofit materials and the buildings themselves show their age, it remains necessary to ensure the safety of public hurricane shelter space by replacing older capacity buildings and retrofits with new projects with a longer life expectancy. Improved evacuation studies also benefit the estimated total shelter demand producing a reduction of more than 44 percent. This year, adequate public hurricane shelter space is available in 40 counties. The statewide cumulative deficit of hurricane shelter space has been eliminated although regions 6 and 8, when isolated, remain in deficit condition.
Figure 4.1
0
200,000
400,000
600,000
800,000
1,000,000
1,200,000
1,400,000
1,600,000
1,800,000
2,000,000
2000 2002 2004 2006 2008 2010 2012 2014 2016 2018 2020 2022 2024
Statewide Shelter Status
Capacity Projected Capacity Demand Projected Demand
Division of Emergency Management 2016 Shelter Retrofit Report
5-1 Conclusion
V. CONCLUSION
The State of Florida recognizes the necessity of providing safe hurricane evacuation shelter space for its residents during disasters. The need was made clear by Hurricane Andrew (1992) and the Lewis Commission Report following Hurricane Floyd (1999). The State remains steadfast in its commitment to provide safe hurricane evacuation shelter space to all during a disaster. Through funding of the recommended 2016 Shelter Retrofit Report projects, Florida will continue to see the improvements in shelter space.
Since 1995, 1,040,170 hurricane evacuation shelter spaces have been identified, created through retrofitting of existing buildings, or through new construction (e.g., EHPAs). In the past year some hurricane shelter buildings have been decommissioned due to age, remodeling or reuse that’s incompatible with mass care shelter operations, removal or deterioration of window protection products; etc. There have been changes in storm hazard maps (e.g., SLOSH, national flood insurance, etc.) that affect the recognition as meeting hurricane safety criteria. Therefore, the 2016 Shelter Retrofit Report of available risk shelter capacity is 1,022,801 spaces.
In 2015 a new provision, Sec. 252.355 Florida Statutes, established new requirements for
special needs registries under county emergency managers. Although shelters for persons with specials needs have been available, the additional statutory provision increased demand because physicians are encouraged to register their patients and the registry is required to be marketed digitally. Also in 2016, changes in evacuation studies and demographics increased the demand for shelters for persons with special needs. These shelters require more space per client and additional physical accommodations which are not needed in general population shelters. They are more expensive to retrofit, the funding is restricted as to the items that can be retrofit, and the space generated per dollar invested is less. As a result, two-thirds of Florida’s counties have a special needs deficit in the 2016 Statewide Emergency Shelter Plan.
An additional 78,041 spaces could be created if the projects in this report are funded,
resulting in a total of 1,124,703 spaces available to be used for risk hurricane evacuation shelters. Some of these could receive additional funding for special needs retrofitting, reducing overall spaces but providing safe haven for Florida’s most vulnerable population. Additionally, overall demand for general population shelters fell in FY 2015-2016 to 905,499. In contrast, there was an estimated hurricane evacuation shelter demand of 1,776,606 shelter spaces in 2000.
In 2016 two (2) regions of the state still report a deficit of hurricane evacuation shelter space. Also, regions that currently have an adequate number of hurricane evacuation shelter spaces will need to maintain their inventory. Over time, some current hurricane evacuation shelter buildings will be decommissioned due to age and other issues; such as, remodeling or reuse that’s incompatible with mass care shelter operations, removal or deterioration of window protection products; etc. There may be more changes in storm hazard maps (e.g., SLOSH, national flood insurance, etc.) that could affect their recognition as meeting hurricane safety criteria. Thus, even though the aggregate statewide deficit is reduced in the 2016 Shelter Retrofit Report, a “maintenance level” of shelter space production will be necessary to avoid falling back into a deficit situation.

Appendix A:
List of Abbreviations

A-1
Appendix A: Abbreviations ANSI: American National Standards Institute ARC: American Red Cross ASCE: American Society of Civil Engineers BFE Base Flood Elevation EHPA: Enhanced Hurricane Protection Area FBC: Florida Building Code FEMA: Federal Emergency Management Agency HLMP: Hurricane Loss Mitigation Program (Florida) HMGP: Hazard Mitigation Grant Program (federal) LIDAR: Light Detection and Ranging PSN: Persons with Special Needs ROM: Rough Order of Magnitude RPC: Regional Planning Council SESP: Statewide Emergency Shelter Plan SLOSH: Sea, Lake and Overland Surges from Hurricanes SpNS: Special Needs Shelter (also SNS)

Appendix B:
Glossary
B-1
Glossary
Approved: Acceptable to the authority having jurisdiction. As-Is: Current or existing condition at the time of survey or review of the applicable documentation. Base Flood Elevation (BFE) - The elevation for an area, for which there is a one percent chance in any given year that flood levels will equal or exceed it. Brick Veneer - A facing of brick that is a single wythe in thickness (3" to 4") that is anchored or adhered to a structural backing, but not designed to carry loads other than its own weight. Buildings: Structures, usually enclosed by walls and a roof, constructed to provide support or shelter for an intended occupancy. Building Enclosure: Exterior cladding, roof deck, walls, window and door assemblies, skylight assemblies, and other components enclosing a building and serving as a barrier between exterior and interior environments. Also known as building envelope. Building Envelope: see Building Enclosure. Certify: Statement in writing by a duly licensed professional attesting to compliance with a standard. Also, Certification. Concrete Masonry Unit (CMU) - A block or brick cast of portland cement and suitable aggregate, with or without admixtures (additives), and intended for laying up with other units, as in normal stone masonry construction. Critical Facilities: Buildings and other structures and life-line infrastructure deemed necessary by a jurisdiction for response to and recovery from a major or catastrophic disaster. Critical support systems: Structures, systems and components required to ensure the health, safety and well-being of occupants. Critical support systems include, but not limited to, life-safety systems, potable and waste water systems, electrical power systems and heating, ventilation and air-conditioning (HVAC) systems. Essential Facilities: Facilities that are classified as Risk Category IV in Table 1.5-1 of ASCE 7-10; Buildings and other structures that are intended to remain operational in the event of an extreme environmental loading condition (e.g., wind and flood).
Glossary: continued
B-2
Enclosed: A condition where there is insufficient opening area in the exterior enclosure of a building to cause unbalanced or excessive air pressure differences (either positive or negative) between the interior and exterior of the enclosure during a windstorm event. Evacuation Shelter: A safe congregate care facility that provides essential support services and is utilized for populations displaced by an emergency or disaster event. For planning purposes, the operational period of an Evacuation Shelter is from 24 hours prior to forecast landfall time until 72 hours after landfall of a hurricane or severe storm. An evacuation shelter may be located either inside or outside of the disaster impact area. Evacuees: Persons that have temporarily fled from flood-prone areas, manufactured housing or other wind-vulnerable structures. Exiting Hurricane: Hurricanes that have crossed over land and approach a coastal area from an inland direction. Storm surge effects for a given category of storm are generally less intense in an Exiting hurricane than for a landfalling hurricane. Fenestration: Design and placement of windows, doors, louvers, vents and other assemblies that penetrate through the exterior surface of a building or structure. Guideline: Criterion or procedure established to assist in determining a course of action, but not necessarily required or enforceable by law. A framework that can assist in decision making. Hurricane Shelter: A building, structure, or portion(s) thereof, designated to serve as a place of relative safety during a threatening, imminent or actual hurricane event. Also known as Hurricane Evacuation Shelter or Hurricane Risk Shelter. Landfalling Hurricane: Hurricanes that approach a coastal area from a seaward direction. Storm surge effects for a given category of storm are more intense in a landfalling hurricane than for an Exiting or paralleling hurricane. Leeward: Facing away from the direction of the oncoming wind flow; projected building surfaces on the opposite side than the wind encounters causing pulling loads or negative pressures. Loadpath: The assemblage of structural components and connections that transfer wind loads from point or area of application through to the main wind force resisting system and then to the foundation. Marginal: Lower end of suitability; less than preferred. Mass-Care: Emergency provision of life sustaining services to ensure the health, safety and well-being of a congregate or collective population, to include shelter, food and water, sanitation, first aid, security, etc.

Glossary: continued
B-3
Mitigation: Actions taken to prevent or reduce the risk to life, property, social, economic activities, and natural resources from natural or technological hazards. New Construction: Means any construction of a building or unit of a building in which the entire work is new. An addition connected to an existing building which adds additional square footage to the space inventory is considered new construction. See S.423.5.8, FBC-bldg. Occupancy: The purpose for which a building or other structure, or part thereof, is used or intended to be used. Occupant Support Areas: Areas required to ensure the health, safety and well-being of occupants. Occupant support areas may include, but not limited to, shelter management, food preparation, water and food storage, electrical and mechanical rooms, toilet and other sanitation rooms, and first-aid stations. On-site: Means located either inside, immediately adjacent to, or on the same contiguous property grounds of a facility, building or place and under the control of the owner or lawful tenant. Opening(s): Apertures or holes in a building enclosure (or envelope) which allow air to flow through into and out of a building. Partially Enclosed: A condition where sufficient opening area in the exterior enclosure of a building may cause unbalanced or excessive air pressure differences (either positive or negative) between the interior and exterior of the enclosure during a windstorm event. Precast Cement-Fiber Planks (PCF Planks) - A common building material that is manufactured from cement and fiber (cementitious fiber) and cast into a composite panel or plank. Typical uses include roof decking and sound absorption panels on interior wall surfaces. Pre-Engineered Metal Building (PEMB) - An easily recognizable prefabricated, standardized type of light steel frame building, which is found in similar form throughout the United States. It consists of two types of steel frame systems -- transverse (short axis) moment-resistant frames, typically rigid frame bents with tapered sections, and longitudinal (long axis) braced frames. This class of building is typically one story or has only a minor mezzanine/partial second story, lightweight cladding, or stud-framed walls. Prewiring - The modification of a facilities electrical system to simplify and expedite connection with a compatible alternate power supply or generator.

Glossary: continued
B-4
Qualitative: Assessment based upon empirical methods and observed qualities and characteristics. Recognize: Acceptance of validity based upon available facts, documents and certifications. Also, recognition. Retrofit: Modification performed upon an existing structure or infrastructure with the goal of significantly reducing or eliminating potential damage due to a specific hazard. Reinforced Masonry: Masonry wall construction in which steel reinforcement is integrally embedded in a manner that permits the two materials to act together in resisting forces. Reinforced masonry can generally be recognized by observing vertical reinforcement (rebar) spacings that do not exceed six times the nominal thickness (6t) of the masonry unit (this is 4 feet o.c. for 8” masonry). Partially reinforced masonry can generally be recognized by observing vertical rebar spacings greater than 6t, but less than about 10t (typically 8 feet o.c. for 8” masonry), or an acceptable alternative. Risk Evacuation Shelter: A facility that is safe and provides essential support services, and is located inside of a hazard risk area; e.g., projected path of an approaching hurricane or severe storm. As local conditions may present hazards such as storm surge inundation, inland rainfall flooding, high winds, or hazardous materials which may exceed the building codes of the facility, shelter selection criteria in ARC 4496 do need to be considered. For planning purposes, the operational period of a Risk Evacuation Shelter is from 24 hours prior to forecast landfall time until 72 hours after landfall of a hurricane or severe storm. The designation does not imply that a shelter is capable of affording complete protection or is free from hazards but only that it meets established minimum safety criteria. Roof cover: The exterior weather protection membrane of a roof assembly that is intended to prevent rainwater intrusion into the interior of a building. Safe: Affording protection that is consistent with the intent of American Red Cross publication Standards for Hurricane Evacuation Shelter Selection (ARC 4496). Also, Safer and Safest. Saffir-Simpson Hurricane Scale: The current prevalent system of classifying hurricane intensity in the Atlantic, Caribbean and East Pacific oceans. Hurricanes are categorized on a scale of 1 (minimum) to 5 (extreme) based on wind velocity and provides examples of types of damage and impacts in the United States associated with winds of the indicated intensity. Sea, Lake and Overland Surges from Hurricanes (SLOSH): A computerized numerical model developed by the National Weather Service to estimate storm surge heights resulting from historical, hypothetical or predicted hurricanes by taking into account atmospheric pressure, size, forward speed and track data. These parameters are used to create a model of the wind field which drives the storm surge.

Glossary: continued
B-5
Softspot: Portion(s) of a building’s exterior enclosure constructed of materials that are likely to perform poorly in high winds and cause an opening, or easily penetrated by common windborne debris. Standard: Reference, criterion or procedure that is accepted or acknowledged as being authoritative, and establishes a minimum quantitative or qualitative measure or attribute that can be required and enforceable by law. Storm Surge: An abnormal rise in sea level accompanying a hurricane or other intense storm, and whose height is the difference between the observed level of the sea surface and the level that would have occurred in the absence of the storm. Storm surge is usually estimated by subtracting the normal or astronomical high tide from the observed storm tide. Untenable: Unfit for occupancy; uninhabitable. Windward: Facing into the direction of the oncoming wind flow; projected building surfaces that the wind encounters causing pushing loads or positive pressures.

Appendix C:
ARC 4496 - Standards for Hurricane Evacuation Shelter Selection

C-1

C-2

C-3

C-4

Appendix D:
Methodology for Recommendation of Projects for Funding

D-1
METHODOLOGY FOR RECOMMENDATION OF PROJECTS FOR FUNDING: The Division has developed a point based rating system, which was used to prioritize projects. The rating system is consistent with the intent of Section 252.385, F.S., and the Division’s and American Red Cross’s shelter selection guidelines. Factors that were considered in the retrofit proposal review process were regional and local shelter deficits, building construction characteristics (ARC 4496), proposed shelter type, an increase in shelter capacity, ownership and day-to-day use of the facility, cost-effectiveness, etc. See Appendix H for an example of the 2012 Project Priority Worksheet. All factors considered in the prioritization process this year are generally consistent with those used in previous Shelter Retrofit Reports. One exception is that, effective the 2012 Shelter Retrofit Report, buildings constructed using the Standard Building Code prior to the 1986 revision of the 1985 SBC will require having been designed to ANSI A58.1 or ASCE-7 to be recommended for retrofitting. Projects carried over from the 2011 Shelter Retrofit Report were reevaluated on changes in the shelter deficits (region and/or county, if any), and on additional information if provided in updates from the counties (See Appendix H, Project Priority Worksheet). In prioritizing the projects the Division based its selection on the criteria listed below. If the desired information in a given line item was not provided, and could not be readily determined from other sources, no points were allocated, except as otherwise noted. In some cases, certain criteria were considered “Show Stoppers” and excluded the facility from recommendation. The show stopper designation was only given when a condition existed that could potentially exclude the building as a shelter, such as the presence of uncertified long span roof or unreinforced masonry walls. Further explanations are given with the specific criteria items below. The following is a listing of the specific criteria used by the Division’s staff to rank each project based upon information provided with each project proposal.
1. Proposed project is located within a region with a shelter deficit situation:
Section 252.385(3), F.S., is very specific in its intent to give priority to regions of the state where shelter deficits are greatest. This information was extracted from shelter status data that was provided by county emergency management officials and tabulated by the Division’s Bureau of Preparedness, All Hazards Planning Unit. A maximum of 75 points was given for those shelters that are located in a region with a severe (greater than 100,000) shelter deficit. Lesser point values were given to retrofit projects in regions with less severe deficits.
2. Proposed project is located within a county with a shelter deficit situation:
Section 252.385(3), F.S., also indicated its intent to give priority to counties of the state where shelter deficits are severe. Again, this information was extracted from shelter status data that was provided by county emergency management officials and tabulated by the Division’s Bureau of Preparedness, All Hazards Planning Unit. A maximum of 50 points was given to those shelters located in counties with a severe (greater than 25,000) shelter deficit. Lesser point values were given to retrofit projects in counties with less severe deficits. If all other factors being reviewed are equal in score, the combined effect of items one and two (125 total points) can have a significant impact upon a given project’s priority.

D-2
3. Current status of facility is demonstrated to meet ARC 4496 guidelines: The Division recommends that all hurricane shelters be analyzed for consistency with the American Red Cross’s Standards for Hurricane Evacuation Shelter Selection, ARC 4496. Critical building envelope features (exterior wall and roof construction, percentage of glass in exterior walls, long span roof, etc.), year built to determine design wind code requirements, presence of interior core area or storm room, and other construction factors must be included in the decision to utilize the building as a shelter and establish its priority for retrofitting. There is only nominal value to installing window protection systems on a shelter building if there are other “weak links” that are limiting factors for the building’s wind performance. Flooding and/or inclusion of the facility in a hazardous materials evacuation zone are also important factors when establishing a building as a hurricane shelter. A maximum of 75 points was allocated based on how well the given facility is demonstrated to conform to ARC 4496 guidelines.
A. A maximum of 25 points was allocated based on what Sea, Lake and Overland Surges from Hurricanes (SLOSH) or Storm Surge evacuation zone the facility is in. Presence of the facility in a Category 1/Tropical Storm or Category 2 surge zone is a “Show Stopper” and excludes the shelter from recommendation. The point system used for this item is generally consistent with Section 1013.372(1), F.S., that exempts educational facilities from the public shelter design criteria if located within a Category 1, 2, or 3 Evacuation Zone.
B. A maximum of 15 points was allocated based on the National Flood Insurance Program
(NFIP) Flood zone (as established in the most recent Flood Insurance Rate Map the facility is located within). If this information was not provided, no points were allocated. Generally, buildings in the Flood Insurance Rate Map zones with an “A” designation were not recommended without detailed justification. Exception was given to those counties (such as Miami-Dade and Collier) whose populations live in areas that are extremely flat and provide very limited natural drainage.
C. A maximum of 25 points was allocated based on the building construction parameters.
Here the building’s structural and envelope characteristics are very important. Structures are evaluated to shelter people during a severe wind storm or major hurricane. “Show Stoppers” typically included unreinforced masonry walls, flat lightweight roofs over long spans, pre-engineered metal buildings, lack of load-path connectors, etc. The majority of “Show Stoppers” originated in this item.
D. A maximum of 10 points was allocated for other considerations. In this item, the extra
items that would assist in determining the relative safety of the facility are evaluated. Examples were certification for wind speeds of 130 mph or more, in-place shutters, hip roofs, and other structural issues. If not specified, certification was not assumed.

D-3
4. Proposed project will serve to improve the structural integrity of the building envelope from wind and/or flood effects:
All retrofit projects that serve to maintain or improve the structural integrity of the building envelope will be given a high priority, as they will have an immediate impact upon the survivability of the shelter population. One of the most important things that can be done to reduce overall evacuation times, and thereby reduce the vulnerability of the population, is to provide adequate shelter space to meet the demand. Therefore, any project proposal for retrofitting that would allow for additional usable space within a structure due to improvements in the building envelope will receive priority consideration for funding. A maximum of 25 points was allocated for projects that would improve the structural integrity of the facility. Here a window protection system would normally get 10 points since it will usually provide some additional protection against windborne debris. Exceptions were buildings (like pre-engineered metal buildings) that have historically performed poorly and on which the window protection system will have nominal impact. In those cases where a structure was considered relatively strong and the only apparent weakness was the windows, 25 points would be allocated. 5. Facility has been identified for potential use as a shelter by ARC or other
sheltering agency, but is not currently in local inventory due to deficiencies to be corrected by this proposal:
In this line item there was a maximum of 25 points allocated. Points were given for projects that will remedy identified deficiencies (structural and mass care features) in a facility not currently listed in the local inventory as meeting ARC 4496 guidelines. The objective was to give priority to renovating or retrofitting structures in order to add new shelters. 6. Numerical increase in shelter capacity due to this proposed retrofit project: A maximum of 75 points was allocated based on a numerical increase in shelter capacity. No points were allocated for shelter spaces already in inventory. This was a priority based on Florida law requiring reduction of the statewide public hurricane shelter deficit and was intended to encourage projects that add new shelter space to the inventories. 7. Building ownership and availability for use as a public shelter. A maximum of 50 points was allocated, depending on ownership and availability status. Public facilities received the highest priority for retrofit project recommendation based on their availability (and the use of public funds). Private facilities, such as churches and fraternal organizations, were recommended for retrofit based upon local necessity for space, previous history as a public shelter and/or existing agreements, type of project to be undertaken, and the endorsements of the local emergency management director.
8. Shutters Only Projects:

D-4
Generators and electrical work items are not considered in this item. Otherwise: A maximum of 50 points was allocated if the retrofit project only required/listed shuttering (i.e. protection of fenestrations/doors/strengthening of doors) to meet ARC 4496. A maximum of 25 points was allocated where shuttering (window/door protection) and engineer certifications were the only items (excluding electrical work) required/listed on the project. If other structural work is required/listed then no points were allocated.
9. Cost-effectiveness of the proposed project: A maximum of 50 points was allocated depending on the cost effectiveness of the project. This was based on the total structural costs (non-engineering study, non-generator) divided by the total shelter capacity gained. If the number of spaces, or costs, could not be determined, no points were allocated.
10. Project proposal has been demonstrated to have a significant impact upon the local, regional, and statewide shelter deficit situation:
This criteria was prepared in coordination with the Division’s Bureau of Preparedness, All Hazards Planning Unit. In order to maintain the statewide scope in assessing which factors would be used to establish this criteria, the assigning of priorities was done on a county wide rather than an individual shelter facility basis; therefore, all retrofit projects in a particular county were ranked equally. The first criteria used to help classify the various counties were the overall vulnerability and severity of the evacuation and sheltering situation for a particular county or region. The state was divided into four areas, each comprised of several regions as defined by the Regional Planning Councils (RPC). Out of a total of 75 possible points for this project selection category, this criterion comprised a maximum of 50 points.
1. The RPC regions within the highly urbanized southern portion of the Florida peninsula were assigned the highest value of 50 points because of their large vulnerable populations; the relatively few alternatives regarding evacuation routes; and the large distances that must be traveled by evacuees from those regions in order to get to destinations that provide them relative safety from hurricane force winds. The intent of the high point value for this area was to also reflect the need to increase the local shelter reserves, which would thereby reduce the need for the region’s evacuees to travel over long distances. This area includes the South Florida; Southwest Florida; Treasure Coast; Central Florida; and Tampa Bay Regional Planning Council Regions.
2. The Regional Planning Council regions in the central portion of the Florida Peninsula
were given 30 points in order to reflect the area’s less acute situation with regards to vulnerable population, evacuation distances, and relative isolation of the population. The proportionally high point assignment for this area was also intended to emphasize the need to increase regional shelter capacity not only for local evacuees, but also for

D-5
the evacuees from South Florida. The Withlacoochee, North Central and East Central Florida Regional Planning Council regions are included in this area.
3. The Regional Planning Council regions for Northeast Florida, the Big Bend and the
entire Panhandle were assigned a value of 15 points because their evacuation and sheltering situation is not as critical as areas in the previous two categories. This area has considerably smaller overall vulnerable populations and there exist numerous options available to local residents regarding evacuation into the inland regions of Georgia and Alabama. This area is comprised of the Northeast Florida, Apalachee and West Florida Regional Planning Council Regions.
The next criteria for assigning points to each county was whether the counties were traversed by either highway U.S. 17 or U.S. 27, or likely to be designated as a host shelter area during the implementation of the Regional Evacuation Procedures. The counties that fulfill these criteria are: Alachua; Columbia; Orange; Osceola; Leon; Marion; Sumter; Lake; Polk; Hardee; DeSoto; Highlands; Charlotte; Glades; Hendry; Palm Beach; Broward; and Miami-Dade. Out of a possible total of 75 points for this shelter retrofit project selection category, the above counties received 15 points. The rationale for selecting counties along routes U.S. 17 and U.S. 27 as a criteria for assigning county priorities for shelter retrofitting is to reflect the increased importance of both highways as alternative evacuation routes to the more frequently considered and therefore much more congested roads, the Florida Turnpike, I-75, and I-95. The roadway segments in Marion County and south along both routes U.S. 17 and U.S. 27 will play an increasingly vital role in the development of a Statewide Evacuation and Sheltering Strategy. Due to the likely preeminence of both these highways in the future with regards to evacuation, it is imperative that shelter capacities in the counties along these roads be increased. Therefore, in an effort to address this necessity, the counties listed above were given an additional 15 points. The final criterion for prioritizing the counties with respect to shelter retrofit projects is whether a shelter deficit exists in the county being considered. A point value of 10 points was given to a county where the number of shelter spaces is greater than the in-county demand for a category 5 storm, based on data provided in the 2012 Statewide Emergency Shelter Plan and updates as provided by county emergency management agencies. The basis for using this as criteria to prioritize the counties is the premise that the counties with already existing adequate shelter space will be the counties where additional facilities will be found and regional shelter capacity increased. Many of the counties with shelter space deficits have experienced these shortfalls for many years, despite the best efforts of local emergency management staff to find additional in-county shelter capacity. Furthermore, counties with adequate shelter space have not had the need or the incentives to conduct an exhaustive search for new shelter facilities or implement innovative approaches to increase their shelter capacity. Therefore, this final criterion is a reflection of the emphasis placed on addressing the statewide shelter deficit problem by creating and augmenting regional shelter capacity rather than eradicating existing county shelter deficits.
11. Project Specified in Local Mitigation Strategy

D-6
A maximum of 50 points was allocated if the specific project building was referenced in a county’s Local Mitigation Strategy.
A maximum of 25 points was allocated if the specific project campus/complex/site was referenced in a county’s Local Mitigation Strategy.
Otherwise no points were allocated.
12. Project can be completed in a fiscal year (i.e. 12 months)? YES or NO
If project can be completed in a fiscal year then it was awarded 25 pts. If no or not known then zero points were allocated.
13. Project Building is a Designated Special Needs Shelter? YES or No
If yes, then the project was awarded 25 pts. If no or not known then zero points were allocated.

Appendix E:
(1) Prioritized List of Recommended Construction-Related Projects (2) List of Projects Offered for Specific Appropriation 1515A FY 2011/2012 List of Projects Offered for Specific Appropriation 2624 FY 2012/2013 List of Projects Offered for Specific Appropriation 2571 FY 2013/2014 List of Projects Offered for Specific Appropriation 2593 FY 2014/2015 List of Projects Offered for Specific Appropriation 2593 FY 2015/2016

Appendix E 1 Prioritized List of Recommended Construction‐Related Projects
RPC # County Site Name Building Type Year Built Spaces Added Cost per Space Project Cost Ranking
3 3 Alachua Lofton HS Classroom 2007 725 522 $ ‐ 565
5 3 Alachua MLK Center Classroom 2007 400 500 $ 200,000 540
6 3 Alachua Sydney Lanier Center Gym 2001 408 567 $ 231,336 515
7 6 Okeechobee Acheivement Academy Auditorium 2011 224 221 $ 175,000 515
8 4 Flagler Rymfire Dining 2006 600 260 $ 160,000 450
10 4 Saint Johns Pacetti Bay MS Dining and Commons 2006 400 250 $ 100,000 435
58 3 Union Lake Butler MS Classroom 2007 231 250 $ 57,750 430
60 4 Clay Argyle Elementary School Classroom 2003 285 424 $ 160,000 385
61 3 Union Lake Butler MS Classroom 2007 231 250 $ 57,750 380
63 3 Alachua Howard Bishop Middle School Classroom 2004 186 175 $ 32,550 372
65 4 Putnam Health Department Rooms 2004 300 220 $ 66,000 365
66 7 Citrus Central Ridge ES Classroom 2006 1146 140 $ 160,000 350
70 7 Manatee Annie Lucy Williams Elem School Classroom/Clinic 2007 938 86 $ 80,700 347
71 7 Manatee Lee Middle School Classroom 2000 391 32 $ 12,629 347
72 7 Manatee Lakewood Ranch HS Dining 1996 707 190 $ 134,676 337
85 4 Putnam St Johns River State College Dining and Commons 2003 260 223 $ 57,980 330
87 4 Duval DASA Auditorium 2010 400 315 $ 125,000 325
88 3 Union Union County HS Classrooms (4 total) 1989 645 350 $ 225,750 317
89 3 Alachua Sydney Lanier Center Dining 2001 552 472 $ 350,000 315
90 5 Brevard Central Jr. High, West Melbourne Classroom 2001 0 0 $ ‐ 312
94 4 Flagler Buddy Taylor Dining 2006 600 260 $ 160,000 300
95 3 Columbia Fort White HS Dining 1999 367 196 $ 71,932 292
97 5 Orange Gotha MS Dining 1994 686 89 $ 61,084 287
99 5 Osceola Westside K‐8 school Whole Building 2008 716 65 $ 46,800 285
100 4 Nassau Yulee High School Gym 2005 569 88 $ 50,250 282
108 4 Nassau Yulee High School Dining 2005 832 99 $ 82,500 282
113 7 Hillsborough Erwin Technical Open space 1957 408 403 $ 300,000 282
114 5 Orange Meadow Woods MS Gym 1997 501 122 $ 61,142 277
115 5 Orange Meadowlbrook MS Classroom 2006 532 116 $ 61,576 277
117 5 Orange Meadowlbrook MS Classroom 2006 528 117 $ 61,534 277
119 5 Orange Avalon MS Classroom 2006 433 141 $ 60,868 275
127 5 Orange West Orange High School Classroom 2008 777 164 $ 127,198 275
129 7 Manatee Lakewood Ranch HS Classroom 1996 306 899 $ 275,138 272
130 8 Glades West Glades Elem School Gym 2007 472 4 $ 2,000 272
136 3 Alachua Community Support Services Auditorium 2000 140 907 $ 126,980 265
143 5 Orange Wekiva HS Classroom 2007 807 222 $ 178,836 264
144 4 Saint Johns Switzerland Point Middle School Gym 1990 502 74 $ 37,203 262
146 5 Orange Hunters Creek MS Classroom 1995 681 204 $ 138,651 262 151 4 Saint Johns Switzerland Point Middle School Admin/Media 1990 1377 48 $ 65,723 260

RPC # County Site Name Building Type Year Built Spaces Added Cost per Space Project Cost Ranking
153 4 Saint Johns Switzerland Point Middle School Dining 1990 733 68 $ 49,715 260 158 4 Putnam Ochwilla Elementary School Classroom 2006 173 302 $ 52,275 257 159 5 Volusia Mainland HS Classroom 2006 128 200 $ 25,536 257 162 7 Hernando Moton Elementary School 300 Classroom 1989 450 223 $ 100,350 257 165 5 Brevard Long Leaf Elementary School Classroom 2002 0 0 $ ‐ 252 166 5 Orange Avalon MS Classroom 2006 425 143 $ 60,595 252 168 5 Orange Avalon MS Classroom 2006 491 124 $ 60,922 252 170 5 Orange Discovery MS Classroom 1995 726 191 $ 138,460 252 199 5 Orange Gotha MS Gym 1994 736 193 $ 141,824 252 205 5 Orange Meadow Woods MS Classroom 1997 237 175 $ 41,487 252 221 5 Orange West Orange High School Classroom 2008 1852 134 $ 247,726 252 223 5 Orange Legacy MS Classroom 2006 345 138 $ 47,481 250 224 5 Orange Wekiva HS Classroom 2007 776 139 $ 108,121 250 225 4 Nassau Callahan Middle School Classroom 2003 376 145 $ 54,600 247 226 5 Orange Jones HS Classroom 2003 313 216 $ 67,482 245 227 7 Manatee Sea Breeze Elementary School Classroom 2009 189 0 $ ‐ 245 228 5 Seminole Layer ES Classroom 2006 1090 37 $ 40,600 244 229 3 Columbia Lake City MS Dining 1998 455 151 $ 68,510 242
231 3 Columbia Lake City MS Classroom 1998 436 156 $ 68,061 242 232 4 Saint Johns Switzerland Point Middle School Classroom 1990 462 99 $ 45,952 237 233 5 Orange Gotha MS Dining 1994 597 241 $ 143,588 237 236 5 Orange Timber Creek High School Gym 1995 1419 240 $ 340,522 237 237 7 Hernando Nature Coast Tech High Cr 2 (Flr 1) Classroom 2001 300 0 $ ‐ 235 239 5 Volusia Deland HS Classroom 2004 614 66 $ 40,500 234 241 7 Hernando Moton Elementary School 400 Classroom 1989 444 788 $ 150,000 232 242 7 Hernando Moton Elementary School caf Dining 1989 437 800 $ 150,000 232 245 7 Hernando Suncoast 500 caf Dining 1993 445 786 $ 150,000 232 246 7 Hernando Suncoast 800 Classroom 1993 438 799 $ 150,000 232 247 5 Volusia Deland HS Auditorium 2004 639 67 $ 42,975 230 251 5 Orange Gotha MS Classroom 1994 382 115 $ 44,050 229
252 5 Orange Meadowlbrook MS Classroom 2006 322 147 $ 47,374 229 255 5 Brevard Space Coast HS Classroom 2005 0 0 $ ‐ 227 256 5 Orange Gotha MS Classroom 1994 257 163 $ 41,965 227 257 5 Orange Hunters Creek MS Dining 1995 289 156 $ 45,151 227 258 5 Orange Legacy MS Dining 2006 466 130 $ 60,681 227
259 5 Orange Meadow Woods MS Dining 1997 307 152 $ 46,674 227
260 6 Polk Sandhill Elem School Dining 1999 397 254 $ 101,025 227
261 4 Saint Johns Webster ES Classroom 1999 466 147 $ 68,740 225
262 5 Orange Discovery MS Classroom 1995 382 134 $ 50,996 225
263 4 Nassau Callahan Intermidiate School Cafeteria 1976 266 163 $ 43,200 222

RPC # County Site Name Building Type Year Built Spaces Added Cost per Space Project Cost Ranking
265 4 Nassau Yulee Primary School Classroom 1986 170 115 $ 19,500 222 266 8 Glades West Glades Elem School Classroom 2007 432 0 $ ‐ 222 267 8 Glades West Glades Elem School Classroom 2007 474 0 $ ‐ 222 268 3 Alachua Hidden Oak Classroom 1999 350 220 $ 77,000 220 269 3 Alachua Charles W. Duval ES Classroom 2000 225 103 $ 23,175 217 270 6 Polk Sandhill Elem School Classroom 1999 211 284 $ 60,000 212 271 7 Hernando Nature Coast Tech High caf Dining 2008 584 0 $ ‐ 212 272 5 Volusia Heritage MS Dining 1997 430 45 $ 19,200 209 273 4 Nassau Bryceville Elementary School Classroom 2007 177 203 $ 36,000 207 275 4 Nassau Callahan Elementary School Classroom 1999 232 68 $ 15,675 207 276 4 Nassau Callahan Intermediate School Classroom 1999 215 212 $ 45,450 207 277 4 Nassau Callahan Intermediate School Classroom 1999 194 222 $ 43,200 207 284 4 Nassau Callahan Intermediate School Classroom 1999 194 222 $ 43,200 207 285 4 Nassau Callahan Intermediate School Classroom 7 2009 200 162 $ 32,400 207
286 4 Nassau Hilliard Elem School Classroom 2009 187 230 $ 43,200 207 288 4 Nassau Yulee ES Classroom 2009 267 180 $ 48,000 207 289 4 Nassau Yulee High School Gym 2005 235 150 $ 35,250 207 303 4 Nassau Yulee High School Classroom 2005 150 38 $ 5,625 207 308 4 Nassau Yulee Primary School Classroom 2009 190 227 $ 43,200 207 309 5 Volusia Galaxy MS Gym 1989 444 48 $ 21,218 207 310 5 Volusia Indian River ES Classroom 1989 488 87 $ 42,560 207 312 7 Hillsborough Edison ES Classroom 1999 155 144 $ 22,305 207 315 7 Hillsborough Edison ES Classroom 2000 310 128 $ 39,780 207 325 3 Alachua FosterES Dining 2000 145 207 $ 61,015 202 326 3 Columbia Lake City MS Classroom 1998 152 301 $ 45,726 202 327 3 Columbia Lake City MS Classroom 1998 203 317 $ 64,274 202
328 4 Saint Johns Hastings, Town of Auditorium 1928 117 85 $ 10,000 202 329 5 Orange Timber Creek High School Classroom 1995 633 358 $ 226,376 200 330 10 Broward Floranada ES Classroom 2001 600 76 $ 75,000 200 331 5 Orange Avalon MS Classroom 2006 335 141 $ 47,464 197 332 4 Duval Edward H White SrHS Dining 2010 486 0 $ 160,000 195 333 4 Clay Local Hospital Rooms 40 50 $ 160,000 192 337 4 Nassau Callahan Elementary School Classroom 2009 118 204 $ 24,000 192 338 5 Brevard Central Middle School Classroom 1996 600 117 $ 160,000 190 344 7 Manatee Manatee HS Auditorium 2011 718 157 $ 112,451 190
345 3 Columbia Eastside ES Classroom 2001 151 323 $ 48,773 187
346 4 Putnam Interlachen ES Dining 1988 376 217 $ 81,654 187
347 4 Putnam Interlachen ES Classroom 1988 272 293 $ 79,750 187
348 4 Putnam Q.I. Roberts Middle School Classroom 1994 164 111 $ 18,150 187 349 4 Saint Johns Switzerland Point Middle School Dining 1990 187 265 $ 49,634 187

RPC # County Site Name Building Type Year Built Spaces Added Cost per Space Project Cost Ranking
351 6 Polk Sandhill Elem School Classroom 1999 212 292 $ 61,845 187 352 4 Saint Johns Switzerland Point Middle School Classroom 1990 219 227 $ 49,715 185 353 4 Nassau Bryceville Elementary School Classroom 2008 167 216 $ 36,000 182 355 5 Volusia Indian River ES Classroom 1989 325 244 $ 79,202 182 356 7 Hernando W Hernando MS caf Dining 1999 455 769 $ 150,000 182 357 3 Columbia Fort White MS Classroom 2007 300 240 $ 72,000 177 358 3 Columbia Fort White MS Classroom 2007 300 170 $ 61,000 177 359 7 Hernando Hernando HS CR30 Classroom 2007 195 301 $ 58,667 177 363 1 Escambia N.B. Cook ES Dining 1997 822 257 $ 211,500 175 364 2 Gadsden Havana MS Classroom 1992 258 244 $ 62,952 175 365 3 Madison Madison Cty HS Gym 2016 300 0 $ 160,000 175 366 5 Orange Olympia HS Classroom 2007 547 225 $ 123,333 175 379 7 Hernando DS Parrott Dining 1988 226 242 $ 12,000 175 380 7 Manatee C. Haile MS Classroom 2007 565 55 $ 30,917 175 383 8 Collier Immokalee HS Classroom 1994 518 19 $ 10,000 175 384 3 Alachua Horizon Center School Classroom 2006 300 357 $ 107,100 172 386 3 Columbia Eastside ES Classroom 2001 121 357 $ 43,197 172 387 3 Columbia Fivepoints ES Classroom 1988 107 326 $ 34,882 172
388 4 Saint Johns Switzerland Point Middle School Classroom 1990 123 302 $ 37,203 172 397 4 Flagler Old King ES Classroom 2006 605 200 $ 121,000 167 470 5 Orange Wekiva HS Auditorium 2004 1706 147 $ 250,914 165 471 5 Orange Wekiva HS Classroom 2004 882 200 $ 176,845 165 472 6 Hardee Wauchula ES Classroom 1998 146 98 $ 14,365 165 473 6 Hardee Wauchula ES Classroom 1998 165 474 7 Manatee Palmetto ES Whole Building 2010 1500 165 $ 104,669 165 475 3 Alachua Alachua Freedom Center Auditorium 2012 140 553 $ 77,500 162 476 3 Columbia Fort White HS Classroom 1998 108 867 $ 93,636 160 477 4 Duval Eugene J Butler MS Classroom 2011 320 0 $ 40,000 160 479 5 Volusia Pathways ES Classroom 1995 203 239 $ 48,554 159 487 2 Gadsden Greensboro ES (AKA HS ) Classroom 1994 162 112 $ 18,225 157 492 3 Alachua High Springs Community EMS Classroom 2005 275 131 $ 127,500 157 493 3 Alachua Horizon Center School Classroom 2006 300 374 $ 112,200 157 494 4 Saint Johns Switzerland Point Middle School Classroom 1990 115 400 $ 45,952 157 497 5 Volusia Forest Lake ES Classroom 1995 255 206 $ 52,491 157
498 4 Duval Robert E. Lee Sr High School Dining 2012 2393 0 $ ‐ 155
499 4 Duval Robert E. Lee Sr High School Classroom 2012 1013 0 $ ‐ 155
500 4 Saint Johns Switzerland Point Middle School Classroom 1990 139 357 $ 49,634 155
501 5 Volusia Forest Lake ES Classroom 1995 203 259 $ 52,491 153
535 3 Columbia Fort White HS Classroom 1998 172 714 $ 122,808 152
536 2 Gadsden Greensboro ES (AKA HS ) Dining 1994 454 286 $ 129,825 150

RPC # County Site Name Building Type Year Built Spaces Added Cost per Space Project Cost Ranking
544 7 Manatee Braden River MS Classroom 1990 620 204 $ 126,548 150 546 7 Manatee C. Haile MS Classroom 2007 510 205 $ 104,577 150 548 5 Volusia McInnis ES Classroom 1993 105 312 $ 32,807 144 554 5 Volusia Pathways ES Classroom 1995 255 239 $ 61,020 142 591 2 Gadsden Havana MS Classroom 1992 187 277 $ 51,745 140 595 2 Gadsden Havana MS Classroom 1992 270 223 $ 60,311 140 596 5 Volusia McInnis ES Classroom 1993 104 297 $ 30,838 140 597 7 Hernando John D Floyd ES Classroom 2003 256 0 $ ‐ 137 598 7 Hernando John D Floyd ES Classroom 2003 256 0 $ ‐ 137 599 8 Sarasota Oak Park School Classroom 0 0 135 600 4 Duval Landmark MS Classroom 1989 0 0 $ ‐ 130 601 4 Duval Robert E. Lee Sr High School Classroom 2012 381 0 $ ‐ 130 602 4 Flagler Matanzas HS Dining 2008 440 360 $ 158,443 127 603 1 Escambia Washington HS Classroom 2004 197 0 $ ‐ 125 604 1 Escambia Washington HS Dining 2004 436 0 $ ‐ 125
605 4 Clay Green Cove Springs Junior HS Classroom 1997 746 0 $ 160,000 125 606 5 Osceola Westside K‐8 School Classroom 2008 298 450 $ 134,095 125 612 5 Volusia Pathways ES Classroom 1995 264 254 $ 67,172 125 613 7 Manatee Lakewood Ranch HS Classroom 1996 472 285 $ 134,616 125 615 2 Gadsden Havana MS Classroom 1992 275 249 $ 68,490 117 619 2 Gadsden Havana MS Classroom 1992 244 259 $ 63,271 117 630 2 Gadsden Havana MS Band 1992 282 226 $ 63,662 117 631 7 Manatee Kinnan ES Classroom 2000 296 194 $ 57,427 115 632 7 Manatee Manatee Comm. College Classroom 1996 173 193 $ 33,462 115 633 10 Miami‐Dade Krop Senior High Cafeteria 1994 1276 $ 115,275 110 637 4 Clay St. Johns River Community College Open space 1993 200 0 $ 160,000 100 638 4 Saint Johns Durbin Creek ES Whole Building 2003 728 79 $ 57,600 100
640 5 Volusia Atlantic HS Gym 1992 621 47621 100 641 7 Manatee Lakewood Ranch HS Classroom 1996 467 681 $ 317,881 100 642 2 Liberty Woodmen of the World Camp Dining 1993 257 199 $ 51,250 90 643 5 Seminole Highlands ES Classroom 500 0 $ 160,000 75 644 5 Sumter N Sumter PS Classroom 504 504 $ 29,160 75 645 7 Manatee C. Haile MS Classroom 2007 297 625 $ 185,730 75 647 1 Escambia Bellview ES Classroom 1998 0 $ ‐ 55 648 1 Escambia Bellview MS Classroom 1998 0 $ ‐ 55
650 1 Escambia Beulah ES Classroom 2000 0 $ ‐ 55
662 1 Bay Fairgrounds Open space 1978 $ 20,000 50
663 3 Dixie Old Town ES Classroom 2006 0 0 $ ‐ 50
664 4 Duval Alfred I Dupont MS Classroom 1999 0 $ ‐ 50
667 7 Manatee Harlee MS Classroom 2000 0 0 $ ‐ 50

Region County Site Name Fiscal Year and Fund Number Gained $/Space Gained Project Cost
4 Putnam Browning‐Pearce ES FY 11‐12 1515A Offered 80 474$ 37,949$
5 Sumter Webster ES FY 13/14 2571 Offered 504 145$ 72,900$
5 Sumter South Sumter HS FY 13/14 2571 Offered 352 188$ 66,150$
5 Sumter South Sumter MS FY 13/14 2571 Offered 332 208$ 68,850$
5 Sumter South Sumter MS FY 13/14 2571 Offered 332 208$ 68,850$
5 Sumter Webster ES FY 13/14 2571 Offered 231 277$ 64,000$
5 Sumter Lake Panasoffkee Elem School FY 13/14 2571 Offered 231 316$ 72,900$
3 Lafayette Lafayette HS FY 13/14 2571 Offered 213 212$ 45,161$
5 Sumter Wildwood Middle School FY 13/14 2571 Offered 318 217$ 68,850$
1 Washington Vernon Middle School FY 14/15 2593 Offered 36 1,629$ 58,889$
5 Orange Freedom MS FY 14/15 2593 Offered 403 151$ 60,868$
5 Orange Freedom MS FY 14/15 2593 Offered 335 160$ 53,598$
6 Hardee Wauchula Elem School FY 14/15 2593 Offered 146 98$ 14,365$
4 Saint Johns Creekside High School FY 14/15 2593 Offered 1908 177$ 338,250$
5 Orange Freedom MS FY 14/15 2593 Offered 425 145$ 61,433$
5 Orange Freedom MS FY 14/15 2593 Offered 483 127$ 61,342$
7 Hillsborough Erwin Technical FY 15‐16 2581 Offered 408 857$ 350,000$
2 Leon FAMU Developmental Research School FY 15‐16 2581 Offered 880 35$ 30,750$
10 Broward Floranada ES FY 15‐16 2581 Offered 900 76$ 68,000$
2 Leon FAMU Developmental Research School FY 15‐16 2581 Offered 254 66$ 16,800$
2 Leon FAMU Developmental Research School FY 15‐16 2581 Offered 532 443$ 235,350$
2 Leon FAMU Developmental Research School FY 15‐16 2581 Offered 557 229$ 127,275$
2 Leon FAMU Developmental Research School FY 15‐16 2581 Offered 672 274$ 183,975$
2 Leon FAMU Developmental Research School FY 15‐16 2581 Offered 40 2,018$ 80,332$
2 Leon Michael J Conley Elementary School FY 15‐16 2581 Offered 417 68$ 28,350$
2 Leon Michael J Conley Elementary School FY 15‐16 2581 Offered 417 68$ 28,350$
7 Hernando Chacahatti ES FY 15‐16 2581 Offered 265 176$ 46,525$
7 Hernando Chacahatti ES FY 15‐16 2581 Offered 220 180$ 39,700$
7 Hernando Deltona ES FY 15‐16 2581 Offered 312 138$ 43,200$
7 Hernando Deltona ES FY 15‐16 2581 Offered 197 335$ 65,875$
7 Hernando Chacahatti ES FY 15‐16 2581 Offered 206 643$ 132,750$

Appendix F:
List of Recommended Projects – Generators

Reg
ion
al P
lan
nin
g C
oun
cil (
RP
C)
#
County Site Name Bldg # / type
Bu
ild
ing
Con
stru
ctio
n Y
ear
Description of WorkProposed Costs $
Risk Capacity Gained (spaces)
$/space gained
Rank Score (2013)
Source of information
Tech Revw Recomm ?
5 Brevard Anderson ES, Rockledge 2, 3, 4, 5 1990 Generator $195,000 0 $0 42 1999 Yes
5 Brevard Apollo ES 2, 3, 4 1990 Generator $215,000 0 $0 249 1999 Yes
5 Brevard Brevard CC - Cocoa Allied Health Bldg 20 1975 Generator (230KW) Freezer & oven/range $215,000 0 $0 195 2001 Yes
5 Brevard Brevard CC- Cocoa Life Long Learning CenterLife Long Learning
Centr1978 Generator (230kw) $185,000 0 $0 25 2001 Yes
5 Brevard Central Jr. High, West Melbourne 1995 Generator $195,000 0 $0 274 1999 Yes
5 Brevard Central Reference Library 1 1998 Generator $200,000 0 $0 27 2000 Yes
5 Brevard Imperial Estates ES 5, 6, 7, 8 1994 Generator $225,000 0 $0 27 1999 Yes
5 Brevard Longleadf ES / Melbourne 1998 Generator $195,000 0 $0 27 1999 Yes
5 Brevard Melbourne HS 1,8 1996 Generator $205,000 0 $0 238 1999 Yes
5 Brevard Oak Park ES 2, 5, 6, 7, 8 1989 Generator - 400kw installation/purchase $771,377 350 $2,204 100 2010 No
5 Brevard Oak Park ES 2, 5, 6, 7, 8 1989 Generator Prewire $55,000 350 $157 105 2010 Yes
5 Brevard Pinewood ES 4 1998 Generator $195,000 0 $0 229 1999 Yes
5 Brevard Port St. John Community Center Center 1999 Generator $185,000 0 $0 197 2000 Yes
5 Brevard Rockledge HS 1990 Generator $185,000 0 $0 27 2001 Yes
5 Brevard South Mainland Community Center Gymnasium 2001 Generator $185,000 0 $0 27 2000 Yes
5 Brevard Space Coast MS / JrHS 1994 Generator $195,000 0 $0 182 1999 Yes
5 Brevard Westside ES Palm Bay 1997 Generator $195,000 0 $0 29 1999 Yes
8 Charlotte Kingsway ES 1 Two-story 1998 Generator/enclosure $101,000 0 $0 77 2005 Yes
8 Collier Big Corkscrew Island Fire Stn #12 generator $25,000 0 $0 75 2001 0
8 Collier Pine Ridge MS 290 Generator Pre-wire $10,000 0 $0 75 1999 Yes
8 Collier Village Oaks ES Generator Pre-wire $10,000 0 $0 75 1999 Yes
6 DeSoto DeSoto MS E Gym 2001 Generator (100kw) $40,000 0 $0 17 2002 Yes
3 Dixie Ruth Rains MS whole school 1993 Generator (500kw) ($150,000) Gen. Prewire $150,000 0 $0 32 2005 Yes
4 Duval Lincoln Villa Comm Center 0 Gen Prewire $4,250 0 $0 0 1999 Yes
1 Escambia Lipscomb ES 1 1991 Generator and Pre-wire (400kw generator) $149,110 0 $0 232 2005 Yes
1 EscambiaOlive Baptist Church North Wing and Rec Outreach Center
ROC 1985 1997 Generator $225,000 0 $0 0 2003 No
1 Escambia Pensacola Civic Center Generator $579,658 0 $0 230 2004 No
1 Escambia Univ of West Fla 54 Gym Generator Prewire $50,000 0 $0 0 2001 No
1 Escambia Univ of West Fla 13 1997 Generator (500kw) /Prewire $90,000 0 $0 167 2001 Yes
1 Escambia West Florida HS 9 Gymnasium /
Cafeteria2002 Generators (450kw & 350kw) and Gen Prewire $186,260 0 $0 0 2005 Yes
6 Hardee Bowling Green ES 18 2001 Generator (30kw)-purchase and install $24,028 0 $0 19 2005 Yes
6 Hardee Old Hardee Junior HS 1200 Media / 15 (?) 2001 Generator (30kw) and install. $24,028 0 $0 2 2005 Yes
6 Hardee North Wauchula ES 3 (5th grade) 2001 Generator (30kw) purchase & install $24,028 0 $0 4 2005 Yes
6 Hardee Wauchula ES 5 1998 Generator (30kw) Purchase & install $24,028 0 $0 237 2005 Yes
6 Hardee Wauchula ES 6 1998 Generator (30kw) install $24,028 0 $0 262 2005 Yes
6 Hardee Zolfo Springs Elementary School 10 Classroom 2001 Generator (30kw) install $24,028 0 $0 2 2005 Yes
1 Holmes East Pittman Evacuation Shelter generator $20,000 0 $0 65 2001 Yes
Appendix F: Prioritized List of Recommended Generator Projects (2016)

Reg
ion
al P
lan
nin
g C
oun
cil (
RP
C)
#
County Site Name Bldg # / type
Bu
ild
ing
Con
stru
ctio
n Y
ear
Description of WorkProposed Costs $
Risk Capacity Gained (spaces)
$/space gained
Rank Score (2013)
Source of information
Tech Revw Recomm ?
Appendix F: Prioritized List of Recommended Generator Projects (2016)
2 Jackson Graceville HS2 Classroom / Multipurpose
2001 Generator: 60kw $36,159 0 $0 17 2002 Yes
2 Jackson Malone SHS 14 2001 Generator: 60kw $36,159 0 $0 237 2002 Yes
6 Lake Seminole Springs ES 1 & 4 1988Generator and switch (500kw generator ($148,500) and switch-$45,200)
$193,700 0 $0 262 2006 Yes
9 Martin Hidden Oaks MS 2, 3 ,8 1991Generator- (300kw) fixed with fencing-slab. Includes panels and conduit wiring.
$267,912 0 $0 52 2005 Yes
9 Martin Jensen Beach HS 1, 4, 5 2004 Generator- prewire- install panel and local conduit $32,431 0 $0 242 2005 Yes
9 Martin Warfield ES 15, 21 1979 2001Generator (300kw)- fixed with fencing and slab. Install panel and conduit
$267,912 0 $0 248 2005 Yes
4 Nassau New Yulee MS "BB" café 2001 Generator 300kw generator/ wiring/ switch $155,000 0 $0 42 2002 Yes
4 Nassau West Nassau County HS CFI 114 2000-01 Generator 500kw generator/ enclosure $250,000 0 $0 189 2002 Yes
1 Okaloosa Antioch ES 1997 Generator Add Emergency Generator $50,000 0 $0 17 2000 Yes
6 Okeechobee County Health Department SpNs 1992 Generator 150KW $25,650 0 $0 2 2001 Yes
5 Osceola Celebration HS 2 2003 Generator $135,000 0 $0 29 2004 Yes
5 Osceola Discovery Intermediate School 2 1999 Generator $108,000 0 $0 0 2004 Yes
5 Osceola Florida Christian College Chapman Center Gym 1985 Generator, transfer switch wi/associated wiring $146,000 0 $0 312 2004 Yes
5 Osceola Harmony HS 2 2004 Generator $137,950 0 $0 228 2004 Yes
5 Osceola Kissimmee ES 4 2002 Generator $177,000 0 $0 27 2004 Yes
5 Osceola Narcoossee Community School 2 1998 Generator $134,000 0 $0 206 2004 Yes
5 Osceola Poinciana ES 4 2003 Generator $88,900 0 $0 27 2004 Yes
5 Osceola Reedy Creek ES 2 ? 2004 Generator and pre-wire $77,900 0 $0 0 2006 Yes
9 Palm Beach Bear Lakes MS 1986 Generator Prewire $10,000 0 $0 110 1999 0
9 Palm Beach Lake Worth MS 1988Generator : Replace generator/tank New automatic transfer switch New panels/feeders New central controls for ventilitation
$450,000 0 $0 110 2002 No
9 Palm Beach Lake Worth MS 1988 Generator Prewire $10,000 0 $0 0 1999 0
9 Palm Beach Omni MS 1989Generator - Replace generator fuel tank with new tank New automatic transfer switch New panels/feeders central controls for ventilation systems
$350,000 0 $0 110 2002 No
9 Palm Beach Omni MS 1989 Generator Prewire $10,000 0 $0 0 1999 0
9 Palm Beach Watson B. Duncan Community School 1989Generator : Replace generator/tank New automatic transfer switch New panels/feeders New central controls for ventilitation
$450,000 0 $0 110 2002 No
9 Palm Beach Watson B. Duncan Community School 1989 Generator Prewire $10,000 0 $0 0 1999 0
7 Pasco Lacoochee ES 11, 12,13 1971 1987 Generator 350KW ($144,762) Gen Housing: ($136,498) $281,260 0 $0 129 2005 Yes
7 Pasco Long Leaf ES 4 2004 Generator: 155KW ($92,954) Gen Housing: ($136,498) $229,092 0 $0 129 2005 Yes
7 Pasco R.B. Stewart MS Cafeteria 2005 Generator ($47,810) Generator Bldg: ($158,285) $206,095 0 $0 127 2005 Yes
7 Pasco Schrader ES9 - 2 Story
Classroom Add2003 Generator ($105,303) Generator Bldg: ($136,498) $241,801 0 $0 129 2005 Yes
7 Pasco Seven Oaks ES 4 2004 Generator ($92,594) Generator Bldg: ($136,498) $229,092 0 $0 129 2005 Yes
7 Pasco Zephyrhills HS 1 1973 Generator ($176,232) (400kw) Gen Bldg: ($171,599) $347,831 0 $0 0 2005 0
6 Polk Lakeland, City of Tigertown complex 050-08 & 050-01 1971 Generators (2) $124,000 0 0 0 2001 No

Reg
ion
al P
lan
nin
g C
oun
cil (
RP
C)
#
County Site Name Bldg # / type
Bu
ild
ing
Con
stru
ctio
n Y
ear
Description of WorkProposed Costs $
Risk Capacity Gained (spaces)
$/space gained
Rank Score (2013)
Source of information
Tech Revw Recomm ?
Appendix F: Prioritized List of Recommended Generator Projects (2016)
9 Saint Lucie Bayshore ES 1 1987Generator Protective enclosure for Generator Generator Prewire
$15,600 0 0 305 1999 Yes
9 Saint Lucie F.K. Sweet ES 8 Cafeteria 1987Generator- 200 KW portable generator with 3-day fuel tank on trailer to power 100Amp main panel
$212,601 0 0 50 1999 Yes
9 Saint Lucie Fairlawn ES 3 1987Generator- 200 KW portable generator with 3-day fuel tank on trailer to power 100Amp main panel
$212,601 0 0 65 2005 Yes
9 Saint Lucie Floresta ES 1 1982Generator Protective enclosure for Generator Generator Prewire Storage
$18,800 0 0 65 1999 Yes
9 Saint Lucie Lakewood Park ES 1981Generator Protective enclosure for Generator Generator Prewire Storage
$18,800 0 0 65 1999 Yes
9 Saint Lucie Morningside ES 1979Generator Protective enclosure for Generator Generator Prewire Storage
$18,800 0 0 65 1999 Yes
9 Saint Lucie Parkway ES 1988Generator Protective enclosure for Generator Generator Prewire Storage
$18,800 0 0 65 1999 Yes
9 Saint Lucie Port St. Lucie ES 17 Café 1987Generator- 200 KW portable generator with 3-day fuel tank on trailer to power 100Amp main panel
$212,601 0 0 65 2005 Yes
9 Saint Lucie Village Green ES 1985 Generator Protective enclosure for generator Prewire $15,600 0 0 65 1999 Yes
9 Saint Lucie White City ES 2 Cafeteria 1987Generator- 200 KW portable generator with 3-day fuel tank on trailer to power 100Amp main panel
$212,601 0 0 65 2005 Yes
9 Saint Lucie Windmill Pointe ES 1985Generator Protective enclosure for Generator Generator Prewire
$15,600 0 0 65 1999 Yes
5 Sumter North Sumter IS 18 Café 2000 Generator $133,972 0 0 217 2002 Yes
5 Sumter North Sumter PS 18 Cafeteria 1997 Generator $153,545 0 0 244 2002 Yes
5 Volusia Daytona Beach Comm Col 5 1988 Generator Pre-wire G $20,000 0 0 40 2000 Yes
5 Volusia Daytona Beach Comm. Col. 16 1970 Generator / Prewire $20,000 0 0 200 2000 Yes
Totals # Projects 84 Project Cost: $12,149,588 Capacity gained: 2,361

Reg
ion
al P
lan
nin
g C
oun
cil (
RP
C)
#
County Site Name Bldg # / type
Bu
ild
ing
Con
stru
ctio
n Y
ear
Description of WorkProposed Costs $
Risk Capacity Gained (spaces)
$/space gained
Rank Score (2013)
Source of information
Tech Revw Recomm ?
5 Brevard Anderson ES, Rockledge 2, 3, 4, 5 1990 Generator $195,000 0 $0 42 1999 Yes
5 Brevard Apollo ES 2, 3, 4 1990 Generator $215,000 0 $0 249 1999 Yes
5 Brevard Brevard CC - Cocoa Allied Health Bldg 20 1975 Generator (230KW) Freezer & oven/range $215,000 0 $0 195 2001 Yes
5 Brevard Brevard CC- Cocoa Life Long Learning CenterLife Long Learning
Centr1978 Generator (230kw) $185,000 0 $0 25 2001 Yes
5 Brevard Central Jr. High, West Melbourne 1995 Generator $195,000 0 $0 274 1999 Yes
5 Brevard Central Reference Library 1 1998 Generator $200,000 0 $0 27 2000 Yes
5 Brevard Imperial Estates ES 5, 6, 7, 8 1994 Generator $225,000 0 $0 27 1999 Yes
5 Brevard Longleadf ES / Melbourne 1998 Generator $195,000 0 $0 27 1999 Yes
5 Brevard Melbourne HS 1,8 1996 Generator $205,000 0 $0 238 1999 Yes
5 Brevard Oak Park ES 2, 5, 6, 7, 8 1989 Generator - 400kw installation/purchase $771,377 350 $2,204 100 2010 No
5 Brevard Oak Park ES 2, 5, 6, 7, 8 1989 Generator Prewire $55,000 350 $157 105 2010 Yes
5 Brevard Pinewood ES 4 1998 Generator $195,000 0 $0 229 1999 Yes
5 Brevard Port St. John Community Center Center 1999 Generator $185,000 0 $0 197 2000 Yes
5 Brevard Rockledge HS 1990 Generator $185,000 0 $0 27 2001 Yes
5 Brevard South Mainland Community Center Gymnasium 2001 Generator $185,000 0 $0 27 2000 Yes
5 Brevard Space Coast MS / JrHS 1994 Generator $195,000 0 $0 182 1999 Yes
5 Brevard Westside ES Palm Bay 1997 Generator $195,000 0 $0 29 1999 Yes
8 Charlotte Kingsway ES 1 Two-story 1998 Generator/enclosure $101,000 0 $0 77 2005 Yes
8 Collier Big Corkscrew Island Fire Stn #12 generator $25,000 0 $0 75 2001 0
8 Collier Pine Ridge MS 290 Generator Pre-wire $10,000 0 $0 75 1999 Yes
8 Collier Village Oaks ES Generator Pre-wire $10,000 0 $0 75 1999 Yes
6 DeSoto DeSoto MS E Gym 2001 Generator (100kw) $40,000 0 $0 17 2002 Yes
3 Dixie Ruth Rains MS whole school 1993 Generator (500kw) ($150,000) Gen. Prewire $150,000 0 $0 32 2005 Yes
4 Duval Lincoln Villa Comm Center 0 Gen Prewire $4,250 0 $0 0 1999 Yes
1 Escambia Lipscomb ES 1 1991 Generator and Pre-wire (400kw generator) $149,110 0 $0 232 2005 Yes
1 EscambiaOlive Baptist Church North Wing and Rec Outreach Center
ROC 1985 1997 Generator $225,000 0 $0 0 2003 No
1 Escambia Pensacola Civic Center Generator $579,658 0 $0 230 2004 No
1 Escambia Univ of West Fla 54 Gym Generator Prewire $50,000 0 $0 0 2001 No
1 Escambia Univ of West Fla 13 1997 Generator (500kw) /Prewire $90,000 0 $0 167 2001 Yes
1 Escambia West Florida HS 9 Gymnasium /
Cafeteria2002 Generators (450kw & 350kw) and Gen Prewire $186,260 0 $0 0 2005 Yes
6 Hardee Bowling Green ES 18 2001 Generator (30kw)-purchase and install $24,028 0 $0 19 2005 Yes
6 Hardee Old Hardee Junior HS 1200 Media / 15 (?) 2001 Generator (30kw) and install. $24,028 0 $0 2 2005 Yes
6 Hardee North Wauchula ES 3 (5th grade) 2001 Generator (30kw) purchase & install $24,028 0 $0 4 2005 Yes
6 Hardee Wauchula ES 5 1998 Generator (30kw) Purchase & install $24,028 0 $0 237 2005 Yes
6 Hardee Wauchula ES 6 1998 Generator (30kw) install $24,028 0 $0 262 2005 Yes
6 Hardee Zolfo Springs Elementary School 10 Classroom 2001 Generator (30kw) install $24,028 0 $0 2 2005 Yes
1 Holmes East Pittman Evacuation Shelter generator $20,000 0 $0 65 2001 Yes
Appendix F: Prioritized List of Recommended Generator Projects (2016)

Reg
ion
al P
lan
nin
g C
oun
cil (
RP
C)
#
County Site Name Bldg # / type
Bu
ild
ing
Con
stru
ctio
n Y
ear
Description of WorkProposed Costs $
Risk Capacity Gained (spaces)
$/space gained
Rank Score (2013)
Source of information
Tech Revw Recomm ?
Appendix F: Prioritized List of Recommended Generator Projects (2016)
2 Jackson Graceville HS2 Classroom / Multipurpose
2001 Generator: 60kw $36,159 0 $0 17 2002 Yes
2 Jackson Malone SHS 14 2001 Generator: 60kw $36,159 0 $0 237 2002 Yes
6 Lake Seminole Springs ES 1 & 4 1988Generator and switch (500kw generator ($148,500) and switch-$45,200)
$193,700 0 $0 262 2006 Yes
9 Martin Hidden Oaks MS 2, 3 ,8 1991Generator- (300kw) fixed with fencing-slab. Includes panels and conduit wiring.
$267,912 0 $0 52 2005 Yes
9 Martin Jensen Beach HS 1, 4, 5 2004 Generator- prewire- install panel and local conduit $32,431 0 $0 242 2005 Yes
9 Martin Warfield ES 15, 21 1979 2001Generator (300kw)- fixed with fencing and slab. Install panel and conduit
$267,912 0 $0 248 2005 Yes
4 Nassau New Yulee MS "BB" café 2001 Generator 300kw generator/ wiring/ switch $155,000 0 $0 42 2002 Yes
4 Nassau West Nassau County HS CFI 114 2000-01 Generator 500kw generator/ enclosure $250,000 0 $0 189 2002 Yes
1 Okaloosa Antioch ES 1997 Generator Add Emergency Generator $50,000 0 $0 17 2000 Yes
6 Okeechobee County Health Department SpNs 1992 Generator 150KW $25,650 0 $0 2 2001 Yes
5 Osceola Celebration HS 2 2003 Generator $135,000 0 $0 29 2004 Yes
5 Osceola Discovery Intermediate School 2 1999 Generator $108,000 0 $0 0 2004 Yes
5 Osceola Florida Christian College Chapman Center Gym 1985 Generator, transfer switch wi/associated wiring $146,000 0 $0 312 2004 Yes
5 Osceola Harmony HS 2 2004 Generator $137,950 0 $0 228 2004 Yes
5 Osceola Kissimmee ES 4 2002 Generator $177,000 0 $0 27 2004 Yes
5 Osceola Narcoossee Community School 2 1998 Generator $134,000 0 $0 206 2004 Yes
5 Osceola Poinciana ES 4 2003 Generator $88,900 0 $0 27 2004 Yes
5 Osceola Reedy Creek ES 2 ? 2004 Generator and pre-wire $77,900 0 $0 0 2006 Yes
9 Palm Beach Bear Lakes MS 1986 Generator Prewire $10,000 0 $0 110 1999 0
9 Palm Beach Lake Worth MS 1988Generator : Replace generator/tank New automatic transfer switch New panels/feeders New central controls for ventilitation
$450,000 0 $0 110 2002 No
9 Palm Beach Lake Worth MS 1988 Generator Prewire $10,000 0 $0 0 1999 0
9 Palm Beach Omni MS 1989Generator - Replace generator fuel tank with new tank New automatic transfer switch New panels/feeders central controls for ventilation systems
$350,000 0 $0 110 2002 No
9 Palm Beach Omni MS 1989 Generator Prewire $10,000 0 $0 0 1999 0
9 Palm Beach Watson B. Duncan Community School 1989Generator : Replace generator/tank New automatic transfer switch New panels/feeders New central controls for ventilitation
$450,000 0 $0 110 2002 No
9 Palm Beach Watson B. Duncan Community School 1989 Generator Prewire $10,000 0 $0 0 1999 0
7 Pasco Lacoochee ES 11, 12,13 1971 1987 Generator 350KW ($144,762) Gen Housing: ($136,498) $281,260 0 $0 129 2005 Yes
7 Pasco Long Leaf ES 4 2004 Generator: 155KW ($92,954) Gen Housing: ($136,498) $229,092 0 $0 129 2005 Yes
7 Pasco R.B. Stewart MS Cafeteria 2005 Generator ($47,810) Generator Bldg: ($158,285) $206,095 0 $0 127 2005 Yes
7 Pasco Schrader ES9 - 2 Story
Classroom Add2003 Generator ($105,303) Generator Bldg: ($136,498) $241,801 0 $0 129 2005 Yes
7 Pasco Seven Oaks ES 4 2004 Generator ($92,594) Generator Bldg: ($136,498) $229,092 0 $0 129 2005 Yes
7 Pasco Zephyrhills HS 1 1973 Generator ($176,232) (400kw) Gen Bldg: ($171,599) $347,831 0 $0 0 2005 0
6 Polk Lakeland, City of Tigertown complex 050-08 & 050-01 1971 Generators (2) $124,000 0 0 0 2001 No

Reg
ion
al P
lan
nin
g C
oun
cil (
RP
C)
#
County Site Name Bldg # / type
Bu
ild
ing
Con
stru
ctio
n Y
ear
Description of WorkProposed Costs $
Risk Capacity Gained (spaces)
$/space gained
Rank Score (2013)
Source of information
Tech Revw Recomm ?
Appendix F: Prioritized List of Recommended Generator Projects (2016)
9 Saint Lucie Bayshore ES 1 1987Generator Protective enclosure for Generator Generator Prewire
$15,600 0 0 305 1999 Yes
9 Saint Lucie F.K. Sweet ES 8 Cafeteria 1987Generator- 200 KW portable generator with 3-day fuel tank on trailer to power 100Amp main panel
$212,601 0 0 50 1999 Yes
9 Saint Lucie Fairlawn ES 3 1987Generator- 200 KW portable generator with 3-day fuel tank on trailer to power 100Amp main panel
$212,601 0 0 65 2005 Yes
9 Saint Lucie Floresta ES 1 1982Generator Protective enclosure for Generator Generator Prewire Storage
$18,800 0 0 65 1999 Yes
9 Saint Lucie Lakewood Park ES 1981Generator Protective enclosure for Generator Generator Prewire Storage
$18,800 0 0 65 1999 Yes
9 Saint Lucie Morningside ES 1979Generator Protective enclosure for Generator Generator Prewire Storage
$18,800 0 0 65 1999 Yes
9 Saint Lucie Parkway ES 1988Generator Protective enclosure for Generator Generator Prewire Storage
$18,800 0 0 65 1999 Yes
9 Saint Lucie Port St. Lucie ES 17 Café 1987Generator- 200 KW portable generator with 3-day fuel tank on trailer to power 100Amp main panel
$212,601 0 0 65 2005 Yes
9 Saint Lucie Village Green ES 1985 Generator Protective enclosure for generator Prewire $15,600 0 0 65 1999 Yes
9 Saint Lucie White City ES 2 Cafeteria 1987Generator- 200 KW portable generator with 3-day fuel tank on trailer to power 100Amp main panel
$212,601 0 0 65 2005 Yes
9 Saint Lucie Windmill Pointe ES 1985Generator Protective enclosure for Generator Generator Prewire
$15,600 0 0 65 1999 Yes
5 Sumter North Sumter IS 18 Café 2000 Generator $133,972 0 0 217 2002 Yes
5 Sumter North Sumter PS 18 Cafeteria 1997 Generator $153,545 0 0 244 2002 Yes
5 Volusia Daytona Beach Comm Col 5 1988 Generator Pre-wire G $20,000 0 0 40 2000 Yes
5 Volusia Daytona Beach Comm. Col. 16 1970 Generator / Prewire $20,000 0 0 200 2000 Yes
Totals # Projects 84 Project Cost: $12,149,588 Capacity gained: 2,361

Appendix G:
(1) Retrofit Projects Not Yet Recommended (2) Generator Projects Not Yet Recommended

Reg
ion
al P
lan
nin
g C
oun
cil (
RP
C)
#
County Site Name Bldg # / type
Bu
ild
ingg
C
onst
ruct
ion
Yea
r
Description of WorkProposed Costs $
Risk Capacity Gained (spaces)
$/space gained
Rank Score (2013)
Source of information
Tech Revw
Recomm ?Technical Review Recommended Notes:
7 Hillsborough Edison ES 6 2000Fenestration Protection (450 SF)Cover Porticos (137 SF)
$22,305 226 $99 152 2003 Yes not done in 1467-2004
7 Hillsborough Edison ES 5 1999Fenestration Protection (827 SF)Cover Porticos (171 SF)
$39,780 412 $97 152 2003 Yes not done int 1467-2004
7 Hillsborough Mort ES 4 Classrooms 1999 Shutters (544 SF) Cover Porticos (267 SF) $28,485 355 $80 152 2003 yes not done in 1467-2004
8 Lee Lehigh Senior HS Bldg 4 1993 Shuttes/drawbolts $100,000 155 $645 152 2005 0
8 Lee Sunshine ES Bldg 11985, 1994
Shutters, anchor, brace, gen prewire, laydown, drawbolts
$350,000 256 $1,368 152 2003 NoNo >$300k No >$200/sp In Cat 4/5 storm surge zone (landfalling) but no surge expected in bldg.
7 Manatee Southeast HS 5 1997 Fenestration Protection $47,771 530 $90 152 2007 Yes
6 Polk Dundee Ridge MS 8 1999 Window protection. Generator. Prewiring. ($5000) $33,996 167 $204 102 2001 yes
6 Polk Eloise Community Center Main 1998 hardening $94,358 371 $254 102 2007 0 HMGP HB7121 - SR
6 Polk Lake Region HS 1 1994 Fenestration Protection $78,296 357 $219 102 2000 No
6 PolkRidgeview Global Studies Academy(Ridgeview ES)
5 Classroom 1999Fenestration Protection & Generator Prewiring
$60,000 237 $253 258 2001 No
6 Polk Ridgeview Global Studies Academy(Ridgeview ES)
3 Classroom 1999Fenestration Protection & Generator Prewiring
$50,000 199 $251 383 2002 Yes
6 Polk Sandhill Elem School 5 Classroom 1999 Fenestration Protection $61,845 212 $292 362 2000 no
6 Polk Sandhill Elem School 3 Classroom 1999 Fenestration Protection $60,000 211 $284 362 2002 no
5 Seminole Highlands ES1 Classroom(2nd Floor)
1995Engineer review / Fenestration Protection(Calculate soft-spot Openings)
$10,000 373 $27 152 2010 yesSpNS Shelter. Need estimate on fenestration opening for $ calculation
7 Hillsborough Eisenhower MS 5 2004 Fenestration Protection $37,372 252 $148 142 2004 Yes not done 1508-2005 06-SR-4P-08-38-03-177
7 Hillsborough Freedom HS 3 Art & band 2000 Fenestration Protection $42,075 321 $131 428 2003 Yes Cancelled in 1467-2004, Cannot locate LRDM
7 Hillsborough Freedom HS 6 Auditorium 2002 Fenestration Protection $37,500 348 $108 428 2003 Yes Cancelled in 1467-2004, Cannot locate LRDM
7 Hillsborough Tampa Bay Blvd ES 4 Media & Classrooms
1990 Shutter (1,063 SF) Cover Porticos (171 SF) $50,400 412 $122 142 2003 Yes not done in 1467-2004
7 Hillsborough W.J. Bryan ES 18 2002 Fenestration Protection $53,320 413 $129 142 2004 Yes
5 Sumter North Sumter PS 17 Classrooms 1997 Fenestration Protection $29,160 504 $58 362 2002 Yes
7 Hernando Deltona ES 300 Classroom 1989 Fenestration Protection (576 SqFt) $43,200 312 $138 155 2013 Yes
1 Escambia Bailey MS sec 9 gym 1993 Eng review- open span $8,421 1,051 $8 127 2004 0
7 Hillsborough Eisenhower MS 2 2004 Fenestration Protection $119,000 482 $247 127 2004 Yes not done 1508-2005 06-SR-4P-08-38-03-177
7 Manatee Braden River MS 3 1990 Door & Window protection pre-wire $126,548 620 $204 127 2000 No 100' Roof Span
3 Marion Saddlewood ES 3 Classroom Wing 1998Relocate Microwave tower from the bldg (laydownhazard)
$23,000 307 $75 117 2000 Yes
7 Pasco J.W. Mitchell HS 1 Admin 1997 Fenestration Protection $52,741 115 $459 127 2000 0
7 Pasco River Ridge MS / HS 7 1990 Fenestration Protection $0 73 $0 127 2000 0
6 Polk Wilfred Smith Community Center Main 1998 hardening $9,658 126 $77 77 2007 0 State Match for HB7121
Appendix G(1) - Retrofit Projects Not Yet Recommended (2016)
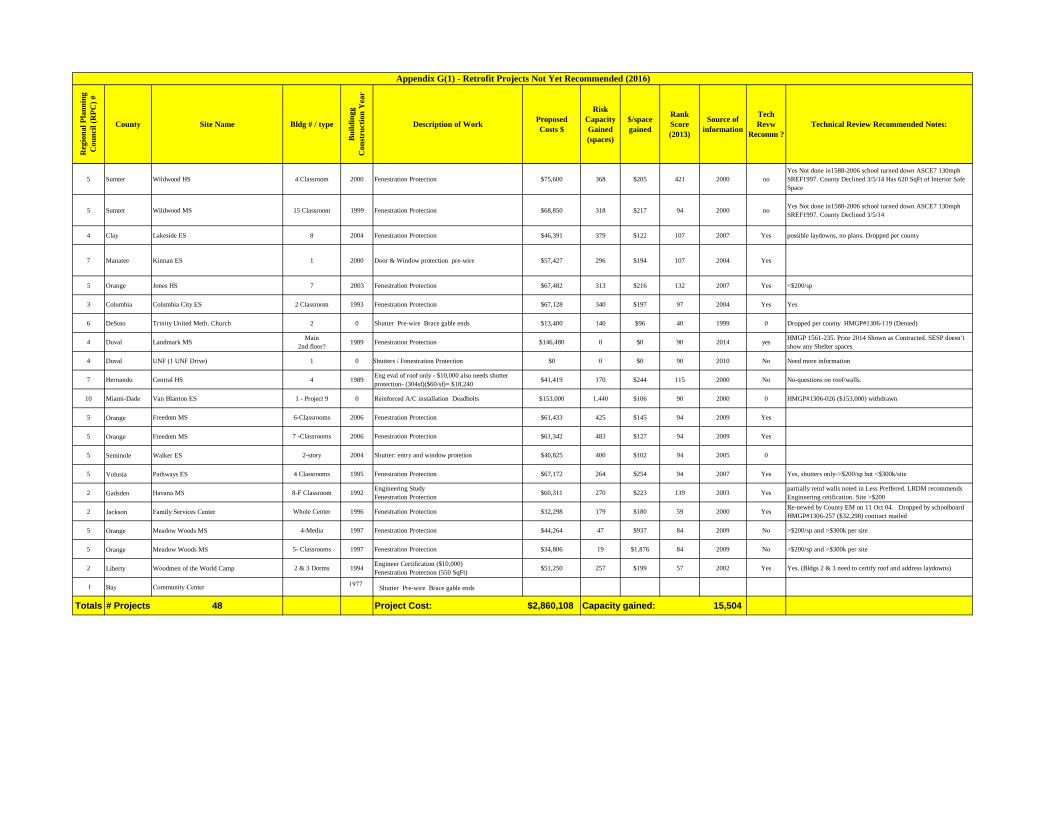
Reg
ion
al P
lan
nin
g C
oun
cil (
RP
C)
#
County Site Name Bldg # / type
Bu
ild
ingg
C
onst
ruct
ion
Yea
r
Description of WorkProposed Costs $
Risk Capacity Gained (spaces)
$/space gained
Rank Score (2013)
Source of information
Tech Revw
Recomm ?Technical Review Recommended Notes:
Appendix G(1) - Retrofit Projects Not Yet Recommended (2016)
5 Sumter Wildwood HS 4 Classroom 2000 Fenestration Protection $75,600 368 $205 421 2000 noYes Not done in1588-2006 school turned down ASCE7 130mph SREF1997. County Declined 3/5/14 Has 620 SqFt of Interior Safe Space
5 Sumter Wildwood MS 15 Classroom 1999 Fenestration Protection $68,850 318 $217 94 2000 noYes Not done in1588-2006 school turned down ASCE7 130mph SREF1997. County Declined 3/5/14
4 Clay Lakeside ES 8 2004 Fenestration Protection $46,391 379 $122 107 2007 Yes possible laydowns, no plans. Dropped per county
7 Manatee Kinnan ES 1 2000 Door & Window protection pre-wire $57,427 296 $194 107 2004 Yes
5 Orange Jones HS 7 2003 Fenestration Protection $67,482 313 $216 132 2007 Yes <$200/sp
3 Columbia Columbia City ES 2 Classroom 1993 Fenestration Protection $67,128 340 $197 97 2004 Yes Yes
6 DeSoto Trinity United Meth. Church 2 0 Shutter Pre-wire Brace gable ends $13,400 140 $96 40 1999 0 Dropped per county HMGP#1306-119 (Denied)
4 Duval Landmark MSMain
2nd floor?1989 Fenestration Protection $146,480 0 $0 90 2014 yes
HMGP 1561-235. Prior 2014 Shown as Contracted. SESP doesn’t show any Shelter spaces
4 Duval UNF (1 UNF Drive) 1 0 Shutters / Fenestration Protection $0 0 $0 90 2010 No Need more information
7 Hernando Central HS 4 1989Eng eval of roof only - $10,000 also needs shutterprotection- (304sf)($60/sf)= $18,240
$41,419 170 $244 115 2000 No No-questions on roof/walls.
10 Miami-Dade Van Blanton ES 1 - Project 9 0 Reinforced A/C installation Deadbolts $153,000 1,440 $106 90 2000 0 HMGP#1306-026 ($153,000) withdrawn
5 Freedom MS 6-Classrooms 2006 Fenestration Protection $61,433 425 $145 94 2009 Yes
5 7 -Classrooms 2006 Fenestration Protection $61,342 483 $127 94 2009 Yes
5 2-story 2004 Shutter: entry and window protetion $40,825 400 $102 94 2005 0
5 4 Classrooms 1995 Fenestration Protection $67,172 264 $254 94 2007 Yes Yes, shutters only->$200/sp but <$300k/site
2 8-F Classroom 1992Engineering StudyFenestration Protection
$60,311 270 $223 139 2003 Yespartially reinf walls noted in Less Preffered. LRDM recommends Engineering cetification. Site >$200
2 Whole Center 1996 Fenestration Protection $32,298 179 $180 59 2000 YesRe-newed by County EM on 11 Oct 04. Dropped by schoolboard HMGP#1306-257 ($32,298) contract mailed
5 4-Media 1997 Fenestration Protection $44,264 47 $937 84 2009 No >$200/sp and >$300k per site
5 5- Classrooms 1997 Fenestration Protection $34,806 19 $1,876 84 2009 No >$200/sp and >$300k per site
2
Orange
Orange
Seminole
Volusia
Gadsden
Jackson
Orange
Orange
Liberty
Bay
Freedom MS
Walker ES
Pathways ES
Havana MS
Family Services Center
Meadow Woods MS
Meadow Woods MS
Woodmen of the World Camp
Community Center
2 & 3 Dorms 1994Engineer Certification ($10,000)Fenestration Protection (550 SqFt)
$51,250 257 $199 57 2002 Yes Yes, (Bldgs 2 & 3 need to certify roof and address laydowns)
Totals # Projects 48 Project Cost: $2,860,108 Capacity gained: 15,504
1 Shutter Pre-wire Brace gable ends1977

Reg
ion
al P
lan
nin
g C
oun
cil (
RP
C)
#
County Site Name Bldg # / type
Bu
ild
ing
Con
stru
ctio
n Y
ear
Description of WorkProposed Costs $
Risk Capacity Gained (spaces)
$ / space gained
Rank Score (2013)
Source of information
Tech Review
Recomm ?Technical Review Recommended Notes:
5 BrevardMeadowlane Intermediate (2700 Wingate Blvd, West Melbourned FL 32904)
main 2007 generator (new) install w/transfrer switch $345,000 0 $0 52 2010 YesEhpa built 2007- currently has 400kw that power all but A/C- special needs shelter
3 Dixie Anderson ES Whole campus Campus Gen 1968 Generator (300kw) ($80,000) Gen. Prewire: ($15,000) $95,000 0 $0 30 2005 NoNo, large overhangs, unreinforced masonry walls, unverified loadpaths, unprotected windows.
6 Hardee Zolfo Springs ES 1 1967 Generator (30kw) $24,028 0 $0 260 2005 No No unreinforced masonry walls, open spans. 1967
6 Hardee Zolfo Springs ES 2 Classroom 1967 Generator (30kw) $24,028 0 $0 262 2005 No No, unreinforced walls, 62 ft open span, 1967 const.
9 Martin Bessey Creek ES 1,2,3,4,5,6 1995
Generator- install generator (300kw) to include panel and local conduit. Power for emergency lighting in all classrooms, restrooms, kitchen, café and admin area.
$370,141 0 $0 77 2005 NoNo, > $300,000 per site ARC 4496 Questionnaire- No lrdm. Cafe-SBC-1988, 74 long span. Has shutters. 9'-8" overhang.
9 Martin Crystal Lake ES 3,4,7,8,9 1989
Generator- install portable generator (250kw) to include panel and local conduit. Power for emergency lighting in all classrooms, restrooms, kitchen, café and admin area.
$316,559 0 $0 236 2005 NoNo, >$300,000 per site ARC 4496 questionnaie- No lrdm SBC-1988, 67ft span over Café. 9'-4" overhang shutters
9 Martin Felix A. Williams ES 2,4,5,6 1993Generator- (330KW) portable and installation of panels and local conduits
$370,141 0 $0 52 2005 NoNo, >$300,000 per site ARC 4496 Questionnaire- No lrdm. Cafe-SBC-1988, 74 long span. Has shutters. 9'-8" overhang.
9 Martin Indiantown MS 1, 2, 3, 41969 1980
1999Generator (50kw)- portable and installation of panel/local conduit
$102,934 0 $0 321 2005 NoNo, large overhang, open span Not addressed Arc 4496 questionnaire SBC-1988, Café-66'-8" span, 9'-4" overhang. Shutters. .
9 Martin Jensen Beach ES 2, 3, 81970 1980 1987 1993
Generator (200kw)- fixed with fence and slab. Install panel and conduit.
$365,206 0 $0 319 2005 NoNo, >$300,000 per site Arc 4496 questionnaire, ANSI A58.1-1982, shutters, Café- 60' span,
9 Martin Pinewood ES 3, 4,7,8,9 1988Generator- (250KW) portable, plus installation of panel and conduit
$316,559 0 $0 317 2005 NoNo, >$300,000 per site SBC-1988, shutters, Café- 66'-8" Span, 9'-4" overhang
9 Martin Seawind ES 2,3,4,5,6 1993Generator (330KW) -portable- install panel and conduit.
$370,141 0 $0 52 2005 Yes Yes SBC-1988,Cafe-74 span, 9'-8" overhangs, shutters.
5 Osceola Holopaw Community Center Center 2005 generator $126,000 0 $0 287 2004 No No +40mph wind design - EHPA
7 Pasco Pasco HS A, B, & C -Clinic Add -Classroom
Add1986 Generator ($176,232) Generator bldg: ($166,757) $342,989 0 $0 125 2005 No No, >$300k per site ANSI A58.1-1982 Shutters
7 Pasco T. Weightman MS 2, 4, 7, 8 1990Generator ($125,048) (230kw) Generator Bldg: ($184,745)
$310,793 0 $0 129 2005 Yes Yes ANSI A58.1-1982 shutters bldg 2 is SpNS shelter
4 Saint Johns Saint Johns County Agricultural Center 1 1986 Generator - Install new 200-KW generator $36,891 0 0 255 2003 No No
5 Seminole Lake Mary HS 1 (1st floor)1979 1983-
1988Generator Prewiring $16,800 0 0 27 2001 No No
5 Sumter Webster ES 14 Café 1995 Generator $83,500 0 0 294 2000 No No, question on roof span 68', not addressed.
5 Volusia Debary ES - Daytona Beach 4 Cafeteria 1995 Generator : Emerg. Prewiring $50,000 0 0 279 2001 NoSoft spots, roof overhangs (7'10") and roof open span (80'). Requires ASCE 7 review. LRDM attached
Totals # Projects 18 Project Cost: $3,666,710 Capacity gained: 0
Appendix G(2) - Generator Projects Not Yet Recommended (2016))

Appendix H: Project Submittal Form and Priority Worksheet
1. 2016 Shelter Retrofit Proposal Submittal Form2. 2016 Project Priority Worksheet

2016 SHELTER RETROFIT PROJECT SUBMITTAL FORM EMPA Base Grant Task 5.A
Ref: Section 252.385(3), Florida Statutes
Instructions 1. The Division’s hurricane shelter retrofit program is generally limited to high wind and flood hurricane-resistance improvements (e.g., ASCE 7 engineering assessments, window and door protection, masonry wall reinforcement, etc.) 2. Please review ARC 4496 (found in Appendix C, 2015 Shelter Retrofit Report) before beginning the project identification process. The Division’s interpretation of the ARC 4496 hurricane safety criteria can be found at the following web address: http://www.floridadisaster.org/Response/engineers/HES/Manual/ARC4496-Prescriptve-Summary-Table.pdf Note all construction deficiencies with respect to ARC 4496 for individual buildings, and address each deficiency with a corrective action. 3. Prepare an individual Shelter Retrofit Project Submittal form for each individual building being evaluated. DO NOT combine several buildings or a campus onto a single submittal form. An Open Plan building that has a common exterior wall and roof system (building envelope) may be considered a single building. If there are significant differences in construction found in the same building (i.e., major addition constructed to a more wind-resistant design), prepare separate forms and indicate structural separation barrier on a sketch. 4. For entries that provide a multiple choice format, choose the response that is “typical” for the individual building being evaluated. For buildings that have multiple construction materials (or characteristics) and can not be described with a single entry, provide a description (and sketches) of the building. Also assume the weakest materials will be a softspot, and therefore the limiting factor with respect to wind performance. 5. Multiple projects can be submitted for each individual building (e.g., window shuttering, door head and foot bolts, gable-end bracing, generator prewiring, etc.). Please describe the tangible benefits that will be provided by each individual project (e.g., 250 additional shelter spaces if shuttering is performed) and a cost estimate for each individual project. 6. Please note the definition of reinforced and partially reinforced masonry, as defined in Wall Construction Type descriptions, when determining applicable General Construction Type entries. For the purposes of this submittal form, use the following prescriptive definitions: Partially Reinforced Masonry - For 8-inch hollow concrete masonry units (CMU), the maximum spacing of vertical reinforcement (rebar) at exterior walls shall be 8'-0"; 12" CMU rebar can be extended up to 11'-4". Rebar shall be provided at each side of wall openings, corners and wall-to-wall intersections. An alternative to reinforced cell construction is tie-column (or pilaster) and beam systems. For 8-inch CMU, the maximum spacing between tie-columns shall not exceed 13'-6"; 12-inch CMU tie-columns can be extended to 20'-0". Horizontal reinforcement must be present at roof and floor levels, and above and below wall openings. Interior masonry bearing and/or “core area” walls shall meet the same reinforcement requirements as exterior walls.

Reinforced masonry - Reinforced masonry has the same definition as partially reinforced masonry above, except the maximum spacing of the principal vertical reinforcement can not exceed six (6) times the wall thickness or 4'-0". The presence of tie-columns does not have an effect upon a masonry walls classification as reinforced masonry. 7. For the purposes of this report, standard weight (wgt) concrete will have a minimum density of 100 pounds per cubic foot and minimum compressive strength of 2500 pounds per square inch. 8. These additional limitations apply to 2016 Shelter Retrofit Report projects:
a) No more than $500 per hurricane evacuation shelter space gained per individual building, or for campuses/sites with multiple buildings, a campus-wide average of no more than $350 per space; or
b) Up to 10% of the total construction costs in the case of a project that is upgrading the
design of new construction to meet high wind and flood sections of the enhanced hurricane protection area (EHPA) codes, to include additional 40 mph in design wind speed, or ICC 500 storm shelter standards; or
c) A maximum of $300,000 total per project (excluding generators/electrical work); and,
d) Generators/electrical work shall be considered separately from hurricane wind and flood
retrofit construction. Generators/electrical work shall be considered separately from the $300,000 limit in item c) above. Generators/electrical work shall also be limited to $300,000 total per project campus/site. (Thus potentially a limit of $300,000 in generators/electrical work, plus $300,000 in other construction/structural mitigation work, for a combined total limit of $600,000.)
9. For hurricane-resistance hardening of new construction, only pages 1, 6, 7 and Prelim Budget
Worksheet(s) need to be prepared and submitted.

2016 SHELTER RETROFIT PROJECT SUBMITTAL (ARC 4496 Questionnaire) County: ___________________________ Latitude: ______________________ Longitude: _________________________________ Facility Name:_________________________________________________________________ Building Number or ID: __________________________________________________________ Address: ______________________________________________________________________ Current Ownership of Facility: (Public, Private) _______________________________________ Is Facility currently used as a high wind shelter? Yes _______ No _______ If answer is No, why? ___________________________________________________________ _____________________________________________________________________________ Is the facility located within one mile of the ocean or a large body of water (greater than 1 mile in width or diameter)? Yes ______ No _______ Is the building located on a coastal barrier island? Yes ______ No ______ Storm Surge (SLOSH) Zone that Facility is located within, circle appropriate response:
1* 2 3 4 5 None * includes Tropical Storm NFIP Flood (FIRM) Zone that Facility is located within, circle appropriate response:
A______ B C D X V zones will not be considered! If applicable, is the Facility/Shelter floor elevation above Base Flood Elevation (BFE) and SLOSH Category 4 flood inundation elevation? Yes ________ No ________ What is the finished floor elevation (above mean sea level) of the 1st floor of the bldg? _____ft Additional comments concerning flooding issues: _____________________________________ _____________________________________________________________________________ Facility Name _______________________________________ Page 1 of _____

FACILITY DESCRIPTION: Year Built _____________ , Major Addition(s) _____________ , ______________ Has building been inspected by structural engineer, architect, construction technician, or other knowledgeable building construction inspector? Yes _________ No_________ Are construction drawings (architectural & structural) and specifications available?
Yes _________ No_________ Which wind design standard(s) was used in the design and construction of this facility? □ SBC or MBMA, Edition 19 □ ANSI A58.1-1982 □ SFBC, Edition 19 □ FBC, Edition ___ or ASCE 7, Edition ___ General Construction Classification, check only one response as appropriate: Light Steel Frame* ______ Heavy Steel Frame ( I or W section)______ Reinforced Concrete Frame _______ Reinforced Concrete or Tilt-up Wall______ Fully or Partially Reinforced Masonry _______ Unreinforced Masonry wall-brg _______ Heavy Timber or Glulam Frame _______ Light Metal or Wood Stud wall-brg _______ *includes Pre-engineered Metal Building (PEMB) Frames. Exterior Wall Construction, check only one response as appropriate: Reinforced Masonry Light Wood or Metal Stud (Rebar @ 4 ft. o.c. or closer) ________ w/ ½ -inch or thicker plywood _______ Partially Reinforced Masonry Light Wood or Metal Stud (Rebar @ 8 ft. o.c. or closer) or w/ light non-plywood sheathing reinforced pilasters @ 13.5 ft. o.c. ________ (Includes EIFS) _______ Unreinforced Masonry (exceeds above Large Panel Glass or other listed spacings)/Rebar spacing unknown ________ Glazed Panel or Block System _______ Reinforced Concrete or Precast Metal Sheets or panels or other Concrete Panels (2" min. thickness) ________ Light Architectural Panel Systems _______ Facility Name _______________________________________ Page 2 of _____

FACILITY DESCRIPTION (cont'd): Do the exterior walls have a brick or stone veneer (3 to 4 inches thick) or ½ + thick stucco on metal lath? Yes ________ No ________ What percentage (to the closest 5 %) of the total exterior wall area is glass? ___________ % Are there portions (softspots) of exterior walls consisting of gypsum wallboard and/or EIFS/vinyl finishes? Yes ____ No _____ If so, what percentage of exterior wall area is composed of this system (use worst-case wall face)? _________% Are there "storefront", atrium, or clerestory sections of glazing in the exterior walls? Yes _________ No ________ Are there fixed or operable shutters or other window coverings that will protect windows from large debris impact? Yes ________ No ________ Roof Construction, check only one response as appropriate: Cast-in-place Reinforced Concrete Plywood on wood or metal (standard wgt concrete, 3 inch min.) _________ joist or truss _________ Precast Concrete Panels Wood boards or T & G deck ("T's", "Double T's", Planks, etc.) _________ on wood joist or truss _________ Metal Decking w/ standard wgt concrete (3 inch min.) on Cement-fiber panels (i.e.,”Tectum”-type) on metal joist, truss or beam _________ wood or metal joist or truss _________ Other Metal Decking Systems Poured Gypsum on Formboard (insulating concrete and/or rigid Decking on wood or metal insulation or other light coverings) _________ joist or truss _________ Roof Geometry, check appropriate response: Flat or low slope (< 1:12) _________ Gable-end _________ Hip System _________ Shed System ________ Other ________________________________________________ Is the Roof Slope greater than 30 degrees (6:12)? Yes _______ No _________ N/A _____ Facility Name _______________________________________ Page 3 of _____

FACILITY DESCRIPTION (cont'd): Does the roof have a long span area (span of greater than 40 ft. between vertical supports)? Yes ________ No _______ If yes, what is the maximum span?_______________ Are Roof Eaves/Overhangs (width greater than 2 ft.) present that connect directly to the roof structure? Yes ________ No _______ Width of overhang __________ Are appropriate loadpath connections present for the building's construction type? (e.g., hurricane clips and straps for wood-frame construction) Yes ________ No _______ If Parapet(s) are present and roof ponding is a hazard, are emergency overflow scuppers present? Yes ________ No _______ Are Skylights or other overhead glass or plastic units present? Yes ________ No _______ Are there any tall structures/trees that are close enough and large enough, that if they fell over, they could strike the building with enough force to significantly breach the roof/walls? Yes ______ No ______ If yes, describe the tree(s) or structures:______________________________________________ ______________________________________________________________________________ ______________________________________________________________________________ ______________________________________________________________________________ ______________________________________________________________________________ Facility Name _______________________________________ Page 4 of _____

FACILITY DESCRIPTION (cont'd): Describe General Condition of the Building: ______________________________________________________________________________ ______________________________________________________________________________ ______________________________________________________________________________ ______________________________________________________________________________ ______________________________________________________________________________ ______________________________________________________________________________ Describe other construction features (features that enhance and detract from shelter usage) and/or site specific special hazards (e.g., close proximity debris sources or laydown hazards, etc.) associated with this facility that should be considered by the Division of Emergency Management: ______________________________________________________________________________ ______________________________________________________________________________ ______________________________________________________________________________ ______________________________________________________________________________ ______________________________________________________________________________ ______________________________________________________________________________ Describe wind or other storm effects damage history of this facility (e.g., severe roof leaks, etc.): ______________________________________________________________________________ ______________________________________________________________________________ ______________________________________________________________________________ ______________________________________________________________________________ Facility Name _______________________________________ Page 5 of _____

FACILITY DESCRIPTION (cont'd): NOTE: DO NOT COMPLETE THIS SECTION IF ARC 6564 HAS BEEN COMPLETED AND ATTACHED TO PROPOSAL. Which of the following descriptions best describes the food preparation capabilities of this facility? Full Kitchen ________ Warming Kitchen _______ HomeEc Clrm _______ None ________ Which of the following descriptions best describes the food serving capabilities of this facility? Restaurant _________ Cafeteria _________ Other _________ None _________ Seating Capacity, if known? ____________________ persons Are Sanitary Facilities directly accessible from the shelter area(s)?
Yes No Quantity Toilets ____________ ____________ _______________ Showers ____________ ____________ _______________ Potable Water ____________ ____________ N/A Which of the following descriptions best describes the potable water source of this facility? Public Utility _________ Onsite Well _________ Other _________ Which of the following descriptions best describes the sanitation utility of this facility? Public Utility _________ Onsite Septic _________ Other _________ Describe normal/daily function and availability of this facility for use as a shelter: _____________________________________________________________________________ _____________________________________________________________________________ ____________________________________________________________________________ Facility Name _______________________________________ Page 6 of _____

FACILITY DESCRIPTION (cont'd): SHELTER RETROFIT/MITIGATION PROJECT PROPOSAL: Describe type of project(s) to be undertaken and what impact it will have upon the shelter characteristics of the facility (e.g.., shuttering, generator pre-wiring, roof bracing, etc.); indicate the pre and post retrofit shelter capacity and whether the retrofits will only improve the safety of existing spaces; describe what impact the project will have upon the local and regional shelter deficit situation; provide cost estimates (+/- 15%), source of cost estimates, copies of cost estimate takeoffs if available; and, the time period necessary to complete all projects if construction is performed concurrently. Also provide detailed information on availability of other cost-sharing sources (local or other). Attach additional sheets if necessary. ______________________________________________________________________________ ______________________________________________________________________________ ______________________________________________________________________________ ______________________________________________________________________________ ______________________________________________________________________________ ______________________________________________________________________________ ______________________________________________________________________________ ______________________________________________________________________________
Project Description Impact (safety/capacity) Cost estimate 1. __________________________ ________________________ __________________ 2. __________________________ _______________________ __________________ 3. __________________________ _______________________ __________________ Is this project listed in the County’s Local Mitigation Strategy? □ Yes □ No If yes, is the project listed by specific building _________, or by campus only_________? Estimated project design and/or construction timeline/duration? Months ________ Facility Name _______________________________________ Page 7 of _____

Attachment A
2016 Shelter Retrofit Report Preliminary Budget Worksheet
Project #1
Descriptive Title: __________________________________
Line Item Description Cost Estimate A Construction Contractual Services $ B Vendor Contractual Services $ C A & E Service Fees $ D Materials $ E Installation/Force Account Labor $ F Permitting & Inspections Fees $ G Packing & Freight $ H $ I SUB-TOTAL $ J Contingency (5% Maximum*) $ K TOTAL ESTIMATED PROJECT COST $
*-Contingency is limited to 5% unless detailed justification provided.
Project #2
Descriptive Title: __________________________________
Line Item Description Cost Estimate A Construction Contractual Services $ B Vendor Contractual Services $ C A & E Service Fees $ D Materials $ E Installation/Force Account Labor $ F Permitting & Inspections Fees $ G Packing & Freight $ H $ I SUB-TOTAL $ J Contingency (5% Maximum*) $ K TOTAL ESTIMATED PROJECT COST $
*-Contingency is limited to 5% unless detailed justification provided. Facility Name _______________________________________ Page of _____

2016 Shelter Retrofit List Report Project Priority Worksheet
County: _______________________________________________
Building Name/ID: ______________________________________
Address, City, Zip: ______________________________________
ITEM MAX POINT SCORE
1. Regional General Population Shelter Deficit (75) _______
2. County General Population Shelter Deficit (50) _______
3. Regional Special/Medical Needs Shelter Deficit (30) _______
4. County Special/Medical Needs Shelter Deficit (20) _______
5. Recognized Multi-County Risk Shelter Destination (50) _______
6. The Building is a Designated Risk Special/Medical Needs Shelter (25) _______
7. The Building is a Designated Risk Pet-Friendly Shelter (25) _______
8. Building Ownership and Availability (50) _______
9. Flood & Building Design and Construction Criteria (125) _______
10. Numerical Increase in Risk Shelter Capacity (75) _______
11. Structural Envelope & Essential Equipment Protection (50) _______
12. Cost-Effectiveness Considerations (50) _______
13. Project Specified in Local Mitigation Strategy (50) _______
14. Project Engineering and/or Construction Timeline/Duration (25) _______
TOTAL POINTS (700) _______

1. Proposed project is located within a region with a General Population hurricane evacuation risk shelter space deficit (Maximum: 75 points): Regional shelter capacity is less than 10 sf per space (75) ________ Regional shelter capacity 10 – 14.9 sf per space (60) ________ Regional shelter capacity 15 – 19.9 sf per space (40) ________ Regional shelter capacity 20 – 30 sf per space (15) ________ Regional shelter capacity is more than 30 sf per space (0) ________ 2. Proposed project is located within a county with a General Population hurricane evacuation risk shelter space deficit (Maximum 50 Points1): County shelter capacity is less than 10 sf per space (50) ________ County shelter capacity 10 – 14.9 sf per space (40) ________ County shelter capacity 15 – 19.9 sf per space (25) ________ County shelter capacity 20 – 30 sf per space (10) ________ County shelter capacity is more than 30 sf per space (0) ________
1 – Fiscally-constrained counties may receive a 5-point preference in score, but not exceed total of 50 points
3. Proposed project is located within a region with a Special/Medical Needs Shelter (SpNS) hurricane evacuation risk shelter space deficit (Maximum: 30 points): Regional shelter capacity is less than 30 sf per space (30) ________ Regional shelter capacity 30 – 39.9 sf per space (25) ________ Regional shelter capacity 40 – 59.9 sf per space (15) ________ Regional shelter capacity 60 – 80 sf per space (10) ________ Regional shelter capacity is more than 80 sf per space (0) ________

4. Proposed project is located within a county with a SpNS hurricane evacuation risk shelter space deficit (Maximum: 20 points2): County shelter capacity is less than 30 sf per space (20) ________ County shelter capacity 30 – 39.9 sf per space (15) ________ County shelter capacity 40 – 59.9 sf per space (10) ________ County shelter capacity 60 – 80 sf per space (5) ________ County shelter capacity is more than 80 sf per space (0) ________
2 – Fiscally-constrained counties may receive a 5-point preference in score, but not exceed total of 20 points 5. Proposed retrofit project’s building is located in a county that is recognized to be a multi-county hurricane evacuation risk shelter destination for counties with very limited or no Category 4/5 sheltering options (Maximum 50 Points):
Destination county with 300+ dedicated multi-county SpNS spaces (50) ________
Destination county with 50 – 299 dedicated multi-county SpNS spaces
(35) ________
Destination county with dedicated multi-county General Population-only and/or limited multi-county SpNS spaces (< 50 dedicated SpNS spaces) (25) ________
Not a recognized multi-county shelter destination (0) ________ 6. Is the building designated by local EM to serve as a hurricane evacuation risk SpNS? (Maximum 25 Points): Yes (25) _________ No (0) _________ 7. Is the building designated by local EM to serve as a hurricane evacuation risk Pet-
Friendly Shelter? (Maximum 25 Points): Yes (25) _________ No (0) _________

8. Building ownership and availability for use as a public shelter (Maximum 50 Points): Public Facility/Full Availability (50) _________ Public Facility/Limited Availability (25) _________ Private Facility/Full Availability (15) _________ Private Facility/Limited Availability (0) _________ 9. Existing facility is demonstrated to address ARC 4496 hurricane-associated criteria (Maximum 125 Points):
A. Surge Inundation/SLOSH Considerations
Outside Cat 5 storm surge zone (25) _________ Inside Cat 4/5 storm surge zone, and floor above Cat 5 maximum inundation elevation (15) _________ Inside Cat 3 or lower storm surge zone, and floor above Cat 5 maximum inundation elevation (5) _________ Inside Cat 3 or lower storm surge zone, and/or floor below Cat 5 maximum inundation elevation (0) _________
B. Rainfall Flooding/NFIP FIRM Review Considerations
FIRM Zones C, D or unshaded-X (25) _________ FIRM Zone B, BE or shaded-X (15) _________ FIRM Zone A, AE or AH (5) _________ FIRM Zone V, VE, Coastal A or SFHA (0) _________
C. High Winds/Type of Construction
High Wind Resistant/Heavy Construction (preferred) (25) __________ Moderate Hurricane Resistance (less preferred) (15) __________ Some Hurricane Resistance (marginal) (5) __________ Light Construction/Info not available (0) __________

D. Building’s Structural Design, Wind Code Year
2003 – present (50) __________ 1995 – 2002 (25) __________ 1989 – 1994 (10) __________ Prior to 1989 (0) __________
10. Numerical increase3 in shelter capacity due to proposed retrofit project (Maximum 75 Points): 500 or greater additional spaces (75) ___________ 300 – 499 additional spaces (50) ___________ 150 – 299 additional spaces (25) ___________ 50 – 149 additional spaces (10) ___________ 1 – 49 additional spaces (5) ___________ No increase in hurricane shelter capacity (0) ___________
3 – For GP to SpNS equivalence, divide numerical capacity increase by three (3). 11. Structural Envelope & Essential Equipment Protection-ONLY Project(s) (Maximum 50 Points): Fenestration protection-only (windows, doors, etc.) required (50) ___________ Fenestration protection and engineer certifications-only required (25) ___________ Genset/Standby Electric System/MEP protection enclosure-only (10) ___________ More structural work than described above (0) ___________

12. Cost-effectiveness4 of project(s) (Maximum 50 Points): $99 average total cost or less per shelter space (50) ___________ $100 to $199 average total cost per shelter space (40) ___________ $200 to $349 average total cost per shelter space (25) ___________ $350 to $500 average total cost per shelter space (10) ___________ In excess of $500 average total cost per shelter space (0) ___________
4 – For GP to SpNS equivalence, increase numerical cost by multiplying by three (3). 13. Project Specified in Local Mitigation Strategy (Maximum 50 Points): Specific Building(s) referenced in LMS (50) ___________ Specific Campus/Complex-Only referenced in LMS (35) ___________ General Reference to Reduction in Shelter Deficit or Safety Improvements in LMS (10) ___________ No Specific applicable references to project(s) in LMS (0) ___________ 14. Proposed retrofit project’s design, engineering and/or construction timeline/duration
(Maximum 25 Points):
Less than 12 months (25) ___________
12 – 18 months (15) ___________
19 – 24 months (5) ___________
Greater than 24 months or Timeline Not Available (0) ___________

2016 Shelter Retrofit Report
November 2016

2016 Shelter Retrofit Report
November 2016
Bryan W. Koon Director
Rick Scott Governor