2016–17 - home - south east...
TRANSCRIPT

Annual Report2016–17Including the Consolidated Financial Report
© State of Victoria, South East Water 2017. This publication is copyright. No part may be reproduced by any process except in accordance with the provisions of the Copyright Act 1968.
ISSN 2205-5185
Aboriginal acknowledgementSouth East Water proudly acknowledges our region’s Aboriginal communities and their rich culture and pays respect to their Elders past and present.
We acknowledge Aboriginal people as Australia’s first peoples and as the Traditional Owners and custodians of the land and water on which we rely. We recognise and value the ongoing contribution of Aboriginal people and communities to Victorian life and how this enriches us. We embrace the spirit of reconciliation, working towards the equality of outcomes and ensuring an equal voice.
South East Water | Annual Report 2016–17 01
Report of operations
Overview of South East Water’s functions and services 3
A message from the Chair and Managing Director 4
Year in review 6
Corporation highlights and strategic objectives 6
Financial summary 14
Environmental reporting 16
Water consumption 16
Sustainable water use 18
Sustainable and resilient water services systems 19
Other statutory obligations 21
Greenhouse gas emissions, energy consumption and social sustainability 22
Compliance with bulk entitlements 23
Corporate governance 25
Organisational chart 25
Directors’ biographies 26
Executives’ biographies 28
Board of directors and board committees 30
Governance arrangements and material risks 33
Workforce data 35
Occupational health and safety reporting 35
Workforce composition and employment levels 36
Executive officer disclosure 38
Other disclosures 39
Performance reporting 44
Certification of performance report 47
Independent Auditor’s report on performance 48
Consolidated Financial Report 50
Contents

South East Water | Annual Report 2016–17 02
In accordance with the Financial Management Act 1994, I am pleased to present South East Water's annual report for the year ending 30 June 2017.
Lucia CadeChair
South East Water Corporation4 September 2017
Responsible body declaration
South East Water | Annual Report 2016–17 03
Overview
Manner of establishment and responsible ministerSouth East Water is a water corporation established under the Water Act 1989. The responsible Minister during the 2016–17 reporting period was the Hon Lisa Neville MP, Minister for Water. The Department of Environment, Land, Water and Planning (DELWP) was the responsible department.
Objectives, functions, powers and duties Since becoming a statutory corporation in 2012, South East Water has operated under a Statement of Obligations issued by the Minister for Water under section 4I(2) of the Water Industry Act 1994.
The corporation’s activities are governed by a number of other Acts, including the Catchment and Land Protection Act 1994, the Safe Drinking Water Act 2003, the Food Act 1984 and the Environment Protection Act 1970.
The Environment Protection Authority Victoria (EPA Victoria) and the Department of Health and Human Services (DHHS) oversee recycled water quality and drinking water respectively.
The Essential Services Commission (ESC) is the water industry’s economic regulator. Water plans outlining what South East Water will deliver and proposed prices are submitted to the ESC for review and approval. Water Plan 3 (2013–18) commenced on 1 July 2013.
Nature and range of services provided South East Water delivers water, wastewater and recycled water services for more than 743,000 residential, commercial and industrial customers – encompassing more than 1.75 million people – within Melbourne’s south east. South East Water’s service region covers 3,640 square kilometres from Port Melbourne to Portsea and some 30 kilometres east of Pakenham. It is responsible for $4 billion of assets and manages more than 25,250 kilometres of pipeline to deliver its services with the support of 81 water pump stations, 262 sewage pump stations, nine recycled water pump stations, eight water recycling plants and one stormwater treatment plant.
South East Water is driven by a vision to provide healthy water for life, and is committed to providing customers with safe, affordable and sustainable integrated water solutions that are both resilient and adaptable to change.
South East Water takes pride in its record of consistently being one of Australia’s most operationally efficient water utilities, while delivering a positive customer experience and managing water resources sustainably for today and the future.
South East Water’s key stakeholders include customers, developers, the community, its people, the state government’s departments and regulatory authorities, suppliers, local councils and business partners.
South East Water holds the ISO 14001 for Environmental Management, ISO 9001 for all aspects of its operations, AS/NZS 4801 for Occupational Health and Safety and certification to Hazard Analysis and Critical Control Points (HACCP), as well as the ISO22000 Food Quality Standard for management of water quality.
South East Water’s vision is to provide healthy water for life and its fundamental purpose is to deliver high quality water, wastewater and recycled water services.
Values of clarity, unity, agility and delivery underpin the corporation’s vision and purpose, while customers, efficiency, leadership and planning for future challenges are at the heart of South East Water’s activities.
South East Water | Annual Report 2016–17 04
We are pleased to present South East Water’s Annual Report 2016–17 to provide an overview of our operational performance, audited financial reports and key highlights, along with statements on our governance and management practices.
As we enter the last year of the 2013–18 price regulatory period and we plan for the services we’ll deliver our customers for 2018–23, we find ourselves in an exciting phase. As an organisation, we have been consolidating and enhancing the programs, plans and outcomes that the hard work of recent years has driven. From augmenting online services for customers and our property and development stakeholders to provide greater choice and convenience, to connecting our 2,000th customer to the sewer network in our Peninsula ECO program – we continued to build upon the services our customers have told us they want.
We have a responsibility to manage water resources on behalf of our customers and community for the future, and it’s one we take seriously. In the past 12 months we’ve implemented some significant integrated water management programs that we believe will help transform how we consider traditional water supply to homes. This is particularly important in the face of climate change and a rapidly growing population, which will place pressure on Melbourne’s waterways, reservoirs and sewer systems.
At the Aquarevo residential development in Lyndhurst, we’re excited to be creating a landmark water-efficient community by plumbing three types of water into homes to showcase the possibilities of harnessing all sources of water available to us: drinking, recycled and rainwater. These will be supported by intelligent sewer systems and high tech rain-to-hot-water systems – just some examples of new, more efficient ways of using water sources.
We’re also proud to be collaborating with stakeholders to design and plan an integrated approach to water supply and sewer systems at Fishermans Bend – Australia’s largest urban renewal project. We aim to create a water sensitive community that dramatically cuts potable water consumption and reduces wastewater discharge, while creating a greener urban environment. And we delivered our Urban Water Strategy (released in July 2017) with six key actions we’ll take to manage water resources for the next 50 years. We further cemented our commitment to our environment in 2017 with a pledge to reduce our carbon emissions to zero by 2030. These exciting initiatives will ensure our customers’ needs are met well into the future in a way that protects and enhances the liveability of Melbourne.
A message from the Chair and Managing Director
South East Water | Annual Report 2016–17 05
Meanwhile, we’re also continuing to share our innovations to provide value to other utilities both in Australia and abroad. Through iota Services, our Melbourne-made OneBox® technology and pressure sewer system is not only supporting local jobs, but also enabling growth of communities where traditional sewer systems are prohibitive and, particularly in Christchurch, New Zealand, it is supporting a city’s regeneration. We’re honoured that our inventions are delivering wide-reaching benefits.
Our people are central to these achievements. Their safety remains a priority for us, and during the year we trained all our employees in our top safety risks through our Living Safely Rules program. Similarly, our Safety and Wellbeing Strategy was launched and guides how we support our people and through our diversity and inclusion policy we’ve addressed our first year targets. These included building an employee profile that focuses on flexibility and caring responsibilities; gender equity; a gender pay gap analysis; and building strong relationships with disability employers.
On behalf of the board, we thank all our employees for their ongoing commitment to delivering healthy water for life. We also thank our outgoing Managing Director Kevin Hutchings for his leadership and 22 years of service to the corporation, and thank Charlie Littlefair for leading the organisation so well as Acting Managing Director for three months.
In accordance with the Financial Management Act 1994, we are pleased to attest that South East Water Corporation’s Annual Report 2016–17 is compliant with all statutory reporting requirements.
It was due to these projects and the innovations we have invested in to deliver more sustainable solutions, that we were recognised by our global peers as a Leading Utilities of the World during the year. We see this as positive acknowledgement of how we’re leveraging emerging technologies to manage the challenges of climate change, population growth, and changing customer expectations and to collaborate with others for greater customer benefit.
It is our customers who are at the very heart of our efforts to improve our services. By creating efficiencies, choice and greater reliability, we’re delivering affordable, fair and high quality outcomes. We’ve spoken with many customers over the past 18 months as part of planning for our price submission, and they’ve told us they expect us to focus on the basics, make sure prices are fair for all, and to tell them about our services. We intend to deliver on these.
We’ve also been engaging with the indigenous community and the Traditional Owners of the land in which we operate to help us understand the cultural value of water and spiritual connection to land and water for these customers. Our Aboriginal Engagement Strategy will be adopted in 2017 and our leadership team and board will meet with Traditional Owners to develop the relationships and action plan that will underpin shared value.
Lucia Cade Chair
4 September 2017
Terri Benson Managing Director

South East Water | Annual Report 2016–17 06
Corporation highlightsSouth East Water’s vision healthy water for life is the aspiration behind its many activities and achievements in 2016–17. Aligned to four strategic objectives that are underpinned by core business, values and behaviours, the corporation and its people continued to place customers, sustainability, efficiency and leadership at the heart of its activities – while anticipating future challenges.
South East Water also welcomed its new Managing Director, Terri Benson, who commenced in the role on 29 May 2017.
Strategic objective 1: customer value
We will continue to provide greater customer value by responding to the changing expectations and preferences of our customers and stakeholders.
Year in review
06
Key initiatives Our progress in 2016–17
Continue to evolve and innovate our digital customer experience to deliver greater customer and business value.
Significant enhancements were made to the registration and concessions processes in mySouthEastWater, South East Water’s online self-service hub. These changes have positively impacted customer experience delivering a 60 per cent reduction in customer enquiries related to these services. South East Water upgraded its smartphone app including offering water usage tips and Touch ID access. A complaints, feedback and enquiries form was also created for the mobile website.
Evolve our understanding of customer needs and expectations to innovate our service offerings, particularly around vulnerability and managing water use.
South East Water’s partnership with the University of Melbourne was designed to test the effectiveness of different behavioural interventions, particularly focused on reducing water usage. The first trial was successful, using an extension of the existing mySouthEastWater app to show water usage by day/week/month and down to the appliance level. Verbatim comments from customers participating in the trial highlighted they valued having access to an app that showed them how much water they used, with water saving efforts during the 5 – 7 am shower timeslot most impacted by this real-time information. At 30 June, a second trial was underway with 700 customers to test whether using a showerhead that displays water temperature and length has any effect on reducing water use.
Enhance our existing capability to provide proactive alerts and notifications for key products and services.
The existing system that is used to issue an SMS or email notice to customers whose property is experiencing an emergency outage was successfully extended to include proactive alerts for planned water outages. This is a quicker, more efficient method that helps remove the need to rely on mailing or hand delivering notifications. It also provides a reminder of the planned outage prior to the event, informs customers when water supply is restored and offers them another convenient, timely channel to suit their communications preferences.
Increase the number of digital offerings available for land and property development customers.
To create efficiencies, remove print-based processes and save customers' time, 13 processes were identified to be automated during 2016–17. At 30 June, three automation processes were completed, five in development and five awaiting implementation.
Develop and implement a holistic customer engagement framework to shape the way South East Water engages its customers.
In 2016–17, South East Water undertook a customer research and engagement program to understand what value for money means for customers, what they are willing to pay for services, and how the application of charges could be improved. This was conducted to support the development of its water price submission for 2018–23.
Completed Ongoing

South East Water | Annual Report 2016–17 0707
South East Water delivers its customers high quality water, wastewater and recycled water services. In 2016–17, the corporation supplied:
• 135 billion litres of drinking water
• 5.5 billion litres of recycled water.
It also collected 12.9 billion litres of sewage into its eight water recycling plants.
South East Water continued to enhance its service through the channels customers can use to make contact or pay their bill. With a rise in the number of customers electing to manage their account or seek support online, the number of phone enquiries continued to decline. The customer support team responded to more than 441,000 phone calls and emails from customers and held almost 30,000 live web chats. Monitoring customers’ experience with South East Water, showed they gave a 93 per cent satisfaction rating in 2016–17, up four per cent on the previous year.
Support for customers
South East Water continued to proactively identify customers experiencing financial difficulty and supported more than 4,500 customers through its South East Water Assist program to apply for Utility Relief Grants, concessions and setting up payment plans. Through its partnership with Good Shepherd Australia New Zealand, 408 customers were also able to access free financial counselling.
The corporation connected with the community by attending events and programs that helped support and educate those experiencing vulnerability, homelessness, family violence, or those from culturally and linguistically diverse backgrounds. As a co-sponsor of Cultural Diversity Week and Day at the Melbourne Zoo, South East Water was able to engage with thousands of newly arrived refugees, asylum seekers and immigrants who are learning English through adult education centres across Melbourne (including offering an introduction on who their water and wastewater utility is, and how they can obtain support if needed).
South East Water was proud to participate in the Vulnerable Customer Taskforce, and to work with the ESC on guidelines for water corporations to implement to help address family violence. In 2016–17, work began to deliver against outcomes from the ESC’s Report from the Royal Commission into Family Violence, and this will be a key program in the next financial year.
Creating efficiencies and streamlining processes is an ongoing commitment at South East Water, and in 2016–17 an automation to the notice of property sale process reduced processing times from three weeks to next-day. The introduction of an EFT payment option to business customers and a portal for real estate agents to pay group accounts provided additional choice and efficiencies for customers and the corporation.
In support of the water price submission for 2018, South East Water conducted research to better understand what customers value from its services and what they would be willing to pay or not pay for them. The results and feedback from customers are valuable, and will inform the services and prices proposed in the submission to the ESC.
Upgrading the water and sewer network
To deliver water and wastewater services to a growing population and continue to manage its 25,250 kilometre network of water and sewer pipes, in 2016–17 South East Water:
• built 109 kilometres of new water pipes, 175 kilometres of new sewer pipes and 87 kilometres of recycled water pipes to expand its existing network
• replaced 33 and 34 kilometres of ageing water and sewer pipes respectively.
In one significant sewer upgrade project, as at 30 June seven kilometres of ageing sewer main was in the process of being replaced between Mentone and Mordialloc, including along Beach Road.
South East Water also continued to play a significant support role in state government infrastructure projects by managing water and sewer realignments to enable other works to take place. These projects included a major tramline upgrade in Acland Street, St Kilda, an extension to the Monash Freeway, level crossing removal train line works, and the metro rail tunnel.
Highlights in 2016–17 to deliver customer value
South East Water | Annual Report 2016–17 08
Year in review
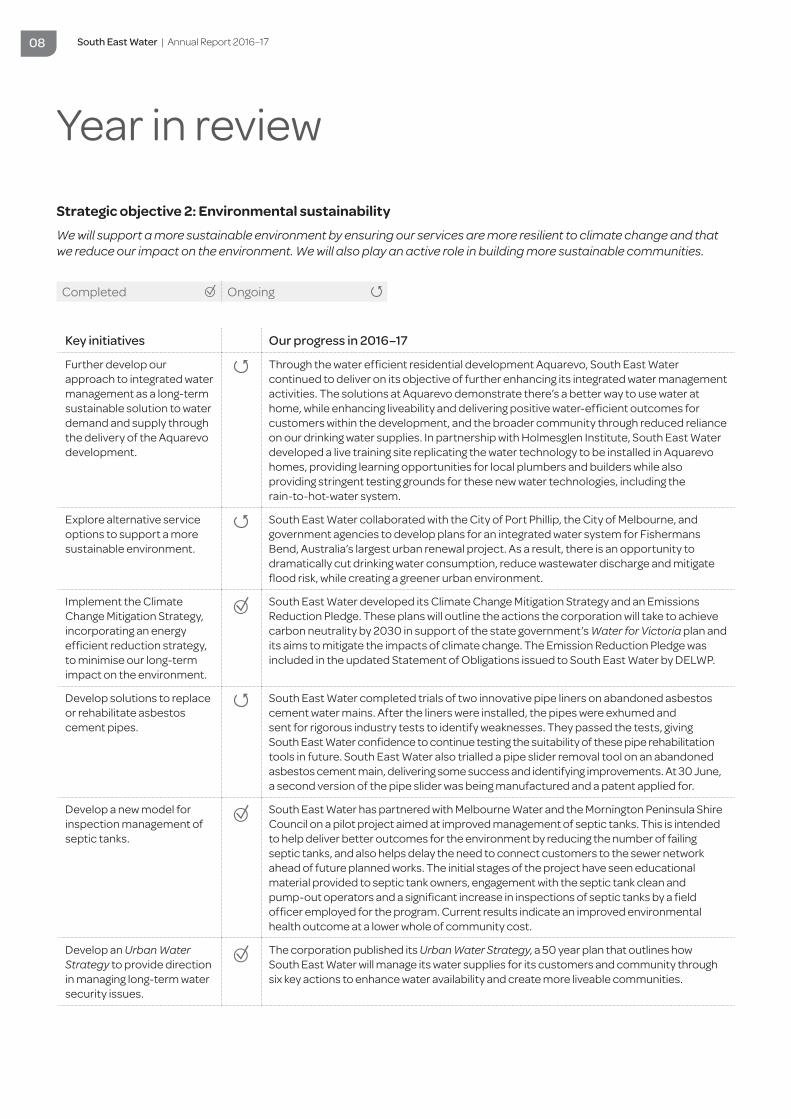
Strategic objective 2: Environmental sustainability
We will support a more sustainable environment by ensuring our services are more resilient to climate change and that we reduce our impact on the environment. We will also play an active role in building more sustainable communities.
Key initiatives Our progress in 2016–17
Further develop our approach to integrated water management as a long-term sustainable solution to water demand and supply through the delivery of the Aquarevo development.
Through the water efficient residential development Aquarevo, South East Water continued to deliver on its objective of further enhancing its integrated water management activities. The solutions at Aquarevo demonstrate there’s a better way to use water at home, while enhancing liveability and delivering positive water-efficient outcomes for customers within the development, and the broader community through reduced reliance on our drinking water supplies. In partnership with Holmesglen Institute, South East Water developed a live training site replicating the water technology to be installed in Aquarevo homes, providing learning opportunities for local plumbers and builders while also providing stringent testing grounds for these new water technologies, including the rain-to-hot-water system.
Explore alternative service options to support a more sustainable environment.
South East Water collaborated with the City of Port Phillip, the City of Melbourne, and government agencies to develop plans for an integrated water system for Fishermans Bend, Australia’s largest urban renewal project. As a result, there is an opportunity to dramatically cut drinking water consumption, reduce wastewater discharge and mitigate flood risk, while creating a greener urban environment.
Implement the Climate Change Mitigation Strategy, incorporating an energy efficient reduction strategy, to minimise our long-term impact on the environment.
South East Water developed its Climate Change Mitigation Strategy and an Emissions Reduction Pledge. These plans will outline the actions the corporation will take to achieve carbon neutrality by 2030 in support of the state government’s Water for Victoria plan and its aims to mitigate the impacts of climate change. The Emission Reduction Pledge was included in the updated Statement of Obligations issued to South East Water by DELWP.
Develop solutions to replace or rehabilitate asbestos cement pipes.
South East Water completed trials of two innovative pipe liners on abandoned asbestos cement water mains. After the liners were installed, the pipes were exhumed and sent for rigorous industry tests to identify weaknesses. They passed the tests, giving South East Water confidence to continue testing the suitability of these pipe rehabilitation tools in future. South East Water also trialled a pipe slider removal tool on an abandoned asbestos cement main, delivering some success and identifying improvements. At 30 June, a second version of the pipe slider was being manufactured and a patent applied for.
Develop a new model for inspection management of septic tanks.
South East Water has partnered with Melbourne Water and the Mornington Peninsula Shire Council on a pilot project aimed at improved management of septic tanks. This is intended to help deliver better outcomes for the environment by reducing the number of failing septic tanks, and also helps delay the need to connect customers to the sewer network ahead of future planned works. The initial stages of the project have seen educational material provided to septic tank owners, engagement with the septic tank clean and pump-out operators and a significant increase in inspections of septic tanks by a field officer employed for the program. Current results indicate an improved environmental health outcome at a lower whole of community cost.
Develop an Urban Water Strategy to provide direction in managing long-term water security issues.
The corporation published its Urban Water Strategy, a 50 year plan that outlines how South East Water will manage its water supplies for its customers and community through six key actions to enhance water availability and create more liveable communities.
Completed Ongoing

South East Water | Annual Report 2016–17 09
In an Australian-first, South East Water installed solar technology to power a pressure sewer system at a community sports ground in Tootgarook. This demonstrated how solar supported by battery technology can pump wastewater from a pressure sewer holding tank to the reticulated sewer network. It also solved a failing septic tank and potential groundwater pollution issue for the Mornington Peninsula Shire Council-run reserve.
More than 10 per cent of the energy needs of South East Water’s headquarters will be met through 400 solar panels installed on its roof. The 99kW panels are intended to deliver up to a third of the office’s electricity needs during summer months, and form part of South East Water’s upcoming climate change mitigation strategy.
An upgrade to increase treatment capacity and produce Class A recycled water at the Lang Lang Water Recycling Plant progressed during the year and is expected to be complete in 2017–18. The plant will collect and treat sewage from both South Gippsland Water and South East Water customers and provide greater access to recycled water for the local community for irrigation.
South East Water was proud to provide scientific expertise and development resources to test and aid research into biosolids and recycled water as part of its role joining the Co-operative Research Centre for High Performance Soils. Biosolids are a by-product of the sewage treatment process, and the corporation already produces these for use in agriculture as a fertilizer replacement.
Highlights in 2016–17 to deliver environmental sustainability

South East Water | Annual Report 2016–17 10
Strategic objective 3: Efficiency through innovation
We aim to operate more efficiently by enhancing our services and developing leading-edge, innovative water solutions.
Key initiatives Our progress in 2016–17
Establish a criteria for the installation of low pressure sewers in greenfield sites.
Pressure sewer systems can provide a viable and cost-effective alternative to sewage removal compared with traditional gravity sewer systems. South East Water established criteria for installing these in greenfield areas in 2016–17, and pressure sewer systems were approved for installation in new residential developments in Lang Lang and in an industrial development in Dandenong South.
Align our systems with ISO 55001 to improve the effectiveness and efficiency of the management of our assets.
South East Water already had a robust asset management system in place, and has updated the system to more strongly align it to ISO 55001. Further development and continuous improvement projects will support this system in the long term.
Trial internet of things (IoT) capability into South East Water sewer and water networks.
In 2016–17 South East Water trialled IoT technology, including NB-IoT chipsets in digital meters and OneBox® devices and NB-IoT data transmission via NB-IoT enabled telecommunications towers. The corporation also successfully completed the end-to-end integration of IoT technology with its existing information technology systems. This work has enabled South East Water to embark on a broader IoT metering trial in 2017–18, working with meter vendors, telecommunications carriers and IT providers to test the reliability and performance of all aspects of the technology, and the value that can be delivered to customers. Learnings from these trials will support City West Water, South East Water and Yarra Valley Water who are collaborating on the metropolitan Melbourne Digital Metering Joint Program. Including to better understand the possibilities for leak detection; improved operational efficiencies; and cost savings for customers and the water corporations from digital meters.
Complete high level future state enterprise architecture incorporating the drivers around digital utility and ISO 55001.
South East Water’s digital utility program aims to integrate its water and sewer assets and devices using IoT technology to form intelligent infrastructure. The vision for South East Water as a digital utility focuses on how data, information and knowledge about its network and how customers use its services can be combined to deliver value, choice and control for customers and shareholders. To support the development of its digital utility program, South East Water developed a future state architecture plan that outlines the IT platforms required to achieve the desired outcomes.
Review our capital procurement models to ensure efficient delivery of our capital program.
The capital procurement models review was completed with the renewals contract extended for 12 months.
Develop and deploy a new Information Security framework aligned to ISO 27001 and the new Victorian Protective Data Security Standards (VPDSS).
South East Water revamped its information security framework and moved information security from being an IT risk into corporate-wide risk. During the year, all employees completed security awareness training and the corporation is pleased to have taken a lead role within the Victoria water industry in how it is approaching IT security.
Deliver advanced and predictive analytic capabilities around the management of asset and customers.
The corporation conducted machine learning trials on assets to test this approach to advanced analytics. By receiving greater data about assets, machine learning can help predict their behaviours resulting in efficiencies and improved management of assets. These capabilities will form the building blocks required to support South East Water’s Digital Utility Program.
Year in review
Completed Ongoing
South East Water | Annual Report 2016–17 11
A $60 million upgrade to the Mt Martha Water Recycling Plant was completed and it is now the first treatment plant in Australia to use thermophilic anaerobic digestion. The process breaks down organic matter more quickly, which creates a more efficient treatment process and significantly reduces the plant’s environmental impact by capturing and using more methane and producing less odour during the process. This innovation also has the potential to deliver significant savings by delaying the need for upgrades and new digesters.
South East Water commenced a trial to explore the benefits of identifying undetected leaks in the water network. The trial involved installing remote zone meters within the water network and digital water meters at approximately 700 residential properties. Together, the meters transmit regular readings of water flows into the network and to properties. The results and learnings from the trial will feed into South East Water’s digital utility program to help inform greater network efficiencies, and water and cost savings to benefit customers and the corporation. The learnings will also be used to inform the metropolitan Melbourne Digital Metering Joint Program between City West Water, South East Water and Yarra Valley Water, who are working together to build a greater understanding of the benefits to customers, community and efficiencies that can be gained from digital water meters.
Engineered solutions
A re-engineering of South East Water’s Blokaid remote sewer monitoring device, initially developed 10 years ago, aims to move sewer flow monitoring to a new frontier. The device leverages ultrasonic level sensors and cutting-edge electronics. The advanced Blokaid was designed by South East Water engineers and at 30 June 2017 initial prototypes were deployed.
South East Water engineers are also behind a new innovation that will see vibration sensors fitted to digital water meters to detect leaks within the water network. All leaks produce a vibration signature, and the sensor will identify where these are present. Prototype sensors were designed and tested, and a final design approved with devices due to be manufactured in late 2017.
iota and OneBox® technology
South East Water’s wholly-owned subsidiary iota Services Pty Ltd is responsible for the commercialisation of innovative technologies emanating from the operational needs of South East Water. In 2016–17, iota progressed contracts for the use of OneBox® and low pressure sewer systems with water utilities in both Australia and overseas. OneBox® delivers reporting on sewer infiltration, and real-time control and monitoring of sewage flows.
Key contracts and trials of OneBox® low pressure sewer system include:
• a 10 year contract to supply OneBox® technology in all new developments in Christchurch, New Zealand across 7,500 properties
• installation of 152 systems in Western Bay of Plenty, New Zealand
• a trial of 50 OneBox® systems in Pitt Town, New South Wales, with a private water utility.
South East Water’s Peninsula ECO program uses the OneBox® low pressure sewer system and it enabled the accelerated rollout of a reticulated sewer system to the southern Mornington Peninsula. In 2016–17, South East Water exceeded its connection targets for the third consecutive year and connected its 2,000th customer to the sewer system.
Highlights in 2016 –17 to deliver efficiency through innovation
South East Water | Annual Report 2016–17 12
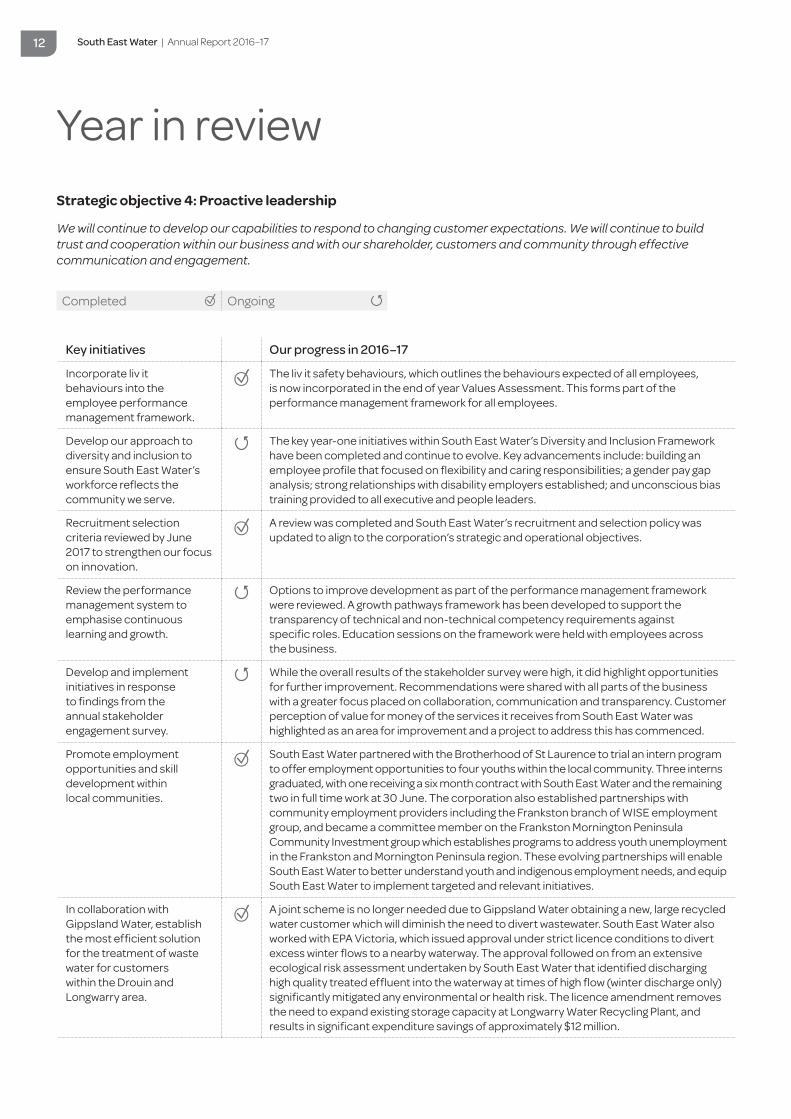
Strategic objective 4: Proactive leadership
We will continue to develop our capabilities to respond to changing customer expectations. We will continue to build trust and cooperation within our business and with our shareholder, customers and community through effective communication and engagement.
Key initiatives Our progress in 2016–17
Incorporate liv it behaviours into the employee performance management framework.
The liv it safety behaviours, which outlines the behaviours expected of all employees, is now incorporated in the end of year Values Assessment. This forms part of the performance management framework for all employees.
Develop our approach to diversity and inclusion to ensure South East Water’s workforce reflects the community we serve.
The key year-one initiatives within South East Water’s Diversity and Inclusion Framework have been completed and continue to evolve. Key advancements include: building an employee profile that focused on flexibility and caring responsibilities; a gender pay gap analysis; strong relationships with disability employers established; and unconscious bias training provided to all executive and people leaders.
Recruitment selection criteria reviewed by June 2017 to strengthen our focus on innovation.
A review was completed and South East Water’s recruitment and selection policy was updated to align to the corporation’s strategic and operational objectives.
Review the performance management system to emphasise continuous learning and growth.
Options to improve development as part of the performance management framework were reviewed. A growth pathways framework has been developed to support the transparency of technical and non-technical competency requirements against specific roles. Education sessions on the framework were held with employees across the business.
Develop and implement initiatives in response to findings from the annual stakeholder engagement survey.
While the overall results of the stakeholder survey were high, it did highlight opportunities for further improvement. Recommendations were shared with all parts of the business with a greater focus placed on collaboration, communication and transparency. Customer perception of value for money of the services it receives from South East Water was highlighted as an area for improvement and a project to address this has commenced.
Promote employment opportunities and skill development within local communities.
South East Water partnered with the Brotherhood of St Laurence to trial an intern program to offer employment opportunities to four youths within the local community. Three interns graduated, with one receiving a six month contract with South East Water and the remaining two in full time work at 30 June. The corporation also established partnerships with community employment providers including the Frankston branch of WISE employment group, and became a committee member on the Frankston Mornington Peninsula Community Investment group which establishes programs to address youth unemployment in the Frankston and Mornington Peninsula region. These evolving partnerships will enable South East Water to better understand youth and indigenous employment needs, and equip South East Water to implement targeted and relevant initiatives.
In collaboration with Gippsland Water, establish the most efficient solution for the treatment of waste water for customers within the Drouin and Longwarry area.
A joint scheme is no longer needed due to Gippsland Water obtaining a new, large recycled water customer which will diminish the need to divert wastewater. South East Water also worked with EPA Victoria, which issued approval under strict licence conditions to divert excess winter flows to a nearby waterway. The approval followed on from an extensive ecological risk assessment undertaken by South East Water that identified discharging high quality treated effluent into the waterway at times of high flow (winter discharge only) significantly mitigated any environmental or health risk. The licence amendment removes the need to expand existing storage capacity at Longwarry Water Recycling Plant, and results in significant expenditure savings of approximately $12 million.
Completed Ongoing
Year in review
South East Water | Annual Report 2016–17 13
Safety and Wellbeing Strategy
South East Water’s commitment to the safety and wellbeing of employees, contractors and its community was reinforced in the development of the new Safety and Wellbeing Strategy. A key deliverable included the development of the Living Safely Rules and training was rolled out to employees and relevant contractors. Refer to the statement on occupational health and safety on page 35 for more details. The strategy’s focus areas include the renewal of the OH&S management system, development of safety cases, increased focus on operational risk, enhanced industry collaboration, progressing the safety culture and employee wellbeing.
Support for diversity and inclusion
The continued delivery of South East Water’s Diversity and Inclusion Framework saw the rollout of unconscious bias training for all leaders within the organisation.
South East Water reviewed its procurement practices to ensure a proportion of contracts and purchases support social outcomes and local suppliers. As a founding member of a collaborative working group with VicWater and other metropolitan water utilities, South East Water is aiming to achieve positive social outcomes through combined purchasing power.
South East Water was proud to launch its Women in the Pipeline program, which aims to encourage an interest in water industry careers among female students. Noble Park Secondary College was the first school involved, with students gaining work experience, touring the Mt Martha Water Recycling Plant and education centre, and South East Water participating in the school’s careers expo.
South East Water's people
South East Water developed its first five-year People Strategy, endorsed by the Board of Directors in 2017. The People Strategy supports the corporation’s strategic priorities and its ‘narrative’ defines what the organisation aspires to culturally in 2021. An in-depth cultural audit was undertaken to identify the key focus areas that will support the delivery of the People Strategy. The audit measured high levels of employee engagement, trust and progression of its safety culture and identified the underpinning behaviours and values needed for future success.
In 2017 a new approach to employee reward and recognition was launched. The program includes formal, informal and peer-to-peer recognition. Designed in consultation with employees, the new program recognises behaviours aligned to South East Water’s values.
The evolution of the employee value proposition included the delivery of a new online on-boarding solution and enhanced induction program.
Highlights in 2016–17 to deliver proactive leadership
South East Water | Annual Report 2016–17 14
Year in review
Financial results for the year ended 30 June extract
2013 ($M)
2014 ($M)
2015 ($M)
2016 ($M)
2017 ($M)
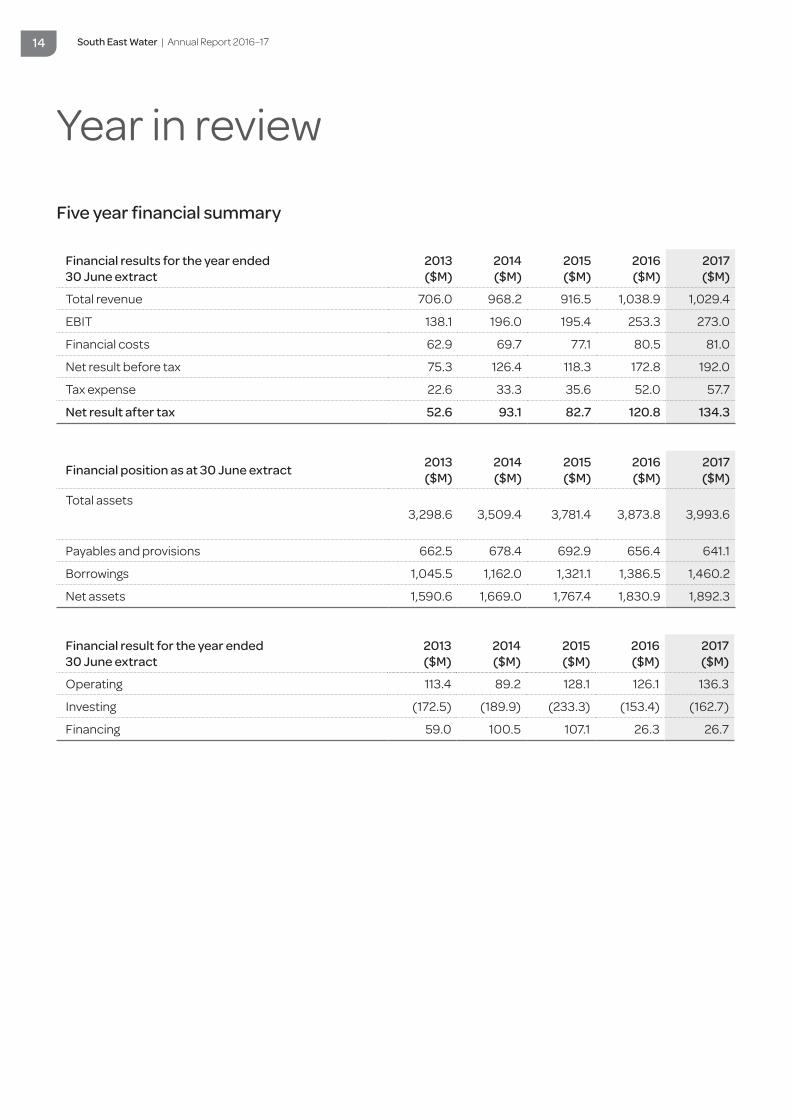
Total revenue 706.0 968.2 916.5 1,038.9 1,029.4
EBIT 138.1 196.0 195.4 253.3 273.0
Financial costs 62.9 69.7 77.1 80.5 81.0
Net result before tax 75.3 126.4 118.3 172.8 192.0
Tax expense 22.6 33.3 35.6 52.0 57.7
Net result after tax 52.6 93.1 82.7 120.8 134.3
Financial result for the year ended 30 June extract
2013 ($M)
2014 ($M)
2015 ($M)
2016 ($M)
2017 ($M)
Operating 113.4 89.2 128.1 126.1 136.3
Investing (172.5) (189.9) (233.3) (153.4) (162.7)
Financing 59.0 100.5 107.1 26.3 26.7
Financial position as at 30 June extract 2013 ($M)
2014 ($M)
2015 ($M)
2016 ($M)
2017 ($M)
Total assets3,298.6 3,509.4 3,781.4 3,873.8 3,993.6
Payables and provisions 662.5 678.4 692.9 656.4 641.1
Borrowings 1,045.5 1,162.0 1,321.1 1,386.5 1,460.2
Net assets 1,590.6 1,669.0 1,767.4 1,830.9 1,892.3
Five year financial summary
South East Water | Annual Report 2016–17 15
Current year financial review
South East Water delivered a solid financial result for 2016–17 driven largely by an increase in customers as a result of strong growth in both the development of new housing estates and of new housing in established areas, and lower expenses.
Customers benefited from the full pass through of lower wholesale charges as part of Melbourne Water’s 2016–21 price determination and payment of the third instalment of the $100 Government Water Rebate. In 2016–17, this rebate totalled $67.8 million and was paid to residential, water usage customers through their bills. As scheduled, 2017–18 will be the fourth and final year the Government Water Rebate will be paid to customers.
The corporation’s financial results demonstrate the benefits that management focus, strong cost control, innovation, ongoing improvements and efficiencies to core business, and investments in new technology and infrastructure have delivered. These activities support South East Water’s preparation for the 2018–23 price submission and its aims of ensuring the corporation is well placed to deliver the services customers expect.
The financial year was also marked by the delivery of new customer payment channels, procurement efficiencies and the launch of the Aquarevo initiative, a collaboration with Villawood Properties, which saw the first four stages of land sell out.
Overall, the business was able to achieve a 0.8 per cent reduction in controllable operating costs in 2016–17 after allowing for inflation and growth in customer numbers.
Capital expenditure totalled $166.9 million, up $23.5 million on the prior year and reflects increased investments in network capacity, local water recycling plants, backlog sewer systems and new recycled water infrastructure. These investments included the installation of the first thermophilic anaerobic digestion system in Australia at the Mt Martha Water Recycling Plant, which will improve odour management, and create a more efficient treatment process. It also enabled the upgrade works at Lang Lang Water Recycling Plant, and the supply of 5.5 billion litres of recycled water.
Cash flows from operating activities also improved during 2016–17 due largely to lower wholesale water and sewerage charges and improvements in working capital management.
The financial position of the business continues to remain sound with gearing (net debt/[net debt+equity]) at 43.5 per cent and funds from operations net interest cover at 2.7 times. This is also supported by South East Water’s standalone credit opinion of ‘A-’ which was reconfirmed by Fitch Ratings during the year.
Shareholder returns for the year included a final dividend of $47 million in respect of the 2015–16 financial year. The interim dividend for 2016–17 was deferred and will be paid as part of the final dividend payment in October 2017.
Capital projectsSouth East Water manages a number of capital projects, including water recycling plant upgrades and water and sewer system growth projects. For information on other recent capital projects for South East Water and the broader Victorian public sector, please refer to the most recent Budget Paper No. 4 State Capital Program (BP4) available on the Department of Treasury and Finance’s website. This publication also contains information on Victorian govenment departments and their related portfolio agencies’ asset investment programs.
Significant changes in financial positionThere were no significant matters which changed South East Water’s financial position during the reporting period.
Significant changes or factors affecting performanceThere were no significant changes or factors which affected South East Water’s performance during the reporting period.
Subsequent eventsThere were no events occurring after balance date which may significantly affect South East Water’s operations in subsequent reporting periods.
South East Water | Annual Report 2016–17 16
Environmental reporting
Residential customers Non-residential customers
District Number Potable water (ML)
Recycled water (ML)
Recycled stormwater (ML)
Number Potable water (ML)
Recycled water (ML)
Recycled stormwater (ML)
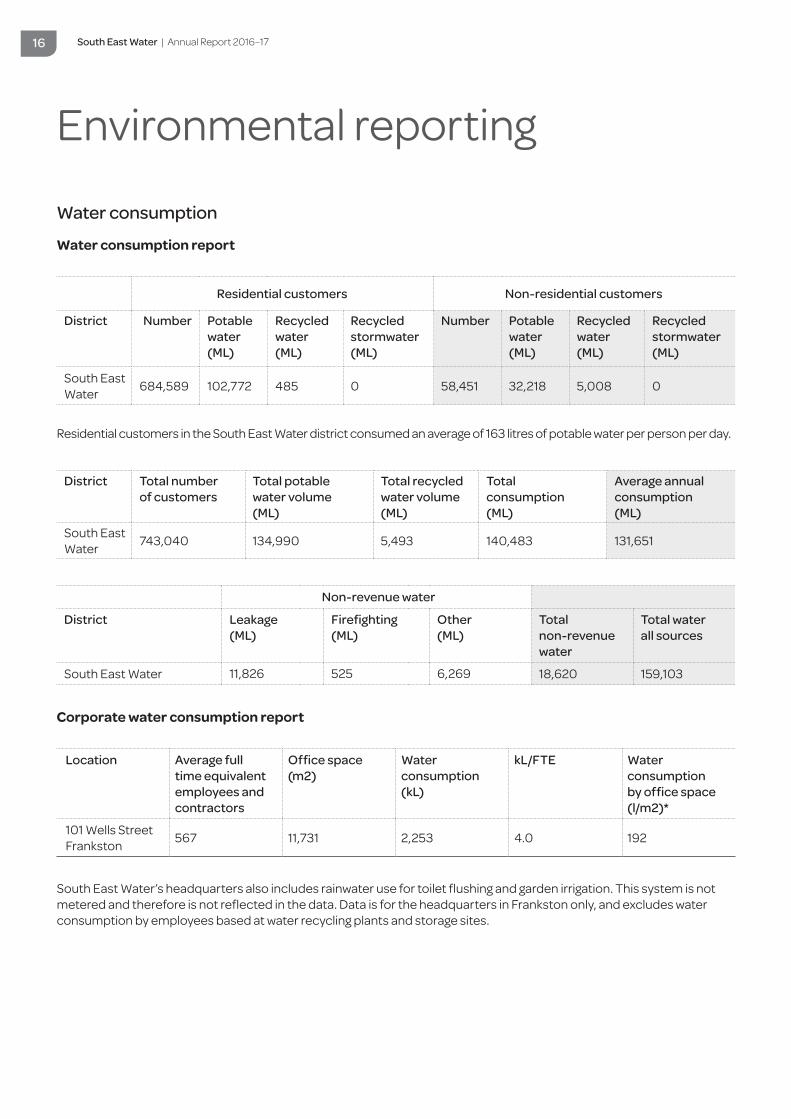
South East Water 684,589 102,772 485 0 58,451 32,218 5,008 0
Water consumption
Water consumption report
District Total number of customers
Total potable water volume (ML)
Total recycled water volume (ML)
Total consumption (ML)
Average annual consumption
(ML)South East Water 743,040 134,990 5,493 140,483 131,651
Non-revenue water
District Leakage (ML)
Firefighting (ML)
Other (ML)
Total non-revenue water
Total water all sources
South East Water 11,826 525 6,269 18,620 159,103
Location Average full time equivalent employees and contractors
Office space (m2)
Water consumption (kL)
kL/FTE Water consumption by office space (l/m2)*
101 Wells Street Frankston 567 11,731 2,253 4.0 192
Corporate water consumption report
South East Water’s headquarters also includes rainwater use for toilet flushing and garden irrigation. This system is not metered and therefore is not reflected in the data. Data is for the headquarters in Frankston only, and excludes water consumption by employees based at water recycling plants and storage sites.
Residential customers in the South East Water district consumed an average of 163 litres of potable water per person per day.
South East Water | Annual Report 2016–17 17
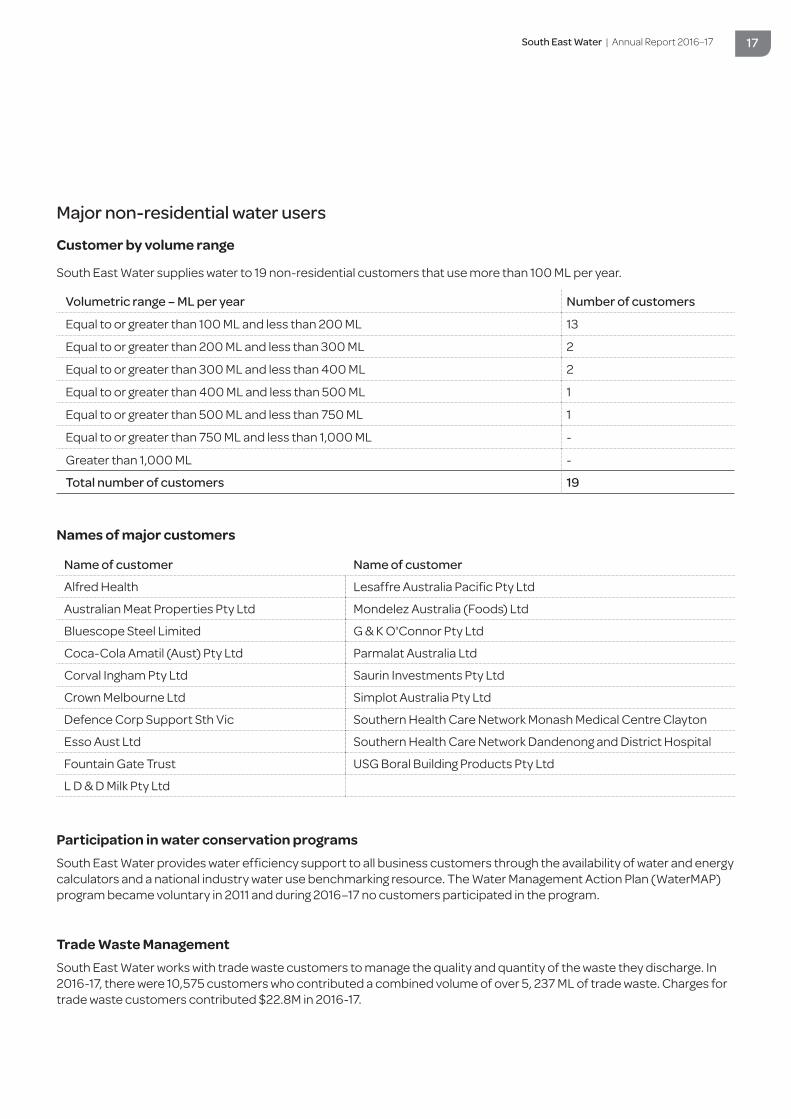
Major non-residential water users
Customer by volume range
South East Water supplies water to 19 non-residential customers that use more than 100 ML per year.
Volumetric range – ML per year Number of customers
Equal to or greater than 100 ML and less than 200 ML 13
Equal to or greater than 200 ML and less than 300 ML 2
Equal to or greater than 300 ML and less than 400 ML 2
Equal to or greater than 400 ML and less than 500 ML 1
Equal to or greater than 500 ML and less than 750 ML 1
Equal to or greater than 750 ML and less than 1,000 ML -
Greater than 1,000 ML -
Total number of customers 19
Participation in water conservation programsSouth East Water provides water efficiency support to all business customers through the availability of water and energy calculators and a national industry water use benchmarking resource. The Water Management Action Plan (WaterMAP) program became voluntary in 2011 and during 2016–17 no customers participated in the program.
Trade Waste ManagementSouth East Water works with trade waste customers to manage the quality and quantity of the waste they discharge. In 2016-17, there were 10,575 customers who contributed a combined volume of over 5, 237 ML of trade waste. Charges for trade waste customers contributed $22.8M in 2016-17.
Names of major customers
Name of customer Name of customer
Alfred Health Lesaffre Australia Pacific Pty Ltd
Australian Meat Properties Pty Ltd Mondelez Australia (Foods) Ltd
Bluescope Steel Limited G & K O'Connor Pty Ltd
Coca-Cola Amatil (Aust) Pty Ltd Parmalat Australia Ltd
Corval Ingham Pty Ltd Saurin Investments Pty Ltd
Crown Melbourne Ltd Simplot Australia Pty Ltd
Defence Corp Support Sth Vic Southern Health Care Network Monash Medical Centre Clayton
Esso Aust Ltd Southern Health Care Network Dandenong and District Hospital
Fountain Gate Trust USG Boral Building Products Pty Ltd
L D & D Milk Pty Ltd
South East Water | Annual Report 2016–17 18
Environmental reporting
Environmental and social sustainability reporting Sustainable water useSouth East Water promotes the integrated and sustainable use of water resources in its region, including better use of alternative supplies, by undertaking the following actions:
Water recyclingSouth East Water has eight water recycling plants that each produce Class A or Class C recycled water. In 2016–17, construction works continued at the Lang Lang Water Recycling Plant to upgrade its treatment from Class C to Class A, and planning commenced for an upgrade to the Boneo Water Recycling Plant to expand its daily Class A production capacity.
In 2016–17, the corporation supplied customers with 5.5 billion litres of recycled water for reuse and continued to expand its recycled water network. This included three new schools in the outer south east suburbs of Officer, Clyde North and Cranbourne West and nearly 5,300 residential homes, which receive the alternative supply for toilet flushing, garden watering and use in the washing machine. At 30 June, South East Water had close to 24,400 homes in its region able to receive recycled water. This is in addition to the large open spaces and sporting ovals irrigated with recycled water by the Mornington Peninsula, Frankston, Casey and Cardinia councils, and the vineyards, golf courses, market gardens, nurseries and turf growers which rely on it to support their businesses.
Water efficiencySouth East Water continued to encourage schools within its service region to join the Schools Water Efficiency Program, which helps them to identify leaks and understand and reduce their water use through deployment of a data logger and access to regular water usage readings. The program is funded by DELWP and Department of Education and Training, and at 30 June 237 schools in the region were participating in the program. They have collectively saved 693 million litres of water worth an estimated $2.4 million since 2012. This has also reduced South East Water’s energy use by 75 tonnes of carbon since 2012 through water it hasn’t needed to pump and manage through its network.
South East Water also continued to promote to its customers the Target 155 program and through water bills, website content, social media posts and videos, encouraged them to be aware of their water use and aim to keep it below Melbourne’s average daily use per person.
To support customers accessing a greater range of water efficiency tips, South East Water partnered with Smart Approved Water Mark – an international water efficiency program that certifies products and services that save water and provides advice about these online.
The corporation also collaborated with all Victorian water utilities to develop a joint approach towards creating water efficient communities through a strategy that seeks to enhance customer value and promote sustainable water use behaviours. The Victorian Water Efficiency Strategy will be finalised in 2017–18.
More than 15,000 members of the culturally and linguistically diverse community in Melbourne attended events and presentations hosted by the South East Water Assist team on water awareness education for new migrants, asylum seekers, refugees, students and families.
To support water efficiency behaviour change, the corporation is conducting a behavioural research trial with University of Melbourne that is designed to provide greater understanding on water use information and how it can help customers. The first phase of the trial began in 2016 and the second and third phases will continue into 2018.
Sustainable and resilient water services systemsFor Fishermans Bend, Australia’s largest urban renewal project, South East Water has continued to collaborate with key stakeholders and authorities to design water and sewer services for the region. These plans seek to ensure water reuse, waste regeneration, stormwater harvesting and sewer mining are some of the sustainable systems in place for this community in future.
South East Water also collaborated with City West Water and Yarra Valley Water to agree standard diagrams based on the corporation’s designs for installation of food and oil interceptors. A consistent approach across Melbourne provides greater ease for plumbers, building consultants and developers to understand the requirements for the interceptors, which have a significant role in capturing greasy waste and preventing it from entering Melbourne’s sewer systems.
South East Water worked to improve how groundwater discharge from construction sites to the sewer system is managed, considering optimum flow capacity and helping keep healthy saline limits to support recycled water programs.
South East Water | Annual Report 2016–17 19
With the Aquarevo project, South East Water is collaborating with Villawood Properties to create a residential development where homes feature a range of unprecedented water saving features. Homes will be built to receive three types of water: drinking, recycled and rainwater. Each source is specifically chosen for its intended use, reducing reliance on drinking water for uses that don’t require it. Homes will also use pressure sewer systems to pump wastewater to a local water recycling plant within the residential development, where water will be treated to Class A standard and sent back to each home for use in the garden, toilet or washing machine.
Sustainable water strategiesSouth East Water’s Urban Water Strategy was published in 2016–17, outlining a 50-year plan to sustainably manage water resources for the future in the face climate change and a population that’s set to nearly double by 2065. It outlines six key actions the corporation will take to enhance water availability and create more liveable communities, including delivering effective wastewater systems and creating water efficient communities.
South East Water has developed a regional strategy for managing sewer services in the rapidly growing Cardinia-Clyde region. This sets out plans to reduce reliance on potable water by making recycled water available for household and agricultural use.
Sustainable and resilient water services systemsWith regards to water efficiency and sustainable and resilient water services systems, South East Water undertook the following activities:
Community education and water awareness campaignsThe Mt Martha Water Recycling Plant is home to an education centre that hosts tours of school students and community groups who learn how sewage is collected and treated. In 2016–17, 2,180 people toured the plant.
To communicate water efficiency tips in line with the reintroduction of Target 155, South East Water developed a proactive social media campaign that ran over the summer months when water use tends to increase. This water awareness campaign used Facebook and Twitter to share videos depicting four different customers who shared their own water use tips. Combined, there were more than 440,000 views of the videos and the customer support team reported lower ‘high water use’ bill questions and contacts from customers than the previous year.
The research project with University of Melbourne (also referenced on pages 6 and 18) focuses on engaging customers about their water use and encouraging them to be more aware of their consumption and to change their water use behaviours.
Local scout groups are now able to complete their waterwise badge through new water-based learning activities, and a new children’s water club was launched where families who register receive a letter about water education each term.
South East Water supported 59 local community events across its region with access to free drinking water through its portable hydration station.
During Cultural Diversity Week, South East Water spoke with thousands of customers across three events supporting Harmony Day in Pakenham, Day at the Melbourne Zoo, and Melbourne’s Multicultural Festival at Federation Square. This week is the culmination of ongoing engagement South East Water undertakes throughout the year to support and educate customers who may be new settlers, refugees, asylum seekers or part of the region’s culturally and linguistically diverse (CALD) communities. Additionally, South East Water supports local and state National Aborigines and Islanders Day Observance Committee (NAIDOC) events, and is a member of the South East CALD Network.
South East Water also partnered with the City of Casey and the Royal Botanic Gardens to host the annual Cranbourne Family Day, which focuses on engagement with families and diverse communities.
Community consultation and engagement to help water cycle decision makingAt the Aquarevo residential development, a small water recycling plant will be built to treat waste from homes in the estate, turn it into Class A recycled water, and return it to homes for use in toilet flushing and outdoor garden watering – closing the loop. In 2016–17, property owners in the estate and within nearby suburbs were consulted about the water recycling plant and invited to ask questions, have a say and vote and comment on ideas about the plant in an online engagement forum.
As part of the development of South East Water’s Urban Water Strategy, which outlines how the corporation will manage water resources for the future, South East Water conducted research with customers to understand their views on the value of water, and to explore what alternative water sources they would consider using for appropriate purposes to help reduce reliance on Melbourne’s drinking water supplies.

South East Water | Annual Report 2016–17 20
Environmental reporting
Work undertaken with industry to improve water management outcomesTo help protect harmful waste from entering the sewer, South East Water works with businesses to help them manage their waste and meet acceptance parameters. This includes working with food retailers to install food and oil interceptors that collect grease and fats before they enter the sewer. This is managed through a Wastelog program and in 2016–17 nearly 25 million litres of fats, oils and grease were prevented from entering the sewer and congesting pipes. South East Water also worked with customers, other water utilities and the ESC to determine a more appropriate measure for sodium levels which can impact the quality of waste entering the sewer and affect the production of recycled water.
South East Water continued to collaborate and provide advice to industry associations like the Master Plumbers, and the Association of Hydraulics Services Consultants Australia on ensuring appropriate standards and codes are followed, including in the Fishermans Bend region where recycled water and rainwater plumbing requirements need to be incorporated in the building designs.
Work undertaken with local government and the community to realise water’s interface with liveability outcomes, including healthier urban waterways, effective and affordable wastewater systems, reduced drinking water consumption and increased use of alternative water sourcesSouth East Water worked with Kingston City Council, Frankston City Council and Glen Eira Council during the year to discuss providing information to ratepayers about the Target 155 program and the importance of water efficiency. These messages were shared through council newsletters and social media channels, and the aim is for ongoing engagement with local government to expand information sharing across the region.
One of South East Water’s strategic initiatives is to develop a new model for the inspection of septic tanks (refer to page 8). To achieve this, South East Water is partnering with Mornington Peninsula Shire Council and Melbourne Water to support healthier waterways and environment by implementing a septic tank monitoring program. By improving management of septics, it is preventing groundwater pollution from failing tanks. Greater engagement with septic tank owners is helping to educate them about the importance of healthy sewer systems and their relationship to liveability outcomes for the community.
Promote efficient use of drinking water and increased use of alternative water sources with householders and businessesSouth East Water promoted the efficient use of drinking water through a number of channels, using the Target 155 program as a key message. These included South East Water’s website, on its bills and envelopes, through social media, and at community events. The high water use campaign (see page 19) through social media supported the message that small behaviour changes can make a difference to water usage.
Through its annual Purple Press newsletter sent to customers with recycled water supply, South East Water encourages the use of the alternative resource and promotes the benefits of access to it and the positive effect it has on helping reduce demand on drinking water supplies.
Reporting on environmental flow recommendations and availability and delivery of environmental flow allocationsSouth East Water has water management strategies in place, including with the other metropolitan water utilities and Melbourne Water, to ensure all environmental flow obligations within the bulk entitlement framework for the Melbourne water supply system are met. Similarly, strategies exist to manage water allocations holdings in the Murray River and Goulburn System to maximise the value of the resources held to customers and minimise risk of spilling water allocation. These strategies include the transfer of allocations between bulk entitlement allocation accounts and trading water allocations.
Uniform drought response plan Permanent water saving (use) rules were in place for Melbourne at 30 June 2017. South East Water published its Drought Preparedness Plan, incorporating its Uniform Drought Response Plan, but the plan was not invoked in 2016–17. In accordance with the plan all metropolitan water corporations and Melbourne Water published an annual Water Outlook on 1 December 2016. It outlined a number of individual and joint industry short and medium-term actions to improve future drought response. During the year, 46 ML of desalinated water was delivered to Melbourne’s water supplies.

South East Water | Annual Report 2016–17 21
Other statutory obligations
Catchment Management StrategySouth East Water is a founding stakeholder of the Port Phillip and Westernport Catchment Management Authority (PPWCMA) Living Links catchment program. Living Links is a large-scale environmental and social project involving councils, government agencies and community groups working together to create a web of green spaces in Melbourne’s south east. It aims to improve the connections between the many parks, reserves, open spaces, coasts, beaches, pathways, rivers, creeks and wetlands to make this area a world-class urban ecosystem. Living Links is one of the key projects underpinning the regional catchment strategy to which South East Water actively contributes. In 2016–17, Living Links has achieved improved community connectivity, liveability and environmental outcomes across key project areas through delivering pest plant control across 37.4 ha of disturbed land, establishing 8.1 ha of long-term planted communities and hosting four community events.
Victorian Biodiversity StrategySouth East Water aims to continually improve environmental performance and contribute to protecting ecological biodiversity for present and future generations. As part of the corporation’s environmental initiatives, biodiversity assessments have been reviewed and a holistic Biodiversity Master Plan created for key sites where biodiversity values have been identified. The
Biodiversity Master Plan has been developed with the aim to preserve and improve the natural biota within the area South East Water has stewardship and to create an asset which is valued by the community. In 2016–17, South East Water improved the habitats for the southern brown bandicoot at its Koo Wee Rup Water Recycling Plant and the sugar glider at its Mt Martha Water Recycling Plant; initiated the rehabilitation of the Tootgarook wetlands at its site on Browns Road; and removed noxious weeds and planted indigenous species to improve waterway health along Deep Creek in Pakenham and Balcombe Creek in Mt Martha.
Victorian Waterway Management StrategySouth East Water complied with all its environmental obligations in regards to its bulk water entitlements. Additionally, the corporation played an active role with Melbourne Water to improve local waterway health through its improved septic tank management pilot program.
State Environmental Protection Policy (Waters of Victoria)South East Water actively contributed to the ongoing review by DELWP on the State Environmental Protection Policy (Waters of Victoria). The corporation participated in a number of workshops aimed at improving the policy clauses while also trialling a number of pilot projects to assist in the science that sits behind the development of this policy, such as the Elster Creek wet weather overflow study.
South East Water | Annual Report 2016–17 22
Environmental reporting
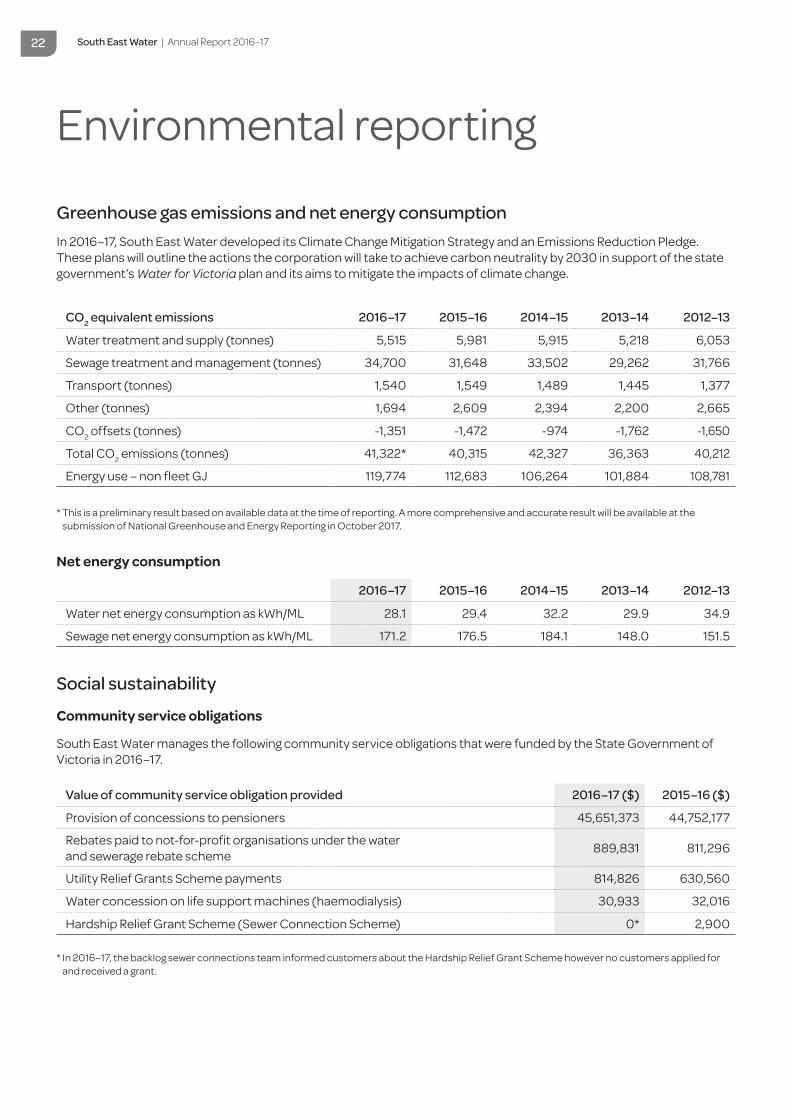
Greenhouse gas emissions and net energy consumption In 2016–17, South East Water developed its Climate Change Mitigation Strategy and an Emissions Reduction Pledge. These plans will outline the actions the corporation will take to achieve carbon neutrality by 2030 in support of the state government’s Water for Victoria plan and its aims to mitigate the impacts of climate change.
CO2 equivalent emissions 2016–17 2015–16 2014–15 2013–14 2012–13
Water treatment and supply (tonnes) 5,515 5,981 5,915 5,218 6,053
Sewage treatment and management (tonnes) 34,700 31,648 33,502 29,262 31,766
Transport (tonnes) 1,540 1,549 1,489 1,445 1,377
Other (tonnes) 1,694 2,609 2,394 2,200 2,665
CO2 offsets (tonnes) -1,351 -1,472 -974 -1,762 -1,650
Total CO2 emissions (tonnes) 41,322* 40,315 42,327 36,363 40,212
Energy use – non fleet GJ 119,774 112,683 106,264 101,884 108,781
* This is a preliminary result based on available data at the time of reporting. A more comprehensive and accurate result will be available at the
submission of National Greenhouse and Energy Reporting in October 2017.
Net energy consumption
2016–17 2015–16 2014–15 2013–14 2012–13
Water net energy consumption as kWh/ML 28.1 29.4 32.2 29.9 34.9
Sewage net energy consumption as kWh/ML 171.2 176.5 184.1 148.0 151.5
Social sustainability
Community service obligations
South East Water manages the following community service obligations that were funded by the State Government of Victoria in 2016–17.
Value of community service obligation provided 2016–17 ($) 2015–16 ($)
Provision of concessions to pensioners 45,651,373 44,752,177
Rebates paid to not-for-profit organisations under the water and sewerage rebate scheme 889,831 811,296
Utility Relief Grants Scheme payments 814,826 630,560
Water concession on life support machines (haemodialysis) 30,933 32,016
Hardship Relief Grant Scheme (Sewer Connection Scheme) 0* 2,900
* In 2016–17, the backlog sewer connections team informed customers about the Hardship Relief Grant Scheme however no customers applied for and received a grant.
South East Water | Annual Report 2016–17 23
South East Water’s reporting requirements
Greater Yarra System – Thomson River Pool1,2
Desalinated water7,8
Goulburn System11,12
Murray River15,16
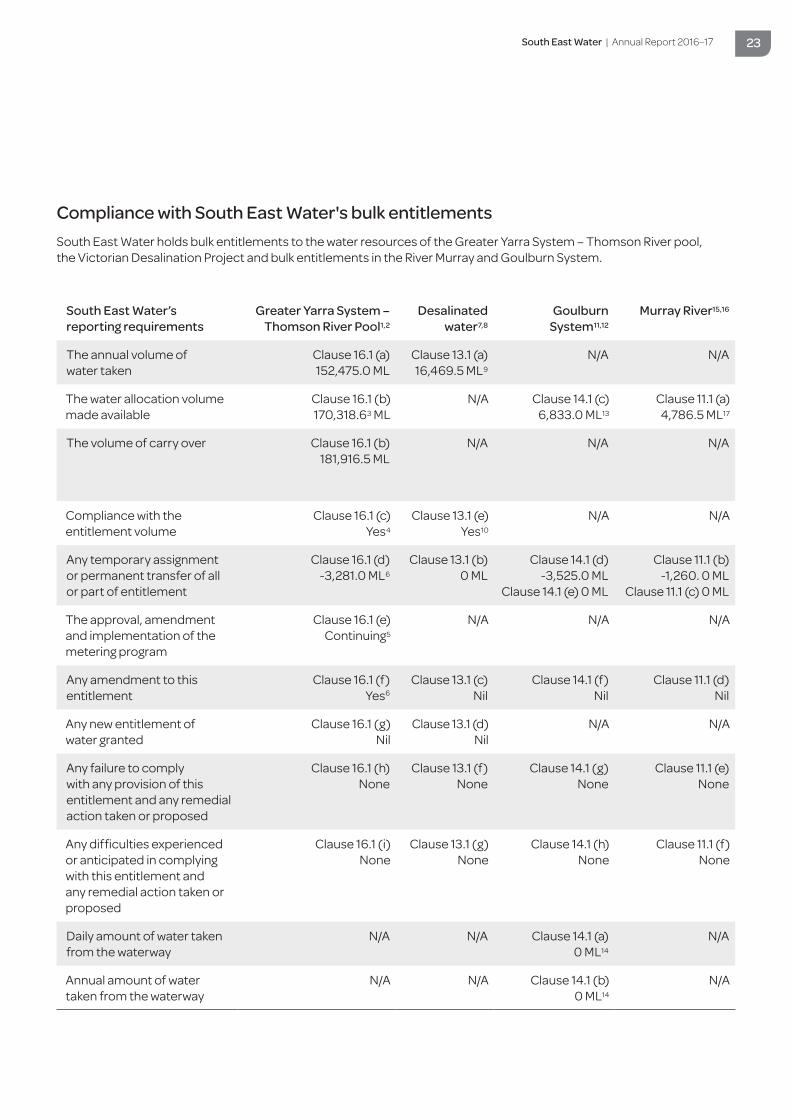
The annual volume of water taken
Clause 16.1 (a) 152,475.0 ML
Clause 13.1 (a) 16,469.5 ML9
N/A N/A
The water allocation volume made available
Clause 16.1 (b) 170,318.63 ML
N/A Clause 14.1 (c) 6,833.0 ML13
Clause 11.1 (a) 4,786.5 ML17
The volume of carry over Clause 16.1 (b) 181,916.5 ML
N/A N/A N/A
Compliance with the entitlement volume
Clause 16.1 (c) Yes4
Clause 13.1 (e) Yes10
N/A N/A
Any temporary assignment or permanent transfer of all or part of entitlement
Clause 16.1 (d) -3,281.0 ML6
Clause 13.1 (b) 0 ML
Clause 14.1 (d) -3,525.0 ML
Clause 14.1 (e) 0 ML
Clause 11.1 (b) -1,260. 0 ML
Clause 11.1 (c) 0 ML
The approval, amendment and implementation of the metering program
Clause 16.1 (e) Continuing5
N/A N/A N/A
Any amendment to this entitlement
Clause 16.1 (f) Yes6
Clause 13.1 (c) Nil
Clause 14.1 (f) Nil
Clause 11.1 (d) Nil
Any new entitlement of water granted
Clause 16.1 (g) Nil
Clause 13.1 (d) Nil
N/A N/A
Any failure to comply with any provision of this entitlement and any remedial action taken or proposed
Clause 16.1 (h) None
Clause 13.1 (f) None
Clause 14.1 (g) None
Clause 11.1 (e) None
Any difficulties experienced or anticipated in complying with this entitlement and any remedial action taken or proposed
Clause 16.1 (i) None
Clause 13.1 (g) None
Clause 14.1 (h) None
Clause 11.1 (f) None
Daily amount of water taken from the waterway
N/A N/A Clause 14.1 (a) 0 ML14
N/A
Annual amount of water taken from the waterway
N/A N/A Clause 14.1 (b) 0 ML14
N/A
Compliance with South East Water's bulk entitlementsSouth East Water holds bulk entitlements to the water resources of the Greater Yarra System – Thomson River pool, the Victorian Desalination Project and bulk entitlements in the River Murray and Goulburn System.
South East Water | Annual Report 2016–17 24
Environmental reporting
Notes for compliance with bulk entitlements
Greater Yarra System – Thomson River Pool1. South East Water holds Bulk Entitlement (Greater Yarra
System–Thomson River Pool – South East Water) Order 2014 – WSE000077.
2. South East Water is a primary entitlement holder with a delivery bulk entitlement to 206,281.0 ML.
3. The Resource Manager – Melbourne Water makes seasonal allocations monthly.
4. Compliance with the entitlement volume is measured by compliance with the overall cap within the source entitlements for the Thomson and Yarra systems (held by Melbourne Water). The caps were complied with. Further, South East Water understands that Melbourne Water has meet all minimum environmental flow obligations contained in its source entitlements.
5. Metering programs for this bulk entitlement are continually maintained and reviewed via the Bulk Water Supply Agreement between South East Water and Melbourne Water and System Management Rules established by Melbourne Water.
6. On 1 June 2017, South East Water’s bulk entitlement WSE000077 was amended by Order to give the Victorian Environmental Water Holder a 3.9 per cent share of inflow into the Thomson Reservoir and an additional 8 GL of storage capacity. South East Water’s share of that equated to a reduction of its entitlement within the Greater Yarra System – Thomson River Pool entitlement by 3,281.0 ML. In June 2016, the state reached consensus with South East Water and the other Melbourne retailers to reduce its entitlement by 3,281 ML to provide additional environmental resources in the Thomson River.
Victorian Desalination Project7. South East Water holds Bulk Entitlement (Desalinated
Water – South East Water) Order 2014 – WSE000053.
8. South East Water may take an average annual volume of up to 53,454 ML of desalinated water over any period of five consecutive years that is delivered to a delivery point to the Melbourne headworks system.
9. In March 2016, the Hon Lisa Neville MP, Minister for Environment, Climate Change and Water made a 50 GL desalinated water order for the 2016–17 year, of which South East Water's share is 17,818 ML. As of 30 June 2017, 16,469.5 ML was delivered to South East Water's system. On 16 May 2017, the Minister for Water announced a further water order of 15 GL to be delivered during 2017–18.
10. Compliance with the entitlement volumes is measured with respect to whether the annual volume taken exceeds the entitlement. This did not occur this year.
Goulburn System11. South East Water holds Bulk Entitlement (Goulburn
System – South East Water) Conversion Order 2012 – WSE000009.
12. South East Water is entitled to a water entitlement in the Goulburn System equal to one-ninth of the total Phase 4 water savings achieved in the Goulburn component of the Goulburn Murray Irrigation District (GMID) from Goulburn Murray Water Connections Project Stage 1 as verified in the latest audit.
13. South East Water’s annual water allocation in a given year from the Goulburn System is equal to one-ninth of the total Phase 3 water savings achieved in the previous year of the Goulburn component of the GMID from the Goulburn Murray Water Connections Project Stage 1 as verified in the latest audit.
14. Diversion limits are specified in Clause 9 of the Bulk Entitlement.
Murray River15. South East Water holds Bulk Entitlement (Murray
River – South East Water) Conversion Order 2012 – WSE000133.
16. South East Water is entitled to a water entitlement volume in the following parts of the River Murray System equal to one-ninth of the total Phase 4 water savings achieved in these parts of the GMID from Goulburn Murray Water Connections Project Stage 1 as verified in the latest audit:
• Trading zone 6 • Trading zone 7.
17. South East Water’s annual water allocation in a given year from the River Murray is equal to one-ninth of the total Phase 3 water savings achieved in the previous year of the Goulburn component of the GMID from the Goulburn Murray Water Connections Project Stage 1 as verified in the latest audit.
South East Water has in place water management strategies to manage water allocations holdings in the Murray River and Goulburn System to maximise the value of the resources held to our customers and minimise risk of spilling water allocation. These strategies include the transfer of allocations between bulk entitlement allocation accounts and trading water allocations.

South East Water | Annual Report 2016–17 25
Corporate governance
Organisational chart at 30 June 2017
Finance Assurance and Risk Management
Committee
iota Services
Board
Service Delivery
Committee
People, Remuneration and Safety Committee
Terri BensonManaging Director
Keith JohnsonActing General Manager Infrastructure
Phil JohnsonChief Financial Officer and General Manager Corporate and Commercial
Charlie LittlefairGeneral Manager Asset Creation
Mark McCormackGeneral Manager Network Services
Claire MillerGeneral Counsel and Corporate Secretary
Hamish ReidActing General Manager Strategy and Acting General Manager iota Services
Sharon RobinsonActing General Manager Customer
Leanne WiebengaActing General Manager People and Safety
Board of Directors
South East Water | Annual Report 2016–17 26
Gabrielle BellBLaws (Hons), BEng (Chem) (Hons), GAICD
Deputy ChairMs Bell was appointed as a Director of South East Water in October 2015 and is Chair of South East Water’s People, Remuneration and Safety Committee. Ms Bell is a corporate lawyer with broad experience working in Australia and Southeast Asia. She specialises in corporate advisory (including corporate governance), mergers and acquisitions and capital markets. She is also a Director of V/Line Corporation and InLife Independent Living Ltd. Ms Bell was a Director of Southern Rural Water from October 2012 to September 2015.
W Peter Day LLb (Hons), MBA, FCA, FCPA, FAICD
DirectorMr Day was appointed as a Director of South East Water in October 2015. Mr Day previously held executive positions as Chief Financial Officer of Amcor, Chief Financial Officer and Executive Director at Bonlac Foods and Managing Director Business Services with Rio Tinto. He is currently a non-executive Director of a number of ASX listed companies including Alumina, Ansell, Australian Unity Office Fund and Boart Longyear. Mr Day was a Director of Gippsland Water from October 2008 to September 2015. He is also involved in not-for-profit activities for disability services and financial education mentoring.
Lucia CadeBEng (Civil) (Hons), BEc, MEngSc, MBA, FAICD, FIEAust
ChairMs Cade was appointed as Chair of South East Water in October 2015. She has extensive experience in the utility, infrastructure and construction industries as a director, executive and an advisor, specialising in business strategy, organisational change, strategic stakeholder engagement, incentivised procurement models and major projects. Ms Cade is Chair of Australian WaterSecure Innovations Ltd and a Director of the Energy Pipelines Co-operative Research Centre. She is a member of the Value Assessment Panel of the University of Melbourne School of Engineering and is a Global Advisor to the UN Global Compact Cities Programme, based at RMIT. She was formerly Chair of Western Water and National President of the Australian Water Association.
Tony Beach MAICD, MIE Aust, BEng (Civil)
DirectorMr Beach was appointed as a Director of South East Water in October 2013 and reappointed in October 2015 and is Chair of South East Water’s Service Delivery Committee. His executive career included roles as the foundation Managing Director of the Zinfra Group and he also undertook key executive management roles with Jemena, Asciano, AGL, Powercor Australia and HEC Tasmania. Mr Beach has extensive experience in essential infrastructure across electricity, gas, water, rail and ports and provides strategic advisory and non-executive director services via his role as the Managing Principal of Phase 10 Consulting Ltd.
Directors’ biographies
Corporate governance

South East Water | Annual Report 2016–17 27
Timothy LyonsBA, DipFinSvcs, GAICD
DirectorMr Lyons was appointed as a Director of South East Water in October 2015. Mr Lyons is a qualified and experienced company Director with an extensive track record in governance, accountability and risk management. His most recent role was Assistant Secretary at Australian Council of Trade Unions. Mr Lyons is a Trustee Director at HOSTPLUS Super Fund and a Research Fellow at Per Capita. He has also served on several other boards including LUCRF Super, HESTA Super Fund, The Union Education Foundation Ltd and Industry Super Australia Pty Ltd.
Freya MarsdenMComm, BAgResEc, GAICD
DirectorMs Marsden was appointed as a Director of South East Water in October 2015 and is Chair of South East Water’s Finance Assurance and Risk Management Committee. Ms Marsden is the Managing Director of The Acuity Group which provides governance, strategy, policy and economic advice. She has held senior advisory and economist roles across state and federal governments and Federal Parliament and is a former Director of Policy at the Business Council of Australia. An experienced non-executive Director Ms Marsden’s other current boards include the Victorian Planning Authority (Director and Chair of Risk and Audit), Chair of the Victorian Government’s Sustainability Fund, Committee Member of VicRoads Risk, Audit and Governance Committee, non-executive director of Brotherhood of St Laurence and Deputy Chair of the David Scott School Council.
Kim McGrathBLaws, BA, GAICD
DirectorMs McGrath was appointed as a Director of South East Water in October 2015. Ms McGrath is Principal Consultant at BKE Consulting, a public policy advisory and research service. She has over 20 years’ experience in public policy formulation and implementation at international, federal and state levels including eight years as water policy adviser to the Premier of Victoria. She has provided strategic advice, research, policy development, writing and editorial services to governments, private companies, universities and not-for-profit organisations. She is currently a doctoral candidate at Monash University. Ms McGrath has previously served on the board of South Gippsland Water.
Terri BensonBBus (Act), CPA, GAICD
Managing DirectorRefer to Ms Benson’s biography on page 28.
Directors’ biographies continued
South East Water | Annual Report 2016–17 28
Terri BensonBBus (Act), CPA, GAICD
Managing DirectorTerri was appointed Managing Director of South East Water in May 2017. A highly experienced Chief Executive Officer, she has held a range of both executive and non-executive director roles in the government utility and private infrastructure sectors. She is former CEO of SEQWater, a water wholesale utility in south-east Queensland, former Managing Director of Essential Energy and also former Chair of the Energy and Water Ombudsman NSW. Prior to joining South East Water, Terri was the Managing Director of Birdon, a diversified engineering and services business providing innovative solutions to the military and marine industries with operations across Australia, USA and Europe.
Keith JohnsonBEng (Civil), EWS, Grad Dip Mgt
Acting General Manager InfrastructureKeith leads the Infrastructure group, which is responsible for developing plans and systems to ensure the corporation’s assets meet the ongoing and future service needs of customers and stakeholders. He has extensive experience in the water industry in all facets of engineering commencing with State Rivers and Water Supply Commission and its successor authorities over a period of 40 years. Highlights have been working in the area of planning with Melbourne’s supply-demand strategy in 2006 and related collaborations across the industry. Keith joined South East Water in 1995.
Phil Johnson BBus (Acc), CPA, GAICD
Chief Financial Officer and General Manager Corporate and CommercialPhil is the Chief Financial Officer and leads the Corporate and Commercial group, which encompasses commercial services, business technology services, major projects, business improvement, quality and risk. He is also a director of iota Services, a wholly-owned subsidiary of South East Water. Previously, Phil was Group Manager, Commercial and Technical Services for Utility Services, an alliance formed between South East Water, Thiess and Siemens to deliver the corporation’s operations, maintenance and capital works program. He was also a member of the alliance governance board. Prior roles include other senior commercial positions within the utilities industry. Phil joined South East Water in 1995.
Charlie LittlefairBEng (Civil), FIEAust, CPEng, EngExec, NER APEC Eng, IntPE (NZ), MIPENZ, GAICD
General Manager Asset CreationCharlie leads the Asset Creation group, which manages the design and construction of South East Water built infrastructure assets, developer works and customer connection of new developer built assets. He also manages the handover of assets to Network Services. During 2016–17 Charlie was Acting General Manager iota Services from 23 December 2016 to 3 March 2017 and Acting Managing Director South East Water from 4 March 2017 to 28 May 2017. During this time, Rohan Ogier was Acting General Manager Asset Creation. Previously Charlie was General Manager, Asset Investment for Metrowater in Auckland. He has more than 30 years of international experience in the water and sewerage industry, having worked for both private and public water utility organisations in New Zealand, Australia and the United Kingdom. Charlie joined South East Water in 2008.
Executives’ biographies
Corporate governance

South East Water | Annual Report 2016–17 29
Executives’ biographies continued
Mark McCormack BEng (Civil), EWS, GAICD
General Manager Network ServicesMark leads the Network Services group, which oversees the operation and maintenance of South East Water’s water and sewer network, treatment plants and 24-hour emergency call centre. Previously he was the acting General Manager of the Utility Services ('us')alliance and a member of the alliance board, which delivered the corporation’s capital works and maintenance programs. He has more than 30 years of experience in the water industry working in roles encompassing design, construction, development, operations and maintenance. He commenced his career with the State Rivers and Water Supply Commission. Mark joined South East Water in 1995.
Claire Miller BA, LLB, MAICD, AGIA, ACIS
General Counsel and Corporate SecretaryClaire leads the Governance and Legal group which is responsible for the legal, compliance and corporate secretarial functions. Claire has extensive executive experience and has held the role of General Counsel and Company Secretary including the functions of compliance, risk, audit and insurance across a diverse range of industry sectors including energy, infrastructure, gas, utilities, mining, and property in government, listed and private entities. Claire was appointed General Counsel and Corporate Secretary in 2017.
Hamish ReidBSc (Hons), PhD, GAICD
Acting General Manager Strategy and Acting General Manager iota ServicesHamish leads the Strategy group, which encompasses strategy, regulation, corporate communications and public policy. Hamish also leads the iota Services group, which is a wholly-owned subsidiary of South East Water, and is responsible for the commercialisation of innovative technologies emanating from the operational needs of South East Water. iota is a distributor of engineered products and solutions serving the water, wastewater and utility sectors. Prior to these acting appointments, Hamish was the General Manager Customer and has previously held the role of General Manager Corporate Strategy and has held a range of water industry and government roles including with EPA Victoria and the New Zealand Ministry for the Environment. Hamish joined South East Water in 2005.
Sharon RobinsonBBus (Marketing and Management), GAICD
Acting General Manager CustomerSharon leads the Customer group which is responsible for delivering South East Water’s overarching customer strategy. She oversees key customer functions including customer contact centre, customer accounts and billing, customer engagement and experience, and the various digital channels that support these. Prior to this acting appointment, Sharon was the General Manager of People and Safety. She brings a wealth of experience in operations, organisational and leadership development, safety and human resources, gained across various industries including financial services, natural resource management, hospitality, retail franchising, consulting and engineering. She has held senior roles at Crown Melbourne Ltd, National Australia Bank and Arup Group. Sharon joined South East Water in 2012.
Leanne WiebengaExec Cert Bus (Mgt), CAHRI
Acting General Manager People and SafetyLeanne leads the People and Safety group, which includes South East Water’s operational and strategic functions of human resources, organisational development, diversity and inclusion, internal communications and safety and wellbeing. Prior to this acting appointment Leanne was the Group Manager, People, Strategy and Performance at South East Water. Leanne has held a number of senior positions and national roles in a range of public and private sectors including health, telecommunications, legal and local and state government and brings a diverse set of capabilities to the organisation. Leanne joined South East Water in 2010.
South East Water | Annual Report 2016–17 30
Corporate governance
The central role of the board is to set the corporation’s strategic direction and to preside over all significant strategic, commercial, regulatory, financial and risk-focused elements of the business.
The board is accountable for the good governance of the corporation including:
• setting the strategic objectives of the corporation
• risk management
• determining all material policies governing operations
• reviewing the progress and performance of the corporation against its strategic objectives.
The board is presently comprised of seven non-executive directors (following the resignation of Ross Passalaqua in February 2017) and an executive director, representing a diverse mix of skills, experience and backgrounds. The Board of Directors is appointed by the Minister for Water, in consultation with the Treasurer.
Director independenceThe board has considered the status of each non-executive director and is of the view that each non-executive director is independent, having no relationships or interests, business or otherwise, which could compromise their autonomy.
Independent adviceDirectors are entitled (with prior approval of the Chair or the Board) to obtain independent professional advice related to the discharge of their directors duties. All reasonable costs are reimbursed by South East Water.
Reporting to governmentThe board informs the government and relevant government departments of all major developments through:
• quarterly performance reports
• annual and half-yearly reports (each containing information about operations and financial and non- financial performance against key indicators)
• a detailed annual corporate plan in accordance with section 247 of the Water Act 1989
• direct contact between the chair, managing director and government representatives on key issues
• frequent communication at an executive level on performance, industry and policy issues
• annual board performance evaluation.
Board performanceSouth East Water is required to evaluate the board’s performance annually under the Public Administration Act 2004 and its Statement of Obligations.
The board conducts an annual assessment of its performance and effectiveness, as well as of its committees and individual directors. As part of this review, a survey was completed by all directors and members of the executive and individual interviews were conducted. Each director participates in an individual interview with the Chair. The performance of each committee is discussed and reviewed as part of the board’s annual assessment.
External experts are engaged as required to review aspects of the board's activities and assist in continuous improvement process and the results are compiled and a written report provided to the Chair.
The Board of Directors
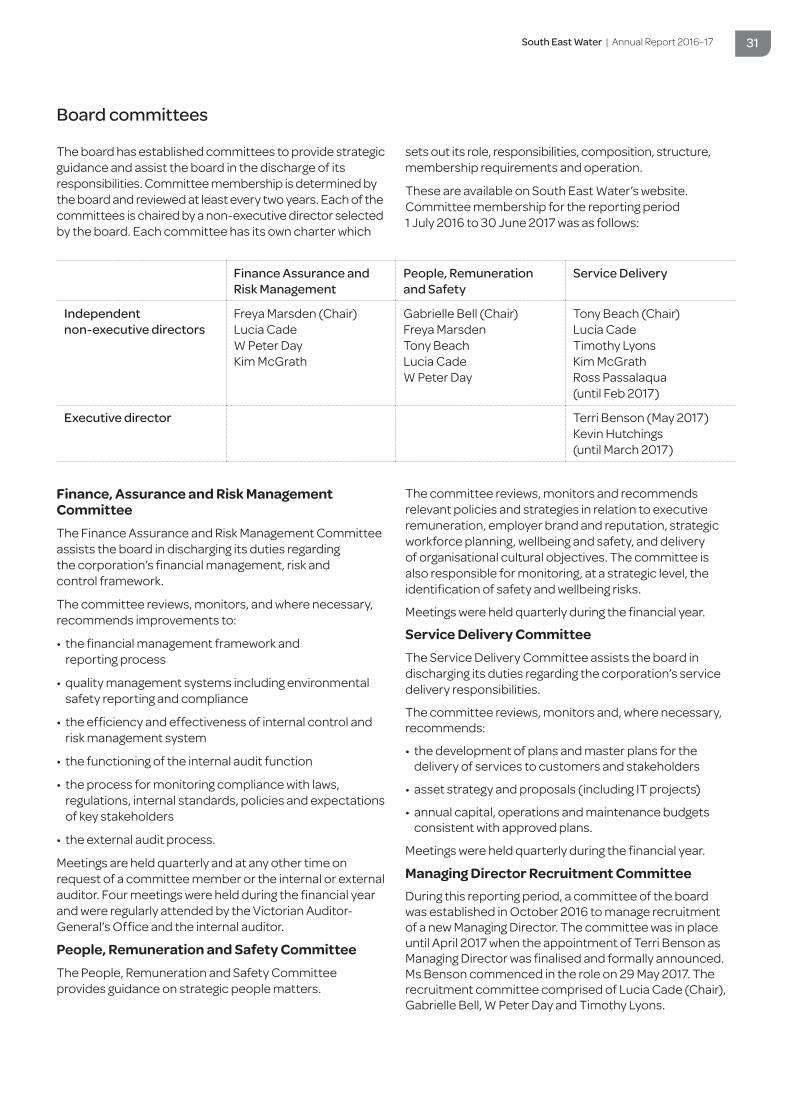
South East Water | Annual Report 2016–17 31
The board has established committees to provide strategic guidance and assist the board in the discharge of its responsibilities. Committee membership is determined by the board and reviewed at least every two years. Each of the committees is chaired by a non-executive director selected by the board. Each committee has its own charter which
sets out its role, responsibilities, composition, structure, membership requirements and operation.
These are available on South East Water’s website. Committee membership for the reporting period 1 July 2016 to 30 June 2017 was as follows:
Finance, Assurance and Risk Management CommitteeThe Finance Assurance and Risk Management Committee assists the board in discharging its duties regarding the corporation’s financial management, risk and control framework.
The committee reviews, monitors, and where necessary, recommends improvements to:
• the financial management framework and reporting process
• quality management systems including environmental safety reporting and compliance
• the efficiency and effectiveness of internal control and risk management system
• the functioning of the internal audit function
• the process for monitoring compliance with laws, regulations, internal standards, policies and expectations of key stakeholders
• the external audit process.
Meetings are held quarterly and at any other time on request of a committee member or the internal or external auditor. Four meetings were held during the financial year and were regularly attended by the Victorian Auditor-General’s Office and the internal auditor.
People, Remuneration and Safety CommitteeThe People, Remuneration and Safety Committee provides guidance on strategic people matters.
The committee reviews, monitors and recommends relevant policies and strategies in relation to executive remuneration, employer brand and reputation, strategic workforce planning, wellbeing and safety, and delivery of organisational cultural objectives. The committee is also responsible for monitoring, at a strategic level, the identification of safety and wellbeing risks.
Meetings were held quarterly during the financial year.
Service Delivery CommitteeThe Service Delivery Committee assists the board in discharging its duties regarding the corporation’s service delivery responsibilities.
The committee reviews, monitors and, where necessary, recommends:
• the development of plans and master plans for the delivery of services to customers and stakeholders
• asset strategy and proposals (including IT projects)
• annual capital, operations and maintenance budgets consistent with approved plans.
Meetings were held quarterly during the financial year.
Managing Director Recruitment CommitteeDuring this reporting period, a committee of the board was established in October 2016 to manage recruitment of a new Managing Director. The committee was in place until April 2017 when the appointment of Terri Benson as Managing Director was finalised and formally announced. Ms Benson commenced in the role on 29 May 2017. The recruitment committee comprised of Lucia Cade (Chair), Gabrielle Bell, W Peter Day and Timothy Lyons.
Board committees
Finance Assurance and Risk Management
People, Remuneration and Safety
Service Delivery
Independent non-executive directors
Freya Marsden (Chair)Lucia CadeW Peter DayKim McGrath
Gabrielle Bell (Chair)Freya MarsdenTony BeachLucia CadeW Peter Day
Tony Beach (Chair)Lucia CadeTimothy LyonsKim McGrathRoss Passalaqua (until Feb 2017)
Executive director Terri Benson (May 2017)Kevin Hutchings (until March 2017)
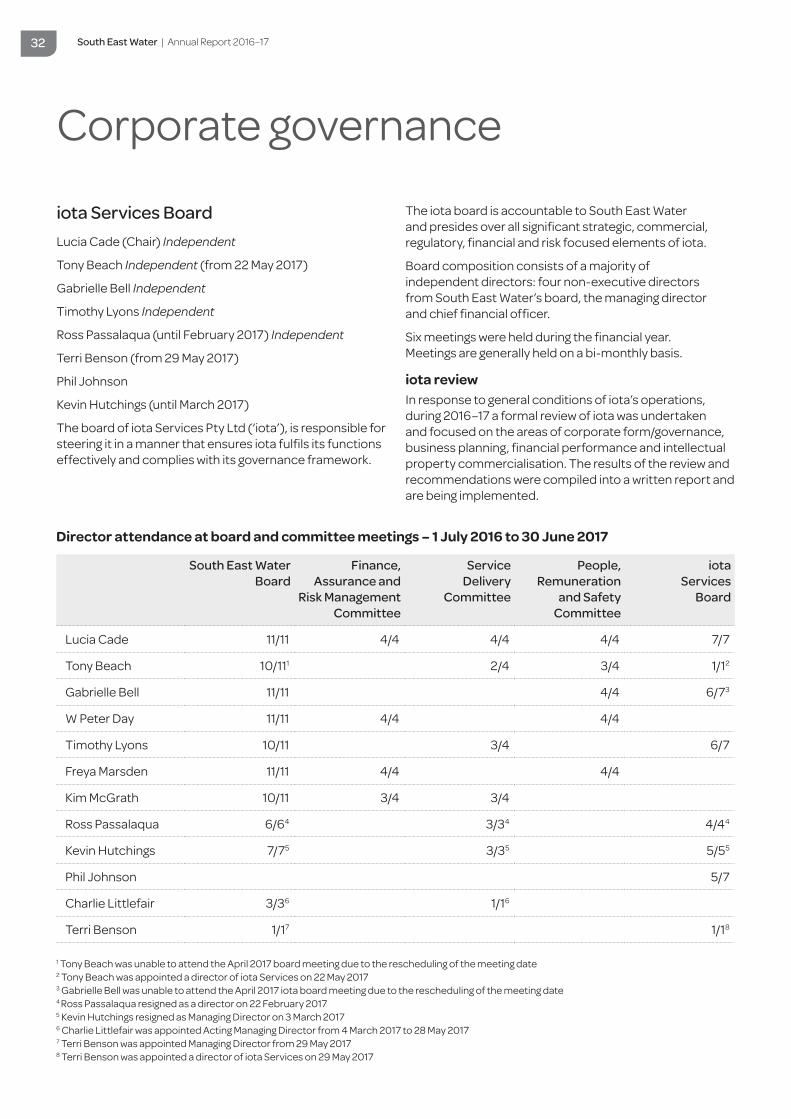
South East Water | Annual Report 2016–17 32
Corporate governance
Director attendance at board and committee meetings – 1 July 2016 to 30 June 2017
South East Water Board
Finance, Assurance and
Risk Management Committee
Service Delivery
Committee
People, Remuneration
and Safety Committee
iota Services
Board
Lucia Cade 11/11 4/4 4/4 4/4 7/7
Tony Beach 10/111 2/4 3/4 1/12
Gabrielle Bell 11/11 4/4 6/73
W Peter Day 11/11 4/4 4/4
Timothy Lyons 10/11 3/4 6/7
Freya Marsden 11/11 4/4 4/4
Kim McGrath 10/11 3/4 3/4
Ross Passalaqua 6/64 3/34 4/44
Kevin Hutchings 7/75 3/35 5/55
Phil Johnson 5/7
Charlie Littlefair 3/36 1/16
Terri Benson 1/17 1/18
1 Tony Beach was unable to attend the April 2017 board meeting due to the rescheduling of the meeting date2 Tony Beach was appointed a director of iota Services on 22 May 20173 Gabrielle Bell was unable to attend the April 2017 iota board meeting due to the rescheduling of the meeting date4 Ross Passalaqua resigned as a director on 22 February 20175 Kevin Hutchings resigned as Managing Director on 3 March 20176 Charlie Littlefair was appointed Acting Managing Director from 4 March 2017 to 28 May 20177 Terri Benson was appointed Managing Director from 29 May 20178 Terri Benson was appointed a director of iota Services on 29 May 2017
iota Services Board Lucia Cade (Chair) Independent
Tony Beach Independent (from 22 May 2017)
Gabrielle Bell Independent
Timothy Lyons Independent
Ross Passalaqua (until February 2017) Independent
Terri Benson (from 29 May 2017)
Phil Johnson
Kevin Hutchings (until March 2017)
The board of iota Services Pty Ltd (‘iota’), is responsible for steering it in a manner that ensures iota fulfils its functions effectively and complies with its governance framework.
The iota board is accountable to South East Water and presides over all significant strategic, commercial, regulatory, financial and risk focused elements of iota.
Board composition consists of a majority of independent directors: four non-executive directors from South East Water’s board, the managing director and chief financial officer.
Six meetings were held during the financial year. Meetings are generally held on a bi-monthly basis.
iota reviewIn response to general conditions of iota’s operations, during 2016–17 a formal review of iota was undertaken and focused on the areas of corporate form/governance, business planning, financial performance and intellectual property commercialisation. The results of the review and recommendations were compiled into a written report and are being implemented.
South East Water | Annual Report 2016–17 33
South East Water maintains a comprehensive framework of governance practices designed to provide appropriate levels of review and oversight. These practices derive principally from statutory requirements and good governance guidelines and are embedded throughout the corporation.
South East Water management systems underpin the corporation’s performance. The management systems, frameworks and standards are subject to independent auditing and certification, including:
• ISO 9001 (Quality Management System)• ISO 14001 (Environment Management System)• AS/NZS 4801 (Occupational Health and Safety)• Hazard Analysis and Critical Control Point (HACCP)
for drinking water and recycled water management• ISO 22000 (Food Safety Management) for sewage
quality management.
South East Water also aligns to ISO 31000 (Risk Management) and ISO 19600 (Compliance Management System).
South East Water’s management systems are also fundamental to providing appropriate levels of assurance and accountability across the corporation and perform a key role in ensuring the processes and controls against strategic and operational risks are functioning effectively. South East Water has strengthened its overarching view of assurance against its risk profile by including an internal attestation over the management of its material risks at both board and executive management to ensure an appropriate level of risk governance.
South East Water is committed to continually improving the quality of its operating systems, ISO 55001 (Asset Management) and ISO 27001 (Information Security Management)/Victorian Protective Data.
As a business, South East Water faces many uncertainties that challenge the achievement of its strategic objectives. The corporation identifies major risk exposures using an enterprise-wide risk management process based on the AS/NZS ISO 31000:2009 Risk Management Standard and
the Victorian Government Risk Management Framework. The following describes, at a whole of entity level, South East Water’s material risk areas (in no particular order) and how the corporation seeks to manage them.
Governance and management arrangements
South East Water’s material risks
Risk area Description and plans to manage
Safety and wellbeing
To reduce serious workplace injury which may be physical, mental, health or wellbeing related.
• South East Water believes safety and wellbeing are not just important, they are absolutely essential. The corporation is always improving its certified safety management system and has a comprehensive wellbeing program aimed at improving employee health.
Water quality To provide safe drinking water that meets expectations of customers and complies with regulatory obligations.
• South East Water’s vision is to provide healthy water for life. This underpins everything the corporation does so its focus in this area is strong, comprising a number of quality management systems, frameworks and standards the corporation abides by and that are subject to stringent audit.
South East Water | Annual Report 2016–17 34
Risk area Description and plans to manage
Customer and our communities
To better understand the customers and the communities South East Water serves (and for them to better understand its services) and to provide them with a positive experience that meets their expectations.
• South East Water’s customer engagement and research program informs its strategies on how to improve services in areas that matter most to customers. It has in place a number of key programs that strive to constantly deliver value for money and enhanced outcomes for the entire customer base.
People To attract, recruit and retain the right people for the right role to take South East Water forward and help achieve its strategic goals.
• As the needs of the business evolve, the corporation has committed to initiatives that continually improve culture, capability and diversity and inclusion practices so that South East Water develops its people and attracts high calibre talent.
IT/OT and data security
To effectively manage the information technology and operational technology (IT/OT) assets that underpins business operations and to protect customer and corporate data in line with regulatory and customer expectations.
• IT/OT infrastructure is managed to an asset management plan to ensure the stability and reliability of all platforms. South East Water aligns its data security to the Victorian Protective Data Security Standards and already has in place mandatory data security awareness training and network controls to protect the data it stores.
Asset management
To plan, build, operate and maintain assets reliably and efficiently to meet the service expectations of customers.
• South East Water has in place comprehensive asset management plans and constantly monitors asset condition. The corporation is driving further improvement in this area by aligning its practices to ISO 55001:2014 Asset Management.
Regulatory environment and stakeholder management
To respond and influence the regulatory and policy environment to outcomes aligned to strategic goals, with the proactive and consistent engagement of key stakeholders.
• South East Water has fostered and continues to develop strong relationships with key stakeholders, built on a platform of transparency and trust. Its underlying approach is to engage in a constructive and collaborative manner to achieve positive solutions for customers.
Climate change To understand and plan for the impacts of a changing climate on assets and effectively transition to a carbon-free future.
• Climate change is real and South East Water has developed adaptation and mitigation plans for its assets and business operations. The corporation is committed to carbon reduction and anticipates to make its pledge on greenhouse gas emissions in 2017–18.
Disruption and non-traditional markets
To be able to adapt South East Water’s business and positively respond to major changes in industry composition, technology or consumer behaviours.
• The corporation has a long and proud history of innovation and continues to monitor shifts inside (and outside of) the industry and trial emerging technologies. The Aquarevo development and establishment of iota are just two examples of how South East Water challenges the conventional approach of a regulated water business.
Organisational resilience
To effectively manage and learn from planned or unplanned significant impact events that disrupt the services provided to customers.
• South East Water has in place a comprehensive continuity framework that comprises of business continuity plans, incident and emergency management response as well as crisis management procedures to help prevent service interruptions and to respond and recover in the event they do occur.
Note: Ensuring the financial sustainability and management of South East Water is also fundamental to its ongoing viability. For details on how South East Water manages its various financial risk factors, please refer to the financial risk management objectives and policies as part of the ‘Notes to the financial statements’.
Corporate governance

South East Water | Annual Report 2016–17 35
Occupational health and safetyThe launch of the new Safety and Wellbeing Policy established a commitment to a safe and healthy workplace with a fair and just culture, with a clear aspiration to achieve a workplace that is free from harm to people. The Safety and Wellbeing Strategy focuses on operational risk, industry collaboration and growth of a resilient safety culture. The Living Safely Rules are a key element of the Safety and Wellbeing Strategy, highlighting the 10 highest risk work activities conducted by South East Water employees and contractors. They describe the behavioural standards expected of all who work for South East Water. All employees and contractors received training in the Living Safely Rules.South East Water developed its first ‘safety case’ for the Mt Martha Water Recycling Plant, a risk management document that is used to facilitate continuous improvement and develop annual risk management action plans. The safety case approach will be progressively adopted across the corporation.
Performance against occupational health and safety management measures
Measure KPI 2014–15 2015–16 2016–17
Incidents*Number of reported incidentsRate per 100 FTE
50.92
152.51
50.81
HazardsNumber of reported hazardsRate per 100 FTE
41375.71
49783.32
36058.57
Claims (WorkCover)
Number of standard claimsRate per 100 FTENumber of lost time claimsRate per 100 FTE
00.010.20
10.1940.76
40.6530.49
Fatalities Fatality claims nil nil nil
Claim costs Average cost per standard claim $8,500 $8,071 $53,216
Management commitment Management participation in planned safety observations 26 59 199
Consultation and participation OH&S committee meetings including employee elected and management representatives 11 12 12
Risk management Safety management system audit actions closed 100% 100% 100%
Training Safety compliance training completed within 10 days of commencement 94.60% 96% 100%
Note: information based on South East Water employee data only.* Incidents include the sum of LTI, MTI and RWI for the year for South East Water employee data only.
Performance against occupational health and safety indicatorsA continued focus on open reporting of hazards and close calls saw hazard reporting exceed its annual target by 55 per cent. South East Water’s safety performance improved upon the previous financial year with 18 per cent fewer recordable injuries (excluding restricted work injuries). Five recordable incidents were reported by South East Water employees for the year which represents a significant improvement on the 15 incidents reported in the previous year. Six lost time injuries (LTIs) were recorded for the year combining South East Water and contractor performance data. There were nine LTIs in the previous year. The lost time injury frequency was 2.9 injuries per million work hours. Safety performance improvement was driven by leadership commitment, heightened safety awareness through the Living Safely Rules and full commitment to collaboration with South East Water’s contractors. South East Water did not achieve its target of zero lost time injuries for the year. There were four accepted WorkCover claims in the year with average costs of $53,216 compared with five claims last year with average costs of $8,701.
Workforce data

South East Water | Annual Report 2016–17 36
Workforce dataApplication of employment conduct principlesSouth East Water has a comprehensive Employment and Conduct Policy Framework. This was established to provide clarity of expectations to employees and operates in alignment with public sector values. South East Water’s obligation to ensure all employees are familiar with the policy framework and their application is met by ensuring policies are read and understood during the on-boarding process and by conducting education sessions throughout the year and refreshment training each two years. Each employment policy is reviewed on an annual basis in collaboration and consultation with relevant employee groups and other key stakeholders. The policy framework is guided by legislation including the Public Administration Act 2004, to ensure compliance and alignment with the public sector. The policy framework ensures equal employment opportunity for all employees.
Workforce composition data South East Water’s total FTE has increased from 560.8 FTE to 567 FTE.
Full time equivalents (FTE) staffing trends from 2015 to 2017
2017 2016 2015
567.0 560.8 525.2
Employment levels in June of 2016 and 2017
Ongoing employees Fixed term and casual
Employees (headcount)
Fulltime (headcount)
Part time (headcount) FTE FTE
Jun 17 569 469 100 536.9 30.1
Jun 16 569 483 86 538.4 22.4
June 2017
Classification Total (headcount) Female Male Female % Male %
Executive 7 3 4 43 57
Group managers 16* 2 14 12 88
Senior officers 123 30 93 24 76
June 2016
Classification Total (headcount) Female Male Female % Male %
Executive 9 1 8 11 89
Group managers 17 3 14 18 82
Senior officers 119 25 94 21 79
Details of gender distribution in management positions in June 2016 and 2017
Aims for gender parity The first year implementation of South East Water’s Diversity and Inclusion Framework has supported moves towards gender parity. Two key enablers include the updating of the Recruitment and Selection Policy. A new shortlisting process sets the expectation that all positions will have a balanced shortlist consisting of 50 per cent female and 50 per cent male applicants. Secondly, the introduction of diverse interview panels consisting of both female and male representatives is now an expected practice.
*Two group managers were acting in executive positions at 30 June 2017, however have been classified here in their substantive roles.
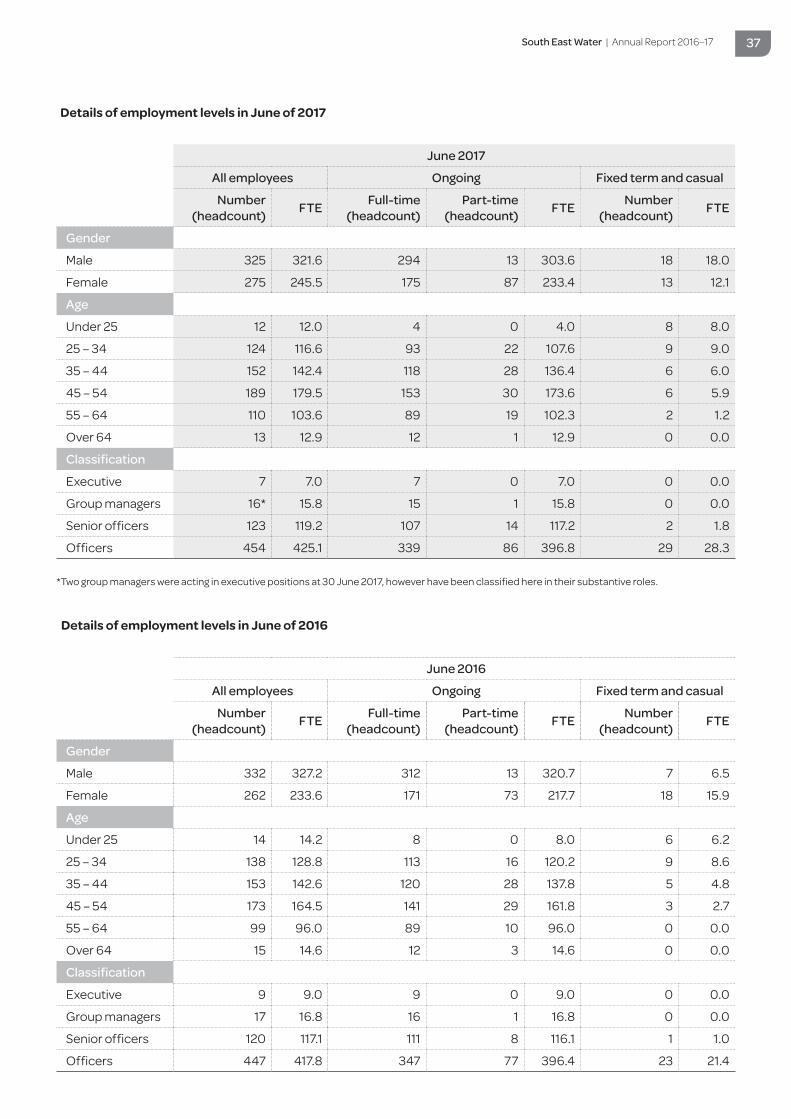
South East Water | Annual Report 2016–17 37
June 2017
All employees Ongoing Fixed term and casual
Number (headcount) FTE Full-time
(headcount)Part-time
(headcount) FTE Number (headcount) FTE
Gender
Male 325 321.6 294 13 303.6 18 18.0
Female 275 245.5 175 87 233.4 13 12.1
Age
Under 25 12 12.0 4 0 4.0 8 8.0
25 – 34 124 116.6 93 22 107.6 9 9.0
35 – 44 152 142.4 118 28 136.4 6 6.0
45 – 54 189 179.5 153 30 173.6 6 5.9
55 – 64 110 103.6 89 19 102.3 2 1.2
Over 64 13 12.9 12 1 12.9 0 0.0
Classification
Executive 7 7.0 7 0 7.0 0 0.0
Group managers 16* 15.8 15 1 15.8 0 0.0
Senior officers 123 119.2 107 14 117.2 2 1.8
Officers 454 425.1 339 86 396.8 29 28.3
*Two group managers were acting in executive positions at 30 June 2017, however have been classified here in their substantive roles.
Details of employment levels in June of 2017
June 2016
All employees Ongoing Fixed term and casual
Number (headcount) FTE Full-time
(headcount)Part-time
(headcount) FTE Number (headcount) FTE
Gender
Male 332 327.2 312 13 320.7 7 6.5
Female 262 233.6 171 73 217.7 18 15.9
Age
Under 25 14 14.2 8 0 8.0 6 6.2
25 – 34 138 128.8 113 16 120.2 9 8.6
35 – 44 153 142.6 120 28 137.8 5 4.8
45 – 54 173 164.5 141 29 161.8 3 2.7
55 – 64 99 96.0 89 10 96.0 0 0.0
Over 64 15 14.6 12 3 14.6 0 0.0
Classification
Executive 9 9.0 9 0 9.0 0 0.0
Group managers 17 16.8 16 1 16.8 0 0.0
Senior officers 120 117.1 111 8 116.1 1 1.0
Officers 447 417.8 347 77 396.4 23 21.4
Details of employment levels in June of 2016

South East Water | Annual Report 2016–17 38
Workforce data
Income band (salary) Executives Group managers*^ Senior officers*^ Levels 1 – 5
<$160,000 7 6
$160,000 – 179,999 6 4
180,000 – 199,999 3
200,000 – 219,999
220,000 – 239,999 2
240,000 – 259,999 2
260,000 – 279,999 2
280,000 – 299,999
300,000 – 319,999
320,000 – 339,999
340,000 – 359,999 1
Total 7 16 10 0
Executive officer disclosure
Annualised total salary, by $20,000 bands, for executives and other senior non-executive staff.
Note: the salaries reported above are for the full financial year, at a 1-FTE rate, and excludes superannuation.^One group manager and one senior officer were employed on a part-time basis at an 0.8 FTE rate.* Three group managers were in long-term acting executive positions at a last pay run in June 2017. Substantive role and salary band reported.
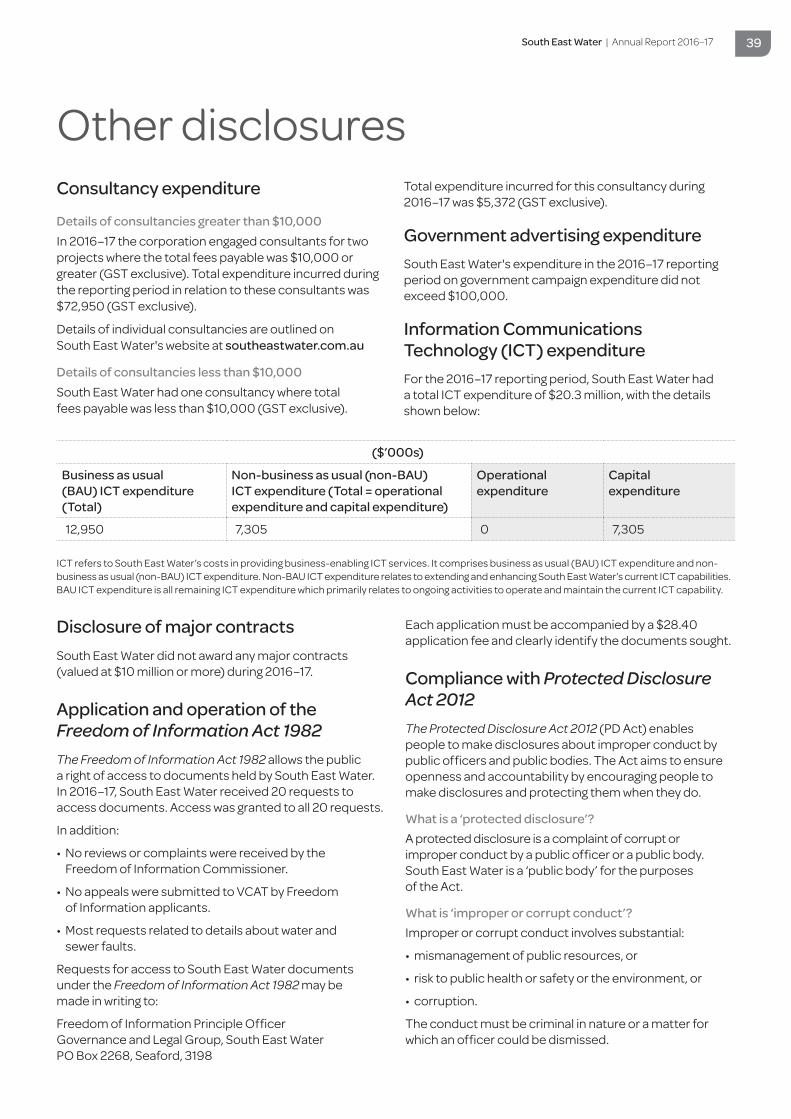
South East Water | Annual Report 2016–17 39
Other disclosures
Disclosure of major contractsSouth East Water did not award any major contracts (valued at $10 million or more) during 2016–17.
Application and operation of the Freedom of Information Act 1982 The Freedom of Information Act 1982 allows the public a right of access to documents held by South East Water. In 2016–17, South East Water received 20 requests to access documents. Access was granted to all 20 requests.
In addition:
• No reviews or complaints were received by the Freedom of Information Commissioner.
• No appeals were submitted to VCAT by Freedom of Information applicants.
• Most requests related to details about water and sewer faults.
Requests for access to South East Water documents under the Freedom of Information Act 1982 may be made in writing to:
Freedom of Information Principle Officer Governance and Legal Group, South East Water PO Box 2268, Seaford, 3198
Each application must be accompanied by a $28.40 application fee and clearly identify the documents sought.
Compliance with Protected Disclosure Act 2012 The Protected Disclosure Act 2012 (PD Act) enables people to make disclosures about improper conduct by public officers and public bodies. The Act aims to ensure openness and accountability by encouraging people to make disclosures and protecting them when they do.
What is a ‘protected disclosure’?A protected disclosure is a complaint of corrupt or improper conduct by a public officer or a public body. South East Water is a ‘public body’ for the purposes of the Act.
What is ‘improper or corrupt conduct’?Improper or corrupt conduct involves substantial:
• mismanagement of public resources, or
• risk to public health or safety or the environment, or
• corruption.
The conduct must be criminal in nature or a matter for which an officer could be dismissed.
($’000s)
Business as usual (BAU) ICT expenditure(Total)
Non-business as usual (non-BAU) ICT expenditure (Total = operational expenditure and capital expenditure)
Operational expenditure
Capital expenditure
12,950 7,305 0 7,305
ICT refers to South East Water’s costs in providing business-enabling ICT services. It comprises business as usual (BAU) ICT expenditure and non-business as usual (non-BAU) ICT expenditure. Non-BAU ICT expenditure relates to extending and enhancing South East Water’s current ICT capabilities. BAU ICT expenditure is all remaining ICT expenditure which primarily relates to ongoing activities to operate and maintain the current ICT capability.
Consultancy expenditure
Details of consultancies greater than $10,000In 2016–17 the corporation engaged consultants for two projects where the total fees payable was $10,000 or greater (GST exclusive). Total expenditure incurred during the reporting period in relation to these consultants was $72,950 (GST exclusive).
Details of individual consultancies are outlined on South East Water's website at southeastwater.com.au
Details of consultancies less than $10,000South East Water had one consultancy where total fees payable was less than $10,000 (GST exclusive).
Total expenditure incurred for this consultancy during 2016–17 was $5,372 (GST exclusive).
Government advertising expenditure South East Water's expenditure in the 2016–17 reporting period on government campaign expenditure did not exceed $100,000.
Information Communications Technology (ICT) expenditureFor the 2016–17 reporting period, South East Water had a total ICT expenditure of $20.3 million, with the details shown below:
South East Water | Annual Report 2016–17 40
Other disclosuresHow do I make a ‘protected disclosure’?
You can make a protected disclosure about South East Water or its board members, officers or employees by contacting the Independent Broad-Based Anti-Corruption Commission on the contact details provided below. Please note that South East Water is not able to receive protected disclosures.
How can I access South East Water’s procedures for the protection of persons from detrimental action? South East Water has established procedures for the protection of persons from detrimental action in reprisal for making a protected disclosure about South East Water or its employees. You can access South East Water’s procedures on its website at southeastwater.com.au
Contact Independent Broad-Based Anti-Corruption Commission (IBAC) VictoriaLevel 1, North Tower, 459 Collins StreetMelbourne Victoria 3000IBAC, GPO Box 24234, Melbourne Victoria 3001ibac.vic.gov.au1300 735 135
Compliance with the Building Act 1993 South East Water owns one office in Frankston and operates warehousing facilities in Heatherton and Lynbrook and buildings associated with water recycling plants at Koo Wee Rup, Lang Lang, Longwarry, Somers, Blind Blight, Pakenham, Boneo, and Mt Martha.
South East Water complies with the Building Act 1993, the Building Regulations 2006 and associated statutory requirements and amendments. South East Water maintains internal control systems to ensure compliance with its Certificate of Occupancy and engages the expertise of qualified service providers to conduct regular weekly, monthly, quarterly and annual building inspection routines to ensure the building’s assets are efficiently maintained and to ensure the workplace is safe for occupants. Contractor compliance is closely monitored through the provision of maintenance reports and regular meeting communications.
South East Water completed two major projects in 2016–17 on the development and building owned by the corporation at a sum greater than $50,000:
• installation of solar panels at the headquarters in Frankston
• new retail tenancy fitout works at the headquarters in Frankston.
There were several building permits processed at the headquarters in Frankston including four occupancy permits for retail tenancies, four relating to fire services alterations and one for the proposed installation of a revolving door.
National Competition Policy Competitive neutrality seeks to enable fair competition between government and private sector businesses. Any advantages or disadvantages that government businesses may experience, simply as a result of government ownership, should be neutralised. South East Water continues to implement and apply this principle in its business undertakings.
Victorian Industry Participation Policy (VIPP) The Victorian Industry Participation Policy Act 2003 requires public sector bodies to report on the implementation of the Victorian Industry Participation Policy (VIPP). The VIPP aims to foster industry development by encouraging Victorian government departments and public bodies to genuinely consider Victorian, Australian and New Zealand supply.
During 2016–17, for metropolitan Melbourne, South East Water:
• registered one VIPP applicable project totalling $4 million
• commenced one VIPP procurement totalling $3.4 million.
The outcomes expected from the implementation of the VIPP projects include:
• an estimated 55 – 60 per cent local content committed to the project
• a total of seven jobs (Annualised Employee Equivalent (AEE) committed, encompassing the creation of seven new jobs.
The commitments to the Victorian economy in terms of skills and technology transfer include:
• training and knowledge transfer related to the development of new technologies around product manufacture and test of both subassemblies and final assembled product
• training to operators, technicians, test engineers, manufacturing engineers on general product, component quality, and evaluation
• new Intellectual Property developed around the product assembly.
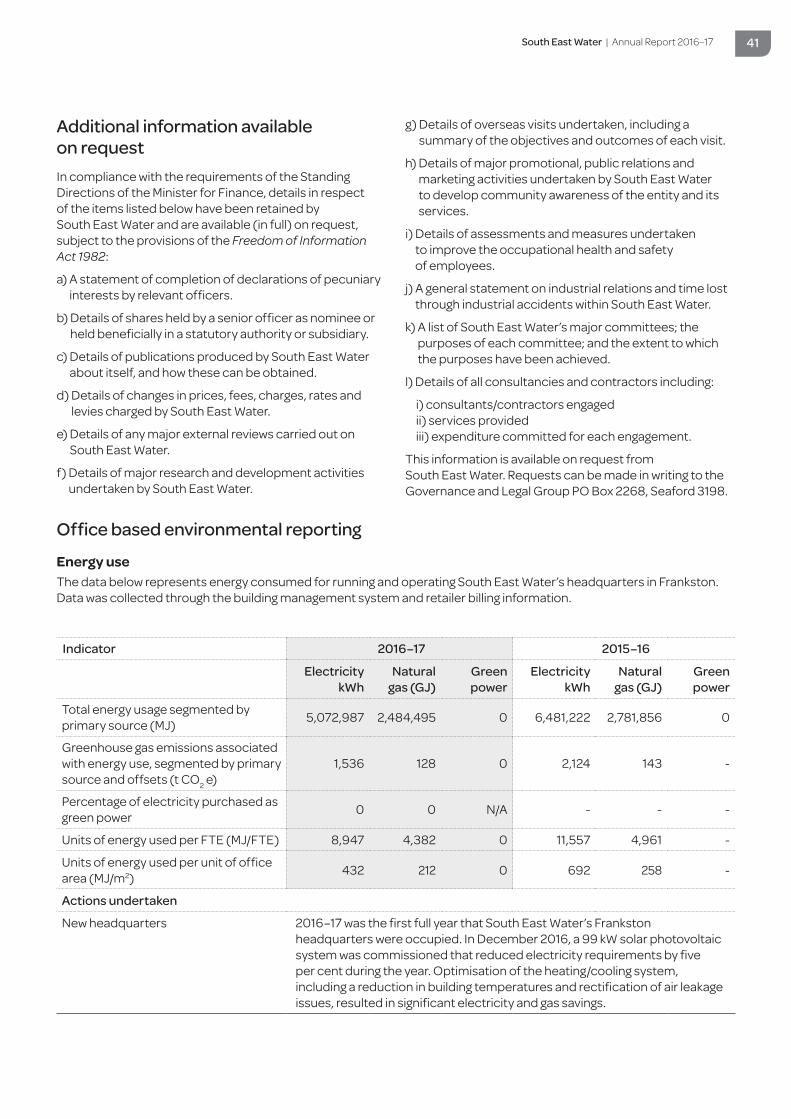
South East Water | Annual Report 2016–17 41
Additional information available on request In compliance with the requirements of the Standing Directions of the Minister for Finance, details in respect of the items listed below have been retained by South East Water and are available (in full) on request, subject to the provisions of the Freedom of Information Act 1982:
a) A statement of completion of declarations of pecuniary interests by relevant officers.
b) Details of shares held by a senior officer as nominee or held beneficially in a statutory authority or subsidiary.
c) Details of publications produced by South East Water about itself, and how these can be obtained.
d) Details of changes in prices, fees, charges, rates and levies charged by South East Water.
e) Details of any major external reviews carried out on South East Water.
f) Details of major research and development activities undertaken by South East Water.
g) Details of overseas visits undertaken, including a summary of the objectives and outcomes of each visit.
h) Details of major promotional, public relations and marketing activities undertaken by South East Water to develop community awareness of the entity and its services.
i) Details of assessments and measures undertaken to improve the occupational health and safety of employees.
j) A general statement on industrial relations and time lost through industrial accidents within South East Water.
k) A list of South East Water’s major committees; the purposes of each committee; and the extent to which the purposes have been achieved.
l) Details of all consultancies and contractors including:
i) consultants/contractors engaged ii) services provided iii) expenditure committed for each engagement.
This information is available on request from South East Water. Requests can be made in writing to the Governance and Legal Group PO Box 2268, Seaford 3198.
Office based environmental reporting
Energy useThe data below represents energy consumed for running and operating South East Water’s headquarters in Frankston. Data was collected through the building management system and retailer billing information.
Indicator 2016–17 2015–16
Electricity kWh
Natural gas (GJ)
Green power
Electricity kWh
Natural gas (GJ)
Green power
Total energy usage segmented by primary source (MJ) 5,072,987 2,484,495 0 6,481,222 2,781,856 0
Greenhouse gas emissions associated with energy use, segmented by primary source and offsets (t CO2 e)
1,536 128 0 2,124 143 -
Percentage of electricity purchased as green power 0 0 N/A - - -
Units of energy used per FTE (MJ/FTE) 8,947 4,382 0 11,557 4,961 -
Units of energy used per unit of office area (MJ/m2) 432 212 0 692 258 -
Actions undertaken
New headquarters 2016–17 was the first full year that South East Water’s Frankston headquarters were occupied. In December 2016, a 99 kW solar photovoltaic system was commissioned that reduced electricity requirements by five per cent during the year. Optimisation of the heating/cooling system, including a reduction in building temperatures and rectification of air leakage issues, resulted in significant electricity and gas savings.
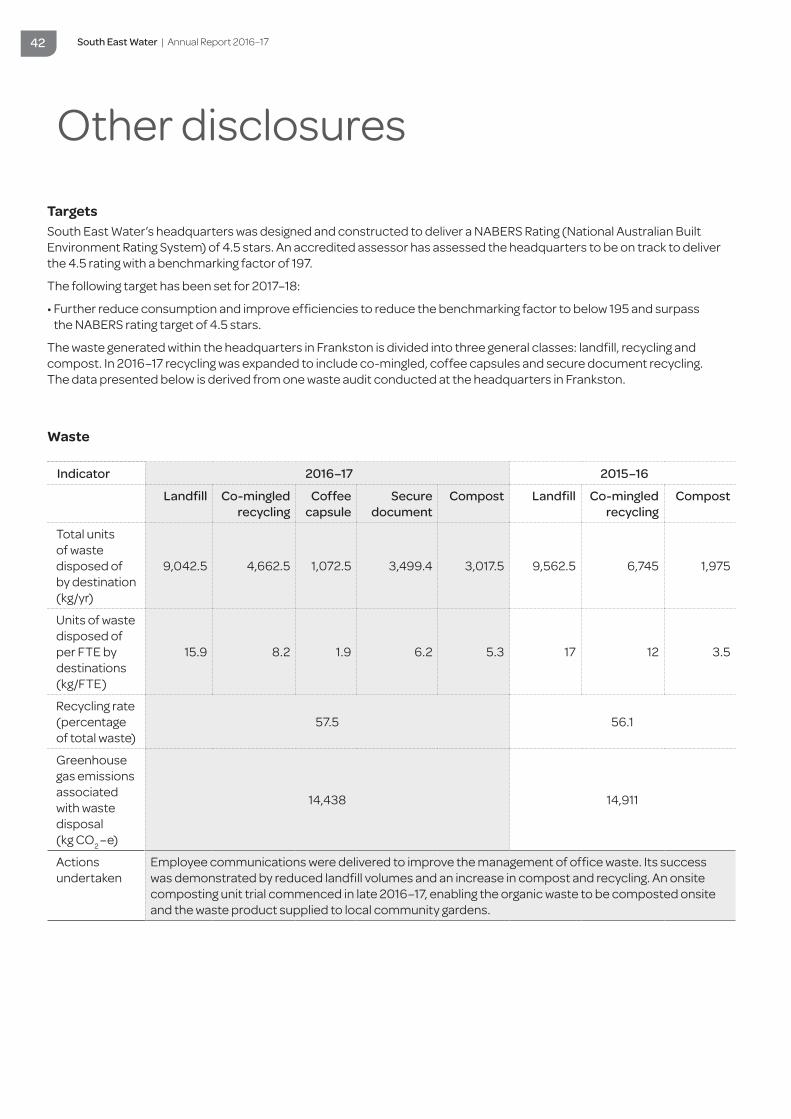
South East Water | Annual Report 2016–17 42
TargetsSouth East Water’s headquarters was designed and constructed to deliver a NABERS Rating (National Australian Built Environment Rating System) of 4.5 stars. An accredited assessor has assessed the headquarters to be on track to deliver the 4.5 rating with a benchmarking factor of 197.
The following target has been set for 2017–18:
• Further reduce consumption and improve efficiencies to reduce the benchmarking factor to below 195 and surpass the NABERS rating target of 4.5 stars.
The waste generated within the headquarters in Frankston is divided into three general classes: landfill, recycling and compost. In 2016–17 recycling was expanded to include co-mingled, coffee capsules and secure document recycling. The data presented below is derived from one waste audit conducted at the headquarters in Frankston.
Waste
Indicator 2016–17 2015–16
Landfill Co-mingled recycling
Coffee capsule
Secure document
Compost Landfill Co-mingled recycling
Compost
Total units of waste disposed of by destination (kg/yr)
9,042.5 4,662.5 1,072.5 3,499.4 3,017.5 9,562.5 6,745 1,975
Units of waste disposed of per FTE by destinations (kg/FTE)
15.9 8.2 1.9 6.2 5.3 17 12 3.5
Recycling rate (percentage of total waste)
57.5 56.1
Greenhouse gas emissions associated with waste disposal (kg CO2 –e)
14,438 14,911
Actions undertaken
Employee communications were delivered to improve the management of office waste. Its success was demonstrated by reduced landfill volumes and an increase in compost and recycling. An onsite composting unit trial commenced in late 2016–17, enabling the organic waste to be composted onsite and the waste product supplied to local community gardens.
Other disclosures
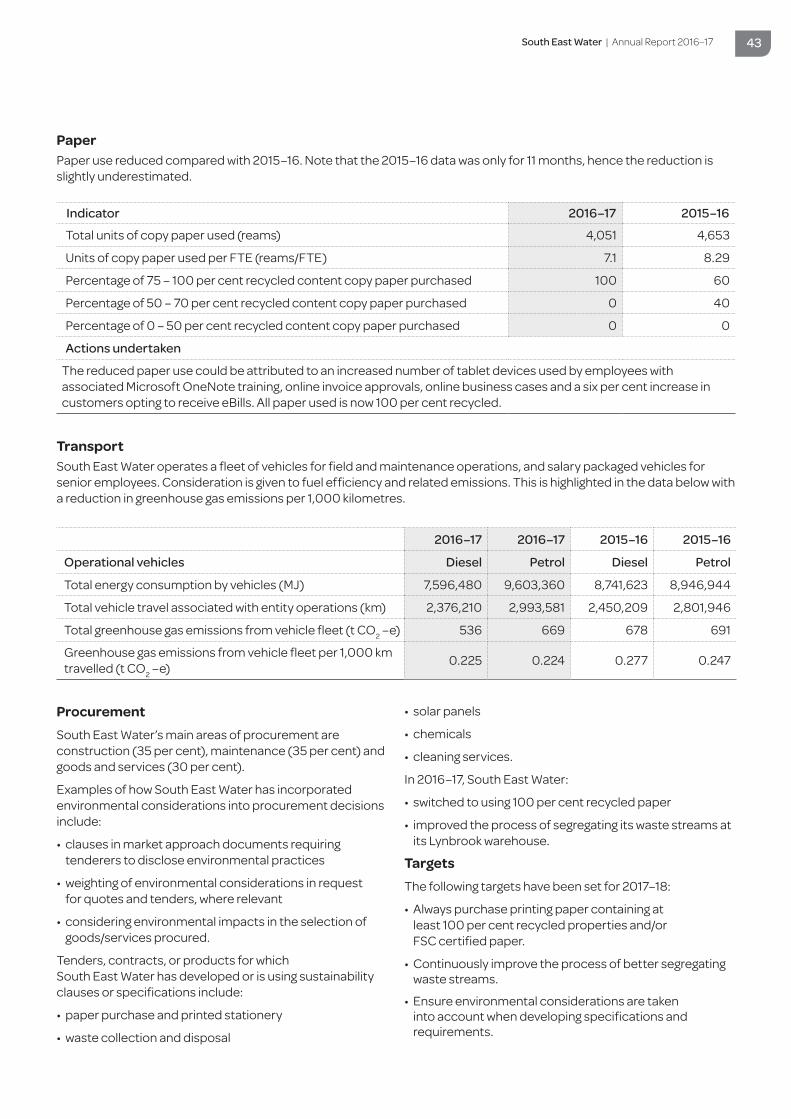
South East Water | Annual Report 2016–17 43
PaperPaper use reduced compared with 2015–16. Note that the 2015–16 data was only for 11 months, hence the reduction is slightly underestimated.
Indicator 2016–17 2015–16
Total units of copy paper used (reams) 4,051 4,653
Units of copy paper used per FTE (reams/FTE) 7.1 8.29
Percentage of 75 – 100 per cent recycled content copy paper purchased 100 60
Percentage of 50 – 70 per cent recycled content copy paper purchased 0 40
Percentage of 0 – 50 per cent recycled content copy paper purchased 0 0
Actions undertaken
The reduced paper use could be attributed to an increased number of tablet devices used by employees with associated Microsoft OneNote training, online invoice approvals, online business cases and a six per cent increase in customers opting to receive eBills. All paper used is now 100 per cent recycled.
TransportSouth East Water operates a fleet of vehicles for field and maintenance operations, and salary packaged vehicles for senior employees. Consideration is given to fuel efficiency and related emissions. This is highlighted in the data below with a reduction in greenhouse gas emissions per 1,000 kilometres.
2016–17 2016–17 2015–16 2015–16
Operational vehicles Diesel Petrol Diesel Petrol
Total energy consumption by vehicles (MJ) 7,596,480 9,603,360 8,741,623 8,946,944
Total vehicle travel associated with entity operations (km) 2,376,210 2,993,581 2,450,209 2,801,946
Total greenhouse gas emissions from vehicle fleet (t CO2 –e) 536 669 678 691
Greenhouse gas emissions from vehicle fleet per 1,000 km travelled (t CO2 –e) 0.225 0.224 0.277 0.247
ProcurementSouth East Water’s main areas of procurement are construction (35 per cent), maintenance (35 per cent) and goods and services (30 per cent).
Examples of how South East Water has incorporated environmental considerations into procurement decisions include:
• clauses in market approach documents requiring tenderers to disclose environmental practices
• weighting of environmental considerations in request for quotes and tenders, where relevant
• considering environmental impacts in the selection of goods/services procured.
Tenders, contracts, or products for which South East Water has developed or is using sustainability clauses or specifications include:
• paper purchase and printed stationery
• waste collection and disposal
• solar panels
• chemicals
• cleaning services.
In 2016–17, South East Water:
• switched to using 100 per cent recycled paper
• improved the process of segregating its waste streams at its Lynbrook warehouse.
TargetsThe following targets have been set for 2017–18:
• Always purchase printing paper containing at least 100 per cent recycled properties and/or FSC certified paper.
• Continuously improve the process of better segregating waste streams.
• Ensure environmental considerations are taken into account when developing specifications and requirements.
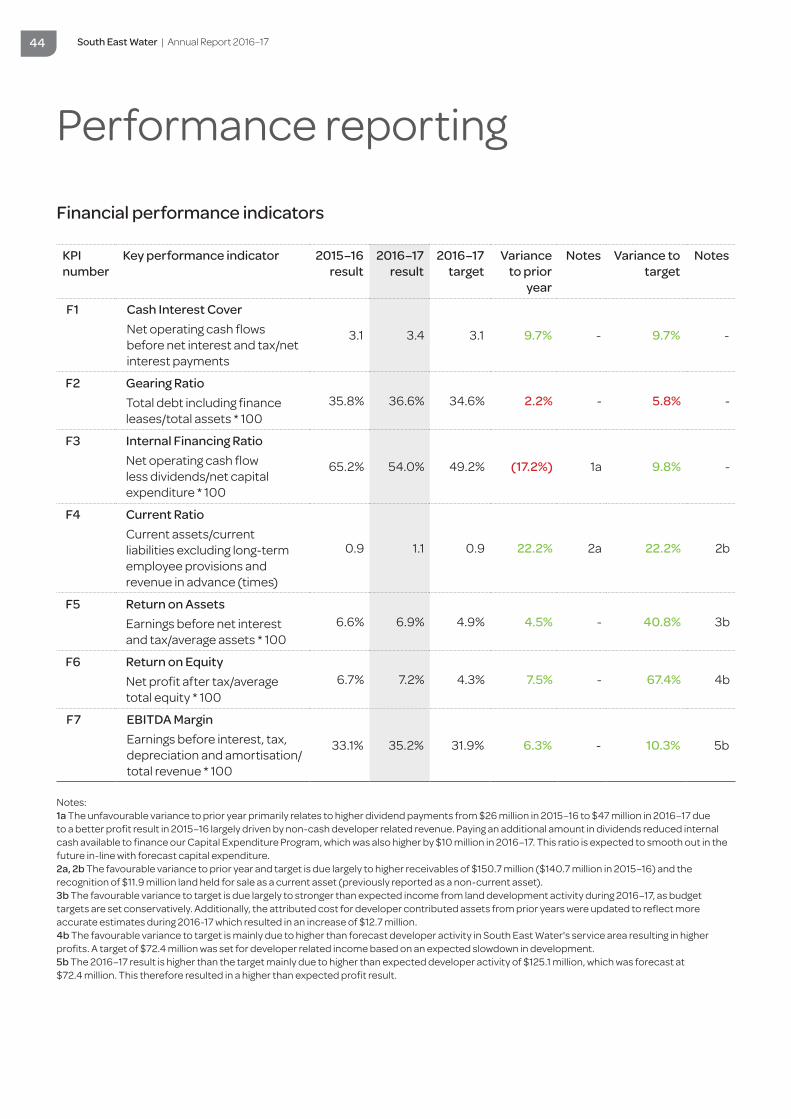
South East Water | Annual Report 2016–17 44
Performance reporting
Financial performance indicators
KPI number
Key performance indicator 2015–16 result
2016–17 result
2016–17 target
Variance to prior
year
Notes Variance to target
Notes
F1 Cash Interest Cover Net operating cash flows before net interest and tax/net interest payments
3.1 3.4 3.1 9.7% - 9.7% -
F2 Gearing RatioTotal debt including finance leases/total assets * 100
35.8% 36.6% 34.6% 2.2% - 5.8% -
F3 Internal Financing RatioNet operating cash flow less dividends/net capital expenditure * 100
65.2% 54.0% 49.2% (17.2%) 1a 9.8% -
F4 Current Ratio Current assets/current liabilities excluding long-term employee provisions and revenue in advance (times)
0.9 1.1 0.9 22.2% 2a 22.2% 2b
F5 Return on AssetsEarnings before net interest and tax/average assets * 100
6.6% 6.9% 4.9% 4.5% - 40.8% 3b
F6 Return on EquityNet profit after tax/average total equity * 100
6.7% 7.2% 4.3% 7.5% - 67.4% 4b
F7 EBITDA MarginEarnings before interest, tax, depreciation and amortisation/total revenue * 100
33.1% 35.2% 31.9% 6.3% - 10.3% 5b
Notes:1a The unfavourable variance to prior year primarily relates to higher dividend payments from $26 million in 2015–16 to $47 million in 2016–17 due to a better profit result in 2015–16 largely driven by non-cash developer related revenue. Paying an additional amount in dividends reduced internal cash available to finance our Capital Expenditure Program, which was also higher by $10 million in 2016–17. This ratio is expected to smooth out in the future in-line with forecast capital expenditure.2a, 2b The favourable variance to prior year and target is due largely to higher receivables of $150.7 million ($140.7 million in 2015–16) and the recognition of $11.9 million land held for sale as a current asset (previously reported as a non-current asset).3b The favourable variance to target is due largely to stronger than expected income from land development activity during 2016–17, as budget targets are set conservatively. Additionally, the attributed cost for developer contributed assets from prior years were updated to reflect more accurate estimates during 2016-17 which resulted in an increase of $12.7 million.4b The favourable variance to target is mainly due to higher than forecast developer activity in South East Water's service area resulting in higher profits. A target of $72.4 million was set for developer related income based on an expected slowdown in development.5b The 2016–17 result is higher than the target mainly due to higher than expected developer activity of $125.1 million, which was forecast at $72.4 million. This therefore resulted in a higher than expected profit result.
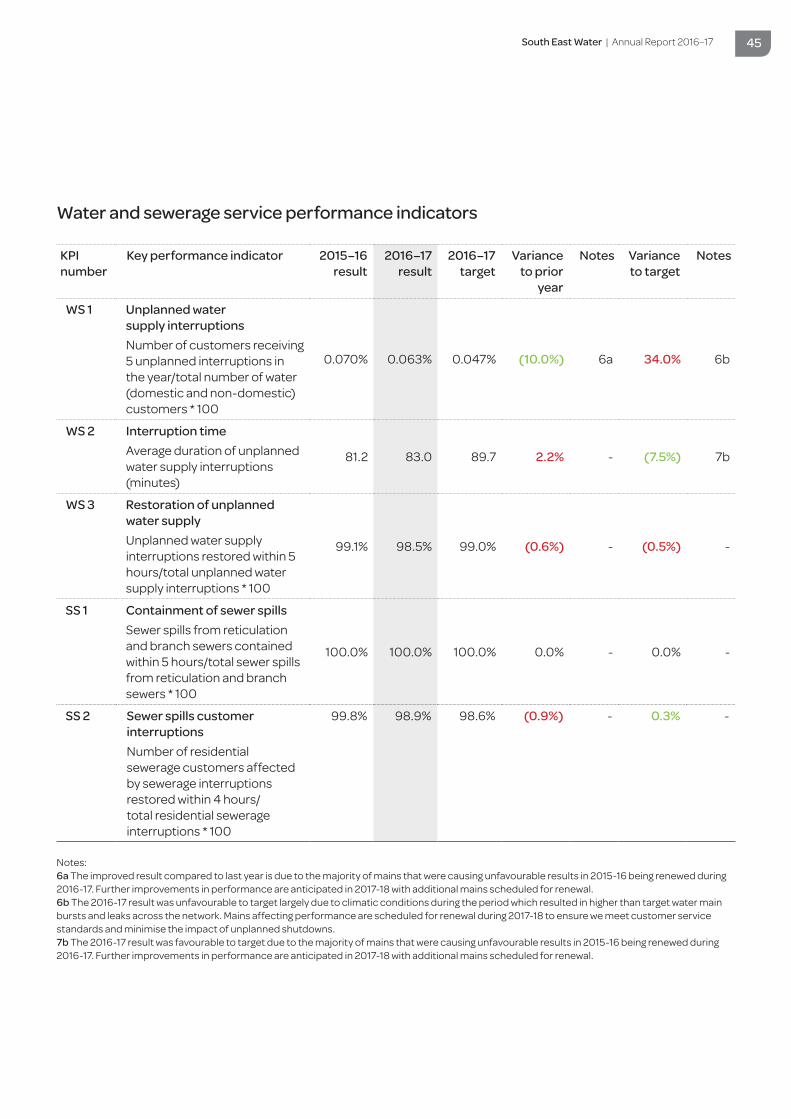
South East Water | Annual Report 2016–17 45
Water and sewerage service performance indicators
KPI number
Key performance indicator 2015–16 result
2016–17 result
2016–17 target
Variance to prior
year
Notes Variance to target
Notes
WS 1 Unplanned water supply interruptionsNumber of customers receiving 5 unplanned interruptions in the year/total number of water (domestic and non-domestic) customers * 100
0.070% 0.063% 0.047% (10.0%) 6a 34.0% 6b
WS 2 Interruption timeAverage duration of unplanned water supply interruptions (minutes)
81.2 83.0 89.7 2.2% - (7.5%) 7b
WS 3 Restoration of unplanned water supplyUnplanned water supply interruptions restored within 5 hours/total unplanned water supply interruptions * 100
99.1% 98.5% 99.0% (0.6%) - (0.5%) -
SS 1 Containment of sewer spillsSewer spills from reticulation and branch sewers contained within 5 hours/total sewer spills from reticulation and branch sewers * 100
100.0% 100.0% 100.0% 0.0% - 0.0% -
SS 2 Sewer spills customer interruptionsNumber of residential sewerage customers affected by sewerage interruptions restored within 4 hours/total residential sewerage interruptions * 100
99.8% 98.9% 98.6% (0.9%) - 0.3% -
Notes: 6a The improved result compared to last year is due to the majority of mains that were causing unfavourable results in 2015-16 being renewed during 2016-17. Further improvements in performance are anticipated in 2017-18 with additional mains scheduled for renewal.6b The 2016-17 result was unfavourable to target largely due to climatic conditions during the period which resulted in higher than target water main bursts and leaks across the network. Mains affecting performance are scheduled for renewal during 2017-18 to ensure we meet customer service standards and minimise the impact of unplanned shutdowns.7b The 2016-17 result was favourable to target due to the majority of mains that were causing unfavourable results in 2015-16 being renewed during 2016-17. Further improvements in performance are anticipated in 2017-18 with additional mains scheduled for renewal.
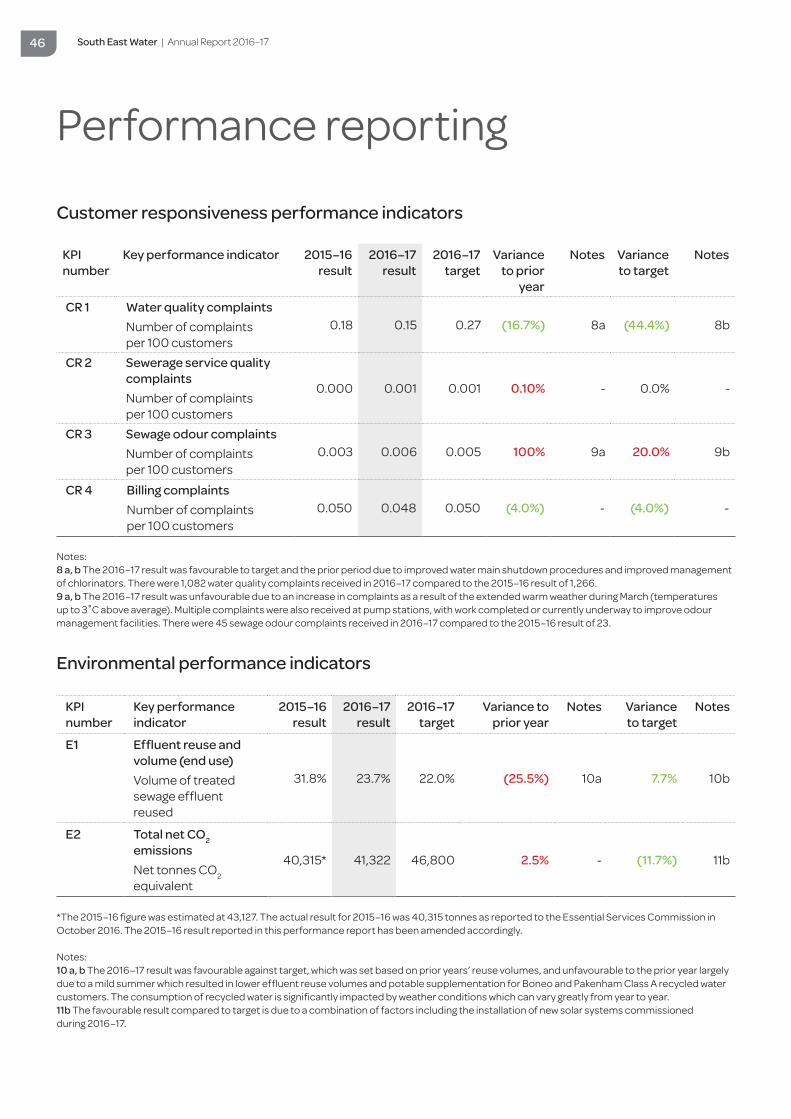
South East Water | Annual Report 2016–17 46
Customer responsiveness performance indicators
KPI number
Key performance indicator 2015–16 result
2016–17 result
2016–17 target
Variance to prior
year
Notes Variance to target
Notes
CR 1 Water quality complaintsNumber of complaints per 100 customers
0.18 0.15 0.27 (16.7%) 8a (44.4%) 8b
CR 2 Sewerage service quality complaintsNumber of complaints per 100 customers
0.000 0.001 0.001 0.10% - 0.0% -
CR 3 Sewage odour complaints Number of complaints per 100 customers
0.003 0.006 0.005 100% 9a 20.0% 9b
CR 4 Billing complaints Number of complaints per 100 customers
0.050 0.048 0.050 (4.0%) - (4.0%) -
Notes: 8 a, b The 2016–17 result was favourable to target and the prior period due to improved water main shutdown procedures and improved management of chlorinators. There were 1,082 water quality complaints received in 2016–17 compared to the 2015–16 result of 1,266. 9 a, b The 2016–17 result was unfavourable due to an increase in complaints as a result of the extended warm weather during March (temperatures up to 3˚C above average). Multiple complaints were also received at pump stations, with work completed or currently underway to improve odour management facilities. There were 45 sewage odour complaints received in 2016–17 compared to the 2015–16 result of 23.
Environmental performance indicators
KPI number
Key performance indicator
2015–16 result
2016–17 result
2016–17 target
Variance to prior year
Notes Variance to target
Notes
E1 Effluent reuse and volume (end use) Volume of treated sewage effluent reused
31.8% 23.7% 22.0% (25.5%) 10a 7.7% 10b
E2 Total net CO2 emissionsNet tonnes CO2 equivalent
40,315* 41,322 46,800 2.5% - (11.7%) 11b
*The 2015–16 figure was estimated at 43,127. The actual result for 2015–16 was 40,315 tonnes as reported to the Essential Services Commission in October 2016. The 2015–16 result reported in this performance report has been amended accordingly.
Notes:10 a, b The 2016–17 result was favourable against target, which was set based on prior years’ reuse volumes, and unfavourable to the prior year largely due to a mild summer which resulted in lower effluent reuse volumes and potable supplementation for Boneo and Pakenham Class A recycled water customers. The consumption of recycled water is significantly impacted by weather conditions which can vary greatly from year to year.11b The favourable result compared to target is due to a combination of factors including the installation of new solar systems commissioned during 2016–17.
Performance reporting
South East Water | Annual Report 2016–17 47
Certification of performance report for 2016–17We certify, in our opinion, that the accompanying Performance Report for the Group in respect of the 2016–17 financial year is presented fairly in accordance with the Financial Management Act 1994.
The Performance Report outlines the relevant performance indicators for the financial year as determined by the Minister for Water and as set out in the 2016–17 Corporate Plan, the actual and comparative results achieved for the financial year against predetermined performance targets and these indicators, and an explanation of any significant variance between the actual results and performance targets and/or between the actual results in the current year and the previous year.
As at the date of signing, we are not aware of any circumstances which would render any particulars in the Performance Report to be misleading or inaccurate.
Dated this 4th day of September 2017
Lucia Cade Terri Benson Phil Johnson
Chair Managing Director Chief Financial Officer
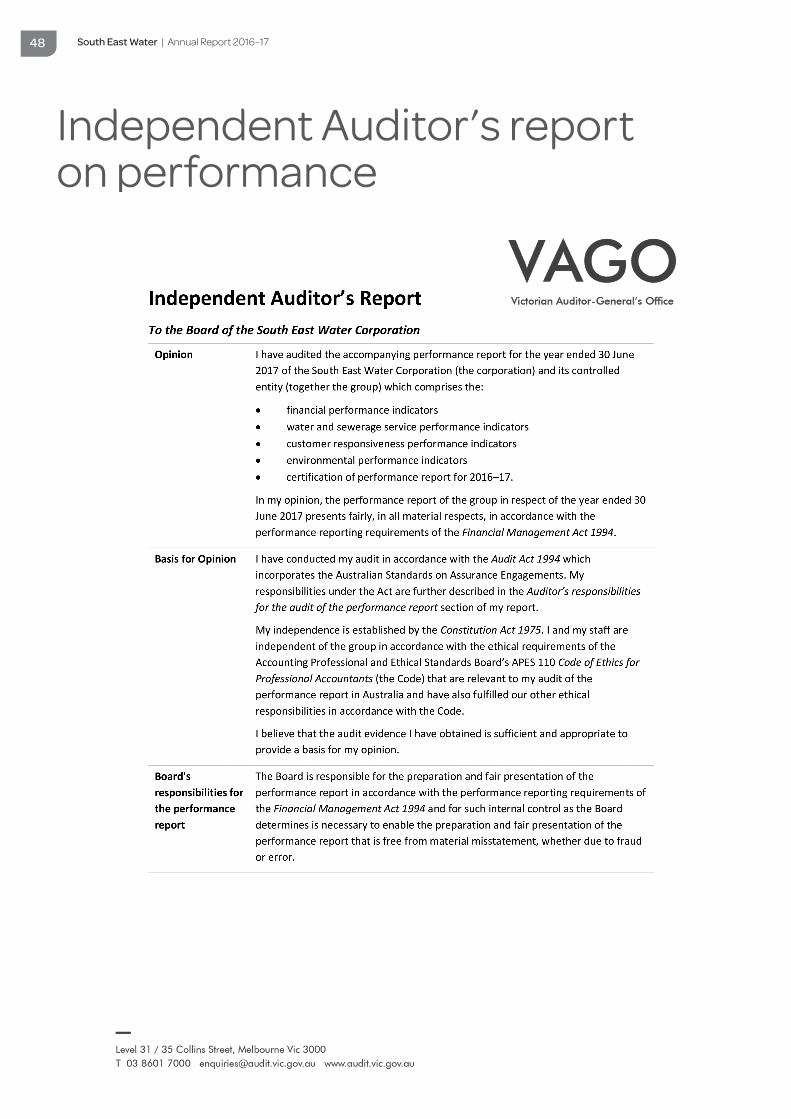
South East Water | Annual Report 2016–17 48
Independent Auditor’s report on performance
South East Water | Annual Report 2016–17 49
2
Auditor’s responsibilities for the audit of the performance report
As required by the Audit Act 1994, my responsibility is to express an opinion on the performance report based on the audit. My objectives for the audit are to obtain reasonable assurance about whether the performance report as a whole is free from material misstatement, whether due to fraud or error, and to issue an auditor’s report that includes my opinion. Reasonable assurance is a high level of assurance, but is not a guarantee that an audit conducted in accordance with the Australian Standards on Assurance Engagements will always detect a material misstatement when it exists. Misstatements can arise from fraud or error and are considered material if, individually or in the aggregate, they could reasonably be expected to influence the decisions of users taken on the basis of this performance report.
As part of an audit in accordance with the Australian Standards on Assurance Engagements, I exercise professional judgement and maintain professional scepticism throughout the audit. I also:
identify and assess the risks of material misstatement of performance report, whether due to fraud or error, design and perform audit procedures responsive to those risks, and obtain audit evidence that is sufficient and appropriate to provide a basis for our opinion. The risk of not detecting a material misstatement resulting from fraud is higher than for one resulting from error, as fraud may involve collusion, forgery, intentional omissions, misrepresentations, or the override of internal control.
obtain an understanding of internal control relevant to the audit in order to design audit procedures that are appropriate in the circumstances, but not for the purpose of expressing an opinion on the effectiveness of the group’s internal control
evaluate the overall presentation, structure and content of the performance report, including the disclosures, and whether the performance report represents the underlying events and results in a manner that achieves fair presentation.
I communicate with the Board regarding, among other matters, the planned scope and timing of the audit and significant audit findings, including any significant deficiencies in internal control that I identify during my audit.
MELBOURNE 5 September 2017
Roberta Skliros as delegate for the Auditor-General of Victoria

South East Water | Annual Report 2016–17 50
Consolidated Financial Report 2016–17
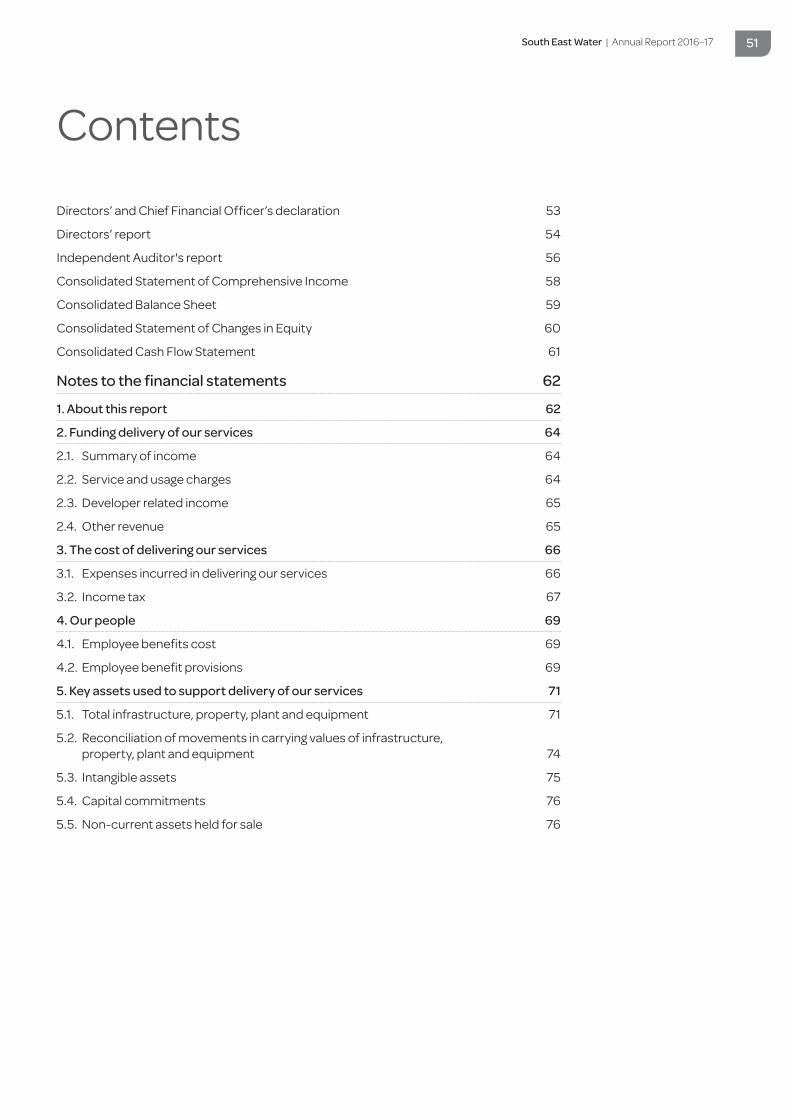
South East Water | Annual Report 2016–17 51
Directors’ and Chief Financial Officer’s declaration 53
Directors’ report 54
Independent Auditor's report 56
Consolidated Statement of Comprehensive Income 58
Consolidated Balance Sheet 59
Consolidated Statement of Changes in Equity 60
Consolidated Cash Flow Statement 61
Notes to the financial statements 62
1. About this report 62
2. Funding delivery of our services 64
2.1. Summary of income 64
2.2. Service and usage charges 64
2.3. Developer related income 65
2.4. Other revenue 65
3. The cost of delivering our services 66
3.1. Expenses incurred in delivering our services 66
3.2. Income tax 67
4. Our people 69
4.1. Employee benefits cost 69
4.2. Employee benefit provisions 69
5. Key assets used to support delivery of our services 71
5.1. Total infrastructure, property, plant and equipment 71
5.2. Reconciliation of movements in carrying values of infrastructure, property, plant and equipment 74
5.3. Intangible assets 75
5.4. Capital commitments 76
5.5. Non-current assets held for sale 76
Contents
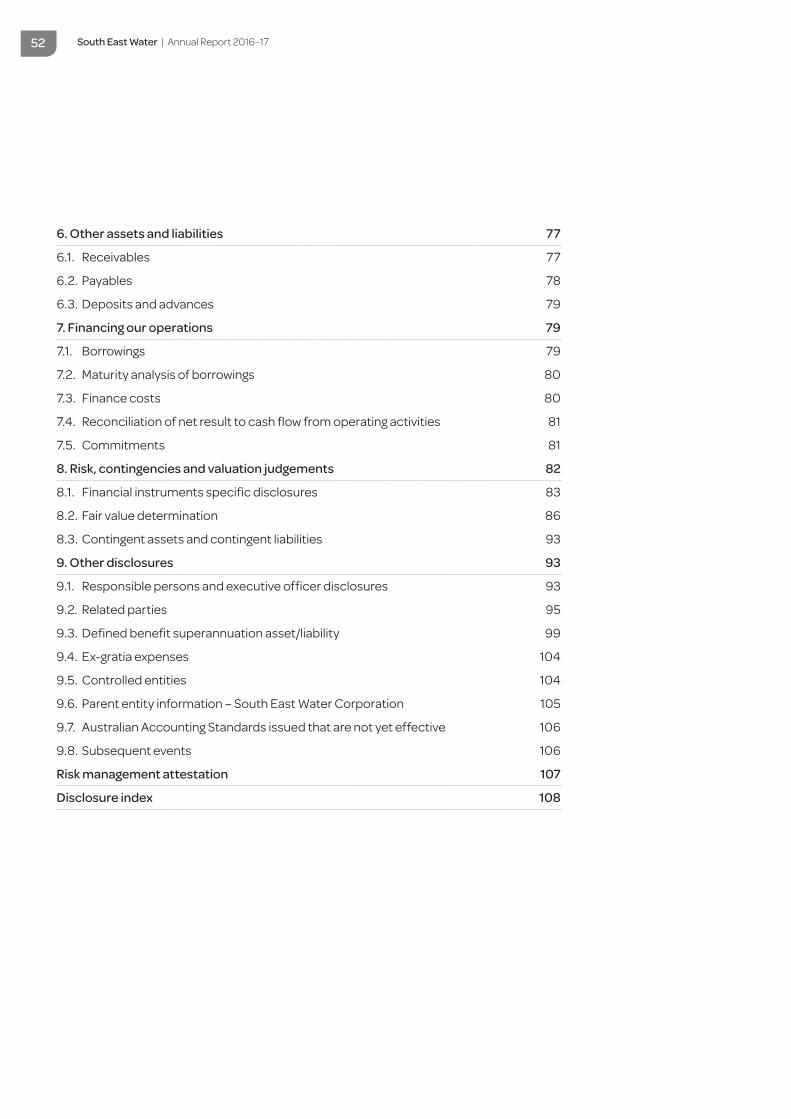
South East Water | Annual Report 2016–17 52
6. Other assets and liabilities 77
6.1. Receivables 77
6.2. Payables 78
6.3. Deposits and advances 79
7. Financing our operations 79
7.1. Borrowings 79
7.2. Maturity analysis of borrowings 80
7.3. Finance costs 80
7.4. Reconciliation of net result to cash flow from operating activities 81
7.5. Commitments 81
8. Risk, contingencies and valuation judgements 82
8.1. Financial instruments specific disclosures 83
8.2. Fair value determination 86
8.3. Contingent assets and contingent liabilities 93
9. Other disclosures 93
9.1. Responsible persons and executive officer disclosures 93
9.2. Related parties 95
9.3. Defined benefit superannuation asset/liability 99
9.4. Ex-gratia expenses 104
9.5. Controlled entities 104
9.6. Parent entity information – South East Water Corporation 105
9.7. Australian Accounting Standards issued that are not yet effective 106
9.8. Subsequent events 106
Risk management attestation 107
Disclosure index 108

South East Water | Annual Report 2016–17 53
Directors’ and Chief Financial Officer’s declarationWe certify that, in our opinion the attached Financial Statements for the Group have been prepared in accordance with Direction 5.2 of the Standing Directions of the Minister for Finance issued under the Financial Management Act 1994, applicable Financial Reporting Directions, Australian Accounting Standards including Interpretations and other mandatory professional reporting requirements.
We further state that, in our opinion the information set out in the Consolidated Statement of Comprehensive Income, Consolidated Balance Sheet, Consolidated Statement of Changes in Equity, Consolidated Cash Flow Statement and Notes to and forming part of the Financial Statements, presents fairly the financial transactions during the year ended 30 June 2017 and the financial position of the Group as at 30 June 2017.
At the time of signing, we are not aware of any circumstances which would render any particulars included in the Consolidated Financial Statements to be misleading or inaccurate.
We authorise the attached financial statements for issue on this 4th day of September 2017.
Lucia Cade Terri Benson Phil JohnsonChair Managing Director Chief Financial Officer
South East Water | Annual Report 2016–17 54
Directors’ report
The directors present their report on the financial year ended 30 June 2017 on South East Water Corporation (the corporation).
The directors of the corporation in office for the period 1 July 2016 to 30 June 2017 were:
Lucia Cade Chair
Kevin Hutchings Managing Director (resigned 3 March 2017)
Terri Benson Managing Director (commenced 29 May 2017)
Tony Beach Director
Gabrielle Bell Deputy Chair
W Peter Day Director
Timothy Lyons Director
Freya Marsden Director
Kim McGrath Director
Ross Passalaqua Director (resigned 22 February 2017)
Particulars of the directors’ and corporate secretary’s qualifications, experience and special responsibilities (if any) are set out on pages 26 to 29 of the Annual Report.
Directors’ meetings The number of board meetings and board committee meetings, and number of meetings attended by each of the directors of the corporation during the financial year are set out in the governance section of this Annual Report.
Principal activities South East Water’s fundamental business objective is to provide water, sewerage and integrated water management services that customers value, while providing strong financial returns to the government and community. Accordingly, the principal activities of the corporation during the financial year, within the State of Victoria, were the provision of retail water supply and sewerage services (including recycled water) and collection of trade waste.
In addition, South East Water, in partnership with Villawood Properties Pty Ltd, finalised the sale of the first four stages of land as part of the Aquarevo development. This project will result in 460 new residential lots within the municipality of Casey and will showcase innovative water recycling solutions and leading-edge efficiency features, both designed to help homes significantly reduce reliance on drinking water supplies.
South East Water continued to progress with the commercialisation of its innovations, engineering solutions and products through its wholly-owned subsidiary, iota Services.
Other than as previously referred to in the annual report, there were no other significant changes in the nature of the corporation’s activities during the year.
Dividends The corporation’s profit after tax for the financial year was $134.3 million.
A final dividend of $47 million for the financial year ended 30 June 2016 was paid on 30 November 2016. As no interim dividend was paid, this amount represents the total full year dividend.
No interim dividend for the financial year ended 30 June 2017 was paid.
The final dividend for the year ended 30 June 2017 will be determined after consultation between the Minister for Water, Treasurer of Victoria and South East Water’s board.
Review of operations A review of the operations of the corporation during the financial year and the results of those operations is set out in the main body of the annual report.
State of affairs There were no significant changes to the state of affairs of the corporation during the financial year ended 30 June 2017.
Likely developments Certain likely developments in the operations of the corporation known at the date of this report have been covered generally within the main body of the annual report.
South East Water | Annual Report 2016–17 55
Environmental regulation performance The corporation is subject to significant environmental regulations in respect of its operations. In particular, the corporation holds an amalgamated licence for its eight sewage treatment plants issued by the Environment Protection Authority (EPA) Victoria under the Environment Protection Act 1970 (Vic).
South East Water has many environmental aspects to its business. In order to effectively and efficiently manage its environmental aspects, the corporation implemented an Environmental Management System (EMS).
The EMS is that part of the overall integrated management system which includes organisational structure, planning activities, responsibilities, practices, procedures, processes and resources for developing, implementing, achieving, reviewing and maintaining the organisation’s Management Systems Policy.
The EMS is one of the tools providing a structured process for continual improvement of environmental performance. South East Water has maintained certification against the ISO 14001 standard since 1996.
South East Water achieved 100 per cent discharge quality compliance for all its eight water recycling plants, however was unable to contain all flows on site at the Lang Lang Water Recycling Plant, which resulted in a breach of the corporation’s EPA amalgamated licence.
The Lang Lang Water Recycling Plant upgrade is currently underway and is due for completion in October 2017, which will increase reuse capacity and relieve the need for future offsite discharge.
Directors’ benefits No director has received, or has become entitled to receive, a benefit (other than a remuneration benefit included in Note 9.1 of the Financial Report) because of a contract the director or a firm of which the director is a member or an entity in which the director has a substantial financial interest, has made (during the financial year ended 30 June 2017 or at any other time) with the corporation. The directors of iota Services Pty Ltd also receive a committee allowance as part of their role as directors of iota. Additional information about director related disclosure is provided in Note 9.1 of the Financial Report.
Directors’ and officers’ liability insurance During the financial year, the corporation paid insurance premiums in respect of directors’ and officers’ liability insurance. The policy does not specify a premium for individual directors and officers. The director and officer liability insurance policy provides cover against all costs and expenses involved in defending legal actions and any resulting payments arising from a liability to persons (other than the corporation) incurred in their position as director or officer unless the conduct involves a wilful breach of duty or an improper use of information or position to gain advantage.
The terms of the insurance policy prohibit the disclosure of the nature of the liabilities insured and the amount of the premium.
Dated at Melbourne this 4th day of September 2017.
Signed in accordance with a resolution of the directors.
Lucia Cade Terri BensonChair Managing Director

South East Water | Annual Report 2016–17 56
Independent Auditor’s report

South East Water | Annual Report 2016–17 57
2
Auditor’s responsibilities for the audit of the consolidated financial report
As required by the Audit Act 1994, my responsibility is to express an opinion on the consolidated financial report based on the audit. My objectives for the audit are to obtain reasonable assurance about whether the consolidated financial report as a whole is free from material misstatement, whether due to fraud or error, and to issue an auditor’s report that includes my opinion. Reasonable assurance is a high level of assurance, but is not a guarantee that an audit conducted in accordance with the Australian Auditing Standards will always detect a material misstatement when it exists. Misstatements can arise from fraud or error and are considered material if, individually or in the aggregate, they could reasonably be expected to influence the economic decisions of users taken on the basis of this consolidated financial report.
As part of an audit in accordance with the Australian Auditing Standards, I exercise professional judgement and maintain professional scepticism throughout the audit. I also:
identify and assess the risks of material misstatement of the consolidated financial report, whether due to fraud or error, design and perform audit procedures responsive to those risks, and obtain audit evidence that is sufficient and appropriate to provide a basis for our opinion. The risk of not detecting a material misstatement resulting from fraud is higher than for one resulting from error, as fraud may involve collusion, forgery, intentional omissions, misrepresentations, or the override of internal control
obtain an understanding of internal control relevant to the audit in order to design audit procedures that are appropriate in the circumstances, but not for the purpose of expressing an opinion on the effectiveness of the group’s internal control
evaluate the appropriateness of accounting policies used and the reasonableness of accounting estimates and related disclosures made by the Board
conclude on the appropriateness of the Board's use of the going concern basis of accounting and, based on the audit evidence obtained, whether a material uncertainty exists related to events or conditions that may cast significant doubt on the group’s ability to continue as a going concern. If I conclude that a material uncertainty exists, I am required to draw attention in my auditor’s report to the related disclosures in the consolidated financial report or, if such disclosures are inadequate, to modify my opinion. My conclusions are based on the audit evidence obtained up to the date of my auditor’s report. However, future events or conditions may cause the group to cease to continue as a going concern
evaluate the overall presentation, structure and content of the consolidated financial report, including the disclosures, and whether the consolidated financial report represents the underlying transactions and events in a manner that achieves fair presentation
obtain sufficient appropriate audit evidence regarding the financial information of the entities or business activities within the group to express an opinion on the financial report. I remain responsible for the direction, supervision and performance of the audit of the group. I remain solely responsible for my audit opinion.
I communicate with the Board regarding, among other matters, the planned scope and timing of the audit and significant audit findings, including any significant deficiencies in internal control that I identify during my audit.
MELBOURNE 5 September 2017
Roberta Skliros as delegate for the Auditor-General of Victoria
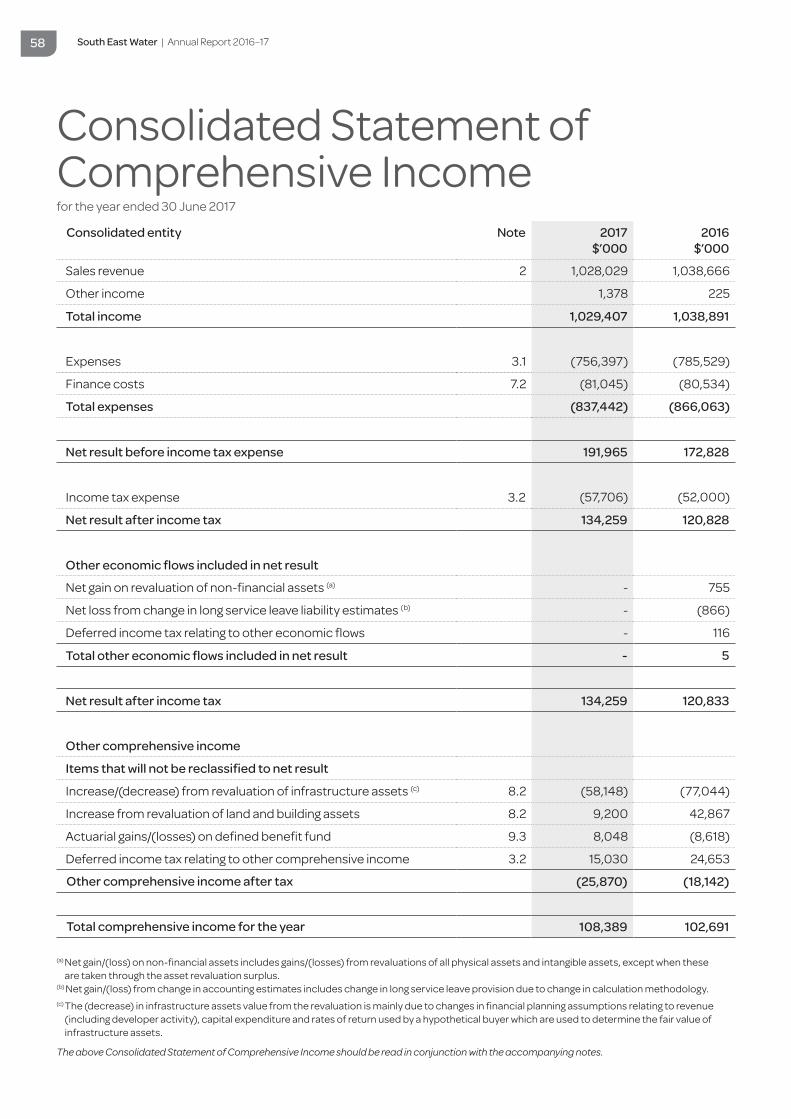
South East Water | Annual Report 2016–17 58
Consolidated entity Note 2017 $’000
2016 $’000
Sales revenue 2 1,028,029 1,038,666
Other income 1,378 225
Total income 1,029,407 1,038,891
Expenses 3.1 (756,397) (785,529)
Finance costs 7.2 (81,045) (80,534)
Total expenses (837,442) (866,063)
Net result before income tax expense 191,965 172,828
Income tax expense 3.2 (57,706) (52,000)
Net result after income tax 134,259 120,828
Other economic flows included in net result
Net gain on revaluation of non-financial assets (a) - 755
Net loss from change in long service leave liability estimates (b) - (866)
Deferred income tax relating to other economic flows - 116
Total other economic flows included in net result - 5
Net result after income tax 134,259 120,833
Other comprehensive income
Items that will not be reclassified to net result
Increase/(decrease) from revaluation of infrastructure assets (c) 8.2 (58,148) (77,044)
Increase from revaluation of land and building assets 8.2 9,200 42,867
Actuarial gains/(losses) on defined benefit fund 9.3 8,048 (8,618)
Deferred income tax relating to other comprehensive income 3.2 15,030 24,653
Other comprehensive income after tax (25,870) (18,142)
Total comprehensive income for the year 108,389 102,691
(a) Net gain/(loss) on non-financial assets includes gains/(losses) from revaluations of all physical assets and intangible assets, except when these are taken through the asset revaluation surplus.
(b) Net gain/(loss) from change in accounting estimates includes change in long service leave provision due to change in calculation methodology.(c) The (decrease) in infrastructure assets value from the revaluation is mainly due to changes in financial planning assumptions relating to revenue
(including developer activity), capital expenditure and rates of return used by a hypothetical buyer which are used to determine the fair value of infrastructure assets.
The above Consolidated Statement of Comprehensive Income should be read in conjunction with the accompanying notes.
Consolidated Statement of Comprehensive Incomefor the year ended 30 June 2017
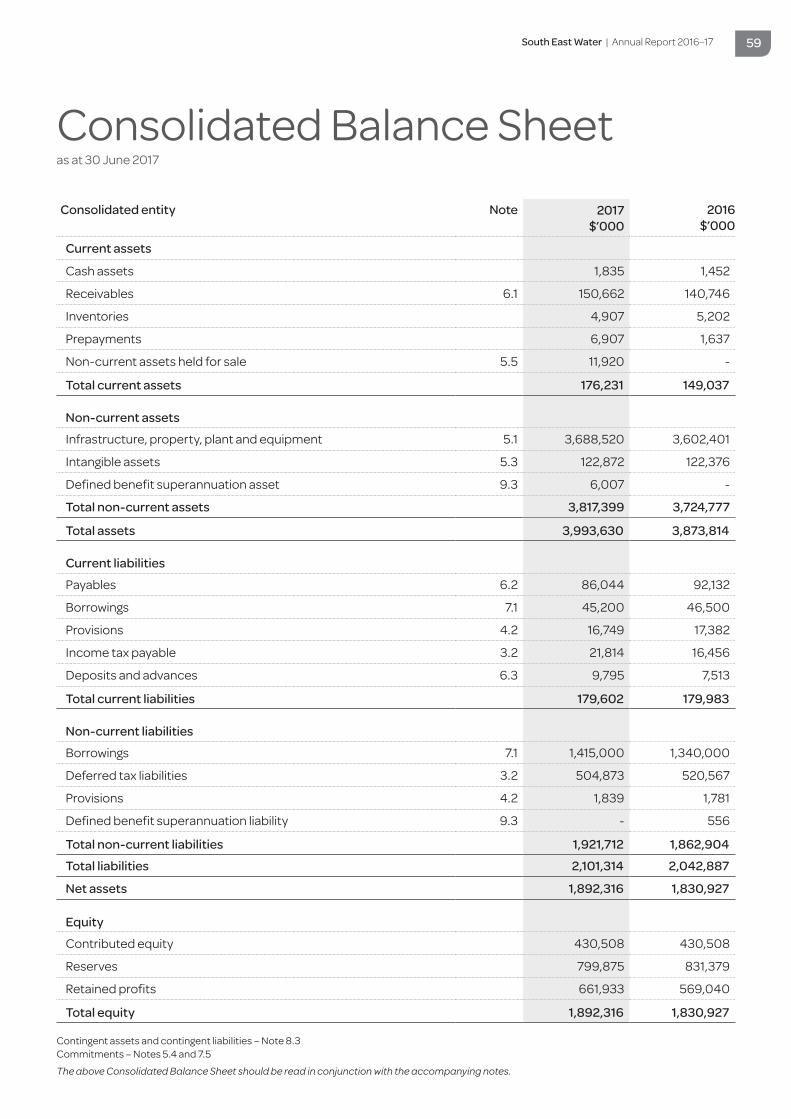
South East Water | Annual Report 2016–17 59
Consolidated Balance Sheetas at 30 June 2017
Consolidated entity Note 2017 $’000
2016 $’000
Current assets
Cash assets 1,835 1,452
Receivables 6.1 150,662 140,746
Inventories 4,907 5,202
Prepayments 6,907 1,637
Non-current assets held for sale 5.5 11,920 -
Total current assets 176,231 149,037
Non-current assets
Infrastructure, property, plant and equipment 5.1 3,688,520 3,602,401
Intangible assets 5.3 122,872 122,376
Defined benefit superannuation asset 9.3 6,007 -
Total non-current assets 3,817,399 3,724,777
Total assets 3,993,630 3,873,814
Current liabilities
Payables 6.2 86,044 92,132
Borrowings 7.1 45,200 46,500
Provisions 4.2 16,749 17,382
Income tax payable 3.2 21,814 16,456
Deposits and advances 6.3 9,795 7,513
Total current liabilities 179,602 179,983
Non-current liabilities
Borrowings 7.1 1,415,000 1,340,000
Deferred tax liabilities 3.2 504,873 520,567
Provisions 4.2 1,839 1,781
Defined benefit superannuation liability 9.3 - 556
Total non-current liabilities 1,921,712 1,862,904
Total liabilities 2,101,314 2,042,887
Net assets 1,892,316 1,830,927
Equity
Contributed equity 430,508 430,508
Reserves 799,875 831,379
Retained profits 661,933 569,040
Total equity 1,892,316 1,830,927 Contingent assets and contingent liabilities – Note 8.3Commitments – Notes 5.4 and 7.5
The above Consolidated Balance Sheet should be read in conjunction with the accompanying notes.
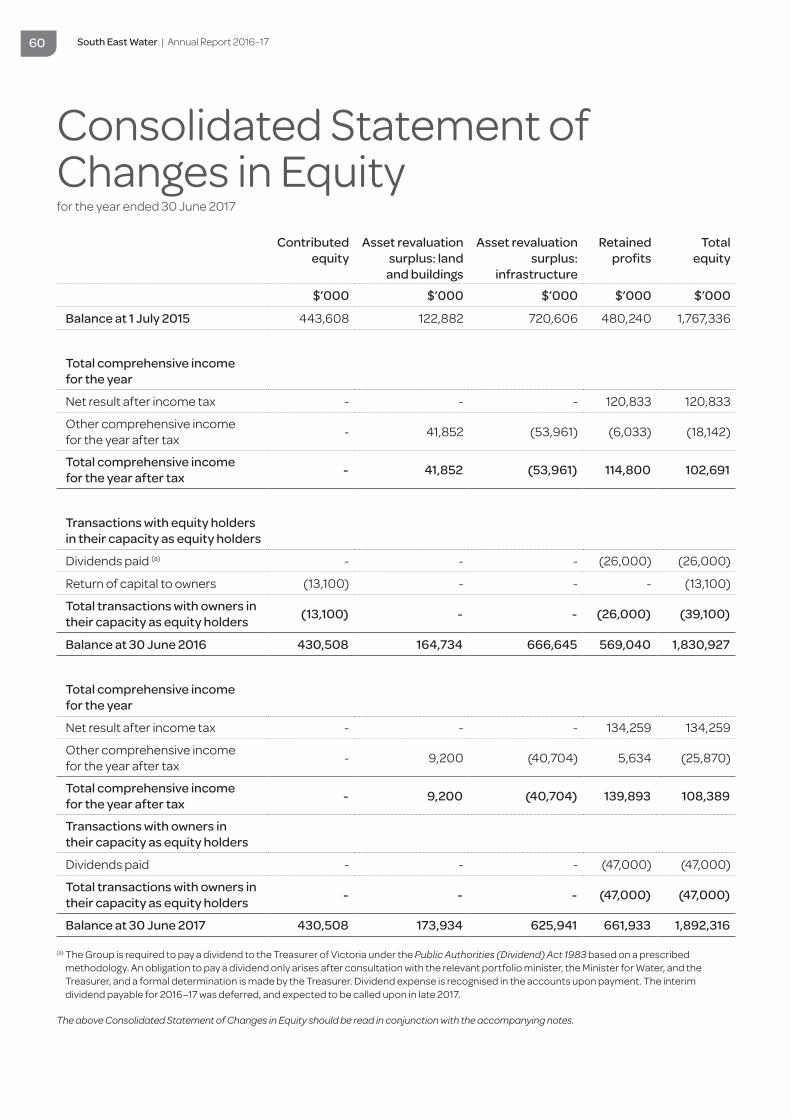
South East Water | Annual Report 2016–17 60
Contributed equity
Asset revaluationsurplus: land
and buildings
Asset revaluationsurplus:
infrastructure
Retained profits
Total equity
$’000 $’000 $’000 $’000 $’000
Balance at 1 July 2015 443,608 122,882 720,606 480,240 1,767,336
Total comprehensive income for the year
Net result after income tax - - - 120,833 120,833
Other comprehensive income for the year after tax - 41,852 (53,961) (6,033) (18,142)
Total comprehensive income for the year after tax - 41,852 (53,961) 114,800 102,691
Transactions with equity holders in their capacity as equity holders
Dividends paid (a) - - - (26,000) (26,000)
Return of capital to owners (13,100) - - - (13,100)
Total transactions with owners in their capacity as equity holders (13,100) - - (26,000) (39,100)
Balance at 30 June 2016 430,508 164,734 666,645 569,040 1,830,927
Total comprehensive income for the year
Net result after income tax - - - 134,259 134,259
Other comprehensive income for the year after tax - 9,200 (40,704) 5,634 (25,870)
Total comprehensive income for the year after tax - 9,200 (40,704) 139,893 108,389
Transactions with owners in their capacity as equity holders
Dividends paid - - - (47,000) (47,000)
Total transactions with owners in their capacity as equity holders - - - (47,000) (47,000)
Balance at 30 June 2017 430,508 173,934 625,941 661,933 1,892,316 (a) The Group is required to pay a dividend to the Treasurer of Victoria under the Public Authorities (Dividend) Act 1983 based on a prescribed
methodology. An obligation to pay a dividend only arises after consultation with the relevant portfolio minister, the Minister for Water, and the Treasurer, and a formal determination is made by the Treasurer. Dividend expense is recognised in the accounts upon payment. The interim dividend payable for 2016–17 was deferred, and expected to be called upon in late 2017.
The above Consolidated Statement of Changes in Equity should be read in conjunction with the accompanying notes.
Consolidated Statement of Changes in Equityfor the year ended 30 June 2017

South East Water | Annual Report 2016–17 61
Consolidated Cash Flow Statementfor the year ended 30 June 2017
Consolidated entity Note 2017 $’000
2016 $’000
Cash flows from operating activities
Receipts from customers 942,225 960,631
Payments to suppliers and employees (693,037) (735,766)
GST refunded from the Australian Tax Office (ATO) (a) 20,669 20,314
Income tax paid (53,011) (39,012)
Interest received 362 331
Interest and other costs of finance paid (80,859) (80,412)
Net cash inflow from operating activities 7.4 136,349 126,085
Cash flows from investing activities
Proceeds from sale of infrastructure, property, plant and equipment 1,833 1,707
Payments for infrastructure, property, plant and equipment, and intangibles (165,568) (155,096)
Net proceeds for water entitlements 1,069 -
Net cash outflow from investing activities (162,666) (153,389)
Cash flows from financing activities
Proceeds from borrowings (b) 205,275 187,900
Repayment of borrowings (c) (131,575) (122,500)
Capital repatriation - (13,100)
Dividends paid (47,000) (26,000)
Net cash inflow from financing activities 26,700 26,300
Net increase/(decrease) in cash held 383 (1,004)
Cash at the beginning of the financial year 1,452 2,456
Cash at the end of the financial year 1,835 1,452
(a) GST refunded from the ATO is presented on a net basis.(b) Proceeds from borrowings includes the amount of borrowings that were paid down and refinanced during the year.(c) Repayment of borrowings represents borrowings that were paid down and refinanced during the financial year.
The above Consolidated Cash Flow Statement should be read in conjunction with the accompanying notes.
South East Water | Annual Report 2016–17 62
1. About this reportThe Consolidated Financial Report is a general purpose financial report that consists of a Consolidated Statement of Comprehensive Income, Consolidated Balance Sheet, Consolidated Statement of Changes in Equity, Consolidated Cash Flow Statement and notes accompanying these statements. These are the consolidated financial statements for South East Water Corporation and its controlled entity, iota Services Pty Ltd, collectively referred to as the Group.
This general purpose Financial Report has been prepared in accordance with the requirements of Australian Accounting Standards (including Australian Interpretations), the requirements of the Financial Management Act 1994 and other mandatory professional reporting requirements.
The Consolidated Financial Report has been prepared on an accruals and going concern basis and is based on historical cost, except for infrastructure, property, plant and equipment and the defined benefit obligation, which have been measured at fair value. The Consolidated Financial Report is presented in Australian dollars.
The Consolidated Financial Report of South East Water Corporation (the Corporation) for the year ended 30 June 2017 was authorised for issue in accordance with a resolution of the directors on 4 September 2017.
South East Water is a state government owned corporation which has been classified as a for-profit entity for the purposes of reporting. The State Government of Victoria is the sole shareholder.
Principles of consolidationiota Services Pty Ltd is 100 per cent owned by South East Water Corporation. Information relating to the Parent is disclosed in Note 9.6. South East Water Corporation has made judgements and determined that the control test under AASB 10 Consolidated Financial Statements is satisfied based on:
1. South East Water Corporation having the capacity to affect the relevant activities of iota Services Pty Ltd that can significantly affect its returns.
2. South East Water Corporation has exposure to variable returns from iota Services Pty Ltd.
3. South East Water Corporation has sufficient discretion to direct the activities of iota Services Pty Ltd.
In preparing the consolidated financial statements, all intercompany balances and transactions, income and expenses and profit and losses resulting from intra-group
transactions have been eliminated. For details regarding the controlled entity, please refer to Note 9.6.
Significant accounting judgements, estimates and assumptionsIn the application of Australian accounting standards, management is required to make judgements, estimates and assumptions about the carrying values of assets and liabilities. Estimates and judgements are continually evaluated and are based on historical experience and other factors, including expectations of future events that are believed to be reasonable under the circumstances. The key estimates and assumptions that have a significant risk of causing a material adjustment to the carrying amounts of certain assets and liabilities within the next annual reporting period relate to the financial planning and valuation assumptions used to determine the fair value of infrastructure assets, land and building valuations, accrued revenue, provisions, actuarial assumptions used to determine the Group's defined benefit obligations, the useful life of fixed assets, deferred tax balances, contingent assets and liabilities and the impairment of assets.
The assumptions and the related carrying amounts are discussed in the following Notes:
Goods and services tax (GST)Revenues, expenses, liabilities and assets are recognised net of the amount of GST except where the GST incurred on a purchase of goods and services is not recoverable from the Australian Taxation Office, in which case the GST is recognised as part of the acquisition cost of the asset or as part of the expense item as applicable.
Receivables and payables are stated with the amount of GST included. The net amount of GST recoverable from or payable to the Australian Taxation Office is included as part of receivables or payables in the Consolidated Balance Sheet.
Description Note(s) Page
Contingent assets and liabilities 8.3 93
Defined benefit superannuation 9.3 99
Employee benefits 4.1 – 4.2 69
Infrastructure, property, plant and equipment 5.1 71
Receivables 6.1 77
Taxes 3.2 67
Notes to the financial statementsfor the year ended 30 June 2017

South East Water | Annual Report 2016–17 63
Cash flows are included in the Consolidated Cash Flow Statement on a gross basis and the GST component of cash flows arising from investing and financing activities, which is recoverable from, or payable to, the Australian Taxation Office are classified as operating cash flows.
Commitments and contingencies are disclosed inclusive of GST recoverable from, or payable to, the Australian Taxation Office.
RoundingUnless otherwise shown in the Consolidated Financial Report, amounts have been rounded to the nearest thousand dollars.
Accounting policiesUnless otherwise stated, all accounting policies applied are consistent with those of the prior year.
Joint arrangements – AquarevoJoint arrangements are contractual arrangements between the Group and one or more other parties to undertake an economic activity that is subject to joint control.
Joint control is the contractually agreed sharing of control of an arrangement, which exists only when decisions about the relevant activities of the joint arrangement require the unanimous consent of the parties sharing control.
Investments in joint arrangements are classified as either joint operations or joint ventures. The classification depends on the contractual rights and obligations of each investor, rather than the legal structure of the joint arrangement.
The Group entered into a joint operation called Aquarevo with Villawood Properties to develop, subdivide, market and sell land owned by the Group at Evans Road in Lyndhurst through the signing of a Development Deed on 8 December 2015. The Group established that joint control of the operation exists as a Project Control Group (PCG):
1. The PCG consists of four members, two from each party to the arrangement.
2. Decisions made by the PCG require a majority vote, which therefore requires consent from both parties.
3. Major project decisions made by the PCG require unanimous approval.
The Group retains ownership of the land throughout the project until sold to a third party and therefore remains an asset of the Group and is recognised as such in the financial statements. A development fee will be paid to Villawood Properties from sales proceeds and will be recognised as incurred as a selling cost in calculating the net gain or loss on sale of assets. The gain or loss on sale of land assets will be calculated as the net of the sales proceeds less development costs and the carrying value of the land.
The development arrangement is expected to increase the gains on sale of the land versus selling the land as one single parcel.
As the land associated with the arrangement is subdivided and available for sale the value is transferred from non-current assets to current assets held for sale (refer to Note 5.5).

South East Water | Annual Report 2016–17 64
Notes to the financial statementsfor the year ended 30 June 2017
2. Funding delivery of our services
Introduction:This section provides information on income generated by the Group and relevant accounting policies, key estimates and judgements.
Structure:2.1 Summary of income2.2 Service and usage charges2.3 Developer related income2.4 Other revenue
Consolidated entity 2017 $’000
2016 $’000
Service charges
Water service charges 85,870 81,740
Sewerage service charges 260,165 260,208
Trade waste service charges 5,420 5,297
Recycled water service charges 2,858 2,859
Usage charges
Water usage charges 375,581 386,730
Sewage disposal charges 170,364 175,940
Trade waste disposal charges 17,476 18,022
Recycled water usage charges 2,949 2,826
Government Water Rebate (67,809) (66,140)
852,874 867,482
Consolidated entity 2017 $’000
2016 $’000
Service and usage charges 852,874 867,482
Developer related income 125,169 119,319
Other revenue 49,986 51,865
Total revenue 1,028,029 1,038,666
2.1. Summary of income
2.2. Service and usage charges
Service and usage chargesService charges are brought to account evenly throughout the financial year in order to reflect how they are earned. Service charges represent charges for access to water and sewerage services. Usage and disposal charges are brought to account as revenue in the financial year the water is consumed and sewage or trade waste disposed.
Government Water Rebate represents a rebate back to customers provided by South East Water on behalf of the state government on water bills of residential water customers. It was first issued in 2014–15 and is due to be provided each year until 2017–18. The rebate was provided through initiatives including lower interest costs of debt, innovative use of technology and efficient scheduling of maintenance and capital works.
Income is recognised to the extent it is probable the economic benefits will flow to the Group and the income can be reliably measured.
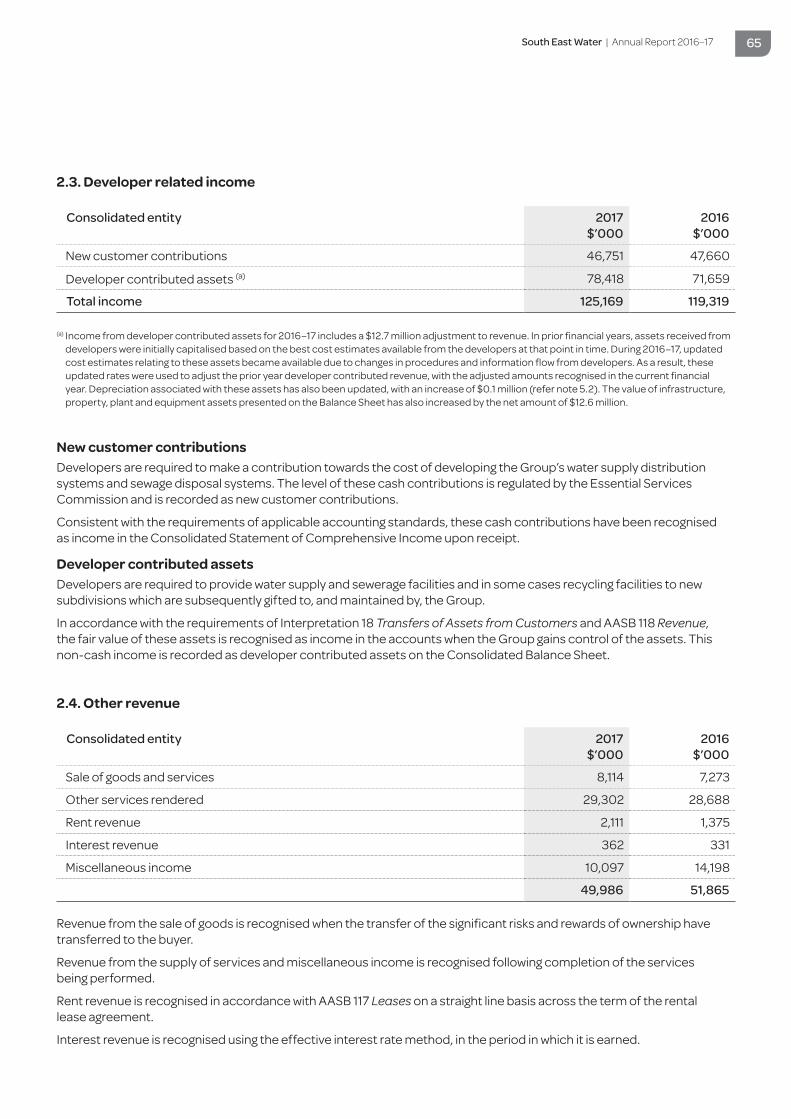
South East Water | Annual Report 2016–17 65
Consolidated entity 2017 $’000
2016 $’000
New customer contributions 46,751 47,660
Developer contributed assets (a) 78,418 71,659
Total income 125,169 119,319
Consolidated entity 2017 $’000
2016 $’000
Sale of goods and services 8,114 7,273
Other services rendered 29,302 28,688
Rent revenue 2,111 1,375
Interest revenue 362 331
Miscellaneous income 10,097 14,198
49,986 51,865
2.3. Developer related income
2.4. Other revenue
New customer contributionsDevelopers are required to make a contribution towards the cost of developing the Group’s water supply distribution systems and sewage disposal systems. The level of these cash contributions is regulated by the Essential Services Commission and is recorded as new customer contributions.
Consistent with the requirements of applicable accounting standards, these cash contributions have been recognised as income in the Consolidated Statement of Comprehensive Income upon receipt.
Developer contributed assetsDevelopers are required to provide water supply and sewerage facilities and in some cases recycling facilities to new subdivisions which are subsequently gifted to, and maintained by, the Group.
In accordance with the requirements of Interpretation 18 Transfers of Assets from Customers and AASB 118 Revenue, the fair value of these assets is recognised as income in the accounts when the Group gains control of the assets. This non-cash income is recorded as developer contributed assets on the Consolidated Balance Sheet.
Revenue from the sale of goods is recognised when the transfer of the significant risks and rewards of ownership have transferred to the buyer.
Revenue from the supply of services and miscellaneous income is recognised following completion of the services being performed.
Rent revenue is recognised in accordance with AASB 117 Leases on a straight line basis across the term of the rental lease agreement.
Interest revenue is recognised using the effective interest rate method, in the period in which it is earned.
(a) Income from developer contributed assets for 2016–17 includes a $12.7 million adjustment to revenue. In prior financial years, assets received from developers were initially capitalised based on the best cost estimates available from the developers at that point in time. During 2016–17, updated cost estimates relating to these assets became available due to changes in procedures and information flow from developers. As a result, these updated rates were used to adjust the prior year developer contributed revenue, with the adjusted amounts recognised in the current financial year. Depreciation associated with these assets has also been updated, with an increase of $0.1 million (refer note 5.2). The value of infrastructure, property, plant and equipment assets presented on the Balance Sheet has also increased by the net amount of $12.6 million.
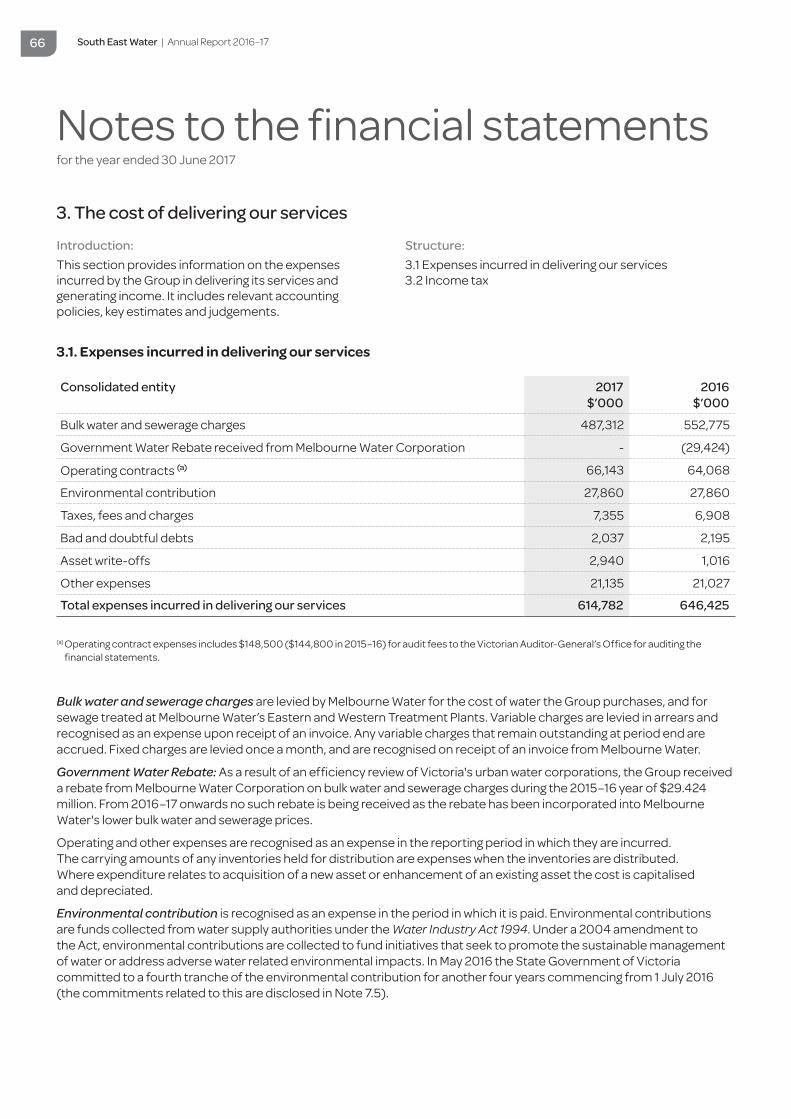
South East Water | Annual Report 2016–17 66
Notes to the financial statementsfor the year ended 30 June 2017
3. The cost of delivering our services
Introduction:This section provides information on the expenses incurred by the Group in delivering its services and generating income. It includes relevant accounting policies, key estimates and judgements.
Structure:3.1 Expenses incurred in delivering our services3.2 Income tax
Consolidated entity 2017 $’000
2016 $’000
Bulk water and sewerage charges 487,312 552,775
Government Water Rebate received from Melbourne Water Corporation - (29,424)
Operating contracts (a) 66,143 64,068
Environmental contribution 27,860 27,860
Taxes, fees and charges 7,355 6,908
Bad and doubtful debts 2,037 2,195
Asset write-offs 2,940 1,016
Other expenses 21,135 21,027
Total expenses incurred in delivering our services 614,782 646,425
(a) Operating contract expenses includes $148,500 ($144,800 in 2015–16) for audit fees to the Victorian Auditor-General’s Office for auditing the financial statements.
Bulk water and sewerage charges are levied by Melbourne Water for the cost of water the Group purchases, and for sewage treated at Melbourne Water’s Eastern and Western Treatment Plants. Variable charges are levied in arrears and recognised as an expense upon receipt of an invoice. Any variable charges that remain outstanding at period end are accrued. Fixed charges are levied once a month, and are recognised on receipt of an invoice from Melbourne Water.
Government Water Rebate: As a result of an efficiency review of Victoria's urban water corporations, the Group received a rebate from Melbourne Water Corporation on bulk water and sewerage charges during the 2015–16 year of $29.424 million. From 2016–17 onwards no such rebate is being received as the rebate has been incorporated into Melbourne Water's lower bulk water and sewerage prices.
Operating and other expenses are recognised as an expense in the reporting period in which they are incurred. The carrying amounts of any inventories held for distribution are expenses when the inventories are distributed. Where expenditure relates to acquisition of a new asset or enhancement of an existing asset the cost is capitalised and depreciated.
Environmental contribution is recognised as an expense in the period in which it is paid. Environmental contributions are funds collected from water supply authorities under the Water Industry Act 1994. Under a 2004 amendment to the Act, environmental contributions are collected to fund initiatives that seek to promote the sustainable management of water or address adverse water related environmental impacts. In May 2016 the State Government of Victoria committed to a fourth tranche of the environmental contribution for another four years commencing from 1 July 2016 (the commitments related to this are disclosed in Note 7.5).
3.1. Expenses incurred in delivering our services

South East Water | Annual Report 2016–17 67
Consolidated entity 2017 $’000
2016 $’000
(a) Income tax expense
The major components of income tax expense are:
Current tax 58,369 51,265
Income tax under provided in prior year - 960
Deferred tax expense/(income) relating to timing differences (663) (225)
57,706 52,000
(b) Deferred income tax recognised in other comprehensive income
Gain/(loss) on revaluation of infrastructure assets (17,445) (23,113)
Gain on revaluation of land and buildings - 1,045
Defined benefit superannuation plan actuarial gain/loss 2,414 (2,585)
(15,031) (24,653)
(c) Reconciliation of income tax expense to prima facie tax payable
Accounting profit before tax 191,964 172,828
Income tax calculated at 30% 57,589 51,848
Add
Non-deductible depreciation - 5
Non-deductible expenses 117 147
Income tax expense 57,706 52,000
(d) Deferred tax items
Deferred tax liabilities
Defined benefit superannuation asset 1,802 -
Prepayments 20 -
Land and buildings 3,927 3,944
Infrastructure 506,760 524,428
Total deferred tax liabilities 512,509 528,372
Recognised directly in equity 344,397 360,040
Recognised directly in net profit 168,112 168,332
Total deferred tax liabilities 512,509 528,372
3.2. Income tax
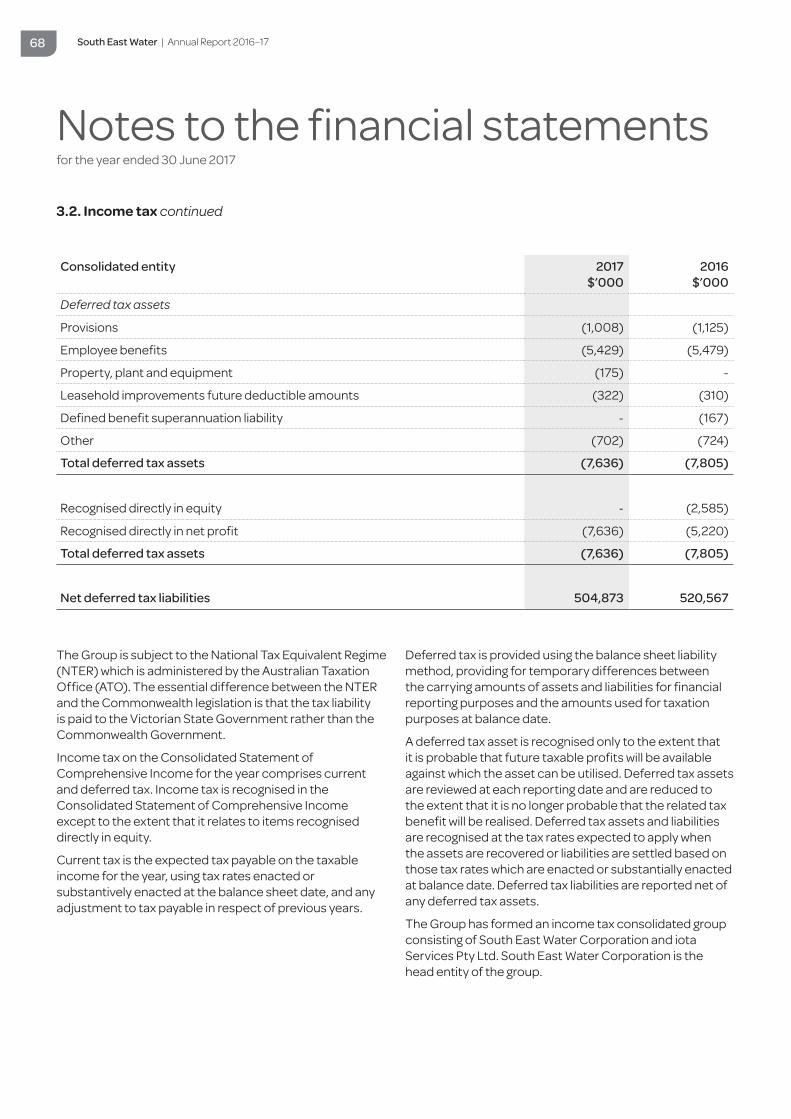
South East Water | Annual Report 2016–17 68
Notes to the financial statementsfor the year ended 30 June 2017
Consolidated entity 2017 $’000
2016 $’000
Deferred tax assets
Provisions (1,008) (1,125)
Employee benefits (5,429) (5,479)
Property, plant and equipment (175) -
Leasehold improvements future deductible amounts (322) (310)
Defined benefit superannuation liability - (167)
Other (702) (724)
Total deferred tax assets (7,636) (7,805)
Recognised directly in equity - (2,585)
Recognised directly in net profit (7,636) (5,220)
Total deferred tax assets (7,636) (7,805)
Net deferred tax liabilities 504,873 520,567
The Group is subject to the National Tax Equivalent Regime (NTER) which is administered by the Australian Taxation Office (ATO). The essential difference between the NTER and the Commonwealth legislation is that the tax liability is paid to the Victorian State Government rather than the Commonwealth Government.
Income tax on the Consolidated Statement of Comprehensive Income for the year comprises current and deferred tax. Income tax is recognised in the Consolidated Statement of Comprehensive Income except to the extent that it relates to items recognised directly in equity.
Current tax is the expected tax payable on the taxable income for the year, using tax rates enacted or substantively enacted at the balance sheet date, and any adjustment to tax payable in respect of previous years.
Deferred tax is provided using the balance sheet liability method, providing for temporary differences between the carrying amounts of assets and liabilities for financial reporting purposes and the amounts used for taxation purposes at balance date.
A deferred tax asset is recognised only to the extent that it is probable that future taxable profits will be available against which the asset can be utilised. Deferred tax assets are reviewed at each reporting date and are reduced to the extent that it is no longer probable that the related tax benefit will be realised. Deferred tax assets and liabilities are recognised at the tax rates expected to apply when the assets are recovered or liabilities are settled based on those tax rates which are enacted or substantially enacted at balance date. Deferred tax liabilities are reported net of any deferred tax assets.
The Group has formed an income tax consolidated group consisting of South East Water Corporation and iota Services Pty Ltd. South East Water Corporation is the head entity of the group.
3.2. Income tax continued
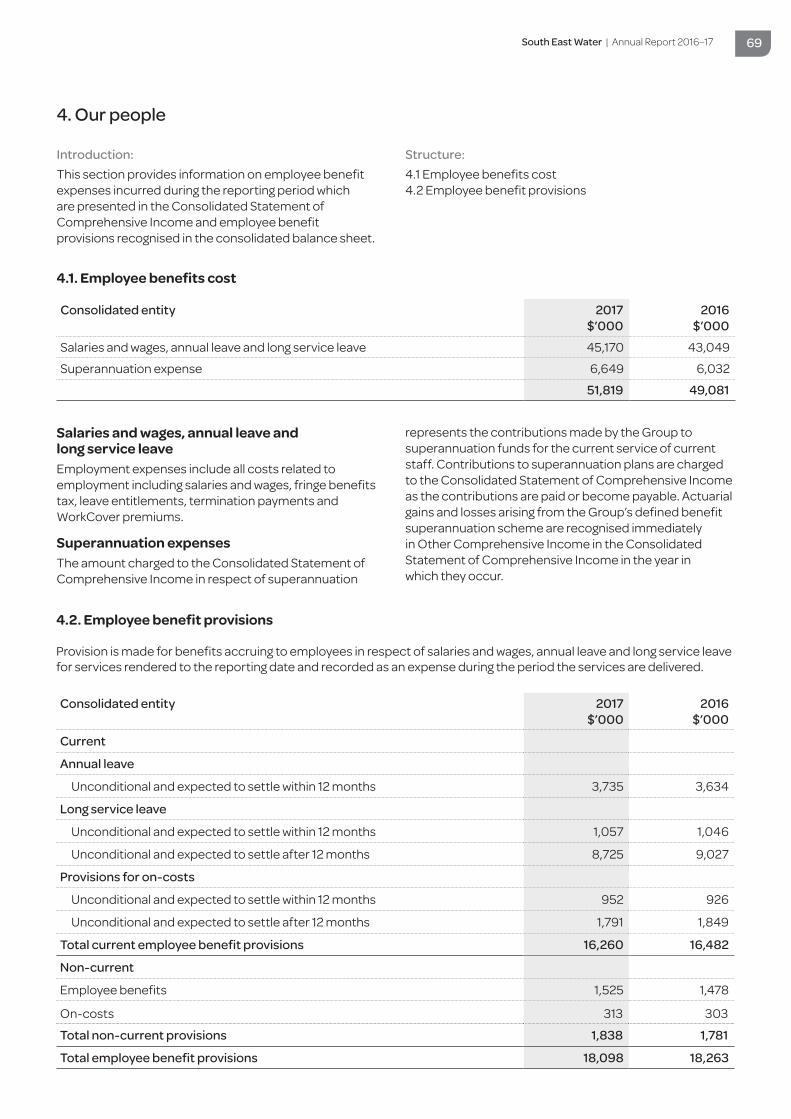
South East Water | Annual Report 2016–17 69
Introduction:This section provides information on employee benefit expenses incurred during the reporting period which are presented in the Consolidated Statement of Comprehensive Income and employee benefit provisions recognised in the consolidated balance sheet.
Structure:4.1 Employee benefits cost4.2 Employee benefit provisions
Consolidated entity 2017 $’000
2016 $’000
Salaries and wages, annual leave and long service leave 45,170 43,049
Superannuation expense 6,649 6,032
51,819 49,081
4.1. Employee benefits cost
Salaries and wages, annual leave and long service leaveEmployment expenses include all costs related to employment including salaries and wages, fringe benefits tax, leave entitlements, termination payments and WorkCover premiums.
Superannuation expensesThe amount charged to the Consolidated Statement of Comprehensive Income in respect of superannuation
represents the contributions made by the Group to superannuation funds for the current service of current staff. Contributions to superannuation plans are charged to the Consolidated Statement of Comprehensive Income as the contributions are paid or become payable. Actuarial gains and losses arising from the Group’s defined benefit superannuation scheme are recognised immediately in Other Comprehensive Income in the Consolidated Statement of Comprehensive Income in the year in which they occur.
4. Our people
Consolidated entity 2017 $’000
2016 $’000
Current
Annual leave
Unconditional and expected to settle within 12 months 3,735 3,634
Long service leave
Unconditional and expected to settle within 12 months 1,057 1,046
Unconditional and expected to settle after 12 months 8,725 9,027
Provisions for on-costs
Unconditional and expected to settle within 12 months 952 926
Unconditional and expected to settle after 12 months 1,791 1,849
Total current employee benefit provisions 16,260 16,482
Non-current
Employee benefits 1,525 1,478
On-costs 313 303
Total non-current provisions 1,838 1,781
Total employee benefit provisions 18,098 18,263
4.2. Employee benefit provisions
Provision is made for benefits accruing to employees in respect of salaries and wages, annual leave and long service leave for services rendered to the reporting date and recorded as an expense during the period the services are delivered.

South East Water | Annual Report 2016–17 70
Notes to the financial statementsfor the year ended 30 June 2017
Salaries and wages, annual leave and sick leaveIn accordance with AASB 119 Employee Benefits, liabilities for salaries and wages (including non-monetary benefits) are recognised as current liabilities because the Group does not have an unconditional right to defer settlements of these liabilities and expects the liabilities to be wholly settled within 12 months of the reporting date. The liabilities are measured using remuneration rates which are current at the reporting date. All on-costs including payroll tax, workers compensation premiums and superannuation are included in the determination of these liabilities.
The annual leave liability is classified as a current liability and measured at the undiscounted amount expected to be paid, as the Group does not have an unconditional right to defer settlement of the liability and the discounted value of amounts expected to be paid after 2017–18 is not materially different from its nominal value.
No provision has been made for sick leave as all sick leave is a non-vesting benefit and is not expected to exceed current and future sick leave entitlements.
Long service leaveThe liability for employees' benefits to long service leave represents the present value of the estimated future cash outflows to be made by the Group resulting from employees' services provided up to the reporting date. Expected future cash outflows are discounted using interest rates attached to national government guaranteed securities as at reporting date with terms to maturity that closely match the estimated future long service leave cash outflows. Discount rates, probability factors and wage/salary growth assumptions are provided by Victoria's Department of Treasury and Finance as part of its long service leave financial model.
Unconditional long service leave is disclosed as a current liability even where the Group does not expect to settle the liability within 12 months because it will not have the unconditional right to defer the settlement of the entitlement.
The components of the current long service leave liability are measured at:
• nominal (undiscounted) value where the Group expects leave to be taken within 12 months of balance date, based on historical data and known commitments for the forthcoming financial year
• present value for employees with seven or more years of continuous service, where the Group does not expect leave to be taken within the forthcoming financial year.
Conditional long service leave is disclosed as a non-current liability. There is an unconditional right to defer the settlement of the entitlement until the employee has completed the requisite years of services. The non-current portion is measured as the present value of long service leave entitlements for employees with less than seven years’ service.
Any gain or loss following revaluation of the present value of the non-current liability is recognised as a transaction, except to the extent that a gain or loss arises due to changes in bond interest rates for which it is then recognised as an ‘other economic flow’ in the net result.
On-costs related to employee benefitsOn-costs such as payroll tax and workers compensation are not employee benefits and are therefore recognised separately from the provision for employee benefits.
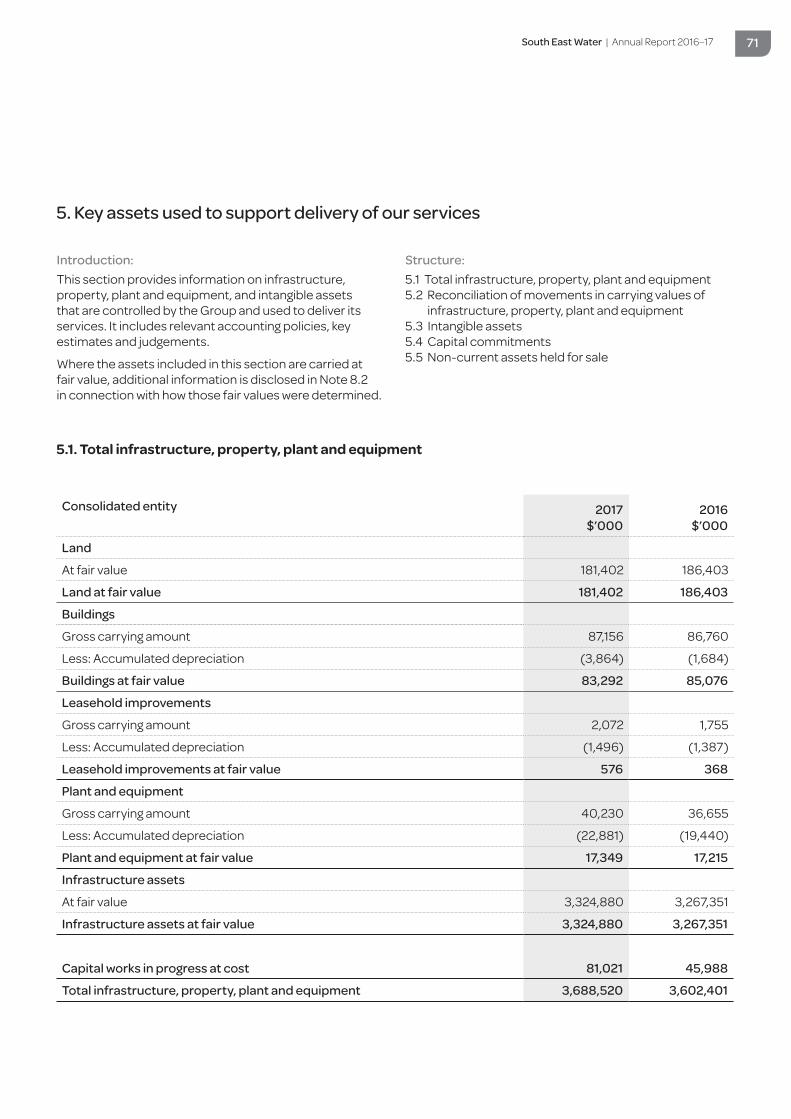
South East Water | Annual Report 2016–17 71
Introduction:This section provides information on infrastructure, property, plant and equipment, and intangible assets that are controlled by the Group and used to deliver its services. It includes relevant accounting policies, key estimates and judgements.
Where the assets included in this section are carried at fair value, additional information is disclosed in Note 8.2 in connection with how those fair values were determined.
Structure:5.1 Total infrastructure, property, plant and equipment5.2 Reconciliation of movements in carrying values of
infrastructure, property, plant and equipment5.3 Intangible assets5.4 Capital commitments5.5 Non-current assets held for sale
5. Key assets used to support delivery of our services
Consolidated entity 2017 $’000
2016 $’000
Land
At fair value 181,402 186,403
Land at fair value 181,402 186,403
Buildings
Gross carrying amount 87,156 86,760
Less: Accumulated depreciation (3,864) (1,684)
Buildings at fair value 83,292 85,076
Leasehold improvements
Gross carrying amount 2,072 1,755
Less: Accumulated depreciation (1,496) (1,387)
Leasehold improvements at fair value 576 368
Plant and equipment
Gross carrying amount 40,230 36,655
Less: Accumulated depreciation (22,881) (19,440)
Plant and equipment at fair value 17,349 17,215
Infrastructure assets
At fair value 3,324,880 3,267,351
Infrastructure assets at fair value 3,324,880 3,267,351
Capital works in progress at cost 81,021 45,988
Total infrastructure, property, plant and equipment 3,688,520 3,602,401
5.1. Total infrastructure, property, plant and equipment
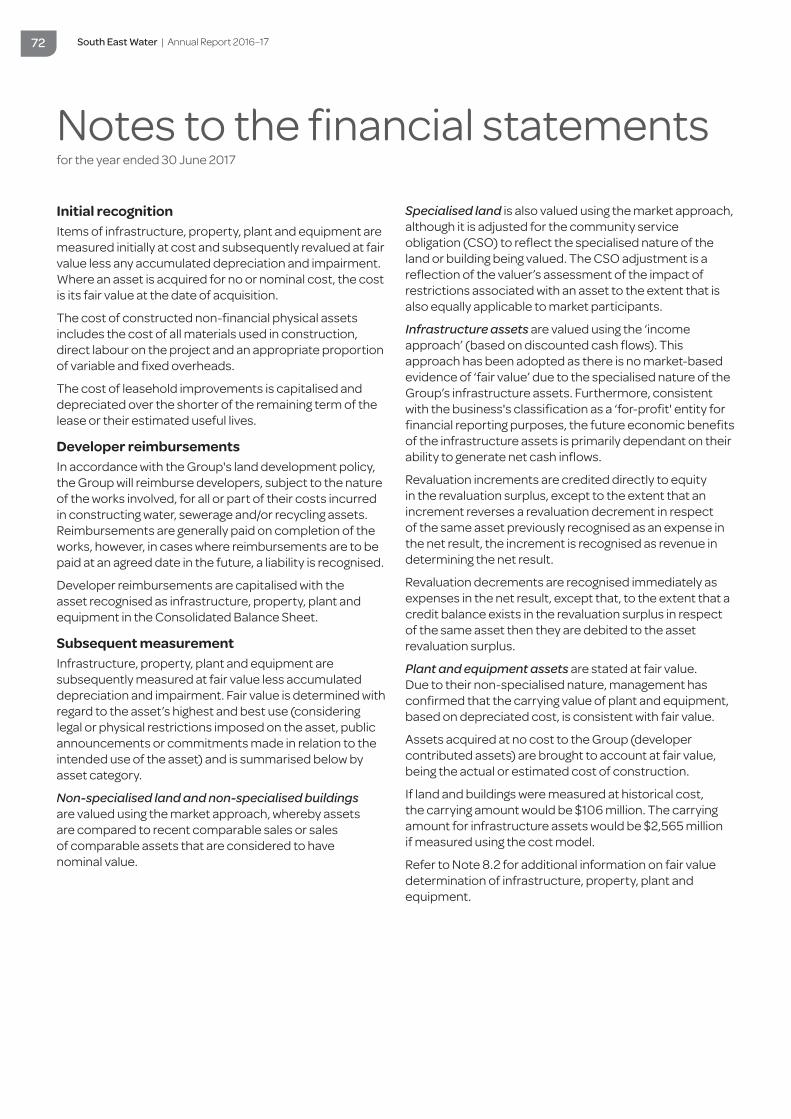
South East Water | Annual Report 2016–17 72
Notes to the financial statementsfor the year ended 30 June 2017
Initial recognitionItems of infrastructure, property, plant and equipment are measured initially at cost and subsequently revalued at fair value less any accumulated depreciation and impairment. Where an asset is acquired for no or nominal cost, the cost is its fair value at the date of acquisition.
The cost of constructed non-financial physical assets includes the cost of all materials used in construction, direct labour on the project and an appropriate proportion of variable and fixed overheads.
The cost of leasehold improvements is capitalised and depreciated over the shorter of the remaining term of the lease or their estimated useful lives.
Developer reimbursementsIn accordance with the Group's land development policy, the Group will reimburse developers, subject to the nature of the works involved, for all or part of their costs incurred in constructing water, sewerage and/or recycling assets. Reimbursements are generally paid on completion of the works, however, in cases where reimbursements are to be paid at an agreed date in the future, a liability is recognised.
Developer reimbursements are capitalised with the asset recognised as infrastructure, property, plant and equipment in the Consolidated Balance Sheet.
Subsequent measurementInfrastructure, property, plant and equipment are subsequently measured at fair value less accumulated depreciation and impairment. Fair value is determined with regard to the asset’s highest and best use (considering legal or physical restrictions imposed on the asset, public announcements or commitments made in relation to the intended use of the asset) and is summarised below by asset category.
Non-specialised land and non-specialised buildings are valued using the market approach, whereby assets are compared to recent comparable sales or sales of comparable assets that are considered to have nominal value.
Specialised land is also valued using the market approach, although it is adjusted for the community service obligation (CSO) to reflect the specialised nature of the land or building being valued. The CSO adjustment is a reflection of the valuer’s assessment of the impact of restrictions associated with an asset to the extent that is also equally applicable to market participants.
Infrastructure assets are valued using the ‘income approach’ (based on discounted cash flows). This approach has been adopted as there is no market-based evidence of ‘fair value’ due to the specialised nature of the Group’s infrastructure assets. Furthermore, consistent with the business's classification as a ‘for-profit' entity for financial reporting purposes, the future economic benefits of the infrastructure assets is primarily dependant on their ability to generate net cash inflows.
Revaluation increments are credited directly to equity in the revaluation surplus, except to the extent that an increment reverses a revaluation decrement in respect of the same asset previously recognised as an expense in the net result, the increment is recognised as revenue in determining the net result.
Revaluation decrements are recognised immediately as expenses in the net result, except that, to the extent that a credit balance exists in the revaluation surplus in respect of the same asset then they are debited to the asset revaluation surplus.
Plant and equipment assets are stated at fair value. Due to their non-specialised nature, management has confirmed that the carrying value of plant and equipment, based on depreciated cost, is consistent with fair value.
Assets acquired at no cost to the Group (developer contributed assets) are brought to account at fair value, being the actual or estimated cost of construction.
If land and buildings were measured at historical cost, the carrying amount would be $106 million. The carrying amount for infrastructure assets would be $2,565 million if measured using the cost model.
Refer to Note 8.2 for additional information on fair value determination of infrastructure, property, plant and equipment.

South East Water | Annual Report 2016–17 73
Impairment of assetsAssets are reviewed for impairment whenever events or changes in circumstances indicate that the carrying amount may not be recoverable. For the purposes of assessing for impairment, assets are grouped at a whole of business level which is considered to be the lowest level for which there are separately identifiable cash flows (cash generating unit).
The assets concerned are tested as to whether their carrying value exceeds their recoverable amount. Where an asset’s carrying value exceeds its recoverable amount, the difference is written off as an ‘other economic flow’, except to the extent that it can be debited to an asset revaluation surplus amount applicable to that class of asset.
If there is an indication that there has been a reversal in impairment, the carrying amount shall be increased to its recoverable amount. However this reversal shall not increase the asset’s carrying amount above what would have been determined, net of depreciation or amortisation, if no impairment loss had been recognised in prior years.
The recoverable amount for most assets is measured at the higher of depreciated replacement cost and fair value less costs to sell. Recoverable amount for assets held primarily to generate net cash inflows is measured at the higher of the present value of future cash flows expected to be obtained from the asset and fair value less costs to sell.
Derecognition and disposalThe carrying amount of an item of infrastructure, property, plant and equipment is derecognised upon disposal or when no further future economic benefits are expected from its use or disposal.
Any loss arising on derecognition of an item of property, plant and equipment is included in profit or loss in the year the asset is derecognised.
Gains or losses on the sale of infrastructure, property, plant and equipment assets are calculated in accordance with AASB 116. This is the gross sale proceeds less the book value of the asset less selling expenses.
Description Depreciation method Useful life
Buildings Straight line 20 – 50 years
Leasehold improvements Straight line 2 – 10 years (i)
Infrastructure assets Straight line 2 – 99 years (ii)
Plant and equipment Reducing balance 5% – 70%
Plant and equipment (iota) Straight line 3 – 20 years
(i) Leasehold improvements useful life range changed from 1 – 20 years to 2 – 10 due to the review and adjustment of asset useful lives.(ii) Infrastructure useful life range changed from 5 – 99 years to 2 – 99 years due to review and adjustment of useful life and addition of a new asset.
DepreciationAll infrastructure assets, buildings, plant and equipment and other non-financial physical assets that have finite useful lives are depreciated. The exceptions to this rule include items under operating leases, assets held for sale and land. Depreciation commences from the date
of acquisition or, in respect of constructed assets, from the time an asset is completed or held ready for use. Depreciation rates are reviewed annually.
Items of infrastructure, property, plant and equipment, excluding land, are depreciated over their expected useful lives to the Group on the following basis:
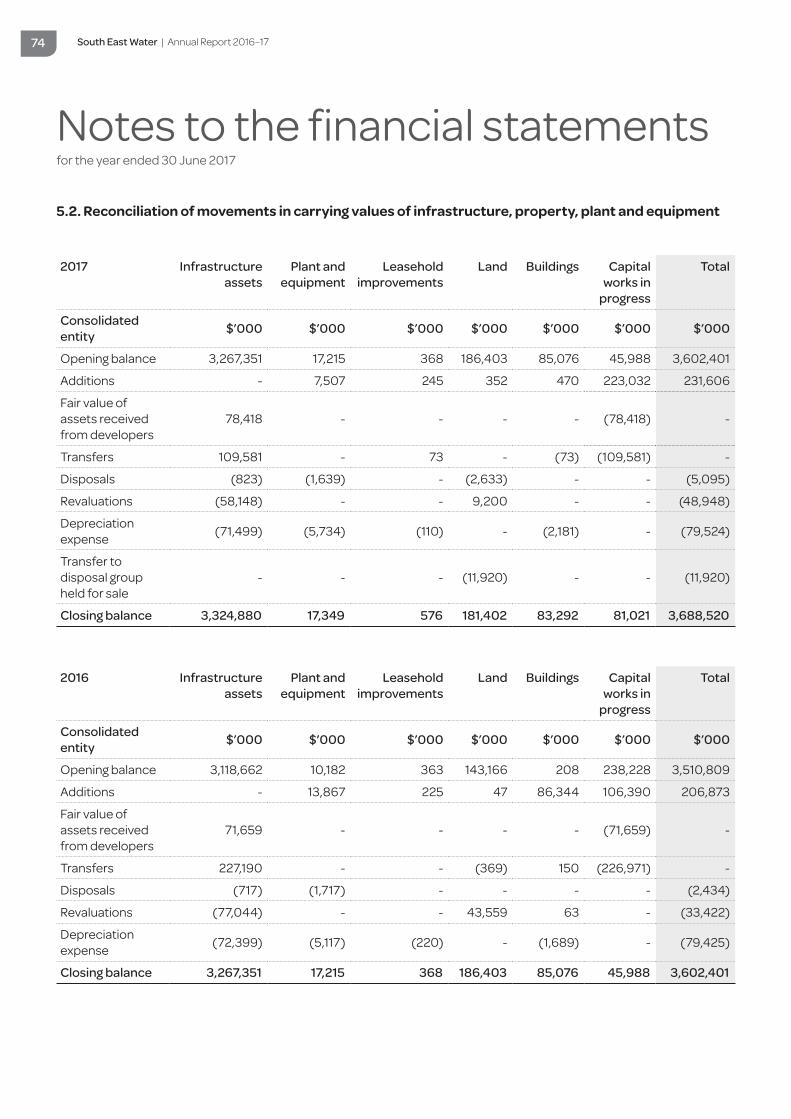
South East Water | Annual Report 2016–17 74
Notes to the financial statementsfor the year ended 30 June 2017
2017 Infrastructure assets
Plant and equipment
Leasehold improvements
Land Buildings Capital works in
progress
Total
Consolidated entity $’000 $’000 $’000 $’000 $’000 $’000 $’000
Opening balance 3,267,351 17,215 368 186,403 85,076 45,988 3,602,401
Additions - 7,507 245 352 470 223,032 231,606
Fair value of assets received from developers
78,418 - - - - (78,418) -
Transfers 109,581 - 73 - (73) (109,581) -
Disposals (823) (1,639) - (2,633) - - (5,095)
Revaluations (58,148) - - 9,200 - - (48,948)
Depreciation expense (71,499) (5,734) (110) - (2,181) - (79,524)
Transfer to disposal group held for sale
- - - (11,920) - - (11,920)
Closing balance 3,324,880 17,349 576 181,402 83,292 81,021 3,688,520
2016 Infrastructure assets
Plant and equipment
Leasehold improvements
Land Buildings Capital works in
progress
Total
Consolidated entity $’000 $’000 $’000 $’000 $’000 $’000 $’000
Opening balance 3,118,662 10,182 363 143,166 208 238,228 3,510,809
Additions - 13,867 225 47 86,344 106,390 206,873
Fair value of assets received from developers
71,659 - - - - (71,659) -
Transfers 227,190 - - (369) 150 (226,971) -
Disposals (717) (1,717) - - - - (2,434)
Revaluations (77,044) - - 43,559 63 - (33,422)
Depreciation expense (72,399) (5,117) (220) - (1,689) - (79,425)
Closing balance 3,267,351 17,215 368 186,403 85,076 45,988 3,602,401
5.2. Reconciliation of movements in carrying values of infrastructure, property, plant and equipment
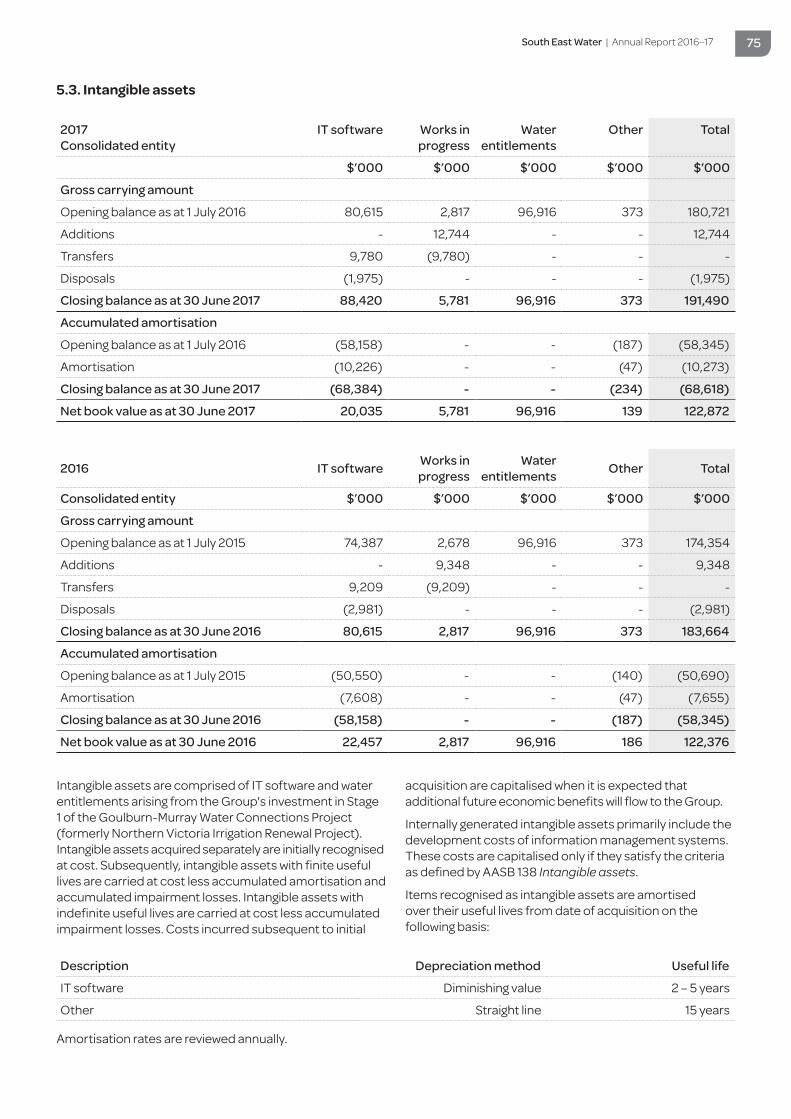
South East Water | Annual Report 2016–17 75
5.3. Intangible assets
2017Consolidated entity
IT software Works in progress
Water entitlements
Other Total
$’000 $’000 $’000 $’000 $’000
Gross carrying amount
Opening balance as at 1 July 2016 80,615 2,817 96,916 373 180,721
Additions - 12,744 - - 12,744
Transfers 9,780 (9,780) - - -
Disposals (1,975) - - - (1,975)
Closing balance as at 30 June 2017 88,420 5,781 96,916 373 191,490
Accumulated amortisation
Opening balance as at 1 July 2016 (58,158) - - (187) (58,345)
Amortisation (10,226) - - (47) (10,273)
Closing balance as at 30 June 2017 (68,384) - - (234) (68,618)
Net book value as at 30 June 2017 20,035 5,781 96,916 139 122,872
2016 IT software Works in progress
Water entitlements Other Total
Consolidated entity $’000 $’000 $’000 $’000 $’000
Gross carrying amount
Opening balance as at 1 July 2015 74,387 2,678 96,916 373 174,354
Additions - 9,348 - - 9,348
Transfers 9,209 (9,209) - - -
Disposals (2,981) - - - (2,981)
Closing balance as at 30 June 2016 80,615 2,817 96,916 373 183,664
Accumulated amortisation
Opening balance as at 1 July 2015 (50,550) - - (140) (50,690)
Amortisation (7,608) - - (47) (7,655)
Closing balance as at 30 June 2016 (58,158) - - (187) (58,345)
Net book value as at 30 June 2016 22,457 2,817 96,916 186 122,376
Intangible assets are comprised of IT software and water entitlements arising from the Group's investment in Stage 1 of the Goulburn-Murray Water Connections Project (formerly Northern Victoria Irrigation Renewal Project). Intangible assets acquired separately are initially recognised at cost. Subsequently, intangible assets with finite useful lives are carried at cost less accumulated amortisation and accumulated impairment losses. Intangible assets with indefinite useful lives are carried at cost less accumulated impairment losses. Costs incurred subsequent to initial
acquisition are capitalised when it is expected that additional future economic benefits will flow to the Group.
Internally generated intangible assets primarily include the development costs of information management systems. These costs are capitalised only if they satisfy the criteria as defined by AASB 138 Intangible assets.
Items recognised as intangible assets are amortised over their useful lives from date of acquisition on the following basis:
Description Depreciation method Useful life
IT software Diminishing value 2 – 5 years
Other Straight line 15 years
Amortisation rates are reviewed annually.
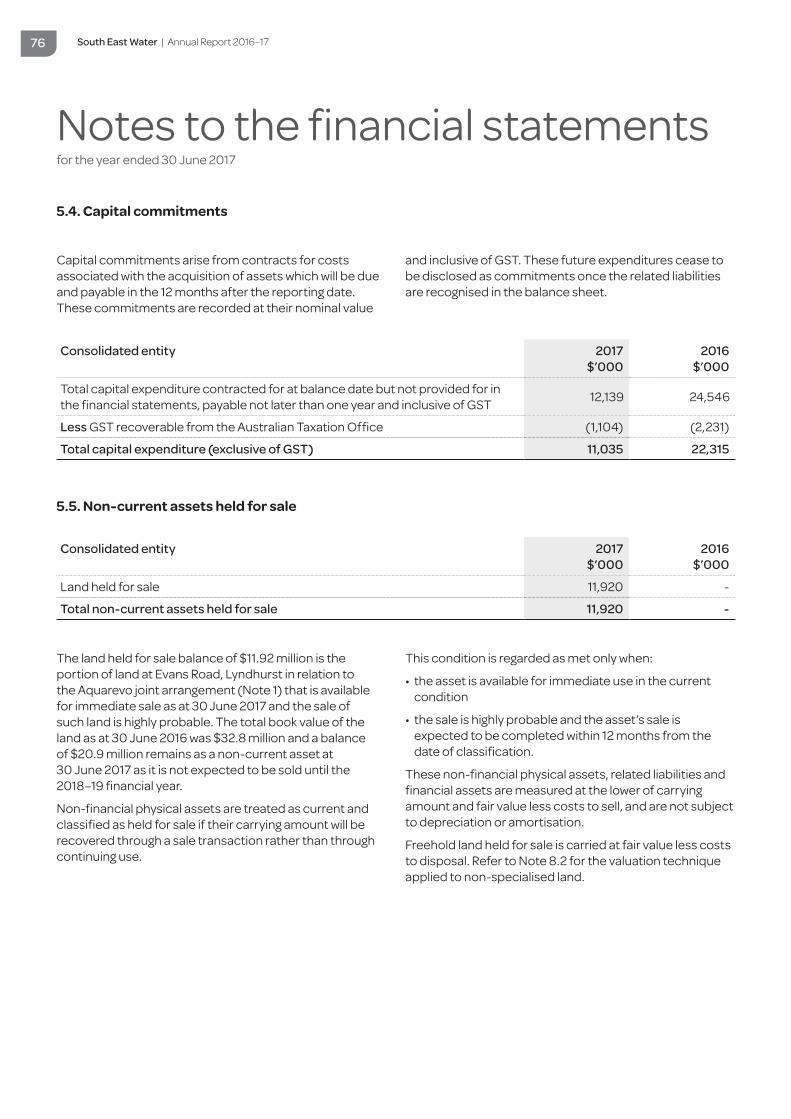
South East Water | Annual Report 2016–17 76
Notes to the financial statementsfor the year ended 30 June 2017
5.4. Capital commitments
5.5. Non-current assets held for sale
Capital commitments arise from contracts for costs associated with the acquisition of assets which will be due and payable in the 12 months after the reporting date. These commitments are recorded at their nominal value
and inclusive of GST. These future expenditures cease to be disclosed as commitments once the related liabilities are recognised in the balance sheet.
The land held for sale balance of $11.92 million is the portion of land at Evans Road, Lyndhurst in relation to the Aquarevo joint arrangement (Note 1) that is available for immediate sale as at 30 June 2017 and the sale of such land is highly probable. The total book value of the land as at 30 June 2016 was $32.8 million and a balance of $20.9 million remains as a non-current asset at 30 June 2017 as it is not expected to be sold until the 2018–19 financial year.
Non-financial physical assets are treated as current and classified as held for sale if their carrying amount will be recovered through a sale transaction rather than through continuing use.
This condition is regarded as met only when:
• the asset is available for immediate use in the current condition
• the sale is highly probable and the asset’s sale is expected to be completed within 12 months from the date of classification.
These non-financial physical assets, related liabilities and financial assets are measured at the lower of carrying amount and fair value less costs to sell, and are not subject to depreciation or amortisation.
Freehold land held for sale is carried at fair value less costs to disposal. Refer to Note 8.2 for the valuation technique applied to non-specialised land.
Consolidated entity 2017 $’000
2016 $’000
Total capital expenditure contracted for at balance date but not provided for in the financial statements, payable not later than one year and inclusive of GST 12,139 24,546
Less GST recoverable from the Australian Taxation Office (1,104) (2,231)
Total capital expenditure (exclusive of GST) 11,035 22,315
Consolidated entity 2017 $’000
2016 $’000
Land held for sale 11,920 -
Total non-current assets held for sale 11,920 -

South East Water | Annual Report 2016–17 77
Introduction:This section provides information on other assets and liabilities utilised and controlled by the Group in its operations.
Structure:6.1 Receivables6.2 Payables6.3 Deposits and advances
6. Other assets and liabilities
Consolidated entity 2017 $’000
2016 $’000
Contractual
Trade debtors 65,820 58,388
Less: Provision for doubtful debts (2,870) (2,850)
Accrued revenue 82,420 80,738
Other debtors 57 52
145,427 136,328
Statutory
GST input tax credits receivable 5,235 4,418
Total receivables 150,662 140,746
6.1. Receivables
Trade debtors are recorded at the amount of contracted sales proceeds less a provision for doubtful debts. Trade debtors are required to be settled within 14 days. Accrued revenue represents the estimated value of water consumed and sewage disposal charges earned but not yet billed at reporting date.
Contractual receivables are classified as financial instruments and are initially recognised at fair value plus any directly attributable transaction costs. Subsequent to initial measurement they are measured at amortised cost using the effective interest method, less any impairment.
Statutory receivables do not arise from contracts and are recognised and measured similarly to contractual receivables (except for impairment), but are not classified as financial instruments.
Bad and doubtful debts: Provision for doubtful debts is recognised to the extent that recovery of the outstanding receivable balance is considered no longer probable. The provision represents an estimate of bad debts to be written off and is made when there is objective evidence that the Group will not be able to collect the debt. Bad debts are written off when determined uncollectable, subject to approval by the board or delegated officer.
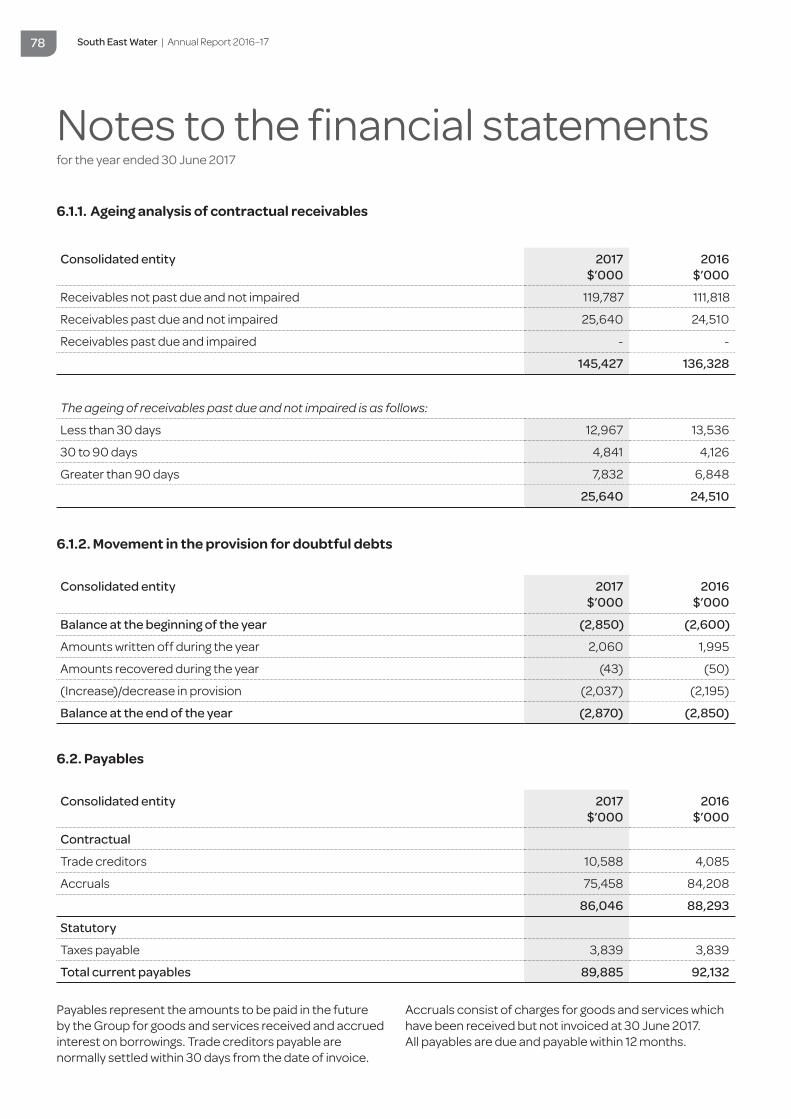
South East Water | Annual Report 2016–17 78
Notes to the financial statementsfor the year ended 30 June 2017
Consolidated entity 2017 $’000
2016 $’000
Receivables not past due and not impaired 119,787 111,818
Receivables past due and not impaired 25,640 24,510
Receivables past due and impaired - -
145,427 136,328
The ageing of receivables past due and not impaired is as follows:
Less than 30 days 12,967 13,536
30 to 90 days 4,841 4,126
Greater than 90 days 7,832 6,848
25,640 24,510
Consolidated entity 2017 $’000
2016 $’000
Balance at the beginning of the year (2,850) (2,600)
Amounts written off during the year 2,060 1,995
Amounts recovered during the year (43) (50)
(Increase)/decrease in provision (2,037) (2,195)
Balance at the end of the year (2,870) (2,850)
Consolidated entity 2017 $’000
2016 $’000
Contractual
Trade creditors 10,588 4,085
Accruals 75,458 84,208
86,046 88,293
Statutory
Taxes payable 3,839 3,839
Total current payables 89,885 92,132
6.1.1. Ageing analysis of contractual receivables
6.1.2. Movement in the provision for doubtful debts
6.2. Payables
Payables represent the amounts to be paid in the future by the Group for goods and services received and accrued interest on borrowings. Trade creditors payable are normally settled within 30 days from the date of invoice.
Accruals consist of charges for goods and services which have been received but not invoiced at 30 June 2017. All payables are due and payable within 12 months.
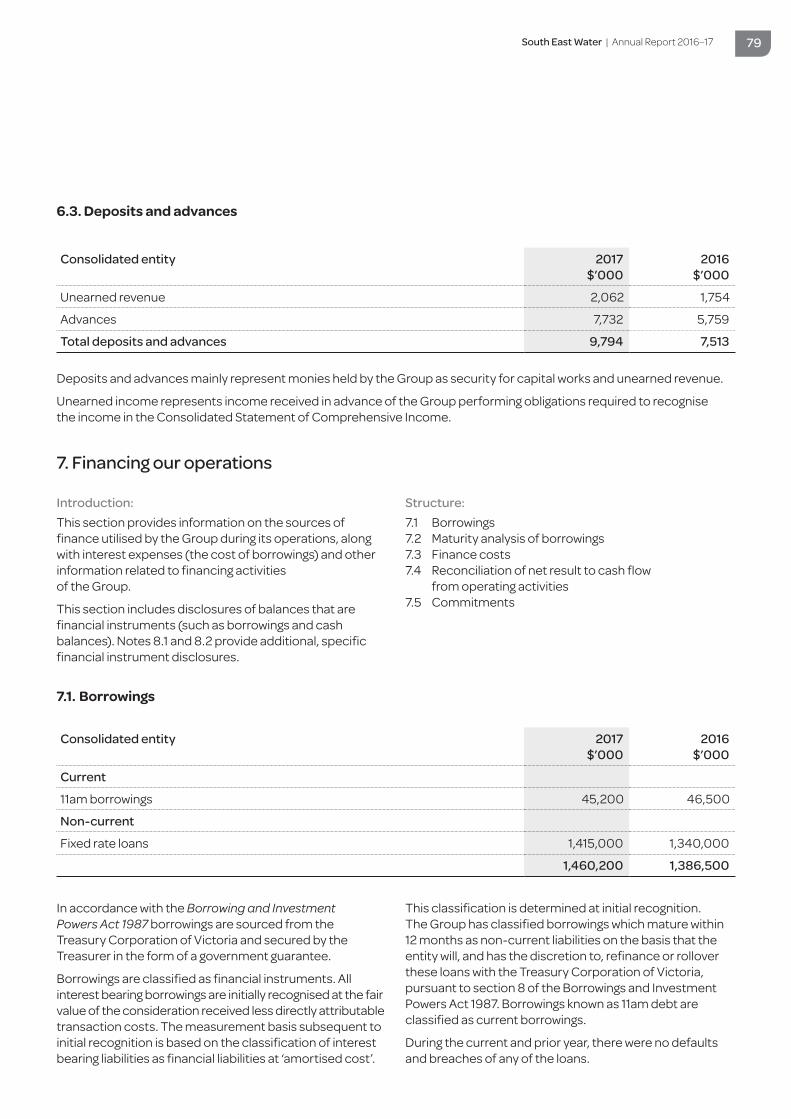
South East Water | Annual Report 2016–17 79
Consolidated entity 2017 $’000
2016 $’000
Unearned revenue 2,062 1,754
Advances 7,732 5,759
Total deposits and advances 9,794 7,513
Consolidated entity 2017 $’000
2016 $’000
Current
11am borrowings 45,200 46,500
Non-current
Fixed rate loans 1,415,000 1,340,000
1,460,200 1,386,500
6.3. Deposits and advances
7.1. Borrowings
Deposits and advances mainly represent monies held by the Group as security for capital works and unearned revenue.
Unearned income represents income received in advance of the Group performing obligations required to recognise the income in the Consolidated Statement of Comprehensive Income.
Introduction:This section provides information on the sources of finance utilised by the Group during its operations, along with interest expenses (the cost of borrowings) and other information related to financing activities of the Group.
This section includes disclosures of balances that are financial instruments (such as borrowings and cash balances). Notes 8.1 and 8.2 provide additional, specific financial instrument disclosures.
Structure:7.1 Borrowings7.2 Maturity analysis of borrowings7.3 Finance costs7.4 Reconciliation of net result to cash flow
from operating activities7.5 Commitments
In accordance with the Borrowing and Investment Powers Act 1987 borrowings are sourced from the Treasury Corporation of Victoria and secured by the Treasurer in the form of a government guarantee.
Borrowings are classified as financial instruments. All interest bearing borrowings are initially recognised at the fair value of the consideration received less directly attributable transaction costs. The measurement basis subsequent to initial recognition is based on the classification of interest bearing liabilities as financial liabilities at ‘amortised cost’.
This classification is determined at initial recognition. The Group has classified borrowings which mature within 12 months as non-current liabilities on the basis that the entity will, and has the discretion to, refinance or rollover these loans with the Treasury Corporation of Victoria, pursuant to section 8 of the Borrowings and Investment Powers Act 1987. Borrowings known as 11am debt are classified as current borrowings.
During the current and prior year, there were no defaults and breaches of any of the loans.
7. Financing our operations

South East Water | Annual Report 2016–17 80
Notes to the financial statementsfor the year ended 30 June 2017
7.2. Maturity analysis of borrowings
Consolidated entity Weighted average
interest rate
Less than 1 year
1 to 5 years
More than 5 years
Total
$’000 $’000 $’000 $’000 $’000
30 June 2017
Borrowings – floating interest rate 1.67% 45,200 - - 45,200
Borrowings – fixed interest rate 4.23% - 544,150 870,850 1,415,000
Total 45,200 544,150 870,850 1,460,200
30 June 2016
Borrowings – floating interest rate 1.92% 46,500 - - 46,500
Borrowings – fixed interest rate 4.51% - 547,500 792,500 1,340,000
Total 46,500 547,500 792,500 1,386,500
Consolidated entity 2017 $’000
2016 $’000
Interest expense 61,377 62,499
Financial accommodation levy 19,667 18,011
Bank charges 35 24
Total finance costs 81,079 80,534
7.3. Finance costs
Finance costs are recognised as expenses in the period in which they are incurred. Finance costs include interest on short and long-term borrowings and the Victorian Government’s financial accommodation levy. All qualifying assets (being assets that necessarily take a substantial period of time to get ready for their intended use or sale) are measured at fair value. Therefore any finance costs directly attributable to the acquisition, construction or
production of these qualifying assets are not required to be capitalised and will continue to be expensed in the period in which they are incurred.
The financial accommodation levy is paid by the Group into the Consolidated Fund in accordance with section 40N of the Financial Management Act 1994 in respect of financial accommodation provided to the Group by the State Government of Victoria.

South East Water | Annual Report 2016–17 81
Consolidated entity 2017 $’000
2016 $’000
Net result after income tax 134,259 120,828
Depreciation 79,524 79,424
Write-off of non-current assets 2,940 1,016
Net (profit)/loss on sales of assets (1,378) (225)
Amortisation 10,273 10,597
Developer contributed assets (78,418) (71,659)
Defined benefit (income)/expenses 1,485 1,236
Changes in operating assets and liabilities
(Increase)/decrease in receivables (9,917) (10,862)
(Increase)/decrease in inventories 296 (1,076)
(Increase)/decrease in prepayments (5,269) (454)
Increase/(decrease) in trade creditors (4,033) (10,027)
Increase/(decrease) in income tax payable 5,358 13,214
Increase/(decrease) in net deferred tax liabilities (663) (227)
Increase/(decrease) in provisions (576) 509
Increase/(decrease) in deposits and advances 2,282 (6,331)
Increase/(decrease) in accrued interest payable 186 122
Net cash inflow from operating activities 136,349 126,085
7.4. Reconciliation of net result to cash flow from operating activities
Consolidated entity 2017 $’000
2016 $’000
Environmental contribution levy commitments payable at balance date not subject to GST and not provided for in the financial statements, payable:
Not later than one year 27,860 27,860
Later than 1 year and not later than 5 years 81,386 109,246
Total environmental contribution levy commitments 109,246 137,106
In May 2016 the State Government of Victoria committed to a fourth tranche of the environmental contribution for another four years commencing from 1 July 2016. The Act establishes an obligation for the Group to pay to the Department of Environment, Land, Water and Planning annual contributions of $27.9 million per annum until 2017–18 and then $40.7 million per annum until 2019–20. The contribution is recognised as an expense during the reporting period it is paid.
7.5. Commitments
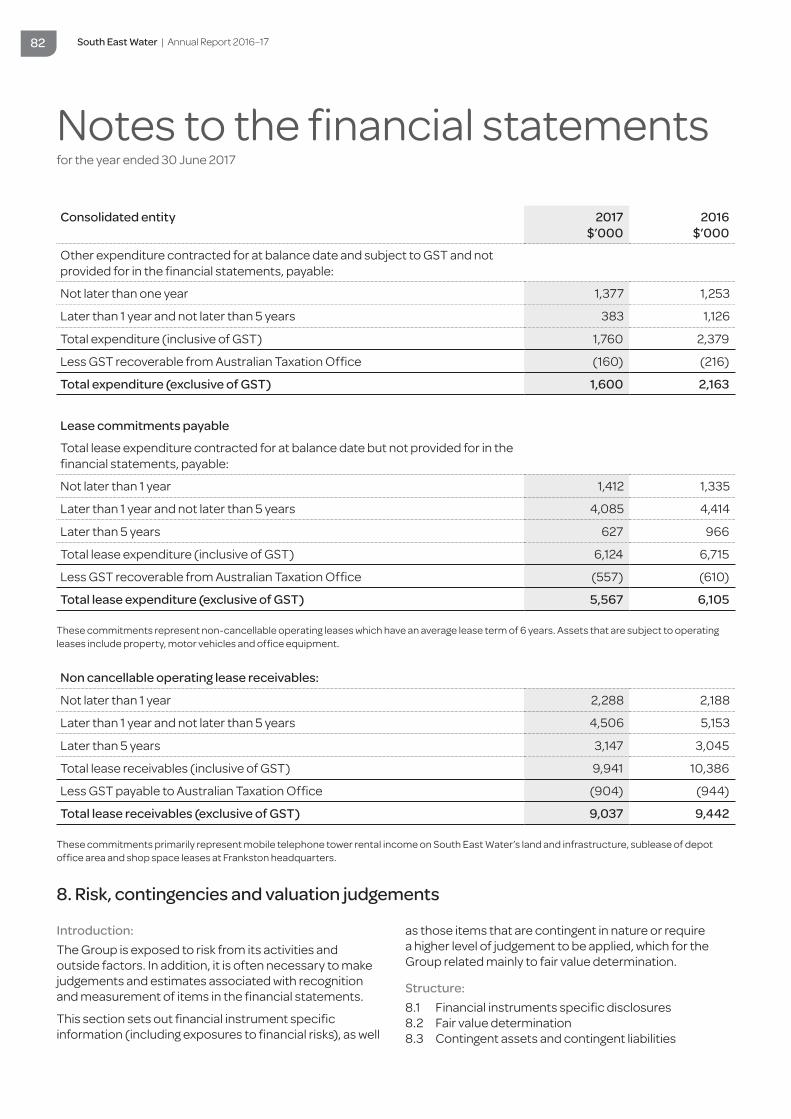
South East Water | Annual Report 2016–17 82
Notes to the financial statementsfor the year ended 30 June 2017
Consolidated entity 2017 $’000
2016 $’000
Other expenditure contracted for at balance date and subject to GST and not provided for in the financial statements, payable:
Not later than one year 1,377 1,253
Later than 1 year and not later than 5 years 383 1,126
Total expenditure (inclusive of GST) 1,760 2,379
Less GST recoverable from Australian Taxation Office (160) (216)
Total expenditure (exclusive of GST) 1,600 2,163
Lease commitments payable
Total lease expenditure contracted for at balance date but not provided for in the financial statements, payable:
Not later than 1 year 1,412 1,335
Later than 1 year and not later than 5 years 4,085 4,414
Later than 5 years 627 966
Total lease expenditure (inclusive of GST) 6,124 6,715
Less GST recoverable from Australian Taxation Office (557) (610)
Total lease expenditure (exclusive of GST) 5,567 6,105
These commitments represent non-cancellable operating leases which have an average lease term of 6 years. Assets that are subject to operating leases include property, motor vehicles and office equipment.
Non cancellable operating lease receivables:
Not later than 1 year 2,288 2,188
Later than 1 year and not later than 5 years 4,506 5,153
Later than 5 years 3,147 3,045
Total lease receivables (inclusive of GST) 9,941 10,386
Less GST payable to Australian Taxation Office (904) (944)
Total lease receivables (exclusive of GST) 9,037 9,442
These commitments primarily represent mobile telephone tower rental income on South East Water’s land and infrastructure, sublease of depot office area and shop space leases at Frankston headquarters.
Introduction:The Group is exposed to risk from its activities and outside factors. In addition, it is often necessary to make judgements and estimates associated with recognition and measurement of items in the financial statements.
This section sets out financial instrument specific information (including exposures to financial risks), as well
as those items that are contingent in nature or require a higher level of judgement to be applied, which for the Group related mainly to fair value determination.
Structure:8.1 Financial instruments specific disclosures8.2 Fair value determination 8.3 Contingent assets and contingent liabilities
8. Risk, contingencies and valuation judgements

South East Water | Annual Report 2016–17 83
8.1. Financial instruments specific disclosuresFinancial instruments arise out of contractual arrangements that give rise to a financial asset of one entity and a financial liability or equity instrument of another entity. Due to the nature of the Group’s activities, certain financial assets and financial liabilities arise under statute rather than a contract (for example taxes, fines and penalties). Such assets and liabilities do not meet the definition of financial instruments in AASB 132 Financial instruments: presentation.
Categories of financial instrumentsLoans and receivables and cash are financial instrument assets with fixed and determinable payments that are not quoted on an active market. These assets and liabilities are initially recognised at fair value plus any directly attributable transaction costs. Subsequent to initial measurement, loans and receivables are measured at amortised cost using the effective interest method (and for assets, less any impairment). The Group recognises the following assets in this category:
• Cash and deposits
• Receivables (excluding statutory receivables).
Financial liabilities at amortised cost are initially recognised on the date they are originated. They are initially recognised at fair value plus any directly attributable transaction costs. Subsequent to initial recognition, these financial instruments are measured at amortised cost with any difference between the initial recognised amount and the redemption value being recognised in profit and loss over the period of the interest bearing liability, using the effective interest rate method. The Group recognises the following liabilities in this category:
• Payables (excluding statutory payables)
• Borrowings.
Derecognition of financial assets: A financial asset (or, where applicable, a part of a financial asset or part of a group of similar financial assets) is derecognised when:
• The rights to receive cash flows from the asset have expired; or
• The Group retains the right to receive cash flows from the asset, but has assumed an obligation to pay them in full without material delay to a third party under a ‘pass through’ arrangement; or
• The Group has transferred its rights to receive cash flows from the asset and either:
- has transferred substantially all the risks and rewards of the asset; or
- has neither transferred nor retained substantially all the risks and rewards of the asset, but has transferred control of the asset.
Where the Group has neither transferred nor retained substantially all the risks and rewards or transferred control, the asset is recognised to the extent of the Group’s continuing involvement in the asset.
Impairment of financial assets: At the end of each reporting period the Group assesses whether there is objective evidence that a financial asset or group of financial assets is impaired. All financial instrument assets, except those measured at fair value through profit or loss, are subject to annual review for impairment.
The allowance is the difference between the financial asset’s carrying amount and the present value of estimated future cash flows, discounted at the effective interest rate. In assessing impairment of statutory (non-contractual) financial assets, which are not financial instruments, professional judgement is applied in assessing materiality using estimates, averages and other computational methods in accordance with AASB 136 Impairment of Assets. Impairment losses are recognised in the Consolidated Statement of Comprehensive Income. Impairment losses recognised in the Consolidated Statement of Comprehensive Income on equity instruments classified as available for sale are not reversed through the Consolidated Statement of Comprehensive Income.
Derecognition of financial liabilities: A financial liability is derecognised when the obligation under the liability is discharged, cancelled or expires.
When an existing financial liability is replaced by another from the same lender on substantially different terms, or the terms of an existing liability are substantially modified, such an exchange or modification is treated as a derecognition of the original liability and the recognition of a new liability. The difference in the respective carrying amounts is recognised as an ‘other economic flow’ in the consolidated statement of comprehensive income.
The Group considers that the carrying amount of financial assets and financial liabilities (excluding borrowings) recorded in the consolidated financial report to be a fair approximation of their fair values, because of the short term nature of the financial instruments and the expectation that they will be paid in full.
The Group's principal financial instruments are loans sourced from the Treasury Corporation of Victoria. The loans include overnight borrowings and fixed rate loans which are used to meet working capital requirements and fund capital expenditure programs.
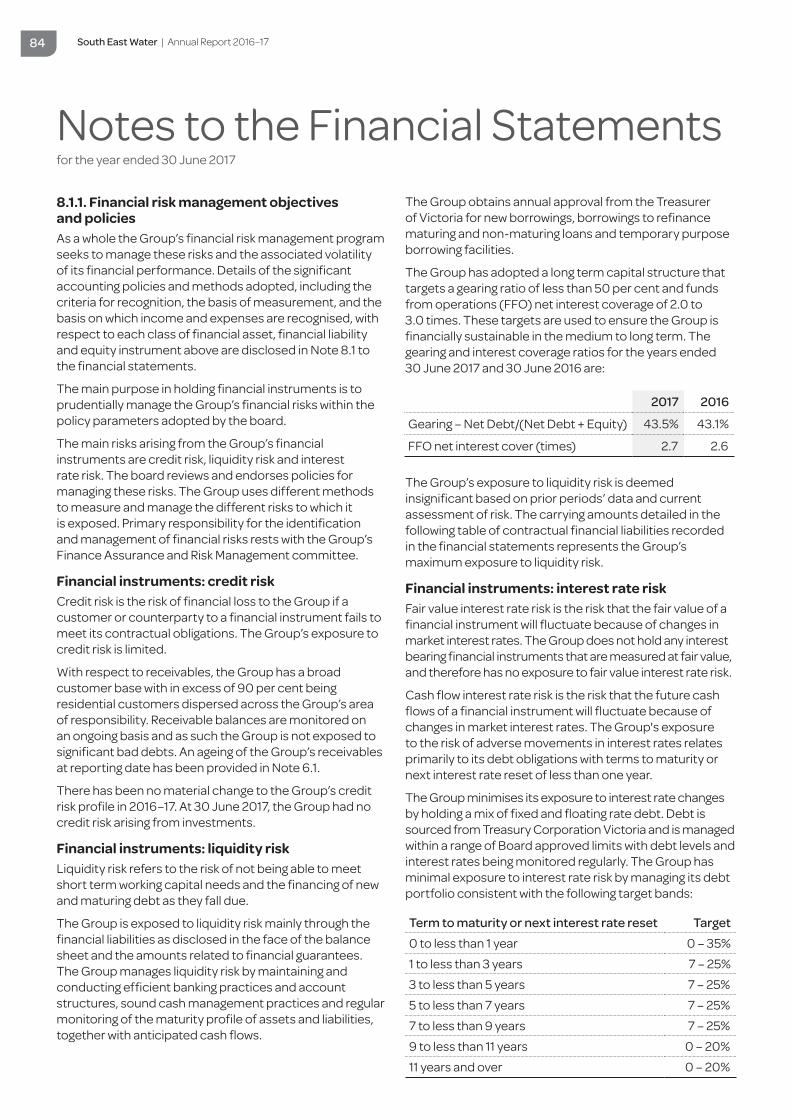
South East Water | Annual Report 2016–17 84
Notes to the Financial Statements for the year ended 30 June 2017
8.1.1. Financial risk management objectives and policiesAs a whole the Group’s financial risk management program seeks to manage these risks and the associated volatility of its financial performance. Details of the significant accounting policies and methods adopted, including the criteria for recognition, the basis of measurement, and the basis on which income and expenses are recognised, with respect to each class of financial asset, financial liability and equity instrument above are disclosed in Note 8.1 to the financial statements.
The main purpose in holding financial instruments is to prudentially manage the Group’s financial risks within the policy parameters adopted by the board.
The main risks arising from the Group’s financial instruments are credit risk, liquidity risk and interest rate risk. The board reviews and endorses policies for managing these risks. The Group uses different methods to measure and manage the different risks to which it is exposed. Primary responsibility for the identification and management of financial risks rests with the Group’s Finance Assurance and Risk Management committee.
Financial instruments: credit riskCredit risk is the risk of financial loss to the Group if a customer or counterparty to a financial instrument fails to meet its contractual obligations. The Group’s exposure to credit risk is limited.
With respect to receivables, the Group has a broad customer base with in excess of 90 per cent being residential customers dispersed across the Group’s area of responsibility. Receivable balances are monitored on an ongoing basis and as such the Group is not exposed to significant bad debts. An ageing of the Group’s receivables at reporting date has been provided in Note 6.1.
There has been no material change to the Group’s credit risk profile in 2016–17. At 30 June 2017, the Group had no credit risk arising from investments.
Financial instruments: liquidity riskLiquidity risk refers to the risk of not being able to meet short term working capital needs and the financing of new and maturing debt as they fall due.
The Group is exposed to liquidity risk mainly through the financial liabilities as disclosed in the face of the balance sheet and the amounts related to financial guarantees. The Group manages liquidity risk by maintaining and conducting efficient banking practices and account structures, sound cash management practices and regular monitoring of the maturity profile of assets and liabilities, together with anticipated cash flows.
The Group obtains annual approval from the Treasurer of Victoria for new borrowings, borrowings to refinance maturing and non-maturing loans and temporary purpose borrowing facilities.
The Group has adopted a long term capital structure that targets a gearing ratio of less than 50 per cent and funds from operations (FFO) net interest coverage of 2.0 to 3.0 times. These targets are used to ensure the Group is financially sustainable in the medium to long term. The gearing and interest coverage ratios for the years ended 30 June 2017 and 30 June 2016 are:
The Group’s exposure to liquidity risk is deemed insignificant based on prior periods’ data and current assessment of risk. The carrying amounts detailed in the following table of contractual financial liabilities recorded in the financial statements represents the Group’s maximum exposure to liquidity risk.
Financial instruments: interest rate riskFair value interest rate risk is the risk that the fair value of a financial instrument will fluctuate because of changes in market interest rates. The Group does not hold any interest bearing financial instruments that are measured at fair value, and therefore has no exposure to fair value interest rate risk.
Cash flow interest rate risk is the risk that the future cash flows of a financial instrument will fluctuate because of changes in market interest rates. The Group's exposure to the risk of adverse movements in interest rates relates primarily to its debt obligations with terms to maturity or next interest rate reset of less than one year.
The Group minimises its exposure to interest rate changes by holding a mix of fixed and floating rate debt. Debt is sourced from Treasury Corporation Victoria and is managed within a range of Board approved limits with debt levels and interest rates being monitored regularly. The Group has minimal exposure to interest rate risk by managing its debt portfolio consistent with the following target bands:
2017 2016
Gearing – Net Debt/(Net Debt + Equity) 43.5% 43.1%
FFO net interest cover (times) 2.7 2.6
Term to maturity or next interest rate reset Target0 to less than 1 year 0 – 35%
1 to less than 3 years 7 – 25%
3 to less than 5 years 7 – 25%
5 to less than 7 years 7 – 25%
7 to less than 9 years 7 – 25%
9 to less than 11 years 0 – 20%
11 years and over 0 – 20%
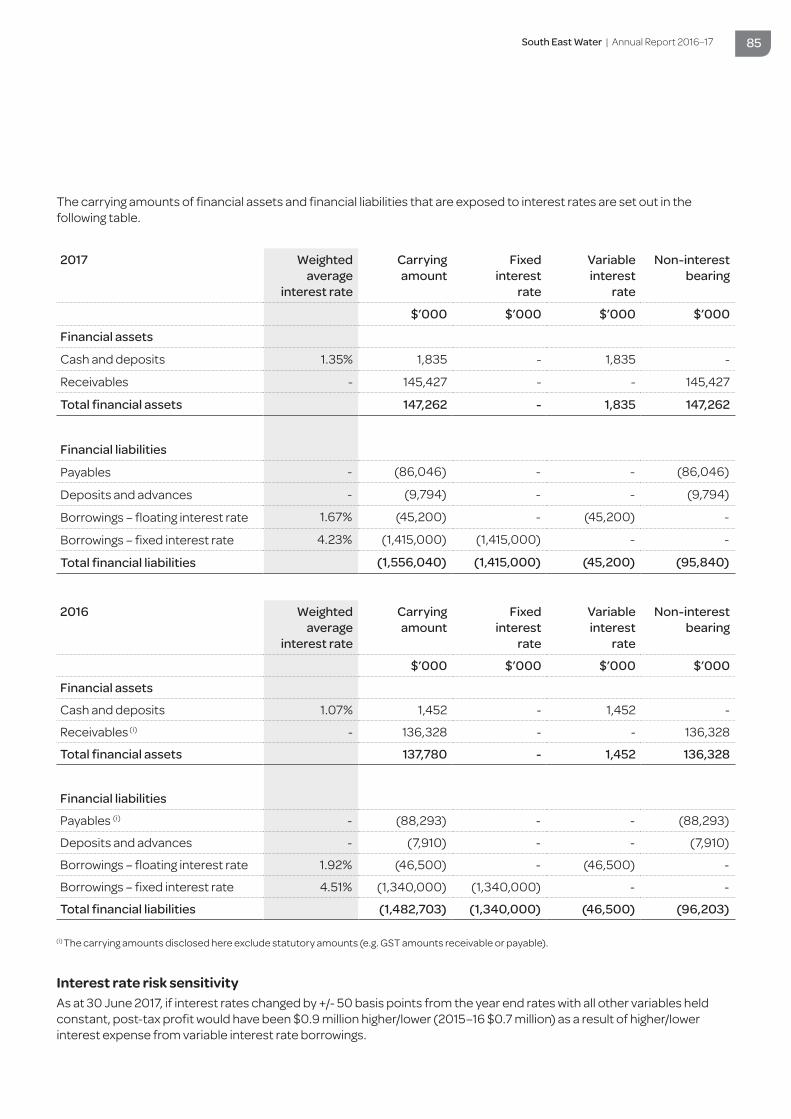
South East Water | Annual Report 2016–17 85
2017 Weighted average
interest rate
Carrying amount
Fixed interest
rate
Variable interest
rate
Non-interest bearing
$’000 $’000 $’000 $’000
Financial assets
Cash and deposits 1.35% 1,835 - 1,835 -
Receivables - 145,427 - - 145,427
Total financial assets 147,262 - 1,835 147,262
Financial liabilities
Payables - (86,046) - - (86,046)
Deposits and advances - (9,794) - - (9,794)
Borrowings – floating interest rate 1.67% (45,200) - (45,200) -
Borrowings – fixed interest rate 4.23% (1,415,000) (1,415,000) - -
Total financial liabilities (1,556,040) (1,415,000) (45,200) (95,840)
The carrying amounts of financial assets and financial liabilities that are exposed to interest rates are set out in the following table.
2016 Weighted average
interest rate
Carrying amount
Fixed interest
rate
Variable interest
rate
Non-interest bearing
$’000 $’000 $’000 $’000
Financial assets
Cash and deposits 1.07% 1,452 - 1,452 -
Receivables (i) - 136,328 - - 136,328
Total financial assets 137,780 - 1,452 136,328
Financial liabilities
Payables (i) - (88,293) - - (88,293)
Deposits and advances ¬- (7,910) - - (7,910)
Borrowings – floating interest rate 1.92% (46,500) - (46,500) -
Borrowings – fixed interest rate 4.51% (1,340,000) (1,340,000) - -
Total financial liabilities (1,482,703) (1,340,000) (46,500) (96,203)
(i) The carrying amounts disclosed here exclude statutory amounts (e.g. GST amounts receivable or payable).
Interest rate risk sensitivityAs at 30 June 2017, if interest rates changed by +/- 50 basis points from the year end rates with all other variables held constant, post-tax profit would have been $0.9 million higher/lower (2015–16 $0.7 million) as a result of higher/lower interest expense from variable interest rate borrowings.

South East Water | Annual Report 2016–17 86
Notes to the financial statementsfor the year ended 30 June 2017
8.2. Fair value determinationFair value determination requires judgement and the use of assumptions. This section discloses the most significant assumptions used in determining fair values. Changes to assumptions could have a material impact on the results and financial position of the Group.
This section sets out information on how the Group determined fair value for financial reporting purposes. Fair value is the price that would be received to sell an asset or paid to transfer a liability in an orderly transaction between market participants at the measurement date. Land, buildings, infrastructure, plant and equipment assets are carried at fair value. In addition, the fair value of other assets and liabilities that are carried at amortised cost, also need to be determined for disclosure purposes.
The Group determines the policies and procedures for determining fair values for both financial and non-financial assets and liabilities as required.
8.2.1. Fair value determination of financial assets and liabilitiesThe fair values and net fair values of financial instrument assets and liabilities are determined as follows.
Level 1: The fair value of financial instrument with standard terms and conditions and traded in active liquid markets are determined with reference to quoted market prices.
Level 2: The fair value is determined using inputs other than quoted prices that are observable for the financial asset or liability, either directly or indirectly.
Level 3: The fair value is determined in accordance with generally accepted pricing models based on discounted cash flow analysis using unobservable market inputs.
The Group considers that the carrying amount of financial instrument assets and liabilities recorded in the financial statements to be a fair approximation of their fair values, because of the short term nature of the financial instruments and the expectation that they will be paid in full.
Where the fair value of the financial instruments is different from the carrying amounts, the following table shows the carrying amounts and fair values of financial assets and financial liabilities, including levels within the fair value hierarchy. The table does not include fair value information for financial assets and financial liabilities not measured at fair value if the carrying amount is a reasonable approximation of fair value e.g. cash, receivables and payables.
There have been no transfers between levels during the period.
In the absence of an active market, the fair value of the Group's borrowings are valued using observable inputs such as recently executed transaction prices in securities of the issuer or comparable issuers and yield curves. Adjustments are made to the valuations when necessary to recognise differences in the instrument's terms. To the extent that the significant inputs are observable, the Group categorises these borrowings as Level 2 within the fair value hierarchy.
Consolidated entity Carrying amount Fair value
Level 1 Level 2 Level 3
$’000 $’000 $’000 $’000
30 June 2017
Financial liabilities
Borrowings (1,460,200) - (1,529,822) -
30 June 2016
Financial liabilities
Borrowings (1,386,500) - (1,510,363) -
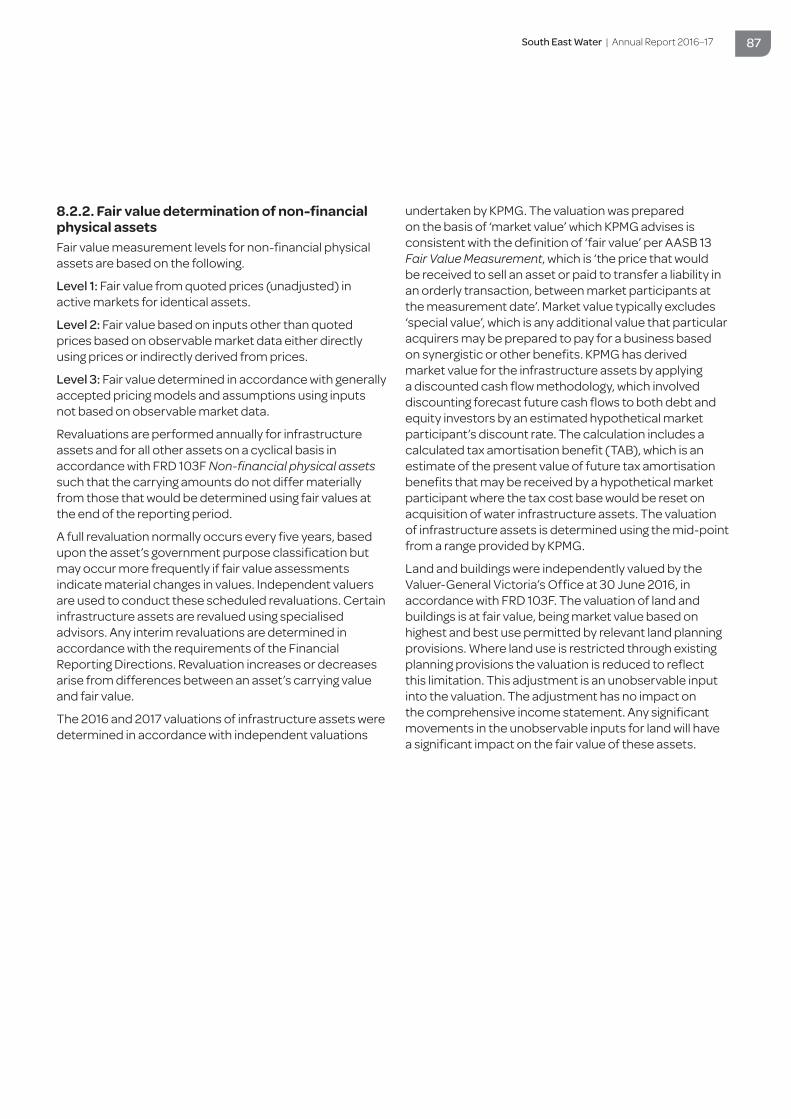
South East Water | Annual Report 2016–17 87
8.2.2. Fair value determination of non-financial physical assetsFair value measurement levels for non-financial physical assets are based on the following.
Level 1: Fair value from quoted prices (unadjusted) in active markets for identical assets.
Level 2: Fair value based on inputs other than quoted prices based on observable market data either directly using prices or indirectly derived from prices.
Level 3: Fair value determined in accordance with generally accepted pricing models and assumptions using inputs not based on observable market data.
Revaluations are performed annually for infrastructure assets and for all other assets on a cyclical basis in accordance with FRD 103F Non-financial physical assets such that the carrying amounts do not differ materially from those that would be determined using fair values at the end of the reporting period.
A full revaluation normally occurs every five years, based upon the asset’s government purpose classification but may occur more frequently if fair value assessments indicate material changes in values. Independent valuers are used to conduct these scheduled revaluations. Certain infrastructure assets are revalued using specialised advisors. Any interim revaluations are determined in accordance with the requirements of the Financial Reporting Directions. Revaluation increases or decreases arise from differences between an asset’s carrying value and fair value.
The 2016 and 2017 valuations of infrastructure assets were determined in accordance with independent valuations
undertaken by KPMG. The valuation was prepared on the basis of ‘market value’ which KPMG advises is consistent with the definition of ‘fair value’ per AASB 13 Fair Value Measurement, which is ‘the price that would be received to sell an asset or paid to transfer a liability in an orderly transaction, between market participants at the measurement date’. Market value typically excludes ‘special value’, which is any additional value that particular acquirers may be prepared to pay for a business based on synergistic or other benefits. KPMG has derived market value for the infrastructure assets by applying a discounted cash flow methodology, which involved discounting forecast future cash flows to both debt and equity investors by an estimated hypothetical market participant’s discount rate. The calculation includes a calculated tax amortisation benefit (TAB), which is an estimate of the present value of future tax amortisation benefits that may be received by a hypothetical market participant where the tax cost base would be reset on acquisition of water infrastructure assets. The valuation of infrastructure assets is determined using the mid-point from a range provided by KPMG.
Land and buildings were independently valued by the Valuer-General Victoria’s Office at 30 June 2016, in accordance with FRD 103F. The valuation of land and buildings is at fair value, being market value based on highest and best use permitted by relevant land planning provisions. Where land use is restricted through existing planning provisions the valuation is reduced to reflect this limitation. This adjustment is an unobservable input into the valuation. The adjustment has no impact on the comprehensive income statement. Any significant movements in the unobservable inputs for land will have a significant impact on the fair value of these assets.
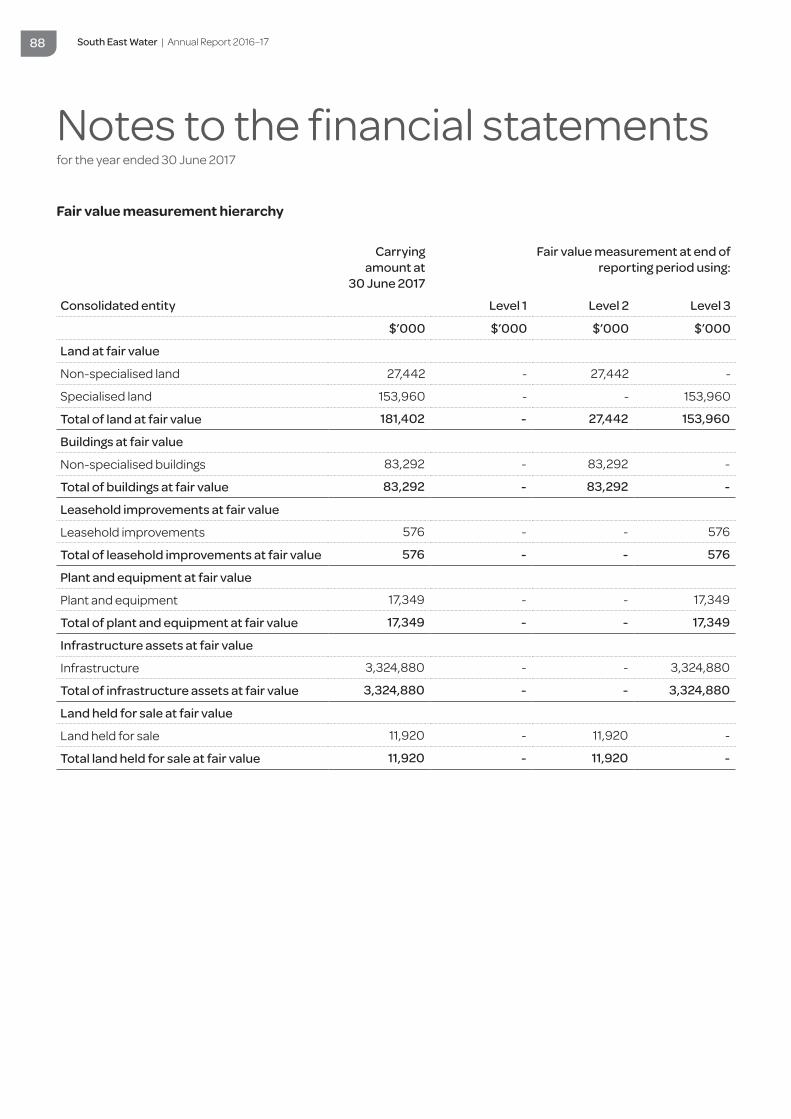
South East Water | Annual Report 2016–17 88
Notes to the financial statementsfor the year ended 30 June 2017
Carrying amount at
30 June 2017
Fair value measurement at end of reporting period using:
Consolidated entity Level 1 Level 2 Level 3
$’000 $’000 $’000 $’000
Land at fair value
Non-specialised land 27,442 - 27,442 -
Specialised land 153,960 - - 153,960
Total of land at fair value 181,402 - 27,442 153,960
Buildings at fair value
Non-specialised buildings 83,292 - 83,292 -
Total of buildings at fair value 83,292 - 83,292 -
Leasehold improvements at fair value
Leasehold improvements 576 - - 576
Total of leasehold improvements at fair value 576 - - 576
Plant and equipment at fair value
Plant and equipment 17,349 - - 17,349
Total of plant and equipment at fair value 17,349 - - 17,349
Infrastructure assets at fair value
Infrastructure 3,324,880 - - 3,324,880
Total of infrastructure assets at fair value 3,324,880 - - 3,324,880
Land held for sale at fair value
Land held for sale 11,920 - 11,920 -
Total land held for sale at fair value 11,920 - 11,920 -
Fair value measurement hierarchy

South East Water | Annual Report 2016–17 89
Carrying amount at
30 June 2016
Fair value measurement at end of reporting period using:
Consolidated entity Level 1 Level 2 Level 3
$’000 $’000 $’000 $’000
Land at fair value
Non-specialised land 6,178 - 6,178 -
Specialised land 180,225 - - 180,225
Total of land at fair value 186,403 - 6,178 180,225
Buildings at fair value
Non-specialised buildings 85,076 - 85,076 -
Total of buildings at fair value 85,076 - 85,076 -
Leasehold improvements at fair value
Leasehold improvements 368 - - 368
Total of leasehold improvements at fair value 368 - - 368
Plant and equipment at fair value
Plant and equipment 17,215 - - 17,215
Total of plant and equipment at fair value 17,215 - - 17,215
Infrastructure assets at fair value
Infrastructure 3,267,351 - - 3,267,351
Total of infrastructure assets at fair value 3,267,351 - - 3,267,351
Non-specialised land and buildings are valued using the market approach. Under this valuation method, the assets are compared to recent comparable sales or sales of comparable assets which are considered to have nominal or no added improvement value. For non-specialised land and buildings an independent valuation was performed by independent valuers the Valuer-General Victoria as at 30 June 2016 to determine the fair value using the market approach. The valuation of the assets was determined by analysing comparable sales and allowing for share, size, topography, location and other relevant factors specific to the asset being valued. From the sales analysed, an appropriate rate per square metre has been applied to the subject asset. The effective date of the valuation is 30 June 2016.
To the extent that non-specialised land and buildings do not contain significant, unobservable adjustments, these assets are classified as Level 2 under the market approach.
Specialised land: The market approach is also used for specialised land, although it is adjusted for the community service obligation to reflect the specialised nature of the land being valued.
The community service obligation adjustment is a reflection of the valuer’s assessment of the impact of restrictions associated with an asset to the extent that is also equally applicable to market participants. This approach is in light of the highest and best use consideration required for fair value measurement, and takes into account the use of the asset that is physically possible, legally permissible, and financially feasible. As adjustments for community service obligations are considered as significant unobservable inputs, specialised land is classified as Level 3 assets. An independent valuation of the Group’s specialised land, based on the market approach, was performed by the Valuer-General Victoria. The effective date of the valuation is 30 June 2016.
Fair value measurement hierarchy continued
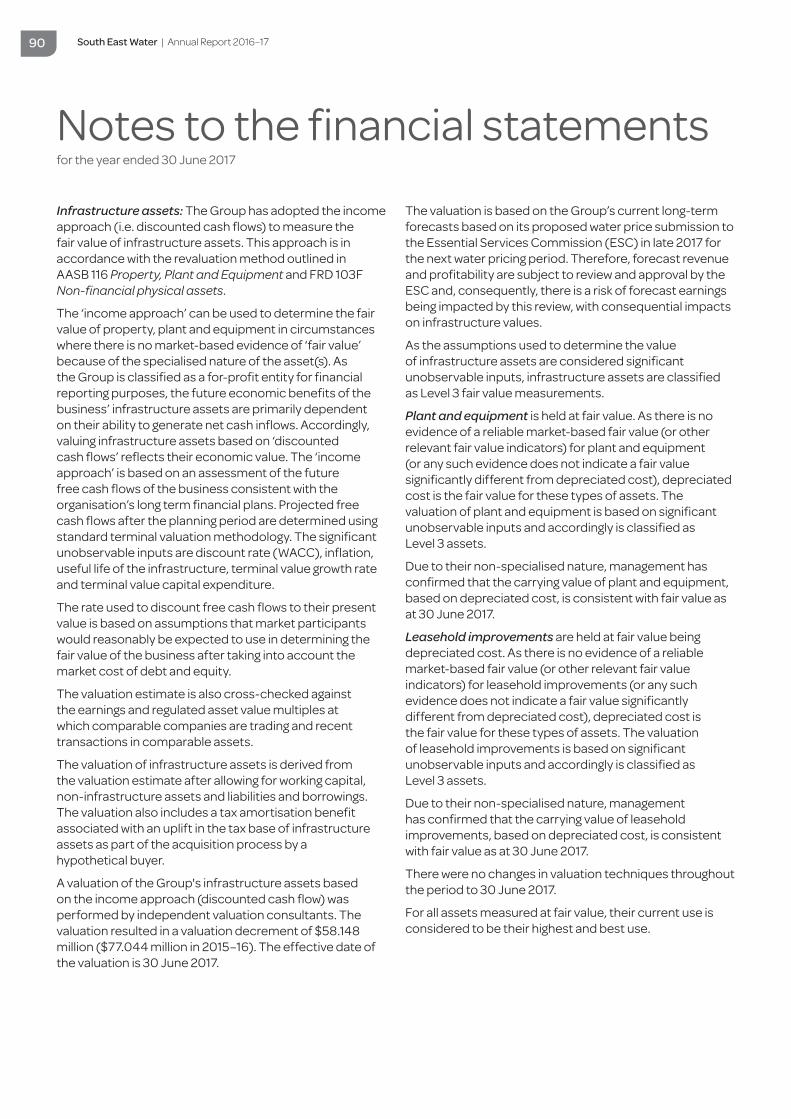
South East Water | Annual Report 2016–17 90
Notes to the financial statementsfor the year ended 30 June 2017
Infrastructure assets: The Group has adopted the income approach (i.e. discounted cash flows) to measure the fair value of infrastructure assets. This approach is in accordance with the revaluation method outlined in AASB 116 Property, Plant and Equipment and FRD 103F Non-financial physical assets.
The ‘income approach’ can be used to determine the fair value of property, plant and equipment in circumstances where there is no market-based evidence of ‘fair value’ because of the specialised nature of the asset(s). As the Group is classified as a for-profit entity for financial reporting purposes, the future economic benefits of the business’ infrastructure assets are primarily dependent on their ability to generate net cash inflows. Accordingly, valuing infrastructure assets based on ‘discounted cash flows’ reflects their economic value. The ‘income approach’ is based on an assessment of the future free cash flows of the business consistent with the organisation’s long term financial plans. Projected free cash flows after the planning period are determined using standard terminal valuation methodology. The significant unobservable inputs are discount rate (WACC), inflation, useful life of the infrastructure, terminal value growth rate and terminal value capital expenditure.
The rate used to discount free cash flows to their present value is based on assumptions that market participants would reasonably be expected to use in determining the fair value of the business after taking into account the market cost of debt and equity.
The valuation estimate is also cross-checked against the earnings and regulated asset value multiples at which comparable companies are trading and recent transactions in comparable assets.
The valuation of infrastructure assets is derived from the valuation estimate after allowing for working capital, non-infrastructure assets and liabilities and borrowings. The valuation also includes a tax amortisation benefit associated with an uplift in the tax base of infrastructure assets as part of the acquisition process by a hypothetical buyer.
A valuation of the Group's infrastructure assets based on the income approach (discounted cash flow) was performed by independent valuation consultants. The valuation resulted in a valuation decrement of $58.148 million ($77.044 million in 2015–16). The effective date of the valuation is 30 June 2017.
The valuation is based on the Group’s current long-term forecasts based on its proposed water price submission to the Essential Services Commission (ESC) in late 2017 for the next water pricing period. Therefore, forecast revenue and profitability are subject to review and approval by the ESC and, consequently, there is a risk of forecast earnings being impacted by this review, with consequential impacts on infrastructure values.
As the assumptions used to determine the value of infrastructure assets are considered significant unobservable inputs, infrastructure assets are classified as Level 3 fair value measurements.
Plant and equipment is held at fair value. As there is no evidence of a reliable market-based fair value (or other relevant fair value indicators) for plant and equipment (or any such evidence does not indicate a fair value significantly different from depreciated cost), depreciated cost is the fair value for these types of assets. The valuation of plant and equipment is based on significant unobservable inputs and accordingly is classified as Level 3 assets.
Due to their non-specialised nature, management has confirmed that the carrying value of plant and equipment, based on depreciated cost, is consistent with fair value as at 30 June 2017.
Leasehold improvements are held at fair value being depreciated cost. As there is no evidence of a reliable market-based fair value (or other relevant fair value indicators) for leasehold improvements (or any such evidence does not indicate a fair value significantly different from depreciated cost), depreciated cost is the fair value for these types of assets. The valuation of leasehold improvements is based on significant unobservable inputs and accordingly is classified as Level 3 assets.
Due to their non-specialised nature, management has confirmed that the carrying value of leasehold improvements, based on depreciated cost, is consistent with fair value as at 30 June 2017.
There were no changes in valuation techniques throughout the period to 30 June 2017.
For all assets measured at fair value, their current use is considered to be their highest and best use.
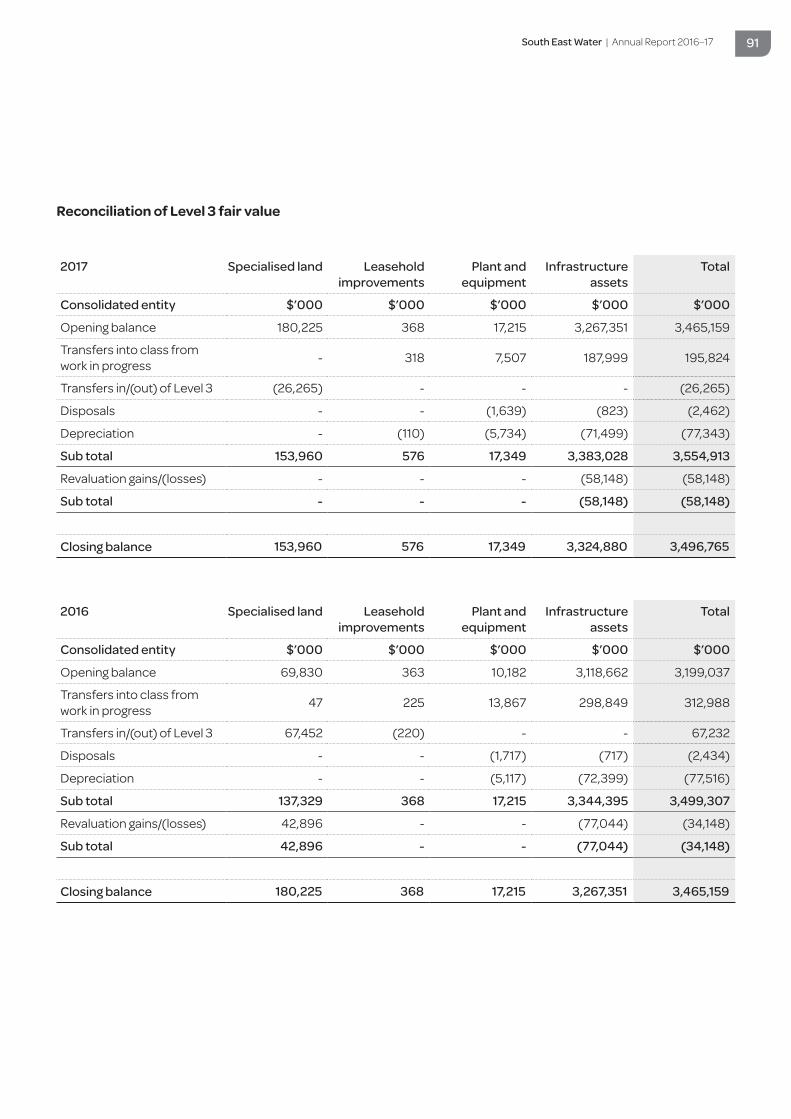
South East Water | Annual Report 2016–17 91
2017 Specialised land Leasehold improvements
Plant and equipment
Infrastructure assets
Total
Consolidated entity $’000 $’000 $’000 $’000 $’000
Opening balance 180,225 368 17,215 3,267,351 3,465,159
Transfers into class from work in progress - 318 7,507 187,999 195,824
Transfers in/(out) of Level 3 (26,265) - - - (26,265)
Disposals - - (1,639) (823) (2,462)
Depreciation - (110) (5,734) (71,499) (77,343)
Sub total 153,960 576 17,349 3,383,028 3,554,913
Revaluation gains/(losses) - - - (58,148) (58,148)
Sub total - - - (58,148) (58,148)
Closing balance 153,960 576 17,349 3,324,880 3,496,765
2016 Specialised land Leasehold improvements
Plant and equipment
Infrastructure assets
Total
Consolidated entity $’000 $’000 $’000 $’000 $’000
Opening balance 69,830 363 10,182 3,118,662 3,199,037
Transfers into class from work in progress 47 225 13,867 298,849 312,988
Transfers in/(out) of Level 3 67,452 (220) - - 67,232
Disposals - - (1,717) (717) (2,434)
Depreciation - - (5,117) (72,399) (77,516)
Sub total 137,329 368 17,215 3,344,395 3,499,307
Revaluation gains/(losses) 42,896 - - (77,044) (34,148)
Sub total 42,896 - - (77,044) (34,148)
Closing balance 180,225 368 17,215 3,267,351 3,465,159
Reconciliation of Level 3 fair value
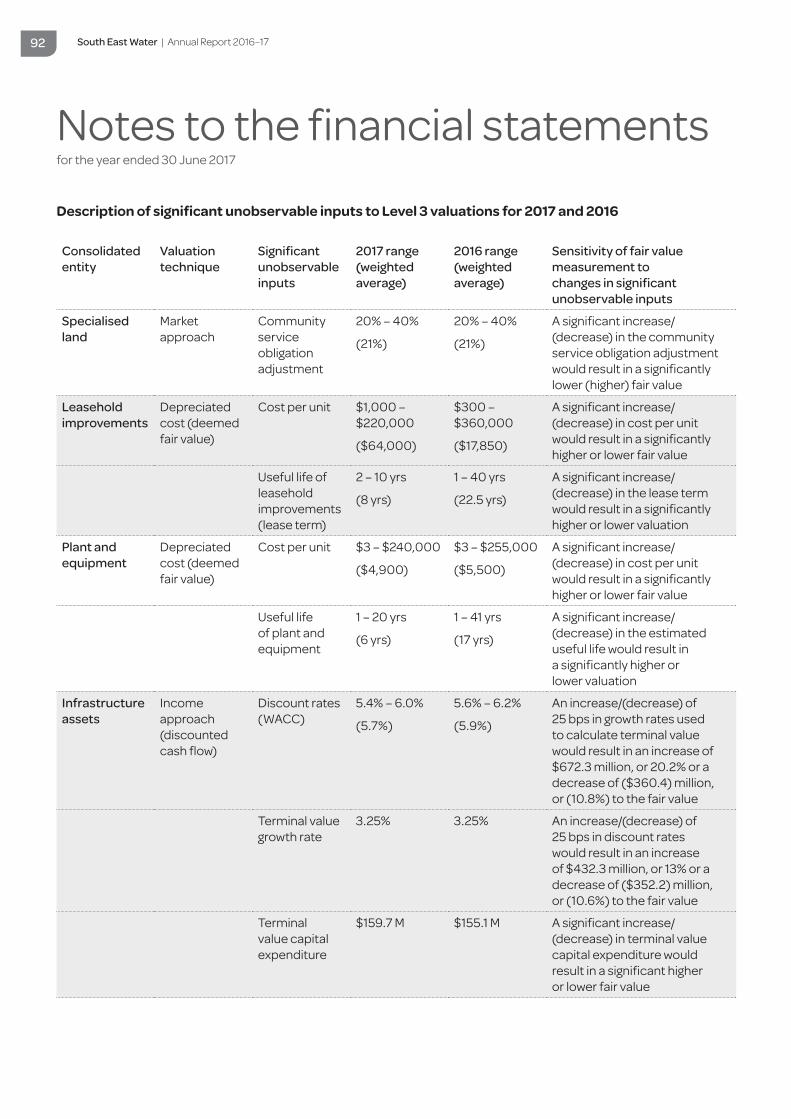
South East Water | Annual Report 2016–17 92
Description of significant unobservable inputs to Level 3 valuations for 2017 and 2016
Consolidated entity
Valuation technique
Significant unobservable inputs
2017 range (weighted average)
2016 range (weighted average)
Sensitivity of fair value measurement to changes in significant unobservable inputs
Specialised land
Market approach
Community service obligation adjustment
20% – 40%
(21%)
20% – 40%
(21%)
A significant increase/(decrease) in the community service obligation adjustment would result in a significantly lower (higher) fair value
Leasehold improvements
Depreciated cost (deemed fair value)
Cost per unit $1,000 – $220,000
($64,000)
$300 – $360,000
($17,850)
A significant increase/(decrease) in cost per unit would result in a significantly higher or lower fair value
Useful life of leasehold improvements (lease term)
2 – 10 yrs
(8 yrs)
1 – 40 yrs
(22.5 yrs)
A significant increase/(decrease) in the lease term would result in a significantly higher or lower valuation
Plant and equipment
Depreciated cost (deemed fair value)
Cost per unit $3 – $240,000
($4,900)
$3 – $255,000
($5,500)
A significant increase/(decrease) in cost per unit would result in a significantly higher or lower fair value
Useful life of plant and equipment
1 – 20 yrs
(6 yrs)
1 – 41 yrs
(17 yrs)
A significant increase/(decrease) in the estimated useful life would result in a significantly higher or lower valuation
Infrastructure assets
Income approach (discounted cash flow)
Discount rates (WACC)
5.4% – 6.0%
(5.7%)
5.6% – 6.2%
(5.9%)
An increase/(decrease) of 25 bps in growth rates used to calculate terminal value would result in an increase of $672.3 million, or 20.2% or a decrease of ($360.4) million, or (10.8%) to the fair value
Terminal value growth rate
3.25% 3.25% An increase/(decrease) of 25 bps in discount rates would result in an increase of $432.3 million, or 13% or a decrease of ($352.2) million, or (10.6%) to the fair value
Terminal value capital expenditure
$159.7 M $155.1 M A significant increase/(decrease) in terminal value capital expenditure would result in a significant higher or lower fair value
Notes to the financial statementsfor the year ended 30 June 2017
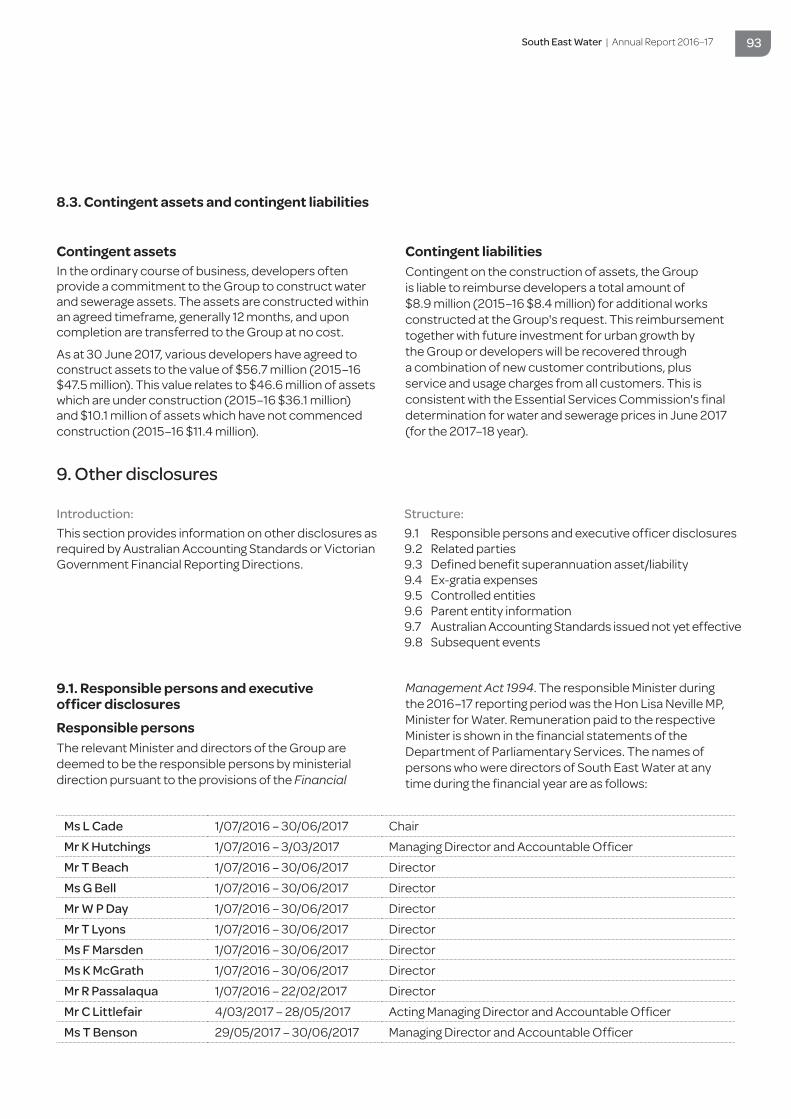
South East Water | Annual Report 2016–17 93
8.3. Contingent assets and contingent liabilities
Contingent assetsIn the ordinary course of business, developers often provide a commitment to the Group to construct water and sewerage assets. The assets are constructed within an agreed timeframe, generally 12 months, and upon completion are transferred to the Group at no cost.
As at 30 June 2017, various developers have agreed to construct assets to the value of $56.7 million (2015–16 $47.5 million). This value relates to $46.6 million of assets which are under construction (2015–16 $36.1 million) and $10.1 million of assets which have not commenced construction (2015–16 $11.4 million).
Contingent liabilitiesContingent on the construction of assets, the Group is liable to reimburse developers a total amount of $8.9 million (2015–16 $8.4 million) for additional works constructed at the Group's request. This reimbursement together with future investment for urban growth by the Group or developers will be recovered through a combination of new customer contributions, plus service and usage charges from all customers. This is consistent with the Essential Services Commission's final determination for water and sewerage prices in June 2017 (for the 2017–18 year).
9. Other disclosures
Introduction:This section provides information on other disclosures as required by Australian Accounting Standards or Victorian Government Financial Reporting Directions.
9.1. Responsible persons and executive officer disclosures
Responsible personsThe relevant Minister and directors of the Group are deemed to be the responsible persons by ministerial direction pursuant to the provisions of the Financial
Management Act 1994. The responsible Minister during the 2016–17 reporting period was the Hon Lisa Neville MP, Minister for Water. Remuneration paid to the respective Minister is shown in the financial statements of the Department of Parliamentary Services. The names of persons who were directors of South East Water at any time during the financial year are as follows:
Ms L Cade 1/07/2016 – 30/06/2017 Chair
Mr K Hutchings 1/07/2016 – 3/03/2017 Managing Director and Accountable Officer
Mr T Beach 1/07/2016 – 30/06/2017 Director
Ms G Bell 1/07/2016 – 30/06/2017 Director
Mr W P Day 1/07/2016 – 30/06/2017 Director
Mr T Lyons 1/07/2016 – 30/06/2017 Director
Ms F Marsden 1/07/2016 – 30/06/2017 Director
Ms K McGrath 1/07/2016 – 30/06/2017 Director
Mr R Passalaqua 1/07/2016 – 22/02/2017 Director
Mr C Littlefair 4/03/2017 – 28/05/2017 Acting Managing Director and Accountable Officer
Ms T Benson 29/05/2017 – 30/06/2017 Managing Director and Accountable Officer
Structure:9.1 Responsible persons and executive officer disclosures9.2 Related parties9.3 Defined benefit superannuation asset/liability9.4 Ex-gratia expenses9.5 Controlled entities9.6 Parent entity information9.7 Australian Accounting Standards issued not yet effective9.8 Subsequent events
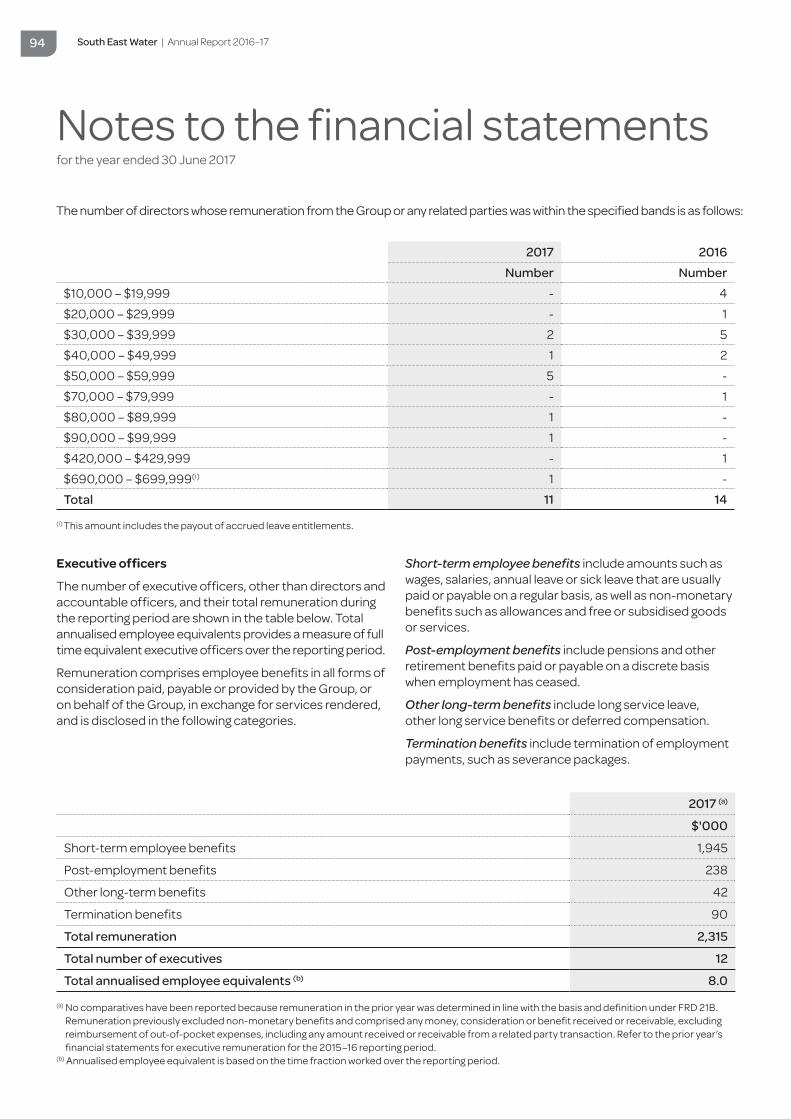
South East Water | Annual Report 2016–17 94
Notes to the financial statementsfor the year ended 30 June 2017
The number of directors whose remuneration from the Group or any related parties was within the specified bands is as follows:
2017 2016Number Number
$10,000 – $19,999 - 4
$20,000 – $29,999 - 1
$30,000 – $39,999 2 5
$40,000 – $49,999 1 2
$50,000 – $59,999 5 -
$70,000 – $79,999 - 1
$80,000 – $89,999 1 -
$90,000 – $99,999 1 -
$420,000 – $429,999 - 1
$690,000 – $699,999(i) 1 -
Total 11 14
Executive officers
The number of executive officers, other than directors and accountable officers, and their total remuneration during the reporting period are shown in the table below. Total annualised employee equivalents provides a measure of full time equivalent executive officers over the reporting period.
Remuneration comprises employee benefits in all forms of consideration paid, payable or provided by the Group, or on behalf of the Group, in exchange for services rendered, and is disclosed in the following categories.
Short-term employee benefits include amounts such as wages, salaries, annual leave or sick leave that are usually paid or payable on a regular basis, as well as non-monetary benefits such as allowances and free or subsidised goods or services.
Post-employment benefits include pensions and other retirement benefits paid or payable on a discrete basis when employment has ceased.
Other long-term benefits include long service leave, other long service benefits or deferred compensation.
Termination benefits include termination of employment payments, such as severance packages.
2017 (a)
$'000
Short-term employee benefits 1,945
Post-employment benefits 238
Other long-term benefits 42
Termination benefits 90
Total remuneration 2,315
Total number of executives 12
Total annualised employee equivalents (b) 8.0
(a) No comparatives have been reported because remuneration in the prior year was determined in line with the basis and definition under FRD 21B. Remuneration previously excluded non-monetary benefits and comprised any money, consideration or benefit received or receivable, excluding reimbursement of out-of-pocket expenses, including any amount received or receivable from a related party transaction. Refer to the prior year’s financial statements for executive remuneration for the 2015–16 reporting period.
(b) Annualised employee equivalent is based on the time fraction worked over the reporting period.
(i) This amount includes the payout of accrued leave entitlements.
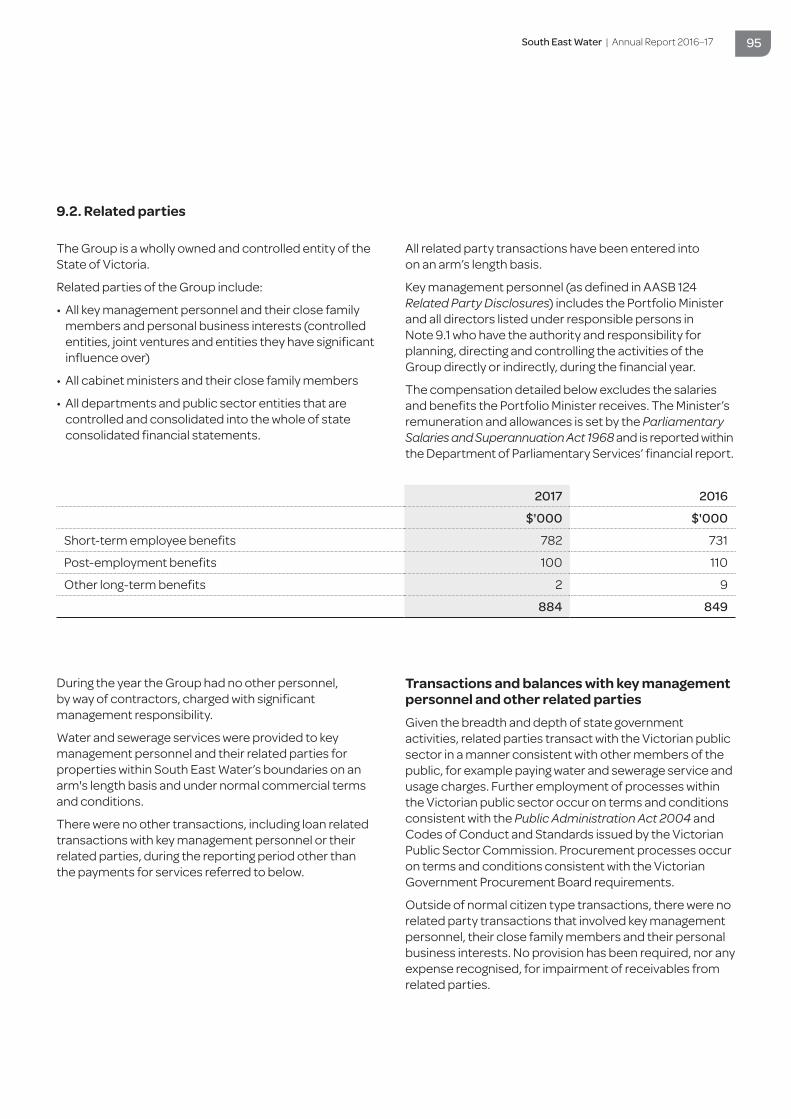
South East Water | Annual Report 2016–17 95
2017 2016
$'000 $'000
Short-term employee benefits 782 731
Post-employment benefits 100 110
Other long-term benefits 2 9
884 849
9.2. Related parties
The Group is a wholly owned and controlled entity of the State of Victoria.
Related parties of the Group include:
• All key management personnel and their close family members and personal business interests (controlled entities, joint ventures and entities they have significant influence over)
• All cabinet ministers and their close family members
• All departments and public sector entities that are controlled and consolidated into the whole of state consolidated financial statements.
All related party transactions have been entered into on an arm’s length basis.
Key management personnel (as defined in AASB 124 Related Party Disclosures) includes the Portfolio Minister and all directors listed under responsible persons in Note 9.1 who have the authority and responsibility for planning, directing and controlling the activities of the Group directly or indirectly, during the financial year.
The compensation detailed below excludes the salaries and benefits the Portfolio Minister receives. The Minister’s remuneration and allowances is set by the Parliamentary Salaries and Superannuation Act 1968 and is reported within the Department of Parliamentary Services’ financial report.
During the year the Group had no other personnel, by way of contractors, charged with significant management responsibility.
Water and sewerage services were provided to key management personnel and their related parties for properties within South East Water’s boundaries on an arm's length basis and under normal commercial terms and conditions.
There were no other transactions, including loan related transactions with key management personnel or their related parties, during the reporting period other than the payments for services referred to below.
Transactions and balances with key management personnel and other related partiesGiven the breadth and depth of state government activities, related parties transact with the Victorian public sector in a manner consistent with other members of the public, for example paying water and sewerage service and usage charges. Further employment of processes within the Victorian public sector occur on terms and conditions consistent with the Public Administration Act 2004 and Codes of Conduct and Standards issued by the Victorian Public Sector Commission. Procurement processes occur on terms and conditions consistent with the Victorian Government Procurement Board requirements.
Outside of normal citizen type transactions, there were no related party transactions that involved key management personnel, their close family members and their personal business interests. No provision has been required, nor any expense recognised, for impairment of receivables from related parties.
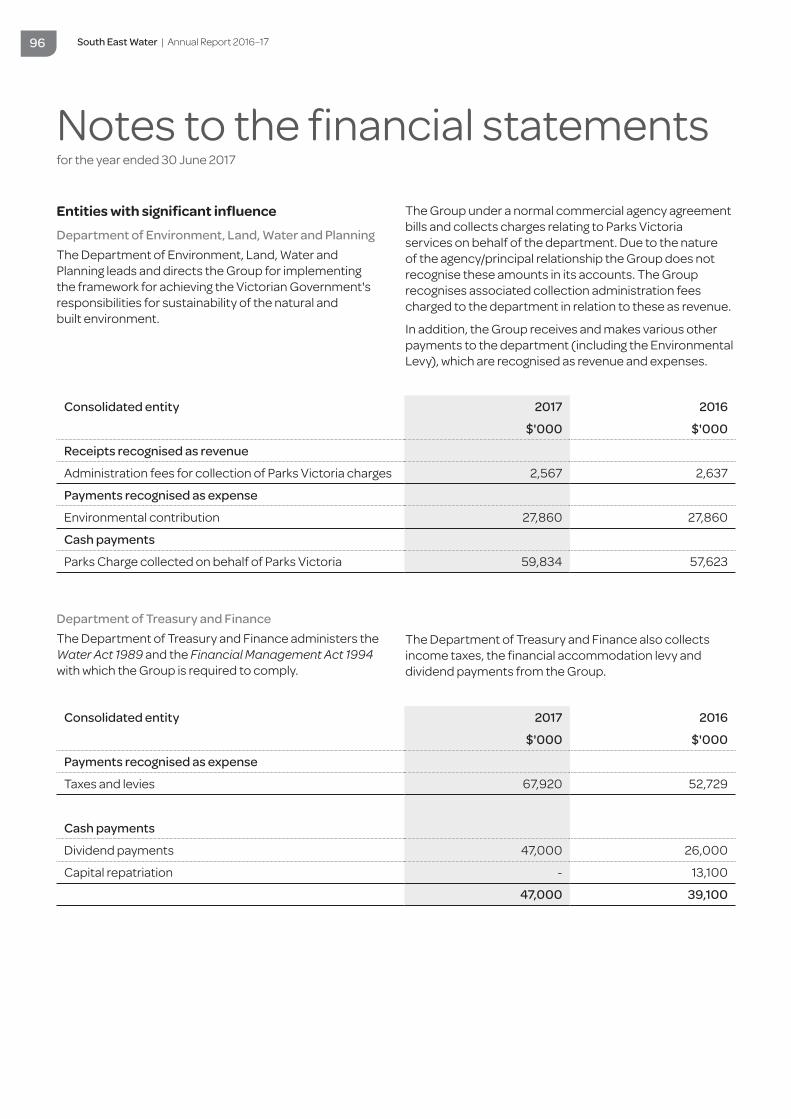
South East Water | Annual Report 2016–17 96
Notes to the financial statementsfor the year ended 30 June 2017
Entities with significant influence
Department of Environment, Land, Water and PlanningThe Department of Environment, Land, Water and Planning leads and directs the Group for implementing the framework for achieving the Victorian Government's responsibilities for sustainability of the natural and built environment.
The Group under a normal commercial agency agreement bills and collects charges relating to Parks Victoria services on behalf of the department. Due to the nature of the agency/principal relationship the Group does not recognise these amounts in its accounts. The Group recognises associated collection administration fees charged to the department in relation to these as revenue.
In addition, the Group receives and makes various other payments to the department (including the Environmental Levy), which are recognised as revenue and expenses.
Department of Treasury and FinanceThe Department of Treasury and Finance administers the Water Act 1989 and the Financial Management Act 1994 with which the Group is required to comply.
The Department of Treasury and Finance also collects income taxes, the financial accommodation levy and dividend payments from the Group.
Consolidated entity 2017 2016
$'000 $'000
Receipts recognised as revenue
Administration fees for collection of Parks Victoria charges 2,567 2,637
Payments recognised as expense
Environmental contribution 27,860 27,860
Cash payments
Parks Charge collected on behalf of Parks Victoria 59,834 57,623
Consolidated entity 2017 2016
$'000 $'000
Payments recognised as expense
Taxes and levies 67,920 52,729
Cash payments
Dividend payments 47,000 26,000
Capital repatriation - 13,100
47,000 39,100
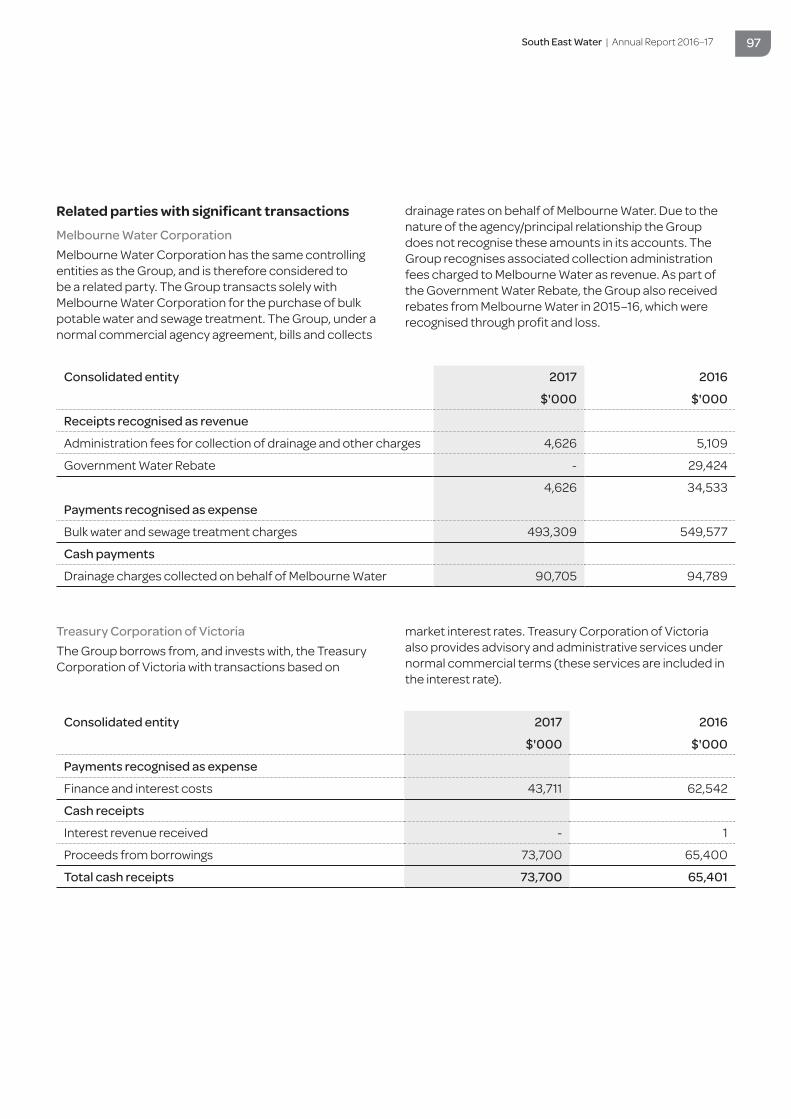
South East Water | Annual Report 2016–17 97
Related parties with significant transactions
Melbourne Water CorporationMelbourne Water Corporation has the same controlling entities as the Group, and is therefore considered to be a related party. The Group transacts solely with Melbourne Water Corporation for the purchase of bulk potable water and sewage treatment. The Group, under a normal commercial agency agreement, bills and collects
drainage rates on behalf of Melbourne Water. Due to the nature of the agency/principal relationship the Group does not recognise these amounts in its accounts. The Group recognises associated collection administration fees charged to Melbourne Water as revenue. As part of the Government Water Rebate, the Group also received rebates from Melbourne Water in 2015–16, which were recognised through profit and loss.
Treasury Corporation of VictoriaThe Group borrows from, and invests with, the Treasury Corporation of Victoria with transactions based on
market interest rates. Treasury Corporation of Victoria also provides advisory and administrative services under normal commercial terms (these services are included in the interest rate).
Consolidated entity 2017 2016
$'000 $'000
Receipts recognised as revenue
Administration fees for collection of drainage and other charges 4,626 5,109
Government Water Rebate - 29,424
4,626 34,533
Payments recognised as expense
Bulk water and sewage treatment charges 493,309 549,577
Cash payments
Drainage charges collected on behalf of Melbourne Water 90,705 94,789
Consolidated entity 2017 2016
$'000 $'000
Payments recognised as expense
Finance and interest costs 43,711 62,542
Cash receipts
Interest revenue received - 1
Proceeds from borrowings 73,700 65,400
Total cash receipts 73,700 65,401

South East Water | Annual Report 2016–17 98
Notes to the financial statementsfor the year ended 30 June 2017
Department of Health and Human ServicesThe Department of Health and Human Services provides a number of services to the community including the
provision of rebates and grants to concession holders. The Group receives various payments from and makes various payments to the department which are recognised as revenue and expenses.
iota Services Pty Ltdiota Services Pty Ltd is a wholly-owned subsidiary of South East Water Corporation. During the financial year ended 30 June 2017, South East Water Corporation purchased goods and services and provided accounting and administrative assistance to iota Services Pty Ltd. All loans are unsecured and are on normal commercial terms and conditions. All financial transactions between South East Water Corporation and iota Services Pty Ltd are eliminated upon consolidation.
Water and sewerage servicesWater and sewerage services were provided to related parties for properties within the Group’s boundary on the same terms and conditions that apply to all other customers.
Other transactionsAll other transactions with Victorian Government related party entities were made on normal commercial terms and conditions.
Consolidated entity 2017 2016
$'000 $'000
Cash receipts
Customer rebate reimbursements 45,763 45,281
Administration expenses 257 251
46,020 45,532
State Revenue OfficeThe State Revenue Office is the Victorian Government’s major tax collection agency. The State Revenue Office is a service agency of the Department of Treasury and Finance, which falls within the portfolio responsibilities of the Treasurer of Victoria. The State Revenue Office
administers Victoria’s taxation legislation and collects a range of taxes, duties and levies in addition to providing rebates to not-for-profit organisations.
The Group receives various payments from and makes various payments to the State Revenue Office which are recognised as revenue and expenses.
Consolidated entity 2017 2016
$'000 $'000
Payments recognised as expense
Taxes 3,875 3,308
Cash receipts
Customer rebate reimbursements 887 902
General Counsel and Corporate Secretary

South East Water | Annual Report 2016–17 99
Consolidated entity 2017 2016
$'000 $'000
Receivables
Department of Environment, Land, Water and Planning 99 14
State Revenue Office 225 224
Department of Health and Human Services 2,293 1,805
Payables
Department of Treasury and Finance 27,406 21,428
Department of Environment, Land, Water and Planning 11 11
Melbourne Water Corporation 10,193 15,372
State Revenue Office of Victoria 248 403
Treasury Corporation of Victoria (loans and accrued interest) 1,477,867 1,404,412
9.2.1. Related party amounts payable/receivable at balance date
9.3. Defined benefit superannuation asset/liability
Superannuation planDefined benefit members receive lump sum benefits on retirement, death, disablement and withdrawal. Some defined benefit members are also eligible for pension benefits in some cases. The defined benefit section of the Plan is closed to new members. All new members receive accumulation only benefits.
The Superannuation Industry (Supervision) (SIS) legislation governs the superannuation industry and provides the framework within which superannuation plans operate. The SIS Regulations require an actuarial valuation to be performed for each defined benefit superannuation plan every three years, or every year if the plan pays defined benefit pensions, unless an exemption has been obtained.
The Plan’s Trustee is responsible for the governance of the Plan. The Trustee has a legal obligation to act solely in the best interests of Plan beneficiaries. The Trustee has the following roles:
• Administration of the Plan and payment to beneficiaries from Plan assets when required in accordance with the Plan rules
• Management and investment of the Plan assets
• Compliance with superannuation law and other applicable regulations.
The prudential regulator, the Australian Prudential Regulation Authority (APRA), licenses and supervises regulated superannuation plans.
There are a number of risks to which the Plan exposes the Group. The more significant risks relating to the defined benefits are:
• Investment risk – The risk that investment returns will be lower than assumed and the Group will need to increase contributions to offset this shortfall.
• Salary growth risk – The risk that wages or salaries (on which future benefit amounts will be based) will rise more rapidly than assumed, increasing defined benefit amounts and thereby requiring additional employer contributions.
No provision for doubtful debts has been raised in relation to any of the above outstanding balances, and no expense has been recognised in respect of bad and doubtful debts due from related parties.
Guarantees given/receivedThe State Government of Victoria has provided a guarantee on loans sourced from the Treasury Corporation of Victoria (Borrowing and Investment Powers Act 1987). There were no other guarantees given to or received from any related parties.

South East Water | Annual Report 2016–17 100
Notes to the financial statementsfor the year ended 30 June 2017
• Legislative risk – The risk is that legislative changes could be made which increase the cost of providing the defined benefits.
• Pension risks – The risk is firstly that pensioner mortality will be lighter than expected, resulting in pensions being paid for a longer period. Secondly, that a greater proportion of eligible members will elect to take a pension benefit, which is generally more valuable than the corresponding lump sum benefit.
• Inflation risk – The risk that inflation is higher than anticipated, increasing pension payments, and thereby requiring additional employer contributions.
The Plan assets are invested by the Trustee in a pool of assets with plans providing defined benefits for other employers. The assets have a benchmark weighting to equities of 50 per cent and therefore the Plan has a significant concentration of equity market risk. However, within the equity investments, the allocation both globally and across sectors is diversified.
Description of significant events There were no plan amendments affecting the defined benefits payable, curtailments or settlements during the year.
Reconciliation of the assets net defined benefit liability/asset 2017 2016
$'000 $'000
Net defined benefit liability/(asset) at start of year 556 (9,298)
Plus current service cost 1,478 1,493
Plus past service cost - -
Plus gain/loss on settlements - -
Plus net interest 7 (257)
Less actual return on plan assets less interest income (5,868) (53)
Plus actuarial (gains)/losses arising from changes in demographic assumptions 18 -
Plus actuarial (gains)/losses arising from changes in financial assumptions (1,227) 6,163
Plus actuarial (gains)/losses arising from liability experience (971) 2,508
Plus adjustment for effect of asset ceiling - -
Less employer contributions - -
Net defined benefit liability/(asset) at end of year (6,007) 556
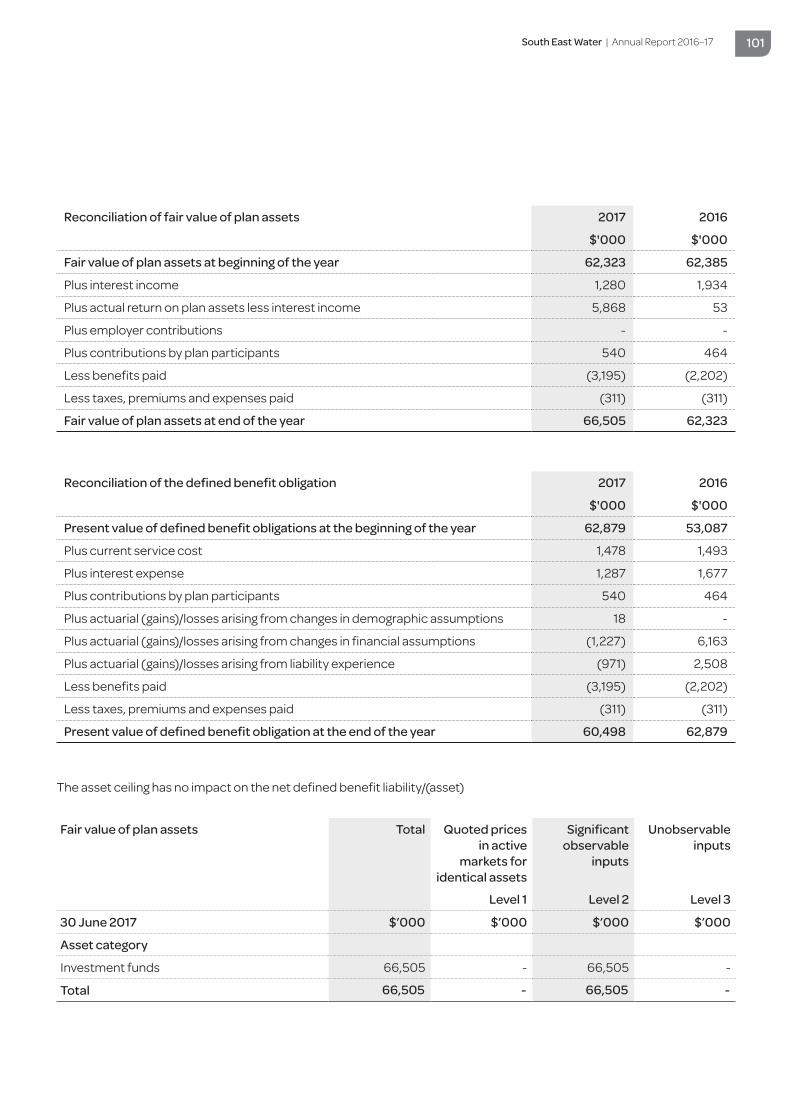
South East Water | Annual Report 2016–17 101
Reconciliation of fair value of plan assets 2017 2016
$'000 $'000
Fair value of plan assets at beginning of the year 62,323 62,385
Plus interest income 1,280 1,934
Plus actual return on plan assets less interest income 5,868 53
Plus employer contributions - -
Plus contributions by plan participants 540 464
Less benefits paid (3,195) (2,202)
Less taxes, premiums and expenses paid (311) (311)
Fair value of plan assets at end of the year 66,505 62,323
Reconciliation of the defined benefit obligation 2017 2016
$'000 $'000
Present value of defined benefit obligations at the beginning of the year 62,879 53,087
Plus current service cost 1,478 1,493
Plus interest expense 1,287 1,677
Plus contributions by plan participants 540 464
Plus actuarial (gains)/losses arising from changes in demographic assumptions 18 -
Plus actuarial (gains)/losses arising from changes in financial assumptions (1,227) 6,163
Plus actuarial (gains)/losses arising from liability experience (971) 2,508
Less benefits paid (3,195) (2,202)
Less taxes, premiums and expenses paid (311) (311)
Present value of defined benefit obligation at the end of the year 60,498 62,879
Fair value of plan assets Total Quoted prices in active
markets for identical assets
Significant observable
inputs
Unobservable inputs
Level 1 Level 2 Level 3
30 June 2017 $’000 $’000 $’000 $’000
Asset category
Investment funds 66,505 - 66,505 -
Total 66,505 - 66,505 -
The asset ceiling has no impact on the net defined benefit liability/(asset)
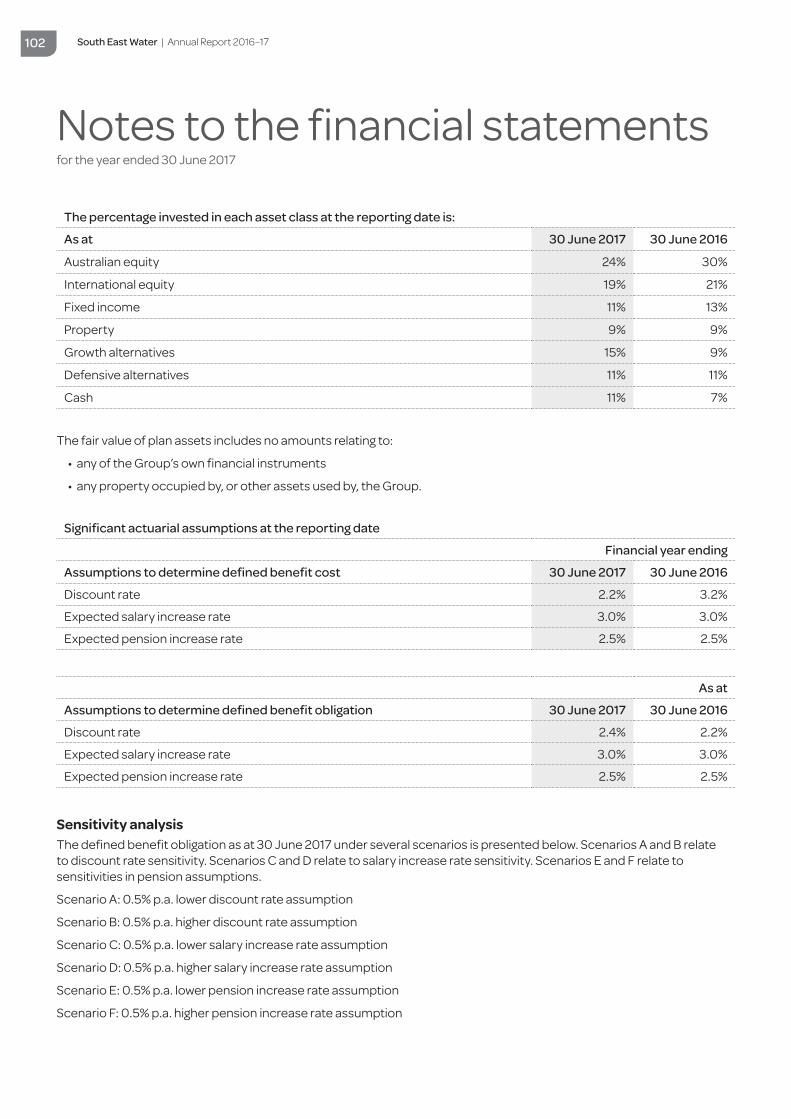
South East Water | Annual Report 2016–17 102
Notes to the financial statementsfor the year ended 30 June 2017
The percentage invested in each asset class at the reporting date is:
As at 30 June 2017 30 June 2016
Australian equity 24% 30%
International equity 19% 21%
Fixed income 11% 13%
Property 9% 9%
Growth alternatives 15% 9%
Defensive alternatives 11% 11%
Cash 11% 7%
Significant actuarial assumptions at the reporting date
Financial year ending
Assumptions to determine defined benefit cost 30 June 2017 30 June 2016
Discount rate 2.2% 3.2%
Expected salary increase rate 3.0% 3.0%
Expected pension increase rate 2.5% 2.5%
As at
Assumptions to determine defined benefit obligation 30 June 2017 30 June 2016
Discount rate 2.4% 2.2%
Expected salary increase rate 3.0% 3.0%
Expected pension increase rate 2.5% 2.5%
The fair value of plan assets includes no amounts relating to:
• any of the Group’s own financial instruments
• any property occupied by, or other assets used by, the Group.
Sensitivity analysisThe defined benefit obligation as at 30 June 2017 under several scenarios is presented below. Scenarios A and B relate to discount rate sensitivity. Scenarios C and D relate to salary increase rate sensitivity. Scenarios E and F relate to sensitivities in pension assumptions.
Scenario A: 0.5% p.a. lower discount rate assumption
Scenario B: 0.5% p.a. higher discount rate assumption
Scenario C: 0.5% p.a. lower salary increase rate assumption
Scenario D: 0.5% p.a. higher salary increase rate assumption
Scenario E: 0.5% p.a. lower pension increase rate assumption
Scenario F: 0.5% p.a. higher pension increase rate assumption
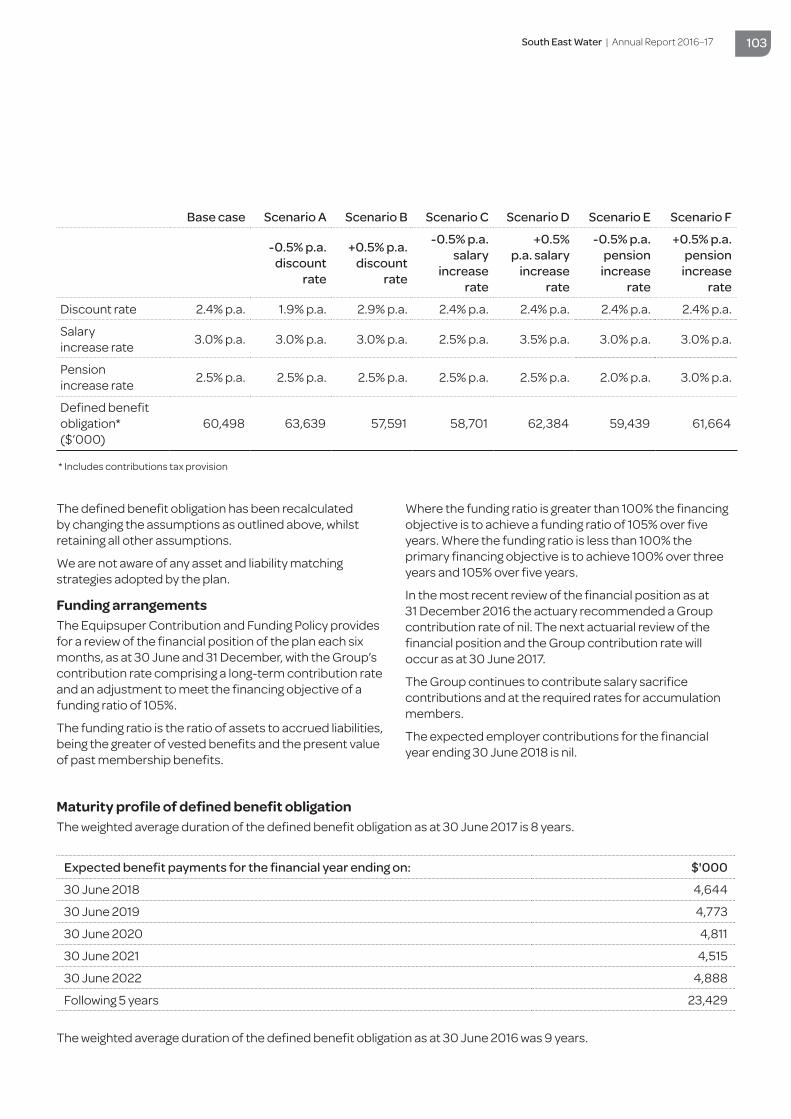
South East Water | Annual Report 2016–17 103
Expected benefit payments for the financial year ending on: $'000
30 June 2018 4,644
30 June 2019 4,773
30 June 2020 4,811
30 June 2021 4,515
30 June 2022 4,888
Following 5 years 23,429
Base case Scenario A Scenario B Scenario C Scenario D Scenario E Scenario F
-0.5% p.a.
discount rate
+0.5% p.a. discount
rate
-0.5% p.a. salary
increase rate
+0.5% p.a. salary
increase rate
-0.5% p.a. pension
increase rate
+0.5% p.a. pension
increase rate
Discount rate 2.4% p.a. 1.9% p.a. 2.9% p.a. 2.4% p.a. 2.4% p.a. 2.4% p.a. 2.4% p.a.
Salary increase rate 3.0% p.a. 3.0% p.a. 3.0% p.a. 2.5% p.a. 3.5% p.a. 3.0% p.a. 3.0% p.a.
Pension increase rate 2.5% p.a. 2.5% p.a. 2.5% p.a. 2.5% p.a. 2.5% p.a. 2.0% p.a. 3.0% p.a.
Defined benefit obligation* ($’000)
60,498 63,639 57,591 58,701 62,384 59,439 61,664
* Includes contributions tax provision
The defined benefit obligation has been recalculated by changing the assumptions as outlined above, whilst retaining all other assumptions.
We are not aware of any asset and liability matching strategies adopted by the plan.
Funding arrangementsThe Equipsuper Contribution and Funding Policy provides for a review of the financial position of the plan each six months, as at 30 June and 31 December, with the Group’s contribution rate comprising a long-term contribution rate and an adjustment to meet the financing objective of a funding ratio of 105%.
The funding ratio is the ratio of assets to accrued liabilities, being the greater of vested benefits and the present value of past membership benefits.
Where the funding ratio is greater than 100% the financing objective is to achieve a funding ratio of 105% over five years. Where the funding ratio is less than 100% the primary financing objective is to achieve 100% over three years and 105% over five years.
In the most recent review of the financial position as at 31 December 2016 the actuary recommended a Group contribution rate of nil. The next actuarial review of the financial position and the Group contribution rate will occur as at 30 June 2017.
The Group continues to contribute salary sacrifice contributions and at the required rates for accumulation members.
The expected employer contributions for the financial year ending 30 June 2018 is nil.
Maturity profile of defined benefit obligationThe weighted average duration of the defined benefit obligation as at 30 June 2017 is 8 years.
The weighted average duration of the defined benefit obligation as at 30 June 2016 was 9 years.
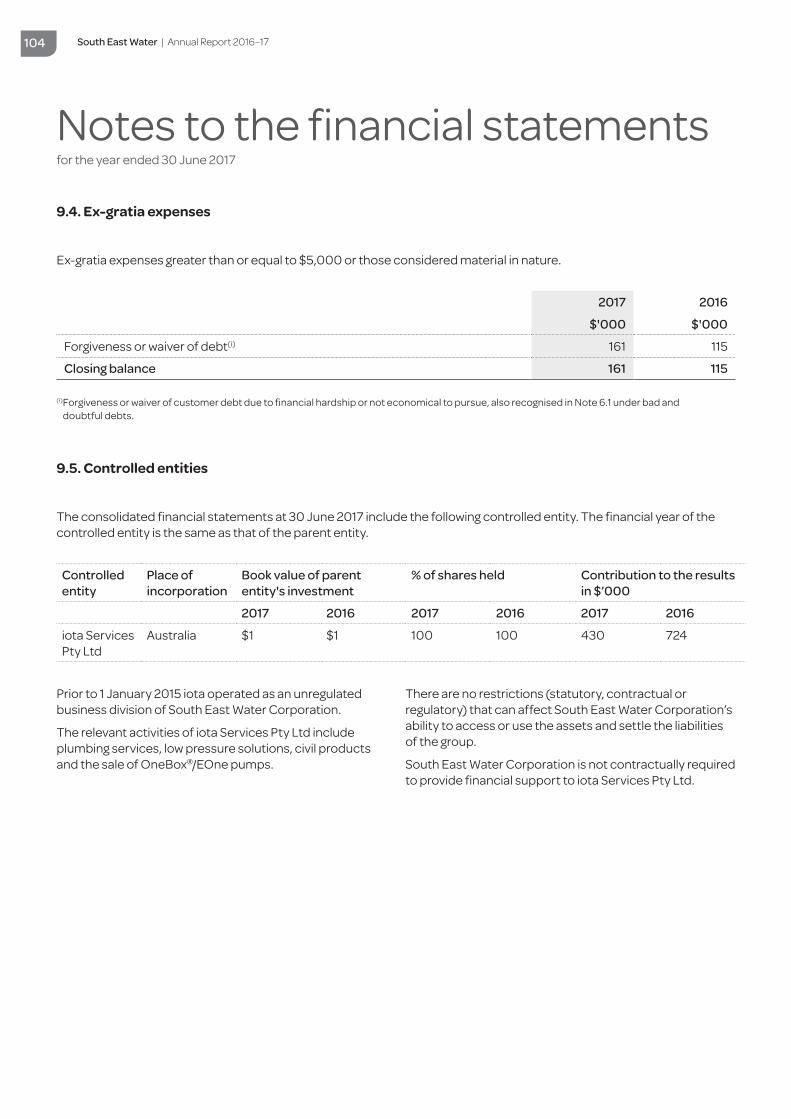
South East Water | Annual Report 2016–17 104
Notes to the financial statementsfor the year ended 30 June 2017
9.4. Ex-gratia expenses
9.5. Controlled entities
2017 2016
$'000 $'000
Forgiveness or waiver of debt(i) 161 115
Closing balance 161 115
(i) Forgiveness or waiver of customer debt due to financial hardship or not economical to pursue, also recognised in Note 6.1 under bad and doubtful debts.
Ex-gratia expenses greater than or equal to $5,000 or those considered material in nature.
The consolidated financial statements at 30 June 2017 include the following controlled entity. The financial year of the controlled entity is the same as that of the parent entity.
Controlled entity
Place of incorporation
Book value of parent entity's investment
% of shares held Contribution to the results in $’000
2017 2016 2017 2016 2017 2016
iota Services Pty Ltd
Australia $1 $1 100 100 430 724
Prior to 1 January 2015 iota operated as an unregulated business division of South East Water Corporation.
The relevant activities of iota Services Pty Ltd include plumbing services, low pressure solutions, civil products and the sale of OneBox®/EOne pumps.
There are no restrictions (statutory, contractual or regulatory) that can affect South East Water Corporation’s ability to access or use the assets and settle the liabilities of the group.
South East Water Corporation is not contractually required to provide financial support to iota Services Pty Ltd.

South East Water | Annual Report 2016–17 105
9.6. Parent entity information – South East Water Corporation
Information relating to South East Water Corporation 2017 2016
$'000 $'000
Current assets 172,793 146,382
Non-current assets 3,820,487 3,727,121
Total assets 3,993,280 3,873,503
Current liabilities 180,729 180,719
Non-current liabilities 1,921,712 1,862,904
Total liabilities 2,102,441 2,043,623
Contributed equity 430,508 430,508
Reserves 799,875 831,379
Retained earnings 660,456 567,994
Total equity 1,890,839 1,829,881
Profit or loss of the parent entity 133,828 120,104
Total comprehensive income of the parent entity 107,958 102,691
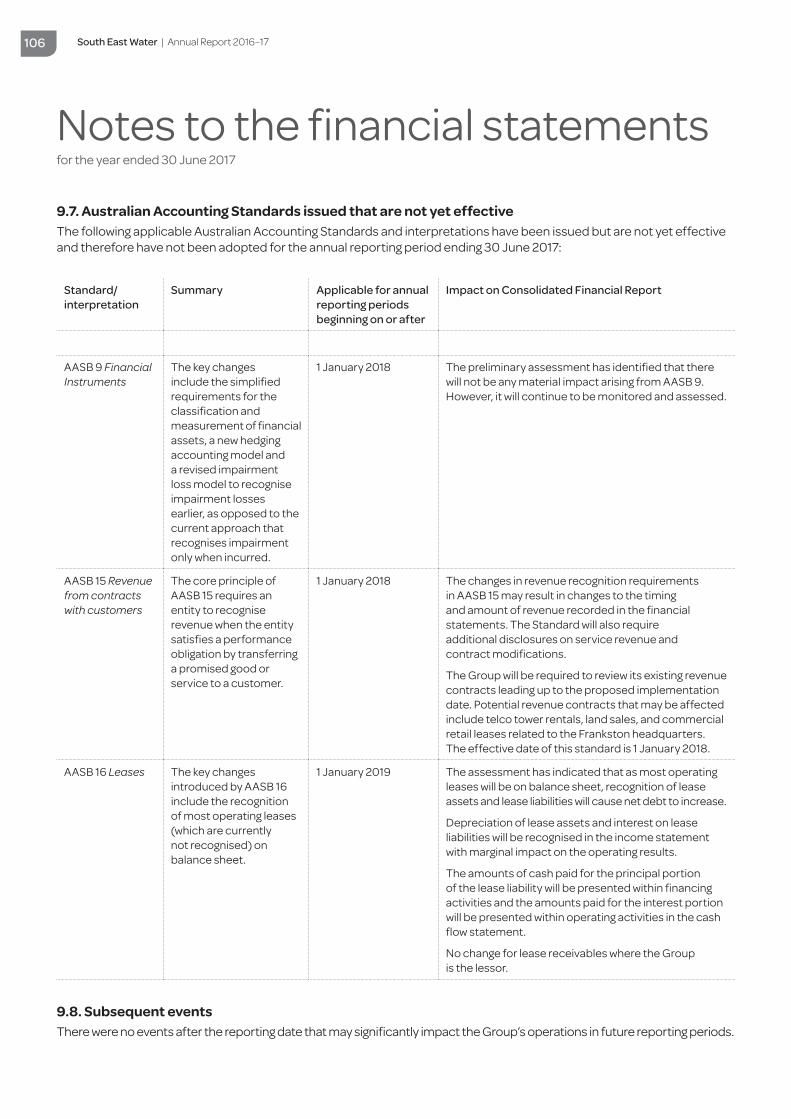
South East Water | Annual Report 2016–17 106
Notes to the financial statementsfor the year ended 30 June 2017
9.7. Australian Accounting Standards issued that are not yet effectiveThe following applicable Australian Accounting Standards and interpretations have been issued but are not yet effective and therefore have not been adopted for the annual reporting period ending 30 June 2017:
9.8. Subsequent eventsThere were no events after the reporting date that may significantly impact the Group’s operations in future reporting periods.
Standard/ interpretation
Summary Applicable for annual reporting periods beginning on or after
Impact on Consolidated Financial Report
AASB 9 Financial Instruments
The key changes include the simplified requirements for the classification and measurement of financial assets, a new hedging accounting model and a revised impairment loss model to recognise impairment losses earlier, as opposed to the current approach that recognises impairment only when incurred.
1 January 2018 The preliminary assessment has identified that there will not be any material impact arising from AASB 9. However, it will continue to be monitored and assessed.
AASB 15 Revenue from contracts with customers
The core principle of AASB 15 requires an entity to recognise revenue when the entity satisfies a performance obligation by transferring a promised good or service to a customer.
1 January 2018 The changes in revenue recognition requirements in AASB 15 may result in changes to the timing and amount of revenue recorded in the financial statements. The Standard will also require additional disclosures on service revenue and contract modifications.
The Group will be required to review its existing revenue contracts leading up to the proposed implementation date. Potential revenue contracts that may be affected include telco tower rentals, land sales, and commercial retail leases related to the Frankston headquarters. The effective date of this standard is 1 January 2018.
AASB 16 Leases The key changes introduced by AASB 16 include the recognition of most operating leases (which are currently not recognised) on balance sheet.
1 January 2019 The assessment has indicated that as most operating leases will be on balance sheet, recognition of lease assets and lease liabilities will cause net debt to increase.
Depreciation of lease assets and interest on lease liabilities will be recognised in the income statement with marginal impact on the operating results.
The amounts of cash paid for the principal portion of the lease liability will be presented within financing activities and the amounts paid for the interest portion will be presented within operating activities in the cash flow statement.
No change for lease receivables where the Group is the lessor.

South East Water | Annual Report 2016–17 107
Attestation of Compliance with Ministerial Standing Direction 3.7.1 – Risk Management Framework and ProcessesI, Lucia Cade, certify that South East Water Corporation has complied with the Ministerial Standing Direction 3.7.1 – Risk Management Framework and Processes. This has been verified by the South East Water Board, its supporting committees (Finance Assurance and Risk Management committee, People Remuneration and Safety committee, Service Delivery committee and iota Services board committee) as well as South East Water management.
Lucia CadeChair
South East Water Corporation4 September 2017
Risk management attestation
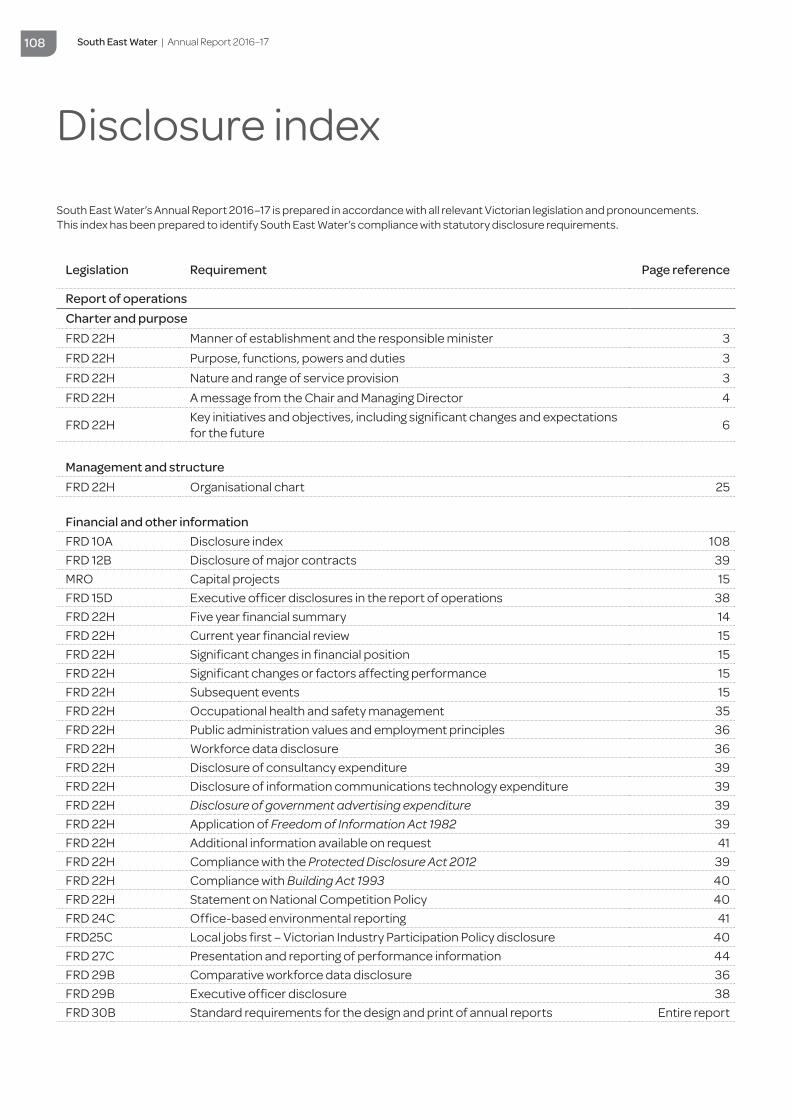
South East Water | Annual Report 2016–17 108
Legislation Requirement Page reference
Report of operationsCharter and purposeFRD 22H Manner of establishment and the responsible minister 3FRD 22H Purpose, functions, powers and duties 3FRD 22H Nature and range of service provision 3FRD 22H A message from the Chair and Managing Director 4
FRD 22H Key initiatives and objectives, including significant changes and expectations for the future 6
Management and structureFRD 22H Organisational chart 25
Financial and other informationFRD 10A Disclosure index 108FRD 12B Disclosure of major contracts 39MRO Capital projects 15FRD 15D Executive officer disclosures in the report of operations 38FRD 22H Five year financial summary 14FRD 22H Current year financial review 15FRD 22H Significant changes in financial position 15FRD 22H Significant changes or factors affecting performance 15FRD 22H Subsequent events 15FRD 22H Occupational health and safety management 35FRD 22H Public administration values and employment principles 36FRD 22H Workforce data disclosure 36FRD 22H Disclosure of consultancy expenditure 39FRD 22H Disclosure of information communications technology expenditure 39FRD 22H Disclosure of government advertising expenditure 39FRD 22H Application of Freedom of Information Act 1982 39FRD 22H Additional information available on request 41FRD 22H Compliance with the Protected Disclosure Act 2012 39FRD 22H Compliance with Building Act 1993 40FRD 22H Statement on National Competition Policy 40FRD 24C Office-based environmental reporting 41FRD25C Local jobs first – Victorian Industry Participation Policy disclosure 40FRD 27C Presentation and reporting of performance information 44FRD 29B Comparative workforce data disclosure 36FRD 29B Executive officer disclosure 38FRD 30B Standard requirements for the design and print of annual reports Entire report
South East Water’s Annual Report 2016–17 is prepared in accordance with all relevant Victorian legislation and pronouncements. This index has been prepared to identify South East Water’s compliance with statutory disclosure requirements.
Disclosure index
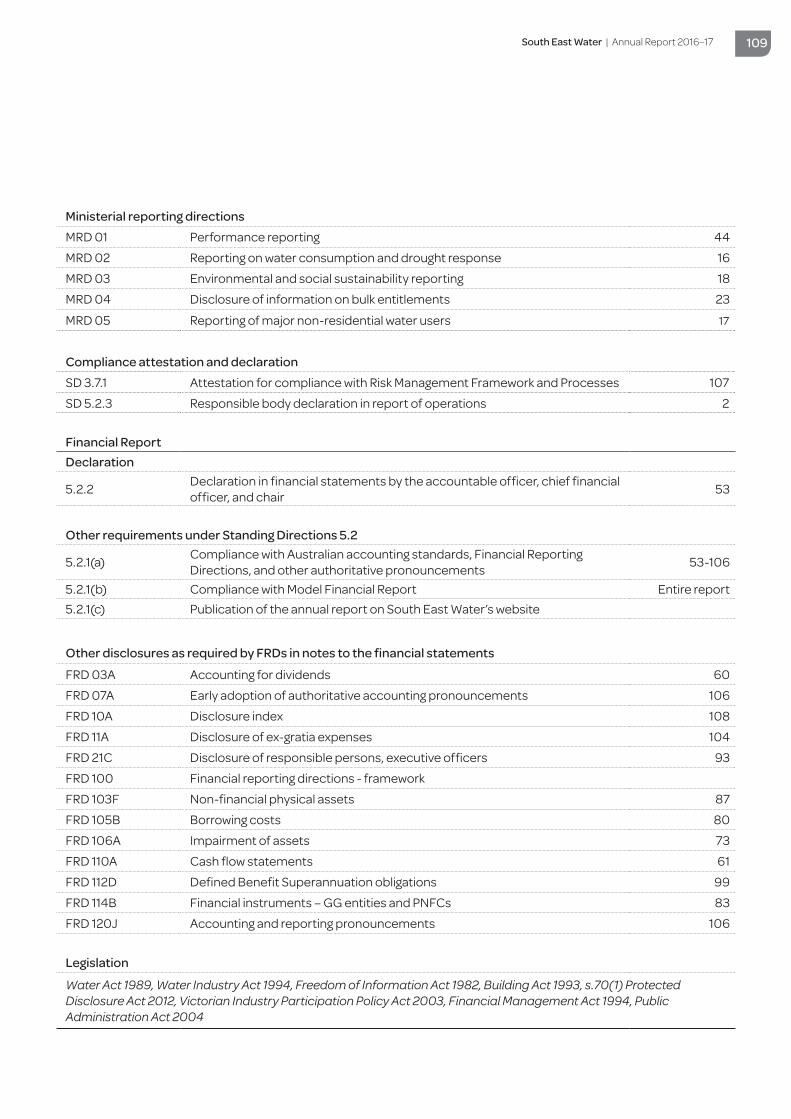
South East Water | Annual Report 2016–17 109
Ministerial reporting directionsMRD 01 Performance reporting 44
MRD 02 Reporting on water consumption and drought response 16
MRD 03 Environmental and social sustainability reporting 18
MRD 04 Disclosure of information on bulk entitlements 23
MRD 05 Reporting of major non-residential water users 17
Compliance attestation and declarationSD 3.7.1 Attestation for compliance with Risk Management Framework and Processes 107
SD 5.2.3 Responsible body declaration in report of operations 2
Financial ReportDeclaration
5.2.2 Declaration in financial statements by the accountable officer, chief financial officer, and chair 53
Other requirements under Standing Directions 5.2
5.2.1(a) Compliance with Australian accounting standards, Financial Reporting Directions, and other authoritative pronouncements 53-106
5.2.1(b) Compliance with Model Financial Report Entire report5.2.1(c) Publication of the annual report on South East Water’s website
Other disclosures as required by FRDs in notes to the financial statements
FRD 03A Accounting for dividends 60
FRD 07A Early adoption of authoritative accounting pronouncements 106
FRD 10A Disclosure index 108
FRD 11A Disclosure of ex-gratia expenses 104
FRD 21C Disclosure of responsible persons, executive officers 93
FRD 100 Financial reporting directions - framework
FRD 103F Non-financial physical assets 87
FRD 105B Borrowing costs 80
FRD 106A Impairment of assets 73
FRD 110A Cash flow statements 61
FRD 112D Defined Benefit Superannuation obligations 99
FRD 114B Financial instruments – GG entities and PNFCs 83
FRD 120J Accounting and reporting pronouncements 106
Legislation
Water Act 1989, Water Industry Act 1994, Freedom of Information Act 1982, Building Act 1993, s.70(1) Protected Disclosure Act 2012, Victorian Industry Participation Policy Act 2003, Financial Management Act 1994, Public Administration Act 2004

Printed on 100% recycled, carbon-neutral paper by a printer using 100% renewable
energy and waterless printing.
South East WaterWatersEdge101 Wells Street Frankston Victoria 319913 16 94ABN 89 066 902 547
southeastwater.com.au