2016fy results - anima sgr · 2016fy - table of contents 1 2 ... nnm mkt effect 4.565-1.046 ......
TRANSCRIPT

2016FY Results
Just have a little patience

2
Disclaimer and safe harbour statements
These slides have been prepared by Anima Holding S.p.A. (“Anima”, the “Company” and together with its subsidiaries the “Group”), solely for a presentationto investors. These slides are being shown for information purposes and neither this document nor any copy thereof may be reproduced, further distributed toany other person or published, in whole or in part, for any purpose. The information contained in this document (“Information”) has been provided by theCompany or obtained from publicly available sources and has not been independently verified.None of the Company or any of their respective affiliates, directors, officers, advisers, agents or employees, nor any other person make any representation orwarranty, express or implied, as to, and no reliance should be placed on, the fairness, accuracy, materiality, completeness or correctness of the Informationor any opinions contained herein. This presentation may contain financial information and/or operating data and/or market information regarding thebusiness, assets and liabilities of the Company and its consolidated subsidiaries and the results of operations and markets in which the Company and itsconsolidated subsidiaries are active. Such financial information may not have been audited, reviewed or verified by any independent accounting firm and/orsuch operating or market information may be based on management estimates or on reports prepared by third parties which neither the Company nor theBanks have independently verified. It is not the intention of the Company to provide, and you may not rely on these materials as providing, a complete orcomprehensive analysis of the Company’s financial or trading position or prospects. This presentation speaks as of its date and will not be updated. TheInformation included in this presentation may be subject to updating, completion, revision and amendment and such Information may change materiallywithout notice. No person is under any obligation to update or keep current the Information contained in this presentation and any estimates, opinions andprojections expressed relating thereto are subject to change without notice. Neither the Company nor any of their respective affiliates, directors, officers,advisers, agents or employees, nor any other person shall have any liability whatsoever (in negligence or otherwise) for any loss howsoever arising from anyuse of these materials or its contents or otherwise arising in connection with this presentation.
This document includes forward-looking statements which include statements regarding ANIMA’s business strategy, financial condition, results of operationsand market data, as well as other statements that are not historical facts. By their nature, forward-looking statements are subject to numerous factors, risksand uncertainties that could cause actual outcomes and results to be materially different from those projected. Readers are cautioned not to place unduereliance on these forward-looking statements. Except for any ongoing obligation to disclose material information as required by the relevant regulations,ANIMA does not have any intention or obligation to publicly update or revise any forward-looking statements after ANIMA distributes this document, whetherto reflect any future events or circumstances or otherwise.
Any projections, estimates, forecasts, targets, prospects, returns and/or opinions contained in this presentation involve elements of subjective judgment andanalysis and are based upon the best judgment of the Company as of the date of this presentation. No representation or warranty is given as to theachievement or reasonableness of, and no reliance should be placed on, any valuations, forecasts, estimates, opinions and projections contained in thispresentation. In all cases, recipients should conduct their own investigation and analysis on the Company and the Information contained in this presentation.Forward-looking statements concern future circumstances and results and other statements that are not historical facts, sometimes identified by the words“believes”, “expects”, “predicts”, “intends”, “projects”, “plans”, “estimates”, “aims”, “foresees”, “anticipates”, “targets”, and similar expressions.A multitude of factors can cause actual events to differ significantly from any anticipated development. Forward-looking statements contained in thispresentation regarding past trends or activities should not be taken as a representation that such trends or activities will continue in the future. No oneundertakes any obligation to update or revise any forward-looking statements, whether as a result of new information, future events or otherwise. You shouldnot place undue reliance on forward-looking statements, which speak only as of the date of this presentation and are subject to change without notice.

3
2016FY - Table of contents
1
2
Anima…who
Anima…what
Anima…why
Anima…how much3
4

4
ANIMA highlights – Different, yet unique
Source: ANIMA
Solid results delivered in a challenging environment amid markets’ volatility and macro turbulences
Highest level of AuM (€72.7b) driven by strong inflows in the institutional segment
Net income yoy reduction highlyimpacted by lower performance fees
DPS confirmed at 0.25€
Healthy growth as a result of the positive mix of diversified ordinarybusiness, new partnerships (Poste) and focus on operating leverage
72.7 AuM (€bn)
233.1 Net commissions (€m)in line with 2015
101.2 Net Income (€m)
-20% vs. 2015
+4.6 Net New Money (€bn)
+9% vs. 2015
2016 at a glance
127.7 Adj. Net Income (€m)
-15% vs. 2015

5
2016FY - Table of contents
Anima…who
Anima…what
Anima…why
Anima…how much
1
2
3
4

6
Anima AuM evolution
Source: ANIMA, data in € bn
4.6
66.9
Mkt effect
1.2
NNM Mkt effect
46.6
+17%
AuM 2013
7.6
NNM
3.0
Mkt effect
57.1
AuM 2014
8.6
AuM 2015
+23%
AuM 2016
1.2
NNM
72.7
+9%

7
2016FY net inflows breakdown
Source: ANIMA – data in €bn
27.24733.637
39.640
1.229
5.61166.887
AuM 2015 EoP
Inst
itut
iona
lRe
tail
72.692
AuM 2016 EoP
39.055
Mkt effectNNM
4.565
-1.046
Retail flows negative in Q1 and Q4 due to bumpy marketsand turmoil of the Italianbanking sector
Highest ever recordedInstitutional flows even net of the BMPS prop fin expirationand consistent with the increased focus on thissegment
8
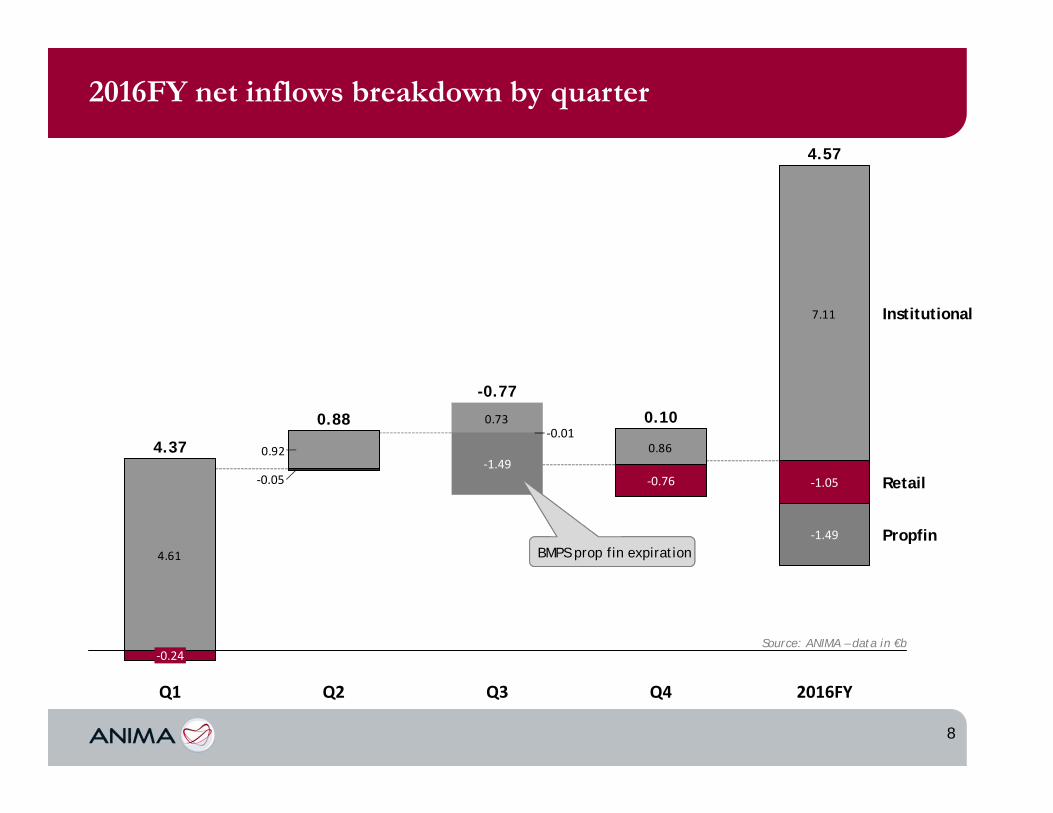
2016FY net inflows breakdown by quarter
Source: ANIMA – data in €b
7.11
0.86
0.73
4.61
0.92
2016FY
4.57
Retail
‐1.49
‐1.05
Q4
0.10
‐0.76
Q3
-0.77
‐1.49
‐0.01
Q2
0.88
‐0.05
Q1
4.37
‐0.24
Institutional
PropfinBMPS prop fin expiration

9
INSTITUTIONAL – 46% AuM = €33.6bnRETAIL - 54% AuM = €39.1bn
Strategic partners*
84.0%
Other banks9.1%
FAs6.4%
Other0.5%
Insurance36.6%
Wrap#
30.1%
Pension funds 9.6%
Poste11.3%
Fund users/subadvisory
12.4%
Source: ANIMA Data as of 31-Dec-2016* Includes BMPS, BPM, Cre.Val. and BPPB # Wrap: Anima funds invested by other products managed by Anima
All segments of the institutional business recordedpositive NNM in 2016
Strong contribution by Poste Italiane NNM with mutualfunds and U/L
Stable breakdown of retail AuM stock
Strategic partners share in line with 2015 EoP
Business by segment

10
2016FY net inflows in mutual funds by asset class
Source: ANIMA – data in €m
*includes balanced up to 20% in equities
-800
-700
-600
-500
-400
-300
-200
-100
0
100
200
300
400
500
600
700
800
900
1,000
Cash Bond* Balanced Flexible Equity

11
5 years of significant shift in product mix
Source: ANIMA
3.4%
39.6%
29.1%
14.2%
13.7%
Flexible
Balanced
Bond
Cash
2015
Equity
4.2%
41.2%
13.6%
27.8%
13.3%
2014
3.8%
46.9%
8.1%
27.5%
13.7%
2013
5.3%
47.8%
5.4%
25.2%
16.4%
2012
7.7%
48.1%
6.4%
18.2%
19.6%
2011
10.5%
50.0%
7.0%
10.9%
21.6%
2016
17.1%32.1%

12
2016 funds’ breakdown by category
Investment performance
Source: Bloomberg - FIDMGEND Index for Italian Industry. ASSOGESTIONI for IT Industry funds breakdown by category
42.2% 39.6%
8.4% 14.2%
24.4%29.1%
21.3%13.7%
Balanced
Bond
Cash
Equity
Flexible
ANIMA
3.4%
IT Industry
3.8%
2014-2016 funds’ WAP
2015
3.5%
1.7%
2014
4.9%4.7%
2.1%
2016
2.6%
ANIMAIT Industry

13
2016FY - Table of contents
Anima…who
Anima…what
Anima…why
Anima…how much
1
2
3
4
Appendix5

14
€m 2016 % 2015
Net commissions 233.106 233.935
Performance fees 20.607 57.313
Total revenues 253.713 -13% 291.248
Personnel costo/w fixedo/w variable
(33.352)(25.059)(8.293)
(40.102)(23.254)(16.848)
Other expense (29.007) (30.221)
Total expense (62.359) -11% (70.323)
EBITDA 191.354 -13% 220.925
Non recurring costs (1.600) (2.750)
LTIP expense (10.352) (12.243)
Other income/(cost) 0.568 (0.337)
D&A (18.400) (18.789)
EBIT 161.570 -13% 186.806
Net financial charges (4.802) (3.747)
PBT 156.768 -14% 183.059
Income tax (55.588) (56.173)
Net income 101.180 -20% 126.886
Adjusted net income 127.734 -15% 150.518
P&L overview
Non cash PPA amortization; amortization of capitalized costs of financing One off components and non‐recurring costs (M&A, asset disposals, lay‐off incentives)
bps/avg AuM 2016 2015
Retail 30.7 34.5
Institutional* 28.8 30.2
Average 30.1 33.4
Cost/income 2016 2015
On total revenues 24.6% 24.1%
Ex performance fees 26.8% 30.1%
Net commission margin declined also as a result of the shift towards institutional segment, and negative market effect on the most profitable asset classes in Q1
Institutional margin decreasing mainly due to very large mandates awarded in Q1 and expiration of BMPS propfin mandate in June 2016
LTIP expense reduced to reflect the final KPI achievements (around 93%). Lower expense also for the remaining period Jan-Apr 2017
Net financial charges and income tax affected by one-off settlement
Cost income ratio still improving net of perf. fees, and best in class on total revenues
*2015 margin restated to reflect similar contribution of expired BMPS prop fin mandate
15
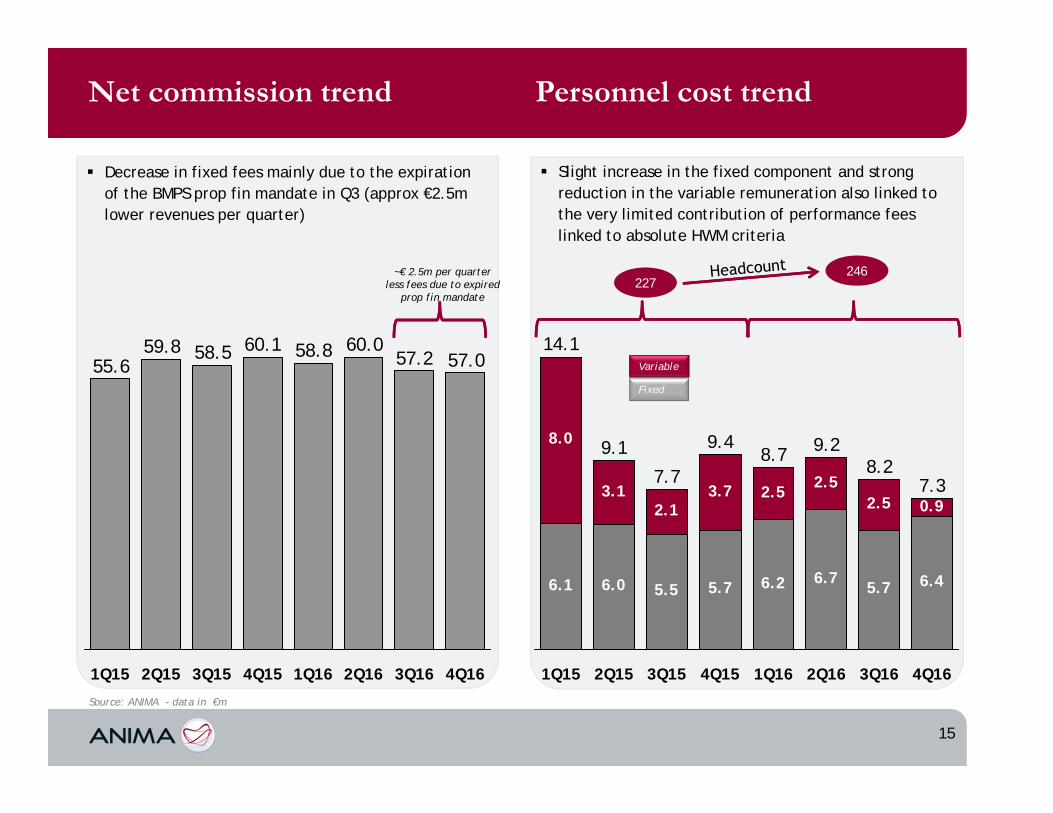
Net commission trend Personnel cost trend
Source: ANIMA - data in €m
57.057.260.058.860.158.559.8
55.6
3Q162Q161Q164Q153Q152Q151Q15 4Q16
Decrease in fixed fees mainly due to the expiration of the BMPS prop fin mandate in Q3 (approx €2.5m lower revenues per quarter)
6.1 6.0 5.5 5.7 6.2 6.75.7 6.4
8.0
3.12.1
3.7 2.52.5
2.5 0.9
8.7
4Q15
9.4
3Q15
7.7
2Q15
9.1
1Q15
14.1
1Q16 2Q16
9.2
3Q16
8.2
4Q16
7.3
Slight increase in the fixed component and strong reduction in the variable remuneration also linked to the very limited contribution of performance feeslinked to absolute HWM criteria
Fixed
Variable
227246~€ 2.5m per quarter
less fees due to expired prop fin mandate

16
Opex breakdown – focus on operating leverage
Source: ANIMA - data in €m
16.3 15.9
8.87.4
5.15.7
-4.0%
Other opex
Outsourcing
Marketing
2016
29.0
2015
30.2
Marketing expense increase more than offset by around €1.8m cost savings in other areas, particularly in outsourcing
Operating leverage still improving even in a year of margin erosion
8.89.5
11.112.3
11.412.9
14.314.3-38.5%
20161H1620151H1520141H1420131H13
OPEX/AuM in bps

17
Exploiting operating leverage
Source: ANIMA - data in €m
75.4%1.5%
75.9%73.5%72.1%
24.6%24.1%26.5%27.9%‐4.1%
26.8%
2016
30.1%
2014
‐10.7%
2015
30.7%
2013
37.6%
EBITDA margin as a % of total revenues
OPEX as a % of total revenues
OPEX as a % of revenues ex perf.fees

18
Tax settlement impact
Source: ANIMA - data in €m
2016 stated chg 2016
restated
EBITDA 191.354 191.354
D&A and other cost (29.784) 595 (29.189)
EBIT 161.570 595 162.165
Interest expense (4.802) 839 (3.963)
PBT 156.768 1.434 158.202
Income tax (55.588) 8.056 (47.533)
Net profit 101.180 9.490 110.670
ANIMA reached on July 7th 2016 a settlement with the Italian Revenue Agency covering the years between 2004 and 2014 for a total charge of €8.9 million related to a differentcalculation of the transfer pricing between the Irish subsidiary and the Italian entities
Ordinary tax rate for 2016FY is 30.0%, slightly decling yoy (30.7% in 2015FY)
€8.9m one-off charge
Consultancies and other fees

19
Net financial position
€m 2016 2015
Bank loan (180.0) (180.0)
TOTAL DEBT (180.0) (180.0)
Cash 215.2 285.8
Securities 141.9 67.9
Perf. fee receivables 15.8 11.5
TOTAL CASH 372.9 365.2
NET FINANCIAL POSITION 192.9 185.2
Source: ANIMA
-180.0 -180.0 -180.0
222.9
365.2 372.9
2015
185.2
2014
42.9
2016
192.9
Total cash
Total debtat Holding level
Mainly in operatingcos (subsidiaries)
€125m dividend distribution in 2015-2016
~€75m dividend for 2016FY (€0.25 DPS) submitted to AGM approval in April 2017
Proposed dividend -for the third year above the 50% payout policy- reflects the Group’s cash generation, flexible and low-leveraged balance sheet and a synthesis of growth opportunities’ funding and capital distribution to shareholders

20
2016FY - Table of contents
Anima…who
Anima…what
Anima…why
Anima…how much
1
2
3
4

21
The ANIMA – Poste partnership (1/2)
Source: ANIMA
Continued support with 8 new product launches during 2016
Training delivered to the sales network: 137 events in 2016
2.0 2.1 2.3 2.42.7 2.7 3.0 3.2 3.3 3.5 3.7 3.8 4.0
4.3
Oct-16 Dec-16Jul-16 Nov-16Aug-16 Feb-17Sep-16 Jan-17Jun-16May-16Apr-16Mar-16Feb-16Jan-16
Cedola Dinamica Nov’22
Evoluzione 3D 2016 I
Evoluzione 3D Jul’21
Soluzione Flessibile U/L
Cedola Dinamica Feb’23
Mix 3 Cedola Dinamica May’23
Cedola Chiara May’22
AuM
in €
bn

22
2%
98%
POSTE - ~€76b
The ANIMA – Poste partnership (2/2)
Source: ANIMA /Assogestioni as of 31.12.2016 POSTE GROUP figures as of 9M16
54%46%
ANIMA - ~€73b
28%
72%
ANIMA+POSTE ~ €150b
24%
41%
10%
23%
2%
POSTE GROUP ~€493b
Saving books Bonds Deposits Life insurance Mutual funds
Poste SGRAuM
Retail
Retail
98%2%
POSTE - ~€76b
Retail
Retail
Institutional
Institutional
Institutional

23
Closing remarks
2013 2014 2015 2016
6.8%
9.5%
2.8%
15.1%
8.4%
16.2%
5.0%
8.5%
Also in 2016 ANIMA showed strong reaction to a very challenging and rapidly evolvingscenario; the result is represented by a growththat for ANIMA is almost 2x the Italian Industry
Three main strategic moves were undertaken:• Exploiting new opportunities in the institutional
segment helped offsetting difficult moments in the retail banking distribution
• Cost reduction was effective to keep a solidoperational leverage even in a lower marginenvironment
• External growth opportunities accelerate the dimensional jump further widening the distributionnetwork
The management aims to proceed on this healthy growth path with unchanged determination always focusing on shareholders’ value creation
ANIMA Assogestioni ex ANIM
Source: ANIMA /Assogestioni
NN
M a
sa
% of
pre
viou
sye
aren
d A
uM
ANIMA: different, yet unique!

Il presente materiale non può in nessun caso essere interpretato come consulenza, invito all’investimento, offerta o raccomandazione per l’acquisto o la vendita di strumentifinanziari, né costituisce sollecitazione al pubblico risparmio. ANIMA è esonerata da qualsiasi responsabilità derivante da un uso improprio del presente materiale al pubblico,effettuato in violazione delle disposizioni degli Organi di Vigilanza anche in materia di pubblicità. I rendimenti passati non sono indicativi di quelli futuri. Prima di aderire leggereil Prospetto, disponibile presso la sede della società, i collocatori e sul sito www.animasgr.it.
This document is not intended to be an offer or solicitation, investment advice or recommendation for the purchase or sell any financial instruments and it cannot be disclosed tothird parties and/or distributed to the public.This is an informative report and its content is not intended and cannot be used improperly, also as advertising, for the placementof any fund managed by ANIMA Sgr, accordingly to Italian law. The Company assumes the hereby given information as accurate and reliable, but it does not guarantee itsprecision and it shaIl not therefore be liable for its use by the addressees. Past performance is not indicative of future returns.For detailed information, please consult the sales prospectus available at ANIMA Headquarter, third parties distributors and on our corporate website www.animasgr.it.
Anima Holding spaCorso Garibaldi, 99I – 20121 Milanowww.animaholding.it
Investor RelationsFabrizio ArmoneTel. [email protected]