2016global hr survey results - amazon web services · 2016 global hr survey results 18-24 25-34...
TRANSCRIPT
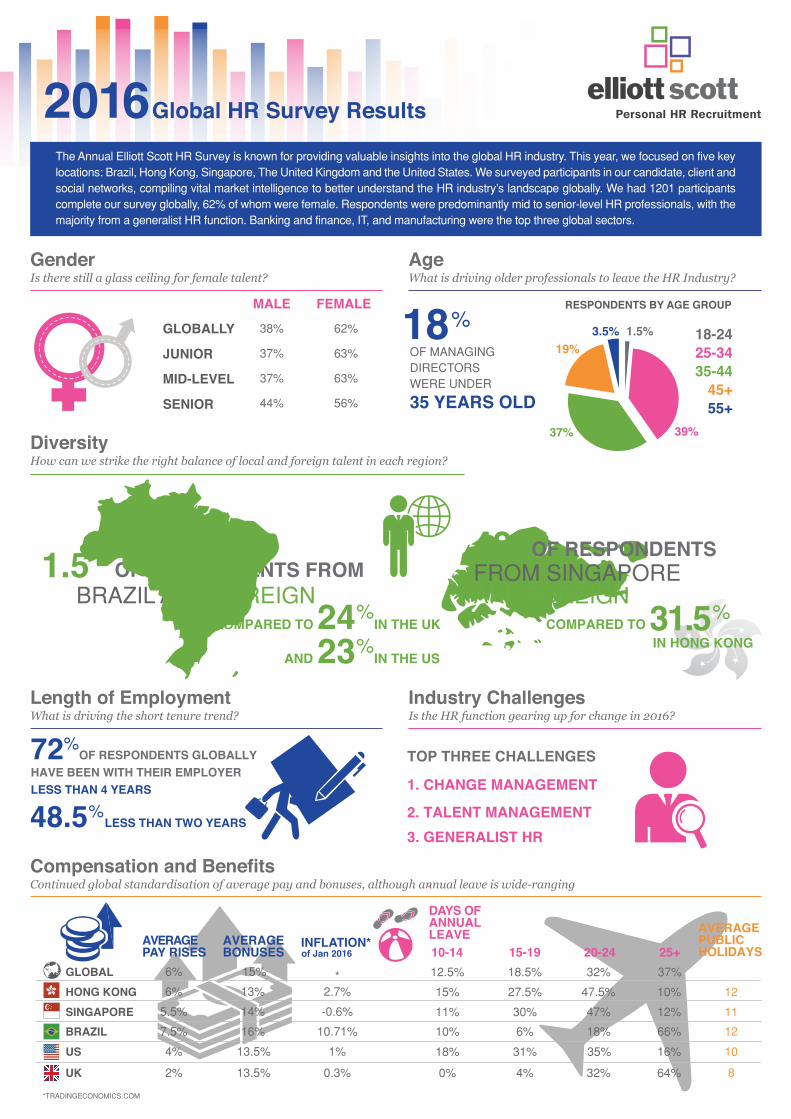
Global HR Survey Results2016
18-2425-3435-44
45+55+
RESPONDENTS BY AGE GROUP
1.5%
39%37%
19%3.5%
OF MANAGING DIRECTORSWERE UNDER
18%
35 YEARS OLD
MALE
GLOBALLY
JUNIOR
MID-LEVEL
SENIOR
FEMALE
GenderIs there still a glass ceiling for female talent?
AgeWhat is driving older professionals to leave the HR Industry?
38% 62%
37% 63%
37% 63%
44% 56%
The Annual Elliott Scott HR Survey is known for providing valuable insights into the global HR industry. This year, we focused on five key locations: Brazil, Hong Kong, Singapore, The United Kingdom and the United States. We surveyed participants in our candidate, client and social networks, compiling vital market intelligence to better understand the HR industry’s landscape globally. We had 1201 participants complete our survey globally, 62% of whom were female. Respondents were predominantly mid to senior-level HR professionals, with the majority from a generalist HR function. Banking and finance, IT, and manufacturing were the top three global sectors.
*TRADINGECONOMICS.COM
Compensation and BenefitsContinued global standardisation of average pay and bonuses, although annual leave is wide-ranging
15%
13%
14%
16%
13.5%
2.7%
-0.6%
10.71%
1%
6%
6%
5.5%
7.5%
4%
GLOBALHONG KONGSINGAPOREBRAZILUS
13.5% 0.3%2%
11%
10%
18%
0%
30%
6%
31%
4%
47%
18%
35%
32%
12%
66%
16%
64%
11
12
10
8UK
*
AVERAGEBONUSES
AVERAGEPAY RISES of Jan 2016
INFLATION*
DAYS OF ANNUAL LEAVE AVERAGE
PUBLIC HOLIDAYS 10-14
12.5%
15%
15-1918.5%
27.5%
20-2432%
47.5%
25+37%
10% 12
72%OF RESPONDENTS GLOBALLY
HAVE BEEN WITH THEIR EMPLOYER LESS THAN 4 YEARS 1. CHANGE MANAGEMENT
TOP THREE CHALLENGES
2. TALENT MANAGEMENT3. GENERALIST HR
48.5% LESS THAN TWO YEARS
Length of EmploymentWhat is driving the short tenure trend?
Industry ChallengesIs the HR function gearing up for change in 2016?
BRAZIL ARE FOREIGN
42%
FROM SINGAPORE ARE FOREIGN
COMPARED TO 24% IN THE UK
AND 23% IN THE US
COMPARED TO 31.5%IN HONG KONG
DiversityHow can we strike the right balance of local and foreign talent in each region?
% OF RESPONDENTS FROM 1.5
OF RESPONDENTS
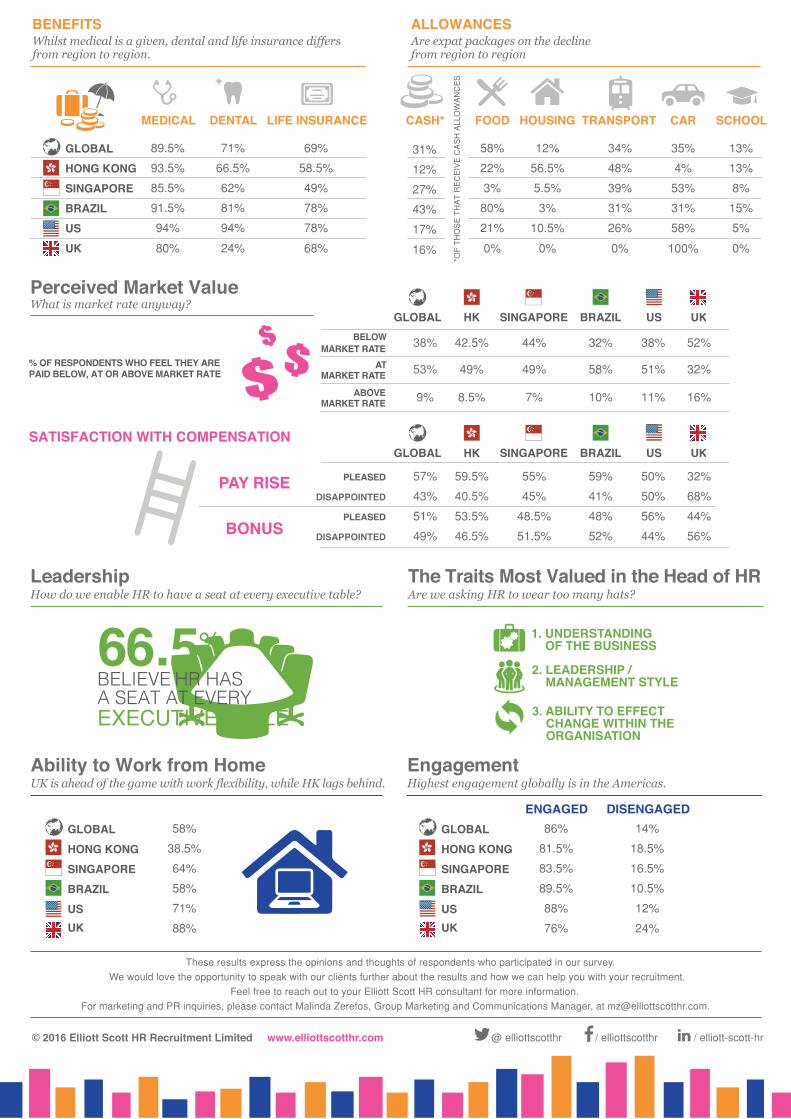
© 2016 Elliott Scott HR Recruitment Limited www.elliottscotthr.com @ elliottscotthr / elliottscotthr / elliott-scott-hr
These results express the opinions and thoughts of respondents who participated in our survey.
We would love the opportunity to speak with our clients further about the results and how we can help you with your recruitment.
Feel free to reach out to your Elliott Scott HR consultant for more information. For marketing and PR inquiries, please contact Malinda Zerefos, Group Marketing and Communications Manager, at [email protected].
BELIEVE HR HAS A SEAT AT EVERY
EXECUTIVE TABLE
66.5% 1. UNDERSTANDING OF THE BUSINESS
3. ABILITY TO EFFECT CHANGE WITHIN THE ORGANISATION
2. LEADERSHIP / MANAGEMENT STYLE
LeadershipHow do we enable HR to have a seat at every executive table? Are we asking HR to wear too many hats?
BENEFITSWhilst medical is a given, dental and life insurance differs from region to region.
EngagementHighest engagement globally is in the Americas.
DISENGAGED14%
18.5%
16.5%
10.5%
12%
ENGAGED86%
81.5%
83.5%
89.5%
88%
24%76%
GLOBALHONG KONGSINGAPOREBRAZILUSUK
58%
38.5%
64%
58%
71%
88%
GLOBALHONG KONGSINGAPOREBRAZILUSUK
Ability to Work from HomeUK is ahead of the game with work flexibility, while HK lags behind.
PAY RISE
BONUS
GLOBAL SINGAPORE BRAZIL
57%
43%
51%
49%
PLEASED
DISAPPOINTED
PLEASED
DISAPPOINTED
55%
45%
48.5%
51.5%
59%
41%
48%
52%
UK
32%
68%
44%
56%
SATISFACTION WITH COMPENSATION
Perceived Market ValueWhat is market rate anyway?
GLOBAL SINGAPORE BRAZIL UK
38%BELOWMARKET RATE 44% 32% 52%
9%ABOVEMARKET RATE 7% 10% 16%
53%ATMARKET RATE
HK
59.5%
40.5%
53.5%
46.5%
HK
42.5%
8.5%
49% 49% 58% 32%
US
50%
50%
56%
44%
US
38%
11%
51%
GLOBALHONG KONGSINGAPORE
USUK
89.5%
93.5%
85.5%
80%
94%
BRAZIL 91.5%
35%
4%
53%
100%
58%
31%
13%
13%
8%
0%
5%
15%
69%
58.5%
49%
68%
78%
78%
71%
66.5%
62%
24%
94%
81%
31%
12%
27%
16%
17%
43%
MEDICAL
12%
56.5%
5.5%
0%
10.5%
3%
HOUSING
34%
48%
39%
0%
26%
31%
TRANSPORT CAR SCHOOLDENTAL FOOD
58%
22%
3%
0%
21%
80%
*OF
TH
OS
E T
HA
T R
EC
EIV
E C
AS
H A
LLO
WA
NC
ES
The Traits Most Valued in the Head of HR
% OF RESPONDENTS WHO FEEL THEY ARE PAID BELOW, AT OR ABOVE MARKET RATE
LIFE INSURANCE CASH*
ALLOWANCESAre expat packages on the decline from region to region