2017-10-d-01-en-5 report on european baccalaureate 2017
TRANSCRIPT

2017-10-D-01-en-5 1/61
Schola Europaea
European Baccalaureate Unit Office of the Secretary-General
Ref. : 2017-10-D-1-en-5
Orig.: EN
Report on European Baccalaureate 2017 Approved by the Board of Governors of the European Schools
On its meeting of 5th, 6th and 7th December 2017 – OSGES Brussels

2017-10-D-01-en-5 2/61
Report on European Baccalaureate 2017
2017-10-D-01-en-4 3/61
INDEX Abbreviations 4 INTRODUCTION 5
1. The European Baccalaureate Examinations 6 1.1 Structure of the examinations 6 1.2 Addtitional written examinations 7 1.3 Correction of the European Baccalaureate Examinations: the On-line Correction System 8 1.4 Communication 11
2. Assurance Quality of the European Baccalaureate 2017 Session 11 2.1 The European Baccalaureate Subjects 11 2.2 Quality control of the European Baccalaureate examination proceedings 11 2.3 Inspectors responsible for the different subjects 13
3. The European Baccalaureate Candidates 15 3.1 Number of candidates in the 2017 European Baccalaureate session 15 3.2 Participation in the Eur. Baccalaureate 2017 session by school and by language section 17 3.3 Evolution of the number of schools and candidates over the years 18
4. General Results of the European Baccalaureate 2017 session 20 4.1 Success rate over the last 15 years 20 4.2 Final marks and averages 22 4.3 The Preliminary Marks 25 4.4 The Written Correction Marks 28 4.5 Gender differences 31 4.6 EB examinations and most popular written and oral examination options 34 4.7 Students Without A Language Section (SWALS) 39
5. Results about the Sciences: Biology, Chemistry, Economic Sciences, Mathematics 3P, Mathematics 5P and Physics 41 5.1 Final Marks for Science Classes 41 5.2 Comparison of Final Marks / Written Marks of Scientific Courses 41 5.3 EB Sciences Written Examination Marks Results 48 5.4 Oral Marks Average for Science EB Examinations 61

Report on European Baccalaureate 2017
2017-10-D-01-en-4 4/61
LANGUAGES
1 BG : Bulgarian
2 CS : Czech
3 DE : German
4 DA : Danish
5 EL : Greek
6 EN: English
7 ES Spanish
8 ET : Estonian
9 FI : Finnish
10 FR : French
11 GA : Gaelic
12 HR: Croatian
13 HU : Hungarian
14 IT : Italian
15 LT : Lithuanian
16 LV : Latvian
17 MT: Maltese
18 NL : Dutch
19 PL : Polish
20 PT : Portuguese
21 RO : Romanian
22 SK : Slovakian
23 SL : Slovene
24 SV : Swedish
Abbreviations
ART: Artistic Education ar4 – Art (4 hours) Writtenbi2 – Biology (2 hour option) Oralbi4 – Biology (4 hour option) Written or Oral
CHI: Chemistry chi – Chemistry Written or OralECO: Economics eco – Economics Written
ge2 – Geography (2 hour option) Oralge4 – Geography (4 hour option) Written or Oral
GRE ANC.: Ancient Greek gre – Ancient Greek Writtenhi2 – History (2 hour option) Oralhi4 – History (4 hour option) Written or Orall1 – Language I Written and Orall2 – Language II Written and/or Orall3 – Language III Written or Orall4 – Language IV Written or Orall1a – Language I Advanced Written and Orall2a – Language II Advanced Written and/or Oral
LAT: Latin lat – Latin Writtenma3 – Math (3 hour option) Writtenma5 – Math (5 hour option) Writtenmaa – Math Advanced Oral
MUS: Musical Education mu4 – Music (4 hour option) WrittenONL: Other National Language onl – Other National Language Written or Oral
ph2 – Philosophy (2 hour option) Oralph4 – Philosophy (4 hour option) Written or Oral
PHY: Physics phy - Physics Written or Oral
SUBJECTS
PH:
LanguageAdvanced course
LanguageBasic course
History
Geography
Biology
Mathematics
Philosophy
(L I) A:
L (1):
HI:
GEO:
BIO:
MATH:
SCHOOLS
*BRI: Liceo scientifico “Fermi Monticelli” Brindisi
*HEL: European Schooling Helsinki
*HER: School of European Education Heraklion
*MAN: École internationale de Manosque
*PAR: Scuola per l'Europa di Parma
*RHM: Europäische Schule RheinMain
*STR: École européenne de Strasbourg
ALI : Alicante
BER: Bergen
BR 1 / UCC: Bruxelles 1
BR 2 / WOL: Bruxelles 2
BR 3 / IXL: Bruxelles 3
BR 4 / LAE: Bruxelles 4
CUL: Culham
FRF: Frankfurt
KAR: Karlsruhe
LUX 1 / LUX: Luxembourg 1
LUX 2 / MAM: Luxembourg 2
MOL: Mol
MUN: Munich
VAR: Varese

Report on European Baccalaureate 2017
2017-10-D-01-en-4 5/61
Introduction
The 58th session of the European Baccalaureate was chaired by Prof. Dr. Wolfgang SCHÖBERLE, European Baccalaureate President, from Germany. 1993 candidates, from 14 European Schools and 7 Accredited Schools, registered for the European Baccalaureate 2017 session.
EB session 2017 - participants European Baccalaureate 2017 – Averages
Registered 2006 Overall Average for the Preliminary Mark 79.93
Abandoned 13 Overall Average for Written Examinations 73.93
Participated 1993 Overall Average for Oral Examinations 81.86
Passed 1948 Overall Average for the Final Mark 78.12
Failed 45
Success rate 97.74%
Fail rate 2.26%

Report on European Baccalaureate 2017
2017-10-D-01-en-4 6/61
1. The European Baccalaureate Examinations
1.1. Structure of the examinations
The structure of the European Baccalaureate examinations is defined in Article 3, “Uniformity of examinations”, of the Arrangements for Implementing the European Baccalaureate Regulations, which specifies that:
ARTICLE 3 — UNIFORMITY OF EXAMINATIONS 3.1 Uniformity of Examinations
The following can be the subject of written and oral European Baccalaureate examinations:
Compulsory subjects (with the exception of Physical Education and Religion/Ethics) Options Advanced subjects All written European Baccalaureate examinations carry the same weighting. All oral European Baccalaureate examinations carry the same weighting.
3.1.1 All written European Baccalaureate examinations will be the same for all candidates, irrespective of the language section to which they belong. The examinations in Languages 1, 2, 3 and 4 are different in so far as the examination papers are set with reference to texts in the original languages. However, they must also follow the general harmonisation framework.
3.1.2 In Language 1, basic course, a uniform examination will be taken by all the pupils in the same language section. The same applies to Language 1, advanced course.
3.1.3 In Foreign Languages, a uniform examination will be taken in each language and at each level by candidates from all language sections.
5 written examinations
LI – basic or advanced course
LII – basic or advanced course
Mathematics–3 periods or 5 periods course
Two 4 period options
3 oral examinations
LI – basic or advanced course
LII – basic or advanced course
or History 2 p. or 4 p. (if not chosen as written examination)
or Geography 2 p. or 4 p.(if not chosen as written examination)
1 subject chosen by the pupil among the 2-period compulsory subjects and the 4-period options
or Advanced Mathematics (compulsory for pupils who followed this course).

Report on European Baccalaureate 2017
2017-10-D-01-en-4 7/61
1.2 Additional written examinations
Article 13 of the Arrangements for Implementing the regulations for the European Baccalaureate establishes that candidates may be allowed to sit for an additional written examination of an option subject and the conditions therefor.
Article 13 states that:
13.1 In particular cases, European School pupils in the final school year may register for the European Baccalaureate in an additional option subject, whether or not they have attended lessons in the subject in question at the School.
However, in the case of Music and Art, due to specific syllabus requirements, an additional exam can only be applied for if the pupil has followed the subject or if he provides evidence of the prescribed work done during s6 and s7 so as to ensure that the syllabus requirements are met. (…)
13.4 Only written examinations will be available (…)
13.4.2 The examination script will be corrected, in the same conditions as normal European Baccalaureate examination scripts. (…)
13.5 The result in this additional written examination will not be included for the purposes of calculating the final mark appearing on the candidate’s Certificate of European Baccalaureate Marks, but will be shown on an Additional Examination Certificate signed by the Secretary-General of the European Schools (…).
The graph below shows the evolution of requests for an additional written examination.
27 requests were received this year, 24 were accepted.
5 candidates finally withdrew their request, so only 19 additional written examinations were taken under article 13 at the 2017 EB session.
Chemistry and Physics remain the most popular subjects chosen as an additional examination.
BI4 CHI ECO GEO L3 LAT MUS PHY
2017 2 10 7
2016 3 10 1 1 1 3
2015 1 11 1 1 1
2014 2 10 4
2013 1 10 1 1 4
0
2
4
6
8
10
12
Additional Written Examinations - Art. 13

Report on European Baccalaureate 2017
2017-10-D-01-en-4 8/61
1.3 Correction of the European Baccalaureate Examinations: the On-line Correction System
For the first time, the scripts of the European Baccalaureate session were corrected on-line, through the Viatique system, by Neoptec, the French company which won the call for tender launched in 2016 by the OSG. Neoptec is a company specialized in the digitization of examinations paper scripts through production scanners and software for their on-line correction. Viatique has been customized to comply with the European Baccalaureate regulations.
The implementation of the on-line correction system during the European Baccalaureate session 2017 was successful due to everybody’s efforts and co-operation.
This new system has shown great potential for the continuous improvement of the quality of assessment of the written European Baccalaureate examinations and for enhancing the efficiency of all the phases in the correction process.
These are some key features supported by the on-line platform : Scanning of the examination scripts The scanning of the scripts were made in each examination centre. The scripts were compacted and uploaded automatically to a secure server with an encrypted connexion. The scanning of the examination scripts allowed scripts to be available earlier for second correctors, with the advantage of extending the correction period for second correction. Special measures for the European Baccalaureate Session 2017 : following a request of INTERPARENTS, and in order to assure zero risk, both the traditional correction system and the on-line correction system overlapped in the European Baccalaureate session 2017.
Once scanned, the paper examination scripts were accessible to the teachers for consultation in the schools, if necessary. Just like every year, once the correction period in the schools ended, the paper examination scripts were shipped by courier to the correction centres, so that they could be accessed by the external correctors, only if necessary. However, all corrections were performed using the on-line platform.
The scanning of the 2017 European Baccalaureate scripts went extremely well. All scripts were scanned according to the schedule, actually even earlier than foreseen, and there was no delay in their distribution to the correctors.
The readability of the scripts on the screen was very good. Only in 0.1% of the cases, a re-scanning was requested. The scanning of special formats for pupils with special arrangements was also successful.
A survey was conducted and 97.77% of the teachers think that the readability of the scripts on the screen is good or very good.

Report on European Baccalaureate 2017
2017-10-D-01-en-4 9/61
Anonymity Anonymity of the scripts resulted in the unbiased assessment of candidates. This was automated during the scanning process. All examinations subjects scripts were anonymized, with the exception of Art and Music. The written part of these examinations also went on the official examination paper, which was scanned. The rest of the parts, preparation and final art work was provided to the correctors in original form. So that the written part could be related to the rest of the parts. However, the marks for all parts and the final commentary was introduced in the on-line correction platform. Criteria referenced All examinations were accompanied by a marking scheme and grid, correction criteria and guidelines and/or suggested answers. These were known to the correctors and served as a benchmark to assess the examinations and award marks, through the forum in the Viatique software. Multiple correction and marking: Internal / External The on-line tools allowed the same script to be corrected by more than one corrector. In our system, every script is corrected twice. A third corrector can be involved if there is a mark disagreement of over 2 points between the two correctors.
The on-line platform also made it possible to make sure that each corrected regularly added a final general mandatory commentary as established in the regulations. To validate the correction of a single script the corrector only needed to have entered the marks for every question and the final commentary, otherwise the validate button would not be active. Random allocation of the scripts On-line correction tools allowed distributing evenly scripts from different schools to different correctors. Before, so as to simplify the logistics, it was normally one corrector who corrected all the scripts from the same class/school.

Report on European Baccalaureate 2017
2017-10-D-01-en-4 10/61
Blind correction On-line correction tools allowed scripts to have marking signs, symbols and comments without them being accessible to the second corrector, so that the second correction remained unbiased. However, all these elements were accessible to the third corrector (in the cases of mark disagreement over 2 marks), the inspectorate and European Baccalaureate Unit. Blended model The first correction was still carried out internally by the teacher of the candidate in the European Schools and the Accredited Schools.
The second correction was carried out by a corrector external to the European School system in a correction centre (European Schools) where 1 or 2 days’ meetings were organised between the inspectors and the external correctors in order to discuss correction guidelines and practice. Training and assistance on the use of the on-line platform was provided. Neoptec experts and the European Baccalaureate Unit were also present in the correction centres to support the external correctors and the inspectors during the correction period.
4 correction centres were open: the European School of Brussels 1 – Uccle, the European School of Brussels 4 – Laeken, the European School of Varese and the European School of Alicante.
Alicante for Spanish LI, LII, LIII, LIV and Art in Spanish. 8 external correctors and 1 inspector were assigned to this centre.
Varese for Italian LI, LII, LIII, LIV and Art in Italian. 7 external correctors and 1 inspector were assigned to this centre.
Brussels IV (LAE) for Mathematics, Physics, Biology and Chemistry. 73 external correctors and 3 inspectors were assigned to this centre.
Brussels I (UCC) for the rest of the subjects. 125 external correctors and 14 inspectors were assigned to this centre.
29 external correctors chose to fully correct theirs scripts at distance, i.e. entirely from home. It has to be noted that the scripts from the accredited schools of Brindisi and Heraklion were not part of the on-line process correction. These scripts were corrected through the usual distance correction process. As from next session, these 2 schools will join the on-line correction process as well. Retrieving evidence and accessibility to corrected scripts Corrected scripts were easily accessible since they are stored in a secured server accessible anytime from anywhere. This also eliminates the difficulty of retrieving documents in case of appeals and especially during periods where many members of the staff in the schools are on holiday. Correctors training The on-line correction tools are easy to use. There is an on-line tutorial and a help-line. The electronic tools be web-based so that no software needs to be installed in the correctors’ own computers. Still, assistance for correctors and short refresher trainings were provided in the correction centres. Corrector’s assessment The on-line tools were able to inform on correctors’ performance. Analysis of standard deviation on the corrected items or papers was possible.

Report on European Baccalaureate 2017
2017-10-D-01-en-4 11/61
Possibility of moderation The on-line tools allow automated recalculation of values either for the whole examination or for individual questions as a result of the modification of values in the different questions of an examination or due to the cancellation of one or several questions. Monitoring of the correction process On-line correction tools allow monitoring and validation of the correction process. They provide immediate access to statistics on performance.
1.4 Communication
This year, to support communication, the European Baccalaureate could also be followed through the social media.
2. Assurance Quality of the 2017 European Baccalaureate session
2.1 The European Baccalaureate Subjects
The European Baccalaureate examinations are elaborated under the responsibility of the secondary cycle inspectors listed above, assisted by teams of external experts. For the 2017 EB session, 154 experts participated in the elaboration of 149 main examination papers and 160 reserve papers. Each examination paper was accompanied by suggested answers, assessment criteria, marking instructions and marking grid. The Board of Inspectors (Secondary) may decide to submit written European Baccalaureate examinations to external auditing in order to add a further layer of quality assurance.
The external auditing of the examination papers is performed by independent experts with experience in the field of assessment. These experts are proposed by the Chairman of the European Baccalaureate Examining Board.
For the European Baccalaureate session of 2017, the examination papers of Biology, Chemistry, Mathematics 3P, Mathematics 5P, Physics and L3 German were audited externally and were found fit for purpose.
2.2 Quality control of the European Baccalaureate examinations proceedings
Quality control of the written and oral examinations in the 21 participating schools was carried out by the Vice-Chairmen. In order to supervise the proceedings, the Vice-Chairmen visited the assigned examination centers for up to 2 days during the written examinations and for a maximum of 4 days per center throughout the oral examinations’ period. This year the supervision of the examination centers was distributed as follows:

Report on European Baccalaureate 2017
2017-10-D-01-en-4 12/61
Schule / School / École
Die stellv. Vorsitzenden und Qualitätskontrolle / The Vice-Chairmen and Quality Control / Les Vice-Présidents et Contrôle de la Qualité
►ALICANTE Ms Lynda O’TOOLE, Ms Anna-Anca PETRACHE
►BERGEN Mr George MIFSUD
►BRUSSELS 1 Ms Margarita KALOGRIDOU, Mr Konrad LESZCZYŃSKI,
Ms Silvia KANTCHEVA
►BRUSSELS 2 Mr Alex COENEN, Ms Zsuzsanna NYIRO
►BRUSSELS 3 Ms Els VERMEIRE, Ms Karin NILSSON
►BRUSSELS 4 Mr Lars DAMKJAER, Ms Karin ECKERSTORFER
►CULHAM Ms Maria José PÉREZ BLANCO, Mr Javier GARRALÓN BARBA
►FRANKFURT Ms Violeta VALIUŠKEVIČIENÉ
►KARLSRUHE Ms Maie KITSING
►LUXEMBOURG 1 Ms Jana HANDZELOVA, Ms Olita ARKLE
►LUXEMBOURG 2 Ms Mojca POZNANOVIČ-JEZERSEK, Mr Luc LOUYS
►MOL Ms. Linde van den BOSCH
►MUNICH Ms Olga DRÁPALOVÁ
►VARESE Ms Tuulamarja HUISMAN
►*BRINDISI Ms. Linde van den BOSCH
►*HELSINKI Ms. Helena COELHO
►*HERAKLION Ms Jasna ANIČIĆ
►*MANOSQUE Mr Dominique WILLÉ, Mr Luc LOUYS
►*PARMA Ms Diana SACCARDO
►*RHEINMAIN Mr Loizos ANASTASIADES
►*STRASBOURG Mr Max WOLFF

Report on European Baccalaureate 2017
2017-10-D-01-en-4 13/61
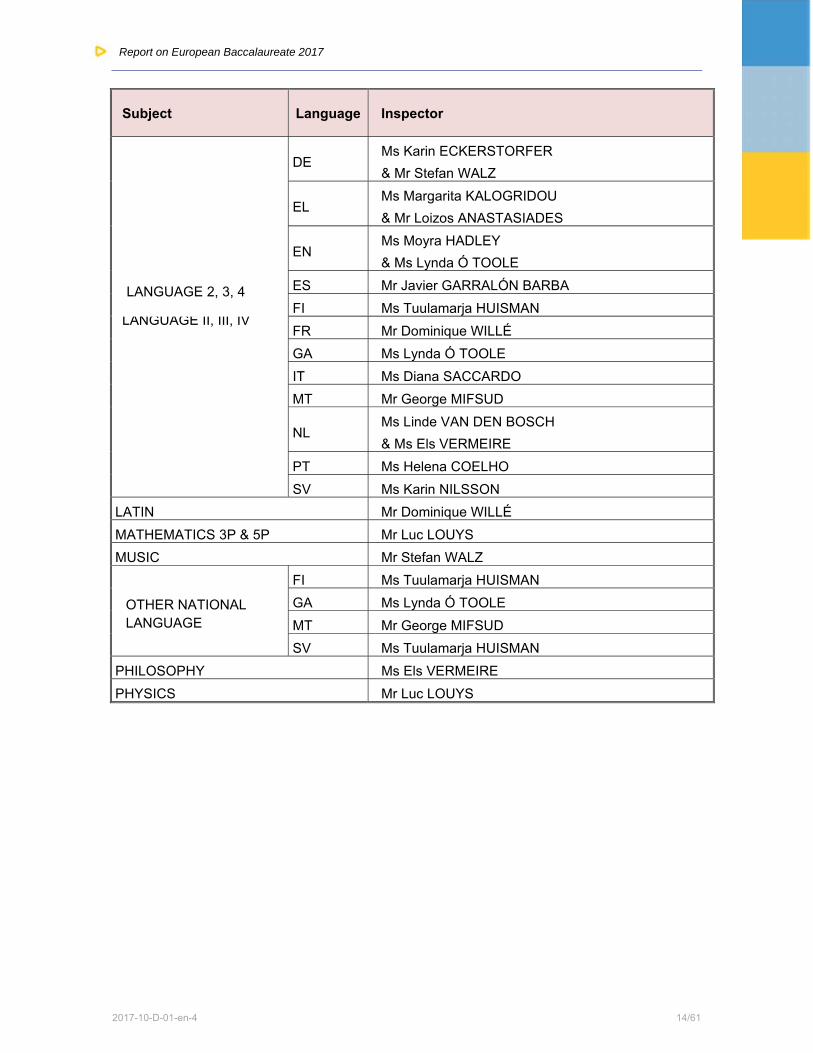
2.3 Inspectors responsible for the different subjects
Subject Language Inspector
ANCIENT GREEK Ms Margarita KALOGRIDOU
ART Ms Karin NILSSON
BIOLOGY Mr Max WOLFF
CHEMISTRY Mr Alex COENEN
ECONOMICS Ms Maria José PÉREZ BLANCO
GEOGRAPHY Ms Olga DRÁPALOVÁ
HISTORY Ms Helena COELHO
LANGUAGE I
BG Ms Silvia KANTCHEVA
CS Ms Olga DRÁPALOVÁ
DA Mr Lars DAMKJAER
DE Mr Stefan WALZ
& Ms Karin ECKERSTORFER
EL Ms Margarita KALOGRIDOU
EN Ms Moyra HADLEY
ES Mr Javier GARRALÓN BARBA
ET Ms Maie KITSING
FI Ms Tuulamarja HUISMAN
FR Mr Dominique WILLÉ
HR Ms Jasna ANIČIĆ
HU Ms Zsuzanna NYÍRÖ
IT Ms Diana SACCARDO
LT Ms Violeta VALIUŠKEVIČIENÉ
LV Ms Olita ARKLE
MT Mr George MIFSUD
NL Ms Linde VAN DEN BOSCH
& Ms Els VERMEIRE
PL Mr Konrad LESZCZYŃSKI
PT Ms Helena COELHO
RO Ms Anca PETRACHE
SK Ms Jana HANDZELOVÁ
SL Ms Mojca POZNANOVIČ-JEZERSEK
SV Ms Karin NILSSON
LANGUAGE 1
Report on European Baccalaureate 2017
2017-10-D-01-en-4 14/61
Subject Language Inspector
LANGUAGE II, III, IV
DE Ms Karin ECKERSTORFER
& Mr Stefan WALZ
EL Ms Margarita KALOGRIDOU
& Mr Loizos ANASTASIADES
EN Ms Moyra HADLEY
& Ms Lynda Ó TOOLE
ES Mr Javier GARRALÓN BARBA
FI Ms Tuulamarja HUISMAN
FR Mr Dominique WILLÉ
GA Ms Lynda Ó TOOLE
IT Ms Diana SACCARDO
MT Mr George MIFSUD
NL Ms Linde VAN DEN BOSCH
& Ms Els VERMEIRE
PT Ms Helena COELHO
SV Ms Karin NILSSON
LATIN Mr Dominique WILLÉ
MATHEMATICS 3P & 5P Mr Luc LOUYS
MUSIC Mr Stefan WALZ
OTHER NATIONAL LANGUAGE
FI Ms Tuulamarja HUISMAN
GA Ms Lynda Ó TOOLE
MT Mr George MIFSUD
SV Ms Tuulamarja HUISMAN
PHILOSOPHY Ms Els VERMEIRE
PHYSICS Mr Luc LOUYS
LANGUAGE 2, 3, 4
OTHER NATIONAL LANGUAGE

Report on European Baccalaureate 2017
2017-10-D-01-en-4 15/61
3. The European Baccalaureate Candidates
3.1 Number of candidates in the 2017 European Baccalaureate session
European School of (ES)
1. Alicante……………………………………… (ALI) 68 candidates2. Bergen………………….…………………… (BER) 46 candidates3. Bruxelles 1 – Uccle….……………………. (Br 1 - UCC) 228 candidates4. Bruxelles 2 – Woluwé ……………………. (Br 2 - WOL) 225 candidates5. Bruxelles 3 - Ixelles….……………………. (Br 3 - IXL) 244 candidates6. Bruxelles 4 – Laeken..……………………… (BR 4 - LAE) 93 candidates7. Culham……………………………………… (CUL) 62 candidates8. Frankfurt……………………………………. (FRF) 86 candidates9. Karlsruhe…………………………………… (KAR) 70 candidates
10. Luxembourg I……………………………… (LUX) 190 candidates11. Luxembourg II……………………………… (MAM) 154 candidates12. Mol…………………………………………… (MOL) 57 candidates13. Munich……………………………………… (MUN) 158 candidates14. Varese……………………………………… (VAR) 75 candidates
1756 candidates European Accredited Schools (EAS)
1. Liceo Scientifico "Fermi-Monticelli" - European High School Brindisi
(*BRI) 4 candidates
2. European Schooling Helsinki (*HEL) 23 candidates3. The School of European Education of Heraklion (*HER) 9 candidates4. École internationale de Manosque (*MAN) 12 candidates5. Scuola per l'Europa di Parma (*PAR) 40 candidates6. The European School RheinMain (*RHM) 81 candidates7. École européenne de Strasbourg (*STR) 68 candidates
237 candidates TOTAL NUMBER OF CANDIDATES EB Session 2017 1993 candidates
Number of examinations
Candidates Written Exams
Total Written Exams
Additional Exams
Grand Total Written Exams
Oral Exams
Total Oral Exams
TOTAL EXAMS
ES 1756 5 per cand.
8.780 19 8.799 3 per cand.
5.268 14.067
AES 237 5 per cand.
1.185 0 1.185 3 per cand.
711 1.896
TOTAL 1993 9.965 19 9.984 5.979 15.963

2017-10-D-01-en-5 16/61
Draft Report on European Baccalaureate 2017
The number of candidates to the 2017 Baccalaureate examination session, by school and by subject, can be seen in the following tables:
SUBJECT *BRI *HEL *HER *MAN *PAR *RHM *STR ALI BERUCC BR 1
WOL BR 2
IXL BR 3
LAE BR 4
CUL FRF KARLUX LU 1
MAMLU 2
MOL MUN VARGrand Total
ANCIENT GREEK 4 4
ART 4P 2 2 3 25 3 11 7 21 40 25 9 15 8 8 23 14 6 20 7 249
BIOLOGY 4P 2 3 3 3 13 13 16 14 24 61 46 71 22 20 25 8 34 40 18 63 16 515
CHEMISTRY 1 7 3 4 3 10 26 14 4 50 48 64 23 18 16 11 44 24 28 39 17 454
ECONOMICS 1 3 2 5 28 6 7 13 27 36 49 27 11 19 14 41 27 15 28 19 378
GEOGRAPHY 4P 6 1 2 36 4 6 9 19 33 10 11 5 20 31 22 30 25 14 284
HISTORY 4P 6 2 3 6 13 9 4 60 58 56 30 9 16 18 46 33 8 21 12 410
L1 4 23 9 9 40 81 60 68 46 214 207 230 93 54 82 65 181 139 57 152 72 1886
L1 ADV 3 8 14 18 14 8 4 5 9 15 6 3 107
L2 4 23 9 12 35 81 59 63 35 220 214 231 88 54 78 70 160 139 50 146 65 1836
L2 ADV 5 9 5 11 8 11 13 5 8 8 0 30 15 7 12 10 157
L3 2 4 6 19 11 33 27 6 96 66 81 26 18 27 22 58 59 12 38 30 641
L4 2 2 9 4 13 16 33 35 41 10 2 8 7 25 21 2 15 12 257
LATIN 1 1 6 5 6 5 24
MATHS 3P 3 11 7 4 21 70 42 45 23 128 126 152 29 39 54 45 121 85 31 92 37 1165
MATHS 5P 1 12 2 8 19 11 26 23 23 100 99 92 64 23 32 25 69 69 26 66 38 828
MUSIC 4P 1 3 1 5 1 4 6 5 5 31
ONL 5 3 1 9
PHILOSOPHY 4 2 2 11 5 29 6 32 9 27 6 6 11 10 27 19 10 15 6 233
PHYSICS 1 11 5 5 17 8 15 12 19 52 70 53 21 16 16 11 50 36 15 49 16 498
TOTAL 20 115 45 60 200 405 340 340 230 1140 1125 1220 465 310 430 350 950 770 285 791 375 9965
Written exams 5 5 5 5 5 5 5 5 5 5 5 5 5 5 5 5 5 5 5 5 5 5
Candidates 4 23 9 12 40 81 68 68 46 228 225 244 93 62 86 70 190 154 57 158 75 1993

2017-10-D-01-en-5 17/61
Draft Report on European Baccalaureate 2017
3.2 Participation in the European Baccalaureate 2017 session by school and by language section
Of the 2006 pupils registered for the European Baccalaureate at the beginning of the 2016-2017 school year, 1993 actually took part in the examinations, 13 pupils having given up their studies in mid-year or during the European Baccalaureate session. During the written examinations 20 candidates were partially absent due to medical reasons and 5 due to participation in UNED or STEPS Examinations. 12 substitute examinations were organised in June 2017. Two candidates were allowed to take part in an extraordinary session in September 2017, one of them withdrew a few days before the examinations and therefore only two substitute written examinations were organised accordingly. The largest number of European Baccalaureate candidates per school came from the European School of Brussels 3 (244). The lowest cohort, 4 pupils, belongs to an Accredited Schools, Brindisi (IT).
The largest number of European Baccalaureate candidates per language section can be found in the French language section, with 511 candidates, closely followed by candidates from the English section, 462, and the German section, 383.
423
9 12
40
8168 68
46
228225244
93
62
8670
190
154
57
158
75
0
50
100
150
200
250
300
*BRI
*HEL
*HER
*MAN
*PAR
*RHM
*STR ALI
BER
BR 1
BR 2
BR 3
BR 4
CUL
FRF
KAR
LUX
MAM
MOL
MUN
VAR
Number of candidates per school - EB 2017
45
383
59
462
105
40
511
9
169124
22 33 31
0
100
200
300
400
500
600
DA DE EL EN ES FI FR HU IT NL PL PT SV
Number of candidates per linguistic section

Report on European Baccalaureate 2017
2017-10-D-01-en-4 18/61
3.3. Evolution of the number of schools and candidates over the years
1493 1512 1476 1489 1564
1789 17991885
1993
0
500
1000
1500
2000
2500
2009 2010 2011 2012 2013 2014 2015 2016 2017
Number of candidates EB sessions 2009-2017
12 12 12 1213 13 13 13
14
1 1 1 1
34
56
7
0
2
4
6
8
10
12
14
16
2009 2010 2011 2012 2013 2014 2015 2016 2017
Number of schools - EB sessions 2009-2017
ES AES
1481 1508 1464 1467 1516
1708 1699 1706 1756
12 4 12 22 48 81 100179 237
0
200
400
600
800
1000
1200
1400
1600
1800
2000
2009 2010 2011 2012 2013 2014 2015 2016 2017
Number of candidates per AES and ES -EB sessions 2009-2017
ES AES

Report on European Baccalaureate 2017
2017-10-D-01-en-4 19/61
Evolution of the AES candidates (base 100 in 2009, year of 1st AES in EB session)
Sessions ES candidates
AES candidates
Total Evolution of the AES
candidates (base 100 in 2009)
2009 1481 12 1493 100
2010 1508 4 1512 33
2011 1464 12 1476 100
2012 1467 22 1489 183
2013 1516 48 1564 400
2014 1708 81 1789 675
2015 1699 100 1799 833
2016 1706 179 1885 1492
2017 1756 237 1993 1975
14305 695 15000 In 9 sessions time, the number of AES candidates was multiplied by nearly 20.

Report on European Baccalaureate 2017
2017-10-D-01-en-4 20/61
4. General Results of the European Baccalaureate 2017 session
EB session 2017 - participants European Baccalaureate 2017 – Averages
Registered 2006 Overall Average for the Preliminary Mark 79.93
Abandoned 13 Overall Average for Written Examinations 73.93
Participated 1993 Overall Average for Oral Examinations 81.86
Passed 1948 Overall Average for the Final Mark 78.12
Failed 45
Success rate 97.74%
Fail rate 2.26%
4.1 Success rate over the last 15 years
A comparison of success rates over the last 15 years shows that the European Baccalaureate situation stays stable.
As from session 2003, the variation in success rate never went over ± 0.7, with a general average over the 18 last sessions of 97.9%.
97,2%
98,1% 98,1%
97,5%
98,2%
97,5%
98,0%
98,5%
98,2%
97,4%
97,8%
98,3% 98,3%
98,1%
97,7%
96,0%
96,5%
97,0%
97,5%
98,0%
98,5%
99,0%
99,5%
100,0%
2003 2004 2005 2006 2007 2008 2009 2010 2011 2012 2013 2014 2015 2016 2017

Report on European Baccalaureate 2017
2017-10-D-01-en-4 21/61
Success rate EB session 2017
School Candidates Passed Success
Rate
*BRI 4 3 75.00 %
*HEL 23 22 95.65 %
*HER 9 9 100 %
*MAN 12 12 100 %
*PAR 40 40 100 %
*RHM 81 79 97.53 %
*STR 68 61 89.71 %
ALI 68 68 100 %
BER 46 46 100 %
BR 1 228 226 99.12 %
BR 2 225 216 96.00 %
BR 3 244 238 97.54 %
BR 4 93 91 97.85 %
CUL 62 62 100 %
FRF 86 86 100 %
KAR 70 70 100 %
LUX 190 186 97.89 %
MAM 154 151 98.05 %
MOL 57 55 96.49 %
MUN 158 153 96.84 %
VAR 75 74 98.67 %
1993 1948 97.74 %
Success rate by language section
Language Section
Candidates Passed Success Rate
Schools involved
DA 45 45 100% 2DE 383 373 97% 15EL 59 59 100% 3EN 462 455 98% 21ES 105 103 98% 4FI 40 39 98% 3FR 511 492 96% 17HU 9 9 100% 1IT 169 168 99% 8NL 124 122 98% 7PL 22 22 100% 2PT 33 31 94% 2SV 31 30 97% 2
1993 1948 97.74%
School Number of candidates
% Passed Failed Success
rate
ES 1756 88.11% 1722 34 98.06%
AES 237 11.89% 226 11 95.36%
1993 1948 45 97.74%
Success rate per type of school:
The table on the right shows the success rate in the
different language sections. This year, the success rates by language section ranged
between 94% and 100%. Due to small numbers of bachelors
in some sections, the results are not always statistically
comparable.

Report on European Baccalaureate 2017
2017-10-D-01-en-4 22/61
4.2 Final marks and averages
The final overall European Baccalaureate mark is expressed out of one hundred (100) and is accurate to two decimal places.
For all the candidates who participated in the 2017 session of the European Baccalaureate, the average Final Mark amounted to 78.12.
Overall average of past five years
This year the average Final Mark ranged between 67.75 and 81.80 throughout schools:
77,3777,31
78,00
78,34
78,12
77,00
77,20
77,40
77,60
77,80
78,00
78,20
78,40
78,60
78,80
79,00
2013 2014 2015 2016 2017
67,750
76,210 77,920 79,410 80,18074,740 73,570
79,45075,580
78,360 78,090 77,690 77,49080,860 81,800 80,930
76,440 78,080 77,25079,880 79,920 78,120
0
25
50
75
100
*BRI *HEL *HER *MAN *PAR *RHM *STR ALI BER BR I BR II BR III BR IV CUL FRF KAR LUX MAM MOL MUN VAR ALL
Final mark average per school

Report on European Baccalaureate 2017
2017-10-D-01-en-4 23/61
Throughout the Language Sections the average Final Mark ranged between 74.08 and 82.54. Small number of candidates in certain sections doesn’t allow the average to be regarded as statistically significant.
Number of candidates per linguistic section
da de el en es fi fr hu it nl pl pt sv ALL
45 383 59 462 105 40 511 9 169 124 22 33 31 1993
80,14 79,43 80,29 79,47 77,95 79,7775,68
82,5478,24 77,53 76,15 74,08
79,53 78,12
0
20
40
60
80
100
da de el en es fi fr hu it nl pl pt sv ALL
Average Final Mark per linguistic section

Report on European Baccalaureate 2017
2017-10-D-01-en-4 24/61
The following table shows the distribution of Final Marks, in %, in the different schools:
*BRI *HEL *HER *MAN *PAR *RHM *STR ALI BER BR 1 BR 2 BR 3 BR 4 CUL FRF KAR LUX MAM MOL MUN VAR
90-100 0% 0% 0% 8% 8% 5% 6% 10% 2% 12% 9% 9% 8% 8% 9% 13% 6% 9% 7% 16% 17%
80-89,9 0% 43% 56% 50% 45% 22% 21% 34% 35% 34% 37% 34% 33% 52% 45% 46% 34% 34% 32% 35% 35%
70-79,9 50% 30% 33% 17% 30% 40% 43% 41% 33% 34% 39% 35% 38% 29% 42% 29% 32% 41% 39% 31% 35%
60-69,9 25% 22% 11% 25% 18% 31% 21% 15% 30% 19% 11% 19% 19% 11% 3% 13% 26% 14% 19% 15% 12%
0-59,9 25% 4% 0% 0% 0% 2% 10% 0% 0% 1% 4% 2% 2% 0% 0% 0% 2% 2% 4% 3% 1%
0%
10%
20%
30%
40%
50%
60%
70%
80%
90%
100%

Report on European Baccalaureate 2017
2017-10-D-01-en-4 25/61
Breakdown of final results throughout the past five years
4.3 The Preliminary Marks
The preliminary mark (C mark) is made up of the following: Class marks (A marks) : They will account for 20 marks out of 50 Part examination marks (B marks): They will account for 30 marks out of 50.
4.3.1 Preliminary marks and Final marks
The graph below shows differences between the Final Mark and the Preliminary Mark for all pupils who took the European Baccalaureate. A negative difference means that the Preliminary Mark is higher than the Final Mark, and vice-versa.
80.6% of the candidates got a higher Preliminary Mark as compared to their Final Mark. However in 72.3% of the cases the difference was not greater than 0.5. For 91.5% of the candidates, the difference between the Preliminary Mark and Final Mark shows deviation of +/- 0.5.
2013 2014 2015 2016 2017
90‐100 6,70% 7,20% 8,40% 9,71% 9,34%
80‐89,9 35,60% 32,90% 36,60% 36,50% 35,34%
70‐79,9 35,60% 38,10% 33,90% 34,38% 35,64%
60‐69,9 19,90% 20,10% 19,50% 17,56% 17,42%
0‐59,9 2,20% 1,70% 1,70% 1,86% 2,26%
0%
10%
20%
30%
40%
50%
60%
70%
80%
90%
100%
0,00% 0,25%
8,08%
72,29%
0,10%
19,08%
0,20% 0,00% 0,00%
Preliminary Mark is higher (80.6%) Preliminary Mark is lower (19.3%)

Report on European Baccalaureate 2017
2017-10-D-01-en-4 26/61
4.3.2 Differences between Preliminary Mark and First Correction
The marks considered in this section only concern the marks given by the teacher.
It can be observed here that the variation of marks is greater. For around 47% of the cases, the variation is +/- 0.5 and for around 73% of the cases the variation is +/- 1.
37% of the pupils receive higher marks from their teachers in the written examinations as compared to the preliminary mark.
In 1.08% of the cases, the pupil obtained the exact same mark at both Preliminary and first marks written examination.
0,01% 0% 0,10%0,76%
1,40%
3,78%
9,76%
21,41%
1,08%
24,44%
16,62%
9,44%
5,45%4,24%
1,07%0,30%0,13%0,01%
The Preliminary mark is higher than the written
exam mark (62%)
The written examination mark is higher than the Preliminary one (37%)

Report on European Baccalaureate 2017
2017-10-D-01-en-4 27/61
4.3.3 Differences between Preliminary Mark and Second Correction
It can be observed here as well that the variation of marks is large. For around 35% of the cases, the variation is +/- 0.5 and for around 60% of the cases the variation is +/- 1.
30% of the pupils receive higher marks from the second examiners in the written examinations as compared to the preliminary mark.
In 0.91% of the cases, the pupils obtained the exact same mark at both Preliminary and external examiners’ written examination marks.
0,03%0,13%0,75%
1,67%
3,86%
8,21%
15,38%
0,91%
18,66%
17,55%
13,23%
8,61%7,71%
2,53%
0,55%0,16%0,04%
Teacher gave a higher Preliminary Mark (69%)
Second examiner gave a higher mark for the written examination (30%)

Report on European Baccalaureate 2017
2017-10-D-01-en-4 28/61
4.4 The Written Correction Marks
4.4.1 Differences between First Correction and Second Correction
62.3% of candidates received a higher mark from their first corrector, the teacher.
In 4.11% of the cases, the pupils obtained the exact same marks at both teacher and external examiner’s written examination correction.
It can also said that:
In 49.58% of the cases, the pupils achieved a mark, first and second correction, with a variation of +/- 0.5.
In 78.57% of the cases, the pupils achieved a mark, first and second correction, with a variation of +/- 1.
In 92.13% of the cases, the pupils achieved a mark, first and second correction, with a variation of +/- 1.5.
155 third corrections had thus to be performed.
Written mark #3 – Written mark #1 = average of -0.76 Written mark #3 – Written mark #2 = average of +0.75
0,10% 0,23%1,55%
3,56%
9,67%
18,48%
4,11%
26,99%
19,32%
10,00%
4,77%
0,97% 0,22% 0,03%
Teacher gave a higher mark for the written examination (62.3%)
Second examiner gave a higher mark for the written examination (33.6%)

Report on European Baccalaureate 2017
2017-10-D-01-en-4 29/61
4.4.2 Third corrections Out of 9984 scripts, 155 scripts were submitted to a third correction, i.e. 1.55% of the total scripts corrected. The tables below indicate the distribution of the 155 third corrections, per school and per subject, with the detail of the language.
Evolution of third corrections – European Baccalaureate sessions 2013-2017
School3rd
corrections performed
Total scripts
% Subject Languages3rd
corrections performed
Total scripts
%
*BRI 0 20 0,00% AR4 EN 1, ES 1 2 249 0,80%*HEL 3 115 2,61% BI4 FR 4 517 0,77%*HER 3 45 6,67% CHI EN 1 464 0,22%*MAN 0 60 0,00% ECO EN 24 378 6,35%*PAR 2 200 1,00% GE4 EN 4 284 1,41%*RHM 4 405 0,99% GRE 0 4 0,00%*STR 1 340 0,29% HI4 DE 1, EN 20, FR 2 23 410 5,61%
ALI 9 340 2,65% L1- DA 1, DE 9, EL 3, ES 2, FR 32, IT 1, NL 1, SV2
51 1886 2,70%
BER 2 238 0,84% L1A 0 107 0,00%BR 1 16 1140 1,40% L2- DE 9, EN 2, FR 11 22 1834 1,20%BR 2 14 1125 1,24% L2A 0 159 0,00%BR 3 14 1224 1,14% L3- FR 1 641 0,16%BR 4 13 466 2,79% L4- DE 2 257 0,78%CUL 4 310 1,29% LAT 0 24 0,00%FRF 12 430 2,79% MA3 FR 4 1165 0,34%KAR 7 350 2,00% MA5 0 828 0,00%LUX 13 951 1,37% MU4 0 31 0,00%MAM 21 771 2,72% ONL 0 9 0,00%MOL 2 287 0,70% PH4 EN 11, FR 6 17 232 7,33%MUN 10 790 1,27% PHY 0 505 0,00%VAR 5 377 1,33% Total 155 9984 1,55%
Total 155 9984 1,55%
75
104
88
155
0
20
40
60
80
100
120
140
160
180
2014 2015 2016 2017

Report on European Baccalaureate 2017
2017-10-D-01-en-4 30/61
4.4.3 Marks disagreement A written examination script is deemed successful for the pupil if it was granted at least the minimum mark of 6 out of 10 (pass mark). Marks disagreement designates the very specific case occurring when, for a same script, one examiner considers the script as being in line with the correction criteria pass mark, whereas the other examiner judges it as insufficient and not in compliance with the pass mark criteria. When comparing the written examination marks given by the teachers / first correctors, and external examiners / second correctors, for the 9984 scripts of the EB session 2017, the following can be observed:
For 948 scripts, i.e. 9.5% of the total scripts, a mark disagreement was observed during last session. In 92 cases was the difference between the two marks higher than 2 marks. 9.7% of the 948 disputed scripts were thus submitted to a third correction.
number of scripts
%number of scripts %
Teacher gave 6 or more 8578 85,92% 128 1,49%
External Examiner gave 6 or more 8206 82,19% 78 0,95%
Teacher gave 5,99 or less 1406 14,08% 27 1,92%
External Examiner gave 5,99 or less 1778 17,81% 77 4,33%
Average W1
Average W2
Average W3
Teacher passed the script, external examiner failed the script 660 6,61% 71 10,76% 6,65 5,34 6,18
Teacher failed the script, external examiner passed the script 288 2,89% 21 7,29% 5,39 6,51 6,43
Third corrections involved (155)
Number of scripts
37
115 114
153
113129
98 97
15 19 14 169 6 7 3 1 1 0 1
Absolute value of difference between first and second correctionfor mark disagreement (948 scripts)
Report on European Baccalaureate 2017
2017-10-D-01-en-4 31/61
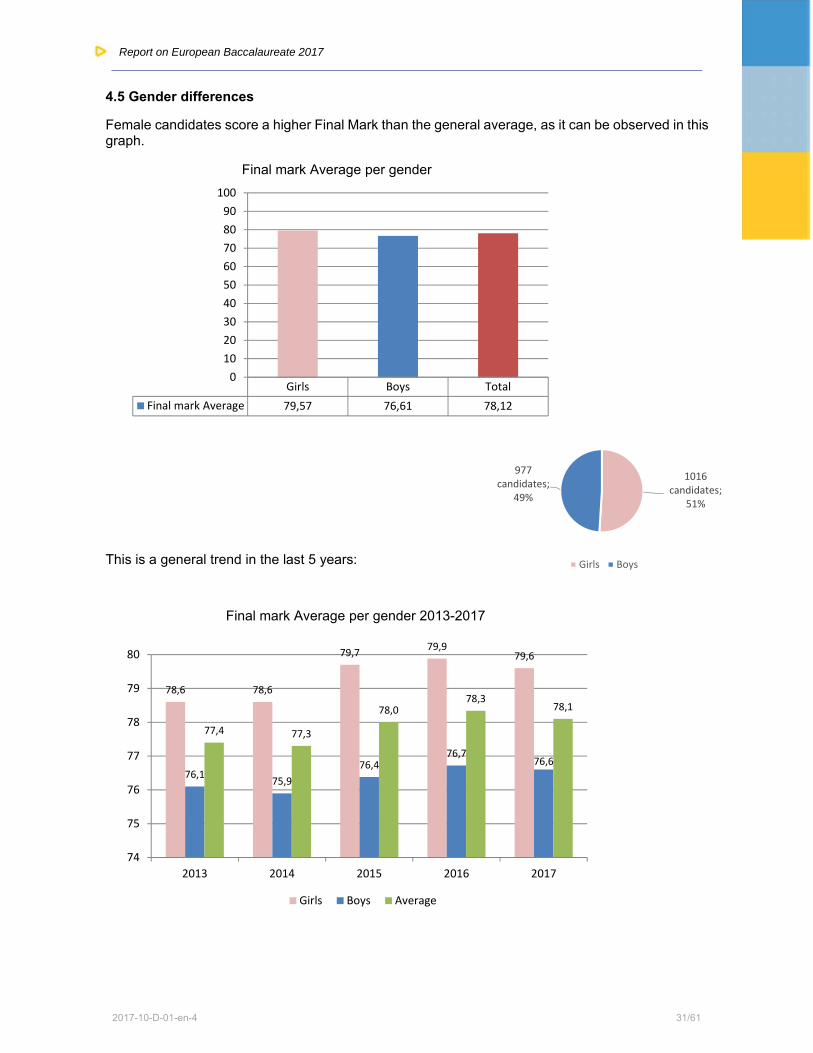
4.5 Gender differences
Female candidates score a higher Final Mark than the general average, as it can be observed in this graph.
This is a general trend in the last 5 years:
Girls Boys Total
Final mark Average 79,57 76,61 78,12
0
10
20
30
40
50
60
70
80
90
100
Final mark Average per gender
1016candidates;
51%
977candidates;
49%
Girls Boys
78,6 78,6
79,779,9
79,6
76,175,9
76,476,7
76,6
77,4 77,3
78,078,3
78,1
74
75
76
77
78
79
80
2013 2014 2015 2016 2017
Final mark Average per gender 2013-2017
Girls Boys Average

Report on European Baccalaureate 2017
2017-10-D-01-en-4 32/61
Here below, the choices of options and written average, per gender:
BI4 CHI ECO MA5 PHY
Subject Gender Number of candidates
Written Average
Percentage
Biology 4P Boys 190 6,78 36,89%Girls 325 7,00 63,11%ALL 515 6,92
Chemistry Boys 224 7,04 49,34%Girls 230 7,37 50,66%ALL 454 7,21
Economics Boys 250 7,06 66,14%Girls 128 7,29 33,86%ALL 378 7,14
MA5 Boys 461 7,12 55,68%Girls 367 7,11 44,32%
828 7,11
Physics Boys 346 7,31 69,48%Girls 152 7,79 30,52%ALL 498 7,45
36,89%
63,11%
49,34%50,66%
66,14%
33,86%
55,68%
44,32%
69,48%
30,52%
0%
10%
20%
30%
40%
50%
60%
70%
80%
90%
100%
Boys(190)
Girls(325)
Boys(224)
Girls(230)
Boys(250)
Girls(128)
Boys(461)
Girls(367)
Boys(346)
Girls(152)

Report on European Baccalaureate 2017
2017-10-D-01-en-4 33/61
Art Geo4 His4 L1a L2a L3 L4 Mus Philo4
Subject Gender Number of candidates
Written Average
Percentage
ART Boys (73) 73 8,31 29,32%Girls (176) 176 8,45 70,68%
249 8,41
Geography 4P Boys (145) 145 6,67 51,06%Girls (139) 139 6,85 48,94%
284 6,76
History 4P Boys (195) 195 7,11 47,56%Girls (215) 215 7,44 52,44%
410 7,28
L1 Adv Boys (28) 28 7,76 26,17%Girls (79) 79 7,93 73,83%
107 7,88
L2 Adv Boys (45) 45 7,95 28,30%Girls (114) 114 8,14 71,70%
159 8,09
L3- Boys (301) 301 8,13 46,96%Girls (340) 340 8,21 53,04%
641 8,17
L4- Boys (100) 100 8,07 38,91%Girls (157) 157 8,47 61,09%
257 8,32
MU4 Boys (20) 20 7,37 64,52%Girls (11) 11 7,98 35,48%
31 7,59
Philo 4P Boys (95) 95 7,86 40,95%Girls (137) 137 7,87 59,05%
232 7,86

Report on European Baccalaureate 2017
2017-10-D-01-en-4 34/61
4.6 European Baccalaureate examinations and most popular written and oral examination options
Compulsory Written examinations – 1993 candidates
Option written examinations – 4005 scripts (1993 x 2 options = 3986 + 19 add. exams)
Oral examinations – 5979 orals (1993 x 3 = 5979 oral examinations)
L1- 1993 candidates L2- 1993 candidates
Adv 107 159
Basic course 1886 1834
1886
1834
107
159
88%
90%
92%
94%
96%
98%
100%
1165
828
0%
10%
20%
30%
40%
50%
60%
70%
80%
90%
100%
Maths:1993 candidates
MA3 MA5
249
517
464
378
284
4
410
641
257
24 319
232
505
0
100
200
300
400
500
600
700
AR4 BI4 CHI ECO GE4 GRE HI4 L3‐ L4‐ LAT MU4 ONL PH4 PHY
359
11148
330
72
256
36
1886
107
1164
137220
50
158
3
870
145
27
0
200
400
600
800
1000
1200
1400
1600
1800
2000
BI2 BI4 CHI GE2 GE4 HI2 HI4 L1- L1A L2- L2A L3- L4- MAA ONL PH2 PH4 PHY

Report on European Baccalaureate 2017
2017-10-D-01-en-4 35/61
4.6.1 Most popular written choices
The five most chosen options for the written examinations this year were: Language III (English LIII being the most popular choice: 242 candidates), Biology, Physics, Chemistry and History 4P.
Options of written examinations
Number of candidates BAC 2015
Percentage of candidates BAC 2015
Number of candidates BAC 2016
Percentage of candidates BAC 2016
Number of candidates BAC 2017
Percentage of candidates BAC 2017
LANGUAGE III 593 32.96% 636 33.74% 641 32.15%
BIOLOGY 4 512 28.46% 469 24.88% 517 25.93%
PHYSICS 494 27.46% 502 26.63% 505 25.33%
CHEMISTRY 453 25.18% 471 24.99% 464 23.27%
HISTORY 364 20.23% 312 16.55% 410 20.56%
Among less popular written examinations, there is Art and Music.
Nevertheless, the number of written examinations in Musical education is slowly growing throughout the years.
Art and Music Education candidates are in progress, as can be seen in the graph on the right.
0,52% 0,51%
1,54%1,19% 1,22% 1,34% 1,21%
1,96% 1,89%
1,49% 1,55%
0,00%
0,50%
1,00%
1,50%
2,00%
2,50%
2007 2008 2009 2010 2011 2012 2013 2014 2015 2016 2017
MU4 written
195 217175
214249
19 35 34 28 31
0
100
200
300
2013 2014 2015 2016 2017
Art and Music : number of candidates 2013-2017
Art Music

Report on European Baccalaureate 2017
2017-10-D-01-en-4 36/61
The averages in these disciplines are generally increasing. They tend to show that pupils choose the subjects out of passion, talent and competence, not just by mere curiosity or simple need to complete their schedule.
General average in Art at the 2017 European Baccalaureate, per school: 8.41.
7,80
9,60
8,50
7,99
8,03
8,72
8,58
8,42
8,53
8,56
8,11
8,62
8,06
8,14
8,26
8,51
8,93
8,34
8,54
8,41
7,00 7,50 8,00 8,50 9,00 9,50 10,00
*HEL
*MAN
*PAR
*RHM
*STR
ALI
BER
BR 1
BR 2
BR 3
BR 4
CUL
FRF
KAR
LUX
MAM
MOL
MUN
VAR
average
8,148,01
8,23 8,218,41
7,827,70
7,55
7,847,59
7,00
7,50
8,00
8,50
2013 2014 2015 2016 2017
Art and Music: evolution of the written average
Art Music

Report on European Baccalaureate 2017
2017-10-D-01-en-4 37/61
General average in Music at the 2017 European Baccalaureate, per school: 7.59.
Only 4 candidates took both Art and Music examination. 2 girls and 2 boys: 1 from ES BR 3, 1 from ES CUL and 2 from ES LUX 2- MAM.
8,20
6,96
7,89
7,31
9,28
8,58
7,70
6,82
7,57
7,59
6,00 6,50 7,00 7,50 8,00 8,50 9,00 9,50 10,00
*HER
*RHM
BR 2
BR 3
BR 4
CUL
FRF
LUX
MAM
average
7,85
6,28
8,05
9,389,75
7,49
9,35
6,83
8,23
6,41
8,73 8,85
8,33
9,09
7,95
5,00
5,50
6,00
6,50
7,00
7,50
8,00
8,50
9,00
9,50
10,00
Cand. 1 art Cand. 1music
Cand. 2 art Cand. 2music
Cand. 3 art Cand. 3music
Cand. 4 art Cand. 4music
Pupils having choosen both Art and Music
Written average Final mark
Report on European Baccalaureate 2017
2017-10-D-01-en-4 38/61
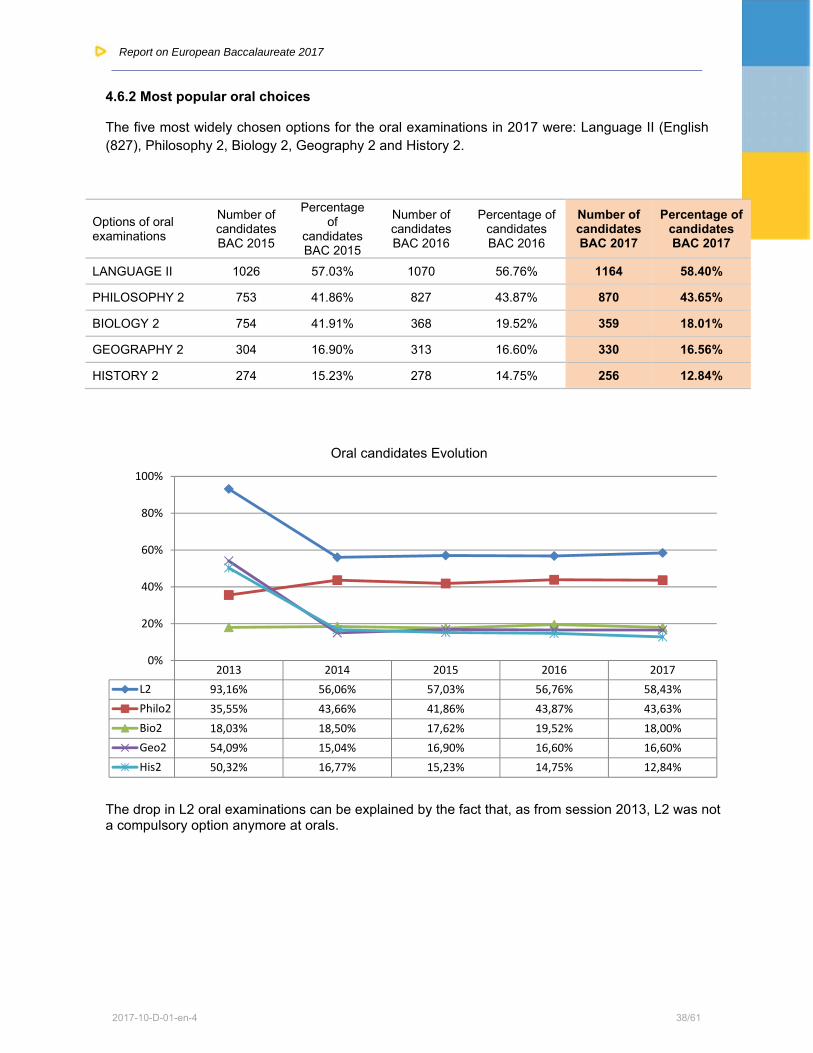
4.6.2 Most popular oral choices
The five most widely chosen options for the oral examinations in 2017 were: Language II (English (827), Philosophy 2, Biology 2, Geography 2 and History 2.
Options of oral examinations
Number of candidates BAC 2015
Percentage of
candidates BAC 2015
Number of candidates BAC 2016
Percentage of candidates BAC 2016
Number of candidates BAC 2017
Percentage of candidates BAC 2017
LANGUAGE II 1026 57.03% 1070 56.76% 1164 58.40%
PHILOSOPHY 2 753 41.86% 827 43.87% 870 43.65%
BIOLOGY 2 754 41.91% 368 19.52% 359 18.01%
GEOGRAPHY 2 304 16.90% 313 16.60% 330 16.56%
HISTORY 2 274 15.23% 278 14.75% 256 12.84%
The drop in L2 oral examinations can be explained by the fact that, as from session 2013, L2 was not a compulsory option anymore at orals.
2013 2014 2015 2016 2017
L2 93,16% 56,06% 57,03% 56,76% 58,43%
Philo2 35,55% 43,66% 41,86% 43,87% 43,63%
Bio2 18,03% 18,50% 17,62% 19,52% 18,00%
Geo2 54,09% 15,04% 16,90% 16,60% 16,60%
His2 50,32% 16,77% 15,23% 14,75% 12,84%
0%
20%
40%
60%
80%
100%
Oral candidates Evolution

Report on European Baccalaureate 2017
2017-10-D-01-en-4 39/61
4.6.3 Combination L3 - Sciences
641 candidates took a written examination in Language III. Out of these, 275 combined this examination with an examination in one scientific subject. Only 1 pupil combined L3 with 2 scientific subjects (Chemistry and Physics). In this graph we can see a frequency of combination:
The graph shows that candidates with language orientation are also interested in mastering sciences in line with European key competences for lifelong learning.
4.7 Students Without A Language Section (SWALS)
This year, 167 Students Without A Language Section registered for the European Baccalaureate session.
The average Final Mark achieved by SWALS candidates this year came up to 8. 1 SWALS candidate failed.
641
87
31
83 74
0
100
200
300
400
500
600
700
L3 BIO4 CHEM ECO PHYS
Frequency of combination L3 - Scientific subject
6
3 3
6
2
6
20
10
20
1516
5
11 11
2
23
8
0
5
10
15
20
25
*HEL
*PAR
*RHM ALI
BER
BR 1
BR 2
BR 3
BR 4
CUL
FRF
KAR
LUX
MAM
MOL
MUN VA
Number of Students without a language section

Report on European Baccalaureate 2017
2017-10-D-01-en-4 40/61
In the following graph are shown their performance in Languages II, IIadv, III and IV. It can be observed that their performance is higher than the average, except in LIV.
Here are some results of the SWALS pupils in comparison with the other pupils and the general average. Results where SWALS averages are higher than the others, are highlighted.
AR4 GE4 GRE HI4 LAT MU4 PH4
SWALS 8.40 6.95 8.90 7.27 8.38 7.87 8.15
Others 8.41 6.74 8.50 7.28 7.72 7.56 7.85
All 8.41 6.76 8.60 7.28 7.77 7.59 7.86
BI4 CHI ECO MA3 MA5 PHY SWALS 6.91 7.44 7.40 6.51 7.27 7.25 Others 6.92 7.15 7.10 6.29 7.10 7.46 All 6.92 7.18 7.14 6.31 7.12 7.44
L2‐ L2A L3‐ L4‐
SWALS 8,29 8,53 8,27 7,84
Other 7,72 8,03 8,17 8,34
ALL 7,76 8,09 8,17 8,32
7,20
7,40
7,60
7,80
8,00
8,20
8,40
8,60
SWALS: Final written examination mark in Languages

Report on European Baccalaureate 2017
2017-10-D-01-en-4 41/61
5. Results about the Sciences: Biology, Chemistry, Economic Sciences, Mathematics 3P, Mathematics 5P and Physics
5.1 Final Marks for Science Classes (Final Mark per subject: 0.50 C + 0.35 W + 0.15 O)
The evolution of the average Final Mark (Marks C + W + O) for the science classes as set out in the graph shows substantial stability over the years.
(Economics data not complete for some past years)
5.2 Comparison of Final Marks / Written Marks of Scientific Courses
The graphs below show that the results in the Biology, Chemistry, Maths 3P, Maths 5P and Physics final marks do not differ much from the final written EB mark. However, the number of failures in these subjects is still considerable.
BI4 CHI ECO MA3 MA5 PHY
Final Notes 7,60 7,65 7,65 6,71 7,51 7,74
Written average 6,92 7,18 7,33 6,31 7,12 7,44
7,60 7,65 7,65
6,71
7,517,74
6,927,18
7,33
6,31
7,127,44
5,00
5,50
6,00
6,50
7,00
7,50
8,00
8,50
9,00
9,50
10,00

Report on European Baccalaureate 2017
2017-10-D-01-en-4 42/61
5.2.1 Biology Final Mark (gen average. 7.60) Detailed results, per school:
Comparison of Frequency of Marks between Biology Written Exam and Biology Final Mark
*BRI *HEL *HER *MAN *PAR *RHM *STR ALI BER BR 1 BR 2 BR 3 BR 4 CUL FRF KAR LUX MAM MOL MUN VAR
Final Notes 4,90 8,12 6,64 6,69 7,28 7,51 7,04 7,42 7,55 7,48 7,81 7,51 7,28 7,49 8,47 8,31 7,84 7,27 7,80 7,52 8,12
Written average 3,40 6,94 5,63 5,74 6,98 5,79 5,33 6,30 6,73 7,20 7,17 6,94 6,51 6,66 7,73 6,87 7,65 6,59 7,46 6,98 7,35
0,00
1,00
2,00
3,00
4,00
5,00
6,00
7,00
8,00
9,00
Biology: Difference average Final mark - Written mark
1 1 1
710
16
3129
42
59
46
6669
5658
20
5
0 0 0
2 15
14
20
27
39
55
71 72
81
6056
13
0
10
20
30
40
50
60
70
80
90
2,00 2,50 3,00 3,50 4,00 4,50 5,00 5,50 6,00 6,50 7,00 7,50 8,00 8,50 9,00 9,50 10,00
Written average Final Notes

Report on European Baccalaureate 2017
2017-10-D-01-en-4 43/61
5.2.2 Chemistry Final Mark (gen. average. 7.65) Detailed results, per school:
Comparison of Frequency of Marks between Chemistry Written Exam and Chemistry Final Mark
*BRI *HEL *HER*MAN
*PAR *RHM *STR ALI BER BR 1 BR 2 BR 3 BR 4 CUL FRF KAR LUX MAM MOL MUN VAR
Final Notes 3,71 7,05 5,53 7,85 8,12 6,34 6,38 8,21 8,03 7,65 7,94 7,74 7,63 8,01 8,42 7,40 7,37 8,00 7,74 7,63 8,04
Written average 1,95 5,27 3,37 7,08 7,28 5,80 5,93 7,49 6,47 7,43 7,43 7,53 7,04 7,44 8,14 6,99 7,13 7,68 7,33 7,08 7,48
0,00
1,00
2,00
3,00
4,00
5,00
6,00
7,00
8,00
9,00
Chemistry: Difference average Final mark - Written mark
20
52
5
9 912
1821
29
43
38
40
44
5855
50
24
2 2 3 4
96
16
29
34
39
50 50
6264
66
28
0
10
20
30
40
50
60
70
Written average
Final Notes

Report on European Baccalaureate 2017
2017-10-D-01-en-4 44/61
5.2.3 Economics Final Mark (gen. average 7.65) Detailed results, per school:
Comparison of Frequency of Marks between Economics Written Exam and Chemistry Final Mark
*BRI *HEL *HER *MAN *PAR *RHM *STR ALI BER BR 1 BR 2 BR 3 BR 4 CUL FRF KAR LUX MAM MOL MUN VAR
Final Notes 7,71 6,97 8,04 7,38 8,23 7,49 7,96 6,54 7,44 7,76 7,09 8,07 8,28 8,07 8,13 7,50 7,97 7,37 7,58 7,65
Written average 6,50 7,15 6,90 6,74 7,63 6,69 7,32 6,14 7,01 7,39 6,82 7,16 7,94 7,54 7,77 6,85 7,32 6,10 7,35 7,33
4,00
5,00
6,00
7,00
8,00
9,00
10,00
Economics: Difference average Final mark - Written mark
0 0 0 0 1 2 2
6 5
1517
30 39
44
50
59
43
39
20
6
0 0 02 1
5 5
9
18
27
36
56
43
70
57
38
11
0
10
20
30
40
50
60
70
80
0,50 1,50 2,50 3,50 4,50 5,50 6,50 7,50 8,50 9,50Written average

Report on European Baccalaureate 2017
2017-10-D-01-en-4 45/61
5.2.4 Maths 3P Final Mark (gen. average. 6.71) Detailed results, per school:
Comparison of Frequency of Marks between Mathematics 3P Written Exam and Mathematics 3P Final Mark
*BRI *HEL *HER *MAN *PAR *RHM *STR ALI BER BR 1 BR 2 BR 3 BR 4 CUL FRF KAR LUX MAM MOL MUN VAR
Final Notes 5,45 6,70 7,25 6,90 7,48 6,70 6,06 6,95 6,67 6,73 6,28 6,30 6,01 7,25 7,87 7,13 6,77 6,94 6,36 6,93 6,65
Written average 4,64 5,44 5,76 6,19 7,38 6,12 5,05 6,04 6,15 6,31 5,67 6,46 5,25 7,17 7,50 6,87 6,31 6,42 5,52 7,01 6,18
0,00
1,00
2,00
3,00
4,00
5,00
6,00
7,00
8,00
9,00
Maths 3P: Difference average Final mark - Written mark
47
10
2327
32 32
44 4654
73
94
114119
110 112106
83
62
1 1 2 10 12
2227
32
47
56
63
83
103
122
134 134
139
87
77
130
10
20
30
40
50
60
70
80
90
100
110
120
130
140
150
Written average Final Notes
Report on European Baccalaureate 2017
2017-10-D-01-en-4 46/61
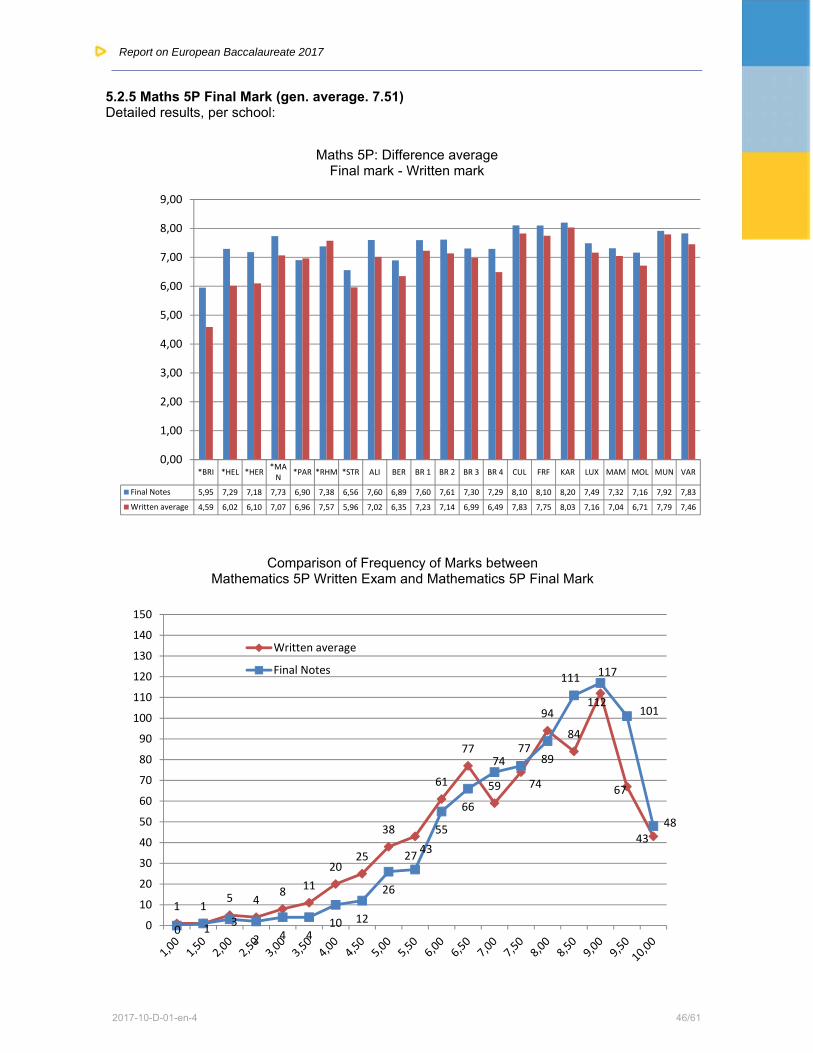
5.2.5 Maths 5P Final Mark (gen. average. 7.51) Detailed results, per school:
Comparison of Frequency of Marks between Mathematics 5P Written Exam and Mathematics 5P Final Mark
*BRI *HEL *HER*MAN
*PAR *RHM *STR ALI BER BR 1 BR 2 BR 3 BR 4 CUL FRF KAR LUX MAM MOL MUN VAR
Final Notes 5,95 7,29 7,18 7,73 6,90 7,38 6,56 7,60 6,89 7,60 7,61 7,30 7,29 8,10 8,10 8,20 7,49 7,32 7,16 7,92 7,83
Written average 4,59 6,02 6,10 7,07 6,96 7,57 5,96 7,02 6,35 7,23 7,14 6,99 6,49 7,83 7,75 8,03 7,16 7,04 6,71 7,79 7,46
0,00
1,00
2,00
3,00
4,00
5,00
6,00
7,00
8,00
9,00
Maths 5P: Difference average Final mark - Written mark
1 15 4
8 11
2025
38
43
61
77
59 74
94
84
112
67
43
0 13
2 4 410 12
26
27
55
66
7477
89
111 117
101
48
0
10
20
30
40
50
60
70
80
90
100
110
120
130
140
150
Written average
Final Notes

Report on European Baccalaureate 2017
2017-10-D-01-en-4 47/61
5.2.6 Physics Final Mark (gen. average. 7.74) Detailed results, per school:
Comparison of Frequency of Marks between
Physics Written Exam and Physics Final Mark
*BRI *HEL *HER *MAN *PAR *RHM *STR ALI BER BR 1 BR 2 BR 3 BR 4 CUL FRF KAR LUX MAM MOL MUN VAR
Final Notes 4,88 7,60 7,61 8,15 7,82 6,74 7,12 8,42 6,90 7,45 7,72 8,20 7,33 8,26 8,53 7,87 7,33 7,89 7,36 8,13 8,36
Written average 3,70 6,19 6,65 8,05 7,71 6,65 6,84 7,62 5,95 7,61 7,27 7,86 6,97 8,27 8,04 7,47 7,08 7,62 6,89 8,07 8,11
0,00
1,00
2,00
3,00
4,00
5,00
6,00
7,00
8,00
9,00
Physics: Difference average Final mark - Written mark
14
14
58
5
1714
10
16
25
26
3139
58
76 74
50
0 0 1
1
15
8
9 12
14
7
18
35
21
40
51
66
88
74
53
0
10
20
30
40
50
60
70
80
90
100
Written average
Final Notes

Report on European Baccalaureate 2017
2017-10-D-01-en-4 48/61
5.3 EB Sciences Written Examination Marks Results
The distribution graph on the left indicates that for all sciences
subjects considered, 1 script out of 4 did not obtain the pass mark.
The table on the right shows the detail among the sciences subjects distribution of written examination marks.
Ma3 is the subject with the highest failure rate with a percentage of 37.60 of pupils not reaching the pass mark of 6.
Whereas Physics shows the highest success rate with a percentage of 25.54, of pupils reaching a final written examination mark between 9 and 10.
Biology Chemistry Economics MA3 MA5 Physics
90‐100 5,22% 16,38% 6,88% 6,70% 14,75% 25,54%
80‐89,9 22,82% 24,78% 21,69% 16,22% 22,49% 25,94%
70‐79,9 25,34% 17,46% 28,84% 19,14% 20,56% 15,84%
60‐69,9 21,28% 17,46% 22,22% 20,34% 16,44% 10,89%
0‐59,9 25,34% 23,92% 20,37% 37,60% 25,76% 21,78%
Distribution written marks 2017Biology - Chemistry - Economics - MA3 - MA5 - Physics
Distribution All Sciences Written marks
90‐100 12,58%
80‐89,9 22,32%
70‐79,9 21,20%
60‐69,9 18,10%
0‐59,9 25,80%
25,80%
18,10%
21,20%
22,32%
12,58%
0%
10%
20%
30%
40%
50%
60%
70%
80%
90%
100%
Distribution of all 2017 written sciences marks

Report on European Baccalaureate 2017
2017-10-D-01-en-4 49/61
5.3.1 Biology (Success rate: 74.66%)
School year *BRI *HEL *HER *MAN *PAR *RHM *STR ALI BER BR 1 BR 2 BR 3 BR 4 CUL FRF KAR LUX MAM MOL MUN VAR Aver.
2012/2013 4,82 8,20 6,58 7,06 6,65 7,59 7,16 7,45 8,20 7,41 6,94 7,14 6,71 6,53 7,24 7,39 7,19
2013/2014 6,25 8,40 7,47 6,67 7,66 6,03 7,41 7,24 7,39 7,41 7,43 7,50 7,17 6,98 7,58 7,48 7,16 7,27
2014/2015 5,58 7,30 6,41 5,99 6,77 6,65 7,50 7,01 7,15 7,40 6,88 7,66 7,08 6,97 6,94 6,69 7,57 7,04
2015/2016 6,00 7,48 7,33 4,78 6,14 6,69 6,43 7,23 6,53 7,13 7,25 7,60 6,57 6,80 7,33 7,50 7,01 7,84 6,97
2016/2017 3,40 6,94 5,63 5,74 6,98 5,79 5,33 6,30 6,73 7,20 7,17 6,94 6,51 6,66 7,73 6,87 7,65 6,59 7,46 6,98 7,35 6,92
7,73 7,65 7,46 7,35 7,20 7,17 6,98 6,98 6,94 6,94 6,92 6,87 6,73 6,66 6,59 6,51 6,305,79 5,74 5,63
5,33
3,40
0
1
2
3
4
5
6
7
8
9
10
FRF (25)
LUX (34)
MOL (18)
VAR (16)
BR 1 (61)
BR 2 (46)
MUN (63)
*PAR (13)
BR 3 (73)
*HEL (3)
Average (517)
KAR (8)
BER
(24)
CUL (20)
MAM (40)
BR 4 (22)
ALI (14)
*RHM (13)
*MAN (3)
*HER
(3)
*STR
(16)
*BRI (2)
Biology written average (6.92)
ALI BER *BRI BR 1 BR 2 BR 2 BR 4 CUL FRF *HEL *HER KAR LUX MAM *MAN MOL MUN *PAR *RHM *STR VARaverag
e
Written 1 6,53 6,86 3,90 7,32 7,51 7,02 6,43 6,75 8,14 7,10 6,03 6,90 8,07 6,61 6,32 7,46 7,17 6,85 6,10 5,54 7,44 7,08
Written 2 6,05 6,59 2,90 7,07 6,82 6,85 6,59 6,57 7,33 6,77 5,23 6,84 7,22 6,55 5,17 7,46 6,78 7,10 5,48 5,12 7,24 6,75
2,002,503,003,504,004,505,005,506,006,507,007,508,008,50
Biology : comparison W1 W2

Report on European Baccalaureate 2017
2017-10-D-01-en-4 50/61
*BRI *HEL *HER *MAN *PAR *RHM *STR ALI BER BR 1 BR 2 BR 3 BR 4 CUL FRF KAR LUX MAM MOL MUN VAR Total
0-59,9 0,39% 0,19% 0,39% 0,19% 0,77% 1,16% 2,51% 0,97% 1,55% 2,51% 1,74% 3,48% 1,35% 0,77% 0,97% 0,58% 0,58% 2,32% 0,39% 2,32% 0,19% 25,34
60-69,9 0,00% 0,00% 0,00% 0,19% 0,58% 0,77% 0,58% 0,77% 0,58% 1,55% 1,55% 2,51% 1,35% 1,74% 0,19% 0,19% 0,97% 2,51% 1,16% 3,09% 0,97% 21,28
70-79,9 0,00% 0,19% 0,19% 0,19% 0,39% 0,39% 0,00% 0,39% 1,74% 4,06% 2,90% 3,87% 0,58% 0,58% 1,35% 0,39% 2,13% 0,97% 0,58% 3,48% 0,97% 25,34
80-89,9 0,00% 0,19% 0,00% 0,00% 0,58% 0,19% 0,00% 0,58% 0,58% 2,90% 2,32% 3,87% 0,97% 0,77% 1,74% 0,19% 2,71% 1,74% 0,77% 1,93% 0,77% 22,82
90-100 0,00% 0,00% 0,00% 0,00% 0,19% 0,00% 0,00% 0,00% 0,19% 0,77% 0,39% 0,39% 0,00% 0,00% 0,58% 0,19% 0,19% 0,19% 0,58% 1,35% 0,19% 5,22%
0%
10%
20%
30%
40%
50%
60%
70%
80%
90%
100%
Distribution Biology 2017

Report on European Baccalaureate 2017
2017-10-D-01-en-4 51/61
5.3.2 Chemistry (Success rate: 76.08%)
School year
*BRI *HEL *HER *MAN *PAR *RHM *STR ALI BER BR 1 BR 2 BR 3 BR 4 CUL FRF KAR LUX MAM MOL MUN VAR Aver.
2012/2013 6,93 8,20 7,14 6,19 6,39 6,97 7,75 7,86 7,77 8,95 8,49 7,45 6,87 7,56 7,65 6,03 7,45
2013/2014 8,08 6,90 7,58 7,46 7,02 5,49 7,27 6,69 7,21 7,40 7,36 6,50 7,12 6,07 6,24 7,44 8,60 6,95
2014/2015 5,35 7,15 7,19 7,28 5,85 6,93 4,54 7,86 6,69 7,04 8,02 7,87 7,39 7,54 7,75 7,41 7,44 7,81 7,24
2015/2016 5,02 6,72 7,40 8,57 5,88 6,20 6,85 4,46 7,66 6,39 7,54 8,01 7,14 6,44 7,97 7,97 7,19 6,99 7,54 7,12
2016/2017 1,95 5,27 3,37 7,08 7,28 5,80 5,93 7,49 6,47 7,43 7,43 7,53 7,04 7,44 8,14 6,99 7,13 7,68 7,33 7,08 7,48 7,18
8,14
7,68
7,53
7,49
7,48
7,44
7,43
7,43
7,33
7,28
7,18
7,13
7,08
7,08
7,04
6,99
6,47
5,93
5,80
5,27
3,37
1,95
0
1
2
3
4
5
6
7
8
9
10
FRF (16)
MAM (25)
BR 3 (64)
ALI (14)
VAR (17)
CUL (18)
BR 1 (50)
BR 2 (48)
MOL (30)
*PAR (3)
Average (464)
LUX (44)
*MAN (4)
MUN (39)
BR 4 (23)
KAR (11)
BER
(11)
*STR
(26)
*RHM (10)
*HEL (7)
*HER
(3)
*BRI (1)
Chemistry written average (7.18)
*BRI *HEL *HER *MAN *PAR *RHM *STR ALI BER BR 1 BR 2 BR 3 BR 4 CUL FRF KAR LUX MAM MOL MUN VAR Av.
Written 1 2,40 6,03 3,60 7,35 7,43 6,08 6,08 7,88 6,68 7,49 7,66 7,67 7,22 7,52 8,17 7,20 7,30 7,85 7,60 7,19 7,49 7,34
Written 2 1,50 4,67 3,13 6,81 7,12 5,51 5,78 7,09 6,26 7,37 7,20 7,38 6,84 7,35 8,11 6,78 6,97 7,51 7,05 6,96 7,47 7,00
1,00
1,50
2,00
2,50
3,00
3,50
4,00
4,50
5,00
5,50
6,00
6,50
7,00
7,50
8,00
8,50
9,00
9,50
10,00
Chemistry : comparison W1 W2

Report on European Baccalaureate 2017
2017-10-D-01-en-4 52/61
*BRI *HEL *HER *MAN *PAR *RHM *STR ALI BER BR 1 BR 2 BR 3 BR 4 CUL FRF KAR LUX MAM MOL MUN VAR Total
0-59,9 0,22% 0,86% 0,65% 0,43% 0,22% 0,86% 2,80% 2,59% 0,43% 1,08% 1,51% 2,37% 1,08% 0,65% 0,00% 0,65% 2,80% 0,65% 1,51% 2,16% 0,43% 23,92
60-69,9 0,00% 0,43% 0,00% 0,00% 0,00% 0,86% 0,65% 1,51% 0,65% 0,00% 3,02% 1,94% 1,29% 0,22% 0,43% 0,43% 1,94% 1,08% 1,08% 1,29% 0,65% 17,46
70-79,9 0,00% 0,22% 0,00% 0,00% 0,22% 0,22% 1,08% 0,86% 0,43% 0,22% 1,51% 3,02% 1,29% 1,72% 0,65% 0,43% 0,86% 0,86% 1,72% 0,86% 1,29% 17,46
80-89,9 0,00% 0,00% 0,00% 0,22% 0,22% 0,22% 0,65% 2,59% 0,86% 0,65% 2,59% 4,09% 1,08% 1,08% 1,94% 0,65% 1,94% 1,29% 0,86% 2,80% 1,08% 24,78
90-100 0,00% 0,00% 0,00% 0,22% 0,00% 0,00% 0,43% 3,23% 0,65% 0,43% 1,72% 2,37% 0,22% 0,22% 0,43% 0,22% 1,94% 1,51% 1,29% 1,29% 0,22% 16,38
0%
10%
20%
30%
40%
50%
60%
70%
80%
90%
100%
Chemistry : distribution of written marks

Report on European Baccalaureate 2017
2017-10-D-01-en-4 53/61
5.3.3 Economics (Success rate: 79,63%)
School year
*BRI *HEL *HER *MAN *PAR *RHM *STR ALI BER BR 1 BR 2 BR 3 BR 4 CUL FRF KAR LUX MAM MOL MUN VAR Aver.
2012/2013 6,64 7,88 6,76 7,04 7,23 7,09 8,28 7,76 6,94 7,67 6,85 6,84 7,78 7,63 7,30
2013/2014 5,64 7,84 7,61 5,87 5,60 7,56 6,86 7,19 7,12 7,70 6,37 7,17 6,37 7,01 7,10 6,33 6,94
2014/2015 6,77 6,91 8,08 6,27 7,06 7,11 7,32 6,95 7,82 7,74 6,55 6,63 6,84 6,10 7,24 7,13 7,01
2015/2016 7,60 7,88 6,95 7,33 6,46 7,11 6,88 6,91 7,84 8,68 7,35 6,82 7,15 6,52 6,47 7,75 7,20
2016/2017 6,50 7,15 6,90 6,74 7,63 6,69 7,32 6,14 7,01 7,39 6,82 7,16 7,94 7,54 7,77 6,85 7,32 6,10 7,35 7,33 7,14
7,94
7,77
7,63
7,54
7,39
7,35
7,33
7,32
7,32
7,16
7,15
7,14
7,01
6,90
6,85
6,82
6,74
6,69
6,50
6,14
6,10
0
1
2
3
4
5
6
7
8
9
10
CUL (11)
KAR (14)
*RHM (28)
FRF (19)
BR 2 (36)
MUN (28)
VAR (19)
ALI (7)
MAM (27)
BR 4 (27)
*HEL (3)
average (378)
BR 1 (27)
*HER
(2)
LUX (41)
BR 3 (49)
*PAR (5)
*STR
(6)
*BRI (1)
BER
(13)
MOL (15)
Economics written average (7.14)
*BRI *HEL *HER *PAR *RHM *STR ALI BER BR 1 BR 2 BR 3 BR 4 CUL FRF KAR LUX MAM MOL MUN VAR Av.
Written 1 7,50 6,61 7,80 6,51 7,74 6,90 7,25 6,09 7,03 7,35 6,66 7,56 7,32 8,24 7,93 7,38 7,70 6,34 6,73 7,18 7,21
Written 2 5,50 7,70 6,00 6,97 7,52 6,47 7,49 6,19 7,03 7,41 6,90 6,74 8,57 6,67 7,60 6,22 6,98 5,85 7,88 7,41 7,02
5,00
5,50
6,00
6,50
7,00
7,50
8,00
8,50
9,00
9,50
10,00
Economics: comparison W1 W2
Report on European Baccalaureate 2017
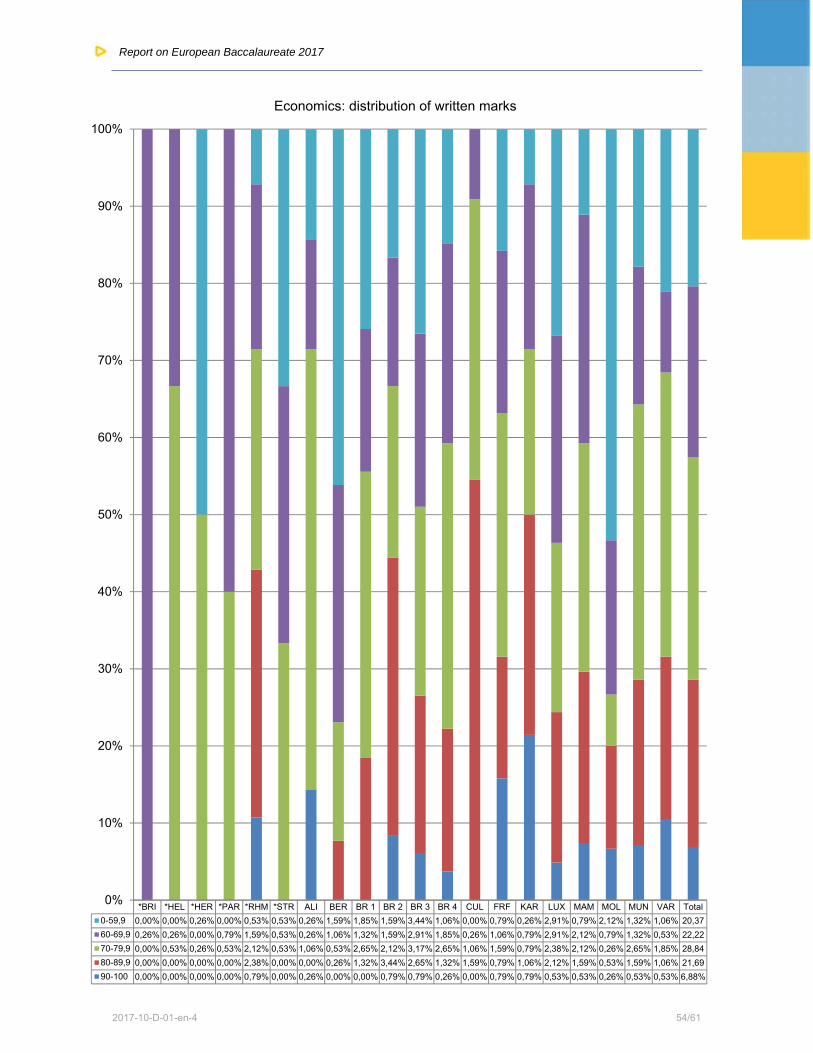
2017-10-D-01-en-4 54/61
*BRI *HEL *HER *PAR *RHM *STR ALI BER BR 1 BR 2 BR 3 BR 4 CUL FRF KAR LUX MAM MOL MUN VAR Total
0-59,9 0,00% 0,00% 0,26% 0,00% 0,53% 0,53% 0,26% 1,59% 1,85% 1,59% 3,44% 1,06% 0,00% 0,79% 0,26% 2,91% 0,79% 2,12% 1,32% 1,06% 20,37
60-69,9 0,26% 0,26% 0,00% 0,79% 1,59% 0,53% 0,26% 1,06% 1,32% 1,59% 2,91% 1,85% 0,26% 1,06% 0,79% 2,91% 2,12% 0,79% 1,32% 0,53% 22,22
70-79,9 0,00% 0,53% 0,26% 0,53% 2,12% 0,53% 1,06% 0,53% 2,65% 2,12% 3,17% 2,65% 1,06% 1,59% 0,79% 2,38% 2,12% 0,26% 2,65% 1,85% 28,84
80-89,9 0,00% 0,00% 0,00% 0,00% 2,38% 0,00% 0,00% 0,26% 1,32% 3,44% 2,65% 1,32% 1,59% 0,79% 1,06% 2,12% 1,59% 0,53% 1,59% 1,06% 21,69
90-100 0,00% 0,00% 0,00% 0,00% 0,79% 0,00% 0,26% 0,00% 0,00% 0,79% 0,79% 0,26% 0,00% 0,79% 0,79% 0,53% 0,53% 0,26% 0,53% 0,53% 6,88%
0%
10%
20%
30%
40%
50%
60%
70%
80%
90%
100%
Economics: distribution of written marks

Report on European Baccalaureate 2017
2017-10-D-01-en-4 55/61
5.3.4 Mathematics 3P (Success rate: 62,40%)
School year
*BRI *HEL *HER *MAN *PAR *RHM *STR ALI BER BR 1 BR 2 BR 3 BR 4 CUL FRF KAR LUX MAM MOL MUN VAR Aver.
2012/2013 6,34 6,18 5,48 5,97 6,00 6,42 6,21 6,94 7,39 7,28 6,36 6,76 6,20 5,01 7,00 6,68 6,52
2013/2014 5,86 6,15 6,23 6,43 6,18 5,50 6,50 5,59 6,63 8,30 6,98 6,60 6,27 6,13 5,80 6,69 6,53 6,35
2014/2015 5,80 3,85 6,07 6,41 6,43 6,52 6,97 6,42 6,13 7,15 7,85 7,71 7,58 6,76 6,66 5,67 7,07 6,80 6,75
2015/2016 4,33 6,20 6,41 6,87 6,69 5,14 6,77 5,96 6,78 6,25 7,30 8,18 7,20 7,16 7,12 7,18 5,75 7,28 7,47 6,88
2016/2017 4,64 5,44 5,76 6,19 7,38 6,12 5,05 6,04 6,15 6,31 5,67 6,46 5,25 7,17 7,50 6,87 6,31 6,42 5,52 7,01 6,18 6,31
7,50 7,38 7,17 7,01 6,876,46 6,42 6,31 6,31 6,31 6,19 6,18 6,15 6,12 6,04 5,76 5,67 5,52 5,44 5,25 5,05
4,64
0
1
2
3
4
5
6
7
8
9
10
FRF (54)
*PAR (21)
CUL (39)
MUN (92)
KAR (45)
BR 3 (152)
MAM (85)
average (1165)
LUX (121)
BR 1 (128)
*MAN (4)
VAR (37)
BER
(23)
*RHM (70)
ALI (45)
*HER
(7)
BR 2 (126)
MOL (31)
*HEL (11)
BR 4 (29)
*STR
(42)
*BRI (3)
Mathematics 3P written average (6.31)
*BRI *HEL *HER *MAN *PAR*RHM
*STR ALI BER BR 1 BR 2 BR 3 BR 4 CUL FRF KAR LUX MAM MOL MUN VAR Av.
Written 1 4,74 5,84 5,64 6,64 7,30 6,47 5,31 6,27 6,28 6,54 5,85 6,51 5,50 7,30 7,73 6,90 6,46 6,76 5,81 7,16 6,11 6,49
Written 2 4,53 5,03 5,87 5,74 7,45 5,76 4,79 5,80 6,02 6,09 5,50 6,40 5,00 7,03 7,28 6,83 6,16 6,10 5,23 6,87 6,24 6,13
3,00
3,50
4,00
4,50
5,00
5,50
6,00
6,50
7,00
7,50
8,00
8,50
9,00
9,50
10,00
Mathematics 3P : comparison W1 W2

Report on European Baccalaureate 2017
2017-10-D-01-en-4 56/61
*BRI *HEL *HER *MAN *PAR *RHM *STR ALI BER BR 1 BR 2 BR 3 BR 4 CUL FRF KAR LUX MAM MOL MUN VAR Total
90-100 0,00% 0,00% 0,00% 0,00% 0,17% 0,17% 0,09% 0,09% 0,00% 0,52% 0,69% 0,52% 0,09% 0,34% 0,60% 0,52% 0,69% 0,60% 0,00% 1,46% 0,17% 6,70%
80-89,9 0,00% 0,00% 0,09% 0,09% 0,52% 0,77% 0,09% 0,52% 0,26% 1,20% 1,12% 2,92% 0,26% 0,94% 1,55% 0,77% 1,46% 1,20% 0,26% 2,06% 0,17% 16,22
70-79,9 0,00% 0,17% 0,00% 0,00% 0,43% 1,46% 0,34% 0,94% 0,52% 2,83% 1,37% 2,92% 0,09% 0,86% 0,86% 0,69% 2,06% 1,12% 0,43% 1,20% 0,86% 19,14
60-69,9 0,00% 0,17% 0,17% 0,09% 0,43% 1,12% 0,77% 0,86% 0,26% 2,92% 2,40% 2,58% 0,69% 0,60% 0,69% 0,86% 2,40% 1,37% 0,77% 0,69% 0,52% 20,34
0-59,9 0,26% 0,60% 0,34% 0,17% 0,26% 2,49% 2,32% 1,46% 0,94% 3,52% 5,24% 4,12% 1,37% 0,60% 0,94% 1,03% 3,78% 3,00% 1,20% 2,49% 1,46% 37,60
0%
10%
20%
30%
40%
50%
60%
70%
80%
90%
100%
Mathematics 3P : distribution of written marks

Report on European Baccalaureate 2017
2017-10-D-01-en-4 57/61
5.3.5 Mathematics 5P (Success rate: 68,71%)
School year
*BRI *HEL *HER *MAN *PAR *RHM *STR ALI BER BR 1 BR 2 BR 3 BR 4 CUL FRF KAR LUX MAM MOL MUN VAR Aver.
2012/2013 3,84 6,65 7,07 7,21 5,03 6,78 6,23 7,02 8,45 7,96 7,30 7,22 7,26 6,50 7,98 7,45 6,99
2013/2014 5,93 8,03 7,61 5,13 6,72 6,07 6,99 6,38 6,95 7,81 7,59 7,69 6,74 6,95 6,38 7,76 7,68 6,93
2014/2015 5,72 3,80 6,51 6,92 5,28 6,49 6,32 7,68 6,77 7,14 7,86 8,07 7,23 7,43 7,80 7,88 7,60 7,54 7,22
2015/2016 5,98 4,75 7,15 7,69 6,22 5,82 6,00 5,88 7,07 5,98 7,03 7,32 7,80 7,19 6,99 6,93 5,95 7,37 6,75 6,76
2016/2017 4,59 6,02 6,10 7,07 6,96 7,57 5,96 7,02 6,35 7,23 7,14 6,99 6,49 7,83 7,75 8,03 7,16 7,04 6,71 7,77 7,46 7,11
8,03 7,83 7,77 7,75 7,57 7,46 7,23 7,16 7,14 7,11 7,07 7,04 7,02 6,99 6,96 6,71 6,49 6,35 6,10 6,02 5,96
4,59
0
1
2
3
4
5
6
7
8
9
10
KAR (25)
CUL (23)
MUN (66)
FRF (32)
*RHM (11)
VAR (38)
BR 1 (100)
LUX (69)
BR 2 (99)
average (828)
*MAN (8)
MAM (69)
ALI (23)
BR 3 (92)
*PAR (19)
MOL (26)
BR 4 (64)
BER
(23)
*HER
(2)
*HEL (12)
*STR
(26)
*BRI (1)
Mathematics 5P Written average (7.11)
*BRI *HEL *HER *MAN *PAR *RHM *STR ALI BER BR 1 BR 2 BR 3 BR 4 CUL FRF KAR LUX MAM MOL MUN VAR Av.
Written 1 5,07 6,48 5,50 7,39 7,16 7,73 5,92 7,37 6,38 7,32 7,23 7,07 6,76 7,90 8,02 7,97 7,23 7,24 7,05 8,02 7,63 7,26
Written 2 4,10 5,55 6,70 6,74 6,76 7,41 6,00 6,67 6,31 7,13 7,04 6,89 6,22 7,75 7,47 8,09 7,09 6,84 6,37 7,56 7,27 6,96
3,00
3,50
4,00
4,50
5,00
5,50
6,00
6,50
7,00
7,50
8,00
8,50
9,00
9,50
10,00
Mathematics 5P: comparison W1 W2

Report on European Baccalaureate 2017
2017-10-D-01-en-4 58/61
*BRI *HEL *HER *MAN *PAR *RHM *STR ALI BER BR 1 BR 2 BR 3 BR 4 CUL FRF KAR LUX MAM MOL MUN VAR Total
90-100 0,00% 0,00% 0,00% 0,12% 0,36% 0,48% 0,00% 0,24% 0,24% 2,18% 1,21% 1,69% 0,48% 0,60% 0,73% 0,36% 1,09% 1,09% 0,48% 2,66% 0,73% 14,75
80-89,9 0,00% 0,12% 0,00% 0,24% 0,24% 0,24% 0,73% 0,73% 0,48% 2,78% 3,14% 2,90% 1,21% 0,97% 1,21% 1,33% 1,57% 1,57% 0,48% 1,57% 0,97% 22,49
70-79,9 0,00% 0,36% 0,00% 0,12% 0,60% 0,24% 0,48% 0,73% 0,60% 1,81% 3,02% 1,57% 1,69% 0,48% 0,85% 1,09% 2,18% 1,81% 0,24% 1,33% 1,33% 20,56
60-69,9 0,00% 0,12% 0,12% 0,12% 0,73% 0,12% 0,24% 0,48% 0,36% 2,54% 1,69% 1,69% 0,85% 0,36% 0,48% 0,12% 2,06% 1,69% 0,73% 1,21% 0,73% 16,44
0-59,9 0,12% 0,85% 0,12% 0,36% 0,36% 0,24% 1,69% 0,60% 1,09% 2,78% 2,90% 3,26% 3,51% 0,36% 0,60% 0,12% 1,45% 2,18% 1,21% 1,09% 0,85% 25,76
0%
10%
20%
30%
40%
50%
60%
70%
80%
90%
100%
Mathematics 5P: distribution of written marks

Report on European Baccalaureate 2017
2017-10-D-01-en-4 59/61
5.3.6 Physics (Success rate: 78,22%)
School year
*BRI *HEL *HER *MAN *PAR *RHM *STR ALI BER BR 1 BR 2 BR 3 BR 4 CUL FRF KAR LUX MAM MOL MUN VAR Aver.
2012/2013 6,70 9,90 7,05 7,14 5,84 7,73 6,84 8,02 7,97 8,63 8,22 7,20 7,35 7,07 8,31 7,79 7,52
2013/2014 7,43 9,35 7,19 7,14 7,96 7,37 7,39 7,17 8,07 8,48 8,14 8,16 7,18 7,38 8,32 8,10 8,43 7,70
2014/2015 6,03 6,15 6,63 6,45 4,90 6,95 6,57 7,58 6,50 7,70 7,17 7,59 6,76 7,19 7,60 7,91 8,11 7,41 7,22
2015/2016 6,60 7,45 8,08 8,36 5,57 6,92 5,90 6,45 7,73 6,92 7,69 7,96 8,16 7,42 7,56 7,30 6,80 7,81 7,86 7,45
2016/2017 3,70 6,19 6,65 8,05 7,71 6,65 6,84 7,62 5,95 7,61 7,27 7,86 6,97 8,27 8,04 7,47 7,08 7,62 6,89 8,07 8,11 7,44
8,27 8,11 8,07 8,05 8,04 7,86 7,71 7,62 7,62 7,61 7,47 7,44 7,27 7,08 6,97 6,89 6,84 6,65 6,656,19 5,95
3,70
0
1
2
3
4
5
6
7
8
9
10
CUL (16)
VAR (18)
MUN (49)
*MAN (5)
FRF (16)
BR 3 (55)
*PAR (17)
ALI (12)
MAM (5)
BR 1 (52)
KAR (11)
Average (505)
BR 2 (70)
LUX (51)
BR 4 (22)
MOL (15)
*STR
(15)
*HER
(5)
*RHM (8)
*HEL 11)
BER
(20)
*BRI (1)
Physics written average (7.44)
*BRI *HEL *HER *MAN *PAR *RHM *STR ALI BER BR 1 BR 2 BR 3 BR 4 CUL FRF KAR LUX MAM MOL MUN VAR Av.
Written 1 4,00 6,61 7,10 7,80 7,95 6,68 6,92 7,88 6,09 7,61 7,45 7,97 6,73 8,25 8,22 7,50 7,26 7,79 6,90 8,24 8,29 7,56
Written 2 3,40 5,75 6,20 8,30 7,46 6,62 6,76 7,35 5,81 7,60 7,08 7,75 7,20 8,28 7,86 7,44 6,90 7,45 6,88 7,90 7,93 7,31
3,00
3,50
4,00
4,50
5,00
5,50
6,00
6,50
7,00
7,50
8,00
8,50
9,00
9,50
10,00
Physics: comparison W1 W2

Report on European Baccalaureate 2017
2017-10-D-01-en-4 60/61
*BRI *HEL *HER *MAN *PAR *RHM *STR ALI BER BR 1 BR 2 BR 3 BR 4 CUL FRF KAR LUX MAM MOL MUN VAR
0-59,9 0,20%1,19%0,40%0,20%0,79%0,59%0,79%0,20%1,78%2,38%2,77%1,39%1,19%0,20%0,20%0,20%2,57%1,39%1,19%1,58%0,59% 21,78
60-69,9 0,00%0,40%0,00%0,00%0,40%0,20%0,00%0,20%0,79%0,20%1,78%0,99%0,59%0,20%0,79%0,59%1,39%0,99%0,40%0,79%0,20% 10,89
70-79,9 0,00%0,40%0,40%0,20%0,59%0,20%0,59%0,99%0,20%0,99%2,77%1,78%0,79%0,20%0,40%0,59%1,78%0,99%0,40%1,19%0,40% 15,84
80-89,9 0,00%0,20%0,20%0,20%0,40%0,20%0,79%0,59%0,79%3,56%4,36%2,77%0,59%1,98%0,40%0,79%2,57%2,38%0,40%1,78%0,99% 25,94
90-100 0,00%0,00%0,00%0,40%1,19%0,40%0,79%0,40%0,40%3,17%2,18%3,96%1,19%0,59%1,39%0,00%1,78%1,39%0,59%4,36%1,39% 25,54
0%
10%
20%
30%
40%
50%
60%
70%
80%
90%
100%
Physics: distribution of written marks

Report on European Baccalaureate 2017
2017-10-D-01-en-4 61/61
5.4 Oral Mark Averages for Science EB Examinations
Candidates Oral aver. Candidates Oral aver. Candidates Oral aver. Candidates Oral aver. Candidates Oral aver.
School BI2 BI2 BI4 BI4 CHI CHI MAA MAA PHY PHY
*BRI 1 9,00
*HEL 7 7,64 3 8,83
*MAN 1 9,00
*PAR 10 8,38 4 8,50 2 8,75
*RHM 14 7,32 3 8,83 3 7,75
*STR 17 7,25 11 8,45 7 8,36 1 6,00
ALI 19 7,17 3 8,17 5 8,95 5 9,00 3 7,17
BER 10 7,35 7 8,32 1 9,50
BR 1 60 8,06 4 6,44 2 8,38 29 8,51 1 9,25
BR 2 45 7,18 19 7,84 6 8,71 23 8,15 4 8,69
BR 3 28 7,29 2 8,75 3 9,00 21 8,62
BR 4 2 7,38 2 8,75 8 9,13 4 7,50
CUL 10 8,35 7 7,21 3 9,00
FRF 31 8,21 8 9,22 3 9,00 2 8,88
KAR 15 8,17 7 9,54 2 5,75
LUX 29 7,24 11 7,48 6 8,17 8 7,88 10 7,95
MAM 24 8,19 10 6,45 2 8,38 10 8,30 1 9,50
MOL 7 7,50 6 7,25 12 8,02
MUN 20 7,75 14 7,13 14 7,61 12 8,52
VAR 10 7,23 1 9,50 8 8,91
359 7,67 111 7,84 48 8,22 158 8,44 27 8,06
7,67
7,84
8,22
8,44
8,06
7,40
7,60
7,80
8,00
8,20
8,40
8,60
Bio2 (359) Bio4 (111) Chem (48) Maadv (158) Phys (27)
EB 2017 - Science oral averages