2017-18 quarter 4 academic progress report presentation to
TRANSCRIPT

2017-18 QUARTER 4
ACADEMIC PROGRESS REPORT
PRESENTATION TO THE BOE
SEPTEMBER 19, 2018
SCHENECTADY CITY SCHOOL DISTRICT

2
OUTLINE OF PRESENTATION
Summary of Data: Slide:
Fluency & Reading Levels 4
ELA Interim & New York State ELA Assessments 8
Math Interim & New York State Math Assessments 12
Additional New York State Assessments 16
Middle & High School-Level Advanced Courses 22
Report Card Achievement Data 26
June & August Grad Rates 34
Summer School Participation 37
Office of Curriculum & Instruction Areas of Priority 39
Behavior Data 42
Attendance Data 49
Office of Pupil Personnel Services 54
3
SYMBOLS USED IN TODAY’S PRESENTATION
MOVING
IN THE RIGHT
DIRECTION
PROCEEDING
WITH
CAUTION
PRIORITY AREA!
NEEDS
ATTENTION

4
End-of-Year
Fluency & Reading Levels

44
60
83
98
118
41
62
82
99
116
59
78
100
114
133
60
78
96
113
130
81
95
114
129
146
81
94
111
128
149
0
30
60
90
120
150
2nd Grade 3rd Grade 4th Grade 5th Grade 6th Grade
Word
s R
ead
Corr
ect
per
Min
ute
Average Words Read Correct (WRC) per Minute by Grade Level
2016-17 to 2017-18 Comparison
2016-17 Sept
2017-18 Sept
2016-17 Nov
2017-18 Nov
2016-17 June
2017-18 June
SP
5
• WRC is a measure of fluency
• One measure used to
monitor student progress
• Any increases or decreases
between years were negligible

Fall 2016-17 to Fall 2017-18
Winter 2016-17 to Winter 2017-18
Spring 2016-17 to Spring 2017-18
Grade Level 2 3 4 5 6 2 3 4 5 6 2 3 4 5 6
Hamilton 10
Howe 8
Keane 9
Lincoln 8
ML King 8
Paige 7
PV 4
VC 4
Woodlawn 6
Yates 6
Zoller 7
CPMS (6)
MPMS (6)
OMS (6)
2016-17 to 2017-18 Average Words Read Correct
Year to Year Comparison, Grades 2- 6, by Building
*based on AIMS Web Oral Reading
SP
6

7
KM
Average Instructional Reading Level* (IRL), by Building, Grades 7-8, Year-to-Year Comparison*based on STAR Reading criterion referenced measures
5.3
1
4.9
0
5.5
7
5.5
7
4.9
2
5.0
4
5.4
8
5.0
6
5.7
9
5.9
1
5.1
1
5.6
6
5.9
1
5.5
1
6.3
0
5.9
8
5.6
3
6.1
4
0.00
2.00
4.00
6.00
8.00
10.00
12.00
Central Park MS Mont Pleasant MS Oneida MS
Ave
rage
Inst
ruct
ional
Read
ing
Leve
l
2016-17 Sept 2017-18 Sept 2016-17 Feb 2017-18 Feb 2016-17 June 2017-18 June
Quarter 4 CPMS MPMS OMS
Total Tested 404 388 405
Participation 83% 83% 94%
• IRL is an estimate of the grade-level of appropriate texts that
can be used for effective instruction
• IRL Reliability ±1 Grade Level
• One measure used to monitor student progress
• Any increases or decreases between years were negligible

8
End-of-Year
ELA Interim &
NYS Assessment Data

4.6
9%
14.1
1%
6.1
0%
2.9
4%
2.8
7%
16.7
3%
5.5
6%
6.9
9%
17.0
3%
5.7
0%
11.6
8%
5.4
7%
12.7
9%
10.9
5%
4.6
3%
2.4
9%
6.9
0%
2.3
4%
7.2
0%
26.3
6%
6.7
2%
12.0
9%
16.3
5%
17.5
0%
12.5
0%
8.7
5%
7.5
2%
15.6
6%
6.4
9%
9.3
9%
18.5
8%
7.4
1%
32.4
6%
9.5
9%
14.6
7%
15.8
2%
8.9
7%
8.6
8%
12.1
5%
18.8
5%
12.6
1%
35.7
5%
12.3
0%
32.1
3%
22.00%
35.00%
19.00%
11.00% 13.00%
22.00%
13.00%
21.00%
31.00%
21.00%
28.00%
0.00%
5.00%
10.00%
15.00%
20.00%
25.00%
30.00%
35.00%
40.00%
45.00%
50.00%
HAM HOWE KEAN LINC MLK PAIG PLVY VAN WDLN YATE ZOL
Ave
rage
Build
ing
Pro
fici
ency
2016-17 to 2017-18 ELA Interim (2-5) and NYS Exam Average Proficiency Projection (3-5)
Oct 16-17 Oct 17-18 Feb 16-17 Feb 17-18 State 16-17 State 17-18
9
Ham How Kean Linc MLK Paig PV Van Wdl Yate Zol
Total Tested (Feb Interim) 271 225 196 223 334 321 244 238 221 244 277
Participation (Feb Interim) 92% 95% 89% 95% 87% 93% 84% 93% 90% 89% 97%KM
• NYS ELA Proficiency 2016-17
• Interim Proficiency 2017-18
• Participation = Feb Interim
• NYS ELA Proficiency 2017-18
“Embargoed”

10
CP MP OMS
Total Tested (Feb Interim) 623 582 644
Participation (Feb Interim) 90% 84% 93%KM
18.7
5%
16.9
6%
15.0
8%
25.6
2%
11.1
3%
17.5
1%
22.8
3%
16.2
7%
24.8
3%
26.8
1%
22.1
6%
23.4
5%
20.00%
10.00%
19.00%
0.00%
5.00%
10.00%
15.00%
20.00%
25.00%
30.00%
35.00%
40.00%
45.00%
50.00%
CPMS MPMS ONMS
Ave
rage
Perc
ent
Pro
fici
ency
2016-17 to 2017-18 ELA Interim (6-8) and NYS Exam Average Proficiency Projection (6-8)
Oct 16-17 Oct 17-18 Feb 16-17 Feb 17-18 State 16-17 State 17-18
• NYS ELA Proficiency 2016-17
• Interim Proficiency 2017-18
• Participation = Feb Interim
• NYS ELA Proficiency 2017-18
“Embargoed”

11
Total
Tested
All Black Hispanic Asian White SWD SES Non-SES ELL
2016-17 538 179 62 142 157 99 412 141 21
2017-18 606 224 69 147 157 94 493 113 25
71.5
6%
62.5
7%
66.1
3%
73.9
4%
78.3
4%
34.3
4%
68.2
0%
78.0
1%
28.5
7%
56.2
7%
48.0
5%
56.3
4%
57.8
2%
64.6
3%
28.7
0%
53.4
0%
68.0
3%
24.0
0%
0.00%
10.00%
20.00%
30.00%
40.00%
50.00%
60.00%
70.00%
80.00%
90.00%
100.00%
All Black Hispanic Asian White SWD SES Non-SES ELL
Perc
ent
Pro
fici
ent
Sub-groups
2016-17 2017-18KM
ELA Common Core Regents Assessment (June Administrations Only)
2016-17 to 2017-18 Comparison
• Designed to measure students’
achievement of the Grade
11-12 Band CCLS for ELA
• Overall decrease in proficiency
• Data triangulated and
pinpointed to students and
standards

12
End-of-Year
Math Interim &
NYS Assessment Data

13
Interim Tested/Participation Ham How Kean Linc MLK Paig PV Van Wdl Yate Zol
Total Tested (Mar Interim) 201 165 161 160 253 264 200 189 165 180 180
Participation (Mar Interim) 94% 93% 93% 93% 87% 97% 94% 95% 90% 89% 91%JD
9.5
6%
17.1
4%
15.1
3%
9.8
2%
8.8
9%
25.8
8%
8.2
6%
7.6
9%
31.3
0%
12.1
2%
17.0
4%
19.6
4%
18.1
8%
11.3
2%
11.0
4%
9.0
2%
14.5
1%
7.5
8%
11.0
5%
30.3
0%
9.6
6%
38.3
8%
13.7
9%
23.6
4%
21.9
3%
10.9
1%
14.9
2%
34.3
6%
8.6
0%
9.6
0%
40.3
4%
18.8
5%
42.1
1%
11.8
8%
31.3
3%
15.4
3%
9.4
3%
9.9
6%
14.3
4%
12.5
0%
12.7
0%
41.8
2%
8.8
9%
54.1
9%
14.00%
22.00%
11.00%
7.00%
6.00%
16.00%
11.00% 8.00%
35.00%
9.00%
31.00%
0.00%
10.00%
20.00%
30.00%
40.00%
50.00%
60.00%
HAM HOWE KEAN LINC MLK PAIG PLVY VAN WDLN YATE ZOL
Ave
rage
Build
ing
Pro
fici
ency
2016-17 to 2017-18 Math Interim (3-5) and NYS Exam Average Proficiency Comparison (3-5)
2016-17 Nov 2017-18 Nov 2016-17 Mar 2017-18 Mar State 16-17 State 17-18
• NYS Math Proficiency 2016-17
• Interim Proficiency 2017-18
• Participation = Mar Interim
• NYS Math Proficiency
2017-18 “Embargoed”
This Photo by Unknown Author is licensed under CC BY-SA

14
Interim Tested/Participation CP MP OMS
Total Tested (Mar Interim) 548 376 482
Participation (Mar Interim) 84% 68% 75%JD
17.4
7%
5.4
7%
8.6
3%
15.1
2%
6.9
8%
10.6
0%
17.5
4%
8.6
3%
16.1
6%
16.6
1%
15.7
3%
12.3
0%
11.00%
5.00%8.00%
0.00%
5.00%
10.00%
15.00%
20.00%
25.00%
30.00%
35.00%
40.00%
45.00%
50.00%
CPMS MPMS ONMS
Ave
rage
Build
ing
Pro
fici
ency
Building
2016-17 to 2017-18 Math Interim (6-8) and NYS Exam Average Proficiency Comparison (6-8)
2016-17 Nov 2017-18 Nov 2016-17 Mar 2017-18 Mar State 16-17 State 17-18
• NYS Math Proficiency 2016-17
• Interim Proficiency 2017-18
• Participation = Mar Interim
• NYS Math Proficiency
2017-18 “Embargoed”

15
50.65%
84.34%
51.60%
47.19%
94.44%
79.91%
0.00%
10.00%
20.00%
30.00%
40.00%
50.00%
60.00%
70.00%
80.00%
90.00%
100.00%
Algebra I Algebra II Geometry
Perc
ent
Pro
fici
ent
Common Core Assessments
2016-17 2017-18
Total Tested Algebra I Algebra II Geometry
2016-17 841 115 219
2017-18 924 90 214JD
Math Common Core Regents Assessments
2016-17 to 2017-18 Proficiency Comparison
• Slight decrease in Algebra I, but
increase in student test takers
• Increased # of 9th grade
students taking Geometry
• 10% increase in Algebra II,
28% in Geometry

16
Additional NYS Assessments

36%
68%
48%
58%
51%
70%
55%
60%
73%
38%
89%
41%
72%
65%
47%
54%
69%
43%
53%
77%
48%
86%
0%
10%
20%
30%
40%
50%
60%
70%
80%
90%
100%
HAM HOWE KEANE LINC MLK PAIG PLVY VAN WDLN YATE ZOLR
Ave
rage
Build
ing
Pro
fici
ency
NYS Fourth Grade Science 2016-17 to 2017-18 Comparison, by Building
2016-17 2017-18
JD
17
Ham How Kean Linc MLK Paig PV Van Wdl Yate Zol
Total Tested 2016-17 75 59 52 57 80 86 56 63 55 50 53
Total Tested 2017-18 73 50 62 57 103 72 70 70 52 69 64
• NYS Science Grade 4 – overall
increase in proficiency
• Exam not yet adapted to NGSS
• Buildings working to unpack
NGSS and integrate across
disciplines

32%
22%
37%
19%
9%
34%
0%
5%
10%
15%
20%
25%
30%
35%
40%
CPMS MPMS ONMS
Ave
rage
Build
ing
Pro
fici
ency
NYS Eighth Grade Science Year - to -Year Comparison by Building
2016-17 2017-18
18
CP MP OMS
Total Tested 2016-17 152 158 112
Total Tested 2017-18 162 113 111
JD
• NYS Science Grade 8 – overall decrease in proficiency
• Exam not yet adapted to NGSS
• Does not include students that were enrolled in Regents-
level Living Environment (30% of the 8th grade population)
• Increased focus on Scientific Discourse at the Middle-level

19
50.5
1%
70.3
5%
49.3
2%
42.0
5%
61.3
6%
55.0
0%
49.2
9%
70.0
4%
42.4
1%
67.9
7%
53.2
2%
72.2
2%
0.00%
10.00%
20.00%
30.00%
40.00%
50.00%
60.00%
70.00%
80.00%
90.00%
100.00%
Global History US History Living Environment Earth Science Chemistry Physics
Perc
ent
Pro
fici
ent
NYS Additional Regents Assessments
2016-17 to 2017-18 Comparison
2016-17 2017-18
Total
Tested
Global
History
US History Living
Environment
Earth
Science
Chemistry Physics
2016-17 687 560 805 302 220 60
2017-18 702 564 837 256 171 72KB
• Slight decreases in Living Environment, but increased # of test
takers and both have same # of students proficient
• Significant increases in Earth Science (26%) and Physics (17%)

20
100.0
0%
58.4
1%
95.5
6%
43.6
4%
8.5
7%
100.0
0%
56.2
5%
83.0
5%
34.7
6%
14.2
9%
0.00%
20.00%
40.00%
60.00%
80.00%
100.00%
CPMS MPMS ONMS SCHS SCLA
Perc
ent
Pro
fici
ent
Percent Proficient on NYS Regents Exam, by Building
Algebra I Living Environment
CP(8) MP(8) ON(8) SHS SCLA
Total Tested Algebra I 35 113 45 653 70
Total Tested LE 45 64 59 633 35
TD
• Algebra I and Living Environment offered at the Middle Level
(8th Grade) as well as at SHS
• Algebra I:
• MPMS 50% participation, 66 kids proficient
• OMS & CPMS 20% participation, 35 & 43 kids proficient
• Living Environment:
• MPMS 28% participation, 36 kids proficient
• OMS (26%) & CPMS (19%) participation, 45 & 48 kids proficient

21
35.8
0%
0.0
0%
33.3
0%
27.1
0%
1.9
0%
2.4
0%
30.3
0%
42.9
0%
6.1
0%
25.9
0%
0.0
0%
35.0
0%
18.2
7%
14.1
4%
1.7
9%
39.6
2%
58.0
6%
16.1
3%
0.00%
20.00%
40.00%
60.00%
80.00%
100.00%
Algebra I Algebra II Geometry ELA Global
History
US History &
Gov't
Living
Environment
Phy
Set/Chemistry
Phy Set/Earth
Sci
Perc
ent
Pro
fici
ent
Percent Proficient on August Regents by Content Area
Year to Year Comparison
2016-17 2017-18KB
Total
Tested
Algebra
I
Algebra
II
Geo ELA Global
History
US &
Gov’t
LE Phy
Set/Chem
Phy
Set/ES
2016-17 134 1 70 24 108 142 21 33 42
2017-18 166 1 20 104 99 56 212 31 31
• August Regents exams are re-takes of exams
• SCSD students participated in a BOCES-run
Regional Summer School
• Subsequent slide depicts credits earned in
Summer School
• Increase of 9.32% proficient in Living
Environment, but large increase in enrollment:
7 kids (16-17) vs. & 84 kids (17-18) proficient

22
Middle and High School Level
Advanced Courses

23
8 15 8 15 14 79 21 3 21 19 49 9 14 9 9 8 38 12 298
173101
175 84
210
7542
120 159
83
144
130193
120 198 102
130
68 102
92% 92% 93% 92%
86%
73%
78%
93%
85%
89%
100%
75%
94% 93% 93%96%
93%
77%
85%
98%
0%
10%
20%
30%
40%
50%
60%
70%
80%
90%
100%
0
50
100
150
200
250
300
350
2016-1
7
2017-1
8
2016-1
7
2017-1
8
2016-1
7
2017-1
8
2016-1
7
2017-1
8
2016-1
7
2017-1
8
2016-1
7
2017-1
8
2016-1
7
2017-1
8
2016-1
7
2017-1
8
2016-1
7
2017-1
8
2016-1
7
2017-1
8
Enriched
English 7
Enriched
Social Studies
7
Accelerated
Math 7/8
Advanced
French 8
Advanced
Spanish 8
Regents
Algebra I
Enriched
English 8
Enriched
Social Studies
8
Regents Living
Environment
Studio in Art
8
% S
tudents
Pas
sing
# o
f Stu
dents
Enro
lled
Failing Passing % Passing
Number of Middle Level Students Enrolled in Accelerated Courses
2016-17 compared to 2017-18 with % Passing
• % passing course, summative exam or final project each year
• Algebra & Living Environment % passing are Regents exams
• 61 additional students received credit in 8th grade for Algebra

24
93.4
5%
95.2
3%
96.3
0%
98.8
9%
96.5
8%
90.1
6%
84.8
1%
98.8
5%
0.00%
10.00%
20.00%
30.00%
40.00%
50.00%
60.00%
70.00%
80.00%
90.00%
100.00%
9 (Pre-IB) 10 (Pre-IB) 11 12
Perc
ent
Pas
sing
2016-17 2017-18
IB Course
Enrollments 9th Grade 10th Grade 11th Grade 12th Grade
Enrollment 2016-17 228 214 146 108
Enrollment 2017-18 237 203 146 128
Percentage of Students Passing High-School Level Pre-International Baccalaureate (IB) and IB Courses
2016-17 Compared to 2017-18
• 2016-17 = 696 (unique) students
enrolled in Pre-IB / IB Courses
• 2017-18 = 714 (unique) students
enrolled in Pre-IB / IB Courses
• % include duplicated students
• NEW Sports Medicine Course in
2017-18 school year

25
93.3
8%
96.5
9%
95.4
5%
98.4
7%
93.3
5%
100.0
0%
100.0
0%
100.0
0%
99.1
9%
97.0
4%
96.9
4%
90.3
2%
68.2
5%
96.5
1%
100.0
0%
100.0
0%
100.0
0%
100.0
0%
0.00%
10.00%
20.00%
30.00%
40.00%
50.00%
60.00%
70.00%
80.00%
90.00%
100.00%
ENG SS MATH SCI FL VA TECH MUSIC IB PROG
Perc
ent
Pas
sing
Department
Percentage of High School Students Passing IB Courses, by Department
2016-17 to 2017-18 Comparison
2016-17 2017-18
• SHS offers 46 different
International Baccalaureate
course offerings

26
End-of-Year
Report Card
Achievement Data

27Number of Students (K-6) Below Achievement for Grade Level on Report Cards*
*Q1 to Q2 to Q3 to Q4
1 course 2 courses 3 or > courses
BLDG
17-18
Q1
17-18
Q2
17-18
Q3
17-18
Q4
17-18
Q1
17-18
Q2
17-18
Q3
17-18
Q4
17-18
Q1
17-18
Q2
17-18
Q3
17-18
Q4
HAM 71 57 50 46 53 50 29 34 104 82 72 63 (63)
HOWE 51 37 30 33 30 21 22 19 38 45 31 33 (42)
KEAN 25 34 22 21 25 19 18 21 32 38 31 25 (20)
LINC 57 61 52 57 27 25 18 22 78 70 50 51 (51)
MLK 82 73 71 77 56 40 38 37 91 91 74 71 (56)
PAIG 67 65 63 61 37 40 33 30 79 71 61 56 (70)
PLVY 73 83 99 68 47 48 38 35 70 62 57 48 (75)
VAN 42 47 48 34 29 26 22 27 67 69 49 34 (37)
WDLN 38 43 45 44 22 24 24 28 50 37 40 34 (43)
YATE 67 48 52 61 39 44 29 30 82 88 96 80 (67)
ZOL 28 35 28 31 35 19 16 11 25 30 38 35 (23)
CPMS
(6) 24 38 35 40 16 12 14 13 10 18 20 16 (12)
MPMS
(6) 51 28 31 19 13 14 10 9 20 7 12 9 (37)
ONMS
(6) 40 49 56 51 24 26 22 18 25 43 33 44 (34)Qtr 4 Ham How Kean Linc MLK Paig PV Van Wdl Yate Zol CP6 MP6 OMS6
Total 437 371 343 344 539 490 424 374 399 394 429 235 246 247
1 course
8 buildings
decreased
2 courses
8 buildings
decreased
3 or > courses
11 buildings
decreased
course failures

28
Q1 Q2 Q3 Q4 Q1 Q2 Q3 Q4 Q1 Q2 Q3 Q4
1 Course 2 Courses 3 or > Courses
Asian 107 100 71 79 37 38 38 33 68 50 38 36
Black or African American 261 255 262 230 158 158 126 112 269 271 234 235
Hispanic/Latino 66 69 69 69 48 58 38 47 109 105 104 89
Two or more races 87 77 85 69 61 41 33 47 86 91 78 63
White 192 195 194 195 148 113 98 94 238 234 209 176
0
50
100
150
200
250
300
Num
ber
of St
udents
Number of Courses by Quarter
Number of Students (K-6) Below Achievement for Grade Level within Race
(i.e. working of key concepts, processes and skills that are below grade level expectations)
Quarter 4 Asian Black/African
American
Hispanic/Latino Two or More
Races
White
Total 861 1659 514 601 1626

29
CALCULATING RELATIVE RISK FOR
3 OR > COURSES BELOW ACHIEVEMENT, GRADES K-6
Definition:
The risk of a subgroup
falling below
achievement for 3 or
more courses
compared to
The risk of all other
students falling below
achievement for 3 or
more courses
Relative Risk:
Subgroup Relative Risk
2017-18 Q4 falling below
achievement, 3 or >
courses
Hispanic 1.62
Asian 0.33
Black 1.41
White 0.93
Two or more 0.91

30Number of Students (7-12) with Report Cards <65*
*Q1 to Q2 to Q3 to Q4
1 course 2 courses 3 or > courses
Building
17-18
Q1
17-18
Q2
17-18
Q3
17-18
Q4
17-18
Q1
17-18
Q2
17-18
Q3
17-18
Q4
17-18
Q1
17-18
Q2
17-18
Q3
17-18
Q4
CPMS 84 109 105 90 47 44 39 55 80 72 79
77
(93)
MPMS 82 93 86 76 46 53 54 65 90 131 146
153
(181)
ONMS 78 83 85 113 54 41 47 38 84 103 82
100
(151)
SHS 545 482 495 475 277 312 271 285 777 821 782
794
(948)
SCLA 40 28 36 33 36 21 30 19 150 152 138
119
(128)
Quarter 4 CP(78) MP(78) OMS(78) SHS SCLA
Total 458 448 459 2246 228
1 course
4 buildings
decreased
course failures
2 courses
2 buildings
decreased
course failures
3 or > courses
2 buildings
decreased
course failures

31Number of Students (Grades 7-12) with Final Year Course Failures
Final Course Grades <65, 2016-17 to 2017-18 Comparison
324
172
682
3422
100
286
196
520
24 22
107
-48
24
-155
-200
-100
0
100
200
300
400
500
600
700
800
1 Course 2 Courses 3+ Courses
# o
f St
udents
with C
ours
e F
ailu
res
2016-17 SHS 2016-17 SCLA 2017-18 SHS 2017-18 SCLA Year-to-Year Combined Difference
Year-to-Year
1 course
48 fewer students
Year-to-Year
2 courses
24 + students
Year-to-Year
3 or > courses
155 fewer
students
20% improvement!

32
Q1 Q2 Q3 Q4 Q1 Q2 Q3 Q4 Q1 Q2 Q3 Q4
1 Course 2 Courses 3 or > Courses
Asian 170 167 199 192 77 95 64 93 140 163 164 167
Black or African American 307 277 309 279 196 186 187 180 534 566 534 530
Hispanic/Latino 120 115 108 106 70 76 62 71 177 190 194 198
Two or more races 23 21 27 16 6 11 10 12 22 21 24 25
White 213 213 164 195 110 105 115 105 319 346 316 325
0
100
200
300
400
500
600N
um
ber
of St
udents
Number of Courses by Quarter
Number of Students (7-12) with Report Cards <65 within Race*
*Q1 to Q2 to Q3 to Q4
Quarter 4 Asian Black/African
American
Hispanic/Latino Two or More
Races
White
Total 854 1331 539 78 1022

33
CALCULATING RELATIVE RISK FOR
3 OR > COURSE FAILURES, GRADES 7-12
Definition:
The risk of a
subgroup failing 3 or
more courses
compared to
The risk of all other
students failing 3 or
more courses
Relative Risk:
Subgroup Relative Risk
2017-18 Q4 Final Mark
Hispanic 1.06
Asian 0.47
Black 1.53
White 1.01
Two or more 0.74

34
June & August
Graduation Rates

35
59% 60%
34%
74%
51%
60% 59%
39%
59%
69%
35%
70%
51% 52%
61%
27%
0%
10%
20%
30%
40%
50%
60%
70%
80%
SHS SES SWD ASIAN BLACK HISPANIC WHITE ELL
Gra
duat
ion R
ate
Schenectady High School June Graduation Rate 2016-17 to 2017-18 Comparison
2016-17 2017-18
Year Total in Cohort
2016-17 726
2017-18 713

36
63%65%
37%
80%
61% 60%62%
44%
63%
74%
38%
81%
56% 57%
63%
53%
0%
10%
20%
30%
40%
50%
60%
70%
80%
90%
100%
SHS SES SWD ASIAN BLACK HISPANIC WHITE ELL
Gra
duat
ion R
ate
Schenectady High School Combined June & August Graduation Rate 2016-17 to 17-18 Comparison
2016-17 2017-18
Year Total in Cohort
2016-17 726
2017-18 713

37
Summer School
Participation

38
109
186
167
100
183
145
0
20
40
60
80
100
120
140
160
180
200
0.00 0.25-1.00 1.25-2.00
Tota
l N
um
ber
of Stu
dents
Total Credits Earned
Total Number of SCSD Students Enrolled in Summer School and Credits Earned
Summer School 2016-17 to 2017-18 Comparison
2016-17 2017-18
Summer
School
Year
Number
of
Students
Enrolled
% of
Students
Earning
Credit(s)
2016-17 462 76%
2017-18 428 77%
89% of students enrolled in
2017-18 earned 1.00 full credit

39
Office of
Curriculum & Instruction
Areas of Priority

AREAS OF FOCUS – OFFICE OF CURRICULUM & INSTRUCTION
Areas of Priority Initiatives & Responses
Fluency, Literacy & Summer Slide • Fluency Targets
• Increase Literacy Resources/Interventions
• Summer Teaching and Learning Institute
• Summer Enrichment Program
• Book Mobile
• Text Sets Professional Development
• Disciplinary Literacy
• New Universal Screener K-12
8th Grade Science @ Middle Level • Math/Science Partnership Grant
• Increased Focus on Scientific Discourse
• Larger Selection of NGSS Science Kits
• STEAM and FabLab
Interim Participation Rate @ Middle Level • Action plans for consistent administration and make-up cycles
• Refined administration protocols
• Increased expectation
Elementary, Middle and High School
Mathematics
• Curriculum Writing Week & Math Units
• NGMS
• Math Solutions (Grades 4 & 5)
• Institute for Learning (Grades 6 through 9)
• Eureka! Math
• New Universal Screener K-12
ELA Common Core Regents Exams • Curriculum Writing Week & ELA Units
• General Education Continuum
• Data Triangulation within PLCs
• Institute for Learning Professional Development (Grades 8-11)
Graduation Rate • Data Protocols with Plan-Do-Study-Act Cycles
• Decreasing Student Course Failures
• Increasing Students’ Opportunities for Advanced Coursework
• Increased Participation in Fine Arts

41
OCI ACTION PLANNING FOR
CONTINUOUS IMPROVEMENT
42
End-of-Year
Behavior Data

200
235
269
264
562
596
620
620
945
868
1008
800
181
169
197
198
427
502
448
511
1087
973
1016
754
355
475420 429
1718
2000
1746
1450
2438 2707
3711
2300
281 224 244 241
1009 1015
889980
3171
2854
2646
1857
0
500
1000
1500
2000
2500
3000
3500
4000
Q1 Q2 Q3 Q4 Q1 Q2 Q3 Q4 Q1 Q2 Q3 Q4
Elementary Schools Middle Schools High School
Comparison of Unique Students to Incidents, By Quarter, By Building Level, 2016-17 to 17-18
2016-17 Students 2017-18 Students 2016-17 Incidents 2017-18 Incidents
Quarter 4 ES MS HS
Total Enrollment 4790 2092 2489
43

HAML HOWE KEAN KING LINC PAIG PLVY VCLR WDLN YATE ZOLR
2017-18 Q1 Students 20 3 17 7 13 36 17 17 23 17 11
2017-18 Q2 Students 14 7 13 5 15 37 13 7 29 17 12
2017-18 Q3 Students 17 8 12 10 8 26 31 34 28 12 11
2017-18 Q4 Students 13 18 21 10 13 24 28 15 29 14 13
2017-18 Q1 Incidents 28 5 25 9 19 95 17 18 31 22 12
2017-18 Q2 Incidents 20 8 17 8 14 55 16 7 41 20 18
2017-18 Q3 Incidents 14 15 17 8 14 40 48 22 31 19 16
2017-18 Q4 Incidents 14 17 24 11 21 26 46 14 35 17 16
0
10
20
30
40
50
60
70
80
90
100
Number of Unique Students and Incidents by Building, Grades K-5*
*Q1 vs Q2 vs Q3 vs Q4
Quarter 4
Enrollment
Ham How Kean Linc MLK Paig PV Van Wdl Yate Zol
Total 437 371 343 344 539 490 424 374 399 394 429
44
Incident =
something
that violated
the code of
conduct.
5 out of 11
buildings
reduced # of
students
involved in
an incident
6 out of 11
buildings
reduced # of
incidents

CNPK MTPL ONDA SCHS SCLA
2017-18 Q1 Students 117 192 118 966 121
2017-18 Q2 Students 146 217 139 851 122
2017-18 Q3 Students 125 212 111 912 104
2017-18 Q4 Students 132 254 125 689 65
2017-18 Q1 Incidents 346 401 262 2829 342
2017-18 Q2 Incidents 336 412 267 2401 453
2017-18 Q3 Incidents 333 326 230 2350 296
2017-18 Q4 Incidents 317 416 247 1738 119
0
500
1000
1500
2000
2500
3000
Number of Unique Students and Incidents by Building, Grades 6-12*
*Q1 vs Q2 vs Q3 vs Q4
Quarter 4 Enrollment CP MP OMS SHS SCLA
Total 693 694 706 2246 228
45
Incident =
something
that violated
the code of
conduct.
2 out of 5
buildings
reduced # of
students
involved in
an incident
3 out of 5
buildings
reduced # of
incidents
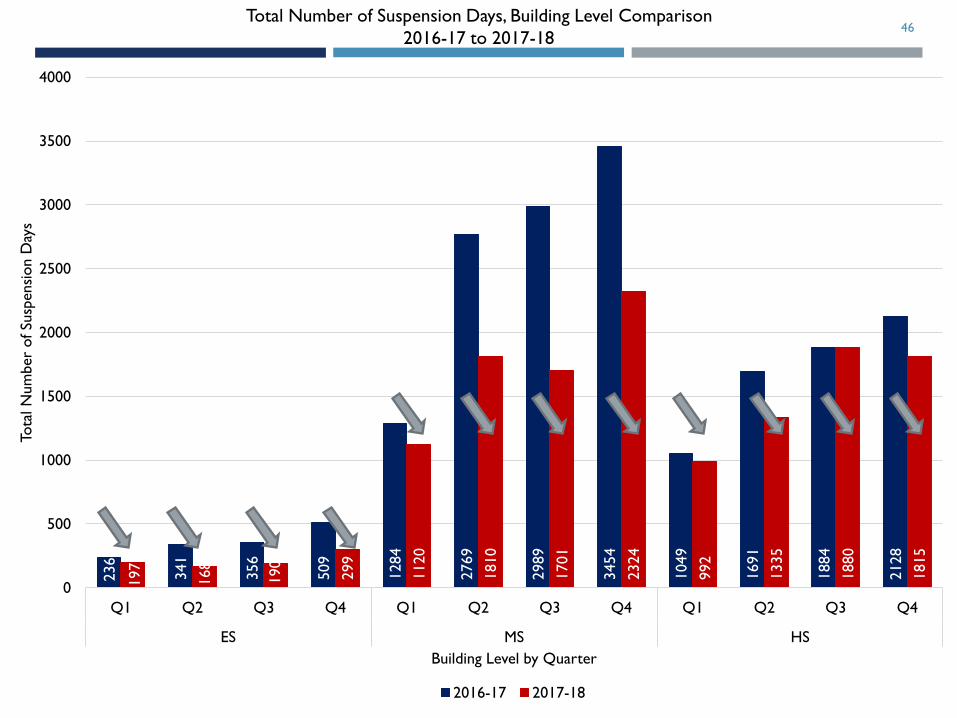
236
341
356
509
1284
2769
2989
3454
1049
1691
1884
2128
197
168
190
299
1120
1810
1701
2324
992
1335
1880
1815
0
500
1000
1500
2000
2500
3000
3500
4000
Q1 Q2 Q3 Q4 Q1 Q2 Q3 Q4 Q1 Q2 Q3 Q4
ES MS HS
Tota
l N
um
ber
of Susp
ensi
on D
ays
Building Level by Quarter
2016-17 2017-18
46Total Number of Suspension Days, Building Level Comparison
2016-17 to 2017-18

HA
M
HO
WE
KE
AN
LIN
C
ML
K
PAI
G
PLV
Y
VC
LR
W
DL
N
YA
TE
ZO
L
CP
MS
MP
MS
ON
MS
SH
S
SC
LA
2017-18 Q1 0 0 0 0 0 0 0 0 0 0 0 3 11 0 8 1
2017-18 Q2 0 0 0 0 0 0 0 0 0 0 0 6 8 10 10 3
2017-18 Q3 0 0 0 0 0 0 0 0 0 0 0 5 13 8 24 3
2017-18 Q4 0 0 0 0 0 0 0 0 0 0 0 3 11 16 19 7
05
1015202530
Num
ber
of St
udents
Building
20+ Days
HA
M
HO
WE
KE
AN
LIN
C
ML
K
PAI
G
PLV
Y
VC
LR
W
DL
N
YA
TE
ZO
L
CP
MS
MP
MS
ON
MSSHS
SCL
A
2017-18 Q1 1 0 0 0 0 0 0 1 0 0 0 1 9 0 5 2
2017-18 Q2 0 0 0 0 0 0 0 0 0 0 0 3 10 7 6 3
2017-18 Q3 0 0 0 0 0 0 0 0 0 0 0 5 0 7 10 1
2017-18 Q4 0 0 0 0 0 0 0 0 0 0 0 3 6 13 12 2
02468
101214
Num
ber
of St
udents
Building
11-19 Days
HA
M
HO
WE
KE
AN
LIN
C
ML
K
PAI
G
PLV
Y
VC
LR
W
DL
N
YA
TE
ZO
L
CP
MS
MP
MS
ON
MS
SH
S
SC
LA
2017-18 Q1 0 0 0 0 0 4 0 1 1 0 0 6 13 7 20 6
2017-18 Q2 1 0 0 0 0 0 1 0 1 0 0 11 16 13 20 7
2017-18 Q3 2 0 0 1 0 0 0 0 0 0 1 5 7 7 36 6
2017-18 Q4 0 0 0 0 1 0 7 0 0 0 2 9 18 19 25 2
0
5
10
15
20
25
30
35
40
Num
ber
of St
udents
Building
6-10 Days
HA
M
HO
WE
KE
AN
LIN
C
ML
K
PAI
G
PLV
Y
VC
LR
W
DL
N
YA
TE
ZO
L
CP
MS
MP
MS
ON
MSSHS
SCL
A
2017-18 Q1 7 1 7 3 2 12 4 1 4 17 5 44 61 53 140 39
2017-18 Q2 6 1 8 2 8 15 7 3 6 12 8 47 79 57 179 38
2017-18 Q3 2 1 2 1 7 8 17 12 5 11 8 52 80 53 187 35
2017-18 Q4 6 5 8 5 10 5 27 8 13 9 13 62 102 65 163 33
020406080
100120140160180200
Num
ber
of St
udents
Building
1-5 Days
47Number of Student Suspensions by Building, by Quarter
10 buildings
reduced
suspensions
or stayed the
same
12 buildings
reduced
suspensions
or stayed the
same
14 buildings
reduced
suspensions
or stayed the
same
5 buildings
reduced
suspensions
or stayed the
same
Quarter
4
Ham How Kean Linc MLK Paig PV Van Wdl Yate Zol CP MP OMS SHS SCLA
Total 455 389 361 361 569 517 440 407 417 412 449 693 694 706 2249 228

48
CALCULATING RELATIVE RISK
STUDENT SUSPENSIONS
Definition:
The risk of a
subgroup being
suspended
compared to
The risk of all other
students being
suspended
Relative Risk:
Subgroup Relative Risk
2017-18 Q4
(2016-17 Q4)
Relative Risk
2017-18 Entire
School Year
Hispanic 1.18 (1.23) 1.17
Asian 0.21 (0.28) 0.30
Black 2.23 (2.49) 2.06
White 0.78 (0.64) 0.76
Two or more 0.73 (0.50) 0.78

49
End-of-Year
Student Attendance Data

HAM
L
HOW
EKEAN LINC MLK PAIG PLVY VCLR
WDL
NYATE ZOLR CNPK MTPL
OND
ASCHS SCLA
2017-18 Q1 124 93 113 92 152 157 130 115 134 106 142 193 152 189 319 29
2017-18 Q2 45 57 41 21 40 64 34 31 57 40 70 27 43 79 149 18
2017-18 Q3 80 69 72 54 88 114 69 52 68 85 85 122 111 104 163 24
2017-18 Q4 53 74 53 26 37 83 45 54 72 60 73 54 75 84 157 30
0
50
100
150
200
250
300
350
Num
ber
of St
udents
Building
50
4 out of the 16 buildings
saw an increase in the
number of students with
perfect attendance
Quarter
4
Ham How Kean Linc MLK Paig PV Van Wdl Yate Zol CP MP OMS SHS SCLA
Total 455 389 361 361 569 517 440 407 417 412 449 693 694 706 2249 228
#projectbehere
Perfect Attendance*
*Q1 vs Q2 vs Q3 vs Q4

HA
ML
HO
WE
KE
AN
LIN
C
ML
K
PAI
G
PLV
Y
VC
LR
W
DL
N
YA
TE
ZO
LR
CN
PK
MT
PL
ON
DA
SC
HS
SCL
A
2017-18 Q1 3 2 1 1 3 1 0 0 2 1 1 5 10 14 277 45
2017-18 Q2 10 2 3 3 23 3 7 9 2 8 5 18 27 28 372 61
2017-18 Q3 2 1 1 7 8 3 4 4 1 3 5 15 22 28 401 70
2017-18 Q4 6 4 4 8 25 4 11 5 2 12 7 36 31 43 461 64
050
100150200250300350400450500
Student Absences, 20+ Days*
*Q1 to Q2 to Q3 to Q4
HA
ML
HO
WE
KEA
N
LIN
C
ML
K
PAI
G
PLV
Y
VCL
R
WD
LN
YAT
E
ZO
LR
CN
PK
MT
PL
ON
DA
SC
HS
SCL
A
2017-18 Q1 16 9 14 6 21 12 9 12 18 9 12 30 39 28 312 59
2017-18 Q2 53 19 23 40 74 23 40 40 28 69 28 58 108 86 443 59
2017-18 Q3 39 7 17 15 36 15 34 42 22 28 20 45 66 55 425 52
2017-18 Q4 54 22 27 26 80 26 45 48 21 45 23 75 72 83 435 45
0
50
100
150
200
250
300
350
400
450
500
Student Absences, 11-19 Days*
*Q1 to Q2 to Q3 to Q4
HA
ML
HO
WE
KE
AN
LIN
C
ML
K
PAI
G
PLV
Y
VC
LR
W
DL
N
YA
TE
ZO
LR
CN
PK
MT
PL
ON
DA
SC
HS
SCL
A
2017-18 Q1 57 26 34 34 61 38 35 40 30 38 22 70 103 74 337 46
2017-18 Q2 132 76 71 112 144 106 109 82 80 123 93 148 158 138 492 56
2017-18 Q3 94 55 64 57 124 71 98 83 75 74 79 119 144 136 402 40
2017-18 Q4 110 75 46 68 126 100 101 74 77 83 83 125 110 122 391 40
0
100
200
300
400
500
600
Student Absences, 6-10 Days*
*Q1 to Q2 to Q3 to Q4
HA
ML
HO
WE
KE
AN
LIN
C
ML
K
PAI
G
PLV
Y
VC
LR
W
DL
N
YA
TE
ZO
LR
CN
PK
MT
PL
ON
DA
SC
HS
SCL
A
2017-18 Q1 283 273 196 227 340 321 295 242 248 264 293 416 403 406 1175 110
2017-18 Q2 248 249 226 192 299 334 280 252 275 187 286 469 371 383 932 79
2017-18 Q3 258 271 218 235 325 324 269 242 278 240 288 418 367 390 948 75
2017-18 Q4 237 217 233 239 305 308 247 233 260 225 280 412 415 380 838 73
0
200
400
600
800
1000
1200
1400
Student Absences, 1-5 Days*
*Q1 to Q2 to Q3 to Q4
13 buildings
saw a
decrease in
absences
6 buildings
saw an
decrease in
absences
2 buildings
saw an
decrease in
absences
1 buildings
saw an
decrease in
absences
51
#projectbehere
#projectbehere

52
End-of-Year
Teacher Attendance Data

HAM HOWE KEAN LINC MLK PAIG PLVY VCLR WDLN YATE ZOL CPMS MPMS ONMS SHS SCLA
Q1 80% 55% 34% 65% 63% 50% 58% 76% 53% 63% 64% 51% 56% 49% 51% 52%
Q2 46% 30% 41% 32% 37% 48% 53% 35% 29% 45% 44% 46% 49% 45% 44% 34%
Q3 48% 55% 41% 49% 49% 45% 53% 62% 29% 53% 56% 43% 38% 51% 61% 48%
Q4 54% 24% 7% 35% 39% 43% 17% 32% 21% 26% 31% 22% 32% 41% 40% 41%
0%
10%
20%
30%
40%
50%
60%
70%
80%
90%
100%
Perc
ent
of T
eac
hers
with L
ess
than
2 A
bse
nce
s
Building
% of SFT with less than 2 absences*
*Q1 vs Q2 vs Q3 vs Q453

54
Office of Pupil Personnel
Services Areas of Focus

55
OFFICE OF PUPIL PERSONNEL SERVICES
OVERVIEW OF INITIATIVES PRESENTED 2017-18
MindUp – Social Emotional Learning
Circle UP!
Continuum of Restorative Practices
Help for Billy
Trauma Sensitive Schools Institute & Implementation Teams
Sensory Rooms and Classroom Calming Spaces
Mindful Moments and Mindful Art
Urban School Conference
Trauma Informed Care & Community Resiliency
Staff, Parent & Student Wellness
PBIS & PAX Good Behavior Game
Attendance Committee & Attendance Interventions
#projectbehere
Disproportionality & Relative Risk
Reducing Suspensions
Code of Conduct Committee
TSS
Attendance Interventions
Behavior Interventions
55

56
o Attendance Committee
o Parent Portal
o Attendance Manual
o Attendance Intervention Plan
o Data Analysis & Target Setting
Attendance Matters: #projectbehere

57
58

59
THANK YOU!
QUESTIONS?