2017-2018 annual report use of physical restraint in ... · identification of trends, and analysis...
TRANSCRIPT
2017-2018
Annual Report
Use of Physical Restraint
in Delaware Public School Districts
and Charter Schools
As required under 14 Del. C. § 4112F(c)
Susan S. Bunting Ed.D.
Delaware Secretary of Education
Delaware Department of Education
Townsend Building
401 Federal Street, Suite 2
Dover, Delaware 19901

December 17, 2018 DDOE Annual Report on the Use of Physical Restraint 2
Note to the Reader
The 2017-2018 Annual Report on the Use of Physical Restraint in Delaware Public School
Districts and Charter Schools presents detailed information regarding incidents of physical
restraint reported from July 1, 2017 through June 30, 2018. Collecting this incident-level data
provides the Delaware Department of Education (DDOE) with a comprehensive picture of the
number and types of incidents of restraint occurring among different student populations
statewide. Since this is the fourth year that data on the use of physical restraint has been
collected, Delaware can make comparisons to the data collected in previous years in order to
further target solutions for districts and charter schools to mitigate areas of concern.
When examining organization-level data and any variances between groups and subgroups,
consideration must be given to district and charter restraint activity born out of a true necessity to
safely secure students from harm, as is the case during incidents of self-injurious behavior or to
prevent students from fleeing school grounds. Further examination and analysis of these data will
assist in informing the direction of DDOE’s future guidance to districts and charters regarding
best practices. Such technical assistance and trainings will promote the use of positive behavioral
supports and interventions. Delaware will also maintain its adherence to nationally recognized
models of de-escalation and physical restraint training, provide training supports to districts and
charter schools on reporting requirements, and review and analyze trend data.
The DDOE collected data on the reported use of physical restraint from July 1, 2017 through
June 30, 2018. The data contained in this report reflects the information provided by all Local
Education Agencies (LEAs) in the state of Delaware during the 2017-2018 school year as
required by 14 Del. C. § 4112F(c). Additionally, 14 Del. Admin. C. § 610 Limitation on the Use
of Seclusion and Restraint contains the following reporting requirements:
7.0 Annual Reporting Requirement
The Department shall issue an annual report on the use of physical restraint,
which shall include rates of usage by school and by subcategories identified
pursuant to Section 6.0, identify trends, and analyze significant results. The
report shall be posted on the Department’s website.
http://www.doe.k12.de.us/domain/167
December 17, 2018 DDOE Annual Report on the Use of Physical Restraint 3
Table of Contents
Background and Overview………..…………………………………………………………Page 4
Methodology…………………...……………………………………………………………Page 5
Definitions and Concepts…………………………………………………………………... Page 8
Summary…………………………………………………….………………………………Page 9
Recommendations………………………………………………………………………….Page 10
Student Demographics………………………………………………………..……………Page 11
Total Number of Reported Incidents………………………………………………….……Page 14
Appendix A…………………………….…………………………………………………..Page 16
Appendix B………………………………………………………………………………...Page 44

December 17, 2018 DDOE Annual Report on the Use of Physical Restraint 4
Background and Overview
Title 14, Delaware Administrative Code, Section 610, Limitations on the Use of Seclusion and
Restraint, established regulations and set standards and procedures for the use of physical
restraint. The regulations prohibit the use of chemical restraint, mechanical restraint, and
seclusion; however, the latter two are subject to use if authorized through the DDOE waiver
granting process. For more information regarding the waiver granting process, please refer to 14
Del. Admin. C. § 610.8.0. In addition to permitting and prohibiting uses of restraint and
seclusion, these regulations require training for public school, private program or alternative
program personnel, documentation and reporting of incidents of restraint and seclusion,
requirements of notification to parents, and waiver procedures for the use of mechanical restraint
or seclusion. These regulations provide for the safety of all students in our public school system.
As per the regulations, DDOE is required to publish an annual public report on the incidents of
physical restraints of students used by schools. The report is to include the following: rates of
usage by school and by subcategories of age, race/ethnicity, and disability category,
identification of trends, and analysis of significant results.
During the 2017-2018 school year, physical restraints were reported for regular education
students and students with disabilities through eSchool Plus (Delaware pupil accounting system).
When a student’s behavior(s) presents a significant and imminent risk of bodily harm to self or
others necessitating the use of physical restraint, Districts and Charter schools are required to
complete the restraint and seclusion reporting screen in eSchool Plus. This report must be
completed and submitted within 72 hours of the restraint occurrence or within 72 hours from the
time the student’s district of residence receives notification of the restraint from the contracted
specialized private or alternative program.
These regulations require annual staff training in the use of crisis prevention and intervention
techniques consistent with nationally recognized training programs. LEAs determine staff
members to be trained. The training must include prevention techniques, de-escalation
techniques, and positive behavioral intervention strategies and supports. This training should be
designed to meet the needs of personnel consistent with their duties and the potential need for
emergency safety interventions. Except as provided in 14 Del.C.§ 702(c), a student may be
physically restrained only by public school personnel, contracted private program personnel or
alternative program personnel who have completed training in physical emergency safety
interventions.
December 17, 2018 DDOE Annual Report on the Use of Physical Restraint 5
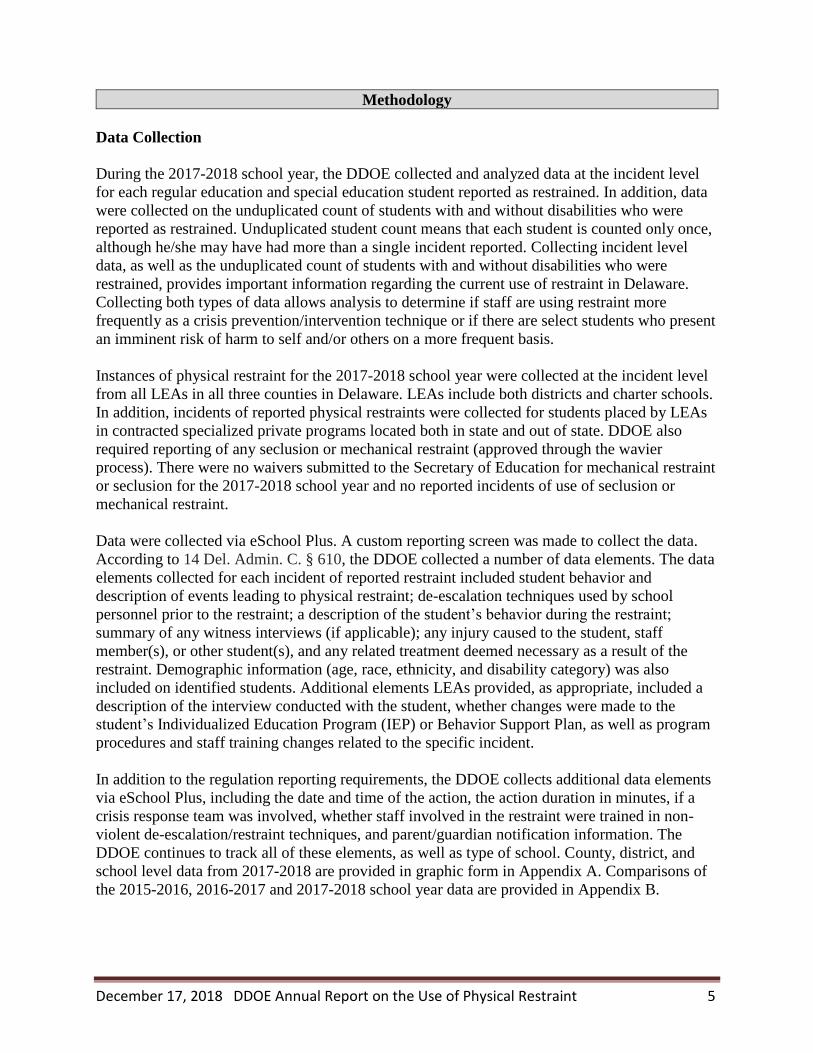
Methodology
Data Collection
During the 2017-2018 school year, the DDOE collected and analyzed data at the incident level
for each regular education and special education student reported as restrained. In addition, data
were collected on the unduplicated count of students with and without disabilities who were
reported as restrained. Unduplicated student count means that each student is counted only once,
although he/she may have had more than a single incident reported. Collecting incident level
data, as well as the unduplicated count of students with and without disabilities who were
restrained, provides important information regarding the current use of restraint in Delaware.
Collecting both types of data allows analysis to determine if staff are using restraint more
frequently as a crisis prevention/intervention technique or if there are select students who present
an imminent risk of harm to self and/or others on a more frequent basis.
Instances of physical restraint for the 2017-2018 school year were collected at the incident level
from all LEAs in all three counties in Delaware. LEAs include both districts and charter schools.
In addition, incidents of reported physical restraints were collected for students placed by LEAs
in contracted specialized private programs located both in state and out of state. DDOE also
required reporting of any seclusion or mechanical restraint (approved through the wavier
process). There were no waivers submitted to the Secretary of Education for mechanical restraint
or seclusion for the 2017-2018 school year and no reported incidents of use of seclusion or
mechanical restraint.
Data were collected via eSchool Plus. A custom reporting screen was made to collect the data.
According to 14 Del. Admin. C. § 610, the DDOE collected a number of data elements. The data
elements collected for each incident of reported restraint included student behavior and
description of events leading to physical restraint; de-escalation techniques used by school
personnel prior to the restraint; a description of the student’s behavior during the restraint;
summary of any witness interviews (if applicable); any injury caused to the student, staff
member(s), or other student(s), and any related treatment deemed necessary as a result of the
restraint. Demographic information (age, race, ethnicity, and disability category) was also
included on identified students. Additional elements LEAs provided, as appropriate, included a
description of the interview conducted with the student, whether changes were made to the
student’s Individualized Education Program (IEP) or Behavior Support Plan, as well as program
procedures and staff training changes related to the specific incident.
In addition to the regulation reporting requirements, the DDOE collects additional data elements
via eSchool Plus, including the date and time of the action, the action duration in minutes, if a
crisis response team was involved, whether staff involved in the restraint were trained in non-
violent de-escalation/restraint techniques, and parent/guardian notification information. The
DDOE continues to track all of these elements, as well as type of school. County, district, and
school level data from 2017-2018 are provided in graphic form in Appendix A. Comparisons of
the 2015-2016, 2016-2017 and 2017-2018 school year data are provided in Appendix B.

December 17, 2018 DDOE Annual Report on the Use of Physical Restraint 6
Data Monitoring
Several audits were applied to ensure data integrity. The data were reviewed monthly to identify
data reporting inconsistencies. In addition, the DDOE continues to make available a Cognos
detail report that LEAs can utilize to review and analyze their own restraint reporting data.
The DDOE continues to ensure accurate reporting practices through the following protocols:
Discipline Report Verification
The DDOE continues to conduct review of the discipline report for words that may be
synonymous to “restraints” (e.g. hold, held, restrained, restraint etc.). Next, the DDOE verifies
that if it is recorded in the discipline report, there is a corresponding report of the restraint in the
restraint reporting system. If a school reports a restraint in the discipline report but it is not also
recorded in the restraint reporting system, an email is sent to the school climate and discipline
contact in the district/charter informing them that the restraint must be entered or clarification as
to why this was not considered a restraint must be provided within 5 business days.
If the information is not entered or clarified within 5 business days, a letter is then sent to the
school climate and discipline contact and copied to the Superintendent indicating that the
information must be entered within 5 business days.
If the information is still not entered within the required timeframe, a letter is sent to the
Superintendent/Board of Directors indicating that the district/charter must engage in professional
development, regarding the policies and procedures of restraint reporting. Once the information
is entered and verification that professional development was completed, a close out letter is sent
to the Superintendent/Board of Directors.
Interagency Collaborative Team (ICT) Files Verification
The Interagency Collaborative Team (ICT) is composed of Directors or their designees of
various divisions of state agencies, including but not limited to, the Delaware Department of
Education; Department of Health and Social Services; Department of Services for Children,
Youth, and their Families; Office of Controller General; and the Office of Management and
Budget. This team reviews LEA requests for support for placements of children with disabilities
in need of Unique Educational Alternatives because the LEAs cannot address these students’
needs with existing resources and programs. Unique Educational Alternatives include but are not
limited to private residential placements and private day programs (14 Del. Admin. C. §
929.3.0).
On a quarterly basis, DDOE reviews student records for youth placed in approved in-state
programs to verify that incidents of restraint are reported. Additional records are also reviewed
for students placed in approved out of state ICT programs. If a restraint is not recorded, an email
is sent to ICT Coordinator/Special Education Director indicating the information must be entered
within 5 business days.

December 17, 2018 DDOE Annual Report on the Use of Physical Restraint 7
If the information is not entered within the required timeframe, a letter is sent to the
Superintendent indicating the district must engage in professional development regarding
policies and procedures of restraint reporting for ICT students.
Once information is entered and verification that professional development was completed, a
close out letter is sent to the Superintendent.
Supports Provided for LEAs
Given the extensive amount of data collection required by the LEAs and the contracted
specialized private programs, the DDOE provided support through multiple trainings and
technical assistance as needed. The DDOE provided training on 14 Del. Admin. Code§ 610
during the annual School Climate and Discipline summer professional development session.
Training was provided in the mandatory School Crime and Discipline reporting trainings held
during the summer of 2018. Additionally, the DDOE provided professional development related
to positive behavioral supports to LEAs through more than 20 trainings focused on multi-tiered
systems of behavior support.
Per 14 Del. Admin. Code. § 610.4.2 the DDOE also provides a training webinar on how to report
restraints via eSchool Plus. This webinar is provided through the DDOE Professional
Development Management System (PDMS) and updated yearly to include helpful information
gleaned from review and analysis of incident data entered in the previous school year.

December 17, 2018 DDOE Annual Report on the Use of Physical Restraint 8
Definitions and Concepts
“Alternative Program” means a program established pursuant to 14 Del.C. Ch. 16.
“Chemical restraint” means a drug or medication used on a student to control behavior or
restrict freedom of movement that is either not medically prescribed for the standard treatment of
a student’s medical or psychiatric condition or not administered as prescribed. (Authority: 14
Del.C.§4112F(a)(1)).
“Mechanical restraint” means the application of any device or object that restricts a student’s
freedom of movement or normal access to a portion of the body that the student cannot easily
remove. “Mechanical restraint” does not include devices or objects used by trained school
personnel, or used by a student, for the specific and approved therapeutic or safety purposes for
which they were designed and, if applicable prescribed, including the following:
• restraints for medical immobilization;
• adaptive devices or mechanical supports used to allow greater freedom of movement stability
than would be possible without use of such devices or mechanical supports;
• vehicle safety restraints when used as intended during the transport of a student in a moving
vehicle;
• instruction and use of restraints as part of a criminal justice or other course; or
• notwithstanding their design for other purposes, adaptive use of benign devices or objects,
including mittens and caps, to deter self-injury.
(Authority: 14 Del.C.§4112F(a)(2))
“Physical restraint” means a restriction imposed by a person that immobilizes or reduces the
ability of a student to freely move arms, legs, body, or head. “Physical restraint” does not include
physical contact that:
• helps a student respond or complete a task;
• is needed to administer an authorized health-related service or procedure; or
• is needed to physically escort a student when the student does not resist or the student’s
resistance is minimal.
(Authority: 14 Del.C.§4112F(a)(3)
“Private program” means a non-public school or program contracted by a school district or
charter school.
“Seclusion” means the involuntary confinement of a student alone in a room, enclosure, or space
that is either locked or, while unlocked, physically disallows egress. The use of a “timeout”
procedure during which a staff member remains accessible to the student shall not be considered
“seclusion.” (Authority: 14 Del.C. §4112F(a)(5))
“Timeout” means a behavior management technique in which, to provide a student with the
opportunity to reflect or regain self-control, a student is separated from others for a limited
period in a setting that is not locked and the exit is not physically blocked by furniture, closed
door held shut from outside, or other inanimate object.
(Authority: 14 Del.C.§4112F(a)(6))

December 17, 2018 DDOE Annual Report on the Use of Physical Restraint 9
Summary
Since the inception of this reporting protocol as part of Title 14, Del.Admin.C.§610, Limitations
on the Use of Seclusion and Restraint. Upon analysis of patterns and trends of both annual and
historical data, DDOE has and will continue to revise training and reporting forms to ensure
accuracy of data and ease of reporting for program personnel.
During the 2017-2018 school year, 2,680 incidents of physical restraint were reported. Appendix
A details the rate of usage of physical restraint procedures at the county, district, and school
levels. Findings include:
A greater percentage of students with disabilities (80%) were restrained as compared to
regular education students (20%).
A greater percentage of males (81%) were restrained compared to females (19%). These
percentages remained consistent with 2016-2017 data.
The DDOE requests districts and charter schools submit a copy of their policies, procedures,
training requirements, and any other supporting documentation related to the use and reporting of
restraint and seclusion.
Historical Perspective:
The DDOE has collected data related to the use of physical restraint procedures for four years,
beginning in the 2014-2015 school year. As data and reporting have become more complete and
consistent in the subsequent three years, the following information gained from a comparative
review of the 2016-2017 and 2017-2018 data will inform future DDOE professional
development and ongoing technical assistance planning.
Total number of restraints in 2017-2018 is the lowest since 2014-2015.
There was an 11% decrease in incidents reported.
There was a 17% increase in the number of unduplicated students physically restrained.
While there was a 2% decrease in the total population of Black/African American
students, there was <1% increase in Black/African American students who were
restrained; the percentage of Hispanic students requiring physical restraint increased by
3%, while the percentage of white students requiring physical restraint decreased by 4%.
The percentage of males and females requiring physical restraint remained virtually
unchanged in 2017-2018 from 2016-2017 data.
There was a 1% decrease in incidents reported of 10 minutes or more, while shorter
durations of less than 5 minutes data indicated a 2% increase.
The percentage of students in special schools and elementary schools requiring physical
restraint remained virtually unchanged since 2016-2017. However, since 2015-2016, the

December 17, 2018 DDOE Annual Report on the Use of Physical Restraint 10
percentage of students in special schools requiring physical restraints has decreased.
annually and 11.5% overall, while students requiring physical restraint in elementary
schools has increased 9.9%.
Recommendations
DDOE will continue to monitor, via the Discipline Report Verification and ICT Files
Verification processes, in order to identify data reporting inconsistencies.
Through the Delaware Positive Behavior Support Project, the DDOE will continue to
provide technical assistance on multi-tiered systems of behavior support. In addition, the
DDOE will update and expand, as appropriate, training materials on Schoology that focus
on the following topics: functional behavior assessment, data collection, behavior support
plan development, and progress monitoring and evaluation.
DDOE will continue to provide training and technical assistance on restraint reporting via
the School Climate and Discipline Summer Professional Development and Special
Education Leadership Meetings.
Beginning in 2016-2017, DDOE instituted an additional practice when a student has been
restrained 50 or more times within a reporting year. DDOE will notify the LEA and
encourage the school staff to access the technical assistance tools in Schoology. If the
student/s receive special education services, the notification will encourage the IEP team
to review the current IEP and determine if additional supports are necessary.
The DDOE will work with LEAs to utilize this information to enhance their multi-tiered
systems of support and focus efforts on providing antecedent modifications, teaching
alternative skills, teaching coping strategies and communication skills, and implementing
de-escalation techniques.
DDOE will review the reporting forms to explore potential revisions for accuracy and
efficiency of reporting for program personnel.

December 17, 2018 DDOE Annual Report on the Use of Physical Restraint 11
Student Demographics
Unduplicated Counts of Student Restraints Disaggregated by Subgroup
The tables below represent the ethnicity, gender, age, and disability category of students who
received restraint procedures during the 2017-2018 school year. Please note that the numbers
represent the total number of unduplicated students. Unduplicated student count means that each
student is counted only once, although he/she may have had more than a single incident reported.
The data presented in all tables represents the time period from July 1, 2017 through June 30,
2018.
Please note the following suppression rules for all tables:
1. For all data, counts for groups or subgroups with 15 or fewer students are suppressed and
represented by “-” in data reports. Complementary suppression of one or more non-
sensitive cells in a table may be required so that the values of the suppressed cells may
not be calculated by subtracting the reported values from the row and column totals.
2. Only report percentages for grade level reporting within a school and district.
3. Percentages are suppressed when the underlying student counts can be derived for groups
or subgroups with 15 or fewer students (i.e., if the number tested and proficient are
reported, then the percentage may need to be suppressed).
4. Any percentage above 95 or below 5 will be reported as >95% and <5%, respectively.
Table 1. Race and Ethnicity
Number of Students
Restrained
Percentage of All Students
Restrained
Two or More Races 51 6%
Black or African American 439 50%
American Indian/Alaskan Native - <5%
Asian - <5%
Hawaiian/Pacific Islander - <5%
Hispanic 98 11%
White 283 32%
Total 880 100%
Table 1 displays the race/ethnicity of students who received restraint procedures. Of students
requiring physical restraint intervention, 50% were Black or African American, 32% were
White, and 11% were Hispanic.
December 17, 2018 DDOE Annual Report on the Use of Physical Restraint 12
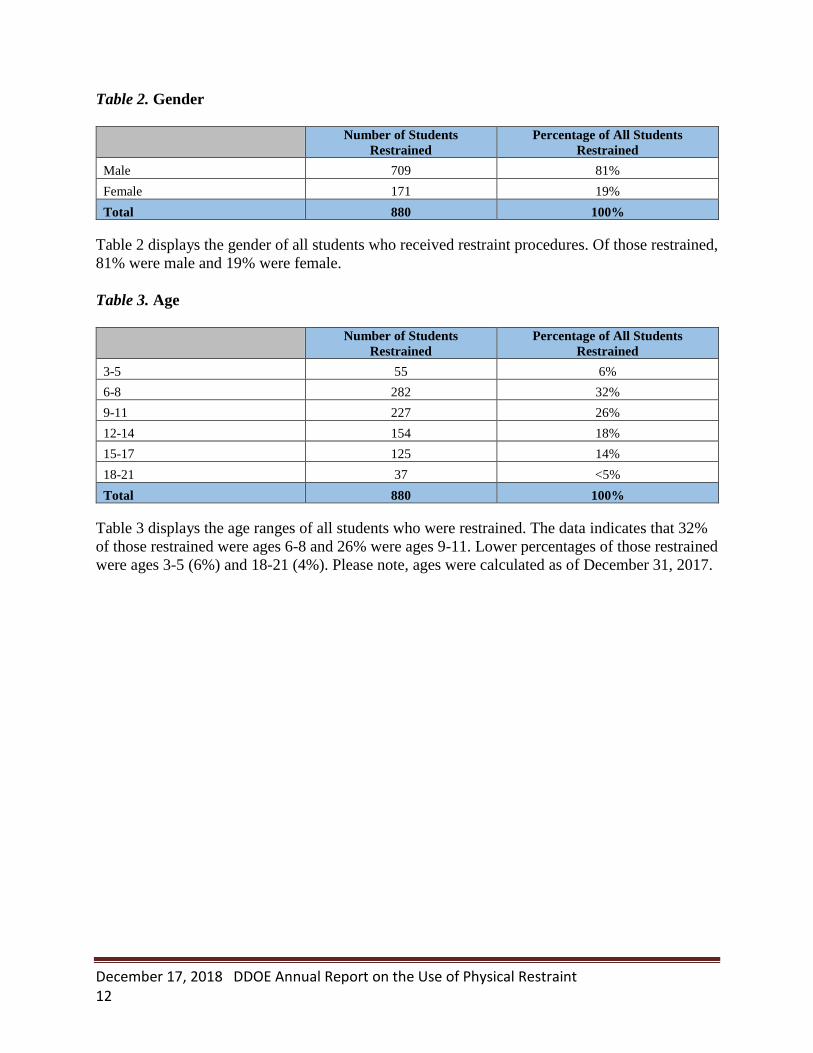
Table 2. Gender
Number of Students
Restrained
Percentage of All Students
Restrained
Male 709 81%
Female 171 19%
Total 880 100%
Table 2 displays the gender of all students who received restraint procedures. Of those restrained,
81% were male and 19% were female.
Table 3. Age
Number of Students
Restrained
Percentage of All Students
Restrained
3-5 55 6%
6-8 282 32%
9-11 227 26%
12-14 154 18%
15-17 125 14%
18-21 37 <5%
Total 880 100%
Table 3 displays the age ranges of all students who were restrained. The data indicates that 32%
of those restrained were ages 6-8 and 26% were ages 9-11. Lower percentages of those restrained
were ages 3-5 (6%) and 18-21 (4%). Please note, ages were calculated as of December 31, 2017.
December 17, 2018 DDOE Annual Report on the Use of Physical Restraint 13
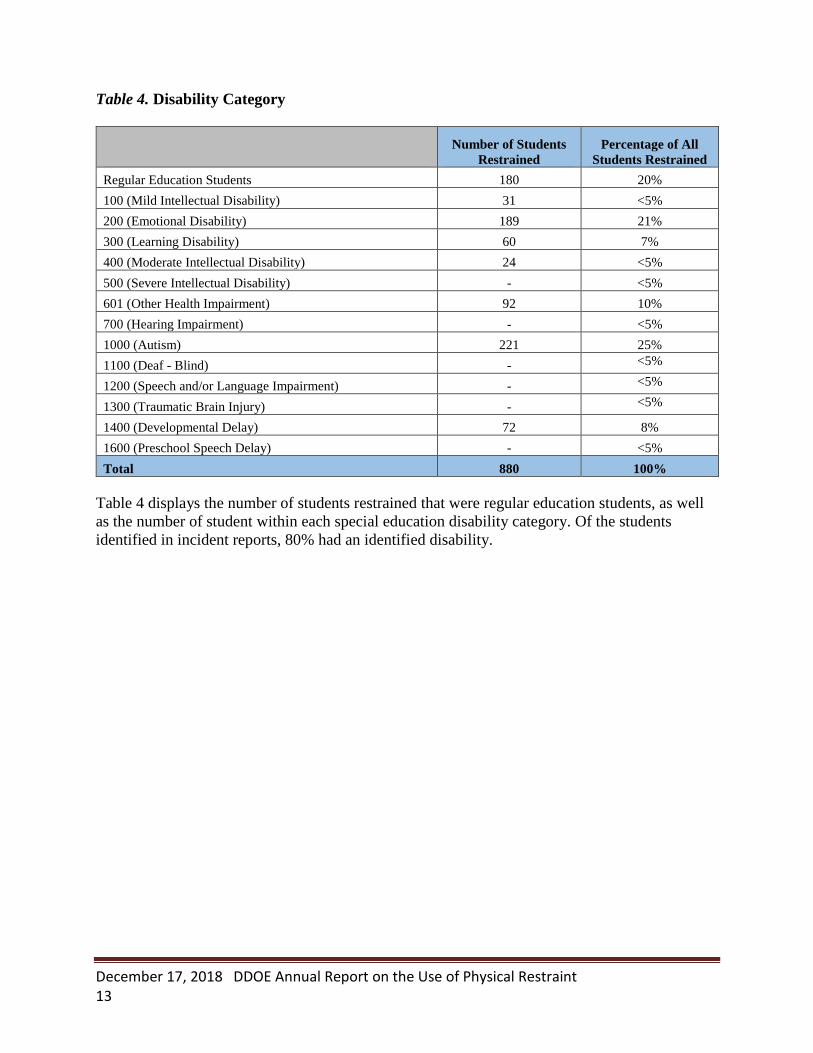
Table 4. Disability Category
Number of Students
Restrained
Percentage of All
Students Restrained
Regular Education Students 180 20%
100 (Mild Intellectual Disability) 31 <5%
200 (Emotional Disability) 189 21%
300 (Learning Disability) 60 7%
400 (Moderate Intellectual Disability) 24 <5%
500 (Severe Intellectual Disability) - <5%
601 (Other Health Impairment) 92 10%
700 (Hearing Impairment) - <5%
1000 (Autism) 221 25%
1100 (Deaf - Blind) - <5%
1200 (Speech and/or Language Impairment) - <5%
1300 (Traumatic Brain Injury) - <5%
1400 (Developmental Delay) 72 8%
1600 (Preschool Speech Delay) - <5%
Total 880 100%
Table 4 displays the number of students restrained that were regular education students, as well
as the number of student within each special education disability category. Of the students
identified in incident reports, 80% had an identified disability.
December 17, 2018 DDOE Annual Report on the Use of Physical Restraint 14
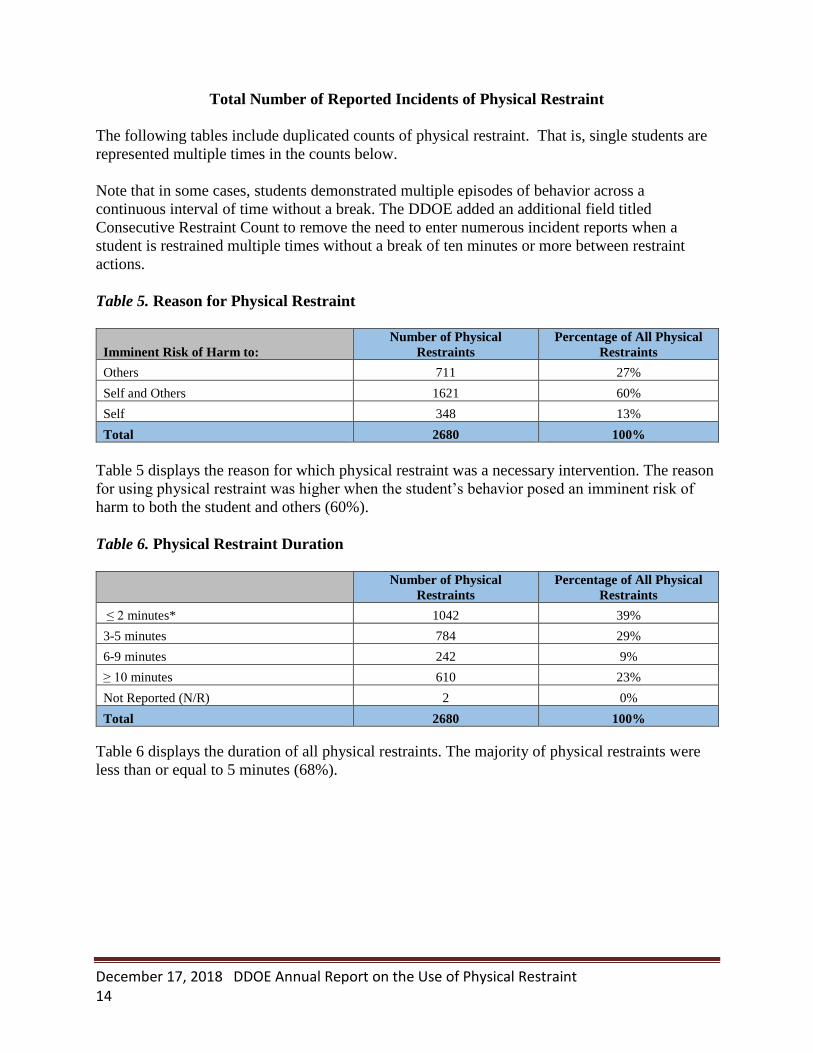
Total Number of Reported Incidents of Physical Restraint
The following tables include duplicated counts of physical restraint. That is, single students are
represented multiple times in the counts below.
Note that in some cases, students demonstrated multiple episodes of behavior across a
continuous interval of time without a break. The DDOE added an additional field titled
Consecutive Restraint Count to remove the need to enter numerous incident reports when a
student is restrained multiple times without a break of ten minutes or more between restraint
actions.
Table 5. Reason for Physical Restraint
Imminent Risk of Harm to:
Number of Physical
Restraints
Percentage of All Physical
Restraints
Others 711 27%
Self and Others 1621 60%
Self 348 13%
Total 2680 100%
Table 5 displays the reason for which physical restraint was a necessary intervention. The reason
for using physical restraint was higher when the student’s behavior posed an imminent risk of
harm to both the student and others (60%).
Table 6. Physical Restraint Duration
Number of Physical
Restraints
Percentage of All Physical
Restraints
≤ 2 minutes* 1042 39%
3-5 minutes 784 29%
6-9 minutes 242 9%
≥ 10 minutes 610 23%
Not Reported (N/R) 2 0%
Total 2680 100%
Table 6 displays the duration of all physical restraints. The majority of physical restraints were
less than or equal to 5 minutes (68%).

December 17, 2018 DDOE Annual Report on the Use of Physical Restraint 15
Table 7. Time of Day
Number of Physical
Restraints
Percentage of All Physical
Restraints
AM 1397 52%
PM 1283 48%
Total 2680 100%
Table 7 displays the number, as well as the percentage of physical restraints that occurred in the
morning and in the afternoon and evening.
Table 8. Physical Restraints per Month*
Number of Physical
Restraints
Percentage of All Physical
Restraints
July 89 3%
August 75 3%
September 386 14%
October 402 15%
November 296 11%
December 235 9%
January 228 9%
February 229 9%
March 224 8%
April 208 8%
May 253 9%
June 55 2%
Total 2680 100%
Table 8 displays the number of physical restraints that occurred during each month.

December 17, 2018 DDOE Annual Report on the Use of Physical Restraint 16
Statewide
New Castle County 1898 Kent County 284
Sussex County 454 Charter Schools 44
Total 2680
Appendix A

December 17, 2018 DDOE Annual Report on the Use of Physical Restraint 17
Appoquinimink School District
Early Childhood
Centers
Number of Physical
Restraints
Appoquinimink -
Cedar Lane -
Spring Meadow -
Townsend -
Elementary Schools
Brick Mill -
Bunker Hill -
Cedar Lane 21
Olive B. Loss -
Old State 155
Silver Lake -
Townsend -
Middle Schools
Everett Meredith -
Louis L. Redding -
Alfred G. Waters -
High Schools
Appoquinimink -
Middletown -
Total Physical
Restraints 242
Total Number of
Students 56
Race and Ethnicity
Number of Students
Restrained
Two or More Races -
Black or African American 20
American Indian/Alaskan Native -
Asian -
Hawaiian/Pacific Islander -
Hispanic -
White 32
Total 56
Age Range
Number of Students
Restrained
3-5 -
6-8 31
9-11 -
12-14 -
15-17 -
18-21 -
Total 56
Gender
Number of Students
Restrained
Male -
Female -
Total 56
Disability Category Number of Students Restrained
Regular Education Students -
100 (Mild Intellectual Disability) -
200 (Emotional Disability) -
300 (Learning Disability) -
400 (Moderate Intellectual Disability) -
500 (Severe Intellectual Disability) -
601 (Other Health Impairment) -
700 (Hearing Impairment) -
1000 (Autism) -
1100 (Deaf - Blind) -
1200 (Speech and/or Language Impairment) -
1300 (Traumatic Brain Injury) -
1400 (Developmental Delay) -
Total 56
New Castle County

December 17, 2018 DDOE Annual Report on the Use of Physical Restraint 18
Brandywine School District
Early Childhood Centers
Number of
Physical Restraints
Charles W. Bush -
Elementary Schools
Carrcroft -
Claymont -
Forwood -
Hanby -
Harlan -
Lancashire -
Lombardy -
Maple Lane -
Mount Pleasant 142
Middle Schools
P.S. duPont -
Springer -
Talley -
High Schools
Brandywine -
Concord -
Mount Pleasant -
Special Programs
Brandywine Community -
Total Physical Restraints 186
Total Number of Students 59
Race and Ethnicity
Number of Students
Restrained
Two or More Races -
Black or African American 33
American Indian/Alaskan Native -
Asian -
Hawaiian/Pacific Islander -
Hispanic -
White 16
Total 59
Age Range
Number of Students
Restrained
3-5 -
6-8 26
9-11 23
12-14 -
15-17 -
18-21 -
Total 59
Gender
Number of Students
Restrained
Male -
Female -
Total 59
Disability Category Number of Students Restrained
Regular Education Students -
100 (Mild Intellectual Disability) -
200 (Emotional Disability) 16
300 (Learning Disability) -
400 (Moderate Intellectual Disability) -
500 (Severe Intellectual Disability) -
601 (Other Health Impairment) 17
700 (Hearing Impairment) -
1000 (Autism) -
1100 (Deaf - Blind) -
1200 (Speech and/or Language Impairment) -
1300 (Traumatic Brain Injury) -
1400 (Developmental Delay) -

December 17, 2018 DDOE Annual Report on the Use of Physical Restraint 19
Total 59
Christina School District
Early Childhood Centers
Number of
Physical Restraints
Christina -
Elementary Schools
Bancroft -
Henry M. Brader -
Brookside -
John R. Downes -
Elbert-Palmer -
Albert H. Jones -
Robert S. Gallaher -
William B. Keene -
Mary B. Leasure 63
R. Elisabeth Maclary 25
Thurgood Marshall -
Joseph M. McVey 35
William A. Oberle, Jr. -
Casimir Pulaski -
Jennie E. Smith -
Frederick Douglass Stubbs -
West Park Place -
Etta J. Wilson -
Middle Schools
Bayard -
Gauger-Cobbs -
George V. Kirk -
Shue-Medill -
High Schools
Christiana -
Glasgow -
Newark -
Special Schools
Brennen 695
Delaware School for the Deaf -
J. H. Douglass -
Special Programs
Alternative Programs -
Networks -
REACH Program -
Total Physical Restraints 911
Total Number of Students 207
Race and Ethnicity
Number of Students
Restrained
Two or More Races -
Black or African American 93
American Indian/Alaskan Native -
Asian -
Hawaiian/Pacific Islander -
Hispanic 34
White 67
Total 207
Age Range
Number of Students
Restrained
3-5 -
6-8 62
9-11 46
12-14 49
15-17 25
18-21 17
Total 207
Gender
Number of Students
Restrained
Male 180
Female 27
Total 207
December 17, 2018 DDOE Annual Report on the Use of Physical Restraint 20
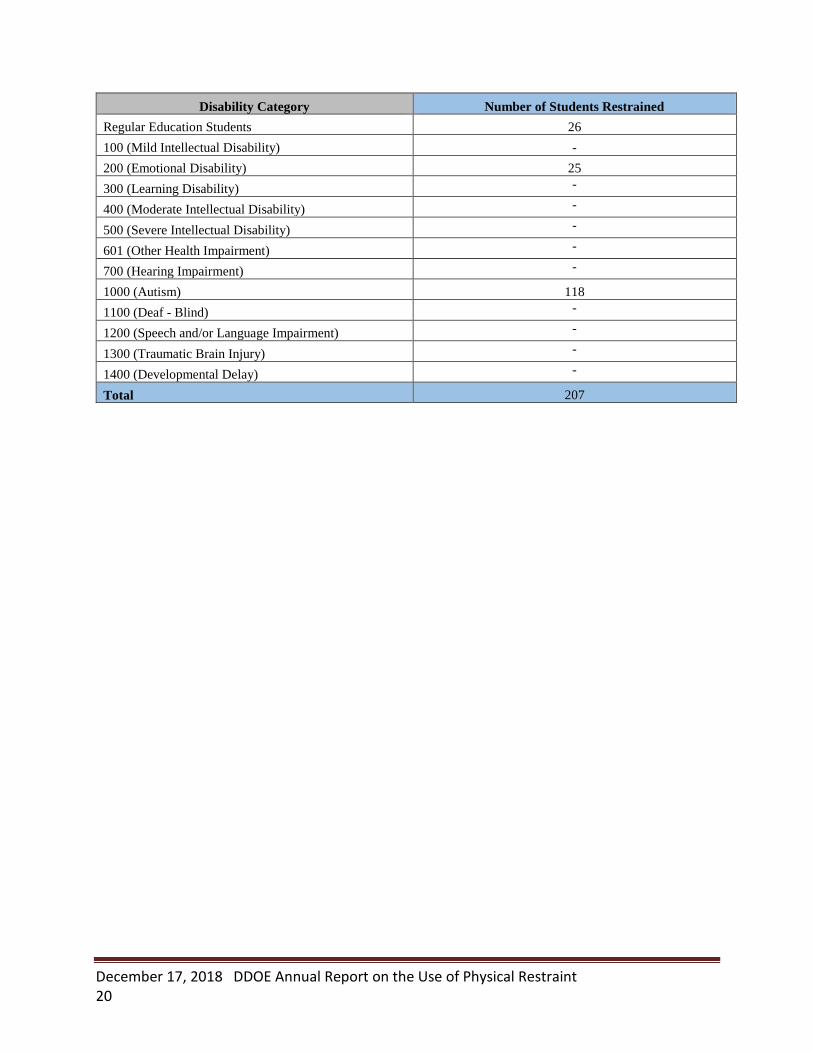
Disability Category Number of Students Restrained
Regular Education Students 26
100 (Mild Intellectual Disability) -
200 (Emotional Disability) 25
300 (Learning Disability) -
400 (Moderate Intellectual Disability) -
500 (Severe Intellectual Disability) -
601 (Other Health Impairment) -
700 (Hearing Impairment) -
1000 (Autism) 118
1100 (Deaf - Blind) -
1200 (Speech and/or Language Impairment) -
1300 (Traumatic Brain Injury) -
1400 (Developmental Delay) -
Total 207

December 17, 2018 DDOE Annual Report on the Use of Physical Restraint 21
Colonial School District
Early Childhood Centers
Number of
Physical Restraints
Colonial Early Education
Program -
Elementary Schools
Carrie Downie -
Castle Hills -
The Colwyck Center -
Harry O. Eisenberg -
New Castle -
Pleasantville 25
Southern 26
Southern ILC 170
Kathleen H. Wilbur 19
Wilmington Manor -
Middle Schools
George Reed -
Gunning-Bedford 20
Calvin R. McCullough -
High Schools
William Penn -
Special Schools
John G. Leach -
The Wallace Wallin School -
Total Physical Restraints 317
Total Number of Students 104
Race and Ethnicity
Number of Students
Restrained
Two or More Races -
Black or African American 67
American Indian/Alaskan Native -
Asian -
Hawaiian/Pacific Islander -
Hispanic -
White 20
Total 104
Age Range
Number of Students
Restrained
3-5 -
6-8 31
9-11 37
12-14 -
15-17 -
18-21 -
Total 104
Gender
Number of Students
Restrained
Male 80
Female 24
Total 104

December 17, 2018 DDOE Annual Report on the Use of Physical Restraint 22
Disability Category Number of Students Restrained
Regular Education Students 22
100 (Mild Intellectual Disability) -
200 (Emotional Disability) 38
300 (Learning Disability) -
400 (Moderate Intellectual Disability) -
500 (Severe Intellectual Disability) -
601 (Other Health Impairment) -
700 (Hearing Impairment) -
1000 (Autism) -
1100 (Deaf - Blind) -
1200 (Speech and/or Language Impairment) -
1300 (Traumatic Brain Injury) -
1400 (Developmental Delay) -
Total 104
December 17, 2018 DDOE Annual Report on the Use of Physical Restraint 23
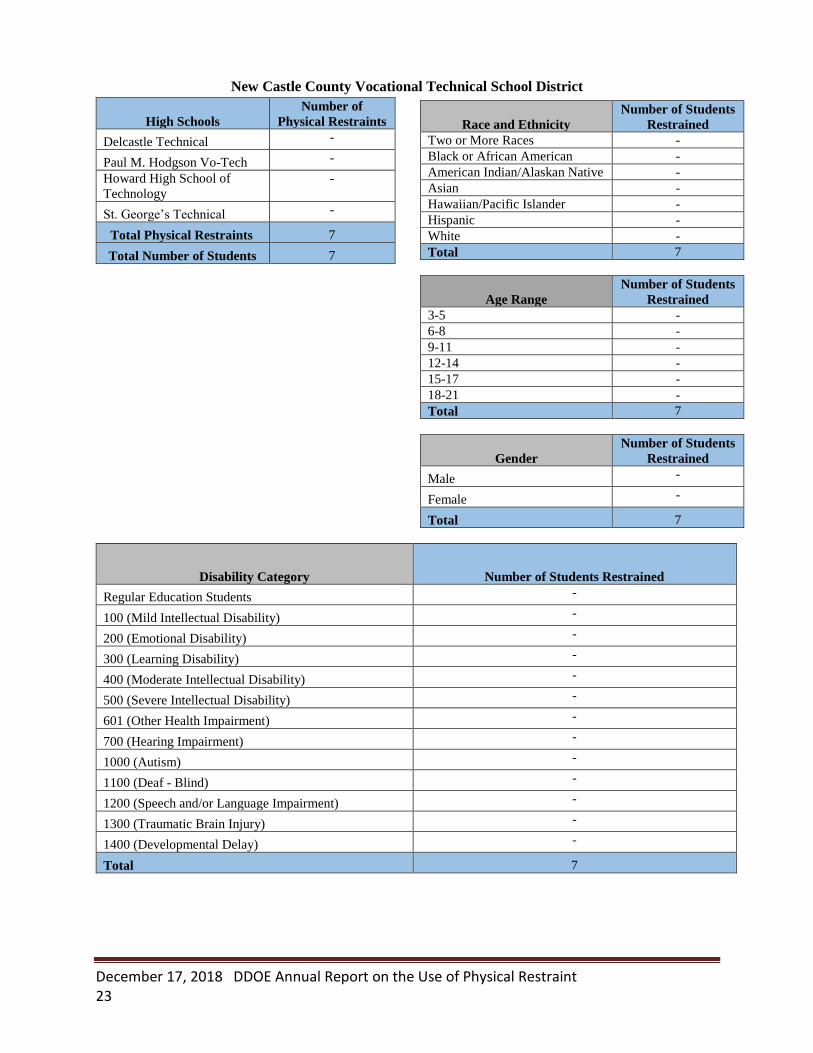
New Castle County Vocational Technical School District
High Schools
Number of
Physical Restraints
Delcastle Technical -
Paul M. Hodgson Vo-Tech -
Howard High School of
Technology
-
St. George’s Technical -
Total Physical Restraints 7
Total Number of Students 7
Race and Ethnicity
Number of Students
Restrained
Two or More Races -
Black or African American -
American Indian/Alaskan Native -
Asian -
Hawaiian/Pacific Islander -
Hispanic -
White -
Total 7
Age Range
Number of Students
Restrained
3-5 -
6-8 -
9-11 -
12-14 -
15-17 -
18-21 -
Total 7
Gender
Number of Students
Restrained
Male -
Female -
Total 7
Disability Category Number of Students Restrained
Regular Education Students -
100 (Mild Intellectual Disability) -
200 (Emotional Disability) -
300 (Learning Disability) -
400 (Moderate Intellectual Disability) -
500 (Severe Intellectual Disability) -
601 (Other Health Impairment) -
700 (Hearing Impairment) -
1000 (Autism) -
1100 (Deaf - Blind) -
1200 (Speech and/or Language Impairment) -
1300 (Traumatic Brain Injury) -
1400 (Developmental Delay) -
Total 7
December 17, 2018 DDOE Annual Report on the Use of Physical Restraint 24
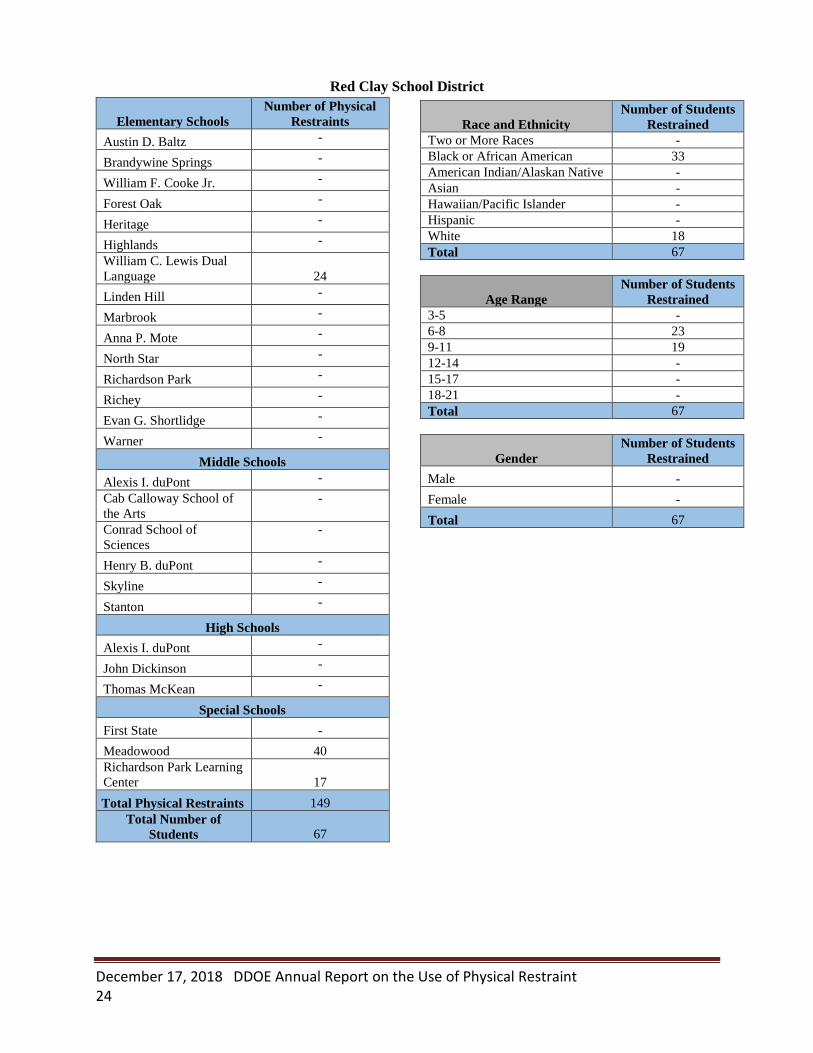
Red Clay School District
Elementary Schools
Number of Physical
Restraints
Austin D. Baltz -
Brandywine Springs -
William F. Cooke Jr. -
Forest Oak -
Heritage -
Highlands -
William C. Lewis Dual
Language 24
Linden Hill -
Marbrook -
Anna P. Mote -
North Star -
Richardson Park -
Richey -
Evan G. Shortlidge -
Warner -
Middle Schools
Alexis I. duPont -
Cab Calloway School of
the Arts
-
Conrad School of
Sciences
-
Henry B. duPont -
Skyline -
Stanton -
High Schools
Alexis I. duPont -
John Dickinson -
Thomas McKean -
Special Schools
First State -
Meadowood 40
Richardson Park Learning
Center 17
Total Physical Restraints 149
Total Number of
Students 67
Race and Ethnicity
Number of Students
Restrained
Two or More Races -
Black or African American 33
American Indian/Alaskan Native -
Asian -
Hawaiian/Pacific Islander -
Hispanic -
White 18
Total 67
Age Range
Number of Students
Restrained
3-5 -
6-8 23
9-11 19
12-14 -
15-17 -
18-21 -
Total 67
Gender
Number of Students
Restrained
Male -
Female -
Total 67
December 17, 2018 DDOE Annual Report on the Use of Physical Restraint 25
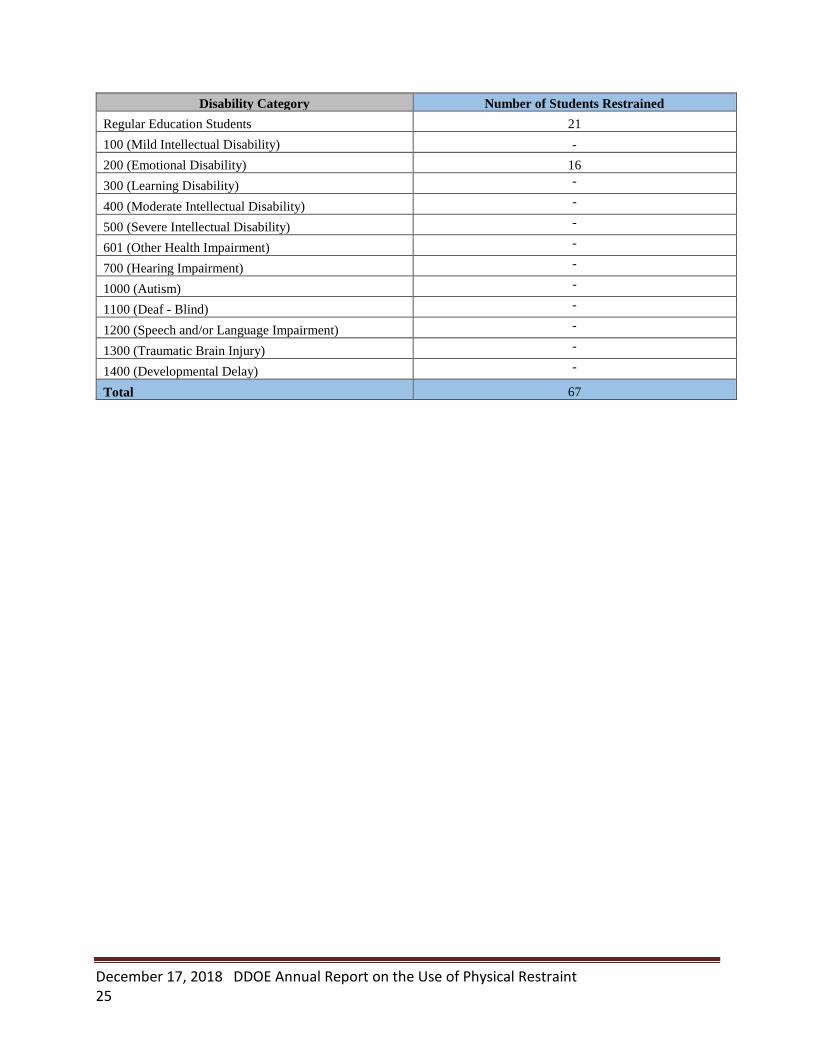
Disability Category Number of Students Restrained
Regular Education Students 21
100 (Mild Intellectual Disability) -
200 (Emotional Disability) 16
300 (Learning Disability) -
400 (Moderate Intellectual Disability) -
500 (Severe Intellectual Disability) -
601 (Other Health Impairment) -
700 (Hearing Impairment) -
1000 (Autism) -
1100 (Deaf - Blind) -
1200 (Speech and/or Language Impairment) -
1300 (Traumatic Brain Injury) -
1400 (Developmental Delay) -
Total 67

December 17, 2018 DDOE Annual Report on the Use of Physical Restraint 26
Caesar Rodney School District
Early Childhood
Centers
Number of Physical
Restraints
J.R. McIlvaine -
Elementary Schools
W. Reily Brown -
Allen Frear -
Kent Elementary ILC 41
W.B. Simpson -
Star Hill -
Nellie H. Stokes -
George S. Welch -
Middle Schools
Dover Air Base -
Fred Fifer III -
F. Niel Postlethwait -
High Schools
Caesar Rodney -
Special Schools
John S. Charlton -
Total Physical
Restraints 94
Total Number of
Students 53
Race and Ethnicity
Number of Students
Restrained
Two or More Races -
Black or African American 21
American Indian/Alaskan Native -
Asian -
Hawaiian/Pacific Islander -
Hispanic -
White 22
Total 53
Age Range
Number of Students
Restrained
3-5 -
6-8 17
9-11 18
12-14 -
15-17 -
18-21 -
Total 53
Gender
Number of Students
Restrained
Male -
Female -
Total 53
Disability Category Number of Students Restrained
Regular Education Students -
100 (Mild Intellectual Disability) -
200 (Emotional Disability) -
300 (Learning Disability) -
400 (Moderate Intellectual Disability) -
500 (Severe Intellectual Disability) -
601 (Other Health Impairment) -
700 (Hearing Impairment) -
1000 (Autism) -
1100 (Deaf - Blind) -
1200 (Speech and/or Language Impairment) -
1300 (Traumatic Brain Injury) -
1400 (Developmental Delay) -
Total 53
Kent County
December 17, 2018 DDOE Annual Report on the Use of Physical Restraint 27
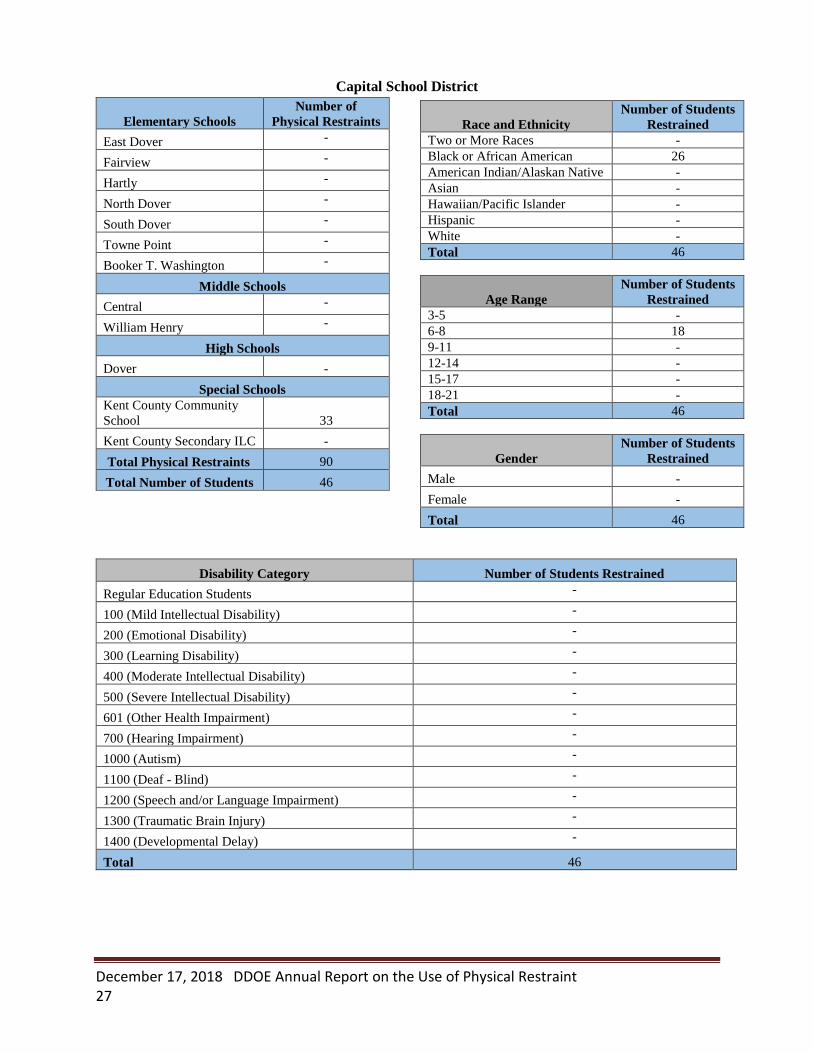
Capital School District
Elementary Schools
Number of
Physical Restraints
East Dover -
Fairview -
Hartly -
North Dover -
South Dover -
Towne Point -
Booker T. Washington -
Middle Schools
Central -
William Henry -
High Schools
Dover -
Special Schools
Kent County Community
School 33
Kent County Secondary ILC -
Total Physical Restraints 90
Total Number of Students 46
Race and Ethnicity
Number of Students
Restrained
Two or More Races -
Black or African American 26
American Indian/Alaskan Native -
Asian -
Hawaiian/Pacific Islander -
Hispanic -
White -
Total 46
Age Range
Number of Students
Restrained
3-5 -
6-8 18
9-11 -
12-14 -
15-17 -
18-21 -
Total 46
Gender
Number of Students
Restrained
Male -
Female -
Total 46
Disability Category Number of Students Restrained
Regular Education Students -
100 (Mild Intellectual Disability) -
200 (Emotional Disability) -
300 (Learning Disability) -
400 (Moderate Intellectual Disability) -
500 (Severe Intellectual Disability) -
601 (Other Health Impairment) -
700 (Hearing Impairment) -
1000 (Autism) -
1100 (Deaf - Blind) -
1200 (Speech and/or Language Impairment) -
1300 (Traumatic Brain Injury) -
1400 (Developmental Delay) -
Total 46

December 17, 2018 DDOE Annual Report on the Use of Physical Restraint 28
Lake Forest School District
Early Childhood Centers
Number of
Physical Restraints
Delaware -
Elementary Schools
Central 18
East -
North -
South -
Middle Schools
W.T. Chipman -
High Schools
Lake Forest -
Total Physical Restraints 37
Total Number of Students 20
Race and Ethnicity
Number of Students
Restrained
Two or More Races -
Black or African American -
American Indian/Alaskan Native -
Asian -
Hawaiian/Pacific Islander -
Hispanic -
White -
Total 20
Age Range
Number of Students
Restrained
3-5 -
6-8 -
9-11 -
12-14 -
15-17 -
18-21 -
Total 20
Gender
Number of Students
Restrained
Male -
Female -
Total 20
Disability Category Number of Students Restrained
Regular Education Students -
100 (Mild Intellectual Disability) -
200 (Emotional Disability) -
300 (Learning Disability) -
400 (Moderate Intellectual Disability) -
500 (Severe Intellectual Disability) -
601 (Other Health Impairment) -
700 (Hearing Impairment) -
1000 (Autism) -
1100 (Deaf - Blind) -
1200 (Speech and/or Language Impairment) -
1300 (Traumatic Brain Injury) -
1400 (Developmental Delay) -
Total 20

December 17, 2018 DDOE Annual Report on the Use of Physical Restraint 29
Milford School District
Early Childhood Centers
Number of
Physical Restraints
Evelyn I. Morris -
Elementary Schools
Benjamin Banneker -
Mispillion -
Lulu M. Ross -
Middle Schools
Milford Central Academy -
High Schools
Milford -
Special Schools
Milford ILC -
Total Physical Restraints 39
Total Number of Students 23
Race and Ethnicity
Number of Students
Restrained
Two or More Races -
Black or African American -
American Indian/Alaskan Native -
Asian -
Hawaiian/Pacific Islander -
Hispanic -
White -
Total 23
Age Range
Number of Students
Restrained
3-5 -
6-8 -
9-11 -
12-14 -
15-17 -
18-21 -
Total 23
Gender
Number of Students
Restrained
Male -
Female -
Total 23
Disability Category Number of Students Restrained
Regular Education Students -
100 (Mild Intellectual Disability) -
200 (Emotional Disability) -
300 (Learning Disability) -
400 (Moderate Intellectual Disability) -
500 (Severe Intellectual Disability) -
601 (Other Health Impairment) -
700 (Hearing Impairment) -
1000 (Autism) -
1100 (Deaf - Blind) -
1200 (Speech and/or Language Impairment) -
1300 (Traumatic Brain Injury) -
1400 (Developmental Delay) -
Total 23

December 17, 2018 DDOE Annual Report on the Use of Physical Restraint 30
PolyTech School District
High Schools
Number of
Physical Restraints
Polytech -
Total Physical Restraints 2
Total Number of Students 2
Race and Ethnicity
Number of Students
Restrained
Two or More Races -
Black or African American -
American Indian/Alaskan Native -
Asian -
Hawaiian/Pacific Islander -
Hispanic -
White -
Total 2
Age Range
Number of Students
Restrained
3-5 -
6-8 -
9-11 -
12-14 -
15-17 -
18-21 -
Total 2
Gender
Number of Students
Restrained
Male -
Female -
Total 2
Disability Category Number of Students Restrained
Regular Education Students -
100 (Mild Intellectual Disability) -
200 (Emotional Disability) -
300 (Learning Disability) -
400 (Moderate Intellectual Disability) -
500 (Severe Intellectual Disability) -
601 (Other Health Impairment) -
700 (Hearing Impairment) -
1000 (Autism) -
1100 (Deaf - Blind) -
1200 (Speech and/or Language Impairment) -
1300 (Traumatic Brain Injury) -
1400 (Developmental Delay) -
Total 2

December 17, 2018 DDOE Annual Report on the Use of Physical Restraint 31
Smyrna School District
Elementary
Number of
Physical Restraints
Clayton -
North Smyrna -
Smyrna -
Sunnyside -
Middle Schools
Clayton Intermediate -
John Bassett Moore -
Smyrna -
High Schools
Smyrna -
Total Physical Restraints 10
Total Number of Students 8
Race and Ethnicity
Number of Students
Restrained
Two or More Races -
Black or African American -
American Indian/Alaskan Native -
Asian -
Hawaiian/Pacific Islander -
Hispanic -
White -
Total 8
Age Range
Number of Students
Restrained
3-5 -
6-8 -
9-11 -
12-14 -
15-17 -
18-21 -
Total 8
Gender
Number of Students
Restrained
Male -
Female -
Total 8
Disability Category Number of Students Restrained
Regular Education Students -
100 (Mild Intellectual Disability) -
200 (Emotional Disability) -
300 (Learning Disability) -
400 (Moderate Intellectual Disability) -
500 (Severe Intellectual Disability) -
601 (Other Health Impairment) -
700 (Hearing Impairment) -
1000 (Autism) -
1100 (Deaf - Blind) -
1200 (Speech and/or Language Impairment) -
1300 (Traumatic Brain Injury) -
1400 (Developmental Delay) -
Total 8

December 17, 2018 DDOE Annual Report on the Use of Physical Restraint 32
Cape Henlopen School District
Elementary Schools
Number of
Physical Restraints
H.O. Brittingham -
Love Creek -
Milton -
Rehoboth -
Richard A. Shields -
Middle Schools
Beacon -
Mariner -
High Schools
Cape Henlopen -
Special School
Sussex Consortium 110
Total Physical Restraints 117
Total Number of Students 44
Race and Ethnicity
Number of Students
Restrained
Two or More Races -
Black or African American -
American Indian/Alaskan Native -
Asian -
Hawaiian/Pacific Islander -
Hispanic -
White 26
Total 44
Age Range
Number of Students
Restrained
3-5 -
6-8 -
9-11 -
12-14 -
15-17 -
18-21 -
Total 44
Gender
Number of Students
Restrained
Male -
Female -
Total 44
Disability Category Number of Students Restrained
Regular Education Students -
100 (Mild Intellectual Disability) -
200 (Emotional Disability) -
300 (Learning Disability) -
400 (Moderate Intellectual Disability) -
500 (Severe Intellectual Disability) -
601 (Other Health Impairment) -
700 (Hearing Impairment) -
1000 (Autism) 21
1100 (Deaf - Blind) -
1200 (Speech and/or Language Impairment) -
1300 (Traumatic Brain Injury) -
1400 (Developmental Delay) -
1600 (Preschool Speech Delay) -
Total 44
Sussex County

December 17, 2018 DDOE Annual Report on the Use of Physical Restraint 33
Delmar School District
Middle Schools
Number of Physical
Restraints
Delmar -
High Schools
Delmar -
Total Physical Restraints 12
Total Number of
Students 9
Race and Ethnicity
Number of Students
Restrained
Two or More Races -
Black or African American -
American Indian/Alaskan Native -
Asian -
Hawaiian/Pacific Islander -
Hispanic -
White -
Total 9
Age Range
Number of Students
Restrained
3-5 -
6-8 -
9-11 -
12-14 -
15-17 -
18-21 -
Total 9
Gender
Number of Students
Restrained
Male -
Female -
Total 9
Disability Category Number of Students Restrained
Regular Education Students -
100 (Mild Intellectual Disability) -
200 (Emotional Disability) -
300 (Learning Disability) -
400 (Moderate Intellectual Disability) -
500 (Severe Intellectual Disability) -
601 (Other Health Impairment) -
700 (Hearing Impairment) -
1000 (Autism) -
1100 (Deaf - Blind) -
1200 (Speech and/or Language Impairment) -
1300 (Traumatic Brain Injury) -
1400 (Developmental Delay) -
Total 9

December 17, 2018 DDOE Annual Report on the Use of Physical Restraint 34
Indian River School District
Elementary Schools
Number of Physical
Restraints
John M. Clayton 22
East Millsboro 47
Georgetown -
Georgetown Kindergarten
Center
-
Long Neck 16
Lord Baltimore -
North Georgetown -
Phillip C. Showell -
Middle Schools
Georgetown -
Millsboro -
Selbyville -
High Schools
Indian River -
Sussex Central -
Southern Delaware School
for the Arts
-
Special Schools
Carver Academy 60
Howard T. Ennis 26
Total Physical Restraints 220
Total Number of Students 97
Race and Ethnicity
Number of Students
Restrained
Two or More Races -
Black or African American 49
American Indian/Alaskan Native -
Asian -
Hawaiian/Pacific Islander -
Hispanic -
White 37
Total 97
Age Range
Number of Students
Restrained
3-5 -
6-8 27
9-11 23
12-14 17
15-17 23
18-21 -
Total 97
Gender
Number of Students
Restrained
Male 71
Female 26
Total 97
Disability Category Number of Students Restrained
Regular Education Students 22
100 (Mild Intellectual Disability) -
200 (Emotional Disability) 28
300 (Learning Disability) -
400 (Moderate Intellectual Disability) -
500 (Severe Intellectual Disability) -
601 (Other Health Impairment) -
700 (Hearing Impairment) -
1000 (Autism) -
1100 (Deaf - Blind) -
1200 (Speech and/or Language Impairment) -
1300 (Traumatic Brain Injury) -
1400 (Developmental Delay) -
Total 97

December 17, 2018 DDOE Annual Report on the Use of Physical Restraint 35
Laurel School District
Elementary Schools
Number of Physical
Restraints
Paul Laurence Dunbar -
North Laurel -
Middle Schools
Laurel -
High Schools
Laurel Senior -
Total Physical Restraints 9
Total Number of Students 8
Race and Ethnicity
Number of Students
Restrained
Two or More Races -
Black or African American -
American Indian/Alaskan Native -
Asian -
Hawaiian/Pacific Islander -
Hispanic -
White -
Total 8
Age Range
Number of Students
Restrained
3-5 -
6-8 -
9-11 -
12-14 -
15-17 -
18-21 -
Total 8
Gender
Number of Students
Restrained
Male -
Female -
Total 8
Disability Category Number of Students Restrained
Regular Education Students -
100 (Mild Intellectual Disability) -
200 (Emotional Disability) -
300 (Learning Disability) -
400 (Moderate Intellectual Disability) -
500 (Severe Intellectual Disability) -
601 (Other Health Impairment) -
700 (Hearing Impairment) -
1000 (Autism) -
1100 (Deaf - Blind) -
1200 (Speech and/or Language Impairment) -
1300 (Traumatic Brain Injury) -
1400 (Developmental Delay) -
Total 8

December 17, 2018 DDOE Annual Report on the Use of Physical Restraint 36
Seaford School District
Elementary
Number of Physical
Restraints
Blades -
Frederick Douglass -
Central -
West Seaford -
Middle Schools
Seaford -
High Schools
Seaford -
Total Physical Restraints 36
Total Number of Students 23
Race and Ethnicity
Number of Students
Restrained
Two or More Races -
Black or African American 16
American Indian/Alaskan Native -
Asian -
Hawaiian/Pacific Islander -
Hispanic -
White -
Total 23
Age Range
Number of Students
Restrained
3-5 -
6-8 -
9-11 -
12-14 -
15-17 -
18-21 -
2Total 23
Gender
Number of Students
Restrained
Male -
Female -
Total 23
Disability Category Number of Students Restrained
Regular Education Students -
100 (Mild Intellectual Disability) -
200 (Emotional Disability) -
300 (Learning Disability) -
400 (Moderate Intellectual Disability) -
500 (Severe Intellectual Disability) -
601 (Other Health Impairment) -
700 (Hearing Impairment) -
1000 (Autism) -
1100 (Deaf - Blind) -
1200 (Speech and/or Language Impairment) -
1300 (Traumatic Brain Injury) -
1400 (Developmental Delay) -
Total 23

December 17, 2018 DDOE Annual Report on the Use of Physical Restraint 37
Sussex Technical School District
High Schools
Number of Physical
Restraints
Sussex Technical -
Total Physical Restraints 0
Total Number of Students 0
Race and Ethnicity
Number of Students
Restrained
Two or More Races -
Black or African American -
American Indian/Alaskan Native -
Asian -
Hawaiian/Pacific Islander -
Hispanic -
White -
Total 0
Age Range
Number of Students
Restrained
3-5 -
6-8 -
9-11 -
12-14 -
15-17 -
18-21 -
2Total 0
Gender
Number of Students
Restrained
Male 0
Female 0
Total 0
Disability Category Number of Students Restrained
Regular Education Students -
100 (Mild Intellectual Disability) -
200 (Emotional Disability) -
300 (Learning Disability) -
400 (Moderate Intellectual Disability) -
500 (Severe Intellectual Disability) -
601 (Other Health Impairment) -
700 (Hearing Impairment) -
1000 (Autism) -
1100 (Deaf - Blind) -
1200 (Speech and/or Language Impairment) -
1300 (Traumatic Brain Injury) -
1400 (Developmental Delay) -
Total 0

December 17, 2018 DDOE Annual Report on the Use of Physical Restraint 38
Woodbridge School District
Early Childhood Center
Number of Physical
Restraints
Woodbridge 39
Elementary
Phillis Wheatley -
Middle
Woodbridge -
High
Woodbridge -
Total Physical Restraints 51
Total Number of Students 16
Race and Ethnicity
Number of Students
Restrained
Two or More Races -
Black or African American -
American Indian/Alaskan Native -
Asian -
Hawaiian/Pacific Islander -
Hispanic -
White -
Total 16
Age Range
Number of Students
Restrained
3-5 -
6-8 -
9-11 -
12-14 -
15-17 -
18-21 -
Total 16
Gender
Number of Students
Restrained
Male -
Female -
Total 16
Disability Category Number of Students Restrained
Regular Education Students -
100 (Mild Intellectual Disability) -
200 (Emotional Disability) -
300 (Learning Disability) -
400 (Moderate Intellectual Disability) -
500 (Severe Intellectual Disability) -
601 (Other Health Impairment) -
700 (Hearing Impairment) -
1000 (Autism) -
1100 (Deaf - Blind) -
1200 (Speech and/or Language Impairment) -
1300 (Traumatic Brain Injury) -
1400 (Developmental Delay) -
Total 16

December 17, 2018 DDOE Annual Report on the Use of Physical Restraint 39
Charter Schools
Number of
Physical Restraints
Academy of Dover -
Antonia Alonso -
Las Americas ASPIRA
Academy
-
Campus Community -
Delaware Academy of Public
Safety and Security
-
Delaware Design-Lab High -
Delaware Military Academy -
Early College High School -
East Side Charter -
Family Foundations Academy -
First State Military Academy -
First State Montessori -
Freire Charter School
Wilmington
-
Gateway Lab School -
Great Oaks Charter School -
Kuumba Academy -
M.O.T. Charter -
Charter School of New Castle -
Newark Charter -
Odyssey Charter -
Positive Outcomes Charter -
Prestige Academy -
Providence Creek Academy -
Sussex Academy -
Thomas A. Edison Charter -
Charter School of Wilmington -
Total Physical Restraints 44
Total Number of Students 31
Race and Ethnicity
Number of Students
Restrained
Two or More Races -
Black or African American 23
American Indian/Alaskan Native -
Asian -
Hawaiian/Pacific Islander -
Hispanic -
White -
Total 31
Age Range
Number of Students
Restrained
3-5 -
6-8 -
9-11 -
12-14 -
15-17 -
18-21 -
Total 31
Gender
Number of Students
Restrained
Male 21
Female -
Total 31
Charter Schools

December 17, 2018 DDOE Annual Report on the Use of Physical Restraint 40
Disability Category Number of Students Restrained
Regular Education Students -
100 (Mild Intellectual Disability) -
200 (Emotional Disability) -
300 (Learning Disability) -
400 (Moderate Intellectual Disability) -
500 (Severe Intellectual Disability) -
601 (Other Health Impairment) -
700 (Hearing Impairment) -
1000 (Autism) -
1100 (Deaf - Blind) -
1200 (Speech and/or Language Impairment) -
1300 (Traumatic Brain Injury) -
1400 (Developmental Delay) -
Total 31

December 17, 2018 DDOE Annual Report on the Use of Physical Restraint 41
Program
Number of Physical
Restraints
In-state 46
Out-of-state 61
Total Physical Restraints 107
Total Number of Students 33
Race and Ethnicity
Number of Students
Restrained
Two or More Races -
Black or African American -
American Indian/Alaskan Native -
Asian -
Hawaiian/Pacific Islander -
Hispanic -
White 22
Total 33
Age Range
Number of Students
Restrained
3-5 -
6-8 -
9-11 -
12-14 -
15-17 -
18-21 -
Total 33
Gender
Number of Students
Restrained
Male -
Female -
Total 33
Disability Category Number of Students Restrained
Regular Education Students -
100 (Mild Intellectual Disability) -
200 (Emotional Disability) -
300 (Learning Disability) -
400 (Moderate Intellectual Disability) -
500 (Severe Intellectual Disability) -
601 (Other Health Impairment) -
700 (Hearing Impairment) -
1000 (Autism) -
1100 (Deaf - Blind) -
1200 (Speech and/or Language Impairment) -
1300 (Traumatic Brain Injury) -
1400 (Developmental Delay) -
Total 33
Private Placement

December 17, 2018 DDOE Annual Report on the Use of Physical Restraint 42
Unduplicated Counts of Student Restraints Disaggregated by Subgroup
Table 1. Race and Ethnicity
2015-2016 2016-2017 2017-2018
# of Students
Restrained
% of All Students
Restrained
# of Students
Restrained
% of All Students
Restrained
# of Students
Restrained
% of All Students
Restrained
Two or More Races 30 <5% 36 5% 51 6%
Black or African American 346 51% 355 49% 439 50%
American Indian/Alaskan Native - <5% - <5% - <5%
Asian/Pacific Islander - <5% - <5% - <5%
Hispanic 61 9% 59 8% 98 11%
White 232 34% 267 37% 283 32%
Total 681 100% 727 100% 880 100%
Graph 1. Race and Ethnicity
Table and Graph 1 display the race/ethnicity of students who received restraint procedures. There
has been a 1% increase each year in the number of Multiracial students requiring physical
restraint intervention compared to the other demographic categories. Other racial/ethnic groups
have remained relatively stable or fluctuated too much from year-to-year to demonstrate a
pattern.
0%
10%
20%
30%
40%
50%
60%
70%
80%
90%
100%
Multiracial Black Amer.Indian Asian Hispanic White
Percentage of All Students Restrained
Race & Ethnicity
2015-2016 2016-2017 2017-2018
Appendix B

December 17, 2018 DDOE Annual Report on the Use of Physical Restraint 43
Table 2. Gender
2015-2016 2016-2017 2017-2018
# of Students
Restrained
% of All Students
Restrained
# of Students
Restrained
% of All Students
Restrained
# of Students
Restrained
% of All Students
Restrained
Male 525 77% 590 81% 709 81%
Female 156 23% 137 19% 171 19%
Total 681 100% 727 100% 880 100%
Graph 2. Gender
Table and Graph 2 display the reported gender of all students who received restraint procedures.
The percentage of males (81%) increased by 4% and females (19%) decreased by 4% between
15-16 and 16-17. Between 16-17 and 17-18, the percentage remained steady with little change.
0%
10%
20%
30%
40%
50%
60%
70%
80%
90%
100%
Male Female
Percentage of All Students Restrained
Gender
2015-2016 2016-2017 2017-2018

December 17, 2018 DDOE Annual Report on the Use of Physical Restraint 44
Table 3. Age
2015-2016 2016-2017 2017-2018
# of Students
Restrained
% of All Students
Restrained
# of Students
Restrained
% of All Students
Restrained
# of Students
Restrained
% of All Students
Restrained
3-5 51 7% 57 8% 55 6%
6-8 201 30% 228 32% 282 32%
9-11 176 26% 184 25% 227 26%
12-14 130 19% 124 17% 154 18%
15-17 96 14% 97 13% 125 14%
18-21 27 <5% 37 5% 37 <5%
Total 681 100% 727 100% 880 100%
Graph 3. Age
Table and Graph 3 display the age ranges of all students who were restrained. There has been a
cumulative increase of 2.5% for the 6-8 age group.
0%
10%
20%
30%
40%
50%
60%
70%
80%
90%
100%
3-5 6-8 9-11 12-14 15-17 18-21
Percentage of All Students Restrained
Age Range
2015-2016 2016-2017 2017-2018

December 17, 2018 DDOE Annual Report on the Use of Physical Restraint 45
Table 4. Disability Category
2015-2016 2016-2017 2017-2018
# of Students
Restrained
% of All Students
Restrained
# of Students
Restrained
% of All Students
Restrained
# of Students
Restrained
% of All Students
Restrained
Regular Education Students 146 22% 156 22% 180 20%
100 (Mild Intellectual Disability) 22 <5% 25 <5% 31 <5%
200 (Emotional Disturbance) 127 19% 133 18% 189 21%
300 (Learning Disability) 49 7% 41 6% 60 <5%
400 (Moderate Intellectual Disability) 24 <5% 26 <5% 24 <5%
500 (Severe Intellectual Disability) - <5% - <5% - <5%
601 (Other Health Impairment) 67 10% 76 11% 92 10%
700 (Hearing Impairment) - <5% - <5% - <5%
1000 (Autism) 193 28% 201 28% 221 25%
1100 (Deaf Blind) - <5% - <5% - <5%
1200 (Speech and/or Language Impairment) - <5% - <5% - <5%
1300 (Traumatic Brain Injury) - <5% - <5% - <5%
1400 (Developmental Delay) 41 6% 49 7% 72 8%
1600 (Preschool Speech Delay) - <5% - <5% - <5%
Total 681 100% 727 100% 880 100%
Graph 4. Disability Category
Table and Graph 4 display the number of students restrained that were regular education
students, as well as the number of students within each special education disability category. The
percentage of regular education students being restrained has decreased 2% cumulatively across
the three years. Across all three years, there has been a cumulative 3% decrease in the 1000
(Autism) disability category and a cumulative 2% increase in the 1400 (Developmental Delay)
category.
0%
10%20%
30%40%
50%60%
70%80%
90%100%
Percentage of All Students Restrained
Disability Category
2015-2016 2016-2017 2017-2018

December 17, 2018 DDOE Annual Report on the Use of Physical Restraint 46
Total Number of Reported Incidents of Student Physical Restraint
Table 5. Reason for Physical Restraint
Imminent Risk of
Harm to:
2015-2016 2016-2017 2017-2018
# of Students
Restrained
% of All Students
Restrained
# of Students
Restrained
% of All Students
Restrained
# of Students
Restrained
% of All Students
Restrained
Others 715 24% 658 22% 711 27%
Self and Others 1789 60% 1948 65% 1621 60%
Self 461 16% 400 13% 348 13%
Total 2965 100% 3006 100% 2680 100%
Graph 5. Reason for Physical Restraint
Table and Graph 5 display the reason for which physical restraint was a necessary intervention.
The reason for using physical restraint remained higher when the student’s behavior posed an
imminent risk of harm to both the student and others across both reporting years.
0%
10%
20%
30%
40%
50%
60%
70%
80%
90%
100%
Others Self and Others Self
Percentage of All Students Restrained
Reason for RestraintImminent Risk of Harm to:
2015-2016 2016-2017 2017-2018

December 17, 2018 DDOE Annual Report on the Use of Physical Restraint 47
Table 6. Physical Restraint Duration
2015-2016 2016-2017 2017-2018
# of Students
Restrained
% of All Students
Restrained
# of Students
Restrained
% of All Students
Restrained
# of Students
Restrained
% of All Students
Restrained
≤ 2 minutes 1073 36% 1124 37% 1042 39%
3-5 minutes 772 26% 801 27% 784 29%
6 – 9 minutes 272 9% 268 9% 242 9%
≥ 10 minutes 618 21% 728 24% 610 23%
Not Reported (N/R) 230 8% 85 3% 2 0%
Total 2965 100% 3006 100% 2680 100%
Graph 6. Physical Restraint Duration
Table and Graph 6 display the duration of all physical restraints. The majority of physical
restraints were less than or equal to 5 minutes across all reporting years.
0%
10%
20%
30%
40%
50%
60%
70%
80%
90%
100%
≤ 2 minutes 3-5 minutes 6-9 minutes ≥ 10 minutes Not Reported (N/R)
Percentage of All Physical Restraints
Restraint Duration
2015-2016 2016-2017 2017-2018

December 17, 2018 DDOE Annual Report on the Use of Physical Restraint 48
Table 7. Time of Day
2015-2016 2016-2017 2017-2018
# of Students
Restrained
% of All Students
Restrained
# of Students
Restrained
% of All Students
Restrained
# of Students
Restrained
% of All Students
Restrained
AM 1603 54% 1583 53% 1397 52%
PM 1359 46% 1420 47% 1283 48%
Not Reported (N/R) 3 <1% 3 0% 0 0%
Total 2965 100% 3006 100% 2680 100%
Graph 7. Time of Day
Table and Graph 7 display the number, as well as the percentage of physical restraints that
occurred in the morning and in the afternoon and evening. Across all three years, there has been
a cumulative 2% decrease in restraints occurring in the morning and a cumulative 2% increase in
restraints occurring in the afternoon/evening.
0%
10%
20%
30%
40%
50%
60%
70%
80%
90%
100%
AM PM Not Reported (N/R)
Percentage of All Students Restrained
Time of Day
2015-2016 2016-2017 2017-2018
December 17, 2018 DDOE Annual Report on the Use of Physical Restraint 49
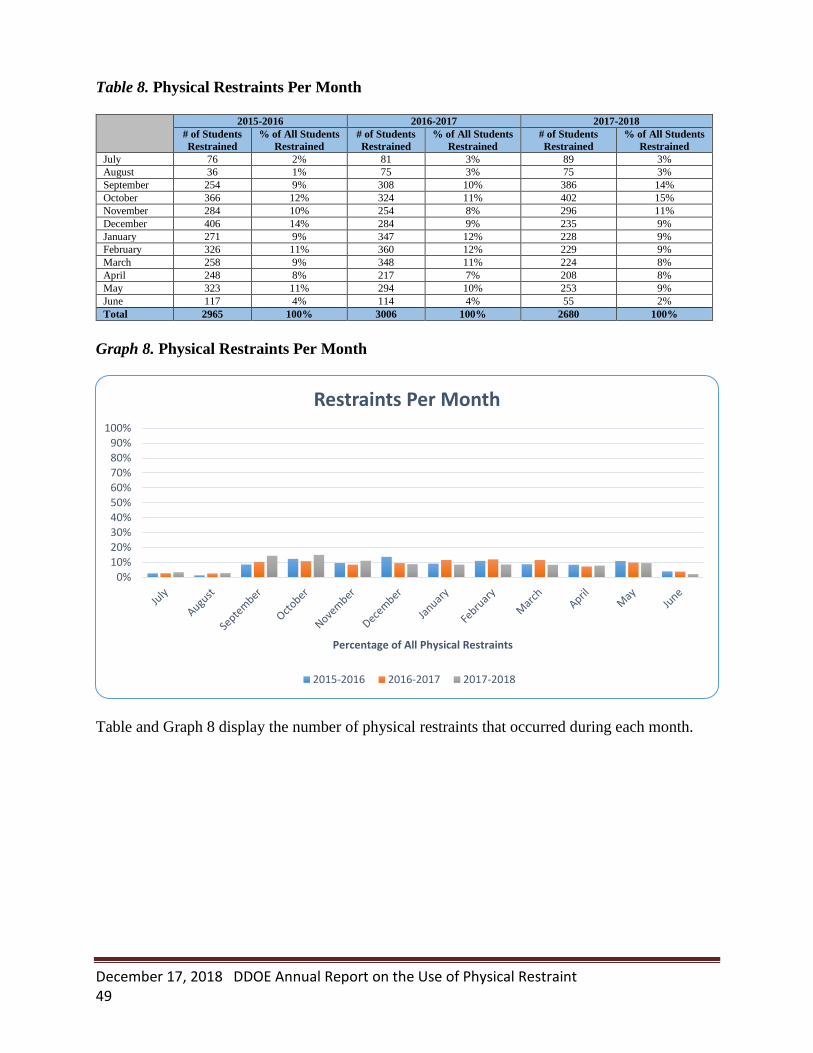
Table 8. Physical Restraints Per Month
2015-2016 2016-2017 2017-2018
# of Students
Restrained
% of All Students
Restrained
# of Students
Restrained
% of All Students
Restrained
# of Students
Restrained
% of All Students
Restrained
July 76 2% 81 3% 89 3%
August 36 1% 75 3% 75 3%
September 254 9% 308 10% 386 14%
October 366 12% 324 11% 402 15%
November 284 10% 254 8% 296 11%
December 406 14% 284 9% 235 9%
January 271 9% 347 12% 228 9%
February 326 11% 360 12% 229 9%
March 258 9% 348 11% 224 8%
April 248 8% 217 7% 208 8%
May 323 11% 294 10% 253 9%
June 117 4% 114 4% 55 2%
Total 2965 100% 3006 100% 2680 100%
Graph 8. Physical Restraints Per Month
Table and Graph 8 display the number of physical restraints that occurred during each month.
0%10%20%30%40%50%60%70%80%90%
100%
Percentage of All Physical Restraints
Restraints Per Month
2015-2016 2016-2017 2017-2018

December 17, 2018 DDOE Annual Report on the Use of Physical Restraint 50
The role of the Office of School Climate and Discipline is to assist public schools in Delaware
in their efforts to provide every student with a safe and supportive learning environment.
As part of that charge, the Office collects and analyzes information from schools in various
areas of student behavior in order to develop training and best practice tools that will
assist schools in addressing those behaviors. The Department supports the use of Trauma
Informed Practices as a tool to help schools prevent issues such as these and to address the
changing emotional, mental and educational needs of a diverse student population
throughout the First State.