2017 - nscorp.com · $ 250 $ $9,888200 $ 150 $ 100 ... premier transportation companies. ... for...
TRANSCRIPT

ANNUAL REPORT
1720

$ 300
$ 250
$ 200
$ 150
$ 100
$ 50
$ 012/12 12/13 12/14 12/15 12/16 12/17
n Norfolk Southern Corp. Common Stock
n S&P Railroad Stock Price Index
n S&P Composite-500 Stock Price Index
FOR THE YEAR (numbers in millions, except per-share amounts) 2017 2016 2015
Railway operating revenues $ 10,551 $ 9,888 $ 10,511Income from railway operations1 $ 3,435 $ 3,074 $ 2,884Net income1 $ 1,922 $ 1,668 $ 1,556 Per share – diluted1 $ 6.61 $ 5.62 $ 5.10Dividends per share $ 2.44 $ 2.36 $ 2.36Dividend pay-out ratio1 37% 42% 46%Net cash provided by operating activities $ 3,253 $ 3,034 $ 2,908Property additions $ 1,723 $ 1,887 $ 2,385Free cash flow2 $ 1,530 $ 1,147 $ 523
AT YEAR END
Total assets $ 35,711 $ 34,892 $ 34,139Total debt $ 9,836 $ 10,212 $ 10,093Stockholders’ equity $ 16,359 $ 12,409 $ 12,188Shares outstanding 284.2 290.4 297.8Stockholders’ equity per share $ 57.57 $ 42.73 $ 40.93
FINANCIAL RATIOS
Operating ratio1 67.4% 68.9% 72.6%Debt-to-total-capitalization ratio 37.5% 45.1% 45.3%
$1,530
$3,435
$9,888
FINANCIAL HIGHLIGHTSNORFOLK SOUTHERN CORPORATION & SUBSIDIARIES
Railway Operating Revenues (in millions)
2017 20171 20172015 2015 20152016 2016 2016
$10,511$2,884
$523
Income from Railway
Operations (in millions)
Free Cash Flow2
(in millions)
DESCRIPTION OF BUSINESS
Norfolk Southern
Corporation (NYSE: NSC)
is one of the nation’s
premier transportation
companies. Its Norfolk
Southern Railway Com-
pany subsidiary operates
approximately 19,500
route miles in
22 states and the
District of Columbia,
serves every major con-
tainer port in the eastern
United States, and provides
efficient connections to
other rail carriers. Norfolk
Southern operates the
most extensive intermodal
network in the East and is
a major transporter of
coal, automotive, and
industrial products.
1 On Dec. 22, 2017, the Tax Cuts and Jobs Act (the “Tax Act”) was signed into law. For 2017, our financial statements reflect the impact of the Tax Act and are presented in accordance with GAAP. However, for purposes of period-over-period comparability, these financial results are adjusted to exclude the effects of the Tax Act, and are considered to be non-GAAP financial measures. Specifically, the adjustments remove the effects of remeasurements of net deferred tax liabilities related to the reduction of the federal corporate income tax rate from 35 percent to 21 percent. Dividend payout ratio is dividends paid ($703M) as a percentage of net income ($1,922M), which was adjusted to exclude the effects of tax reform. For more information, see the “Reconciliation of Non-GAAP Financial Measures” on page K18 of our Annual Report on Form 10-K for the fiscal year ended Dec. 31, 2017.
2 Free cash flow is considered a non-GAAP financial measure and is a measure of cash available for other investing and financing activities, primarily including payment of dividends, repurchases of common stock, and repayments of debt. Management believes that this non-GAAP financial measure provides useful supplemental information to investors regarding our ability to generate cash flows after taking into consideration cash necessary to cover operations and maintain and grow our capital base. Net cash provided by operating activities is a GAAP measure. Free cash flow ($1,530M) is net cash provided by operating activities ($3,253M) reduced by payments for property additions ($1,723M).
3 This graph compares the cumulative stockholder returns on Norfolk Southern Corporation common stock with the other identified indices. It assumes that the value of the investment in NSC common stock and each index was $100 on Dec. 31, 2012, and that all dividends were reinvested over the five-year period. Data furnished by Bloomberg Financial Markets.
$10,551 $3,074
$1,147
Total Stockholder Returns3
(in dollars)

GROWTH, EFFICIENCY, AND SAFETY
Annual revenue grew 7 percent in 2017, the most since 2011, to $10.6 billion. Growth came from a 5 percent increase in total carload volume and revenue per-unit gains across all major market segments. Merchandise volumes were flat overall, while intermodal volumes grew 5 percent. Coal volumes rose for the first time since 2011, increasing 16 percent.
In the third and fourth quarters of 2017, and continuing into the first quarter of 2018, our network velocity slowed as the result of a series of hurricanes and multiple snowstorms in the South, with one shutting down one of our highest-density routes for several days. Resulting service disruptions were regrettable. Although we will never be immune to severe weather, our objective is to provide stable, resilient service over the long term through steady investments in key resources and reasonable redundancy, such as maintaining parallel routes, “surge” locomotives, and adequate yard capacity. In 2018, in close consultation with customers, we will begin implementing operational changes we believe will promote greater network stability.
DEAR FELLOW SHAREHOLDERS:
In 2017, Norfolk Southern delivered an all-time best operating ratio
of 67.41 and record earnings per share of $6.61 ,
1 up 18 percent versus
2016. Income from railway operations and net income also increased
double digits, by 12 percent and 15 percent, respectively. Free cash
flow, another record, grew 33 percent year-over-year. These financial
achievements show our strategy is working, and we are on track to
deliver a sub-65 operating ratio by 2020 or sooner. In 2018, with
a strengthening economy and the benefit of the Tax Cuts
and Jobs Act, we plan to increase capital spending and
shareholder distributions.
Above: A Norfolk Southern double-stack intermodal train passes a siding track as it moves through Tifton, Georgia. The company grew intermodal revenue by 11 percent in 2017 versus 2016, reflecting volume growth and pricing gains.
1 On Dec. 22, 2017, the Tax Cuts and Jobs Act (the “Tax Act”) was signed into law. For 2017, our financial statements reflect the impact of the Tax Act and are presented in accordance with GAAP. However, for purposes of period-over-period comparability, these financial results are adjusted to exclude the effects of the Tax Act, and are considered to be non-GAAP financial measures. Specifically, the adjustments remove the effects of remeasurements of net deferred tax liabilities related to the reduction of the federal corporate income tax rate from 35 percent to 21 percent. For more information, see the “Reconciliation of Non-GAAP Financial Measures” on page K18 of our Annual Report on Form 10-K for the fiscal year ended Dec. 31, 2017.

Efficiency and safety improved in a variety of ways in 2017. Productivity metrics like train length, locomotive utilization, and fuel efficiency reached new levels. We maintained adequate staffing to meet demand, and we expect to hold employment levels relatively flat in 2018. In 2017, we experienced our lowest-ever train accident frequency, an essential safety measure. Our employee reportable and serious injury ratios remained stable. Our goal for safety is continuous improvement and, ultimately, zero accidents and injuries.
REINVESTING IN THE BUSINESS AND RETURNING CAPITAL TO SHAREHOLDERS
Our 2017 capital spending and replacement programs, which ensure safe, efficient, and reliable service, totaled $1.7 billion. Investments included $1.2 billion in roadway and other property and $500 million in equipment. We installed 466 miles of rail, resurfaced 5,368 miles of track, and installed 2.5 million crossties. We earned new business from 75 industries locating or expanding along our lines, representing over $1 billion invested by our customers. Through a public-private partnership with the State of New York, we invested in a new $75 million Portageville Bridge to expand rail capacity and shipping options for businesses across New York’s Southern Tier.
In addition to reinvesting money in our company, we returned capital to our shareholders. In 2017, we paid $703 million in dividends and repurchased $1 billion of company stock. For 2018 we have budgeted $1.8 billion of capital expenditures, with additional investments in growth and network resilience under consideration. In early 2018 our board of directors increased our dividend 18 percent. In 2018, we plan to conduct a robust share repurchase program.
Top: On Dec. 11, 2017, the eastbound
36T general merchandise train,
running from Buffalo, New York, to Allentown,
Pennsylvania, with stops in Corning and Binghamton,
New York, became the first train to run over the new Portageville
Bridge on Norfolk Southern’s Southern Tier Line. The bridge, a public-private
partnership between Norfolk Southern and the State of New York, supports jobs
and economic development in New York’s Southern Tier.
Right: A Norfolk Southern mixed-freight merchandise train passes by PTC
wayside signals infrastructure on Norfolk Southern’s CNO&TP line in
Kentucky. The company’s merchandise markets generated railway operating
revenues of $6.4 billion in 2017, a 3 percent increase over 2016.
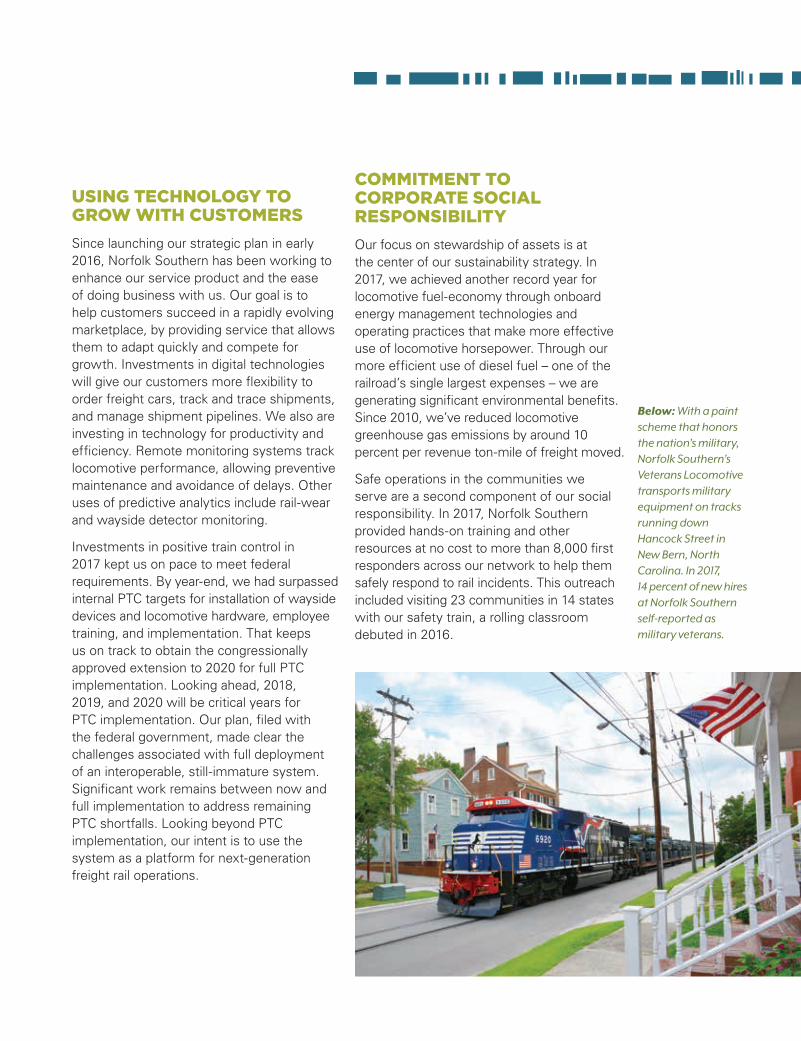
USING TECHNOLOGY TO GROW WITH CUSTOMERS
Since launching our strategic plan in early 2016, Norfolk Southern has been working to enhance our service product and the ease of doing business with us. Our goal is to help customers succeed in a rapidly evolving marketplace, by providing service that allows them to adapt quickly and compete for growth. Investments in digital technologies will give our customers more flexibility to order freight cars, track and trace shipments, and manage shipment pipelines. We also are investing in technology for productivity and efficiency. Remote monitoring systems track locomotive performance, allowing preventive maintenance and avoidance of delays. Other uses of predictive analytics include rail-wear and wayside detector monitoring.
Investments in positive train control in 2017 kept us on pace to meet federal requirements. By year-end, we had surpassed internal PTC targets for installation of wayside devices and locomotive hardware, employee training, and implementation. That keeps us on track to obtain the congressionally approved extension to 2020 for full PTC implementation. Looking ahead, 2018, 2019, and 2020 will be critical years for PTC implementation. Our plan, filed with the federal government, made clear the challenges associated with full deployment of an interoperable, still-immature system. Significant work remains between now and full implementation to address remaining PTC shortfalls. Looking beyond PTC implementation, our intent is to use the system as a platform for next-generation freight rail operations.
COMMITMENT TO CORPORATE SOCIAL RESPONSIBILITY
Our focus on stewardship of assets is at the center of our sustainability strategy. In 2017, we achieved another record year for locomotive fuel-economy through onboard energy management technologies and operating practices that make more effective use of locomotive horsepower. Through our more efficient use of diesel fuel – one of the railroad’s single largest expenses – we are generating significant environmental benefits. Since 2010, we’ve reduced locomotive greenhouse gas emissions by around 10 percent per revenue ton-mile of freight moved.
Safe operations in the communities we serve are a second component of our social responsibility. In 2017, Norfolk Southern provided hands-on training and other resources at no cost to more than 8,000 first responders across our network to help them safely respond to rail incidents. This outreach included visiting 23 communities in 14 states with our safety train, a rolling classroom debuted in 2016.
Below: With a paint scheme that honors the nation’s military, Norfolk Southern’s Veterans Locomotive transports military equipment on tracks running down Hancock Street in New Bern, North Carolina. In 2017, 14 percent of new hires at Norfolk Southern self-reported as military veterans.

Another integral part of our sustainability efforts is our commitment to provide employees with a work environment where they can thrive – rewarding careers with good pay to support their families, opportunities for advancement, and a financially secure retirement. In 2017, we continued to grow the ranks of women, military veterans, and minorities in our workforce. We also created a new leadership development program for field supervisors in transportation, our largest operations department, designed to retain top talent, enhance operating efficiencies, and build stronger relationships with customers and communities.
ENGAGED AND EFFECTIVE CORPORATE GOVERNANCE
Our highly qualified and independent board of directors played an active role in developing the company’s long-term strategy, and the board is fully engaged in overseeing the progress we have achieved. Our board now comprises 13 members, 12 of them independent, who bring a wealth of senior management experience, diverse viewpoints, and skills to the table.
Shareholder input and feedback are essential to the board’s decision-making. In 2017, our board supported shareholders’ desire to continue annual advisory shareholder votes on executive pay. As part of our enterprise risk management program, the board continued its effective oversight of risk, a key theme that emerged from shareholder engagements during the year.
MOVING AHEAD WITH DETERMINATION
Norfolk Southern has generated tremendous momentum since rolling out our strategic plan two years ago. Through the energy and talent of our employees, we have demonstrated the ability to deliver on our financial and operational goals. Our emphasis on growth, efficiency, safety, balanced capital deployment, technology that drives service and productivity, sustainability, and sound governance gives me great confidence that we will deliver superior shareholder value as we move through 2018 and beyond. Thank you for your investment in Norfolk Southern.
Above and Right: Norfolk Southern
reinvests in its network to ensure safe and
efficient operations and to promote
growth. Above, a maintenance-of-
way crew replaces crossties near Barree,
Pennsylvania, as an eastbound automotive train passes by. At right, a maintenance-of-way
train dumps ballast along a South Carolina
line. In 2017, the company installed
466 miles of rail, resurfaced 5,368 miles
of track, and installed 2.5 million crossties.

All directors stand for re-election annually. Information is as of March 1, 2018.BOARD OF DIRECTORS
THOMAS D. BELL JR. | Director since 2010 Bell is chairman of Mesa Capital Partners, a real estate investment company. He also served as chairman and CEO of Cousins Properties, a publicly traded real estate investment trust that invests in office buildings throughout the South, from 2002 to 2009. He is a director of Regal Entertainment Group Inc. and Southern Company Gas, formerly AGL Resources.COMMITTEES: compensation, executive, finance and risk management (chair) EXPERTISE: CEO/senior officer; environmental and safety; governance/board; governmental and stakeholder relations; human resources and compensation; marketing; strategic planning
ERSKINE B. BOWLES | Director since 2011 Bowles has been a senior advisor and non-executive vice chairman of BDT Capital Partners LLC, a merchant bank, since January 2012. He was co-chairman of the National Commission on Fiscal Responsibility and Reform after serving as president of the University of North Carolina from 2006 to 2010. Bowles is a director of Facebook Inc.COMMITTEES: compensation, finance and risk managementEXPERTISE: CEO/senior officer; finance and accounting; governance/board; governmental and stakeholder relations; human resources and compensation; strategic planning
WESLEY G. BUSH | Director since 2012
Bush has been chief executive officer and president of Northrop Grumman Corporation, a global aerospace and defense technology company, since 2010. He was elected to Northrop Grumman’s board in 2009 and named chairman in July 2011. Previously, he served as Northrop Grumman’s president and chief operating officer from 2007 to 2009 and as corporate vice president and chief financial officer from 2006 to 2007.COMMITTEES: compensation, finance and risk management EXPERTISE: CEO/senior officer; environmental and safety; finance and accounting; governance/board; governmental and stakeholder relations; human resources and compensation; information technology; strategic planning; transportation
DANIEL A. CARP | Director since 2006
Carp served as chairman of the board and chief executive officer of Eastman Kodak Company from 2000 until his retirement in 2005. He is a director of Delta Air Lines Inc., having been non-executive chairman of its board from 2007 until May 2016. He is a director of Texas Instruments Inc.COMMITTEES: compensation (chair), executive, governance and nominatingEXPERTISE: CEO/senior officer; governance/board; human resources and compensation; information technology; strategic planning; transportation

AMY E. MILES | Director since 2014 Miles has been a director and chief executive officer of Regal Entertainment Group Inc., a leading motion picture exhibitor, since June 2009. She was named chair of its board in March 2015. Previously, she served as Regal Entertainment’s executive vice president, chief financial officer and treasurer from March 2002 through June 2009. COMMITTEES: audit (chair), executive, governance and nominating EXPERTISE: CEO/senior officer; finance and accounting; governance/board; information technology; marketing; strategic planning
MICHAEL D. LOCKHART | Director since 2008 Lockhart served as chairman of the board, president and chief executive officer of Armstrong World Industries Inc., and its predecessor, Armstrong Holdings Inc., a leading global producer of flooring products and ceiling systems, from 2000 until his retirement in February 2010. Previously, he served as chairman and chief executive officer of General Signal Corporation, a diversified manufacturer, from September 1995 until it was acquired in 1998.COMMITTEES: audit, finance and risk managementEXPERTISE: CEO/senior officer; environmental and safety; finance and accounting; governance/board; marketing; strategic planning; transportation
STEVEN F. LEER | Lead Director | Director since 1999 Leer served as the chief executive officer of Arch Coal Inc., a company engaged in coal mining and related businesses, from 1992 through 2012. He was chairman of its board from 2006 through 2012 and its executive chairman from 2012 through 2014. He served as senior advisor to the president and CEO of Arch Coal from 2014 through May 2015. He is a director of Cenovus Energy Inc. and the non-executive chairman of USG Corporation.COMMITTEES: compensation, executive, governance and nominating (chair)EXPERTISE: CEO/senior officer; environmental and safety; governance/board; governmental and stakeholder relations; human resources and compensation; marketing; strategic planning; transportation
MITCHELL E. DANIELS JR. | Director since 2016
Daniels has been president of Purdue University since 2013 and served as governor of Indiana from 2005 to 2013. From 1990 to 2000, he worked for Eli Lilly and Company, holding the executive positions of president of North American pharmaceutical operations, and senior vice president of corporate strategy and policy. He is a director of Cerner Corp.COMMITTEES: compensation, governance and nominating EXPERTISE: CEO/senior officer; finance and accounting; governance/board; governmental and stakeholder relations; strategic planning
MARCELA E. DONADIO | Director since 2016
Donadio retired as a partner of Ernst & Young LLP, a multinational professional services firm, in 2014. From 2007 until her retirement, she was Americas Oil & Gas sector leader, with responsibility for one of Ernst & Young’s significant industry groups. She helped set firm strategy for oil and gas industry clients in the United States and throughout the Americas. She is a director of Marathon Oil Corp. and National Oilwell Varco Inc.COMMITTEES: audit, finance and risk managementEXPERTISE: CEO/senior officer; finance and accounting; governance/board; human resources and compensation; strategic planning

JAMES A. SQUIRES | Chairman, President and CEO | Director since 2014 Squires has been president of Norfolk Southern since 2013 and chief executive officer since June 2015. He was named chairman of the board of Norfolk Southern in October 2015. Previously, he served as Norfolk Southern’s executive vice president administration, executive vice president finance and chief financial officer, senior vice president finance, senior vice president law, and vice president law.COMMITTEES: executive (chair)EXPERTISE: CEO/senior officer; finance and accounting; governance/board; governmental and stakeholder relations; human resources and compensation; marketing; strategic planning; transportation
MARTIN H. NESBITT | Director since 2013 Nesbitt is the co-founder of The Vistria Group, a private equity firm. He served as president and chief executive officer of PRG Parking Management LLC, an off-airport parking management company, and managing director of Green Courte Partners LLC, a real estate investment firm, until 2012. He is a director of Jones Lang LaSalle Inc. and American Airlines Group Inc.COMMITTEES: audit, finance and risk managementEXPERTISE: CEO/senior officer; finance and accounting; governance/board; governmental and stakeholder relations; marketing; strategic planning
JOHN R. THOMPSON | Director since 2013 Thompson served as a government relations consultant for Best Buy Co. Inc., a multinational consumer electronics corporation, from October 2012 to April 2016. He served as senior vice president and general manager of BestBuy.com LLC, a subsidiary of Best Buy Co. Inc., from 2002 through 2012. Previously, he was a director of Belk Inc. and Wendy’s International Inc.COMMITTEES: audit, governance and nominatingEXPERTISE: CEO/senior officer; finance and accounting; governance/board; governmental and stakeholder relations; information technology; marketing; strategic planning
JENNIFER F. SCANLON | Director since 2018
Scanlon has been president and chief executive officer of USG Corporation, an industry-leading manufacturer of building products and innovative solutions, since November 2016. Previously, she was president of the company’s international business, president of its L&W Supply Corporation, and chief information officer and chairman of the board for USG Boral Building Products. She was elected to USG’s board in September 2016.COMMITTEES: compensation, finance and risk management EXPERTISE: CEO/senior officer; environmental and safety; governance/board; information technology; marketing; strategic planning; transportation
Norfolk Southern has generated tremendous momentum since rolling out our strategic plan two years ago. Through the energy and talent of our employees, we have demonstrated the ability to deliver on our financial and operational goals.
~ Jim Squires

OFFICERSAs of March 1, 2018
EQUAL EMPLOYMENT OPPORTUNITY POLICY
Norfolk Southern Corporation’s policy is to comply with all applicable laws, regulations, and executive orders
concerning equal employment opportunity and nondiscrimination. The company’s policy is to offer
employment on the basis of qualification and performance, regardless of race, religion, color, national origin, gender,
age, sexual orientation, veteran status, the presence of a disability, or any other legally protected status.
JAMES A. SQUIRESChairman, President and Chief Executive Officer
CYNTHIA C. EARHARTExecutive Vice President Finance and Chief Financial Officer
JOHN M. SCHEIBExecutive Vice President Law and Administration and Chief Legal Officer
ALAN H. SHAWExecutive Vice President and Chief Marketing Officer
MICHAEL J. WHEELERExecutive Vice President and Chief Operating Officer
ANN A. ADAMSVice President Human Resources
CLYDE H. “JAKE” ALLISON JR.Vice President and Treasurer
FREDRIC M. EHLERSVice President Information Technology and Chief Information Officer
JOHN H. FRIEDMANNVice President Network Operations and Strategic Planning
JERRY W. HALLVice President Transportation
JEFFREY S. HELLERVice President Intermodal and Automotive
THOMAS E. HURLBUTVice President and Controller
ROBERT M. KESLER JR.Vice President Taxation
KAROL R. LAWRENCEVice President Network and Service Management
DAVID T. LAWSONVice President Coal
BRUNO MAESTRIVice President Government Relations
ROBERT E. MARTÍNEZVice President Business Development and Real Estate
MICHAEL R. MCCLELLANVice President Industrial Products
PHILIP G. MERILLIVice President Engineering
SUSAN S. STUARTVice President Audit and Compliance
SCOTT R. WEAVERVice President Labor Relations
THOMAS G. WERNERVice President Corporate Communications and Chief Sustainability Officer
DENISE W. HUTSONCorporate Secretary

UNITED STATES SECURITIES AND EXCHANGE COMMISSIONWashington, DC 20549
FORM 10-K
(X) ANNUAL REPORT PURSUANT TO SECTION 13 OR 15(d) OF THE SECURITIES EXCHANGE ACT OF 1934for the fiscal year ended DECEMBER 31, 2017 ( ) TRANSITION REPORT PURSUANT TO SECTION 13 OR 15(d) OF THE SECURITIES EXCHANGE ACT OF 1934for the transition period from ___________ to___________
Commission file number 1-8339
NORFOLK SOUTHERN CORPORATION(Exact name of registrant as specified in its charter)
Virginia(State or other jurisdiction of incorporation)
52-1188014(IRS Employer Identification No.)
Three Commercial PlaceNorfolk, Virginia
(Address of principal executive offices)23510-2191(Zip Code)
Registrant’s telephone number, including area code: (757) 629-2680
Securities registered pursuant to Section 12(b) of the Act:
Title of each Class Name of each exchange on which registeredNorfolk Southern Corporation
Common Stock (Par Value $1.00) New York Stock Exchange
Securities registered pursuant to Section 12(g) of the Act: NONE Indicate by check mark if the registrant is a well-known seasoned issuer, as defined in Rule 405 of the Securities Act. Yes (X) No ( ) Indicate by check mark if the registrant is not required to file reports pursuant to Section 13 or 15(d) of the Act. Yes ( ) No (X) Indicate by check mark whether the registrant: (1) has filed all reports required to be filed by Section 13 or 15(d) of the Securities ExchangeAct of 1934 during the preceding 12 months (or for such shorter period that the registrant was required to file such reports), and (2) has beensubject to such filing requirements for the past 90 days. Yes (X) No ( ) Indicate by check mark whether the registrant has submitted electronically and posted on its corporate Web site, if any, every Interactive DataFile required to be submitted and posted pursuant to Rule 405 of Regulations S-T (§ 232.405 of this chapter) during the preceding 12 months(or for such shorter period that the registrant was required to submit and post such files). Yes (X) No ( ) Indicate by check mark if disclosure of delinquent filers pursuant to Item 405 of Regulation S-K (§ 229.405 of this chapter) is not containedherein, and will not be contained, to the best of registrant’s knowledge, in definitive proxy or information statements incorporated by referencein Part III of this Form 10-K or any amendment to this Form 10-K. (X) Indicate by check mark whether the registrant is a large accelerated filer, an accelerated filer, a non-accelerated filer, a smaller reporting company,or emerging growth company. See definitions of “large accelerated filer,” “accelerated filer,” “smaller reporting company,” and “emerginggrowth company” in Rule 12b-2 of the Exchange Act.Large accelerated filer (X) Accelerated filer ( ) Non-accelerated filer ( ) Smaller reporting company ( ) Emerging growth company ( ) If an emerging growth company, indicate by check mark if the registrant has elected not to use the extended transition period for complying withany new or revised financial accounting standards provided pursuant to Section 13(a) of the Exchange Act [ ]
Indicate by check mark whether the registrant is a shell company (as defined in Rule 12b-2 of the Act). Yes ( ) No (X) The aggregate market value of the voting common equity held by non-affiliates at June 30, 2017, was $35,044,199,563 (based on the closingprice as quoted on the New York Stock Exchange on that date). The number of shares outstanding of each of the registrant’s classes of common stock, at January 31, 2018: 283,997,242 (excluding 20,320,777shares held by the registrant’s consolidated subsidiaries). DOCUMENTS INCORPORATED BY REFERENCE: Portions of the Registrant’s definitive proxy statement to be filed electronically pursuantto Regulation 14A not later than 120 days after the end of the fiscal year, are incorporated herein by reference in Part III.
TABLE OF CONTENTS
NORFOLK SOUTHERN CORPORATION AND SUBSIDIARIES
PagePart I. Items 1 and 2. Business and Properties K3
Item 1A. Risk Factors K10Item 1B. Unresolved Staff Comments K13Item 3. Legal Proceedings K13Item 4. Mine Safety Disclosures K13
Executive Officers of the Registrant K14
Part II. Item 5. Market for Registrant’s Common Equity, Related Stockholder Matters andIssuer Purchases of Equity Securities K15
Item 6. Selected Financial Data K16Item 7. Management’s Discussion and Analysis of Financial Condition and
Results of Operations K17Item 7A. Quantitative and Qualitative Disclosures About Market Risk K30Item 8. Financial Statements and Supplementary Data K31Item 9. Changes in and Disagreements with Accountants on Accounting and
Financial Disclosure K72Item 9A. Controls and Procedures K72Item 9B. Other Information K72
Part III. Item 10. Directors, Executive Officers and Corporate Governance K73Item 11. Executive Compensation K73Item 12. Security Ownership of Certain Beneficial Owners and Management
and Related Stockholder Matters K74Item 13. Certain Relationships and Related Transactions, and Director Independence K76Item 14. Principal Accounting Fees and Services K76
Part IV. Item 15. Exhibits, Financial Statement Schedules K77Item 16. Form 10-K Summary K87
Power of Attorney K88
Signatures K88
K2

PART I
NORFOLK SOUTHERN CORPORATION AND SUBSIDIARIES
K3
Item 1. Business and Item 2. Properties GENERAL – Our company, Norfolk Southern Corporation, is a Norfolk, Virginia based company that owns amajor freight railroad, Norfolk Southern Railway Company (NSR). We were incorporated on July 23, 1980, underthe laws of the Commonwealth of Virginia. Our common stock (Common Stock) is listed on the New York StockExchange (NYSE) under the symbol “NSC.” Unless indicated otherwise, Norfolk Southern Corporation and its subsidiaries, including NSR, are referred tocollectively as NS, we, us, and our. We are primarily engaged in the rail transportation of raw materials, intermediate products, and finished goodsprimarily in the Southeast, East, and Midwest and, via interchange with rail carriers, to and from the rest of theUnited States. We also transport overseas freight through several Atlantic and Gulf Coast ports. We offer the mostextensive intermodal network in the eastern half of the United States. We make available free of charge through our website, www.norfolksouthern.com, our annual report on Form 10-K,quarterly reports on Form 10-Q, current reports on Form 8-K, and all amendments to those reports as soon asreasonably practicable after such material is electronically filed with or furnished to the U.S. Securities andExchange Commission (SEC). In addition, the following documents are available on our website and in print toany shareholder who requests them:
• Corporate Governance Guidelines• Charters of the Committees of the Board of Directors• The Thoroughbred Code of Ethics• Code of Ethical Conduct for Senior Financial Officers• Categorical Independence Standards for Directors• Norfolk Southern Corporation Bylaws

RAILROAD OPERATIONS – At December 31, 2017, our railroad operated approximately 19,500 miles of roadin 22 states and the District of Columbia. Our system reaches many manufacturing plants, electric generating facilities, mines, distribution centers, transloadfacilities, and other businesses located in our service area.
Corridors with heaviest freight volume:• New York City area to Chicago (via Allentown and Pittsburgh)• Chicago to Macon (via Cincinnati, Chattanooga, and Atlanta)• Central Ohio to Norfolk (via Columbus and Roanoke)• Birmingham to Meridian• Memphis to Chattanooga• Cleveland to Kansas City
K4

The miles operated, which include major leased lines between Cincinnati, Ohio, and Chattanooga, Tennessee, andan exclusive operating agreement for trackage rights over property owned by North Carolina Railroad Company,were as follows:
Mileage Operated at December 31, 2017
Milesof
Road
Secondand
OtherMainTrack
PassingTrack,
Crossoversand
Turnouts
Way andYard
Switching Total
Owned 14,711 2,753 1,952 8,320 27,736Operated under lease, contract or trackage
rights 4,756 1,932 398 835 7,921
Total 19,467 4,685 2,350 9,155 35,657 We operate freight service over lines with significant ongoing Amtrak and commuter passenger operations, andconduct freight operations over trackage owned or leased by Amtrak, New Jersey Transit, SoutheasternPennsylvania Transportation Authority, Metro-North Commuter Railroad Company, Maryland Department ofTransportation, and Michigan Department of Transportation.
The following table sets forth certain statistics relating to our railroads’ operations for the past five years:
Years ended December 31,2017 2016 2015 2014 2013
Revenue ton miles (billions) 201 191 200 205 194Revenue per thousand revenue ton miles $ 52.38 $ 51.91 $ 52.63 $ 56.70 $ 58.10Revenue ton miles (thousands) per railroad employee 7,474 6,838 6,645 7,054 6,517Ratio of railway operating expenses to railway
operating revenues 67.4% 1 68.9% 72.6% 69.2% 71.0%
1Note: See reconciliation to U.S. Generally Accepted Accounting Principles (GAAP) in Part II, Item 7,“Management’s Discussion and Analysis of Financial Condition and Results of Operations.”
K5
RAILWAY OPERATING REVENUES – Total railway operating revenues were $10.6 billion in 2017. Followingis an overview of our three major market groups. See the discussion of merchandise revenues by commodity group,intermodal revenues, and coal revenues and tonnage in Part II, Item 7, “Management’s Discussion and Analysis ofFinancial Condition and Results of Operations.” MERCHANDISE – Our merchandise market group is composed of five major commodity groupings:
• Chemicals includes sulfur and related chemicals, petroleum products (including crude oil), chlorine andbleaching compounds, plastics, rubber, industrial chemicals, and chemical wastes.
• Agriculture, consumer products, and government includes soybeans, wheat, corn, fertilizer, livestock andpoultry feed, food oils, flour, beverages, canned goods, sweeteners, consumer products, ethanol,transportation equipment, and items for the U.S. military.
• Metals and construction includes steel, aluminum products, machinery, scrap metals, cement, aggregates,sand, and minerals.
• Automotive includes finished motor vehicles and automotive parts.

• Paper, clay and forest products includes lumber and wood products, pulp board and paper products, woodfibers, wood pulp, scrap paper, and clay.
Merchandise carloads handled in 2017 were 2.5 million, the revenues from which accounted for 60% of our totalrailway operating revenues.
K6
INTERMODAL – Our intermodal market group consists of shipments moving in domestic and internationalcontainers and trailers. These shipments are handled on behalf of intermodal marketing companies, internationalsteamship lines, truckers, and other shippers. Intermodal units handled in 2017 were 4.1 million, the revenues fromwhich accounted for 23% of our total railway operating revenues. COAL – Revenues from coal accounted for 17% of our total railway operating revenues in 2017. We handled 116million tons, or 1.0 million carloads, in 2017, most of which originated on our lines from major eastern coal basins,with the balance from major western coal basins received via the Memphis and Chicago gateways. Our coalfranchise supports the electric generation market, serving approximately 76 coal generation plants, as well as theexport, domestic metallurgical and industrial markets, primarily through direct rail and river, lake, and coastalfacilities, including various terminals on the Ohio River, Lamberts Point in Norfolk, Virginia, the Port of Baltimore,and Lake Erie.
FREIGHT RATES – Our predominant pricing mechanisms, private contracts and exempt price quotes, are notsubject to regulation. In general, market forces are the primary determinant of rail service prices. In 2017, our railroad was found by the U.S. Surface Transportation Board (STB), the regulatory board that hasbroad jurisdiction over railroad practices, to be “revenue adequate” on an annual basis based on results for the year2016. The STB has not made its revenue adequacy determination for the year 2017. A railroad is “revenueadequate” on an annual basis under the applicable law when its return on net investment exceeds the rail industry’scomposite cost of capital. This determination is made pursuant to a statutory requirement. RAILWAY PROPERTY Our railroad infrastructure makes us capital intensive with net property of approximately $30 billion on a historicalcost basis.
Property Additions – Property additions for the past five years were as follows:
2017 2016 2015 2014 2013($ in millions)
Road and other property $ 1,210 $ 1,292 $ 1,514 $ 1,406 $ 1,421Equipment 513 595 658 712 550Delaware & Hudson acquisition — — 213 — —
Total $ 1,723 $ 1,887 $ 2,385 $ 2,118 $ 1,971
Our capital spending and replacement programs are and have been designed to assure the ability to provide safe,efficient, and reliable rail transportation services. For 2018, we have budgeted $1.8 billion of property additions.

Equipment – At December 31, 2017, we owned or leased the following units of equipment:
Owned Leased TotalCapacity ofEquipment
Locomotives: (Horsepower)Multiple purpose 3,911 14 3,925 14,948,800Auxiliary units 175 — 175 —Switching 55 — 55 82,050
Total locomotives 4,141 14 4,155 15,030,850
Freight cars: (Tons)Gondola 25,265 2,549 27,814 3,086,465Hopper 11,266 — 11,266 1,272,224Covered hopper 9,061 85 9,146 1,013,837Box 8,248 1,362 9,610 829,014Flat 1,776 1,484 3,260 316,534Other 1,606 4 1,610 74,100
Total freight cars 57,222 5,484 62,706 6,592,174
Other:Chassis 28,710 — 28,710Containers 16,190 1,738 17,928Work equipment 7,213 287 7,500Vehicles 4,072 156 4,228Miscellaneous 2,387 189 2,576
Total other 58,572 2,370 60,942
The following table indicates the number and year built for locomotives and freight cars owned at December 31,2017:
2017 2016 2015 2014 20132008-2012
2003-2007
2002 &Before Total
Locomotives:No. of units 53 66 8 83 50 231 624 3,026 4,141% of fleet 1% 2% —% 2% 1% 6% 15% 73% 100%
Freight cars:No. of units 470 775 2,091 897 — 8,889 1,658 42,442 57,222% of fleet 1% 1% 4% 1% —% 16% 3% 74% 100%
K7

The following table shows the average age of our owned locomotive and freight car fleets at December 31, 2017,and information regarding 2017 retirements:
Locomotives Freight Cars Average age – in service 24.4 years 28.5 yearsRetirements 180 units 6,947 unitsAverage age – retired 33.2 years 44.7 years
Track Maintenance – Of the approximately 35,700 total miles of track on which we operate, we are responsiblefor maintaining approximately 28,500 miles, with the remainder being operated under trackage rights from otherparties responsible for maintenance. Over 83% of the main line trackage (including first, second, third, and branch main tracks, all excluding railoperated pursuant to trackage rights) has rail ranging from 131 to 155 pounds per yard with the standard installationcurrently at 136 pounds per yard. Approximately 46% of our lines, excluding rail operated pursuant to trackagerights, carried 20 million or more gross tons per track mile during 2017. The following table summarizes several measurements regarding our track roadway additions and replacementsduring the past five years:
2017 2016 2015 2014 2013Track miles of rail installed 466 518 523 507 549Miles of track surfaced 5,368 4,984 5,074 5,248 5,475Crossties installed (millions) 2.5 2.3 2.4 2.7 2.5
Traffic Control – Of the approximately 16,400 route miles we dispatch, about 11,300 miles are signalized,including 8,500 miles of centralized traffic control (CTC) and 2,800 miles of automatic block signals. Of the 8,500miles of CTC, approximately 7,600 miles are controlled by data radio originating at 355 base station radio sites.
K8
ENVIRONMENTAL MATTERS – Compliance with federal, state, and local laws and regulations relating to theprotection of the environment is one of our principal goals. To date, such compliance has not had a material effecton our financial position, results of operations, liquidity, or competitive position. See Note 16 to the ConsolidatedFinancial Statements. EMPLOYEES – The following table shows the average number of employees and the average cost per employeefor wages and benefits:
2017 2016 2015 2014 2013
Average number of employees 27,110 28,044 30,456 29,482 30,103Average wage cost per employee $ 79,000 $ 76,000 $ 77,000 $ 76,000 $ 72,000Average benefit cost per employee $ 42,000 $ 35,000 $ 32,000 $ 35,000 $ 40,000
Approximately 80% of our railroad employees are covered by collective bargaining agreements with various laborunions. See the discussion of “Labor Agreements” in Part II, Item 7, “Management’s Discussion and Analysis ofFinancial Condition and Results of Operations.”

GOVERNMENT REGULATION – In addition to environmental, safety, securities, and other regulationsgenerally applicable to all business, our railroads are subject to regulation by the STB. The STB has jurisdiction tovarying extents over rates, routes, customer access provisions, fuel surcharges, conditions of service, and theextension or abandonment of rail lines. The STB also has jurisdiction over the consolidation, merger, or acquisitionof control of and by rail common carriers. The relaxation of economic regulation of railroads, following the Staggers Rail Act of 1980, included exemptionfrom STB regulation of the rates and most service terms for intermodal business (trailer-on-flat-car, container-on-flat-car), rail boxcar shipments, lumber, manufactured steel, automobiles, and certain bulk commodities such assand, gravel, pulpwood, and wood chips for paper manufacturing. Further, all shipments that we have undercontract are effectively removed from commercial regulation for the duration of the contract. Approximately 90%of our revenues comes from either exempt shipments or shipments moving under transportation contracts; theremainder comes from shipments moving under public tariff rates. Efforts have been made over the past several years to increase federal economic regulation of the rail industry, andsuch efforts are expected to continue in 2018. The Staggers Rail Act of 1980 substantially balanced the interests ofshippers and rail carriers, and encouraged and enabled rail carriers to innovate, invest in their infrastructure, andcompete for business, thereby contributing to the economic health of the nation and to the revitalization of theindustry. Accordingly, we will continue to oppose efforts to reimpose increased economic regulation. Government regulations are discussed within Item 1A. “Risk Factors” and the safety and security of our railroadsare discussed within the “Security of Operations” section contained herein.
K9
COMPETITION – There is continuing strong competition among rail, water, and highway carriers. Price isusually only one factor of importance as shippers and receivers choose a transport mode and specific haulingcompany. Inventory carrying costs, service reliability, ease of handling, and the desire to avoid loss and damageduring transit are also important considerations, especially for higher-valued finished goods, machinery, andconsumer products. Even for raw materials, semi-finished goods, and work-in-progress, users are increasinglysensitive to transport arrangements that minimize problems at successive production stages.
Our primary rail competitor is CSX Corporation (CSX); both NS and CSX operate throughout much of the sameterritory. Other railroads also operate in parts of the territory. We also compete with motor carriers, water carriers,and with shippers who have the additional options of handling their own goods in private carriage, sourcingproducts from different geographic areas, and using substitute products. Certain marketing strategies to expand reach and shipping options among railroads and between railroads and motorcarriers enable railroads to compete more effectively in specific markets.
SECURITY OF OPERATIONS – We continue to enhance the security of our rail system. Our comprehensivesecurity plan is modeled on and was developed in conjunction with the security plan prepared by the Association ofAmerican Railroads (AAR) post September 11, 2001. The AAR Security Plan defines four Alert Levels and detailsthe actions and countermeasures that are being applied across the railroad industry as a terrorist threat increases ordecreases. The Alert Level actions include countermeasures that will be applied in three general areas: (1)operations (including transportation, engineering, and mechanical); (2) information technology andcommunications; and, (3) railroad police. All of our Operations Division employees are advised by theirsupervisors or train dispatchers, as appropriate, of any change in Alert Level and any additional responsibilities theymay incur due to such change.
Our plan also complies with U.S. Department of Transportation (DOT) security regulations pertaining to trainingand security plans with respect to the transportation of hazardous materials. As part of the plan, security awarenesstraining is given to all railroad employees who directly affect hazardous material transportation safety, and isintegrated into hazardous material training programs. Additionally, location-specific security plans are in place forcertain metropolitan areas and each of the six facilities we operate that are under U.S. Coast Guard (USCG)

Maritime Security Regulations. With respect to these facilities, each facility’s security plan has been approved bythe applicable Captain of the Port and remains subject to inspection by the USCG. Additionally, we continue to engage in close and regular coordination with numerous federal and state agencies,including the U.S. Department of Homeland Security (DHS), the Transportation Security Administration, theFederal Bureau of Investigation, the Federal Railroad Administration (FRA), the USCG, U.S. Customs and BorderProtection, the Department of Defense, and various state Homeland Security offices. Similarly, we follow guidancefrom DHS and DOT regarding rail corridors in High Threat Urban Areas (HTUA). Particular attention is aimed atreducing risk in HTUA by: (1) the establishment of secure storage areas for rail cars carrying toxic-by-inhalation(TIH) materials; (2) the expedited movement of trains transporting rail cars carrying TIH materials; (3) substantiallyreducing the number of unattended loaded tank cars carrying TIH materials; and (4) cooperation with federal, state,local, and tribal governments to identify those locations where security risks are the highest.
In 2017, through participation in the Transportation Community Awareness and Emergency Response(TRANSCAER) Program, we provided rail accident response training to approximately 8,185 emergencyresponders, such as local police and fire personnel. Our other training efforts throughout 2017 includedparticipation in drills for local, state, and federal agencies. We also have ongoing programs to sponsor localemergency responders at the Security and Emergency Response Training Course conducted at the AARTransportation Technology Center in Pueblo, Colorado.
K10
Item 1A. Risk Factors
The risks set forth in the following risk factors could have a materially adverse effect on our financial condition,results of operations, or liquidity in a particular year or quarter, and could cause those results to differ materiallyfrom those expressed or implied in our forward-looking statements. The information set forth in this Item 1A. “RiskFactors” should be read in conjunction with the rest of the information included in this annual report, includingItem 7 “Management’s Discussion and Analysis of Financial Condition and Results of Operations” and Item 8“Financial Statements and Supplementary Data.” Significant governmental legislation and regulation over commercial, operating and environmental matterscould affect us, our customers, and the markets we serve. Congress can enact laws that could increase economicregulation of the industry. Railroads presently are subject to commercial regulation by the STB, which hasjurisdiction to varying extents over rates, routes, customer access provisions, fuel surcharges, conditions of service,and the extension or abandonment of rail lines. The STB also has jurisdiction over the consolidation, merger, oracquisition of control of and by rail common carriers. Additional economic regulation of the rail industry byCongress or the STB, whether under new or existing laws, could have a significant negative impact on our ability todetermine prices for rail services and on the efficiency of our operations. This potential material adverse effectcould also result in reduced capital spending on our rail network or abandonment of lines.
Railroads are also subject to the enactment of laws by Congress and regulation by the DOT and the DHS (whichregulate most aspects of our operations) related to safety and security. The Rail Safety Improvement Act of 2008(RSIA), the Surface Transportation Extension Act of 2015, and the implementing regulations promulgated by theFRA (collectively “the PTC laws and regulations”) require us (and each other Class I railroad) to implement, oncertain mainline track where intercity and commuter passenger railroads operate and where TIH hazardousmaterials are transported, an interoperable positive train control system (PTC). PTC is a set of highly advancedtechnologies designed to prevent train-to-train collisions, speed-related derailments, and certain other accidentscaused by human error, but PTC will not prevent all types of train accidents or incidents. The PTC laws andregulations require us to install all hardware and to implement the PTC system on some of those rail lines byDecember 31, 2018, and to implement such system on the remainder of those rail lines by December 31, 2020.
Full implementation of PTC in compliance with RSIA, as amended, will result in additional operating costs andcapital expenditures, and PTC implementation may result in reduced operational efficiency and service levels, aswell as increased compensation and benefits expenses, and increased claims and litigation costs.

Our operations are subject to extensive federal and state environmental laws and regulations concerning, amongother things, emissions to the air; discharges to waterways or groundwater supplies; handling, storage,transportation, and disposal of waste and other materials; and the cleanup of hazardous material or petroleumreleases. The risk of incurring environmental liability, for acts and omissions, past, present, and future, is inherent inthe railroad business. This risk includes property owned by us, whether currently or in the past, that is or has beensubject to a variety of uses, including our railroad operations and other industrial activity by past owners or our pastand present tenants.
Environmental problems that are latent or undisclosed may exist on these properties, and we could incurenvironmental liabilities or costs, the amount and materiality of which cannot be estimated reliably at this time,with respect to one or more of these properties. Moreover, lawsuits and claims involving other unidentifiedenvironmental sites and matters are likely to arise from time to time.
Concern over climate change has led to significant federal, state, and international legislative and regulatory effortsto limit greenhouse gas (GHG) emissions. Restrictions, caps, taxes, or other controls on GHG emissions, includingdiesel exhaust, could significantly increase our operating costs, decrease the amount of traffic handled, and decreasethe value of coal reserves we own.
In addition, legislation and regulation related to GHGs could negatively affect the markets we serve and ourcustomers. Even without legislation or regulation, government incentives and adverse publicity relating to GHGscould negatively affect the markets for certain of the commodities we carry and our customers that (1) usecommodities that we carry to produce energy, including coal, (2) use significant amounts of energy in producing ordelivering the commodities we carry, or (3) manufacture or produce goods that consume significant amounts ofenergy.
As a common carrier by rail, we must offer to transport hazardous materials, regardless of risk.Transportation of certain hazardous materials could create catastrophic losses in terms of personal injury andproperty (including environmental) damage, and compromise critical parts of our rail network. The cost of acatastrophic rail accident involving hazardous materials could exceed our insurance coverage. We have obtainedinsurance for potential losses for third-party liability and first-party property damages (see Note 16 to theConsolidated Financial Statements); however, insurance is available from a limited number of insurers and may notcontinue to be available or, if available, may not be obtainable on terms acceptable to us.
We may be affected by general economic conditions. Prolonged negative changes in domestic and globaleconomic conditions could affect the producers and consumers of the commodities we carry. Economic conditionscould also result in bankruptcies of one or more large customers.
Significant increases in demand for rail services could result in the unavailability of qualified personnel andlocomotives. In addition, workforce demographics and training requirements, particularly for engineers andconductors, could have a negative impact on our ability to meet short-term demand for rail service. Unpredictedincreases in demand for rail services may exacerbate such risks.
We may be affected by energy prices. Volatility in energy prices could have a significant effect on a variety ofitems including, but not limited to: the economy; demand for transportation services; business related to the energysector, including crude oil, natural gas, and coal; fuel prices; and fuel surcharges.
We face competition from other transportation providers. We are subject to competition from motor carriers,railroads and, to a lesser extent, ships, barges, and pipelines, on the basis of transit time, pricing, and quality andreliability of service. While we have used primarily internal resources to build or acquire and maintain our railsystem, trucks and barges have been able to use public rights-of-way maintained by public entities. Any futureimprovements, expenditures, legislation, or regulation materially increasing the quality or reducing the cost ofalternative modes of transportation in the regions in which we operate (such as granting materially greater latitude
K11

for motor carriers with respect to size or weight limitations or adoption of autonomous commercial vehicles) couldhave a material adverse effect on our operations.
The operations of carriers with which we interchange may adversely affect our operations. Our ability toprovide rail service to customers in the U.S. and Canada depends in large part upon our ability to maintaincollaborative relationships with connecting carriers (including shortlines and regional railroads) with respect to,among other matters, freight rates, revenue division, car supply and locomotive availability, data exchange andcommunications, reciprocal switching, interchange, and trackage rights. Deterioration in the operations of or serviceprovided by connecting carriers, or in our relationship with those connecting carriers, could result in our inability tomeet our customers’ demands or require us to use alternate train routes, which could result in significant additionalcosts and network inefficiencies. Additionally, any significant consolidations, mergers or operational changesamong other railroads may significantly redefine our market access and reach.
We rely on technology and technology improvements in our business operations. If we experience significantdisruption or failure of one or more of our information technology systems, including computer hardware, software,and communications equipment, we could experience a service interruption, a security breach, or other operationaldifficulties. We also face cybersecurity threats which may result in breaches of systems, or compromises ofsensitive data, which may result in an inability to access or operate systems necessary for conducting operations andproviding customer service, thereby impacting our efficiency and/or damaging our corporate reputation.Additionally, if we do not have sufficient capital to acquire new technology or we are unable to implement newtechnology, we may suffer a competitive disadvantage within the rail industry and with companies providing othermodes of transportation service.
The vast majority of our employees belong to labor unions, and labor agreements, strikes, or work stoppagescould adversely affect our operations. Approximately 80% of our railroad employees are covered by collectivebargaining agreements with various labor unions. If unionized workers were to engage in a strike, work stoppage, orother slowdown, we could experience a significant disruption of our operations. Additionally, future national laboragreements, or renegotiation of labor agreements or provisions of labor agreements, could significantly increase ourcosts for health care, wages, and other benefits.
We may be subject to various claims and lawsuits that could result in significant expenditures. The nature ofour business exposes us to the potential for various claims and litigation related to labor and employment, personalinjury, commercial disputes, freight loss and other property damage, and other matters. Job-related personal injuryand occupational claims are subject to the Federal Employer’s Liability Act (FELA), which is applicable only torailroads. FELA’s fault-based tort system produces results that are unpredictable and inconsistent as compared witha no-fault worker’s compensation system. The variability inherent in this system could result in actual costs beingdifferent from the liability recorded.
Any material changes to current litigation trends or a catastrophic rail accident involving any or all of freight lossproperty damage, personal injury, and environmental liability could have a material adverse effect on us to theextent not covered by insurance. We have obtained insurance for potential losses for third-party liability and first-party property damages; however, insurance is available from a limited number of insurers and may not continue tobe available or, if available, may not be obtainable on terms acceptable to us.
Severe weather could result in significant business interruptions and expenditures. Severe weather conditionsand other natural phenomena, including hurricanes, floods, fires, and earthquakes, may cause significant businessinterruptions and result in increased costs, increased liabilities, and decreased revenues.
We may be affected by terrorism or war. Any terrorist attack, or other similar event, any government responsethereto, and war or risk of war could cause significant business interruption. Because we play a critical role in thenation’s transportation system, we could become the target of such an attack or have a significant role in thegovernment’s preemptive approach or response to an attack or war.
K12

Although we currently maintain insurance coverage for third-party liability arising out of war and acts of terrorism,we maintain only limited insurance coverage for first-party property damage and damage to property in our care,custody, or control caused by certain acts of terrorism. In addition, premiums for some or all of our currentinsurance programs covering these losses could increase dramatically, or insurance coverage for certain losses couldbe unavailable to us in the future.
We may be affected by supply constraints resulting from disruptions in the fuel markets or the nature ofsome of our supplier markets. We consumed approximately 458 million gallons of diesel fuel in 2017. Fuelavailability could be affected by any limitation in the fuel supply or by any imposition of mandatory allocation orrationing regulations. A severe fuel supply shortage arising from production curtailments, increased demand inexisting or emerging foreign markets, disruption of oil imports, disruption of domestic refinery production, damageto refinery or pipeline infrastructure, political unrest, war or other factors could impact us as well as our customersand other transportation companies.
Due to the capital intensive nature, as well as the industry-specific requirements of the rail industry, high barriers ofentry exist for potential new suppliers of core railroad items, such as locomotives and rolling stock equipment.Additionally, we compete with other industries for available capacity and raw materials used in the production oflocomotives and certain track and rolling stock materials. Changes in the competitive landscapes of these limitedsupplier markets could result in increased prices or significant shortages of materials.
The state of capital markets could adversely affect our liquidity. We rely on the capital markets to provide someof our capital requirements, including the issuance of debt instruments, as well as the sale of certain receivables.Significant instability or disruptions of the capital markets, including the credit markets, or deterioration of ourfinancial condition due to internal or external factors could restrict or eliminate our access to, and/or significantlyincrease the cost of, various financing sources, including bank credit facilities and issuance of corporate bonds.Instability or disruptions of the capital markets and deterioration of our financial condition, alone or in combination,could also result in a reduction in our credit rating to below investment grade, which could prohibit or restrict usfrom accessing external sources of short- and long-term debt financing and/or significantly increase the associatedcosts.
K13
Item 1B. Unresolved Staff Comments None.
Item 3. Legal Proceedings In 2007, various antitrust class actions filed against us and other Class I railroads in various Federal district courtsregarding fuel surcharges were consolidated in the District of Columbia by the Judicial Panel on MultidistrictLitigation. In 2012, the court certified the case as a class action. The defendant railroads appealed this certification,and the Court of Appeals for the District of Columbia vacated the District Court’s decision and remanded the casefor further consideration. On October 10, 2017, the District Court denied class certification; the findings are subjectto appeal. We believe the allegations in the complaints are without merit and intend to vigorously defend the cases.We do not believe the outcome of these proceedings will have a material effect on our financial position, results ofoperations, or liquidity.
Item 4. Mine Safety Disclosures Not applicable.

Executive Officers of the Registrant Our executive officers generally are elected and designated annually by the Board of Directors at its first meetingheld after the annual meeting of stockholders, and they hold office until their successors are elected. Executiveofficers also may be elected and designated throughout the year as the Board of Directors considers appropriate.There are no family relationships among our officers, nor any arrangement or understanding between any officerand any other person pursuant to which the officer was selected. The following table sets forth certain information,at February 1, 2018, relating to our officers.
Name, Age, Present Position Business Experience During Past Five Years
James A. Squires, 56,Chairman, President andChief Executive Officer
Present position since October 1, 2015. Served as CEO since June 1, 2015. Served as Presidentsince June 1, 2013. Served as Executive Vice President –Administration from August 1, 2012 to June 1, 2013.Served as Executive Vice President – Finance and ChiefFinancial Officer from July 1, 2007 to August 1, 2012.
Cynthia C. Earhart, 56, Executive Vice President – Finance and Chief Financial Officer
Present position since August 15, 2017.Served as Executive Vice President - Administration andChief Information Officer from October 1, 2015 to August15, 2017. Served as Executive Vice President -Administration from June 1, 2013 to October 1, 2015.Served as Vice President Human Resources from March 1,2007 to June 1, 2013.
William A. Galanko, 61, Executive Vice President – Law and Administration
Present position since October 1, 2017.Served as Senior Vice President - Law and CorporateCommunications from December 1, 2016 to October 1,2017. Served as Vice President Law from April 1, 2006 toDecember 1, 2016.
Alan H. Shaw, 50,Executive Vice President andChief Marketing Officer
Present position since May 16, 2015.Served as Vice President Intermodal Operations fromNovember 1, 2013 to May 16, 2015. Served as GroupVice President Industrial Products from November 16,2009 to November 1, 2013.
Michael J. Wheeler, 55,Executive Vice President andChief Operating Officer
Present position since February 1, 2016.Served as Senior Vice President Operations from October1, 2015 to February 1, 2016. Served as Vice PresidentEngineering from November 1, 2012 to October 1, 2015.Served as Vice President Transportation from February 1,2009 to November 1, 2012.
Thomas E. Hurlbut, 53,Vice President and Controller
Present position since November 1, 2013. Served as Vice President Audit and Compliance from February 1, 2010 to November 1, 2013.
K14

PART II
NORFOLK SOUTHERN CORPORATION AND SUBSIDIARIES
K15
Item 5. Market for Registrant’s Common Equity, Related Stockholder Matters and Issuer Purchases ofEquity Securities
STOCK PRICE AND DIVIDEND INFORMATION
Common Stock is owned by 25,737 stockholders of record as of December 31, 2017, and is traded on the New YorkStock Exchange under the symbol “NSC.” The following table shows the high and low sales prices as reported byBloomberg L.P. on its internet-based service and dividends per share, by quarter, for 2017 and 2016.
Quarter2017 1st 2nd 3rd 4th
Market PriceHigh $ 123.77 $ 124.51 $ 133.04 $ 145.82Low 107.39 112.07 112.28 126.45
Dividends per share 0.61 0.61 0.61 0.61
2016 1st 2nd 3rd 4thMarket Price
High $ 85.37 $ 93.15 $ 96.83 $ 110.52Low 66.41 78.93 83.89 90.77
Dividends per share 0.59 0.59 0.59 0.59
ISSUER PURCHASES OF EQUITY SECURITIES
Period
Total Numberof Shares(or Units)
Purchased(1)
AveragePrice Paidper Share(or Unit)
TotalNumber of
Shares (or Units)Purchased as
Part of PubliclyAnnounced
Plansor Programs(2)
MaximumNumber
(or ApproximateDollar Value)of Shares (or
Units)that may yet be
Purchased underthe Plans orPrograms(2)
October 1-31, 2017 776,328 $ 131.53 772,572 57,935,286November 1-30, 2017 786,387 129.44 785,106 57,150,180December 1-31, 2017 679,945 142.33 679,945 56,470,235
Total 2,242,660 2,237,623 (1) Of this amount, 5,037 represents shares tendered by employees in connection with the exercise of stock options
under the stockholder-approved Long-Term Incentive Plan.(2) On September 26, 2017, our Board of Directors authorized the repurchase of up to an additional 50 million
shares of Common Stock through December 31, 2022. As of December 31, 2017, 56.5 million shares remainauthorized for repurchase.

Item 6. Selected Financial Data
K16
FIVE-YEAR FINANCIAL REVIEW
2017 2016 2015 2014 2013($ in millions, except per share amounts)
RESULTS OF OPERATIONSRailway operating revenues $ 10,551 $ 9,888 $ 10,511 $ 11,624 $ 11,245Railway operating expenses 6,965 6,814 7,627 8,049 7,988
Income from railway operations 3,586 3,074 2,884 3,575 3,257
Other income – net 92 71 103 104 233Interest expense on debt 550 563 545 545 525
Income before income taxes 3,128 2,582 2,442 3,134 2,965
Income taxes (2,276) 914 886 1,134 1,055
Net income $ 5,404 $ 1,668 $ 1,556 $ 2,000 $ 1,910
PER SHARE DATANet income – basic $ 18.76 $ 5.66 $ 5.13 $ 6.44 $ 6.10
– diluted 18.61 5.62 5.10 6.39 6.04Dividends 2.44 2.36 2.36 2.22 2.04Stockholders’ equity at year end 57.57 42.73 40.93 40.26 36.55
FINANCIAL POSITIONTotal assets $ 35,711 $ 34,892 $ 34,139 $ 33,033 $ 32,259Total debt 9,836 10,212 10,093 8,985 9,404Stockholders’ equity 16,359 12,409 12,188 12,408 11,289
OTHERProperty additions $ 1,723 $ 1,887 $ 2,385 $ 2,118 $ 1,971
Average number of shares outstanding (thousands) 287,861 293,943 301,873 309,367 311,916Number of stockholders at year end 25,737 27,288 28,443 29,575 30,990Average number of employees:
Rail 26,955 27,856 30,057 29,063 29,698Nonrail 155 188 399 419 405
Total 27,110 28,044 30,456 29,482 30,103
Note: In 2017, as a result of the enactment of tax reform, “Railway operating expenses” includes a $151 millionbenefit and “Income taxes” includes a $3,331 million benefit, which added $3,482 million to “Net income” and$12.00 to “Diluted earnings per share.”See accompanying consolidated financial statements and notes thereto.
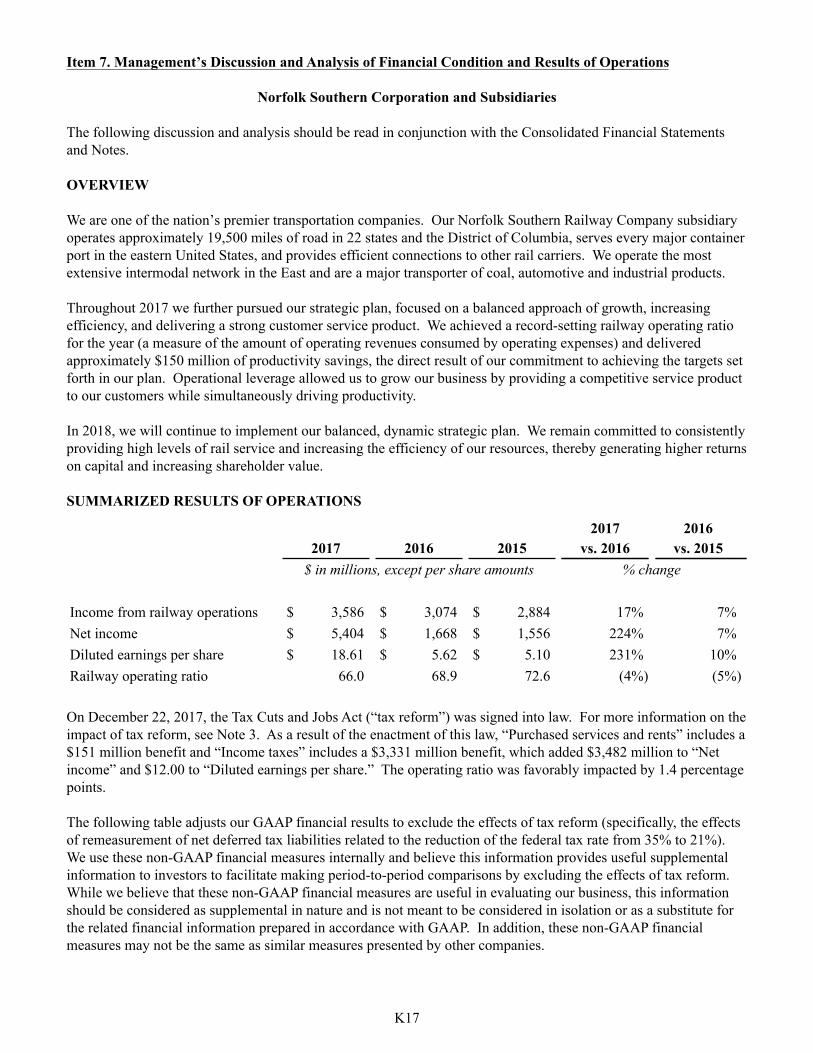
Item 7. Management’s Discussion and Analysis of Financial Condition and Results of Operations
Norfolk Southern Corporation and Subsidiaries
The following discussion and analysis should be read in conjunction with the Consolidated Financial Statementsand Notes.
K17
OVERVIEW We are one of the nation’s premier transportation companies. Our Norfolk Southern Railway Company subsidiaryoperates approximately 19,500 miles of road in 22 states and the District of Columbia, serves every major containerport in the eastern United States, and provides efficient connections to other rail carriers. We operate the mostextensive intermodal network in the East and are a major transporter of coal, automotive and industrial products.
Throughout 2017 we further pursued our strategic plan, focused on a balanced approach of growth, increasingefficiency, and delivering a strong customer service product. We achieved a record-setting railway operating ratiofor the year (a measure of the amount of operating revenues consumed by operating expenses) and deliveredapproximately $150 million of productivity savings, the direct result of our commitment to achieving the targets setforth in our plan. Operational leverage allowed us to grow our business by providing a competitive service productto our customers while simultaneously driving productivity.
In 2018, we will continue to implement our balanced, dynamic strategic plan. We remain committed to consistentlyproviding high levels of rail service and increasing the efficiency of our resources, thereby generating higher returnson capital and increasing shareholder value.
SUMMARIZED RESULTS OF OPERATIONS
2017 20162017 2016 2015 vs. 2016 vs. 2015
$ in millions, except per share amounts % change
Income from railway operations $ 3,586 $ 3,074 $ 2,884 17% 7%Net income $ 5,404 $ 1,668 $ 1,556 224% 7%Diluted earnings per share $ 18.61 $ 5.62 $ 5.10 231% 10%Railway operating ratio 66.0 68.9 72.6 (4%) (5%)
On December 22, 2017, the Tax Cuts and Jobs Act (“tax reform”) was signed into law. For more information on theimpact of tax reform, see Note 3. As a result of the enactment of this law, “Purchased services and rents” includes a$151 million benefit and “Income taxes” includes a $3,331 million benefit, which added $3,482 million to “Netincome” and $12.00 to “Diluted earnings per share.” The operating ratio was favorably impacted by 1.4 percentagepoints.
The following table adjusts our GAAP financial results to exclude the effects of tax reform (specifically, the effectsof remeasurement of net deferred tax liabilities related to the reduction of the federal tax rate from 35% to 21%).We use these non-GAAP financial measures internally and believe this information provides useful supplementalinformation to investors to facilitate making period-to-period comparisons by excluding the effects of tax reform.While we believe that these non-GAAP financial measures are useful in evaluating our business, this informationshould be considered as supplemental in nature and is not meant to be considered in isolation or as a substitute forthe related financial information prepared in accordance with GAAP. In addition, these non-GAAP financialmeasures may not be the same as similar measures presented by other companies.
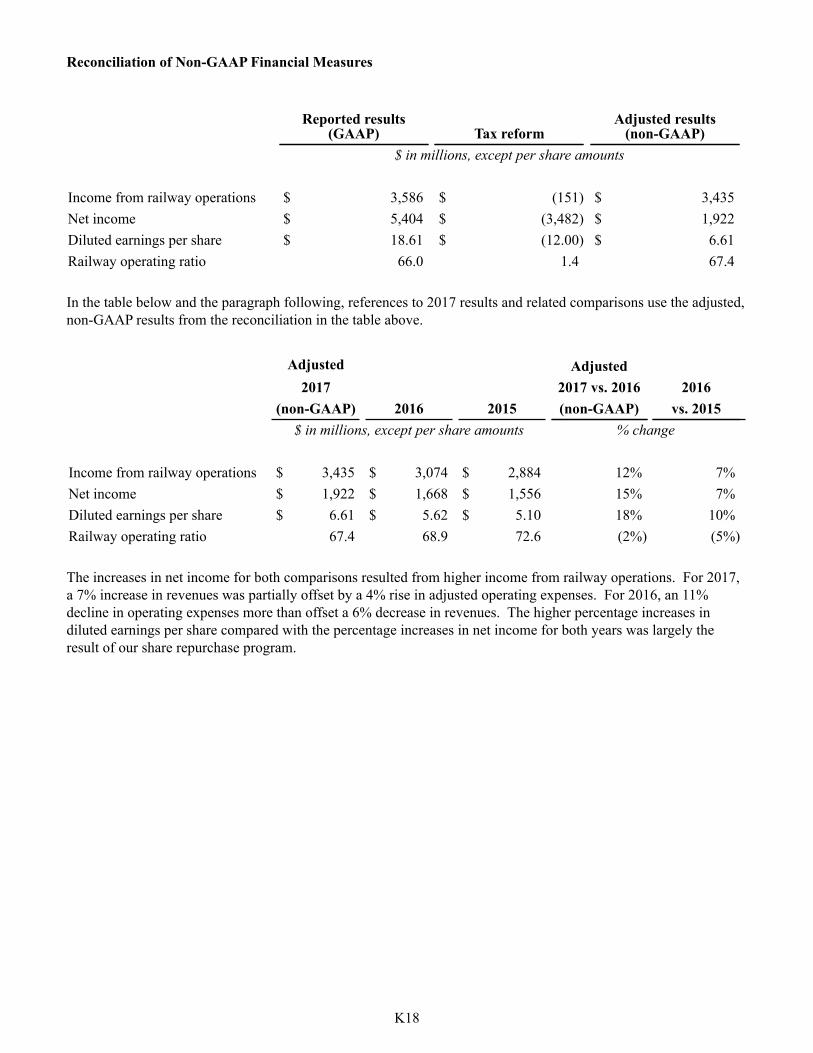
Reconciliation of Non-GAAP Financial Measures
Reported results(GAAP) Tax reform
Adjusted results(non-GAAP)
$ in millions, except per share amounts
Income from railway operations $ 3,586 $ (151) $ 3,435Net income $ 5,404 $ (3,482) $ 1,922Diluted earnings per share $ 18.61 $ (12.00) $ 6.61Railway operating ratio 66.0 1.4 67.4
In the table below and the paragraph following, references to 2017 results and related comparisons use the adjusted,non-GAAP results from the reconciliation in the table above.
Adjusted Adjusted2017 2017 vs. 2016 2016
(non-GAAP) 2016 2015 (non-GAAP) vs. 2015$ in millions, except per share amounts % change
Income from railway operations $ 3,435 $ 3,074 $ 2,884 12% 7%Net income $ 1,922 $ 1,668 $ 1,556 15% 7%Diluted earnings per share $ 6.61 $ 5.62 $ 5.10 18% 10%Railway operating ratio 67.4 68.9 72.6 (2%) (5%)
The increases in net income for both comparisons resulted from higher income from railway operations. For 2017,a 7% increase in revenues was partially offset by a 4% rise in adjusted operating expenses. For 2016, an 11%decline in operating expenses more than offset a 6% decrease in revenues. The higher percentage increases indiluted earnings per share compared with the percentage increases in net income for both years was largely theresult of our share repurchase program.
K18

DETAILED RESULTS OF OPERATIONS
Railway Operating Revenues
The following tables present a three-year comparison of revenues, volumes (units), and average revenue per unit bymarket group.
Revenues 2017 20162017 2016 2015 vs. 2016 vs. 2015
$ in millions % changeMerchandise:
Chemicals $ 1,668 $ 1,648 $ 1,760 1% (6%)Agr./consumer/gov’t. 1,547 1,548 1,516 — 2%Metals/construction 1,426 1,267 1,263 13% —Automotive 955 975 969 (2%) 1%Paper/clay/forest 761 744 771 2% (4%)
Merchandise 6,357 6,182 6,279 3% (2%)Intermodal 2,452 2,218 2,409 11% (8%)Coal 1,742 1,488 1,823 17% (18%)
Total $ 10,551 $ 9,888 $ 10,511 7% (6%)
Units 2017 20162017 2016 2015 vs. 2016 vs. 2015
in thousands % changeMerchandise:
Chemicals 467.2 475.7 527.6 (2%) (10%)Agr./consumer/gov’t. 589.0 601.2 609.0 (2%) (1%)Metals/construction 727.5 685.8 672.4 6% 2%Automotive 423.1 440.5 429.3 (4%) 3%Paper/clay/forest 284.6 284.0 299.9 — (5%)
Merchandise 2,491.4 2,487.2 2,538.2 — (2%)Intermodal 4,074.1 3,870.4 3,861.0 5% —Coal 1,046.0 902.1 1,079.7 16% (16%)
Total 7,611.5 7,259.7 7,478.9 5% (3%)
Revenue per Unit 2017 20162017 2016 2015 vs. 2016 vs. 2015
$ per unit % changeMerchandise:
Chemicals $ 3,571 $ 3,465 $ 3,335 3% 4%Agr./consumer/gov’t. 2,627 2,575 2,489 2% 3%Metals/construction 1,960 1,847 1,879 6% (2%)Automotive 2,257 2,213 2,258 2% (2%)Paper/clay/forest 2,673 2,620 2,573 2% 2%
Merchandise 2,552 2,486 2,474 3% —Intermodal 602 573 624 5% (8%)Coal 1,665 1,650 1,688 1% (2%)
Total 1,386 1,362 1,405 2% (3%)
K19

Revenues increased $663 million in 2017, following a $623 million decline in 2016. As reflected in the tablebelow, the rise in 2017 was largely the result of increased volume, particularly in our coal and intermodal markets,coupled with pricing gains. The decline in 2016 reflected lower revenue per unit, the effects of reduced fuelsurcharges and changes in traffic mix, which more than offset price increases, as well as lower volume, primarilydriven by reductions in energy-related markets and the restructuring of our Triple Crown Services (TCS) subsidiary.
Revenue Variance AnalysisIncrease (Decrease)
2017 vs. 2016 2016 vs. 2015$ in millions
Revenue per unit $ 184 $ (315)Volume (units) 479 (308)
Total $ 663 $ (623)
Fuel surcharge revenues $ 123 $ (241) Most of our contracts include negotiated fuel surcharges, typically tied to either West Texas Intermediate Crude Oil(WTI) or On-Highway Diesel (OHD). Approximately 90% of our revenue base is covered by these negotiated fuelsurcharges, with about two-thirds tied to OHD. For both 2017 and 2016, contracts tied to OHD accounted for about90% of our fuel surcharge revenue, as oil price levels were below most of our surcharge trigger points in contractstied to WTI. Revenues associated with fuel surcharges totaled $359 million, $236 million, and $477 million in2017, 2016, and 2015, respectively.
K20
MERCHANDISE revenues increased in 2017, but decreased in 2016, compared with the years before. In 2017,the growth was a result of higher average revenue per unit, driven by pricing gains. Volume was relatively flatcompared to the prior year, as gains in the metals and construction group were offset by declines in automotive,agriculture, and chemicals traffic. In 2016, the effects of lower volume were offset in part by a slight increase inaverage revenue per unit. Price increases were tempered by reduced fuel surcharge revenues and unfavorablechanges in traffic mix.
For 2018, merchandise revenues are expected to increase, primarily the result of pricing gains and higher fuelsurcharge revenues.
Chemicals revenues were modestly higher in 2017, following a decline in 2016. The increase in 2017 was due tohigher average revenue per unit, a result of favorable mix and price improvements, which outweighed declines involume. Both periods reflected fewer shipments of crude oil from the Bakken oil fields, and 2017 reflected lowershipments of coal ash; in both periods, these reductions were partially offset by more shipments of plastics. The2016 volume decline also reflected lower chlor-alkali and rock salt traffic, the result of market consolidations andsoftened demand. The 2016 volume decrease was offset in part by higher average revenue per unit, due tofavorable mix as increased volumes of higher-rated plastics more than offset reduced fuel surcharge revenues. For 2018, chemicals revenues are anticipated to increase, as average revenue per unit is expected to be higher, theeffect of favorable mix influenced by increased volumes of higher-rated plastics and organic chemicals, as well as,overall pricing gains. We expect carload declines of liquefied petroleum gas to be offset by gains in plastics,industrial chemicals, and crude oil.
One of our chemical customers, Sunbelt Chlor Alkali Partnerships (Sunbelt), filed in 2011 a rate reasonablenesscomplaint before the STB alleging that our tariff rates for transportation of regulated movements are unreasonable.Since April 1, 2011, we have been billing and collecting amounts based on the challenged tariff rates. In 2014, the

STB resolved this rate reasonableness complaint in our favor and in June 2016, the STB resolved petitions forreconsideration. The matter remains decided in our favor; however, the findings are still subject to appeal. Webelieve the estimate of any reasonably possible loss will not have a material effect on our financial position, resultsof operations, or liquidity.
Agriculture, consumer products, and government revenues were flat in 2017 after rising in 2016. In 2017, lowertraffic volume was offset by higher revenue per unit, driven by pricing gains. Volume declines in ethanol andsoybeans, reflecting reduced market demand, more than offset increases in fertilizer. The improvement in 2016 wasdriven by higher average revenue per unit, primarily the result of pricing gains, offset in part by lower fuelsurcharge revenues. Volumes decreased in 2016, driven by weaker demand for feed shipments and the effects ofcustomer sourcing changes on corn volumes, offset in part by an increase in soybean export shipments and higherfood oil volumes driven by service improvements.
For 2018, agriculture, consumer products, and government revenues are expected to increase, driven by moreshipments of ethanol, corn and feed products, and by increased average revenue per unit, primarily a result ofpricing gains.
Metals and construction revenues rose in both periods, reflecting higher traffic volume and, for 2017, higheraverage revenue per unit. In 2017, volume growth was a result of more frac sand shipments for use in natural gasdrilling in the Marcellus and Utica regions and more iron and steel shipments driven by continued improvement inconstruction activity. These increases were partially offset by a decline in coil steel traffic due to customer sourcingchanges. Revenue per unit growth in 2017 was driven by favorable changes in traffic mix. The volume increase in2016 was driven by higher demand for aggregates and iron and steel shipments, and more coil steel traffic due tocustomer sourcing changes. These increases were offset in part by lower demand for materials used in natural gasand oil drilling as a result of depressed commodity prices. Average revenue per unit declined in 2016, driven bylower fuel surcharge revenues and changes in traffic mix. For 2018, metals and construction revenues are expected to rise, primarily driven by increased revenue per unit, aresult of pricing gains and positive mix. Traffic volume growth should result from the continued rise in frac sandshipments in addition to more shipments of steel related products.
Automotive revenues fell in 2017, but rose in 2016. The decline in 2017 was driven mainly by decreases in U.S.light vehicle production, as well as temporary shutdowns for retooling of several NS-served facilities. Averagerevenue per unit increased for the year, driven by pricing gains and higher fuel surcharge revenue. In 2016,volumes increased as a result of higher automotive parts shipments and growth in the production of U.S. lightvehicles. Lower fuel surcharge revenues offset in part by pricing gains drove the decrease in average revenue perunit in 2016. For 2018, automotive revenues are expected to increase as a result of higher revenue per unit driven by priceincreases and higher fuel surcharge, partially offset by volume declines due to reduced customer demand.
Paper, clay and forest products revenues rose in 2017 following a decline in 2016. The increase in 2017 was dueto higher revenue per unit, a result of pricing gains and changes in the traffic mix. Traffic was flat for the year asincreases in waste and pulp shipments were offset by continued losses in woodchip volume due to customersourcing changes. The decline in 2016 reflected volume decreases in our pulpboard and woodchip markets due tocustomer sourcing changes, in addition to lower paper shipments as a result of decreased demand and furthercontraction of the paper market. Average revenue per unit increased in 2016 driven by pricing gains, offset in partby lower fuel surcharge revenues. For 2018, paper, clay, and forest products revenues are anticipated to increase, reflecting pricing gains and increasedvolume, driven by growth in pulpboard as a result of tightening truck capacity, lumber due to more constructionactivity, and our miscellaneous waste markets. These increases may be partially offset by weaker export demandfor kaolin shipments, and further contraction of the paper market.
K21
K22
INTERMODAL revenues increased in 2017, but declined in 2016, compared to the prior years. The 2017 increaseresulted from higher traffic volume and higher average revenue per unit, driven by fuel surcharge revenue andpricing gains. The decline in 2016 was due to lower average revenue per unit that more than offset a small volumeincrease. Reduced fuel surcharge revenues and the effects of the TCS subsidiary restructuring (which togetherlowered average revenue per unit $57) offset the effects of price increases.
For 2018, we expect higher intermodal revenues due to increased average revenue per unit, driven by higher fuelsurcharge revenues and rate increases, as well as, higher volumes.
Intermodal units by market were as follows:
2017 20162017 2016 2015 vs. 2016 vs. 2015
units in thousands % change
Domestic 2,585.0 2,416.2 2,500.4 7% (3%)International 1,489.1 1,454.2 1,360.6 2% 7%
Total 4,074.1 3,870.4 3,861.0 5% —
Total domestic volume increased in 2017, but decreased 2016, a result of the restructuring of our TCS subsidiarywhich decreased overall domestic volume. Domestic volumes in both years benefitted from continued highwayconversions and growth from new and existing accounts.
For 2018, we expect higher domestic volumes driven by strong demand due to favorable economic conditionscombined with continued highway conversions.
International volume increased in both years reflecting increased demand from existing customers and marketshare gains. For 2018, we expect continued growth in our international volume largely driven by more traffic from both new andexisting customers.
COAL revenues increased in 2017, but decreased in 2016, compared with the prior years. The increase in 2017was a result of higher volume, primarily in the export market, and higher revenue per unit, driven by fuel surchargerevenue and pricing gains. The 2016 decline was a result of lower carload volumes across all markets anddecreased average revenue per unit, primarily due to reduced fuel surcharge revenues that lowered average revenueper unit by $34 in 2016.
For 2018, coal revenues are expected to decline, driven by lower export and utility volumes, in addition todecreased revenue per unit, primarily the result of lower pricing in our export market.

As shown in the following table, tonnage increased in 2017, but decreased in 2016.
2017 20162017 2016 2015 vs. 2016 vs. 2015
tons in thousands % change
Utility 67,899 65,033 81,137 4% (20%)Export 26,460 14,608 16,193 81% (10%)Domestic metallurgical 15,675 13,884 14,450 13% (4%)Industrial 5,545 6,152 8,201 (10%) (25%)
Total 115,579 99,677 119,981 16% (17%)
Utility coal tonnage increased in 2017, driven by market share gains. Both years were affected by limited coal burndue to milder weather and sustained lower natural gas prices. The decline in 2016 was additionally impacted byresidual customer stockpile overhang.
For 2018, we expect utility tonnage to decrease, the result of continued pressure from natural gas prices and newrenewable and natural gas capacity.
Export coal tonnage grew significantly in 2017 as continued tightening of international coal supply droveincremental production increases and higher demand for U.S. coal. In 2016, the decrease was a result of strongcompetition faced by U.S. coal suppliers as excess coal supply, weak seaborne coal prices, and a strong U.S. dollarreduced demand. Volume through Norfolk was up 5.5 million tons, or 57%, in 2017, following a drop of 1.7million tons, or 15%, in 2016. Volume through Baltimore was up 6.4 million tons, or 129%, in 2017 and was upslightly in 2016. For 2018, we expect export coal tonnage to decrease due to expected contraction of the elevated 2017 market. Domestic metallurgical coal tonnage was up in 2017, but down in 2016. In 2017, the increase was a result ofmarket share gains while the 2016 decline was largely driven by softness in the metallurgical market.
For 2018, domestic metallurgical coal tonnage is expected to remain relatively flat year-over-year.
Industrial coal tonnage decreased in both years, a result of plant outages, natural gas conversions and decreasedcoal burn. For 2018, industrial coal tonnage is expected to increase driven by increased customer demand, but will continue toface pressure due to natural gas conversions and customer sourcing changes.
K23

Railway Operating Expenses
Railway operating expenses summarized by major classifications were as follows:
2017 20162017 2016 2015 vs. 2016 vs. 2015
$ in millions % change
Compensation and benefits $ 2,915 $ 2,743 $ 2,911 6% (6%)Purchased services and rents 1,414 1,548 1,752 (9%) (12%)Fuel 840 698 934 20% (25%)Depreciation 1,055 1,026 1,054 3% (3%)Materials and other 741 799 976 (7%) (18%)
Total $ 6,965 $ 6,814 $ 7,627 2% (11%)
In 2017, we experienced an overall increase in expense compared to the prior year, reflecting higher fuel expense,incentive compensation, inflationary increases, and volume-related costs, partially offset by improved productivityand increased equity in earnings of certain investees as a result of the enactment of tax reform. In 2016, expenseswere lower across all categories driven largely from cost-control initiatives, lower fuel expense, the absence ofrestructuring costs incurred in 2015, and service improvements.
Compensation and benefits increased in 2017, reflecting changes in:• incentive and stock-based compensation (up $125 million)• higher health and welfare benefit rates for agreement employees (up $62 million), • pay rates (up $43 million),• increased overtime (up $24 million), and• employment levels (down $81 million).
In 2016, compensation and benefits decreased, a result of changes in:• employment levels, including overtime and trainees (down $184 million),• pension costs (down $38 million),• payroll taxes (down $27 million),• labor agreement payments in 2015 ($24 million), • pay rates (up $34 million),• health and welfare benefit costs for agreement employees (up $35 million), which reflected higher rates,
offset in part by favorability from reduced headcount, and• bonus accruals (up $59 million).
Our employment averaged 27,110 in 2017, compared with 28,044 in 2016, and 30,456 in 2015.
K24

Purchased services and rents includes the costs of services purchased from outside contractors, including the netcosts of operating joint (or leased) facilities with other railroads and the net cost of equipment rentals. As previouslydiscussed, this line item includes a $151 million benefit from the enactment of tax reform ($36 million in purchasedservices and $115 million in equipment rents) in the form of higher income of certain equity investees.
2017 20162017 2016 2015 vs. 2016 vs. 2015
$ in millions % change
Purchased services $ 1,233 $ 1,242 $ 1,433 (1%) (13%)Equipment rents 181 306 319 (41%) (4%)
Total $ 1,414 $ 1,548 $ 1,752 (9%) (12%)
The remaining increase in purchased services expense was a result of higher intermodal volume-related costs. The2016 decrease reflected lower TCS operational costs, reduced repair and maintenance expenses, and decreasedtransportation activity costs, offset in part by higher intermodal volume-related costs.
Equipment rents, which includes our cost of using equipment (mostly freight cars) owned by other railroads orprivate owners less the rent paid to us for the use of our equipment, decreased in both 2017 and 2016. In 2017, inaddition to the effects of tax reform, the decline was a result of lower automotive volume. In 2016, the decreasewas largely from improved network velocity, partly offset by higher rates and conventional intermodal volumes.
Fuel expense, which includes the cost of locomotive fuel as well as other fuel used in railway operations, increasedin 2017, but decreased in 2016. The change in both years was principally due to locomotive fuel prices (up 22% in2017 and down 18% in 2016). Locomotive fuel consumption decreased 1% in 2017 despite an increase in volumeof 5% and declined 5% in 2016 with a volume decrease of 3%, both the direct result of our strategic initiative toincrease fuel efficiency. We consumed approximately 458 million gallons of diesel fuel in 2017, compared with462 million gallons in 2016 and 487 million gallons in 2015.
Depreciation expense increased in 2017, but decreased in 2016. Both periods reflect growth in our roadway andequipment capital base as we continue to invest in our infrastructure and rolling stock. In 2016, the decrease was aresult of the effects of $63 million in accelerated depreciation related to the TCS restructuring in 2015.
Materials and other expenses decreased in both periods as shown in the following table.
2017 20162017 2016 2015 vs. 2016 vs. 2015
$ in millions % change
Materials $ 348 $ 364 $ 469 (4%) (22%)Casualties and other claims 145 150 137 (3%) 9%Other 248 285 370 (13%) (23%)
Total $ 741 $ 799 $ 976 (7%) (18%) Material usage declined in both periods, a result of lower freight car repairs associated with cost-control initiativesand improved asset utilization.
K25

Casualties and other claims expenses include the estimates of costs related to personal injury, property damage, andenvironmental matters. The decrease in 2017 was the result of lower loss and damage, offset in part by unfavorabledevelopments in personal injury cases. The increase in 2016 was primarily driven by higher derailment expenses.
Both declines in other expenses reflected more gains from the sale of operating properties (up $42 million in 2017and $37 million in 2016). The 2016 decline was also driven by the absence of expenses that occurred in 2015 forrelocating employees in connection with the closure of our Roanoke, Virginia office.
Income Taxes Income taxes in 2017 includes a benefit of $3,331 million related to the effects of the enactment of tax reform fromthe reduction in our net deferred tax liabilities driven by the change in the federal rate. Our tax benefit on 2017income resulted in an effective rate of negative 72.8%, which includes negative 106.5% related to tax reform,compared with 35.4% in 2016 and 36.3% in 2015. Both 2017 and 2016 benefited from favorable tax benefitsassociated with stock-based compensation and higher returns from corporate-owned life insurance. The 2016 and2015 years also benefited from favorable reductions in deferred taxes for state tax law changes and certain businesstax credits.
We expect our effective tax rate to approximate 24% on a go-forward basis. In addition, we expect cash paid forincome taxes to be approximately 25% lower than 2017 levels, which is less than the percentage decline in theeffective rate, as 2017 benefited from accelerated tax deductions related to our two debt exchanges (see Note 8).
K26
FINANCIAL CONDITION, LIQUIDITY, AND CAPITAL RESOURCES
Cash provided by operating activities, our principal source of liquidity, was $3.3 billion in 2017, $3.0 billion in2016, and $2.9 billion in 2015. The increases in both 2017 and 2016 were primarily the result of improvedoperating results. We had working capital deficits of $396 million and $48 million at December 31, 2017 and 2016,respectively. Cash and cash equivalents totaled $690 million and $956 million at December 31, 2017 and 2016,respectively. We expect cash on hand combined with cash provided by operating activities will be sufficient tomeet our ongoing obligations.
Contractual obligations at December 31, 2017, were comprised of long-term debt, interest on fixed-rate long-termdebt (Note 8), unconditional purchase obligations (Note 16), operating leases (Note 9), agreements withConsolidated Rail Corporation (CRC) and long-term advances from Conrail (Note 5), and unrecognized tax benefits(Note 3):
Total 20182019 -2020
2021 -2022
2023 andSubsequent Other
$ in millions
Long-term debt principal $ 10,584 $ 600 $ 899 $ 1,184 $ 7,901 $ —Interest on fixed-rate long-term debt 10,105 493 884 782 7,946 —Unconditional purchase obligations 1,050 438 315 297 — —Operating leases 660 69 126 106 359 —Agreements with CRC 281 38 76 76 91 —Long-term advances from Conrail 280 — — — 280 —Unrecognized tax benefits* 17 — — — — 17
Total $ 22,977 $ 1,638 $ 2,300 $ 2,445 $ 16,577 $ 17 * This amount is shown in the Other column because the year of settlement cannot be reasonably estimated.

Off balance sheet arrangements consist of obligations related to operating leases, which are included in the tableof contractual obligations above and disclosed in Note 9. Cash used in investing activities was $1.5 billion in 2017, compared with $1.8 billion in 2016, and $2.1 billion in2015. Both year-over-year comparisons reflected lower cash outflows for property additions. A decline incorporate-owned life insurance investments additionally impacted 2017. The decrease in 2016 is also a reflectionof lower proceeds from corporate-owned life insurance investments.
Capital spending and track and equipment statistics can be found within the “Railway Property” section of Part I ofthis report on Form 10-K. For 2018, we expect capital spending to total $1.8 billion.
Cash used in financing activities was $2.0 billion in 2017, compared with $1.3 billion in 2016, and $693 millionin 2015. Both year-over-year comparisons reflected lower debt proceeds. In 2017, the rise was further affected byincreased repurchases of common stock. Contributing to the increase in 2016 were higher debt repayments,partially offset by lower repurchases of common stock.
Share repurchases totaled $1.0 billion in 2017, $803 million in 2016, and $1.1 billion in 2015 for the purchase andretirement of 8.2 million, 9.2 million, and 11.3 million shares, respectively. On September 26, 2017, our Board ofDirectors authorized the repurchase of up to an additional 50 million shares of Common Stock throughDecember 31, 2022. As of December 31, 2017, 56.5 million shares remain authorized for repurchase. The timingand volume of future share repurchases will be guided by our assessment of market conditions and other pertinentfactors. Any near-term purchases under the program are expected to be made with internally generated cash, cashon hand, or proceeds from borrowings.
In May of 2017, we issued $300 million of 3.15% senior notes due 2027. In August of 2017, we issued $750million of 4.05% senior notes due 2052 as part of a debt exchange for $551 million of previously issued notes. InNovember of 2017, we issued $750 million of senior notes at 3.94% due 2047 and paid $52 million of premium inexchange for $613 million of previously issued notes (see Note 8). We discuss our credit agreement and our accounts receivable securitization program in Note 8, and we haveauthority from our Board of Directors to issue an additional $1.2 billion of debt or equity securities through publicor private sale, all of which provide for access to additional liquidity should the need arise. Our debt-to-totalcapitalization ratio was 37.5% at December 31, 2017, compared with 45.1% at December 31, 2016. Upcoming annual debt maturities are disclosed in Note 8. Overall, our goal is to maintain a capital structure withappropriate leverage to support our business strategy and provide flexibility through business cycles.
K27
APPLICATION OF CRITICAL ACCOUNTING POLICIES The preparation of financial statements in accordance with GAAP requires us to make estimates and assumptionsthat affect the reported amounts of assets and liabilities, the disclosure of contingent assets and liabilities at the dateof the financial statements, and the reported amounts of revenue and expenses during the reporting period. Theseestimates and assumptions may require significant judgment about matters that are inherently uncertain, and futureevents are likely to occur that may require us to make changes to these estimates and assumptions. Accordingly, weregularly review these estimates and assumptions based on historical experience, changes in the businessenvironment, and other factors we believe to be reasonable under the circumstances. The following criticalaccounting policies are a subset of our significant accounting policies described in Note 1.

Pensions and Other Postretirement Benefits Accounting for pensions and other postretirement benefit plans requires us to make several estimates andassumptions (Note 11). These include the expected rate of return from investment of the plans’ assets and theexpected retirement age of employees as well as their projected earnings and mortality. In addition, the amountsrecorded are affected by changes in the interest rate environment because the associated liabilities are discounted totheir present value. We make these estimates based on our historical experience and other information that wedeem pertinent under the circumstances (for example, expectations of future stock market performance). We utilizean independent actuarial consulting firm’s studies to assist us in selecting appropriate actuarial assumptions andvaluing related liabilities. In recording our net pension benefit, we assumed a long-term investment rate of return of 8.25%, which wassupported by the long-term total rate of return on plan assets since inception, as well as our expectation of futurereturns. A one-percentage point change to this rate of return assumption would result in a $22 million change inpension expense. We review assumptions related to our defined benefit plans annually, and while changes are likelyto occur in assumptions concerning retirement age, projected earnings, and mortality, they are not expected to havea material effect on our net pension expense or net pension liability in the future. The net pension liability isrecorded at net present value using discount rates that are based on the current interest rate environment in light ofthe timing of expected benefit payments. We utilize analyses in which the projected annual cash flows from thepension and postretirement benefit plans are matched with yield curves based on an appropriate universe of high-quality corporate bonds. We use the results of the yield curve analyses to select the discount rates that match thepayment streams of the benefits in these plans. Properties and Depreciation Most of our assets are long-lived railway properties (Note 6). As disclosed in Note 1, the primary depreciationmethod for our asset base is group life. See Note 1 for a more detailed discussion of the assumptions and estimatesin this area. Depreciation expense for 2017 totaled $1.1 billion. Our composite depreciation rates for 2017 are disclosed in Note 6; a one-tenth percentage point increase (or decrease) in these rates would have resulted in a $40 millionincrease (or decrease) to depreciation expense. For 2017, roadway depreciation rates ranged from 0.83% to 29.12%and equipment depreciation rates ranged from 1.38% to 33%. Personal Injury Casualties and other claims expense, included in “Materials and other” in the Consolidated Statements of Income,includes our accrual for personal injury liabilities. To aid in valuing our personal injury liability and determining the amount to accrue with respect to such claimsduring the year, we utilize studies prepared by an independent consulting actuarial firm. The actuarial firm studiesour historical patterns of reserving for claims and subsequent settlements, taking into account relevant outsideinfluences. We adjust the liability quarterly based upon our assessment and the results of the study. Our estimate issubject to inherent limitation given the difficulty of predicting future events and as such the ultimate loss sustainedmay vary from the estimated liability recorded.
For a more detailed discussion of the assumptions and estimates in accounting for personal injury see Note 16.
Income Taxes Our net deferred tax liability totaled $6.3 billion at December 31, 2017 (Note 3). This liability is estimated basedon the expected future tax consequences of items recognized in the financial statements. After application of the
K28

federal statutory tax rate to book income, judgment is required with respect to the timing and deductibility ofexpenses in our income tax returns. For state income and other taxes, judgment is also required with respect to theapportionment among the various jurisdictions. A valuation allowance is recorded if we expect that it is more likelythan not that deferred tax assets will not be realized. We have a $44 million valuation allowance on $366 million ofdeferred tax assets as of December 31, 2017, reflecting the expectation that almost all of these assets will berealized. See discussion of tax reform in Note 3.
K29
OTHER MATTERS Labor Agreements Approximately 80% of our railroad employees are covered by collective bargaining agreements with various laborunions. Pursuant to the Railway Labor Act, these agreements remain in effect until new agreements are reached, oruntil the bargaining procedures mandated by the Railway Labor Act are completed. We largely bargain nationallyin concert with other major railroads, represented by the National Carriers Conference Committee (NCCC).Moratorium provisions in the labor agreements govern when the railroads and unions may propose changes to theagreements.
Beginning in late 2014, the NCCC and the various unions exchanged new proposals to begin the current round ofnational negotiations. The unions formed three separate bargaining coalitions and the NCCC has reachedagreements with 2 of these coalitions representing 10 separate unions and approximately 80% of the unionizedworkforce. Some of these agreements (applicable to approximately 10% of the unionized workforce) are stillpending ratification by the union membership while the rest have already been ratified and are now final.Negotiations with the other coalition is ongoing with the assistance of mediators from the National MediationBoard. In accordance with the Railway Labor Act, current agreements will remain in effect during the statutorybargaining process. Separately, NS has reached agreement covering wages and work rules through 2019 with theBrotherhood of Locomotive Engineers and Trainmen (BLET), which represents approximately 4,600 NS engineers. Market Risks We manage overall exposure to fluctuations in interest rates by issuing both fixed- and floating-rate debtinstruments. At December 31, 2017, debt subject to interest rate fluctuations totaled $100 million. A one-percentage point increase in interest rates would increase total annual interest expense related to all variable debt byapproximately $1 million. We consider it unlikely that interest rate fluctuations applicable to these instruments willresult in a material adverse effect on our financial position, results of operations, or liquidity.
New Accounting Pronouncements
For a detailed discussion of new accounting pronouncements, see Note 1.
Inflation In preparing financial statements, GAAP requires the use of historical cost that disregards the effects of inflation onthe replacement cost of property. As a capital-intensive company, we have most of our capital invested in long-lived assets. The replacement cost of these assets, as well as the related depreciation expense, would besubstantially greater than the amounts reported on the basis of historical cost.

FORWARD-LOOKING STATEMENTS Certain statements in Management’s Discussion and Analysis of Financial Condition and Results of Operations are“forward-looking statements” within the meaning of the “safe harbor” provisions of the Private Securities LitigationReform Act of 1995, as amended. These statements relate to future events or our future financial performance andinvolve known and unknown risks, uncertainties, and other factors that may cause our actual results, levels ofactivity, performance, or our achievements or those of our industry to be materially different from those expressedor implied by any forward-looking statements. In some cases, forward-looking statements can be identified byterminology such as “may,” “will,” “could,” “would,” “should,” “expect,” “plan,” “anticipate,” “intend,” “believe,”“estimate,” “project,” “consider,” “predict,” “potential,” “feel,” or other comparable terminology. We have basedthese forward-looking statements on our current expectations, assumptions, estimates, beliefs, and projections.While we believe these expectations, assumptions, estimates, beliefs, and projections are reasonable, such forward-looking statements are only predictions and involve known and unknown risks and uncertainties, many of whichinvolve factors or circumstances that are beyond our control. These and other important factors, including thosediscussed in Part I, Item 1A. “Risk Factors,” may cause actual results, performance, or achievements to differmaterially from those expressed or implied by these forward-looking statements. The forward-looking statementsherein are made only as of the date they were first issued, and unless otherwise required by applicable securitieslaws, we disclaim any intention or obligation to update or revise any forward-looking statements, whether as aresult of new information, future events, or otherwise. Copies of our press releases and additional informationabout us is available at www.norfolksouthern.com, or you can contact Norfolk Southern Corporation InvestorRelations Department by calling 757-629-2861.
K30
Item 7A. Quantitative and Qualitative Disclosures About Market Risk The information required by this item is included in Part II, Item 7, “Management’s Discussion and Analysis ofFinancial Condition and Results of Operations” under the heading “Market Risks.”

Item 8. Financial Statements and Supplementary Data
K31
INDEX TO FINANCIAL STATEMENTS
Page
Report of Management K32
Reports of Independent Registered Public Accounting Firm K33
Consolidated Statements of IncomeYears ended December 31, 2017, 2016, and 2015 K36
Consolidated Statements of Comprehensive IncomeYears ended December 31, 2017, 2016, and 2015 K37
Consolidated Balance SheetsAt December 31, 2017 and 2016 K38
Consolidated Statements of Cash FlowsYears ended December 31, 2017, 2016, and 2015 K39
Consolidated Statements of Changes in Stockholders’ EquityYears ended December 31, 2017, 2016, and 2015 K40
Notes to Consolidated Financial Statements K41
Index to Consolidated Financial Statement Schedule in Item 15 K77

Report of Management
February 5, 2018 To the StockholdersNorfolk Southern Corporation Management is responsible for establishing and maintaining adequate internal control over financial reporting. Inorder to ensure that Norfolk Southern Corporation’s internal control over financial reporting is effective,management regularly assesses such controls and did so most recently as of December 31, 2017. This assessmentwas based on criteria for effective internal control over financial reporting described in Internal Control - IntegratedFramework (2013) issued by the Committee of Sponsoring Organizations of the Treadway Commission. Based onthis assessment, management has concluded that the Corporation maintained effective internal control overfinancial reporting as of December 31, 2017. KPMG LLP, independent registered public accounting firm, has audited the Corporation’s financial statements andissued an attestation report on the Corporation’s internal control over financial reporting as of December 31, 2017.
/s/ James A. Squires /s/ Cynthia C. Earhart /s/ Thomas E. HurlbutJames A. Squires Cynthia C. Earhart Thomas E. HurlbutChairman, President and Executive Vice President Finance Vice President andChief Executive Officer and Chief Financial Officer Controller
K32

Report of Independent Registered Public Accounting Firm
To the Board of Directors and StockholdersNorfolk Southern Corporation:
Opinion on Internal Control Over Financial Reporting
We have audited Norfolk Southern Corporation and subsidiaries’ (the “Company”) internal control over financialreporting as of December 31, 2017, based on criteria established in Internal Control - Integrated Framework (2013)issued by the Committee of Sponsoring Organizations of the Treadway Commission. In our opinion, the Companymaintained, in all material respects, effective internal control over financial reporting as of December 31, 2017,based on criteria established in Internal Control - Integrated Framework (2013) issued by the Committee ofSponsoring Organizations of the Treadway Commission.
We also have audited, in accordance with the standards of the Public Company Accounting Oversight Board(United States) (“PCAOB”), the consolidated balance sheets of the Company as of December 31, 2017 and 2016,the related consolidated statements of income, comprehensive income, cash flows, and changes in stockholders’equity for each of the years in the three-year period ended December 31, 2017, and the related notes and financialstatement schedule of valuation and qualifying accounts as listed in Item 15(A)2 (collectively, the “consolidatedfinancial statements”), and our report dated February 5, 2018 expressed an unqualified opinion on thoseconsolidated financial statements.
Basis for Opinion
The Company’s management is responsible for maintaining effective internal control over financial reporting andfor its assessment of the effectiveness of internal control over financial reporting, included in the accompanyingReport of Management. Our responsibility is to express an opinion on the Company’s internal control over financialreporting based on our audit. We are a public accounting firm registered with the PCAOB and are required to beindependent with respect to the Company in accordance with the U.S. federal securities laws and the applicablerules and regulations of the Securities and Exchange Commission and the PCAOB. We conducted our audit in accordance with the standards of the PCAOB. Those standards require that we plan andperform the audit to obtain reasonable assurance about whether effective internal control over financial reportingwas maintained in all material respects. Our audit of internal control over financial reporting included obtaining anunderstanding of internal control over financial reporting, assessing the risk that a material weakness exists, andtesting and evaluating the design and operating effectiveness of internal control based on the assessed risk. Ouraudit also included performing such other procedures as we considered necessary in the circumstances. We believethat our audit provides a reasonable basis for our opinion.
Definition and Limitations of Internal Control Over Financial Reporting
A company’s internal control over financial reporting is a process designed to provide reasonable assuranceregarding the reliability of financial reporting and the preparation of financial statements for external purposes inaccordance with generally accepted accounting principles. A company’s internal control over financial reportingincludes those policies and procedures that (1) pertain to the maintenance of records that, in reasonable detail,accurately and fairly reflect the transactions and dispositions of the assets of the company; (2) provide reasonableassurance that transactions are recorded as necessary to permit preparation of financial statements in accordancewith generally accepted accounting principles, and that receipts and expenditures of the company are being madeonly in accordance with authorizations of management and directors of the company; and (3) provide reasonableassurance regarding prevention or timely detection of unauthorized acquisition, use, or disposition of the company’sassets that could have a material effect on the financial statements.
K33

Because of its inherent limitations, internal control over financial reporting may not prevent or detectmisstatements. Also, projections of any evaluation of effectiveness to future periods are subject to the risk thatcontrols may become inadequate because of changes in conditions, or that the degree of compliance with thepolicies or procedures may deteriorate.
/s/ KPMG LLP KPMG LLPNorfolk, VirginiaFebruary 5, 2018
K34

Report of Independent Registered Public Accounting Firm
To the Board of Directors and StockholdersNorfolk Southern Corporation: Opinion on the Consolidated Financial Statements
We have audited the accompanying consolidated balance sheets of Norfolk Southern Corporation and subsidiaries(the “Company”) as of December 31, 2017 and 2016, the related consolidated statements of income, comprehensiveincome, cash flows, and changes in stockholders’ equity for each of the years in the three-year period endedDecember 31, 2017, and the related notes and financial statement schedule of valuation and qualifying accounts aslisted in Item 15(A)2 (collectively, the “consolidated financial statements”). In our opinion, the consolidatedfinancial statements present fairly, in all material respects, the financial position of the Company as ofDecember 31, 2017 and 2016, and the results of its operations and its cash flows for each of the years in the three-year period ended December 31, 2017, in conformity with U.S. generally accepted accounting principles.
We also have audited, in accordance with the standards of the Public Company Accounting Oversight Board(United States) (“PCAOB”), the Company’s internal control over financial reporting as of December 31, 2017,based on criteria established in Internal Control - Integrated Framework (2013) issued by the Committee ofSponsoring Organizations of the Treadway Commission, and our report dated February 5, 2018 expressed anunqualified opinion on the effectiveness of the Company’s internal control over financial reporting.
Basis for Opinion
These consolidated financial statements are the responsibility of the Company’s management. Our responsibility isto express an opinion on these consolidated financial statements based on our audits. We are a public accountingfirm registered with the PCAOB and are required to be independent with respect to the Company in accordancewith the U.S. federal securities laws and the applicable rules and regulations of the Securities and ExchangeCommission and the PCAOB.
We conducted our audits in accordance with the standards of the PCAOB. Those standards require that we plan andperform the audit to obtain reasonable assurance about whether the consolidated financial statements are free ofmaterial misstatement, whether due to error or fraud. Our audits included performing procedures to assess the risksof material misstatement of the consolidated financial statements, whether due to error or fraud, and performingprocedures that respond to those risks. Such procedures included examining, on a test basis, evidence regarding theamounts and disclosures in the consolidated financial statements. Our audits also included evaluating theaccounting principles used and significant estimates made by management, as well as evaluating the overallpresentation of the consolidated financial statements. We believe that our audits provide a reasonable basis for ouropinion.
/s/ KPMG LLP KPMG LLP
We have served as the Company’s auditor since 1982.
Norfolk, VirginiaFebruary 5, 2018
K35

Norfolk Southern Corporation and SubsidiariesConsolidated Statements of Income
Years ended December 31,2017 2016 2015
($ in millions, except per share amounts)
Railway operating revenues $ 10,551 $ 9,888 $ 10,511
Railway operating expenses:Compensation and benefits 2,915 2,743 2,911Purchased services and rents 1,414 1,548 1,752Fuel 840 698 934Depreciation 1,055 1,026 1,054Materials and other 741 799 976
Total railway operating expenses 6,965 6,814 7,627
Income from railway operations 3,586 3,074 2,884
Other income – net 92 71 103Interest expense on debt 550 563 545
Income before income taxes 3,128 2,582 2,442
Income taxes (2,276) 914 886
Net income $ 5,404 $ 1,668 $ 1,556
Per share amounts:Net income
Basic $ 18.76 $ 5.66 $ 5.13Diluted 18.61 5.62 5.10
See accompanying notes to consolidated financial statements.K36

Norfolk Southern Corporation and SubsidiariesConsolidated Statements of Comprehensive Income
Years ended December 31,2017 2016 2015
($ in millions)
Net income $ 5,404 $ 1,668 $ 1,556Other comprehensive income (loss), before tax:
Pension and other postretirement benefits 155 (74) (76)Other comprehensive income of equity investees 19 5 —
Other comprehensive income (loss), before tax 174 (69) (76)Income tax benefit (expense) related to items of
other comprehensive income (loss) (43) 27 29
Other comprehensive income (loss), net of tax 131 (42) (47)
Total comprehensive income $ 5,535 $ 1,626 $ 1,509
See accompanying notes to consolidated financial statements.K37

Norfolk Southern Corporation and SubsidiariesConsolidated Balance Sheets
At December 31,2017 2016
($ in millions)AssetsCurrent assets:
Cash and cash equivalents $ 690 $ 956Accounts receivable – net 955 945Materials and supplies 222 257Other current assets 282 133
Total current assets 2,149 2,291
Investments 2,981 2,777Properties less accumulated depreciation of $11,909 and
$11,737, respectively 30,330 29,751Other assets 251 73
Total assets $ 35,711 $ 34,892
Liabilities and stockholders’ equityCurrent liabilities:
Accounts payable $ 1,401 $ 1,215Short-term debt 100 100Income and other taxes 211 245Other current liabilities 233 229Current maturities of long-term debt 600 550
Total current liabilities 2,545 2,339
Long-term debt 9,136 9,562Other liabilities 1,347 1,442Deferred income taxes 6,324 9,140
Total liabilities 19,352 22,483
Stockholders’ equity:Common Stock $1.00 per share par value, 1,350,000,000 shares
authorized; outstanding 284,157,187 and 290,417,610 shares,respectively, net of treasury shares 285 292
Additional paid-in capital 2,254 2,179Accumulated other comprehensive loss (356) (487)Retained income 14,176 10,425
Total stockholders’ equity 16,359 12,409
Total liabilities and stockholders’ equity $ 35,711 $ 34,892
See accompanying notes to consolidated financial statements.K38

Norfolk Southern Corporation and SubsidiariesConsolidated Statements of Cash Flows
Years ended December 31,2017 2016 2015
($ in millions)Cash flows from operating activities:
Net income $ 5,404 $ 1,668 $ 1,556Reconciliation of net income to net cash
provided by operating activities:Depreciation 1,059 1,030 1,059Deferred income taxes (2,859) 227 320Gains and losses on properties (92) (46) (30)Changes in assets and liabilities affecting operations:
Accounts receivable (41) 23 109Materials and supplies 35 42 (35)Other current assets (71) 82 192Current liabilities other than debt 135 158 (152)
Other – net (317) (150) (111)
Net cash provided by operating activities 3,253 3,034 2,908
Cash flows from investing activities:Property additions (1,723) (1,887) (2,385)Property sales and other transactions 202 130 63Investment purchases (7) (123) (5)Investment sales and other transactions 47 48 240
Net cash used in investing activities (1,481) (1,832) (2,087)
Cash flows from financing activities:Dividends (703) (695) (713)Common Stock transactions 89 57 12Purchase and retirement of Common Stock (1,012) (803) (1,075)Proceeds from borrowings – net of issuance costs 290 694 1,185Debt repayments (702) (600) (102)
Net cash used in financing activities (2,038) (1,347) (693)
Net increase (decrease) in cash and cash equivalents (266) (145) 128
Cash and cash equivalents:At beginning of year 956 1,101 973
At end of year $ 690 $ 956 $ 1,101
Supplemental disclosures of cash flow information:Cash paid during the year for:
Interest (net of amounts capitalized) $ 528 $ 543 $ 518Income taxes (net of refunds) 705 593 386
See accompanying notes to consolidated financial statements.K39

Norfolk Southern Corporation and SubsidiariesConsolidated Statements of Changes in Stockholders’ Equity
CommonStock
AdditionalPaid-inCapital
Accum. OtherComprehensive
LossRetainedIncome Total
($ in millions, except per share amounts)
Balance at December 31, 2014 $ 310 $ 2,148 $ (398) $ 10,348 $ 12,408
Comprehensive income:Net income 1,556 1,556Other comprehensive loss (47) (47)
Total comprehensive income 1,509Dividends on Common Stock,
$2.36 per share (713) (713)Share repurchases (11) (75) (989) (1,075)Stock-based compensation,
including tax benefit of $14 70 (8) 62Other (3) (3)
Balance at December 31, 2015 299 2,143 (445) 10,191 12,188
Comprehensive income:Net income 1,668 1,668Other comprehensive loss (42) (42)
Total comprehensive income 1,626Dividends on Common Stock,
$2.36 per share (695) (695)Share repurchases (9) (63) (731) (803)Stock-based compensation 2 99 (6) 95Other (2) (2)
Balance at December 31, 2016 292 2,179 (487) 10,425 12,409
Comprehensive income:Net income 5,404 5,404Other comprehensive income 131 131
Total comprehensive income 5,535Dividends on Common Stock,
$2.44 per share (703) (703)Share repurchases (8) (59) (945) (1,012)Stock-based compensation 1 134 (5) 130
Balance at December 31, 2017 $ 285 $ 2,254 $ (356) $ 14,176 $ 16,359
See accompanying notes to consolidated financial statements.K40

Norfolk Southern Corporation and SubsidiariesNotes to Consolidated Financial Statements
The following Notes are an integral part of the Consolidated Financial Statements.
K41
1. Summary of Significant Accounting Policies Description of Business Norfolk Southern Corporation (Norfolk Southern) is a Virginia-based holding company engaged principally in therail transportation business, operating approximately 19,500 miles of road primarily in the East and Midwest. Theseconsolidated financial statements include Norfolk Southern and its majority-owned and controlled subsidiaries(collectively, NS, we, us, and our). Norfolk Southern’s major subsidiary is NSR. All significant intercompanybalances and transactions have been eliminated in consolidation. NSR and its railroad subsidiaries transport raw materials, intermediate products, and finished goods classified in thefollowing commodity groups (percent of total railway operating revenues in 2017): intermodal (23%); coal (17%);chemicals (16%); agriculture/consumer products/government (15%); metals/construction (13%); automotive (9%);and, paper/clay/forest products (7%). Although most of our customers are domestic, ultimate points of originationor destination for some of the products transported (particularly coal bound for export and some intermodalcontainers) may be outside the U.S. Approximately 80% of our railroad employees are covered by collectivebargaining agreements with various labor unions. Use of Estimates The preparation of financial statements in accordance with GAAP requires us to make estimates and assumptionsthat affect the reported amounts of assets and liabilities, the disclosure of contingent assets and liabilities at the dateof the financial statements and the reported amounts of revenues and expenses during the reporting period. Weperiodically review our estimates, including those related to the recoverability and useful lives of assets, as well asliabilities for litigation, environmental remediation, casualty claims, income taxes and pension and otherpostretirement benefits. Changes in facts and circumstances may result in revised estimates. Revenue Recognition Transportation revenue is recognized proportionally as a shipment moves from origin to destination, and relatedexpenses are recognized as incurred. Refunds (which are primarily volume-based incentives) are recorded as areduction to revenues on the basis of management’s best estimate of projected liability, which is based on historicalactivity, current shipment counts and the expectation of future activity. Switching, demurrage and other incidentalservice revenues are recognized when the services are performed. Cash Equivalents “Cash equivalents” are highly liquid investments purchased three months or less from maturity.
Allowance for Doubtful Accounts Our allowance for doubtful accounts was $7 million at December 31, 2017 and $4 million at December 31,2016. To determine our allowance for doubtful accounts, we evaluate historical loss experience (which has notbeen significant), the characteristics of current accounts, and general economic conditions and trends.

Materials and Supplies “Materials and supplies,” consisting mainly of items for maintenance of property and equipment, are stated at thelower of average cost or market. The cost of materials and supplies expected to be used in property additions orimprovements is included in “Properties.” Investments Investments where we have the ability to exercise significant influence over but do not control the entity areaccounted for using the equity method, whereby the investment is carried at the cost of the acquisition plus ourequity in undistributed earnings or losses since acquisition. Properties “Properties” are stated principally at cost and are depreciated using the group method whereby assets with similarcharacteristics, use, and expected lives are grouped together in asset classes and depreciated using a compositedepreciation rate. This methodology treats each asset class as a pool of resources, not as singular items. We useapproximately 75 depreciable asset classes. “Depreciation” in the Consolidated Statements of Cash Flows includesboth depreciation and depletion.
Depreciation expense is based on our assumptions concerning expected service lives of our properties as well as theexpected net salvage that will be received upon their retirement. In developing these assumptions, we utilizeperiodic depreciation studies that are performed by an independent outside firm of consulting engineers andapproved by the STB. Our depreciation studies are conducted about every three years for equipment and every sixyears for track assets and other roadway property. The frequency of these studies is consistent with guidelinesestablished by the STB. We adjust our rates based on the results of these studies and implement the changesprospectively. The studies may also indicate that the recorded amount of accumulated depreciation is deficient (orin excess) of the amount indicated by the study. Any such deficiency (or excess) is amortized as a component ofdepreciation expense over the remaining service lives of the affected class of property, as determined by the study. Key factors that are considered in developing average service life and salvage estimates include:
• statistical analysis of historical retirement data and surviving asset records;• review of historical salvage received and current market rates;• review of our operations including expected changes in technology, customer demand, maintenance
practices and asset management strategies;• review of accounting policies and assumptions; and• industry review and analysis.
The composite depreciation rate for rail in high density corridors is derived based on consideration of annual grosstons as compared to the total or ultimate capacity of rail in these corridors. Our experience has shown that trafficdensity is a leading factor in the determination of the expected service life of rail in high density corridors. Indeveloping the respective depreciation rate, consideration is also given to several rail characteristics including age,weight, condition (new or second hand) and type (curve or straight). We capitalize interest on major projects during the period of their construction. Expenditures, including those onleased assets, that extend an asset’s useful life or increase its utility are capitalized. Expenditures capitalizedinclude those that are directly related to a capital project and may include materials, labor and equipment, inaddition to an allocable portion of indirect costs that relate to a capital project. A significant portion of annualcapital spending relates to the replacement of self-constructed assets. Removal activities occur in conjunction withreplacement and are estimated based on the average percentage of time employees replacing assets spend onremoval functions. Costs related to repairs and maintenance activities that do not extend an asset’s useful life orincrease its utility are expensed when such repairs are performed.
K42

When depreciable operating road and equipment assets are sold or retired in the ordinary course of business, thecost of the assets, net of sale proceeds or salvage, is charged to accumulated depreciation, and no gain or loss isrecognized in earnings. Actual historical cost values are retired when available, such as with most equipmentassets. The use of estimates in recording the retirement of certain roadway assets is necessary based on theimpracticality of tracking individual asset costs. When retiring rail, ties and ballast, we use statistical curves thatindicate the relative distribution of the age of the assets retired. The historical cost of other roadway assets isestimated using a combination of inflation indices specific to the rail industry and those published by the U.S.Bureau of Labor Statistics. The indices are applied to the replacement value based on the age of the retiredassets. These indices are used because they closely correlate with the costs of roadway assets. Gains and losses ondisposal of operating land are included in “Materials and other” expenses. Gains and losses on disposal ofnonoperating land and nonrail assets are included in “Other income – net” (Note 2) since such income is not aproduct of our railroad operations. A retirement is considered abnormal if it does not occur in the ordinary course of business, if it relates to dispositionof a large segment of an asset class and if the retirement varies significantly from the retirement profile identifiedthrough our depreciation studies, which inherently consider the impact of normal retirements on expected servicelives and depreciation rates. Gains or losses from abnormal retirements would be recognized in income fromrailway operations. We review the carrying amount of properties whenever events or changes in circumstances indicate that suchcarrying amount may not be recoverable based on future undiscounted cash flows. Assets that are deemed impairedas a result of such review are recorded at the lower of carrying amount or fair value. New Accounting Pronouncements In May 2014, the Financial Accounting Standards Board (FASB) issued Accounting Standards Update (ASU) No.2014-09, “Revenue from Contracts with Customers.” This update will replace most existing revenue recognitionguidance in GAAP and require an entity to recognize the amount of revenue to which it expects to be entitled forthe transfer of promised goods or services to customers. Freight revenue will continue to be recognizedproportionally as a shipment moves from origin to destination and other revenues will be recognized asperformance obligations are satisfied. We adopted the standard on January 1, 2018 using the modified retrospectivetransition method and the adoption did not have a material effect on our financial position and results of operations.Certain additional financial statement disclosures are required beginning with 2018 reporting, including disclosureof contract assets and contract liabilities as well as a disaggregated view of revenue, which we expect to be similarto our current disclosures within the “Railway Operating Revenues” section of Item 7, “Management’s Discussionand Analysis of Financial Condition and Results of Operations.”
In February 2016, the FASB issued ASU 2016-02, “Leases.” This update, effective for our annual and interimreporting periods beginning January 1, 2019, will replace existing lease guidance in GAAP and will require lesseesto recognize lease assets and lease liabilities on the balance sheet for leases greater than twelve months and disclosekey information about leasing arrangements. When implemented, lessees and lessors will be required to measureand record leases at the present value of the remaining lease payments as of the beginning of the earliest periodpresented using a modified retrospective approach. We are currently evaluating the effects ASU 2016-02 will haveon our consolidated financial statements and related disclosures. We currently disclose approximately $660 millionin undiscounted operating lease obligations in our lease commitments footnote (Note 9) and we will evaluate thosecontracts as well as other existing arrangements to determine if they qualify for lease accounting under the newstandard. We do not anticipate a material impact on our results of operations and we do not plan to adopt thestandard early.
In June 2016, the FASB issued ASU 2016-13, “Credit Losses - Measurement of Credit Losses on FinancialInstruments,” which replaces the current incurred loss impairment method with a method that reflects expectedcredit losses. The new standard is effective as of January 1, 2020, and early adoption is permitted as of January 1,
K43

2019. Because credit losses associated from our trade receivables have historically been insignificant, we do notexpect this standard to have a material effect on our financial statements.
In March 2017, the FASB issued ASU No. 2017-07, “Improving the Presentation of Net Periodic Pension Cost andNet Periodic Postretirement Benefit Cost.” This update, effective for annual and interim reporting periodsbeginning January 1, 2018, will require segregation of these net benefit costs between operating and non-operatingexpenses. Currently, we report the net benefit costs associated with our defined benefit and postretirement plans inthe “Compensation and benefits” line item of the Consolidated Statements of Income, as disclosed in Note 11,“Pensions and Other Postretirement Benefits.” When the ASU is implemented, only the service cost component ofdefined benefit pension cost and postretirement benefit cost will be reported within compensation costs, while allother components of net benefit cost will be presented within the “Other income – net” line item on theConsolidated Statements of Income. The standard requires retrospective application, and as such the adoption ofthis standard will result in offsetting increases in “Compensation and benefits” expense and “Other income – net”on the Consolidated Statements of Income for all periods of 2017 and 2016, with no impact on net income. We didnot adopt the standard early.
K44
2. Other Income – Net
2017 2016 2015($ in millions)
Rental income $ 87 $ 93 $ 80Corporate-owned life insurance – net 33 20 (1)Royalties from coal 19 10 19Interest income 13 10 8Gains from sale of properties (including joint venture sales) 13 9 55External advisor costs — (20) (8)Nonoperating depletion and depreciation (4) (4) (5)Taxes on nonoperating property (11) (11) (10)Charitable contributions (15) (9) (9)Other interest expense – net (including debt exchange fees) (17) (6) (4)Other (26) (21) (22)
Total $ 92 $ 71 $ 103
3. Income Taxes On December 22, 2017, the Tax Cuts and Jobs Act (“tax reform”) was signed into law. Tax reform lowered theFederal corporate tax rate from 35% to 21% and made numerous other tax law changes. GAAP requires companiesto recognize the effect of tax law changes in the period of enactment. As a result, “Purchased services and rents”includes a $151 million benefit for earnings generated from reductions to net deferred tax liabilities at certain equityinvestees and “Income taxes” includes a $3,331 million benefit primarily due to the remeasurement of our netdeferred tax liabilities to reflect the lower rate. Reasonable estimates were made based on our analysis of taxreform. These provisional amounts may be adjusted in future periods during 2018 when additional information isobtained. Additional information that may affect our provisional amounts would include further clarification andguidance on how the IRS will implement tax reform, including guidance with respect to 100% bonus depreciationon self-constructed assets, further clarification and guidance on how state taxing authorities will implement taxreform and the related effect on our state income tax returns, completion of our 2017 tax return filings, any changes

made by our equity method investees, and the potential for additional guidance from the SEC or the FASB relatedto tax reform.
2017 2016 2015($ in millions)
Current:Federal $ 500 $ 612 $ 505State 83 75 61
Total current taxes 583 687 566
Deferred:Federal (2,924) 206 292State 65 21 28
Total deferred taxes (2,859) 227 320
Income taxes $ (2,276) $ 914 $ 886
Reconciliation of Statutory Rate to Effective Rate “Income taxes” in the Consolidated Statements of Income differs from the amounts computed by applying thestatutory federal corporate tax rate as follows:
2017 2016 2015Amount % Amount % Amount %
($ in millions)
Federal income tax at statutory rate $ 1,095 35.0 $ 904 35.0 $ 855 35.0State income taxes, net of federal tax effect 88 2.8 70 2.8 72 3.0Excess tax benefits on stock-based compensation (39) (1.2) (17) (0.7) — —Equity in earnings related to tax reform (38) (1.2) — — — —Other, net (51) (1.7) (43) (1.7) (41) (1.7)Tax reform (3,331) (106.5) — — — —
Income taxes $ (2,276) (72.8) $ 914 35.4 $ 886 36.3
K45

Deferred Tax Assets and Liabilities Certain items are reported in different periods for financial reporting and income tax purposes. Deferred tax assetsand liabilities are recorded in recognition of these differences. The tax effects of temporary differences that giverise to significant portions of the deferred tax assets and deferred tax liabilities are as follows:
December 31,2017 2016
($ in millions)Deferred tax assets:
Compensation and benefits, including postretirement benefits $ 235 $ 464Accruals, including casualty and other claims 64 102Other 67 62
Total gross deferred tax assets 366 628Less valuation allowance (44) (39)
Net deferred tax assets 322 589
Deferred tax liabilities:Property (6,212) (9,301)Other (434) (428)
Total deferred tax liabilities (6,646) (9,729)
Deferred income taxes $ (6,324) $ (9,140)
Except for amounts for which a valuation allowance has been provided, we believe that it is more likely than notthat the results of future operations will generate sufficient taxable income to realize the deferred tax assets. Thevaluation allowance at the end of each year primarily relates to subsidiary state income tax net operating losses andstate investment tax credits that may not be utilized prior to their expiration. The total valuation allowanceincreased by $5 million in 2017 and $4 million in 2016.
Uncertain Tax Positions A reconciliation of the beginning and ending amount of unrecognized tax benefits is as follows:
December 31,2017 2016
($ in millions)
Balance at beginning of year $ 27 $ 25
Additions based on tax positions related to the current year 4 3Additions for tax positions of prior years 2 —Reductions for tax positions of prior years (2) —Settlements with taxing authorities (11) —Lapse of statutes of limitations (3) (1)
Balance at end of year $ 17 $ 27
K46
Included in the balance of unrecognized tax benefits at December 31, 2017, are potential benefits of $11 millionthat would affect the effective tax rate if recognized. Unrecognized tax benefits are adjusted in the period in whichnew information about a tax position becomes available or the final outcome differs from the amount recorded. IRS examinations have been completed for all years prior to 2013. We have amended our 2012 income tax return torequest a refund of $46 million, which is not included in the above balance of unrecognized tax benefits. Stateincome tax returns generally are subject to examination for a period of three to four years after filing of thereturn. In addition, we are generally obligated to report changes in taxable income arising from federal income taxexaminations to the states within a period of up to two years from the date the federal examination is final. We havevarious state income tax returns either under examination, administrative appeal, or litigation.
K47
4. Fair Value Measurements FASB Accounting Standards Codification (ASC) 820-10, “Fair Value Measurements,” established a framework formeasuring fair value and a fair value hierarchy that prioritizes the inputs to valuation techniques used to measurefair value into three broad levels, as follows:
Level 1 Inputs to the valuation methodology are unadjusted quoted prices for identical assets or liabilities inactive markets that we have the ability to access.
Level 2 Inputs to the valuation methodology include:• quoted prices for similar assets or liabilities in active markets; • quoted prices for identical or similar assets or liabilities in inactive markets;• inputs other than quoted prices that are observable for the asset or liability;• inputs that are derived principally from or corroborated by observable market data by
correlation or other means.
If the asset or liability has a specified (contractual) term, the Level 2 input must be observable forsubstantially the full term of the asset or liability.
Level 3 Inputs to the valuation methodology are unobservable and significant to the fair value measurement.
The asset’s or liability’s fair value measurement level within the hierarchy is based on the lowest level of any inputthat is significant to the fair value measurement. Other than those assets and liabilities described below thatapproximate fair value, there were no assets or liabilities measured at fair value on a recurring basis atDecember 31, 2017 or 2016.
Fair Values of Financial Instruments
We have evaluated the fair values of financial instruments and methods used to determine those fair values. Thefair values of “Cash and cash equivalents,” “Accounts receivable,” “Accounts payable,” and “Short-term debt”approximate carrying values because of the short maturity of these financial instruments. The carrying value ofcorporate-owned life insurance is recorded at cash surrender value and, accordingly, approximates fair value. Thecarrying amounts and estimated fair values for the remaining financial instruments, excluding investmentsaccounted for under the equity method, consisted of the following at December 31:
2017 2016CarryingAmount
FairValue
CarryingAmount
FairValue
($ in millions)
Long-term investments $ 26 $ 49 $ 116 $ 141Long-term debt, including current maturities (9,736) (11,771) (10,112) (11,626)

Underlying net assets and future discounted cash flows were used to estimate the fair value of investments. The fairvalues of long-term debt were estimated based on quoted market prices or discounted cash flows using currentinterest rates for debt with similar terms, credit rating, and remaining maturity.
The following tables set forth the fair value of long-term investment and long-term debt balances disclosed aboveby valuation technique level, within the fair value hierarchy (there were no level 3 valued assets or liabilities).
Level 1 Level 2 Total($ in millions)
December 31, 2017 Long-term investments $ 4 $ 45 $ 49 Long-term debt, including current maturities (11,676) (95) (11,771)
December 31, 2016 Long-term investments $ 4 $ 137 $ 141 Long-term debt, including current maturities (11,427) (199) (11,626)
K48
5. Investments
December 31,2017 2016
($ in millions)Long-term investments:
Equity method investments:Conrail Inc. $ 1,293 $ 1,199TTX Company 629 471Meridian Speedway LLC 272 274Pan Am Southern LLC 154 155Other 77 77
Total equity method investments 2,425 2,176
Corporate-owned life insurance at net cash surrender value 530 485Other investments 26 116
Total long-term investments $ 2,981 $ 2,777
Investment in Conrail Through a limited liability company, we and CSX jointly own Conrail, whose primary subsidiary is CRC. We havea 58% economic and 50% voting interest in the jointly owned entity, and CSX has the remainder of the economicand voting interests. We are amortizing the excess of the purchase price over Conrail’s net equity using theprinciples of purchase accounting, based primarily on the estimated useful lives of Conrail’s depreciable propertyand equipment, including the related deferred tax effect of the differences in book and tax accounting bases for suchassets, as all of the purchase price at acquisition was allocable to Conrail’s tangible assets and liabilities.

At December 31, 2017, based on the funded status of Conrail’s pension plans, we increased our proportionalinvestment in Conrail by $19 million. This resulted in income of $17 million recorded to “Other comprehensiveincome” and a combined federal and state deferred tax liability of $2 million. At December 31, 2016, based on the funded status of Conrail’s pension plans, we increased our proportionalinvestment in Conrail by $5 million. This resulted in income of $5 million recorded to “Other comprehensive loss”and a combined federal and state deferred tax liability of less than $1 million. At December 31, 2017, the difference between our investment in Conrail and our share of Conrail’s underlying netequity was $519 million. Our equity in the earnings of Conrail, net of amortization, included in “Purchasedservices and rents” was $75 million (including $33 million related to the enactment of tax reform - see Note 3) for2017, $47 million for 2016, and $42 million for 2015. Equity in earnings are included in the “Other - net” line itemwithin operating activities in the Consolidated Statements of Cash Flows. CRC owns and operates certain properties (the Shared Assets Areas) for the joint and exclusive benefit of NSR andCSX Transportation, Inc. (CSXT). The costs of operating the Shared Assets Areas are borne by NSR and CSXTbased on usage. In addition, NSR and CSXT pay CRC a fee for access to the Shared Assets Areas. “Purchasedservices and rents” and “Fuel” include expenses payable to CRC for operation of the Shared Assets Areas totaling$141 million in 2017, $151 million in 2016, and $154 million in 2015. Future minimum lease payments due to CRCunder the Shared Assets Areas agreements are as follows: $38 million in each of 2018 through 2022 and $91million thereafter. We provide certain general and administrative support functions to Conrail, the fees for which arebilled in accordance with several service-provider arrangements and approximate $8 million annually.
“Accounts payable” includes $146 million at December 31, 2017, and $129 million at December 31, 2016, due toConrail for the operation of the Shared Assets Areas. “Other liabilities” includes $280 million at both December 31,2017 and 2016 for long-term advances from Conrail, maturing in 2044, that bear interest at an average rate of 2.9%.
Investment in TTX
NS and eight other North American railroads jointly own TTX Company (TTX). NS has a 19.65% ownershipinterest in TTX, a railcar pooling company that provides its owner-railroads with standardized fleets of intermodal,automotive, and general use railcars at stated rates.
Amounts paid to TTX for use of equipment are included in “Purchased services and rents.” This amounted to $237million, $229 million, and $219 million of expense, respectively, for the years ended December 31, 2017, 2016 and2015. Our equity in the earnings of TTX, also included in “Purchased services and rents,” totaled $158 million(including $115 million related to the enactment of tax reform - see Note 3) for 2017, $26 million for 2016, and $21million for 2015.
K49

6. Properties
Accumulated Net Book DepreciationDecember 31, 2017 Cost Depreciation Value Rate (1)
($ in millions)
Land $ 2,342 $ — $ 2,342 —
Roadway:Rail and other track material 6,730 (1,961) 4,769 2.28%Ties 5,181 (1,374) 3,807 3.37%Ballast 2,654 (624) 2,030 2.71%Construction in process 447 — 447 —Other roadway 13,636 (3,523) 10,113 2.59%
Total roadway 28,648 (7,482) 21,166
Equipment:Locomotives 5,658 (2,158) 3,500 3.77%Freight cars 3,256 (1,286) 1,970 2.48%Computers and software 610 (334) 276 10.61%Construction in process 247 — 247 —Other equipment 1,004 (366) 638 5.06%
Total equipment 10,775 (4,144) 6,631
Other property 474 (283) 191 0.77%
Total properties $ 42,239 $ (11,909) $ 30,330
K50

Accumulated Net Book DepreciationDecember 31, 2016 Cost Depreciation Value Rate (1)
($ in millions)
Land $ 2,330 $ — $ 2,330 —
Roadway:Rail and other track material 6,632 (1,997) 4,635 2.46%Ties 5,011 (1,314) 3,697 3.25%Ballast 2,559 (584) 1,975 2.64%Construction in process 664 — 664 —Other roadway 13,096 (3,361) 9,735 2.51%
Total roadway 27,962 (7,256) 20,706
Equipment:Locomotives 5,525 (2,199) 3,326 3.65%Freight cars 3,377 (1,345) 2,032 2.51%Computers and software 552 (329) 223 10.40%Construction in process 295 — 295 —Other equipment 972 (329) 643 4.71%
Total equipment 10,721 (4,202) 6,519
Other property 475 (279) 196 0.83%
Total properties $ 41,488 $ (11,737) $ 29,751 (1) Composite annual depreciation rate for the underlying assets, excluding the effects of the amortization of any
deficiency (or excess) that resulted from our depreciation studies. Other property includes the costs of obtaining rights to natural resources of $336 million at both December 31, 2017and December 31, 2016, with accumulated depletion of $200 million and $199 million, respectively. Capitalized Interest Total interest cost incurred on debt was $570 million in 2017, $583 million in 2016, and $566 million in 2015, ofwhich $20 million in both 2017 and 2016 and $21 million in 2015 was capitalized.
K51

7. Current Liabilities
December 31,2017 2016
($ in millions)Accounts payable:
Accounts and wages payable $ 822 $ 650Casualty and other claims (Note 16) 187 192Due to Conrail (Note 5) 146 129Vacation liability 133 134Other 113 110
Total $ 1,401 $ 1,215
Other current liabilities:Interest payable $ 115 $ 119Pension benefit obligations (Note 11) 17 16Other 101 94
Total $ 233 $ 229
K52
8. Debt Debt with weighted average interest rates and maturities is presented below:
December 31,2017 2016
($ in millions)Notes and debentures:
5.32% maturing to 2022 $ 2,682 $ 3,2324.42% maturing 2023 to 2031 2,965 2,7464.54% maturing 2037 to 2052 4,404 3,1906.81% maturing 2097 to 2111 531 1,328
Securitization borrowings and capital leases 102 202Discounts, premiums, and debt issuance costs (848) (486)
Total debt 9,836 10,212
Less current maturities and short-term debt (700) (650)
Long-term debt excluding current maturities and short-term debt $ 9,136 $ 9,562

Long-term debt maturities subsequent to 2018 are as follows:2019 $ 5852020 3142021 5842022 6002023 and subsequent years 7,053
Total $ 9,136
During the fourth quarter of 2017, we issued $750 million of senior notes at 3.94% due 2047 and paid $52 millionof premium in exchange for $613 million of previously issued notes ($241 million at 6% due 2105, $208 million at4.8% due 2043, $78 million at 7.05% due 2037, $49 million at 7.8% due 2027, $32 million at 7.25% due 2031 and$5 million at 6% due 2111). The premium is reflected as a reduction of debt in the Consolidated Balance Sheet andwithin “Debt repayments” in the Consolidated Statement of Cash Flows and will be amortized as additional interestexpense over the term of the new debt. No gain or loss was recognized as a result of the debt exchange.
During the third quarter of 2017, we issued $750 million of senior notes at 4.05% due 2052 in exchange for $551million of previously issued notes ($48 million at 7.9% due 2097, $378 million at 6% due 2111, and $125 million at6% due 2105). No gain or loss was recognized as a result of the debt exchange.
During the second quarter of 2017, we issued $300 million of 3.15% senior notes due 2027.
We have in place a $350 million receivables securitization facility under which NSR sells substantially all of itseligible third-party receivables to a subsidiary, which in turn may transfer beneficial interests in the receivables tovarious commercial paper vehicles. Amounts received under the facility are accounted for as borrowings. Underthis facility, we received $100 million in 2016, and paid $100 million in both 2017 and 2016. The facility expires inJune 2018. At December 31, 2017, the amount outstanding under the facility was $100 million (at an averagevariable interest rate of 3.21%). Our intent is to pay the remaining balance by the June 2018 expiration, therefore,this amount was included within “Short-term debt” at December 31, 2017. At December 31, 2016, the amountoutstanding was $200 million (at an average variable interest rate of 2.47%), with $100 million included within“Long-term debt” and the remaining $100 million outstanding included in “Short-term debt” in the ConsolidatedBalance Sheet. At December 31, 2017 and 2016, the receivables included in “Accounts receivable-net” serving ascollateral for these borrowings totaled $751 million and $704 million, respectively. These borrowings are supportedby our $750 million credit agreement (see below).
Credit Agreement and Debt Covenants We have in place and available a $750 million, five-year credit agreement which expires in May 2021 and providesfor borrowings at prevailing rates and includes covenants. We had no amounts outstanding under this facility atDecember 31, 2017 and 2016, and we are in compliance with all of its covenants.
K53

9. Lease Commitments We are committed under long-term lease agreements, which expire on various dates through 2067, for equipment,lines of road and other property. The following amounts do not include payments to CRC under the Shared AssetsAreas agreements (Note 5). Future minimum lease payments and operating lease expense are as follows:
Future Minimum Lease Payments
OperatingLeases
($ in millions)
2018 $ 692019 662020 602021 552022 512023 and subsequent years 359
Total $ 660 Operating Lease Expense
2017 2016 2015($ in millions)
Minimum rents $ 90 $ 98 $ 111Contingent rents 79 73 84
Total $ 169 $ 171 $ 195 Contingent rents are primarily comprised of usage-based rent paid to other railroads for joint facility operations.
K54
10. Other Liabilities
December 31,2017 2016
($ in millions)
Net other postretirement benefit obligations (Note 11) $ 309 $ 346Net pension benefit obligations (Note 11) 296 333Long-term advances from Conrail (Note 5) 280 280Casualty and other claims (Note 16) 179 178Deferred compensation 113 112Other 170 193
Total $ 1,347 $ 1,442

11. Pensions and Other Postretirement Benefits We have both funded and unfunded defined benefit pension plans covering principally salaried employees. We alsoprovide specified health care and life insurance benefits to eligible retired employees; these plans can be amendedor terminated at our option. Under our self-insured retiree health care plan, for those participants who are notMedicare-eligible, a defined percentage of health care expenses is covered for retired employees and theirdependents, reduced by any deductibles, coinsurance, and, in some cases, coverage provided under other groupinsurance policies. Those participants who are Medicare-eligible are not covered under the self-insured retireehealth care plan, but instead are provided with an employer-funded health reimbursement account which can beused for reimbursement of health insurance premiums or eligible out-of-pocket medical expenses.
Pension and Other Postretirement Benefit Obligations and Plan Assets
Pension BenefitsOther Postretirement
Benefits2017 2016 2017 2016
($ in millions)Change in benefit obligations:Benefit obligation at beginning of year $ 2,420 $ 2,372 $ 528 $ 536Service cost 38 36 7 7Interest cost 80 82 15 16Actuarial losses 143 66 6 14Benefits paid (140) (136) (46) (45)
Benefit obligation at end of year 2,541 2,420 510 528
Change in plan assets:Fair value of plan assets at beginning of year 2,073 2,040 182 189Actual return on plan assets 423 152 40 17Employer contribution1 17 17 25 21Benefits paid (140) (136) (46) (45)
Fair value of plan assets at end of year 2,373 2,073 201 182
Funded status at end of year $ (168) $ (347) $ (309) $ (346)
Amounts recognized in the ConsolidatedBalance Sheets:
Noncurrent assets $ 145 $ 2 $ — $ —Current liabilities (17) (16) — —Noncurrent liabilities (296) (333) (309) (346)
Net amount recognized $ (168) $ (347) $ (309) $ (346)
Amounts included in accumulated other comprehensiveloss (before tax):
Net loss $ 781 $ 940 $ 11 $ 30Prior service cost (benefit) 2 3 (283) (307)
1Norfolk Southern is eligible to receive reimbursement from the Norfolk Southern Corporation Post-RetirementBenefits Trust (Trust), and the Trust had an outstanding liability to Norfolk Southern of $1 million at December 31,2017 and $13 million at December 31, 2016.
K55
Our accumulated benefit obligation for our defined benefit pension plans is $2.3 billion and $2.2 billion atDecember 31, 2017 and December 31, 2016, respectively. Our unfunded pension plans, included above, which inall cases have no assets, had projected benefit obligations of $313 million at December 31, 2017 and $286 millionat December 31, 2016, and had accumulated benefit obligations of $267 million and $252 million at December 31,2017 and December 31, 2016, respectively.
Pension and Other Postretirement Benefit Cost Components
2017 2016 2015($ in millions)
Pension benefits:Service cost $ 38 $ 36 $ 41Interest cost 80 82 93Expected return on plan assets (172) (173) (165)Amortization of net losses 51 51 65Amortization of prior service cost 1 — —
Net cost (benefit) $ (2) $ (4) $ 34
Other postretirement benefits:Service cost $ 7 $ 7 $ 7Interest cost 15 16 21Expected return on plan assets (15) (17) (19)Amortization of prior service benefit (24) (24) (24)
Net benefit $ (17) $ (18) $ (15)
Other Changes in Plan Assets and Benefit Obligations Recognized in Other Comprehensive Income
2017
PensionBenefits
OtherPostretirement
Benefits($ in millions)
Net gain arising during the year $ (108) $ (19)Amortization of net losses (51) —Amortization of prior service benefit (cost) (1) 24
Total recognized in other comprehensive income $ (160) $ 5Total recognized in net periodic cost
and other comprehensive income $ (162) $ (12) Net actuarial gains arising during the year for pension and other postretirement benefits were due primarily tohigher actual returns on plan assets, partially offset by a decrease in discount rate.
K56

The estimated net losses for the pension benefit plans that will be amortized from accumulated other comprehensiveloss into net periodic cost over the next year are $57 million. The estimated prior service benefit for the otherpostretirement benefit plans that will be amortized from accumulated other comprehensive loss into net periodicbenefit over the next year is $24 million.
Pension and Other Postretirement Benefits Assumptions Costs for pension and other postretirement benefits are determined based on actuarial valuations that reflectappropriate assumptions as of the measurement date, ordinarily the beginning of each year. The funded status of theplans is determined using appropriate assumptions as of each year end. A summary of the major assumptionsfollows:
2017 2016 2015Pension funded status:
Discount rate 3.74% 4.05% 4.30%Future salary increases 4.21% 4.21% 4.50%
Other postretirement benefits funded status:Discount rate 3.57% 3.83% 4.02%
Pension cost:Discount rate - service cost 4.31% 4.64% 3.95%Discount rate - interest cost 3.43% 3.51% 3.95%Return on assets in plans 8.25% 8.25% 8.25%Future salary increases 4.21% 4.50% 4.50%
Other postretirement benefits cost:Discount rate - service cost 4.17% 4.36% 3.70%Discount rate - interest cost 3.14% 3.15% 3.70%Return on assets in plans 8.00% 8.00% 8.00%Health care trend rate 6.56% 6.30% 6.56%
To determine the discount rates used to measure our benefit obligations, we utilize analyses in which the projectedannual cash flows from the pension and other postretirement benefit plans were matched with yield curves based onan appropriate universe of high-quality corporate bonds. We use the results of the yield curve analyses to select thediscount rates that match the payment streams of the benefits in these plans.
Effective January 1, 2016, we began using a spot rate approach to estimate the service cost and interest costcomponents of net periodic benefit cost for our pension and other postretirement benefits plans rather than a singleweighted-average discount rate. Health Care Cost Trend Assumptions For measurement purposes at December 31, 2017, increases in the per capita cost of pre-Medicare covered healthcare benefits were assumed to be 6.3% for 2018. It is assumed the rate will decrease gradually to an ultimate rate of5.0% for 2023 and remain at that level thereafter.
K57

Assumed health care cost trend rates affect the amounts reported in the consolidated financial statements. Toillustrate, a one-percentage point change in the assumed health care cost trend would have the following effects:
One-percentage pointIncrease Decrease
($ in millions)Increase (decrease) in:
Total service and interest cost components $ 1 $ (1)Postretirement benefit obligation 10 (9)
Asset Management Ten investment firms manage our defined benefit pension plans’ assets under investment guidelines approved byour Benefits Investment Committee that is comprised of members of our management. Investments are restricted todomestic and international equity securities, domestic and international fixed income securities, and unleveragedexchange-traded options and financial futures. Limitations restrict investment concentration and use of certainderivative investments. The target asset allocation for equity is 75% of the pension plans’ assets. The fixed incomeportfolio is invested in the BlackRock Government/Credit Bond Index Fund. Equity investments must be in liquidsecurities listed on national exchanges. No investment is permitted in our securities (except through commingledpension trust funds). Our pension plans’ weighted average asset allocations, by asset category, were as follows:
Percentage of planassets at December 31,2017 2016
Domestic equity securities 49% 51%International equity securities 25% 24%Debt securities 24% 23%Cash and cash equivalents 2% 2%
Total 100% 100%
The other postretirement benefit plan assets consist primarily of trust-owned variable life insurance policies with anasset allocation at December 31, 2017 of 61% in equity securities and 39% in debt securities compared with 67% inequity securities and 33% in debt securities at December 31, 2016. The target asset allocation for equity is between50% and 75% of the plan’s assets. The plans’ assumed future returns are based principally on the asset allocations and historical returns for the plans’asset classes determined from both actual plan returns and, over longer time periods, expected market returns forthose asset classes. For 2018, we assume an 8.25% return on pension plan assets.
Fair Value of Plan Assets Following is a description of the valuation methodologies used for pension plan assets measured at fair value.
Common stock: Shares held by the plan at year end are valued at the official closing price as defined by theexchange or at the most recent trade price of a security at the close of the active market.
K58
Common collective trusts: The readily determinable fair value is based on the published fair value per unitof the trusts. The common collective trusts hold equity securities, fixed income securities and cash andcash equivalents. Commingled funds: The readily determinable fair value is based on the published fair value per unit of thefunds. The commingled funds hold equity securities. Interest bearing cash: Short-term bills or notes are valued at an estimated price at which a dealer would payfor the security at year end using observable market-based inputs; money market funds are valued at theclosing price reported on the active market on which the funds are traded. U.S. government and agencies securities: Valued at an estimated price at which a dealer would pay for asecurity at year end using observable market-based inputs. Inflation adjusted instruments utilize theappropriate index factor.
The following table sets forth the pension plans’ assets by valuation technique level, within the fair value hierarchy(there were no level 3 valued assets).
December 31, 2017Level 1 Level 2 Total
($ in millions)
Common stock $ 1,154 $ — $ 1,154Common collective trusts:
Debt securities — 562 562International equity securities — 397 397
Commingled funds — 233 233Interest bearing cash 23 — 23U.S. government and agencies securities — 4 4
Total investments $ 1,177 $ 1,196 $ 2,373
December 31, 2016Level 1 Level 2 Total
($ in millions)
Common stock $ 1,142 $ — $ 1,142Common collective trusts:
Debt securities — 481 481International equity securities — 324 324
Commingled funds — 79 79Interest bearing cash 43 — 43U.S. government and agencies securities — 4 4
Total investments $ 1,185 $ 888 $ 2,073
K59

Following is a description of the valuation methodologies used for other postretirement benefit plan assetsmeasured at fair value.
Trust-owned life insurance: Valued at our share of the net assets of trust-owned life insurance issued by amajor insurance company. The underlying investments of that trust consist of a U.S. stock account and aU.S. bond account but may retain cash at times as well. The U.S. stock account and U.S. bond account arevalued based on readily determinable fair values.
The other postretirement benefit plan assets consisted of trust-owned life insurance with fair values of $201 millionand $182 million at December 31, 2017 and 2016 respectively, and are valued under level 2 of the fair valuehierarchy. There were no level 1 or level 3 valued assets. Contributions and Estimated Future Benefit Payments In 2018, we expect to contribute approximately $17 million to our unfunded pension plans for payments topensioners and approximately $43 million to our other postretirement benefit plans for retiree health and deathbenefits. We do not expect to contribute to our funded pension plan in 2018.
Benefit payments, which reflect expected future service, as appropriate, are expected to be paid as follows:
PensionBenefits
OtherPostretirement
Benefits($ in millions)
2018 $ 143 $ 422019 143 412020 143 402021 144 382022 145 37Years 2023 – 2027 731 169 Other Postretirement Coverage Under collective bargaining agreements, Norfolk Southern and certain subsidiaries participate in a multi-employerbenefit plan, which provides certain postretirement health care and life insurance benefits to eligible unionemployees. Premiums under this plan are expensed as incurred and totaled $44 million in 2017, $37 million in2016, and $32 million in 2015. Section 401(k) Plans Norfolk Southern and certain subsidiaries provide Section 401(k) savings plans for employees. Under the plans, wematch a portion of employee contributions, subject to applicable limitations. Our matching contributions, recordedas an expense, under these plans were $23 million in 2017 and $21 million in both 2016 and 2015.
K60
12. Stock-Based Compensation Under the stockholder-approved Long-Term Incentive Plan (LTIP), the Compensation Committee (Committee),which is made up of nonemployee members of the Board of Directors, or the Chief Executive Officer (whendelegated authority by such Committee), may grant stock options, stock appreciation rights (SARs), restricted stockunits (RSUs), restricted shares, performance share units (PSUs), and performance shares, up to a maximum of

104,125,000 shares of our Common Stock, of which 8,774,768 remain available for future grants as of December31, 2017. The number of shares remaining for issuance under the LTIP is reduced (i) by 1 for each award granted as a stockoption or stock-settled SAR, or (ii) by 1.61 for an award made in the form other than a stock option or stock-settledSAR. Under the Board-approved Thoroughbred Stock Option Plan (TSOP), the Committee may grant stockoptions up to a maximum of 6,000,000 shares of Common Stock. We use newly issued shares to satisfy anyexercises and awards under the LTIP and the TSOP.
The LTIP also permits the payment, on a current or a deferred basis and in cash or in stock, of dividend equivalentson shares of Common Stock covered by stock options, RSUs, or PSUs in an amount commensurate with regularquarterly dividends paid on Common Stock. With respect to stock options, if employment of the participant isterminated for any reason, including retirement, disability, or death, we have no further obligation to make anydividend equivalent payments. Regarding RSUs, we have no further obligation to make any dividend equivalentpayments unless employment of the participant is terminated as a result of qualifying retirement or disability.Should an employee terminate employment, they are not required to forfeit dividend equivalent payments alreadyreceived. Outstanding PSUs do not receive dividend equivalent payments. The Committee granted stock options, RSUs and PSUs pursuant to the LTIP and granted stock options pursuant tothe TSOP for the last three years as follows:
2017 2016 2015
Granted
WeightedAverage
Grant-DateFair Value Granted
WeightedAverage
Grant-DateFair Value Granted
WeightedAverage
Grant-DateFair Value
Stock options:LTIP 341,120 $ 37.73 694,290 $ 19.92 643,890 $ 30.35TSOP 144,440 31.33 302,320 14.75 181,320 24.71
Total 485,560 996,610 825,210
Restricted stock units 83,330 120.16 136,250 70.44 101,470 104.23Performance share units 300,334 88.56 1,042,628 52.75 413,770 71.66
Receipt of an LTIP award is contingent on the recipient having executed a non-compete agreement with thecompany.
We account for our grants of stock options, RSUs, PSUs, and dividend equivalent payments in accordance withASC 718, “Compensation - Stock Compensation.” Accordingly, all awards result in charges to net income whiledividend equivalent payments, which are all related to equity classified awards, are charged to retained income.Related compensation costs and tax benefits during the year were:
2017 2016 2015($ in millions)
Stock-based compensation expense $ 45 $ 42 $ 42Total tax benefit 54 31 13
K61

Stock Options Option exercise prices will be at least the higher of (i) the average of the high and low prices at which CommonStock is traded on the grant date, or (ii) the closing price of Common Stock on the grant date. All options aresubject to a vesting period of at least one year, and the term of the option will not exceed ten years. Holders of theoptions granted under the LTIP who remain actively employed receive cash dividend equivalent payments for fouryears in an amount equal to the regular quarterly dividends paid on Common Stock. Dividend equivalent paymentsare not made on the TSOP options.
For all years, options granted under the LTIP and the TSOP may not be exercised prior to the fourth and thirdanniversaries of the date of grant, respectively, or if the optionee retires or dies before that anniversary date, maynot be exercised before the later of one year after the grant date or the date of the optionee’s retirement or death. The fair value of each option awarded in 2017, 2016, and 2015 was measured on the date of grant using a binomiallattice-based option valuation model. Expected volatility is based on implied volatility from traded options on, andhistorical volatility of, Common Stock. Historical data is used to estimate option exercises and employeeterminations within the valuation model. The average expected option term is derived from the output of thevaluation model and represents the period of time that all options granted are expected to be outstanding, includingthe branches of the model that result in options expiring unexercised. The average risk-free interest rate is based onthe U.S. Treasury yield curve in effect at the time of grant. A dividend yield of zero was used for the LTIP optionsduring the vesting period. For 2017, 2016, and 2015, a dividend yield of 2.04%, 3.37%, and 2.27%, respectively,was used for all vested LTIP options and all TSOP options.
The assumptions for the LTIP and TSOP grants for the last three years are shown in the following table:
2017 2016 2015
Average expected volatility 26% 27% 25%Average risk-free interest rate 2.51% 2.00% 1.83%Average expected option term LTIP 8.6 years 8.9 years 9.3 yearsAverage expected option term TSOP 8.3 years 8.6 years 9.1 years
A summary of changes in stock options is presented below:
StockOptions
WeightedAvg.
Exercise Price
Outstanding at December 31, 2016 5,554,054 $ 72.57Granted 485,560 120.25Exercised (1,789,939) 60.28Forfeited (15,608) 90.05
Outstanding at December 31, 2017 4,234,067 83.17 The aggregate intrinsic value of options outstanding at December 31, 2017, was $261 million with a weightedaverage remaining contractual term of 6.2 years. Of these options outstanding, 2,221,577 were exercisable and had
K62

an aggregate intrinsic value of $157 million with a weighted average exercise price of $74.06 and a weightedaverage remaining contractual term of 4.8 years.
The following table provides information related to options exercised for the last three years:
2017 2016 2015($ in millions)
Options exercised 1,789,939 1,466,721 589,081Total intrinsic value $ 114 $ 60 $ 27Cash received upon exercise 104 74 29Related tax benefits realized 35 13 7 At December 31, 2017, total unrecognized compensation related to options granted under the LTIP and the TSOPwas $10 million, and is expected to be recognized over a weighted-average period of approximately 2.2 years. Taxbenefits realized in both 2017 and 2016 are recognized in “Income taxes.” Tax benefits realized in 2015 wererecognized as “Additional paid-in capital.”
Restricted Stock Units RSUs granted in all three years have a five-year restriction period and will be settled through the issuance of sharesof Common Stock. The RSU grants include cash dividend equivalent payments during the restriction period in anamount equal to regular quarterly dividends paid on Common Stock.
2017 2016 2015($ in millions)
RSUs vested 137,200 175,500 166,750Common Stock issued net of tax witholding 81,318 103,936 99,337Related tax benefit realized $ 3 $ 1 $ 4
Tax benefits realized in both 2017 and 2016 are recognized in “Income taxes.” Tax benefits realized in 2015 wererecognized as “Additional paid-in capital.”
A summary of changes in RSUs is presented below:
RSUs
Weighted-Average
Grant-DateFair Value
Nonvested at December 31, 2016 645,645 $ 80.68Granted 83,330 120.16Vested (137,200) 75.14Forfeited (3,370) 108.47
Nonvested at December 31, 2017 588,405 87.40
K63

At December 31, 2017, total unrecognized compensation related to RSUs was $8 million, and is expected to berecognized over a weighted-average period of approximately 3.2 years. Performance Share Units PSUs provide for awards based on the achievement of certain predetermined corporate performance goals at the endof a three-year cycle and are settled through the issuance of shares of Common Stock. All PSUs will earn out basedon the achievement of performance conditions and some will also earn out based on a market condition. Themarket condition fair value was measured on the date of grant using a Monte Carlo simulation model.
2017 2016 2015($ in millions)
PSUs earned 171,080 406,038 236,601Common Stock issued net of tax witholding 99,805 241,757 141,386Related tax benefit realized $ 1 $ 3 $ 3
Tax benefits realized in both 2017 and 2016 are recognized in “Income taxes.” Tax benefits realized in 2015 wererecognized as “Additional paid-in capital.”
A summary of changes in PSUs is presented below:
PSUs
Weighted-Average
Grant-DateFair Value
Balance at December 31, 2016 1,849,008 $ 61.17Granted 300,334 88.56Earned (171,080) 68.67Unearned (226,780) 74.93Forfeited (2,730) 58.09
Balance at December 31, 2017 1,748,752 63.36 At December 31, 2017, total unrecognized compensation related to PSUs granted under the LTIP was $6 million,and is expected to be recognized over a weighted-average period of approximately 1.8 years.
K64

Shares Available and Issued Shares of Common Stock available for future grants and issued in connection with all features of the LTIP and theTSOP at December 31, were as follows:
2017 2016 2015Available for future grants:
LTIP 8,774,768 9,385,674 11,769,796TSOP 410,895 544,217 832,676
Issued:LTIP 1,679,547 1,511,645 708,059TSOP 291,515 300,769 121,745
K65
13. Stockholders’ Equity
Common Stock
Common Stock is reported net of shares held by our consolidated subsidiaries (Treasury Shares). Treasury Sharesat December 31, 2017 and 2016 amounted to 20,320,777, with a cost of $19 million at both dates.
Accumulated Other Comprehensive Loss
The components of “Other comprehensive income (loss)” reported in the Consolidated Statements ofComprehensive Income and changes in the cumulative balances of “Accumulated other comprehensive loss”reported in the Consolidated Balance Sheets consisted of the following:
Balanceat
Beginningof Year
Net Income(Loss)
ReclassificationAdjustments
Balanceat Endof Year
($ in millions)Year ended December 31, 2017Pensions and other postretirement
liabilities $ (414) $ 95 $ 19 $ (300)Other comprehensive income
of equity investees (73) 17 — (56)
Accumulated other comprehensive loss $ (487) $ 112 $ 19 $ (356)
Year ended December 31, 2016Pensions and other postretirement
liabilities $ (367) $ (64) $ 17 $ (414)Other comprehensive income
of equity investees (78) 5 — (73)
Accumulated other comprehensive loss $ (445) $ (59) $ 17 $ (487)

Other Comprehensive Income (Loss) “Other comprehensive income (loss)” reported in the Consolidated Statements of Comprehensive Income consistedof the following:
PretaxAmount
Tax(Expense)
BenefitNet-of-Tax
Amount($ in millions)
Year ended December 31, 2017Net gain (loss) arising during the year: Pensions and other postretirement benefits $ 127 $ (32) $ 95 Reclassification adjustments for costs included in net income 28 (9) 19
Subtotal 155 (41) 114
Other comprehensive income of equity investees 19 (2) 17
Other comprehensive income $ 174 $ (43) $ 131
Year ended December 31, 2016Net gain (loss) arising during the year: Pensions and other postretirement benefits $ (101) $ 37 $ (64) Reclassification adjustments for costs included in net income 27 (10) 17
Subtotal (74) 27 (47)
Other comprehensive income of equity investees 5 — 5
Other comprehensive loss $ (69) $ 27 $ (42)
Year ended December 31, 2015Net gain (loss) arising during the year: Pensions and other postretirement benefits $ (117) $ 45 $ (72) Reclassification adjustments for costs included in net income 41 (16) 25
Other comprehensive loss $ (76) $ 29 $ (47)
K66
14. Stock Repurchase Program We repurchased and retired 8.2 million, 9.2 million, and 11.3 million shares of Common Stock under our stockrepurchase program in 2017, 2016, and 2015, respectively, at a cost of $1.0 billion, $803 million, and $1.1 billion,respectively. On September 26, 2017, our Board of Directors authorized the repurchase of up to an additional 50million shares of Common Stock through December 31, 2022. As of December 31, 2017, 56.5 million sharesremain authorized for repurchase. Since the beginning of 2006, we have repurchased and retired 168.5 millionshares at a total cost of $11.3 billion.
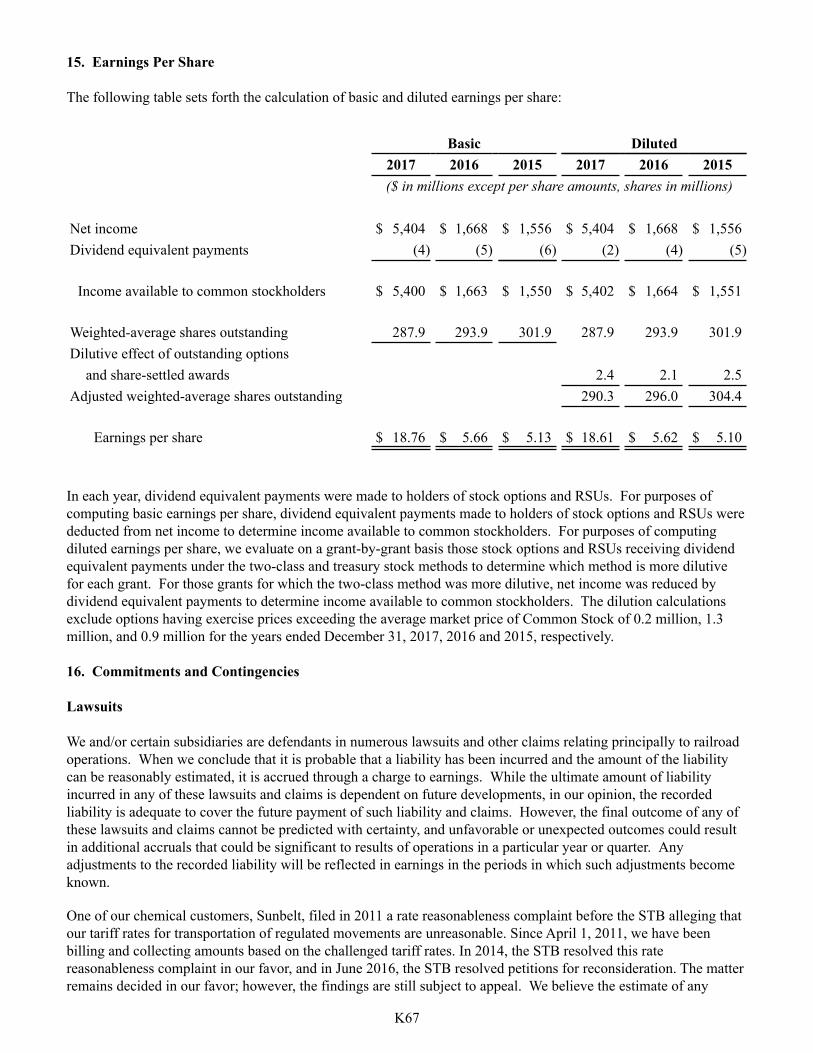
15. Earnings Per Share The following table sets forth the calculation of basic and diluted earnings per share:
Basic Diluted2017 2016 2015 2017 2016 2015($ in millions except per share amounts, shares in millions)
Net income $ 5,404 $ 1,668 $ 1,556 $ 5,404 $ 1,668 $ 1,556Dividend equivalent payments (4) (5) (6) (2) (4) (5)
Income available to common stockholders $ 5,400 $ 1,663 $ 1,550 $ 5,402 $ 1,664 $ 1,551
Weighted-average shares outstanding 287.9 293.9 301.9 287.9 293.9 301.9Dilutive effect of outstanding options
and share-settled awards 2.4 2.1 2.5Adjusted weighted-average shares outstanding 290.3 296.0 304.4
Earnings per share $ 18.76 $ 5.66 $ 5.13 $ 18.61 $ 5.62 $ 5.10
In each year, dividend equivalent payments were made to holders of stock options and RSUs. For purposes ofcomputing basic earnings per share, dividend equivalent payments made to holders of stock options and RSUs werededucted from net income to determine income available to common stockholders. For purposes of computingdiluted earnings per share, we evaluate on a grant-by-grant basis those stock options and RSUs receiving dividendequivalent payments under the two-class and treasury stock methods to determine which method is more dilutivefor each grant. For those grants for which the two-class method was more dilutive, net income was reduced bydividend equivalent payments to determine income available to common stockholders. The dilution calculationsexclude options having exercise prices exceeding the average market price of Common Stock of 0.2 million, 1.3million, and 0.9 million for the years ended December 31, 2017, 2016 and 2015, respectively.
K67
16. Commitments and Contingencies Lawsuits We and/or certain subsidiaries are defendants in numerous lawsuits and other claims relating principally to railroadoperations. When we conclude that it is probable that a liability has been incurred and the amount of the liabilitycan be reasonably estimated, it is accrued through a charge to earnings. While the ultimate amount of liabilityincurred in any of these lawsuits and claims is dependent on future developments, in our opinion, the recordedliability is adequate to cover the future payment of such liability and claims. However, the final outcome of any ofthese lawsuits and claims cannot be predicted with certainty, and unfavorable or unexpected outcomes could resultin additional accruals that could be significant to results of operations in a particular year or quarter. Anyadjustments to the recorded liability will be reflected in earnings in the periods in which such adjustments becomeknown.
One of our chemical customers, Sunbelt, filed in 2011 a rate reasonableness complaint before the STB alleging thatour tariff rates for transportation of regulated movements are unreasonable. Since April 1, 2011, we have beenbilling and collecting amounts based on the challenged tariff rates. In 2014, the STB resolved this ratereasonableness complaint in our favor, and in June 2016, the STB resolved petitions for reconsideration. The matterremains decided in our favor; however, the findings are still subject to appeal. We believe the estimate of any

reasonably possible loss will not have a material effect on our financial position, results of operations, or liquidity.With regard to rate cases, we record adjustments to revenues in the periods if and when such adjustments areprobable and reasonably estimable.
In 2007, various antitrust class actions filed against us and other Class I railroads in various Federal district courtsregarding fuel surcharges were consolidated in the District of Columbia by the Judicial Panel on MultidistrictLitigation. In 2012, the court certified the case as a class action. The defendant railroads appealed this certification,and the Court of Appeals for the District of Columbia vacated the District Court’s decision and remanded the casefor further consideration. On October 10, 2017, the District Court denied class certification; the findings are subjectto appeal. We believe the allegations in the complaints are without merit and intend to vigorously defend the cases.We do not believe the outcome of these proceedings will have a material effect on our financial position, results ofoperations, or liquidity.
Casualty Claims Casualty claims include employee personal injury and occupational claims as well as third-party claims, allexclusive of legal costs. To aid in valuing our personal injury liability and determining the amount to accrue withrespect to such claims during the year, we utilize studies prepared by an independent consulting actuarial firm. Job-related personal injury and occupational claims are subject to the FELA, which is applicable only torailroads. FELA’s fault-based tort system produces results that are unpredictable and inconsistent as compared witha no-fault workers’ compensation system. The variability inherent in this system could result in actual costs beingdifferent from the liability recorded. While the ultimate amount of claims incurred is dependent on futuredevelopments, in our opinion, the recorded liability is adequate to cover the future payments of claims and issupported by the most recent actuarial study. In all cases, we record a liability when the expected loss for the claimis both probable and reasonably estimable. Employee personal injury claims – The largest component of casualties and other claims expense is employeepersonal injury costs. The independent actuarial firm engaged by us provides quarterly studies to aid in valuing ouremployee personal injury liability and estimating personal injury expense. The actuarial firm studies our historicalpatterns of reserving for claims and subsequent settlements, taking into account relevant outside influences. Theactuarial firm uses the results of these analyses to estimate the ultimate amount of liability. We adjust the liabilityquarterly based upon our assessment and the results of the study. Our estimate of the liability is subject to inherentlimitation given the difficulty of predicting future events such as jury decisions, court interpretations, or legislativechanges. As a result, actual claim settlements may vary from the estimated liability recorded.
Occupational claims – Occupational claims (including asbestosis and other respiratory diseases, as well asconditions allegedly related to repetitive motion) are often not caused by a specific accident or event but ratherallegedly result from a claimed exposure over time. Many such claims are being asserted by former or retiredemployees, some of whom have not been employed in the rail industry for decades. The independent actuarial firmprovides an estimate of the occupational claims liability based upon our history of claim filings, severity, payments,and other pertinent facts. The liability is dependent upon judgments we make as to the specific case reserves aswell as judgments of the actuarial firm in the quarterly studies. The actuarial firm’s estimate of ultimate lossincludes a provision for those claims that have been incurred but not reported. This provision is derived byanalyzing industry data and projecting our experience. We adjust the liability quarterly based upon our assessmentand the results of the study. However, it is possible that the recorded liability may not be adequate to cover thefuture payment of claims. Adjustments to the recorded liability are reflected in operating expenses in the periods inwhich such adjustments become known.
Third-party claims – We record a liability for third-party claims including those for highway crossing accidents,trespasser and other injuries, automobile liability, property damage, and lading damage. The actuarial firm assistsus with the calculation of potential liability for third-party claims, except lading damage, based upon our experienceincluding the number and timing of incidents, amount of payments, settlement rates, number of open claims, andlegal defenses. We adjust the liability quarterly based upon our assessment and the results of the study. Given the
K68

inherent uncertainty in regard to the ultimate outcome of third-party claims, it is possible that the actual loss maydiffer from the estimated liability recorded. Environmental Matters We are subject to various jurisdictions’ environmental laws and regulations. We record a liability where suchliability or loss is probable and reasonably estimable. Environmental engineers regularly participate in ongoingevaluations of all known sites and in determining any necessary adjustments to liability estimates. Our Consolidated Balance Sheets include liabilities for environmental exposures of $58 million at December 31,2017, and $67 million at December 31, 2016, (of which $15 million is classified as a current liability at the end ofboth 2017 and 2016). At December 31, 2017, the liability represents our estimates of the probable cleanup,investigation, and remediation costs based on available information at 127 known locations and projects comparedwith 134 locations and projects at December 31, 2016. At December 31, 2017, 15 sites accounted for $37 millionof the liability, and no individual site was considered to be material. We anticipate that much of this liability will bepaid out over five years; however, some costs will be paid out over a longer period. At thirteen locations, one or more of our subsidiaries in conjunction with a number of other parties have beenidentified as potentially responsible parties under the Comprehensive Environmental Response, Compensation andLiability Act of 1980 or comparable state statutes that impose joint and several liability for cleanup costs. Wecalculate our estimated liability for these sites based on facts and legal defenses applicable to each site and notsolely on the basis of the potential for joint liability. With respect to known environmental sites (whether identified by us or by the Environmental Protection Agency orcomparable state authorities), estimates of our ultimate potential financial exposure for a given site or in theaggregate for all such sites can change over time because of the widely varying costs of currently available cleanuptechniques, unpredictable contaminant recovery and reduction rates associated with available cleanup technologies,the likely development of new cleanup technologies, the difficulty of determining in advance the nature and fullextent of contamination and each potential participant’s share of any estimated loss (and that participant’s ability tobear it), and evolving statutory and regulatory standards governing liability. The risk of incurring environmental liability, for acts and omissions, past, present, and future, is inherent in therailroad business. Some of the commodities we transport, particularly those classified as hazardous materials, posespecial risks that we work diligently to reduce. In addition, several of our subsidiaries own, or have owned, landused as operating property, or which is leased and operated by others, or held for sale. Because environmentalproblems that are latent or undisclosed may exist on these properties, there can be no assurance that we will notincur environmental liabilities or costs with respect to one or more of them, the amount and materiality of whichcannot be estimated reliably at this time. Moreover, lawsuits and claims involving these and potentially otherunidentified environmental sites and matters are likely to arise from time to time. The resulting liabilities couldhave a significant effect on financial position, results of operations, or liquidity in a particular year or quarter. Based on our assessment of the facts and circumstances now known, we believe we have recorded the probable andreasonably estimable costs for dealing with those environmental matters of which we are aware. Further, webelieve that it is unlikely that any known matters, either individually or in the aggregate, will have a materialadverse effect on our financial position, results of operations, or liquidity.
Insurance We obtain on behalf of ourself and our subsidiaries insurance for potential losses for third-party liability and first-party property damages. We are currently self-insured up to $50 million and above $1.1 billion ($1.5 billion forspecific perils) per occurrence and/or policy year for bodily injury and property damage to third parties and up to$25 million and above $200 million per occurrence and/or policy year for property owned by us or in our care,custody, or control.
K69

Purchase Commitments At December 31, 2017, we had outstanding purchase commitments totaling approximately $1.1 billion forlocomotives, track material, long-term service contracts, track and yard expansion projects in connection with ourcapital programs as well as freight cars and containers through 2022. Change-In-Control Arrangements We have compensation agreements with certain officers and key employees that become operative only upon achange in control of Norfolk Southern, as defined in those agreements. The agreements provide generally forpayments based on compensation at the time of a covered individual’s involuntary or other specified terminationand for certain other benefits.
Indemnifications
In a number of instances, we have agreed to indemnify lenders for additional costs they may bear as a result ofcertain changes in laws or regulations applicable to their loans. Such changes may include impositions ormodifications with respect to taxes, duties, reserves, liquidity, capital adequacy, special deposits, and similarrequirements relating to extensions of credit by, deposits with, or the assets or liabilities of such lenders. The natureand timing of changes in laws or regulations applicable to our financings are inherently unpredictable, and thereforeour exposure in connection with the foregoing indemnifications cannot be quantified. No liability has beenrecorded related to these indemnifications.
K70

NORFOLK SOUTHERN CORPORATION AND SUBSIDIARIESQUARTERLY FINANCIAL DATA
(Unaudited)
Three Months EndedMarch 31 June 30 September 30 December 31
($ in millions, except per share amounts)2017Railway operating revenues $ 2,575 $ 2,637 $ 2,670 $ 2,669Income from railway operations 773 888 911 1,014Net income 433 497 506 3,968Earnings per share:
Basic 1.49 1.72 1.76 13.91Diluted 1.48 1.71 1.75 13.79
2016Railway operating revenues $ 2,420 $ 2,454 $ 2,524 $ 2,490Income from railway operations 723 770 820 761Net income 387 405 460 416Earnings per share:
Basic 1.30 1.37 1.56 1.43Diluted 1.29 1.36 1.55 1.42
Note: In the fourth quarter of 2017, as a result of the enactment of tax reform, “Income from railway operations”includes a $151 million benefit and income taxes includes a $3,331 million benefit, which added $3,482 million to“Net income,” $12.21 to “Earnings per share - basic,” and $12.10 to “Earnings per share - diluted.”
K71

Item 9. Changes in and Disagreements with Accountants on Accounting and Financial Disclosure None.
K72
Item 9A. Controls and Procedures Disclosure Controls and Procedures Our Chief Executive Officer and Chief Financial Officer, with the assistance of management, evaluated theeffectiveness of our disclosure controls and procedures (as such term is defined in Rules 13a-15(e) and 15d-15(e)under the Securities Exchange Act of 1934, as amended (Exchange Act)) at December 31, 2017. Based on suchevaluation, our officers have concluded that, at December 31, 2017, our disclosure controls and procedures wereeffective to ensure that information required to be disclosed in our reports under the Exchange Act is recorded,processed, summarized, and reported, within the time period specified in the SEC’s rules and forms, and that suchinformation is accumulated and communicated to management, including the Chief Executive Officer and the ChiefFinancial Officer, as appropriate, to allow timely decisions regarding required disclosure. Management’s Annual Report on Internal Control Over Financial Reporting We are responsible for establishing and maintaining adequate internal control over financial reporting. Our internalcontrol over financial reporting includes those policies and procedures that pertain to our ability to record, process,summarize, and report reliable financial data. We recognize that there are inherent limitations in the effectivenessof any internal control over financial reporting, including the possibility of human error and the circumvention oroverriding of internal control. Accordingly, even effective internal control over financial reporting can provide onlyreasonable assurance with respect to financial statement preparation. Further, because of changes in conditions, theeffectiveness of internal control over financial reporting may vary over time. Our Board of Directors, acting through its Audit Committee, is responsible for the oversight of our accountingpolicies, financial reporting, and internal control. The Audit Committee of our Board of Directors is comprised offive outside directors who are independent of management. The independent registered public accounting firm andour internal auditors have full and unlimited access to the Audit Committee, with or without management, todiscuss the adequacy of internal control over financial reporting, and any other matters which they believe shouldbe brought to the attention of the Audit Committee. We have issued a report of our assessment of internal control over financial reporting, and our independentregistered public accounting firm has issued an attestation report on our internal control over financial reporting atDecember 31, 2017. These reports appear in Part II, Item 8 of this report on Form 10-K.
Changes in Internal Control Over Financial Reporting
During the fourth quarter of 2017, we have not identified any changes in internal control over financial reportingthat have materially affected, or are reasonably likely to materially effect, our internal control over financialreporting. Item 9B. Other Information None.

PART III
NORFOLK SOUTHERN CORPORATION AND SUBSIDIARIES
K73
Item 10. Directors, Executive Officers and Corporate Governance In accordance with General Instruction G(3), information called for by Part III, Item 10, is incorporated herein byreference from the information appearing under the caption “Election of Directors,” under the caption “Section 16(a) Beneficial Ownership Reporting Compliance,” under the caption “Corporate Governance and the Board,” underthe caption “Committees of the Board,” under the caption “Shareholder Recommendations and Nominations,” andunder the caption “The Thoroughbred Code of Ethics” in our definitive Proxy Statement for our 2018 AnnualMeeting of Stockholders, which definitive Proxy Statement will be filed electronically with the SEC pursuant toRegulation 14A. The information regarding executive officers called for by Item 401 of Regulation S-K is includedin Part I hereof beginning under “Executive Officers of the Registrant.” Item 11. Executive Compensation In accordance with General Instruction G(3), information called for by Part III, Item 11, is incorporated herein byreference from the information:
• under the caption “Corporate Governance and the Board”, including “Compensation of Directors” and“Non-Employee Director Compensation;”
• appearing under the caption “Executive Compensation” for executives, including the “CompensationDiscussion and Analysis,” the information appearing in the “Summary Compensation Table” and the “2017Grants of Plan-Based Awards” table, including the narrative to such tables, the “Outstanding Equity Awardsat Fiscal Year-End 2017” and “Option Exercises and Stock Vested in 2017” tables, and the tabular andnarrative information appearing under the subcaptions “Retirement Benefits,” “Deferred Compensation,”and “Potential Payments Upon a Change in Control or Other Termination of Employment;” and
• appearing under the captions “Compensation Committee Interlocks and Insider Participation,”“Compensation Policy Risk Assessment,” and “Compensation Committee Report,”
in each case included in our definitive Proxy Statement for our 2018 Annual Meeting of Stockholders, whichdefinitive Proxy Statement will be filed electronically with the SEC pursuant to Regulation 14A.

Item 12. Security Ownership of Certain Beneficial Owners and Management and Related StockholderMatters In accordance with General Instruction G(3), information on security ownership of certain beneficial owners andmanagement called for by Part III, Item 12, is incorporated herein by reference from the information appearingunder the caption “Beneficial Ownership of Stock” in our definitive Proxy Statement for our 2018 Annual Meetingof Stockholders, which definitive Proxy Statement will be filed electronically with the SEC pursuant to Regulation14A. Equity Compensation Plan Information (at December 31, 2017)
PlanCategory
Number ofsecurities
to be issued uponexercise of
outstandingoptions,
warrants andrights
Weighted-average
exercise priceof outstanding
options,warrantsand rights
Number ofsecuritiesremainingavailable
for future issuanceunder equitycompensation
plans (1)
(a) (b) (c)Equity compensation plans
approved by securities holders(2) 5,916,679 (4) $ 83.00 (5) 8,774,768
Equity compensation plansnot approved by securities holders(3) 959,376 83.77 419,895 (6)
Total 6,876,055 9,194,663 (1) Excludes securities reflected in column (a).(2) LTIP.(3) TSOP and the Director’s Restricted Stock Plan.(4) Includes options, RSUs and PSUs granted under LTIP that will be settled in shares of stock.(5) Calculated without regard to 2,641,988 outstanding RSUs and PSUs at December 31, 2017.(6) Reflects shares remaining available for grant under TSOP.
Norfolk Southern Corporation Long-Term Incentive Plan (LTIP) Established on June 28, 1983, and approved by our stockholders at their Annual Meeting held on May 10, 1984,LTIP was adopted to promote the success of our company by providing an opportunity for non-employee Directors,officers, and other key employees to acquire a proprietary interest in the Corporation. The Board of Directorsamended LTIP on January 23, 2015, which amendment was approved by shareholders on May 14, 2015, to includethe reservation for issuance of an additional 8,000,000 shares of authorized but unissued Common Stock. The amended LTIP adopted a fungible share reserve ratio so that, for awards granted after May 13, 2010, thenumber of shares remaining for issuance under the amended LTIP will be reduced (i) by 1 for each award granted asan option or stock-settled stock appreciation right, or (ii) by 1.61 for an award made in the form other than anoption or stock-settled stock appreciation right. Any shares of Common Stock subject to options, PSUs, restrictedshares, or RSUs which are not issued as Common Stock will again be available for award under LTIP after theexpiration or forfeiture of an award.
K74

Non-employee Directors, officers, and other key employees residing in the United States or Canada are eligible forselection to receive LTIP awards. Under LTIP, the Committee, or the Corporation’s chief executive officer to theextent the Committee delegates award-making authority pursuant to LTIP, may grant incentive stock options,nonqualified stock options, stock appreciation rights, RSUs, restricted shares, PSUs, and performance shares. Inaddition, dividend equivalent payments may be awarded for options, RSUs, and PSUs. Awards under LTIP may bemade subject to forfeiture under certain circumstances and the Committee may establish such other terms andconditions for the awards as provided in LTIP. For options granted after May 13, 2010, the option price will be at least the higher of (i) the average of the high andlow prices at which Common Stock is traded on the date of grant, or (ii) the closing price of Common Stock on thedate of the grant. All options are subject to a vesting period of at least one year, and the term of the option will notexceed ten years. LTIP specifically prohibits option repricing without stockholder approval, except that adjustmentsmay be made in the event of changes in our capital structure or Common Stock. PSUs entitle a recipient to receive performance-based compensation at the end of a three-year cycle based on ourperformance during that period. For the regular 2017 PSU awards, corporate performance will be measured usingtwo equally weighted standards established by the Committee: (1) three-year average return on average capitalinvested and (2) total return to stockholders measured at the end of the three-year period. For the 2017 PSUawards, PSUs will be settled in shares of Common Stock. In 2016, the committee also granted an “acceleratedturnaround incentive” award in the form of a PSU with a three-year performance that is based on equally weightedstandards established by the Committee for operating ratio and earnings per share. RSUs are payable in cash or in shares of Common Stock at the end of a restriction period. During the restrictionperiod, the holder of the RSUs has no beneficial ownership interest in the Common Stock represented by the RSUsand has no right to vote the shares represented by the units or to receive dividends (except for dividend equivalentpayment rights that may be awarded with respect to the RSUs). The Committee at its discretion may waive therestriction period, but settlement of any RSUs will occur on the same settlement date as would have applied absenta waiver of restrictions, if no performance goals were imposed. For the 2017 RSU awards, RSUs will be settled inshares of Common Stock. Norfolk Southern Corporation Thoroughbred Stock Option Plan (TSOP) Our Board of Directors adopted TSOP on January 26, 1999, to promote the success of our company by providing anopportunity for nonagreement employees to acquire a proprietary interest in our company and thereby to provide anadditional incentive to nonagreement employees to devote their maximum efforts and skills to the advancement,betterment, and prosperity of our company and our stockholders. Under TSOP there were 6,000,000 shares ofauthorized but unissued Common Stock reserved for issuance. TSOP has not been and is not required to have beenapproved by our stockholders. Active full-time nonagreement employees residing in the United States or Canada are eligible for selection toreceive TSOP awards. Under TSOP, the Committee, or the Corporation’s chief executive officer to the extent theCommittee delegates award-making authority pursuant to TSOP, may grant nonqualified stock options subject tosuch terms and conditions as provided in TSOP. The option price may not be less than the average of the high and low prices at which Common Stock is traded onthe date of the grant. All options are subject to a vesting period of at least one year, and the term of the option willnot exceed ten years. TSOP specifically prohibits repricing without stockholder approval, except for capitaladjustments.
K75

Norfolk Southern Corporation Directors’ Restricted Stock Plan (Plan) The Plan was adopted on January 1, 1994, and was designed to increase ownership of Common Stock by our non-employee Directors so as to further align their ownership interest in our company with that of our stockholders.The Plan has not been and is not required to have been approved by our stockholders. Effective January 23, 2015, the Board amended the Plan to provide that no additional awards will be made underthe Plan. Prior to that amendment, only non-employee Directors who are not and never have been employees of ourcompany were eligible to participate in the Plan. Upon becoming a Director, each eligible Director received a one-time grant of 3,000 restricted shares of Common Stock. No additional shares may be granted under the Plan. Noindividual member of the Board exercised discretion concerning the eligibility of any Director or the number ofshares granted. The restriction period applicable to restricted shares granted under the Plan begins on the date of the grant and endson the earlier of the recipient’s death or the day after the recipient ceases to be a Director by reason of disability orretirement. During the restriction period, shares may not be sold, pledged, or otherwise encumbered. Directorsforfeit the restricted shares if they cease to serve as a Director of our company for reasons other than their disability,retirement, or death.
K76
Item 13. Certain Relationships and Related Transactions, and Director Independence In accordance with General Instruction G(3), information called for by Part III, Item 13, is incorporated herein byreference from the information appearing under the caption “Related Persons Transactions” and under the caption“Director Independence” in our definitive Proxy Statement for our 2018 Annual Meeting of Stockholders, whichdefinitive Proxy Statement will be filed electronically with the SEC pursuant to Regulation 14A.
Item 14. Principal Accounting Fees and Services In accordance with General Instruction G(3), information called for by Part III, Item 14, is incorporated herein byreference from the information appearing under the caption “Ratification of Appointment of Independent RegisteredPublic Accounting Firm” in our definitive Proxy Statement for our 2018 Annual Meeting of Stockholders, whichdefinitive Proxy Statement will be filed electronically with the SEC pursuant to Regulation 14A.

PART IV
NORFOLK SOUTHERN CORPORATION AND SUBSIDIARIES
K77
Item 15. Exhibits, Financial Statement Schedules
Page(A) The following documents are filed as part of this report:
1. Index to Financial Statements
Report of Management K32Reports of Independent Registered Public Accounting Firm K33
Consolidated Statements of Income, Years ended December 31, 2017, 2016, and 2015 K36Consolidated Statements of Comprehensive Income, Years ended December 31, 2017,2016, and 2015 K37
Consolidated Balance Sheets at December 31, 2017 and 2016 K38Consolidated Statements of Cash Flows, Years ended December 31, 2017, 2016, and2015 K39Consolidated Statements of Changes in Stockholders’ Equity, Years ended December 31,2017, 2016, and 2015 K40Notes to Consolidated Financial Statements K41
2. Financial Statement Schedule:
The following consolidated financial statement schedule should be read in connectionwith the consolidated financial statements:
Index to Consolidated Financial Statement Schedule
Schedule II – Valuation and Qualifying Accounts K90
Schedules other than the one listed above are omitted either because they are not requiredor are inapplicable, or because the information is included in the consolidated financialstatements or related notes.
3. Exhibits
ExhibitNumber Description2.1 Distribution Agreement, dated as of July 26, 2004, by and among CSX Corporation, CSX
Transportation, Inc., CSX Rail Holding Corporation, CSX Northeast HoldingsCorporation, Norfolk Southern Corporation, Norfolk Southern Railway Company, CRRHoldings LLC, Green Acquisition Corp., Conrail Inc., Consolidated Rail Corporation,New York Central Lines LLC, Pennsylvania Lines LLC, NYC Newco, Inc., and PRRNewco, Inc., is incorporated by reference to Exhibit 2.1 to Norfolk SouthernCorporation’s Form 8-K filed on September 2, 2004. (SEC File No. 001-08339)

4 Instruments Defining the Rights of Security Holders, Including Indentures:
(a) Indenture, dated as of January 15, 1991, from Norfolk Southern Corporation to First Trustof New York, National Association, as Trustee, is incorporated by reference to Exhibit 4.1to Norfolk Southern Corporation’s Registration Statement on Form S-3 (SEC File No.33-38595).
(b) First Supplemental Indenture, dated May 19, 1997, between Norfolk SouthernCorporation and First Trust of New York, National Association, as Trustee, related to theissuance of notes in the principal amount of $4.3 billion, is incorporated by reference toExhibit 1.1(d) to Norfolk Southern Corporation’s Form 8-K filed on May 21, 1997. (SECFile No. 001-08339)
(c) Second Supplemental Indenture, dated April 26, 1999, between Norfolk SouthernCorporation and U.S. Bank Trust National Association, as Trustee, is incorporated byreference to Exhibit 1.1(c) to Norfolk Southern Corporation’s Form 8-K filed on April 30,1999. (SEC File No. 001-08339)
(d) Fourth Supplemental Indenture, dated as of February 6, 2001, between Norfolk SouthernCorporation and U.S. Bank Trust National Association, as Trustee, related to the issuanceof notes in the principal amount of $1 billion, is incorporated by reference to Exhibit 4.1to Norfolk Southern Corporation’s Form 8-K filed on February 7, 2001. (SEC File No.001-08339)
(e) Indenture, dated August 27, 2004, among PRR Newco, Inc., as Issuer, and NorfolkSouthern Railway Company, as Guarantor, and The Bank of New York, as Trustee, isincorporated by reference to Exhibit 4(1) to Norfolk Southern Corporation’s Form 10-Qfiled on October 28, 2004. (SEC File No. 001-08339)
(f) First Supplemental Indenture, dated August 27, 2004, among PRR Newco, Inc., as Issuer,and Norfolk Southern Railway Company, as Guarantor, and The Bank of New York, asTrustee, related to the issuance of notes in the principal amount of approximately $451.8million, is incorporated by reference to Exhibit 4(m) to Norfolk Southern Corporation’sForm 10-Q filed on October 28, 2004. (SEC File No. 001-08339)
(g) Ninth Supplemental Indenture, dated as of March 11, 2005, between Norfolk SouthernCorporation and U.S. Bank Trust National Association, as Trustee, related to the issuanceof notes in the principal amount of $300 million, is incorporated by reference to Exhibit4.1 to Norfolk Southern Corporation’s Form 8-K filed on March 15, 2005. (SEC File No.001-08339)
(h) Tenth Supplemental Indenture, dated as of May 17, 2005, between Norfolk SouthernCorporation and U.S. Bank Trust National Association, as Trustee, related to the issuanceof notes in the principal amount of $366.6 million, is incorporated by reference to Exhibit99.1 to Norfolk Southern Corporation’s Form 8-K filed on May 18, 2005. (SEC File No.001-08339)
3 Articles of Incorporation and Bylaws –
(i)(a) The Restated Articles of Incorporation of Norfolk Southern Corporation are incorporatedby reference to Exhibit 3(i) to Norfolk Southern Corporation’s 10-K filed on March 5,2001. (SEC File No. 001-08339)
(i)(b) An amendment to the Articles of Incorporation of Norfolk Southern Corporation isincorporated by reference to Exhibit 3(i) to Norfolk Southern Corporation’s Form 8-Kfiled on May 18, 2010. (SEC File No. 001-08339)
(ii) The Bylaws of Norfolk Southern Corporation, as amended January 22, 2018, areincorporated by reference to Exhibit 99.1 to Norfolk Southern Corporation’s Form 8-Kfiled on January 22, 2018. (SEC File No. 001-08339)
K78

(i) Eleventh Supplemental Indenture, dated as of May 17, 2005, between Norfolk SouthernCorporation and U.S. Bank Trust National Association, as Trustee, related to the issuanceof notes in the principal amount of $350 million, is incorporated by reference to Exhibit99.2 to Norfolk Southern Corporation’s Form 8-K filed on May 18, 2005. (SEC File No.001-08339)
(j) Twelfth Supplemental Indenture, dated as of August 26, 2010, between Norfolk SouthernCorporation and U.S. Bank Trust National Association, as Trustee, related to the issuanceof notes in the principal amount of $250 million, is incorporated by reference to Exhibit4.2 to Norfolk Southern Corporation’s Form 8-K filed on August 26, 2010. (SEC FileNo. 001-08339)
(k) Indenture, dated as of April 4, 2008, between Norfolk Southern Corporation and U.S.Bank Trust National Association, as Trustee, related to the issuance of notes in theprincipal amount of $600 million, is incorporated by reference to Exhibit 4.1 to NorfolkSouthern Corporation’s Form 8-K filed on April 9, 2008. (SEC File No. 001-08339)
(l) Indenture, dated as of January 15, 2009, between Norfolk Southern Corporation and U.S.Bank Trust National Association, as Trustee, related to the issuance of notes in theprincipal amount of$500 million, is incorporated by reference to Exhibit 4.1 to NorfolkSouthern Corporation’s Form 8-K filed on January 20, 2009. (SEC File No. 001-08339)
(m) Indenture, dated as of June 1, 2009, between Norfolk Southern Corporation and U.S.Bank Trust National Association, as Trustee, is incorporated by reference to Exhibit 4.1 toNorfolk Southern Corporation’s Form 8-K filed on June 1, 2009. (SEC File No.001-08339)
(n) First Supplemental Indenture, dated as of June 1, 2009, between Norfolk SouthernCorporation and U.S. Bank Trust National Association, as Trustee, related to the issuanceof notes in the principal amount of $500 million, is incorporated by reference to Exhibit4.2 to Norfolk Southern Corporation’s Form 8-K filed on June 1, 2009. (SEC File No.001-08339)
(o) Second Supplemental Indenture, dated as of May 23, 2011, between the Registrant andU.S. Bank Trust National Association, as Trustee, related to the issuance of notes in theprincipal amount of $400 million, is incorporated by reference to Exhibit 4.1 to NorfolkSouthern Corporation’s Form 8-K filed on May 23, 2011. (SEC File No. 001-08339)
(p) Indenture, dated as of September 14, 2011, between the Registrant and U.S. Bank TrustNational Association, as Trustee, related to the issuance of notes in the principal amountof $595,504,000, is incorporated by reference to Exhibit 4.1 to Norfolk SouthernCorporation’s Form 8-K filed on September 15, 2011. (SEC File No. 001-08339)
(q) Third Supplemental Indenture, dated as of September 14, 2011, between the Registrantand U.S. Bank Trust National Association, as Trustee, related to the issuance of notes inthe principal amount of $4,492,000, is incorporated by reference to Exhibit 4.2 to NorfolkSouthern Corporation’s Form 8-K filed on September 15, 2011. (SEC File No.001-08339)
(r) Fourth Supplemental Indenture, dated as of November 17, 2011, between the Registrantand U.S. Bank Trust National Association, as Trustee, related to the issuance of two seriesof notes, one in the principal amount of $500 million and one in the principal amount of$100 million, is incorporated by reference to Exhibit 4.1 to Norfolk SouthernCorporation’s Form 8-K filed on November 17, 2011. (SEC File No. 001-08339)
(s) Indenture, dated as of March 15, 2012, between the Registrant and U.S. Bank TrustNational Association, as Trustee, is incorporated by reference to Exhibit 4.1 to NorfolkSouthern Corporation’s Form 8-K filed on March 15, 2012. (SEC File No. 001-08339)
(t) First Supplemental Indenture, dated as of March 15, 2012, between the Registrant andU.S. Bank Trust National Association, as Trustee, is incorporated by reference to Exhibit4.2 to Norfolk Southern Corporation’s Form 8-K filed on March 15, 2012. (SEC File No.001-08339)
K79

(u) Indenture, dated as of August 20, 2012, between the Registrant and U.S. Bank TrustNational Association, as Trustee, is incorporated by reference to Exhibit 4.1 to theRegistrant’s Form 8-K filed on August 21, 2012. (SEC File No. 001-08339)
(v) Second Supplemental Indenture, dated as of September 7, 2012, between the Registrantand U.S. Bank Trust National Association, as Trustee, is incorporated by reference toExhibit 4.1 to Norfolk Southern Corporation’s Form 8-K filed on September 7, 2012.(SEC File No. 001-08339)
(w) Third Supplemental Indenture, dated as of August 13, 2013, between the Registrant andU.S. Bank Trust National Association, as Trustee, related to the issuance of notes in theprincipal amount of $500,000,000, is incorporated by reference to Exhibit 4.1 to NorfolkSouthern Corporation’s Form 8-K filed on August 13, 2013. (SEC File No. 001-08339)
(x) Fourth Supplemental Indenture, dated as of November 21, 2013, between the Registrantand U.S. Bank Trust National Association, as Trustee, related to the issuance of notes inthe principal amount of $400,000,000, is incorporated by reference to Exhibit 4.1 toNorfolk Southern Corporation’s Form 8-K filed on November 21, 2013. (SEC File No.001-08339)
(y) Indenture dated as of June 2, 2015, between Registrant and U.S. Bank Trust NationalAssociation, as Trustee, is incorporated by reference to Exhibit 4.1 to Norfolk SouthernCorporation’s Form 8-K filed on June 2, 2015. (SEC File No. 001-08339)
(z) First Supplemental Indenture, dated as of June 2, 2015, between the Registrant and U.S.Bank Trust National Association, as Trustee, is incorporated by reference to Exhibit 4.2 toNorfolk Southern Corporation’s Form 8-K filed on June 2, 2015. (SEC File No.001-08339)
(aa) Second Supplemental Indenture, dated as of November 3, 2015, between the Registrantand U.S. Bank Trust National Association, as Trustee, is incorporated by reference toExhibit 4.1 to Norfolk Southern Corporation’s Form 8-K filed on November 3, 2015.(SEC File No. 001-08339)
(bb) Third Supplemental Indenture, dated as of June 3, 2016, between the Registrant and U.S.Bank National Association, as Trustee, is incorporated by reference to Exhibit 4.1 toNorfolk Southern Corporation’s Form 8-K filed on June 3, 2016. (SEC File No.001-08339)
(cc) Fourth Supplemental Indenture, dated as of May 31, 2017, between the Registrant andU.S. Bank National Association, as Trustee, is incorporated by reference to Exhibit 4.1 tothe Corporation’s Form 8-K filed May 31, 2017. (SEC File No. 001-08339)
(dd) Indenture dated as of August 15, 2017, between the Registrant and U.S. Bank NationalAssociation, as Trustee, is incorporated by reference herein to Exhibit 4.1 to NorfolkSouthern Corporation’s Form 8-K filed August 15, 2017. (SEC File No. 001-08339)
(ee) Registration Rights Agreement dated as of August 15, 2017. The Agreement isincorporated by reference herein to Exhibit 4.2 to Norfolk Southern Corporation’s Form8-K filed August 15, 2017. (SEC File No. 001-08339)
(ff) Indenture, dated as of November 16, 2017, between the Registrant and U.S. BankNational Association, as Trustee, is incorporated by reference herein to Exhibit 4.1 toNorfolk Southern Corporation’s Form 8-K filed November 16, 2017. (SEC File No.001-08339)
(gg) Registration Rights Agreement, dated as of November 16, 2017, between NorfolkSouthern Corporation and Merrill Lynch, Pierce, Fenner & Smith Incorporated, isincorporated by reference herein to Exhibit 4.2 to Norfolk Southern Corporation’s Form8-K filed November 16, 2017. (SEC File No. 001-08339)
In accordance with Item 601(b)(4)(iii) of Regulation S-K, copies of other instruments ofNorfolk Southern Corporation and its subsidiaries with respect to the rights of holders oflong-term debt are not filed herewith, or incorporated by reference, but will be furnishedto the Commission upon request.
K80

10 Material Contracts -
(a) The Transaction Agreement, dated as of June 10, 1997, by and among CSX and CSXTransportation, Inc., Registrant, Norfolk Southern Railway Company, Conrail Inc.,Consolidated Rail Corporation, and CRR Holdings LLC, with certain schedules thereto,previously filed, is incorporated by reference to Exhibit 10(a) to Norfolk SouthernCorporation’s Form 10-K filed on February 24, 2003. (SEC File No. 001-08339)
(b) Amendment No. 1 dated as of August 22, 1998, to the Transaction Agreement, dated as ofJune 10, 1997, by and among CSX Corporation, CSX Transportation, Inc., NorfolkSouthern Corporation, Norfolk Southern Railway Company, Conrail, Inc., ConsolidatedRail Corporation, and CRR Holdings LLC, is incorporated by reference from Exhibit10.1 to Norfolk Southern Corporation’s Form 10-Q filed on August 11, 1999. (SEC FileNo. 001-08339)
(c) Amendment No. 2 dated as of June 1, 1999, to the Transaction Agreement, dated June 10,1997, by and among CSX Corporation, CSX Transportation, Inc., Norfolk SouthernCorporation, Norfolk Southern Railway Company, Conrail, Inc., Consolidated RailCorporation, and CRR Holdings LLC, is incorporated by reference from Exhibit 10.2 toNorfolk Southern Corporation’s Form 10-Q filed on August 11, 1999. (SEC File No.001-08339)
(d) Amendment No. 3 dated as of June 1, 1999, and executed in April 2004, to theTransaction Agreement, dated June 10, 1997, by and among CSX Corporation, CSXTransportation, Inc., Norfolk Southern Corporation, Norfolk Southern Railway Company,Conrail, Inc., Consolidated Rail Corporation, and CRR Holdings LLC, is incorporated byreference from Exhibit 10(dd) to Norfolk Southern Corporation’s Form 10-Q filed onJuly 30, 2004. (SEC File No. 001-08339)
(e) Amendment No. 5 to the Transaction Agreement, dated as of August 27, 2004, by andamong CSX Corporation, CSX Transportation, Inc., Norfolk Southern Corporation,Norfolk Southern Railway Company, Conrail, Inc., Consolidated Rail Corporation, andCRR Holdings LLC, is incorporated by reference to Exhibit 10.1 to Norfolk SouthernCorporation’s Form 8-K filed on September 2, 2004. (SEC File No. 001-08339)
(f) Amendment No. 6 dated as of April 1, 2007, to the Transaction Agreement, dated June10, 1997, by and among CSX Corporation, CSX Transportation, Inc., Norfolk SouthernRailway Company, Conrail, Inc., Consolidated Rail Corporation, and CRR HoldingsLLC, is incorporated by reference to Exhibit 10.5 to Norfolk Southern Corporation’sForm 10-Q filed on July 27, 2007. (SEC File No. 001-08339)
(g) Shared Assets Area Operating Agreement for North Jersey, dated as of June 1, 1999, byand among Consolidated Rail Corporation, CSX Transportation, Inc., and NorfolkSouthern Railway Company, with exhibit thereto, is incorporated by reference fromExhibit 10.4 to Norfolk Southern Corporation’s Form 10-Q filed on August 11, 1999.(SEC File No. 001-08339)
(h) Shared Assets Area Operating Agreement for Detroit, dated as of June 1, 1999, by andamong Consolidated Rail Corporation, CSX Transportation, Inc., and Norfolk SouthernRailway Company, with exhibit thereto, is incorporated by reference from Exhibit 10.6 toNorfolk Southern Corporation’s Form 10-Q filed on August 11, 1999. (SEC File No.001-08339)
(i) Shared Assets Area Operating Agreement for South Jersey/Philadelphia, dated as of June1, 1999, by and among Consolidated Rail Corporation, CSX Transportation, Inc., andNorfolk Southern Railway Company, with exhibit thereto, is incorporated by referencefrom Exhibit 10.5 to Norfolk Southern Corporation’s Form 10-Q filed on August 11,1999. (SEC File No. 001-08339)
K81

(j) Amendment No. 1, dated as of June 1, 2000, to the Shared Assets Area OperatingAgreements for North Jersey, South Jersey/Philadelphia, and Detroit, dated as of June 1,1999, by and among Consolidated Rail Corporation, CSX Transportation, Inc., andNorfolk Southern Railway Company, with exhibits thereto, is incorporated by referenceto Exhibit 10(h) to Norfolk Southern Corporation’s Form 10-K filed on March 5, 2001.(SEC File No. 001-08339)
(k) Amendment No. 2, dated as of January 1, 2001, to the Shared Assets Area OperatingAgreements for North Jersey, South Jersey/Philadelphia, and Detroit, dated as of June 1,1999, by and among Consolidated Rail Corporation, CSX Transportation, Inc., andNorfolk Southern Railway Company, with exhibits thereto, is incorporated by referenceto Exhibit 10(j) to Norfolk Southern Corporation’s Form 10-K filed on February 21,2002. (SEC File No. 001-08339)
(l) Amendment No. 3, dated as of June 1, 2001, and executed in May of 2002, to the SharedAssets Area Operating Agreements for North Jersey, South Jersey/Philadelphia, andDetroit, dated as of June 1, 1999, by and among Consolidated Rail Corporation, CSXTransportation, Inc., and Norfolk Southern Railway Company, with exhibits thereto, isincorporated by reference to Exhibit 10(k) to Norfolk Southern Corporation’s Form 10-Kfiled on February 24, 2003. (SEC File No. 001-08339)
(m) Amendment No. 4, dated as of June 1, 2005, and executed in late June 2005, to theShared Assets Area Operating Agreements for North Jersey, South Jersey/Philadelphia,and Detroit, dated as of June 1, 1999, by and among Consolidated Rail Corporation, CSXTransportation, Inc., and Norfolk Southern Railway Company, with exhibits thereto, isincorporated by reference to Exhibit 99 to Norfolk Southern Corporation’s Form 8-Kfiled on July 1, 2005. (SEC File No. 001-08339)
(n) Monongahela Usage Agreement, dated as of June 1, 1999, by and among CSXTransportation, Inc., Norfolk Southern Railway Company, Pennsylvania Lines LLC, andNew York Central Lines LLC, with exhibit thereto, is incorporated by reference from -Exhibit 10.7 to Norfolk Southern Corporation’s Form 10-Q filed on August 11, 1999.(SEC File No. 001-08339)
(o) The Agreement, entered into as of July 27, 1999, between North Carolina RailroadCompany and Norfolk Southern Railway Company, is incorporated by reference fromExhibit 10(i) to Norfolk Southern Corporation’s Form 10-K filed on March 6, 2000.(SEC File No. 001-08339)
(p) Second Amendment, dated December 28, 2009, to the Master Agreement dated July 27,1999, by and between North Carolina Railroad Company and Norfolk Southern RailwayCompany, is incorporated by reference to Exhibit 10(q) to Norfolk SouthernCorporation’s Form 10-K filed on February 17, 2010 (Exhibits, annexes and schedulesomitted. The Registrant will furnish supplementary copies of such materials to the SECupon request). (SEC File No. 001-08339)
(q) The Supplementary Agreement, entered into as of January 1, 1987, between the Trusteesof the Cincinnati Southern Railway and The Cincinnati, New Orleans and Texas PacificRailway Company (the latter a wholly owned subsidiary of Norfolk Southern RailwayCompany) – extending and amending a Lease, dated as of October 11, 1881 – isincorporated by reference to Exhibit 10(k) to Norfolk Southern Corporation’s Form 10-Kfiled on March 5, 2001. (SEC File No. 001-08339)
(r)* Norfolk Southern Corporation Executive Management Incentive Plan, as approved byshareholders May 14, 2015, is incorporated by reference to Exhibit 10-A to NorfolkSouthern Corporation’s Form 10-Q filed on July 27, 2015. (SEC File No. 001-08339)
(s)* The Norfolk Southern Corporation Officers’ Deferred Compensation Plan, as amendedeffective September 26, 2000, is incorporated by reference to Exhibit 10(n) to NorfolkSouthern Corporation’s Form 10-K filed on March 5, 2001. (SEC File No. 001-08339)
(t)* The Norfolk Southern Corporation Directors’ Restricted Stock Plan, adopted January 1,1994, and amended and restated effective as of January 23, 2015, is incorporated byreference to Exhibit 10.1 to Norfolk Southern Corporation’s Form 10-Q filed onOctober 25, 2017. (SEC File No. 001-08339)
K82

(u)* Supplemental Benefit Plan of Norfolk Southern Corporation and Participating SubsidiaryCompanies, adopted June 1, 1982, as amended and restated effective as of June 26, 2015,is incorporated by reference to Exhibit 10.2 to Norfolk Southern Corporation’s Form 10-Q filed on October 25, 2017. (SEC File No. 001-08339)
(v)* Retirement Plan of Norfolk Southern Corporation and Participating SubsidiaryCompanies effective June 1, 1982, as amended and restated effective January 1, 2016, isincorporated by reference to Exhibit 10(hh) to Norfolk Southern Corporation’s Form 10-K file on February 6, 2017. (SEC File No. 001-08339)
(w)* The Norfolk Southern Corporation Directors’ Charitable Award Program, as amendedeffective July 2007, is incorporated by reference to Exhibit 10.6 to Norfolk SouthernCorporation’s Form 10-Q filed on July 27, 2007. (SEC File No. 001-08339)
(x) The Norfolk Southern Corporation Thoroughbred Stock Option Plan, as amendedeffective July 22, 2013, is incorporated by reference to Exhibit 10.2 to Norfolk SouthernCorporation’s Form 10-Q filed on July 24, 2013. (SEC File No. 001-08339)
(y)* The Norfolk Southern Corporation Executive Life Insurance Plan, as amended andrestated effective November 1, 2009, is incorporated by reference to Exhibit 10(cc) toNorfolk Southern Corporation’s Form 10-K filed on February 17, 2010. (SEC File No.001-08339)
(z)* The description of Norfolk Southern Corporation’s executive physical reimbursement fornon-employee directors and certain executives is incorporated by reference to NorfolkSouthern Corporation’s Form 8-K filed on July 28, 2005; but no reimbursements will bemade for physical examinations performed for non-employee directors after July 30,2016. (SEC File No. 001-08339)
(aa)*,** The Norfolk Southern Corporation Long-Term Incentive Plan, as approved byshareholders May 14, 2015, and as amended July 29, 2016, November 29, 2016, andNovember 28, 2017. (SEC File No. 001-08339)
(bb) The Transaction Agreement, dated as of December 1, 2005, by and among NorfolkSouthern Corporation, The Alabama Great Southern Railroad Company, Kansas CitySouthern, and The Kansas City Southern Railway Company, is incorporated by referenceto Exhibit 10(II) to Norfolk Southern Corporation’s Form 10-K filed on February 23,2006 (Exhibits, annexes, and schedules omitted. The Registrant will furnishsupplementary copies of such materials to the SEC upon request). (SEC File No.001-08339)
(cc) Amendment No. 1, dated as of January 17, 2006, by and among Norfolk SouthernCorporation, The Alabama Great Southern Railroad Company, Kansas City Southern, andThe Kansas City Southern Railroad , is incorporated by reference to Exhibit 10(mm) toNorfolk Southern Corporation’s Form 10-K filed on February 23, 2006. (SEC File No.001-08339)
(dd) Amendment No. 2, dated as of May 1, 2006, to the Transaction Agreement, dated as ofDecember 1, 2005, by and among Norfolk Southern Corporation, The Alabama GreatSouthern Railroad Company, Kansas City Southern, and The Kansas City SouthernRailway Company is incorporated by reference to Exhibit 10.1 to Norfolk SouthernCorporation’s Form 8-K filed on May 4, 2006. (SEC File No. 001-08339)
(ee) Limited Liability Agreement of Meridian Speedway, LLC, dated as of May 1, 2006, byand among the Alabama Great Southern Railroad Company and Kansas City Southern, isincorporated by reference to Exhibit 10.2 to Norfolk Southern Corporation’s Form 8-Kfiled on May 4, 2006. (SEC File No. 001-08339)
(ff) Transfer and Administration Agreement dated as of November 8, 2007, is incorporated byreference to Exhibit 99 to Norfolk Southern Corporation’s Form 8-K filed on November14, 2007. (SEC File No. 001-08339)
K83

(gg) Amendment No. 1 to Transfer and Administration Agreement dated as of November 8,2007, and effective as of October 22, 2008, is incorporated by reference to Exhibit 99 toNorfolk Southern Corporation’s Form 8-K filed on October 23, 2008. (SEC File No.001-08339)
(hh) Amendment No. 2, dated as of May 19, 2009, to Transfer and Administration Agreementdated as of November 8, 2007, is incorporated by reference to Exhibit 10.1 to NorfolkSouthern Corporation’s Form 10-Q filed on July 31, 2009. (SEC File No. 001-08339)
(ii) Amendment No. 3, dated as of August 21, 2009, to Transfer and AdministrationAgreement dated as of November 8, 2007, is incorporated by reference to Exhibit 10.1 toNorfolk Southern Corporation’s Form 10-Q filed on October 30, 2009. (SEC File No.001-08339)
(jj) Amendment No. 4, dated as of October 22, 2009, to Transfer and AdministrationAgreement dated as of November 8, 2007, is incorporated by reference to Exhibit 99 toNorfolk Southern Corporation’s Form 8-K filed on October 22, 2009. (SEC File No.001-08339)
(kk) Amendment No. 5, dated as of January 5, 2010, to Transfer and AdministrationAgreement dated as of November 8, 2007, is incorporated by reference to Exhibit 10(xx)to Norfolk Southern Corporation’s Form 10-K filed on February 17, 2010. (SEC File No.001-08339)
(ll) Amendment No. 6, dated as of August 30, 2010, to Transfer and AdministrationAgreement dated as of November 8, 2007, is incorporated by reference to Exhibit 10.1 toNorfolk Southern Corporation’s Form 10-Q filed on October 29, 2010. (SEC File No.001-08339)
(mm) Amendment No. 7, dated as of October 21, 2010, to Transfer and AdministrationAgreement dated as of November 8, 2007, is incorporated by reference to Exhibit 99 toNorfolk Southern Corporation’s Form 8-K filed on October 22, 2010. (SEC File No.001-08339)
(nn) Amendment No. 8, dated as of October 20, 2011, to Transfer and AdministrationAgreement dated as of November 8, 2007, is incorporated by reference to Exhibit 99 toNorfolk Southern Corporation’s Form 8-K filed on October 20, 2011. (SEC File No.001-08339)
(oo) Amendment No. 9, dated as of October 18, 2012, to Transfer and AdministrationAgreement dated as of November 8, 2007, is incorporated by reference to Exhibit 99 toNorfolk Southern Corporation’s Form 8-K filed on October 22, 2012. (SEC File No.001-08339)
(pp) Amendment No. 10, dated as of October 17, 2013, to Transfer and AdministrationAgreement dated as of November 8, 2007, is incorporated by reference to Exhibit 10.1 toNorfolk Southern Corporation’s Form 8-K filed on October 18, 2013. (SEC File No.001-08339)
(qq) Amendment No. 11 to Transfer and Administration Agreement dated as of October 16,2014, is hereby incorporated by reference to Exhibit 10.1 to Norfolk SouthernCorporation’s Form 8-K filed on October 17, 2014. (SEC File No. 001-08339)
(rr) Amendment No. 12 to Transfer and Administration Agreement dated as of June 3, 2016(Schedules III and IV omitted. The Registrant will furnish supplementary copies of suchmaterials to the SEC upon request), is incorporated by reference to Exhibit 10.1 toNorfolk Southern Corporation’s Form 8-K filed on June 6, 2016. (SEC File No.001-08339)
(ss) Omnibus Amendment, dated as of March 18, 2008, to the Transfer and AdministrationAgreement dated as of November 8, 2007, is incorporated by reference to Exhibit 10.1 toNorfolk Southern Corporation’s Form 10-Q filed on April 23, 2008. (SEC File No.001-08339)
K84
(tt) Transaction Agreement (Pan Am Transaction Agreement), dated May 15, 2008, by andamong Norfolk Southern Railway Company, Pan Am Railways, Inc., Boston and MaineCorporation, and Springfield Terminal Railway Company, is incorporated by reference toExhibit 10.1 to Norfolk Southern Corporation’s Form 10-Q filed on July 24, 2008(Exhibits, annexes and schedules omitted. The Registrant will furnish supplementarycopies of such materials to the SEC upon request). (SEC File No. 001-08339)
(uu) Letter Agreement, dated October 21, 2008, by and among Norfolk Southern RailwayCompany, Pan Am Railways, Inc., Boston and Maine Corporation, and SpringfieldTerminal Railway Company amending certain terms of the Pan Am TransactionAgreement, is incorporated by reference to Exhibit 10(rrr) to Norfolk SouthernCorporation’s Form 10-K filed on February 18, 2009. (SEC File No. 001-08339)
(vv)* Directors’ Deferred Fee Plan of Norfolk Southern Corporation, adopted June 1, 1982 andas amended and restated effective October 3, 2014, is incorporated by reference toExhibit 10 to Norfolk Southern Corporation’s Form 10-Q filed on October 22, 2014.(SEC File No. 001-08339)
(ww)* Norfolk Southern Corporation Executives’ Deferred Compensation Plan, as amendedeffective June 26, 2013, is incorporated by reference to Exhibit 10.1 to Norfolk SouthernCorporation’s Form 10-Q filed on July 24, 2013. (SEC File No. 001-08339)
(xx)* Amendment to Norfolk Southern Corporation Officers’ Deferred Compensation Plan,effective January 1, 2008, is incorporated by reference to Exhibit 10.03 to NorfolkSouthern Corporation’s Form 8-K filed on July 24, 2008. (SEC File No. 001-08339)
(yy)* Stock Unit Plan of Norfolk Southern Corporation dated as of July 24, 2001, as amendedon August 21, 2008, with an effective date of January 1, 2009, is incorporated byreference to Exhibit 10.1 to Norfolk Southern Corporation’s Form 10-Q filed on October24, 2008. (SEC File No. 001-08339)
(aaa)* Form of Amended and Restated Change in Control Agreement between Norfolk SouthernCorporation and certain executive officers (including those defined as “named executiveofficers” and identified in the Corporation’s Proxy Statement for the 2016 annualMeeting of Stockholders), is incorporated by reference to Exhibit 10(aaaa) to NorfolkSouthern Corporation’s Form 10-K filed on February 18, 2009. (SEC File No.001-08339)
(bbb) Limited Liability Company Agreement of Pan Am Southern LLC, dated as of April 9,2009, is incorporated by reference to Exhibit 10.1 to Norfolk Southern Corporation’sForm 8-K filed on April 9, 2009 (exhibits, annexes, and schedules omitted – theRegistrant will furnish supplementary copies of such materials to the SEC upon request).(SEC File No. 001-08339)
(ccc)* Form of Norfolk Southern Corporation Long-Term Incentive Plan, Award Agreement forOutside Directors as approved by the Compensation Committee on November 28, 2016,is incorporated by reference to Exhibit 10(ggg) to Norfolk Southern Corporation’s Form10-K filed on February 6, 2017. (SEC File No. 001-08339)
(ddd)*,** Form of Norfolk Southern Corporation Long-Term Incentive Plan, Award Agreement forperformance share units approved by the Compensation Committee on November 27,2017. (SEC File No. 001-08339)
(eee)*,** Form of Norfolk Southern Corporation Long-Term Incentive Plan, Award Agreement fornon-qualified stock options approved by the Compensation Committee on November 27,2017. (SEC File No. 001-08339)
(fff)*,** Form of Norfolk Southern Corporation Long-Term Incentive Plan, Award Agreement forrestricted stock units approved by the Compensation Committee on November 27, 2017.(SEC File No. 001-08339)
K85

(ggg)* Form of Norfolk Southern Corporation Long-Term Incentive Plan, Non-CompeteAgreement Associated with Award Agreement, approved by the CompensationCommittee on November 28, 2016, is incorporated by reference to Exhibit 10(kkk) toNorfolk Southern Corporation’s 10-K filed on February 6, 2017. (SEC File No.001-08339)
(hhh) Performance Criteria for bonuses payable in 2019 for the 2018 incentive year. OnNovember 27, 2017, the Compensation Committee of the Norfolk Southern CorporationBoard of Directors adopted the following performance criteria for determining bonusespayable in 2019 for the 2018 incentive year under the Norfolk Southern CorporationExecutive Management Incentive Plan: 50% based on operating income; 35% based onoperating ratio; and 15% based on a composite of three transportation service measures,consisting of adherence to operating plan, connection performance, and trainperformance.
(iii) Omnibus Amendment, dated as of January 17, 2011, to Pan Am Transaction Agreementdated as of May 15, 2008, and Limited Liability Company Agreement of Pan AmSouthern LLC dated as of April 9, 2009, is incorporated by reference to Exhibit 10.1 toNorfolk Southern Corporation’s Form 10-Q filed on April 27, 2012. (SEC File No.001-08339)
(jjj)* Form of Amendment to Amended and Restated Change in Control Agreements betweenNorfolk Southern Corporation and the Corporation’s Chairman, President and ChiefExecutive Officer, and each of the Corporation’s Executive Vice Presidents, to eliminatethe excise tax gross-up provision in the Agreements, is incorporated by reference toExhibit 10.1 to Norfolk Southern Corporation’s Form 8-K filed on January 23, 2013.(SEC File No. 001-08339)
(kkk)* Form of Change in Control Agreement between Norfolk Southern Corporation andexecutive officers who did not enter into a change in control agreement before 2016, isincorporated by reference to Exhibit 10(ooo) to Norfolk Southern Corporation’s Form 10-K filed on February 8, 2016. (SEC File No. 001-08339)
(lll)* Form of Norfolk Southern Corporation Long-Term Incentive Plan, Award Agreement forPerformance Share Unit Incentive for Accelerated Five-Year Plan approved by theCompensation Committee on November 28, 2016, is incorporated by reference to Exhibit10(ppp) to Norfolk Southern Corporation’s Form 10-K filed on February 6, 2017. (SECFile No. 001-08339)
(mmm) Credit Agreement dated as of May 26, 2016, establishing a 5-year, $750 million,unsecured revolving credit facility of the Registrant, is incorporated by reference toExhibit 10.1 to Norfolk Southern Corporation’s Form 8-K filed on May 27, 2016. (SECFile No. 001-08339)
12** Statement re: Computation of Ratio of Earnings to Fixed Charges.
21** Subsidiaries of the Registrant.
23** Consent of Independent Registered Public Accounting Firm.
31-A** Rule 13a-14(a)/15d-014(a) CEO Certification.
31-B** Rule 13a-14(a)/15d-014(a) CFO Certification.
32** Section 1350 Certifications.
99** Annual CEO Certification pursuant to NYSE Rule 303A.12(a).
K86

(B) Exhibits.
The Exhibits required by Item 601 of Regulation S-K as listed in Item 15(A)3 are filedherewith or incorporated by reference.
(C) Financial Statement Schedules.
Financial statement schedules and separate financial statements specified by this Item areincluded in Item 15(A)2 or are otherwise not required or are not applicable.
Exhibits 23, 31, 32, and 99 are included in copies assembled for public dissemination. Allexhibits are included in the 2017 Form 10-K posted on our website atwww.norfolksouthern.com under “Investors” and “SEC Filings” or you may requestcopies by writing to:
Office of Corporate SecretaryNorfolk Southern Corporation
Three Commercial PlaceNorfolk, Virginia 23510-9219
101** The following financial information from Norfolk Southern Corporation’s Annual Reporton Form 10-K for the year ended December 31, 2017, formatted in Extensible BusinessReporting Language (XBRL) includes: (i) the Consolidated Statements of Income ofeach of the years ended December 31, 2017, 2016, and 2015; (ii) the ConsolidatedStatements of Comprehensive Income for each of the years ended December 31, 2017,2016, and 2015; (iii) the Consolidated Balance Sheets at December 31, 2017 and 2016;(iv) the Consolidated Statements of Cash Flows for each of the years ended December31, 2017, 2016, and 2015; (v) the Consolidated Statements of Changes in Stockholders’Equity for each of the three years ended December 31, 2017, 2016, and 2015; and (vi) theNotes to Consolidated Financial Statements.
* Management contract or compensatory arrangement.** Filed herewith.
K87
Item 16. Form 10-K Summary
Not applicable.

POWER OF ATTORNEY
Each person whose signature appears on the next page under SIGNATURES hereby authorizes William A. Galankoand Cynthia C. Earhart, or any one of them, to execute in the name of each such person, and to file, anyamendments to this report, and hereby appoints William A. Galanko and Cynthia C. Earhart, or any one of them, asattorneys-in-fact to sign on his or her behalf, individually and in each capacity stated below, and to file, any and allamendments to this report.
K88
SIGNATURES
Pursuant to the requirements of Section 13 or 15(d) of the Securities Exchange Act of 1934, Norfolk SouthernCorporation has duly caused this report to be signed on its behalf by the undersigned, thereunto duly authorized, onthis 5th day of February, 2018.
/s/ James A. SquiresBy: James A. Squires
(Chairman, President and Chief Executive Officer)

Pursuant to the requirements of the Securities Exchange Act of 1934, this report has been signed below on this 5thday of February, 2018, by the following persons on behalf of Norfolk Southern Corporation and in the capacitiesindicated.
Signature Title
/s/ James A. Squires (James A. Squires)
Chairman, President and Chief Executive Officer and Director(Principal Executive Officer)
/s/ Cynthia C. Earhart (Cynthia C. Earhart)
Executive Vice President Finance and Chief Financial Officer(Principal Financial Officer)
/s/ Thomas E. Hurlbut (Thomas E. Hurlbut)
Vice President and Controller(Principal Accounting Officer)
/s/ Thomas D. Bell, Jr. (Thomas D. Bell, Jr.) Director
/s/ Erskine B. Bowles (Erskine B. Bowles) Director
/s/ Wesley G. Bush (Wesley G. Bush) Director
/s/ Daniel A. Carp (Daniel A. Carp) Director
/s/ Mitchell E. Daniels, Jr. (Mitchell E. Daniels, Jr.) Director
/s/ Marcela E. Donadio (Marcela E. Donadio) Director
/s/ Steven F. Leer (Steven F. Leer) Director
/s/ Michael D. Lockhart (Michael D. Lockhart) Director
/s/ Amy E. Miles (Amy E. Miles) Director
/s/ Martin H. Nesbitt (Martin H. Nesbitt) Director
/s/ Jennifer F. Scanlon (Jennifer F. Scanlon) Director
/s/ John R. Thompson (John R. Thompson) Director
K89

Schedule IINorfolk Southern Corporation and SubsidiariesValuation and Qualifying AccountsYears ended December 31, 2015, 2016, and 2017 ($ in millions)
Additions charged to:BeginningBalance Expenses
OtherAccounts Deductions
EndingBalance
Year ended December 31, 2015Valuation allowance (included net in
deferred tax liability) for deferredtax assets $ 33 $ 2 $ — $ — $ 35
Casualty and other claimsincluded in other liabilities 199 66 (1) — 74 (3) 191
Current portion of casualty andother claims included inaccounts payable 187 19 119 (2) 151 (4) 174
Year ended December 31, 2016Valuation allowance (included net in
deferred tax liability) for deferredtax assets $ 35 $ 4 $ — $ — $ 39
Casualty and other claimsincluded in other liabilities 191 68 (1) — 81 (3) 178
Current portion of casualty andother claims included inaccounts payable 174 25 101 (2) 108 (4) 192
Year ended December 31, 2017Valuation allowance (included net in
deferred tax liability) for deferredtax assets $ 39 $ 5 $ — $ — $ 44
Casualty and other claimsincluded in other liabilities 178 83 (1) — 82 (3) 179
Current portion of casualty andother claims included inaccounts payable 192 17 124 (2) 146 (4) 187
(1) Includes adjustments for changes in estimates for prior years’ claims.(2) Includes revenue refunds and overcharges provided through deductions from operating revenues and transfers
from other accounts.(3) Payments and reclassifications to/from accounts payable.(4) Payments and reclassifications to/from other liabilities.
K90

Intentionally Left Blank

Intentionally Left Blank

Intentionally Left Blank

Intentionally Left Blank

Intentionally Left Blank

Intentionally Left Blank

PUBLICATIONSThe following reports and publications are available on our website at www.norfolksouthern.com and, upon written request, will be furnished in printed form to shareholders free of charge:
Annual Reports on Form 10-K Quarterly Reports on Form 10-Q Corporate Governance Guidelines Board Committee Charters Thoroughbred Code of Ethics Code of Ethical Conduct for Senior Financial Officers Categorical Independence Standards for Directors
Shareholders desiring a printed copy of one or more of these reports and publications should send their request to the corporate secretary:
Denise W. Hutson Corporate Secretary Norfolk Southern Corporation Three Commercial Place Norfolk, Va. 23510 757.823.5567
A notice and proxy statement for the annual meeting of shareholders are furnished to shareholders in advance of the meeting.
Amendments to or waivers of the Thoroughbred Code of Ethics and/or the Code of Ethical Conduct for Senior Financial Officers that are required to be disclosed pursuant to Item 5.05 of the current report on Form 8-K will be disclosed on our website.
ETHICS & COMPLIANCE HOTLINEHigh ethical standards always have been key to our success. Anyone who may be aware of a violation of our corporation’s Thoroughbred Code of Ethics is encouraged to contact our Ethics & Compliance Hotline at 800.732.9279.
COMMON STOCKTicker symbol: NSC Our common stock is listed and traded on the New York Stock Exchange.
DIVIDENDSAt its January 2018 meeting, our board of directors declared a quarterly dividend of 72 cents per share on the company’s common stock, payable on March 10, 2018, to shareholders of record on Feb. 2, 2018.
We usually pay quarterly dividends on our common stock on or about March 10, June 10, Sept. 10, and Dec. 10, when and if declared by our board of directors to shareholders of record. We have paid 142 consecutive quarterly dividends since our inception in 1982.
ACCOUNT ASSISTANCEFor assistance with lost stock certificates, transfer requirements, the INVESTORS CHOICE Plan, address changes, dividend checks, and direct deposit of dividends, contact:
American Stock Transfer & Trust Company LLC 6201 15th Avenue Brooklyn, N.Y. 11219 877.864.4750
INVESTORS CHOICEWe and our transfer agent, American Stock Transfer & Trust Company LLC (AST), offer the INVESTORS CHOICE Plan for investors wishing to purchase or sell Norfolk Southern Corporation common stock. This plan is available to both present shareholders of record and individual investors wishing to make an initial purchase of Norfolk Southern Corporation common stock. Once enrolled in the plan, you can invest cash dividends when paid and make optional cash investments simply and conveniently.
To take advantage of the INVESTORS CHOICE Plan, contact AST at 877.864.4750 or visit www.astfinancial.com. Once you are on this page, you may go to Client Login/Shareholders/Buy Shares Direct to access information about the INVESTORS CHOICE Plan.
SHAREHOLDER INFORMATION
Financial Inquiries Cynthia C. EarhartExecutive Vice President Finance andChief Financial Officer Norfolk Southern Corp.Three Commercial PlaceNorfolk, Va. 23510757.629.2734
Investor Inquiries Claiborne L. MooreDirector Investor RelationsNorfolk Southern Corp. Three Commercial PlaceNorfolk, Va. 23510757.629.2861
Corporate OfficeExecutive OfficesNorfolk Southern Corp.Three Commercial PlaceNorfolk, Va. 23510757.629.2600
Regional OfficeNorfolk Southern Corp. 1200 Peachtree St. N.E.Atlanta, Ga. 30309
Annual Report Norfolk Southern Corp.Requests & Information 800.531.6757

Three Commercial PlaceNorfolk, Virginia 23510www.norfolksouthern.com
© 2018 Norfolk Southern Corporation All Rights Reserved 10.032018.12101.75K