2017 – 2027 - ministry of environment · natural resources through various agreements (such as...
TRANSCRIPT

MINISTRY OF ENVIRONMENT AND NATURAL RESOURCES
KENYA STRATEGIC INVESTMENT FRAMEWORK FOR SUSTAINABLE LAND MANAGEMENT
2017 – 2027
December 2016

ii
FOREWORD
Kenya’s economy is highly dependent on climate-sensitive sectors such as agriculture, water, fisheries, forestry and energy. Approximately 80% of Kenya’s population is directly and indirectly dependent on rain-fed agriculture for basic livelihoods. The most vulnerable sectors happen to be the agricultural and water sectors where land degradation remains a major threat to the provision of environmental services and the ability of smallholder farmers to meet the growing demand for food and incomes. The interactions between climate change and land degradation are likely to affect a range of different social and ecosystem functions they deliver, with consequent impacts on food production, livelihoods and human well-being. The areas most affected by these impacts also happen to be the most productive in Kenya. Unless these challenges are seriously addressed, achieving the full potential of Kenya’s natural land resources could prove difficult. The process of preventing or reducing land degradation and rehabilitating degraded lands is essentially a long-term development that requires the enactment of appropriate policies and supporting institutions as well as enabling environment that ensures participation of all stakeholders and land users. Sustainable Land Management (SLM) has in recent years been a focus of the Government and various development partners, due to its potential to minimize degradation, rehabilitate degraded lands and increase food production. While the government of Kenya has made significant commitments toward sustaining natural resources through various agreements (such as UNCCD, UNFCCC, CBD, SDGs), the push to implement and scale up SLM interventions and investments to tackle land degradation in a coordinated approach across stakeholders and all sectors remains inadequate. In response to these challenges the Government of Kenya, through the Ministry of Environment and Natural Resources (MENR) is has developed the Kenya Strategic Investment Framework (KSIF) for sustainable land management (SLM) to guide in addressing land management issues through effective multi-sectoral, multi-stakeholder partnerships and collaboration. The KSIF is a tool to foster a programmatic approach to scaling up SLM practices across all relevant sectors and its implementation is envisaged to lead to a systematic change to upscale policy, institutional, governance and financial responses to the scaling up of SLM, by adopting a cross-sectoral integrated development approach to SLM. This framework is an important tool because it identifies gaps, opportunities and priorities for scaling up SLM. The Framework outlines clear roles for key sectors and stakeholders to guide and focus interventions which support securing ecosystems and actions for moving Kenya towards land degradation neutrality as part of contributing towards the attainment of Vision 2030 and Sustainable Development Goals (SDGs).

iii
Meanwhile, Kenya has been collaborating with international and national organizations in addressing the land degradation problem through various programmes and initiatives. The Kenya Strategic Investment Framework (KSIF) for sustainable land management is one of such collaborations with the World Bank and TerrAfrica aimed at scaling up SLM interventions and investments in Kenya. The KSIF is a tool adopted by the Government to strengthen a programmatic approach to SLM responding to the country’s development priorities as outlined under Vision 2030. It is important to note that, this the first national Strategy targeted at SLM holistically in a multi-sectoral focus, designed to upscale actions and investment funding. This document provides a framework, which guides current and future SLM priorities and planned investments that, in the medium term will form a national program on SLM. I wish to reaffirm the commitment of the MENR in supporting sustainable land management, and the implementation of the KSIF. Indeed, our natural resources, and the environment need to be used carefully and protected, as these are important assets for socio-economic development and for our people, now and in the future. I urge all stakeholders to play their respective roles in ensuring that the Kenya Strategic Investment Framework is successfully implemented. Prof. Judi Wakhungu Cabinet Secretary, Ministry of Environment and Natural Resources

iv
ACKNOWLEDGEMENTS
The Ministry of Environment and Natural Resources (MENR) would like to extend its sincere gratitude to all individuals and institutions, who shared their data, insights and experiences which informed and enriched the development of the Kenya Strategic Investment Framework (KSIF) for sustainable land management (SLM). It is worth noting the efforts of the Kenya Agricultural Productivity and Sustainable Land Management Project (KASLMP), a programme hosted by the MENR, which spearheaded the preparatory work and the development of this KSIF. We also appreciate the contributions of the World Bank and TerrAfrica for programme support to KAPSLMP, the baseline studies and the development of this Framework. We appreciate the contributions of all the persons and institutions that provided information and participated in the stakeholder forums that informed this Strategy. In particular, we wish to thank the 47 County Governments, County Executive Officers, the national Government Ministries, especially; Ministry of Water and Irrigation; Ministry of Agriculture, Livestock and Fisheries; Ministry of Lands, Housing and Urban Planning; Ministry of Devolution and Planning; Ministry of Finance and National The Treasury. Also, our appreciation to semi-autonomous Government institutions especially; NEMA, WRMA, KFS, KWS, NDMA, as well as the NGOs, private sector institutions, other groups and individuals who contributed to advising the formulation of this Framework. We greatly commend the contribution of the SLM Steering committee and Resource Plan, for their inputs and technical expertise in developing the content and contributing to the production of this Framework. We thank you all. Charles Sunkuli Principal Secretary – State Department of Environment Ministry of Environment and Natural Resources
v
EXECUTIVE SUMMARY
The Kenya Strategic Investment Framework on sustainable land management (KSIF) provides a strategy for enhancing investments, interventions and actions for the management of the country’s natural capital in a sustainable manner. Sustainable land management (SLM) is defined as “the adoption of land use systems that, through appropriate management practices, enables land users to maximize the economic and social benefits from the land while maintaining or enhancing the ecological support functions of the land resources”. The need for a Country Strategic Investment Framework (CSIF) on SLM for Kenya is in line with the Government’s commitment to support the sustainable utilization and management of the country’s natural resources for improving socio-economic development and livelihoods of its people now and for future generations. This concept is well espoused in the Constitution of Kenya, Section 60, which stipulates that; “Land in Kenya shall be held, used and managed in a manner that is equitable, efficient, productive and sustainable”, as well as under Section 69, in which the Government commits to “ensure sustainable exploitation, utilization, management and conservation of the environment and natural resources, and ensure the equitable sharing of the accruing benefits”. This promise is underpinned in the Kenya Vision 2030,which under section 4.6 envisions “a people living in a clean, secure and sustainable environment” and further proposes; sustainable management of natural resources, conservation and combating environmental degradation as actions towards fulfilling the Social Pillar. But despite this legislative and policy push, Kenya’s watersheds, agricultural, rangelands and settled areas continue to face extensive land degradation. This is evident from a study by the Kenya Agricultural Productivity and Sustainable Land Management Project (KAPSLMP), showing that at least 61% the total area of Kenya is at high risk of land degradation, while very high degradation affects 27% of the land. Land degradation is especially severe in the arid and semi-arid lands (ASALs). Nationally, Kenya is prone to all seven types of land degradation, namely: soil degradation, biological degradation, water degradation, chemical degradation, physical degradation, climate deterioration, and land conversion. At the same time, agricultural productivity is low compared to inherent potential. This is because investments in land productivity have not received the requisite attention in the country’s development programmes. At the policy level, there exist a disconnect in the way interventions are implemented, as there is a multiplicity of institutions, laws and policies that touch on SLM, but the sub-sector lacks a focused investment agenda. This disconnect is addressed through this SLM-focused Kenya Strategic Investment Framework for sustainable land management (KSIF). The KSIF was formulated through a participatory process which has involved extensive stakeholder consultations. Baseline work also involved dedicated studies of the subsector. These included; the “Land degradation assessment (LADA) in Kenya”, a study that utilized remote sensing and GIS tools to conduct a national level assessment of land degradation in the country. In another study, an “Overview of the

vi
policy, legislative and institutional frameworks for sustainable land management in the public sector in Kenya” was conducted. The third study determined the “Cost benefit analysis of sustainable land and water management in three water catchments of Kenya (Cherangani, Kinale-Kikuyu, Wundanyi)”. The fourth study culminated in the “Report on public expenditure review and resource mobilization strategy for sustainable land management in Kenya”. The data gathered from these studies were used to identify gaps and opportunities for enhancing investments in SLM. Further, stakeholder consultations were implemented at County level, County SLM Platforms formed in preparation for the implementation of the Strategy. Special focus group discussions were held with County Executive Committee Members (CECMs) who are the staff to lead implementation of the Strategy at County level. All the views and data collected were harmonized to produce a comprehensive KSIF. The KSIF has the following key features: Goal: To provide a national level strategic planning framework, for guiding the inter-sectoral coordination, planning, prioritization and implementation of integrated approaches, and stimulating cost effective investments and budgetary support for SLM. The KSIF will contribute to the attainment of Kenya Vision 2030 targets on economic development, food security and sustainable livelihoods. Development Objective: To restore, sustain, enhance and protect the productivity of the Kenya’s natural capital through improved investments, sector coordination and scaling up of SLM interventions. Environmental Objective: To rebuild Kenya’s natural capital assets by overcoming the causes and mitigating the negative impacts of land degradation, while also building long-term ecosystem sustainability, facilitating climate change resilience and environmental health. The Specific Objectives of the KSIF: Providing a national level strategic framework for planning, harmonization and implementation of SLM initiatives, programmes and projects in Kenya; Providing strategic directions for enhancing prioritization and investments in SLM in the country; Identifying opportunities for sector coordination, stakeholder participation, capacity development, partnerships and advocacy for SLM; Providing adequate prioritization, investments and budgetary support for SLM; Facilitating the integration of SLM into national and sectoral policies, legislations, strategies and development plans; and Enhancing knowledge, networking, common focus and logical tracking of SLM initiatives. The KSIF Guiding Principles; Increased land productivity; improved livelihoods; ecosystem sustainability; economic viability; financing; socio-economic relevance; social and cultural sustainability; institutional sustainability; multi-sectoral approach; participation and inclusiveness; sensitivity to gender, minorities and vulnerable groups); knowledge management; and international responsiveness.
vii
The Planned Outputs of the KSIF include: Policy on SLM developed; an Inter-sectoral Coordinating unit for the SLM established and functionalized; Programmes, projects and initiatives for scaling up SLM implemented; the policy, legal, institutional frameworks and investments in SLM enhanced; capacity built of the institutions, actors and stakeholders to strengthen the technical, socio-economic and support services for SLM; Research and extension for SLM upscaled to support implementation of SLM best practices; SLM knowledge management, monitoring and evaluation (M&E) and information dissemination strengthened, adding value to tracking, feedback and improvements in SLM investments and interventions. In Terms of geographic targeting, the KSIF is planned to target five land-use zones grouped as: (a) The water towers/forest areas (including ASAL water towers), (b) Smallholder rainfed agricultural areas, (c) Rangelands in ASAL areas, (d) Flood-prone areas, and, (e) Urban and peri-urban areas undergoing rapid land conversion. KSIF Programme Components– KSIF will be implemented across five components as follows:
Component-1: Implementing projects and programmes for promoting and for scaling up SLM. These will encompass; watershed approach, afforestation and agroforestry, soil and water conservation, integrated soil fertility management, rainwater harvesting and storage, runoff harvesting (runoff farming), tools and equipment for SLM implementation, energy saving interventions, integrated rangeland management programmes, drainage of waterlogging areas, flood management and control, climate change adaptation, mitigation and resilience, stormwater management, water conservation and green infrastructure in urban and peri-urban areas, pollution control and alternative livelihoods. Component-2: Enhancing the policy, legal, institutional frameworks and investments in SLM; This will include; establishing an inter-sectoral coordination mechanism for SLM, review and support the improvement of policy environment for SLM, developing a national policy on SLM, review and support the improvement of the legal and regulatory frameworks impacting on SLM, and identify mechanisms to upscale investments for SLM. Component-3: Capacity building to strengthen the technical, socio-economic and support services for SLM; building the capacity of land users, building the capacity of policy makers, building the capacity of extension (advisory) service providers, capacity building for research support service providers, strengthening the capacity of equipment and input suppliers, enhancing opportunities for credit and financial services, strengthening commercial and advisory services for SLM, and supporting alternative livelihoods that uphold SLM. Component-4: Supporting research and extension for SLM best practices: This involves, identify problems facing land users which require research and/or scientific solutions; Link land users to research institutions for adaptive research; Encourage farmer

viii
experimentation and record keeping; Re-establish SLM training of middle–level extension workers; and functionalize a demand-driven extension service in pilot areas. Component-5: Strengthening SLM knowledge management, M&E and information dissemination. This will include; documenting successful SLM technologies and approaches; establishing the Kenya SLM Information System (KSLM-IS); development and operationalization of a results-based monitoring and evaluation (M&E) framework; dissemination of SLM knowledge to users; development and implementation of an information management and communication strategy; and programme management. Each of these five components has a number of sub-components describing the respective activities. Promoting SLM requires a multi-dimensional approach as it involves a variety of cross cutting activities. Thus, each component should not be seen as stand-alone activity to be implemented in separate projects, but rather, most of the individual investment projects to be designed and implemented under the KSIF, will be expected to be multi-focal rather than sector specific and will include a blend of the respective components and sub-components. For implementing the strategy, an inter-sectoral mechanism is proposed comprising:
National government ministries: These include the Ministries responsible for: Natural Resources, Environment, Lands, Housing/Human settlements, Agriculture, Livestock, Fisheries, Water, Irrigation, national Planning, Urban Planning, Finance, National Treasury, Industry, Commerce, Trade, Regional Development, Energy, Mining/Petroleum, Tourism, Education, Science and Technology, Public Service, Social services/Gender and related ministries. The semi-autonomous agencies whose functions are relevant to SLM will also be included in the inter-sectoral coordination mechanism, which include KALRO, NEMA, KFS, KWS, WRMA, KEFRI, NDMA, universities and other relevant government affiliated agencies. County governments: Implementation of SLM interventions will be mainly undertaken at county level, as agriculture and environment are devolved functions. It is therefore vital that county governments be facilitated to build structures for implementing SLM from policy to farm-level interventions. Just as in the national government, SLM issues at county level in many cases fall across more than one department. In this regard, there will be need to create forums for inter departmental consultation and coordination for SLM planning, investments and actions. Intergovernmental coordination: In the early stages of the implementation of devolution, there has been considerable reorganization between the national and county governments on respective roles, responsibilities, resource flows and utilization. An inter-governmental mechanism will provide a structured framework for consultation and coordination of SLM issues between the two levels of government. This will ensure that SLM issues are well taken care of.

ix
Development partners: Development partners in Kenya play a key role of not only providing financial resources for SLM, but are also important for their expertise in various technical fields. The KSIF draws in the input of development partners to support investments in SLM through various modes of cooperation. County SLM Committee: –Many counties have steering committees for agriculture, environment or other issues related to SLM. The mandates of these committees will be expanded to include the SLM agenda. Where such committees do not exist, new County SLM Committees will be created to perform requisite functions in the implementation of the KSIF: The proposed budget for the ten-year KSIF is US$5,938.3 million. This budget is shared across the project components as follows; On-the-ground activities and projects to promote and up-scale SLM will cost US$4,156.6 million (70%); Enhancing the Policy, legal, institutional frameworks and investments for SLM will be US$475.1 million (8%); capacity building to strengthen the technical, socio-economic and support services for SLM costs US$890.8 million (15%); supporting research and extension for SLM best practices to cost US$237.6 million (4%); and strengthening SLM knowledge management, M&E and information dissemination which will cost US$ 178.2 million (3%). This budget was made considering the broadening of SLM issues to include flood management and peri-urban pollution control interventions alongside the other types of SLM initiatives. The sources of funding to implement the KSIF include the national Government, respective County Governments, private sector, development partners, and emerging funding mechanisms such as PES, carbon markets, water funds, green climate funds and public-private sector programmes. Timelines: The KSIF will be implemented in ten years through two five-year phases that coincide with the GoK mid-term planning (MTP) systems. These timelines are designed to be within (not to over-shoot) the Kenya Vision 2030, under which this Framework has been developed. The two phases are as follows:
Phase I: 2017 – 2022 (to coincide with the 3rd MTP under Vision 2030)
Phase II: 2022 – 2027, (to coincide with the 4th MTP under Vision 2030) A Monitoring and Evaluation (M&E) framework for the KSIF is presented for tracking the key SLM interventions, outputs and impacts. It will also be used for documentation and sharing of the lessons learnt. The M&E also ensures timely feedback is provided to policy makers and other stakeholders on the Strategy implementation, outputs and outcomes. Indicators have been set to track progress of the KSIF, including the reporting format. A main recommendation of this KSIF is the need to develop a Policy on SLM. This will facilitate upscaling SLM issues to higher policy levels so as to achieve the targets of this strategy.
x
Table of Contents FOREWORD ................................................................................................................................ii ACKNOWLEDGEMENTS ............................................................................................................ iv EXECUTIVE SUMMARY .............................................................................................................. v List of Figures ......................................................................................................................... xiii List of Tables .......................................................................................................................... xiii
LIST OF ACRONYMS AND ABBREVIATIONS ........................................................................... xiv 1. COUNTRY CONTEXT ............................................................................................................. 1 1.1 Kenya: Extent and Natural Resource Base ......................................................................... 1 1.2 The Economy ...................................................................................................................... 3 1.3 Population .......................................................................................................................... 3 1.4 Gender and Youth .............................................................................................................. 4 1.5 Poverty prevalence .............................................................................................................. 4 1.6 Land Degradation ............................................................................................................... 5 1.7 Sustainable Land Management (SLM) ................................................................................ 6 1.8 SLM Interventions Relevant to Kenya ................................................................................. 7
2 SECTOR ISSUES................................................................................................................... 10 2.1 Agriculture ....................................................................................................................... 10 2.2 Land ................................................................................................................................. 13 2.3 Water Sector ..................................................................................................................... 16 2.4 Biological Resources and Ecosystems............................................................................... 18 2.5 Environment and Pollution ............................................................................................... 21 2.6 Energy .............................................................................................................................. 23 2.7 Infrastructure Development .............................................................................................. 24 2.8 Tourism ............................................................................................................................ 25 2.9 Trade ................................................................................................................................ 26 2.10 Climate Change Threats ................................................................................................. 27 2.11 Other Emerging Issues ................................................................................................... 29
3. RATIONALE AND JUSTIFICATION FOR THE KSIF ON SLM ................................................. 31 3.1 Legal, Policy and Institutional Frameworks Guiding SLM................................................. 31
3.1.1 SLM is Entrenched in Kenya’s Legal Instruments ..................................................... 31 3.1.2 Policy Support for SLM.............................................................................................. 32 3.1.3 KSIF is Linked to National Development Priorities .................................................... 33 3.1.4 Linkage with National and County Planning and Investment Frameworks ................ 33
3.2. Synthesis of the findings of the Baseline Studies ............................................................ 35 3.3 Gaps and Bottlenecks in SLM Implementation ................................................................. 39
3.3.1 Technology gaps ........................................................................................................ 39 3.3.2 Policy gaps ................................................................................................................ 40 3.3.3 Institutional gaps ...................................................................................................... 40 3.3.4 Challenges with Monitoring and Evaluation .............................................................. 40 3.3.5 Gaps in Resource Allocation Processes ..................................................................... 41 3.3.6 The need for an Inter-sectoral coordination mechanism for SLM .............................. 42
4. KSIF PROGRAM DESCRIPTION .......................................................................................... 43 4.1 KSIF Goal, Purpose, Objectives and Guiding Principles.................................................... 43
4.1.1 Goal .......................................................................................................................... 43 4.1.2 Purpose ..................................................................................................................... 43 4.1.3 Development Objective .............................................................................................. 43 4.1.4 Overall Environmental Objective ............................................................................... 43 4.1.5 KSIF Guiding Principles ............................................................................................ 44 4.1.6 Planned Outputs ....................................................................................................... 46 4.1.7 KSIF Timelines .......................................................................................................... 46

xi
4.2 Geographic Priority Areas to Target the SLM Framework ................................................. 46 4.2.1 The Water Towers/Forest areas (including ASAL water towers) ................................ 48 4.2.2 Smallholder Rainfed Agricultural Lands.................................................................... 50 4.2.3 Rangelands in ASAL areas ........................................................................................ 51 4.2.4 Flood-prone areas ..................................................................................................... 52 4.2.5 Urban and peri-urban areas faced with rapid land conversion ................................. 53
4.3 KSIF Programme Components ......................................................................................... 55 Component-1: Implement On-the-Ground SLM Projects and Activities .............................. 55 Component-2: Enhancing Policy, Legal, Institutional and Investment Support ................. 63 Component-3: Capacity Building to Strengthenl and Support Services for SLM ................ 65 Component-4: Supporting Research and Extension for SLM Best Practices ...................... 67 Component-5: Strengthening SLM Knowledge Management and M&E ............................. 69
5. KSIF IMPLEMENTATION ARRANGEMENTS ......................................................................... 71 5.1 Institutional Partners........................................................................................................ 71
5.1.1 National Government Ministries and SAGAs ............................................................. 71 5.1.2 County governments ................................................................................................. 73 5.1.3 Development partners ............................................................................................... 73 5.1.4 Private Sector ............................................................................................................ 74 5.1.5 Research and Capacity Building Institutions ............................................................ 74 5.1.6 Non-State Actors ....................................................................................................... 74
5.2 Organizational Structure for KSIF Implementation at National Level ............................... 74 5.2.1. Inter-Ministerial SLM Coordination Committee (IMCC) ............................................ 75 5.2.2 Inter-Ministerial SLM Technical Committee (IMTC) ................................................... 75 5.2.3 KSIF SLM Secretariat (KSS)....................................................................................... 76
5.3 Organization Structures for KSIF Implementation at County Level .................................. 76 5.3.1 County Executive Committee .................................................................................... 77 5.3.2 County SLM Committee (CSLM) ................................................................................ 77 5.3.3 Watershed SLM Committee (WSLM) .......................................................................... 77 5.3.4 County SLM Secretariat ............................................................................................ 78 5.3.5 Engaging the County Political system: ...................................................................... 78
5.4 Organization structure for intergovernmental Coordination ............................................. 79 5.5 Enhancing Sustainability ................................................................................................. 81 5.6 Stakeholder Involvement .................................................................................................. 81 5.7 Implementation Plan and Scaling up strategy .................................................................. 82
6: STRATEGY FOR FINANCING AND RESOURCE MOBILIZATION .......................................... 84 6.1 Resource Allocation Processes and Mechanisms .............................................................. 84 6.2: On-going and Planned Investments in SLM ..................................................................... 85 6.3: Proposed KSIF Budget and Funding Sources .................................................................. 86
6.3.1 Proposed budget for the KSIF .................................................................................... 86 6.3.2 Funding Sources ....................................................................................................... 87
6.4: Innovative Resource Mobilization Plan ............................................................................ 89 6.4.1 Establishment of Sustainable Land Management Fund (SLMF) ................................ 89 6.4.2 Financial Sustainability ............................................................................................ 90
6.5 Economic and Financial Assessment of KSIF Investments ............................................... 91 7. MONITORING AND EVALUATION FRAMEWORK ................................................................ 93 7.1: Monitoring and Evaluation Objectives ............................................................................. 93 7.2: Benchmarks and Targets ................................................................................................. 93 7.3: Data Collection and Processing Arrangements ................................................................ 94 7.4: SLM Management Information System (KSLM-IS) ........................................................... 95 7.5: Communication Plan ....................................................................................................... 95
8. ANNEXES ............................................................................................................................ 96 Annex 1: Methodology used in developing the KSIF................................................................ 96

xii
Annex 2: Results Framework for the KSIF ............................................................................. 99 Annex 3: Detailed KSIF Results Framework ........................................................................ 100 Annex 4: Estimated Cost of Investments for KSIF ............................................................... 103 Annex 5: Cost breakdown per component and implementation period ................................. 105 Annex 6: Thematic maps showing criteria for geographic targeting of KSIF ......................... 108
Annex6.1: Map of Kenya showing land degradation risk .................................................. 108 Annex 6.2: Map of Kenya showing the major water towers .............................................. 109 Annex 6.3: Map of Kenya showing smallholder agricultural areas ................................... 110 Annex 6.4: Map of Kenya showing cattle density and ASAL areas .................................... 111 Annex 6.5: Map of Kenya showing flood-prone areas ....................................................... 112 Annex 6.6: Map showing major urban centres in Kenya prone to land conversion .......... 113

xiii
List of Figures Figure 1: Linkages of SLM Investment Framework to National and County Planning and
Investment Frameworks ........................................................................................... 34
Figure 2: County SLM Coordination Structure ........................................................................ 78
Figure 3: Overall Organization Structure for SLM .................................................................... 80
List of Tables Table 1: SLM solutions for various types of land degradation in Kenya ..................................... 7 Table 2: Constraints and Opportunities affecting SLM in Kenya .............................................. 41 Table 3: Financing gap for SLM ............................................................................................... 42 Table 4: Geographic Hot Spot and Selection Criteria for SLM Target Areas ............................. 47 Table 5: Public Sector Institutions for KSIF Engagement ......................................................... 72 Table 6: Implementation Plan for KSIF .................................................................................... 82 Table 7: Summary of Previous Budget for SLM components (2010-2015) ................................ 85 Table 8: Total KSIF budget ....................................................................................................... 86 Table 9: KSIF budget per component ....................................................................................... 87 Table 10: Sources and Strategies for Resource Mobilization for KSIF ...................................... 90

xiv
LIST OF ACRONYMS AND ABBREVIATIONS
Acronym Full Name AFA Agriculture and Food Authority AfDB African Development Bank AFFA Agriculture, Fisheries and Food Authority AfT Aid for Trade Initiative AMCEN African Ministerial Conference on the Environment ARD Agriculture and Rural Development ASAL Arid and Semi-Arid Lands ASDS Agricultural Sector Development Strategy BMUs Beach Management Units BROP Budget Review and Outlook Paper CAADP Comprehensive Africa Agriculture Development Programme CBD Convention on Biodiversity CDF Constituency Development Fund CDTF Community Development Trust Fund CECM County Executive Committee Member CFA Community Forest Association CIDP County Integrated Development Plan CIG Common Interest Groups CISEE Composite Index for SLM Enabling Environment CoG Council of Governors CSIF Country Strategic Investment Framework CSLM County SLM committee CSR Corporate Social Responsibility CSS County SLM Secretariat DO Development Objective DPs Development partners DRSRS Department of Remote Sensing and Resource Survey EDE Ending Drought Emergencies EIA Environmental Impact Assessments EIP Expanded Irrigation Programme EO Environmental Objective FAO Food and Agriculture Organization of the United Nations Fyr Financial year GBM Green Belt Movement GCF Green Climate Fund GIS Geographical Information Systems GNI Gross National Income GoK Government of Kenya ICIPE International Centre for Insect Physiology and Ecology ICRAF International Centre for Research in Agroforestry (World Agroforestry Centre) ICT Information Communication Technologies IFAD International Fund for Agricultural Development IGF Inter-Governmental Forum IGTC Intergovernmental SLM Technical Committee

xv
ILRI International Livestock Research Institute IMCC Inter-Ministerial Coordination Committee IMTC Inter-Ministerial SLM Technical Committee IPM Integrated pest management IRR Internal Rate of Return ISFM Integrated soil fertility management ITCZ Inter Tropical Convergence Zone IK Indigenous Knowledge IWRM Integrated Water Resources Management KAGRC Kenya Animal Genetic Resources Centre KALRO Kenya Agricultural and Livestock Research Organization KAPSLMP Kenya Agricultural Productivity and Sustainable Land Management Project KEFRI Kenya forest Research institute KeNHA Kenya National Highways Authorities KEPHIS Kenya Plant Health Inspectorate Services KES Kenyan Shillings KEWI Kenya Water Institute KFS Kenya Forest Service KIPPRA Kenya Institute of Public Policy Research and Analysis KMFRI Kenya Marine and Fisheries Research institute KNBS Kenya National Bureau of Statistics KNCSAP Kenya National Climate Smart Agricultural Project KSIF Kenya Strategic Investment Framework (for SLM) KSLM-IS Kenyan SLM Information System KSS Kenya SLM Secretariat KWS Kenya Wildlife Service KWTA Kenya Water Towers Agency LADA Land Degradation Assessment LAPSSET Lamu Port-Southern Sudan-Ethiopia Transport) Corridor LD Land Degradation LPG Liquefied Petroleum Gas LPG Liquefied Petroleum Gas M&E Monitoring and Evaluation MCAs Members of County Assembly MEA Multilateral Environmental Agreement MENR Ministry of Environment and Natural Resources MIS Management Information System MITPs Medium Term Investment Plans MLHUP Ministry of Lands, Housing and Urban Planning MoALF Ministry of Agriculture, Livestock and Fisheries MoDP Ministry of Devolution and Planning MoEP Ministry of Energy and Petroleum MoEST Ministry of Education, Science and Technology MWI Ministry of Water and Irrigation NACOSTI National Commission for Science, Technology and Innovation NAP National Adaptation Plan (for climate change) NBSAPs National Biodiversity Strategies and Action Plans NCCAP National Climate Change Action Plan

xvi
NCCRS National Climate Change Response Strategy NCPB National Cereals and Produce Board NCWSC Nairobi City Water and Sewerage Company NDMA National Drought Management Authority NEMA National Environment Management Authority NEPAD New Partnership for Africa’s Development NETFUND National Environment Trust Fund NGO Non Governmental Organization NIB National Irrigation Board NPV Net Present Value NSAs Non-State Actors NWMP-2030 National Water Master Plan 2030 (published in 2013) NWRMS National Water Resources Management Strategy PER Public Expenditure Review (report) PES Payments for Ecosystem Services PEST Political, Economic, Social, and Technological PESTLE Political, Economic, Social, Technological, Legal and Environmental PFMA Public Finance Management Act POPs Persistent Organic Pollutants PPP Public Private Partnership REDD Reducing Emissions from Deforestation and forest Degradation SAGA Semi-autonomous government authorities SDGs Sustainable Development Goals SGR Standard Gauge Railway Sida Swedish International Development Agency SLM Sustainable Land Management SLMF Sustainable Land Management Fund SWC Soil and Water Conservation SWGs Sector Working Groups SWOT Strengths, Weaknesses, Opportunities and Threats UNCCD United Nations Convention to Combat Desertification UNEP United Nations Environment Programme UNFCCC United Nations Framework Convention on Climate Change UNHCR United Nations High Commission for Refugees UNICEF United Nations Children’s Fund VCM Voluntary Carbon Markets WHO World Health Organization WRMA Water Resources Management Authority WRUA Water Resources Users Association WSTF Water Sector Trust Fund
1
1. COUNTRY CONTEXT
1.1 Kenya: Extent and Natural Resource Base Extent and Topography: Kenya covers a total area of 582,646 km2, of which 11,230 km2 (1.9%) are water bodies, leaving 571,416 km2 being landmass. Kenya has diverse geographic landscapes, with relief, climatic and ecological extremes affected by altitudes, which vary from sea level at the coast to over 5199 m.a.s.l. on Mt. Kenya, the highest mountain in the country. The terrain ranges from coastal reefs to inland plains, plateaus, with dominant features such as the Great Rift Valley and major highlands which constitute the “Water Towers” of the country. These include the Mt. Kenya, the Aberdares, the Mau escarpment, Cherangani and Mt. Elgon and other highlands such as Nyambene hills, Mts. Marsabit, Kulal, Nyiru, Tugen Hills, Chyulu and the Taita Hills.Geographically, the country may be divided into seven major topographic regions: a coastal belt; plains adjoining the coastal strip; a low plateau; northern plains; the fertile central Kenya highlands; the north-south Rift Valley region and the western plateaus that form part of the Lake Victoria basin. Moreover, Kenya has a880 km long coastline extending from Ishakani in Somalia in the north, to Vanga at the Tanzanian border in the south. Climate: Kenya has a moderate tropical climate which is tempered by topographic relief, as well as the movement of the Inter Tropical Convergence Zone (ITCZ). Rainfall is also affected by large water bodies like the Indian Ocean and Lake Victoria. The country generally experiences two seasonal rainfall peaks of long rain (March – May) and short rain (October -December) in most places. Most of the country is relatively dry with mean annual rainfall estimated at 680 mm per year. But this rainfall is unevenly distributed over country in both spatial as well as temporal scales, varying from about 200 mm in the dry areas to over 2,000 mm in the humid zones, the latter being mostly in the highlands. Agro-climatic zones: The country is commonly divided into seven agro-climatic zones, namely; (i) Afro-Alpine, (ii) humid, (iii) sub-humid, semi-humid, (iv) semi-humid to semi-arid, (v) semi-arid, (vi) arid and (vii) very arid. About 84% of the land area is classified as arid and semi-arid lands (ASALs), which also include the very arid zones. Thus, most of the country suffers low rainfall and erratic weather, with recurrent droughts and floods. These in turn escalate land degradation, affecting agriculture, livelihoods and the national economy. Water Resources: The total renewable freshwater resources1 of Kenya are estimated to be 76.610 billion m3/year, of which 20.637 billion m3/year is surface water and 55.973 billion m3/year is ground water. Kenya’s surface water resources are distributed across five major drainage basins: the Tana, Athi, Ewaso Ng’iro north, Rift
1Republic of Kenya (2013).National Water Master Plan 2030.

2
Valley and Lake Victoria Basin. These basins drain from the major water towers: Mt. Kenya, the Aberdares, the Mau escarpment, Cherangani/Tugen Hills and Mt. Elgon and other smaller water catchment areas. The diverse water towers contain about 164 sub-basins with perennial rivers, of which 33 have ephemeral flows, while 90 sub-basins suffer from surface water deficits2. About 54% of Kenya’s water is in transboundary basins, shared with other countries. Other significant catchments include sandy reserves at the Kenyan Coast such as Shella Dunes of Lamu and oases in arid areas such as Loiyangalani in Marsabit. There are also reservoirs created from dams and ponds, spread across the landscape. Kenya boasts about 880 km of coastal shoreline with an Exclusive Economic Zone of 200 nautical miles. Soils: Kenya has a wide range of soils emanating from the variations in geology (parent material), relief and climate. Generally, the country has 25 major soil types but in terms of geographic coverage, about 15 soil types dominate, which include; Nitisols, Regosols, Cambisols, Luvisols, Solonetz, Ferralsols, Acrisols, Alisols, Fluvisols, Andosols, Arenosols, Calcisols, Lixisols, Planosols and Vertisols3.The distribution of soil types varies from coral types on the coast to alluvial, swampy, and black cotton soils along river valleys and plains. The Kenyan highlands have fertile volcanic soils whereas the ASAL zones have basement soils which face many challenges. These include limitations such as poor fertility, propensity for salinity/sodicity, high erodibility and drainage problems. About 59 per cent of Kenya’s soils have moderate to high fertility, meaning they are theoretically suitable for growing crops, but rainfall is usually the main limitation to making productive use of these soils. Minerals: Kenya has appreciable amounts of mineral resources, some of which are already being exploited by private companies, while others are yet to be prospected and mined. The minerals found in Kenya include inter alia; soda ash, fluorspar, diatomite, carbon dioxide, gold, iron ore, lead, vermiculite, kyanite, manganese, titanium, silica sands, gypsum, limestone and salt. There are also small quantities of gemstones and a wide range of colored and ornamental stones mined in the country. These include mainly in order of importance, ruby, tsavorite, sapphire, corundum various types of garnets, tourmaline, aquamarine, zoisite and rhodolite. Rare earths and petroleum have recently been discovered in Kenya, but are yet to be mined. Beaches and Dunes: Sandy beaches are found on Kenya’s coast providing recreation facilities and supporting a thriving tourism sector. They also provide habitats for species such as sea turtles, shorebirds and other marine life. Sand dunes are notably found along parts of the coastline dominated by land-based sources of sediment and without fringing reefs, near the Tana and Athi-Galana-Sabaki Rivers and northwards towards Lamu. Some of these areas have high dunes generated by wind-blown sand from the beach. Sand dunes support a surprisingly rich diversity of flora and fauna.
2 FAO (2005) Country Profile and Factsheet for Kenya. Food and Agriculture Organization of the United Nations 3 Sombroek, W.G., Braun, H.M.H. and van der Pouw, B.J.A. (1982). Exploratory Soil Map and Agro-Climatic Zone Map of
Kenya. Report No. E1. Kenya Soil Survey Ministry of Agriculture - National Agricultural Laboratories, Nairobi, Kenya
3
Biodiversity: Kenya is endowed with unique natural ecosystems that constitute biodiversity assets in the terrestrial, aquatic and aerial environments. These comprise over 35,000 species of flora and fauna4. The species diversity comprise; 7,000 plants, 25,000 invertebrates (of which 21,575 are insects), 1,133 birds, 315 mammals, 191 reptiles, 180 freshwater fish, 692 marine and brackish fish, 88 amphibians and about 2,000 species of fungi and bacteria. This diversity is as a result of the variable ecosystems ranging from marine, mountains, tropical, dry lands, forests and arid lands. In addition, there are some 467 inland lake and wetland habitats covering about 2.5% of the total area. Kenya’s rich biodiversity can be attributed to a number of factors, including a long evolutionary history, variable climatic conditions, diverse habitat types and ecosystems.
1.2 The Economy The economy of Kenya is largely dependent on agriculture and tourism. The per capita Gross Domestic Product (GDP) of Kenya in 20155 was Kshs.140,961 (equivalent to US$1,410). Indeed Kenya has transformed from a developing country to a Lower Middle Income Country, as declared by the World Bank6, when in 2015, the country’s per capita GDP exceeded the US$1,000 mark. However, poverty prevalence is estimated at 42%, and thus, the economy needs to perform better, to create more jobs, bridge the poverty gap and reduce inequality. According to the Kenya National Bureau of Statistics (2016), the country has an average GDP growth rate averaging 5.6%. The target growth rate of 10% envisioned in Vision 2030 could achieve the needed growth rate as the economy becomes mature. About 75% of Kenya’s population earns its living from agriculture which in turn depends on rainfall. Sustainable agriculture, water, infrastructure, trade and human resources capacity development form key drivers of the needed economic growth.
1.3 Population According to the Economic Survey (2016), Kenya has a population of 44.2 million; with growth rates averaging 3% annually7.A majority of the Kenyan population (67%), lives in rural areas but rural–urban migration has steadily increased the trend. Overall, Kenya’s population is projected to reach 67.84 million by the year 2030, by which time some 63% of the people will be living in urban areas. This has great implications for agriculture, water resources, food security, land resources exploitation and the environment. As population increases, the need to grow more food has largely resulted in expansion of cultivated areas onto more marginal lands and water catchment areas.
4NEMA (2009). National Environment Research Agenda for 2008-2030. National Environment Management Authority
(NEMA) and Government of Kenya. Nairobi. 5Economic Survey, 2016. Kenya National Bureau of Statistics. Republic of Kenya 6 worldbank.org/indicator/NY.GNP.PCAP.CD?order=wbapi_data_value_2014+wbapi_data_value+wbapi_data_value-
last&sort=desc 7Population and Housing Census 2009.Government of Kenya, Ministry of Planning and Vision 2030

4
This has seen increased pressure on land and water resources, and inevitably, land degradation has ensued.
1.4 Gender and Youth Gender dimensions: Traditional norms have in the past and continue at present to disadvantage both women and youth in Kenya, in terms of access to resources and decision making. For instance, only 29% of those earning a formal wage throughout the country are women, leaving a huge percentage of women to work in the informal sector. Furthermore, 54% of agricultural workers are women providing the bulk of the labour force in agriculture8. Yet few women own assets such as land. As a result, poverty in Kenya has a gender and age dimension. Meanwhile, Kenya has ratified various international9 and regional protocols10 on gender equality and women empowerment. Nationally, both the National Gender and Equality Commission Act enacted in 2011and the Constitution (2010) promote gender equality and women empowerment. Gender balance in leadership, governance and decision-making was pegged at a minimum of 30% by the constitution. This has helped increase women’s presence in leadership from 20.5% in 2008 to 38.6% in 2012 due to the affirmative action measures. Inclusion of gender mainstreaming in the performance contracting process helped strengthen accountability on gender equality in public service. Youth: The youth comprise 36% of the national population but alarmingly 61% of them remain unemployed11. Despite their numerical weight, the youth are not well represented in the national and local political and socio-economic development processes.Poor access to resources; disaffection with rural life, the drudgery of agricultural production and poor incomes limits youth livelihood options. Yet it is the youth who are most energetic, better educated and more technologically savvy. Thus, their exclusion represents untapped potential for increasing productivity of enterprises, especially agriculture and natural resources management.
1.5 Poverty prevalence Poverty is a major problem in Kenya, albeit incidences of poverty have been dropping, from 52.2% in 1997 to 46% in 201312.The country ranks 147/186 in the Human Development Index13. Within the high rainfall areas of Kenya, the land units are small, averaging less than two hectares per household. However, the favorable climatic conditions in these areas means highly intensive agriculture is possible, while the relatively good infrastructure provides better access to urban markets. Paradoxically,
8Kenya Labour market profile, 2014. Danish Trade Union Council for International Development Cooperation 9Convention on the Elimination of All Forms of Discrimination against Women. UN General Assembly, 1981 10Protocol to the African Charter on Human and Peoples' Rights on the Rights of Women in Africa. African Union, 1995. 11 Second Medium Term Plan (2013-2017). The Presidency and Ministry of Devolution and Planning 12Kenya Population situation analysis. UNFPA, 2013 (http://countryoffice.unfpa.org/kenya/drive/FINALPSAREPORT.pdf) 13 Human Development Index (HDI), 2015. dr.undp.org/sites/default/files/2015_human_development_report.pdf

5
the high rainfall areas host large numbers of poor people, with poverty prevalence14 estimated at about 35.4%. Meanwhile, the highest poverty in Kenya is in the ASALs, where over 60% of the population live below the poverty line15. Land degradation and poverty are inherently interlinked, as the poor tend to exploit land resources with inadequate inputs and conservation measures.
1.6 Land Degradation Land degradation is a slow onset disaster which has long-term negative implications on agriculture, ecosystems and human livelihoods, as well as the economy of the country. Land degradation has been defined16, as “the reduction in the capacity of the land to provide ecosystem goods and services and assure its functions over a period of time for its beneficiaries”. Thus, land degradation is the loss of utility or potential utility of land, through deterioration and/or damage to the physical, social, economic features and ecosystem diversity. A recent LADA study17 has shown that almost all the counties in Kenya are at risk from one form of land degradation or other. About 61% the total area of Kenya has high risk of land degradation, while very high degradation affects 27% of the land. It is estimated that over US$390 million (KSh.3.9 billion) is lost annually from the national economy due to land degradation, affecting over 11 million people18. These are the direct and indirect economic and social costs suffered in the affected areas, including, loss of agricultural productivity, loss of biodiversity and ecosystems, which portends negative effects on the environment, food security, incomes and national economy.
The LADA study also found that Kenya is prone to all eight types of land degradation, namely:
(i) Soil degradation- Decline in the productive capacity of soil resources due to adverse changes in their biological, chemical, physical and hydrological properties
(ii) Soil erosion, compaction, loss of fertility, changes in soil pH or soil structure. (iii) Water degradation - Decline in the quantity and quality of both surface
groundwater resources, including; aridification, drying up of water sources, salinity build up and water pollution.
(iv) Vegetation degradation: Decline in the quantity and quality of vegetation including; trees, grasses, shrubs and woody biomass (e.g. through deforestation, overgrazing, fires, cultivation, charcoal burning).
14 Agricultural Growth and Poverty Reduction in Kenya. ReSakss, 2012. 15 National Policy for the Sustainable Development of Northern Kenya and other Arid Lands. Sessional Paper No. 8 of 2012 16 FAO 2011. Manual for Local Level Assessment of Land Degradation and Sustainable Land Management. Food and
Agriculture Organization of the United Nations. Rome. 17 MENR (2016). Land Degradation Assessment in Kenya: Based on a Study of Land Degradation Assessment (LADA) with
Remote Sensing and GIS, for Sustainable Land Management (SLM) in Kenya. Republic of Kenya, Ministry of Environment and Natural Resources (MENR), Nairobi.
18 GoK 2013. National Land Reclamation Policy (Final Draft). Ministry of Water and Irrigation. Republic of Kenya

6
(v) Biodiversity degradation: Decline in the natural genetic resources, loss of species, and ecosystems(including loss of crop plant genetic resources), lowering of habitat quality and reduction in habitats for associated species – both floral and faunal (terrestrial and aquatic).
(vi) Chemical degradation– Negative changes in chemical properties of soil, water and ecosystems including; pollution of land and/or water, the environment, soil fertility decline, salinity build-up and/or alkalinization,
(vii) Physical Degradation - Loss of natural or aesthetic physical conditions of the land e.g. from quarrying, mining, scarification and unplanned developments.
(viii) Climate deterioration– Adverse changes in the micro and/or macro climatic conditions that increase vulnerability of crops, livestock, wildlife, biodiversity, ecosystems and human livelihoods.
(ix) Land conversion - Decline in the total area of land used, or with potential to be used for crop, livestock and/or forestry e.g. through urbanization, unplanned settlements, cultivation or mining.
1.7 Sustainable Land Management (SLM) Sustainable Land Management (SLM) is defined19 as: “the adoption of land use systems that, through appropriate management practices, enables land users to maximize the economic and social benefits from the land while maintaining or enhancing the ecological support functions of the land resources”. SLM has also been described20 as “the use of land resources, including soils, water, animals and plants, for the production of goods to meet changing human needs, while simultaneously ensuring the long-term productive potential of these resources and maintenance of their environmental functions”. Thus, SLM includes ecological, economic and socio-cultural dimensions, known as the “3 Es” of sustainable development –Ecology, Equality/social dimensions and Economy21.
Ecologically - SLM technologies in all their diversity effectively combat land degradation. But a majority of agricultural land is still not sufficiently protected, and SLM needs to spread further.
Socially - SLM helps secure sustainable livelihoods by maintaining or increasing soil productivity, thus improving food security and reducing poverty, both at household and national levels.
Economically - SLM pays back investments made by land users, communities or governments. Agricultural production is safeguarded and enhanced for farmers and other land users, while there are immeasurable offsite benefits from SLM.
Generally, SLM is the sum of activities which balance the often conflicting ideals of economic growth and maintaining environmental quality and viability.
19 TerrAfrica, 2011. Sustainable Land Management in Practice – Guidelines and Best Practices for Sub-Saharan Africa.
TerrAfrica, World Overview of Conservation Approaches and Technologies (WOCAT) and Food and Agriculture Organization of the United Nations (FAO).
20 FAO, 2007. TerrAfrica – A Vision paper for Sustainable Land Management in Sub-Saharan Africa. Food and Agriculture Organization of the United Nations, Rome, Italy
21 UNESCO, 2006. Curriculum rationale. Understanding Sustainable Development. http://www.unesco.org/education/tlsf/TLSF/theme_a/mod02/uncom02t02.htm

7
1.8 SLM Interventions Relevant to Kenya Kenya’s Vision 2030proposes the sustainable management of natural resources. Sustainability implies maintaining components of the natural environment over time (such as biologic diversity, water quality, preventing soil degradation), while simultaneously maintaining (or improving) human welfare (provision of food, housing, sanitation and infrastructure). The basic SLM interventions may range from intensive agriculture and management of natural ecosystems, to policy and institutional reforms. There is a wide selection of SLM interventions to suit specific land degradation problems, geographical zones, land use systems and agricultural enterprises. At the national levels, the SLM activities and interventions in Kenya can be divided into ten broad groups:
(i) Catchment protection, afforestation, agroforestry, re-greening riparian lands (ii) Preserving and enhancing the productive capabilities of agricultural lands
(croplands, grazing lands) (iii) Soil and water conservation (structures for erosion control, soil fertility
management, agronomic measures) (iv) Rainwater harvesting (supplemental irrigation, drinking water, livestock) (v) Rangeland rehabilitation (improving grazing conditions, re-vegetation, control) (vi) Biodiversity conservation (protected areas, ecosystem conservation, green
zones) (vii) Sustainable exploitation of groundwater aquifers (viii) Flood control and management, (ix) Pollution prevention and control (waste management) (x) Alternative energy (reduce use of biomass-based fuels), alternative livelihoods.
These broad classes can be further expounded into hundreds of individual technologies and practices22. However, these are simplified here as shown in Table 1: Table 1: SLM solutions for various types of land degradation in Kenya Type of Land degradation SLM solutions
Water-induced soil erosion
• Mechanical methods: Soil and water conservation structures; terraces, cutoff drains, artificial waterways, gully control structures
• Agronomic methods: Mulching; crop management (cover crops, intercropping, relay inter-cropping); early planting, crop rotations
• Soil management methods: Minimum tillage; deep tillage, tied ridging Wind-induced soil erosion
• Windbreak and dune stabilization using trees and other vegetation • Cover crops in humid or semi-humid zones, stubble mulch tillage • Supplemental irrigation • Rotational grazing and other practices that improve land cover or
prevent overgrazing
22Mati, B.M. (2007). 100 Ways to Manage Water for Smallholder Agriculture in Eastern and Southern Africa. A
Compendium of Technologies and Practices. SWMnet Working Paper 13. Nairobi, Kenya. https://sriwestafrica.files.wordpress.com/2014/05/1179993482swmnet-working-paper-13-100-ways-of-awm-in-esa.pdf

8
Salinity • Careful selection of land for irrigation • Improved drainage, lowering of high water tables • Amelioration using intermittent or continuous leaching • Cultivation of salinity-resistant crops and crop varieties • Using halophyte crops, trees, and pasture
Compaction/ soil sealing and crusting
• Soil management methods: Periodic deep tillage, controlled farm equipment or livestock traffic, stubble-mulch tillage
• Agronomic methods: conservation agriculture, intercropping, manuring, rotational cropping, incorporating shallow and deep-rooted crops
Loss of biodiversity • Zoning land as protected areas, forest reserves, national parks • Prevention of land use conversions that lead to loss of biodiversity • Afforestation and reforestation programs • Enhancing agro-biodiversity in cropping and livestock systems
Soil fertility mining • Integrated soil fertility management (ISFM), fertilizers, manures, composting, green manures, growing nitrogen fixing crops
Soil pollution
• Reduced use of agrochemicals Proper use of agrochemicals • Integrated pest management (IPM) • Better planning of urban and peri-urban settlements • Solid waste management, solid waste recycling • Safe disposal of waste water, proper storm water drains
Rangeland degradation
• Rotational grazing, controlled grazing • Planting of more productive fodder, grass reseeding • Reduction of herd size (improved livestock breeds) • Water harvesting micro-basins, infiltration strips in rangelands
Water degradation
• Catchment conservation; tree planting, protection forests by law • Re-vegetation of riparian lands • Water harvesting and storage • Soil and water conservation in catchment areas • Control of pollution from urban, peri-urban and agricultural lands
Climate change
• Water harvesting and storage • Development of irrigation infrastructure • Drought-resistant crop varieties • Tree planting and other carbon-sequestering practices
SLM is Demanded by National Policies The Government of Kenya recognizes the damaging impacts of land degradation on natural resources, livelihoods and the economy. This is addressed in the Constitution23, the Vision 203024, and the national land policy25, which highlight the need to institute measures to rehabilitate degraded lands and implement various components of SLM. However, SLM is not adequately addressed in a dedicated document, but the tenets are embedded in a number of policy, legal and institutional frameworks across sectors such
23GoK, 2010. The Constitution of Kenya. The Government of the Republic of Kenya 24GoK, 2007. Kenya Vision 2030. Government of the Republic of Kenya, Ministry of Planning and National Development and
Office of the President 25Government of Kenya (GoK), 2009. Sessional Paper No. 3 of 2009 on the National Land Policy August 2009.

9
as agriculture, water, environment, infrastructure development and sometimes, public health. To correct this disconnect, there is need for a programmatic approach that reflects a Country Strategic Investment Framework (CSIF) on SLM for Kenya. SLM and Devolution: Kenya is divided into 47 Counties as per the Constitution (2010), in a devolved system of Government, which became operational in March 2013. Devolution has seen the National Government transfer certain powers, functions and responsibilities to the 47 counties. The devolved government system recognizes the right of communities to take charge of their own affairs and development26. Some of the functions devolved to counties that are relevant to SLM include; agriculture, environment and natural resources (including forestry), lands, housing, urban development, health and social services. Generally, most SLM activities are implemented through the agriculture sector which is largely devolved, but in reality, SLM carries mandates that cut cross several sectors in the two levels of Government. Thus, devolution requires that SLM issues be factored in County Integrated Development Plans (CIDPs), which should be in line with Vision 2030 and national Government plans and strategies. Thus, devolution has wide-ranging implications for SLM, affecting land use, its management and decisions at county level. SLM is Necessary for Fulfilling Kenya’s Commitments to International MEAs
Kenya has ratified several multilateral environmental agreements (MEAs) and international treaties, committing actions on natural resources management, biodiversity, ecosystems, the environment and climate change. Some notable MEAs include; the United Nations Convention to Combat Desertification (UNCCD) of 1997, Convention on Biological Diversity (CBD) of 1994, the World Heritage Convention, the Convention on the Conservation of Migratory Species of Wild Animals (Bonn Convention) of 1979, the Ramsar Convention on Wetlands (1992), the Stockholm Convention on Persistent Organic Pollutants (POPs) 2004and the Sustainable Development Goals (SDGs) adopted in 2015. At the regional level, legal instruments and initiatives include: the African Convention on the Conservation of Nature and Natural Resources, the New Partnership for Africa’s Development (NEPAD), African Ministerial Conference on the Environment (AMCEN), and the Protocol on Protected Areas and Wild Fauna and Flora in Eastern Africa and the Convention for the Establishment of the Lake Victoria Fisheries Organization 1996. Another important regional development was Kenya becoming a signatory, along with Uganda, Tanzania, Ethiopia and Rwanda, to the Nile River Basin Cooperative Framework. Besides providing for more equitable use of the waters of the Nile, the parties committed to collectively work towards conserving the Nile riparian lands and implicitly, the vast biodiversity wealth of the Nile basin.
26Devolution in Kenya: Opportunities and Challenges for the Water Sector. Water and Sanitation Program: Policy Note,
September 2013

10
2 SECTOR ISSUES
2.1 Agriculture Agriculture is the mainstay of Kenya’s economy, contributing 30% of the GDP27. The sector accounts for 65% of Kenya’s total exports, 75% of industrial raw materials, 60% of export earnings, as well as 18% and 60% of the formal and total employment respectively28. The sector comprises five subsectors: –industrial crops, food crops, horticulture, livestock and fisheries, and farmer institutions (e.g. co-operatives). Crop production accounts for 82% of agricultural GDP and 94% of export earnings from agriculture. The livestock, fisheries and forestry subsectors account for 18% of agricultural GDP and 8% of export earnings from agriculture, both of which have significant potential which has not been fully exploited. Cultivated areas in Kenya occupy about 5 million hectares of land, dominated by rainfed agricultural systems. Some 4.3 million ha are used to grow food crops, 0.56 million ha are under horticultural crops, 0.48 million ha of industrial crops and 0.10 million ha of oil crops. The major food cereals grown in Kenya include maize, wheat and rice. Maize is the main staple food crop for about 90% of the population in Kenya29 and is also a key component of feedstuff for livestock. Generally, maize is grown rainfed on a cropping area of about 2.13 million ha (almost 50% of total cropping area), with annual production of about 3.5 million tons30. Other food crops include beans, roots and tubers (cassava, potatoes), millets and sorghums. Industrial crops include sugar, pyrethrum, cotton, tobacco, and sisal, while major export crops include tea, coffee and horticulture. Generally, agriculture in Kenya has come under pressure due to population increase and extreme weather changes. Population pressure and the relative scarcity of productive agricultural land has resulted in sub-division of land into small uneconomic units. The problem of reducing available land is expected to escalate, from a mean of about 1.5 ha per capita currently, to a predicted 0.3 ha by 205031. In order to produce more from smaller land areas, SLM interventions are therefore urgent. Small-scale farming sub-sector: Kenya’s agriculture32 is predominantly small-scale farming where production is carried out on farms averaging 0.2–3 ha per household. Small-scale farms account for 75% of the total agricultural output and 70% of marketed agricultural produce. The smallholder farmers produce over 70% of maize, 65% of coffee, 50% of tea, 80% of milk, 85% of fish, 70% of beef and related products. In contrast, the medium and large scale farms account for about 2% of the holdings,
27 Kenya National Bureau of Statistics. Statistical Abstract, 2016 28 Republic of Kenya, 2013. Second Medium Term Plan (2013-2017). 29 National Food and Nutrition Security Policy, 2011. Government of Kenya. 30 Ministry of Agriculture, Economic Review of Agriculture 2012, MOA 31 GoK (Government of Kenya). (2007). Kenya Vision 2030. Nairobi. Nairobi: Government Printers. Available at:
http://www.vision2030.go.ke/cms/vds/Popular_Version.pdf 32 Government of Kenya, 2010. Agricultural Sector Development Strategy (2010–2020)

11
but cover about 54% of the area farmed. Typically, a small-scale farm contains a mix of crop and livestock enterprises, including food crops such as maize, beans and fruits plus a cash crop such as coffee or vegetables as well as trees. However, use of improved means of production such as hybrid seed, fertilizers, concentrate livestock feeds, and proper machinery and tools are relatively low. There is huge potential for increasing the productivity smallholder agriculture through optimization of natural capital and adoption of appropriate technologies, especially SLM. Rainfed Agriculture: Rainfed agriculture takes up 96% of all cultivated area in Kenya, yet only 13% of the total land area in the country receives adequate rainfall (at least 1,000 mm per year). In essence a lot of the rainfed agriculture occurs in areas with inadequate rainfall including in the ASALs. It is part of the reason agriculture in Kenya is highly vulnerable to weather variability and erratic rains, causing fluctuations in agricultural production and incomes. This has cascade effects on food security and rural poverty. Despite this, rainfed agriculture supports the bulk of the food crops grown in Kenya (maize, wheat, beans) as well as traditional food crops (pulses, roots and tubers, millet, sorghum), industrial crops (coffee, tea, sugar, cotton) and livestock production including milk, meat and eggs. Paradoxically for rain-fed agriculture, there is sufficient rainfall in the highlands but limited land, while there is more land but low rainfall in the ASALs.Moreover, rainfed agriculture occurs on steep slopes and on fragile soils, and is a major cause of soil erosion. Therefore, SLM interventions have greatest impact if targeted at smallholder agriculture. Irrigated agriculture: Kenya’s irrigated area stood at 161,840 Ha in 2013 against a potential of 1,341,900 Ha. This accounts for about 11% of the total irrigation potential33.This potential is based on water commanded from direct surface flows only, otherwise irrigation potential is much higher if groundwater and water harvesting/storage infrastructure were developed. Irrigated agriculture contributes about 3% of the GDP and 18% of the value of all agricultural produce. The main crops grown under irrigated agriculture in Kenya include: paddy rice, which accounts for 22% of the irrigated area, while food and horticultural crops account for 25% and 53% respectively. The Kenya Vision 2030 has set a national goal of increasing the new irrigation area to 1.2 million ha by 2030, so as to attain high agricultural productivity in the country. Expansion of irrigation: Massive expansion of irrigation schemes has recently been implemented in Kenya and others are planned for future development. The Expanded Irrigation Programme (EIP) implemented by the National Irrigation Board (NIB)34 targets to accelerate irrigation coverage in Kenya, thereby turning Kenya into a net exporter of food and improving livelihood households. This includes the extensive Galana-Kulalu irrigation scheme which alone covers 1 million acres (400,000 ha). To facilitate this, a total of 121 irrigation projects have been established nation-wide
33Republic of Kenya 2015. Draft National Irrigation Policy. Ministry of Agriculture, Livestock and Fisheries.
34 Status Report of Expanded Irrigation Programme, National Irrigation Board, 2013
12
targeting to increase area under irrigation including expansion of already existing irrigation schemes such as Mwea, Hola, and Lower Nzoia schemes. Expansion of irrigation, while good for the country’s food security and export earnings, carries with it threats of land degradation (drying up of downstream water sources, salinity build up) that must be factored within the country SLM agenda. Livestock sector: The livestock sector provides an important source of livelihoods especially for rural people in Kenya. Animal products make up 43% of the agricultural gross domestic product, but three-quarters of this amount is from milk production. Although Kenya is the largest milk producer in East Africa, roughly only one-third of production is recorded in trade statistics. Smallholder farmers produce 80% of the milk, helping to meet the national demand for milk and with surplus exported mainly to Uganda, Tanzania and Rwanda35. By the end of the 1990s, milk production had dropped by 70% prompting the liberalization of the dairy sector. Since then, there has been a resurgence of milk production especially under smallholder mixed farms. In the rangelands, livestock production systems feature mainly pastoralists. Livestock herd sizes are considerably large managed under communal grazing with low use of purchased inputs like feeds, drugs and artificial insemination. Disease and malnutrition are major constraints to facing livestock productivity in these systems. Beef is another leading meat product, some 80% of which comes from pastoralists, either directly in Kenya or in neighbouring countries. Unlike Ethiopia, Sudan or Somalia, Kenya is not entirely self-sufficient in the production of meat, and estimates indicate that approximately one-fifth of meat comes from neighbouring states (as most trade is informal, official statistics are missing). In addition to cattle, goats, sheep and camels are also raised in Kenya36. Fisheries: Fish production in Kenya is gaining importance as an alternative source of healthy protein and for income generation. Kenya has important marine and inland fisheries potential but the bulk of fish landings come from Lake Victoria. Kenyan marine fisheries include a coastal fisheries sector, largely artisanal in nature focusing on reef fisheries with gill nets and lines. A small fleet of shrimp trawlers also share these inshore grounds with artisanal net and line fishers. Although most parts of the country are suitable for aquaculture, only about 0.014% of the 1.4 million ha of potential aquaculture sites are used for fish farming, of which 95% is small-scale37. The national aquaculture production is estimated at 12,000 tons/yr equivalent to 7% of the total fish production and was valued at $21 million38 in 2011. There is a huge un-exploited potential for aquaculture development in Kenya.
35 ILRI, Milk markets as ‘the great equalizer’ in East Africa? http://www.ilri.org/ilrinews/index.php/archives/tag/smallholder-
dairy-project 36 IGAD. The Contribution of Livestock to the Kenyan Economy. 2011. 37 Otieno MJ. 2011. Fishery Value Chain Analysis: Background Report – Kenya. FAO, Rome, IT, pp. 2-10 38 Nyonje, B.M, Charo-Karisa H, Macharia S.K. and Mbugua M. 2011. Aquaculture Development in Kenya: Status, Potential
and Challenges. In Sakami News: Aquaculture Development in Kenya towards Food Security, Poverty Alleviation and Wealth Creation. Vol. 7. No. 1. pp.8-11
13
Fisheries are relevant to SLM as they affect biodiversity within water resources. The introduction and dispersal of alien species in wetlands and other freshwater ecosystems have threatened the biodiversity and ecosystem services. For instance, Lake Victoria originally had a high diversity of fish species which included more than 300 cichlid species, 99 percent of which were endemic. However, the introduction of Nile Perch, a carnivorous fish species in the 1950s, while it increased commercial fish production by nearly ten-fold, but the lake’s biodiversity was severely destroyed because the Nile perch preys on the smaller native species39.. Over-fishing in other lakes e.g. Lake Turkana, Lake Baringo and off-shore in the Indian Ocean have decimated fish stocks, further impoverishing the aquatic biological resources of the country. Food and Nutrition Security: Food and nutrition security has been defined40 as a situation “where all people, at all times, have physical and economic access to sufficient, safe and nutritious food to meet their dietary needs and food preferences for an active and healthy life”. In Kenya, over 10 million people suffer from chronic food insecurity and poor nutrition, while some 7.5 million people live in extreme poverty41. Meanwhile, nearly 30% of Kenya’s children are classified as undernourished. The national per capita energy supply per day is less than the recommended rates42of 2,250 Kcal/day for an active African adult. Thus, for many people, the basic diet is inadequate in terms of diversity and nutrition. SLM is about improving productivity sustainably, thus facilitating the attainment of the country’s food and nutrition security.
2.2 Land Land: Land represents one of Kenya’s most important natural resources and upon which the livelihoods of a majority of the population are critically dependent. Kenya’s Land Policy43 describes land as having multiple values which include: (a) Land is an economic resource that should be managed productively; (b) Land is a significant resource to which members of society should have equitable access for livelihood; (c) Land is a finite resource that should be utilized sustainably; and (d) Land is a cultural heritage which should be conserved for future generations. Kenya’s Vision 2030 describes land as a critical resource for socio-economic and political development of the country. Approximately 42% of Kenya’s GDP and 70% of employment is derived from natural resource-based sectors, including agriculture, water, energy, forestry and tourism.
39 EAC (2008).Studies on Rapid Assessment of the Ecological and the Dynamics Status of Water Hyacinth Eichchornia
Crassipes (Mart.) Solms-laubach in the Nyanza Gulf of Lake Victoria, Kenya. East African Community (EAC), Arusha. 40 World Food Summit, Rome Declaration on World Food Security, 1996. Available at:
http://www.fao.org/docrep/003/w3613e/w3613e00.HTM 41 National Food and Nutrition Security Policy, 2011. Government of Kenya. 42 Central Bureau of Statistics, Kenya Demographic and Health Survey (1998, 2003, 2008/9). 43 Republic of Kenya, 2009. Sessional Paper No. 3 of 2009 on National Land Policy. Ministry of Lands.
14
Land is an emotive resource in Kenya, faced with numerous challenges. These include impacts of population pressure and human activities such as agriculture, urbanization and poorly planned settlements. Moreover, there is a multiplicity of legal regimes related to land causing tenure insecurity and a general deterioration in land productivity across both cultivated and pastoral grazing areas. Also, there are many conflicts over land and land-based resources. Also, poor land management has led to the deterioration of land quality, including; destruction of water catchment areas, pollution and loss of unique biodiversity. Land tenure: According to the Constitution of Kenya (2010), land in Kenya is classified as public, community or private. Public land includes protected mountains, hills, forests, national parks, rivers, lakes and other water bodies, territorial sea and the continental shelf; all roads, land on which public utilities stand e.g. offices, schools, hospitals, and all lands held by County Governments. Community lands, on the other hand, consists of land lawfully registered in the name of group representatives e.g. Cooperatives, ancestral lands, religious lands, or any other land declared to be community land by an Act of Parliament. Private land consists of registered land held by any person under any freehold tenure or leasehold tenure. The land tenure system in Kenya has been facilitative of competitive private enterprise and general development. It is also a source of numerous conflicts across ethnic, economic and individual levels. Private land acquisitions are at the centre of reduction of protected public lands, with consequent impacts of water resources, biodiversity, ecosystems and land degradation. Arid and semi-arid lands (ASALS): ASALs are the drylands straddling agro-climatic zones IV to VII of Kenya, and are characterized by low, erratic rainfall and relatively hot climates. Covering 84% of the land area of Kenya, the ASALs contain scanty water resources, are prone to drought and have poorly developed infrastructure. The ASALs are home to about 12 million people, over 70% of the livestock and 75% of the wildlife in the country44. However, over 60% of ASAL inhabitants live below the poverty line, and in some counties such as Turkana, Marsabit, Wajir and Mandera, about 74% - 97% of people live below the poverty line45. ASAL communities remain the most chronically food insecure groups in the country experiencing consistently high malnutrition rates. Yet, there are 24 million hectares of land in the ASAL that can be used for livestock production, but only 50 per cent of the carrying capacity of the land is exploited. Additionally, there are 9.2 million hectares in ASALs which have the potential for crop production if irrigated46, but water is the main limitation. It means that there is a lot of potential in the ASALs which could be exploited for food security and economic development.
44 GoK, 2008. Review and analysis of existing drought risk reduction policies and programmes in Kenya. National Report on
Drought Risk Reduction Policies and Programmes. Ministry of State for Special Programmes. Republic of Kenya. 45 National Policy for the Sustainable Development of Northern Kenya and other Arid Lands. Sessional Paper No. 8 of 2012 46 Pastoralist Thematic Group (PTG), 2001. Pastoral Poverty Reduction Strategy

15
ASALs face many challenges associated with factors such as drought, a rapidly growing population, immigration and expansion of agriculture into these marginal areas. The result is shrinking space for migratory pastoralism, overgrazing of the fragile ecosystems and when combined with erratic rainfall, this escalates land degradation. ASAL zones also suffer cattle rustling and general insecurity, contributing to a large number of internal refugees in Kenya, majority being environmental refugees who are dislocated from their rural livelihoods due to drought47. Even when relatively good rains are received, recovery in the ASALs is usually slow as the droughts severely erode the productive assets of pastoralists and agro-pastoralists. Generally, many pastoralists having lost their herds due to drought or cattle rustling, resort to settling in urban and peri-urban areas, often facing unemployment. Others migrate to new areas, triggering ethnic tensions. The greatest opportunity for creating SLM impacts on poverty, livelihoods and environments, is inherently in the ASALs. Protected Areas: Kenya has over 12% of its land designated as protected areas, which include forests, national parks, national reserves, conservancies, Ramsar sites, biosphere reserves and world heritage sites. Some 47,959 sq. km (8%) of Kenya’s land mass is reserved for wildlife conservation48 managed in-situ by the Kenya Wildlife Service or Kenya Forest Service or conjointly with communities. Protected areas in Kenya are categorized either as parks or reserves. Marine reserves are spaces either in the sea or inland water bodies. The distinction between the two categories is that; in parks, there is complete protection of natural resources and the only activities allowed are tourism and research. On the other hand in reserves, human activities are allowed. There are also conservancies in private ranches in marginal areas such as Samburu, Laikipia and in Kajiado, licensed to ranch wildlife. But most of the wildlife in Kenya and the overall biodiversity is found outside the designated protected areas. Wetlands: The exact extent of Kenya’s wetlands is unknown owing to the lack of a wetlands inventory, but estimates indicate that wetlands occupy around 3 - 4 percent of Kenya’s land mass, which temporarily increases to 6 percent during the rainy seasons49. Wetlands50 play a fundamental role by maintaining hydrological stability through regulating stream flows, improving water quality by sediment filtration absorbing heavy metals and other toxic pollutants as well as reducing the risk of flooding downstream. They also help to recharge groundwater aquifers thereby making groundwater easily available and augmenting stream flows, functions which are now threatened as wetlands dry up or are polluted. Wetland degradation brings an added
47 GoK, 2011. Livestock Sub-Sector Stakeholders’ Conference for North Eastern Kenya. Proceedings of a Conference, 12th-
14th January 2011 Garissa, Kenya. 48 KWS and TWRI (2010). Aerial Total Count Amboseli – West Kilimanjaro and Magadi-Natron Cross Border Landscape. Wet
Season, March 2010. Kenya Wildlife Service (KWS) and Tanzania Wildlife Research Institute. (TWRI), Nairobi. 49 Kenya Wetlands Forum (2012). Why conserve wetlands?
http://kenyawetlandsforum.org/index.php?option=com_content&view=article&id=1:welcome-to-kenya-wetlands-forum 50 NEMA (2009). Environmental Management and Coordination Act (EMCA).

16
dimension of land degradation in Kenya, pushed by expansion of agriculture and unsustainable exploitation of wetland resources. These activities, combined with degradation of catchment areas, causes drying up of springs and reduced dry season stream flows to the extent that formerly perennial rivers have turned ephemeral or dried up. Wetland rehabilitation and management is an important component of SLM.
2.3 Water Sector Freshwater resources: The estimated renewable water resources in Kenya amount to 76,610 million m3/year of which 20,638 million m3/year is surface water and 55,973 million m3/year is groundwater51. However, water resources in Kenya face growing demand from increasing numbers of water users and uses, urbanization and industrialization. Thus Kenya has been described as a water-scarce country52, with rapidly dropping fresh water availability. In 1992, the per capita water availability was about 647 m3/inhabitant, but this had dropped to449.5 m3per capita by 2014 and is projected to decline to 235 m3 by 202553, meaning the country will be severely water stressed. Meanwhile, the demand for water supplies and services continues to grow. The total water demand for domestic, industrial irrigation, livestock, wildlife and inland fisheries will increase from 3,218million m3/year in 2010 to 21,468 million m3/year in 2030 and growing to 23,141 million m3/year in 2050. But the greatest water resource in Kenya, the rainfall, remains largely untapped and thus, under-utilized. Rainwater potential: Although Kenya has poorly distributed rainfall, in absolute terms, the country has adequate rainwater to meet all her water requirements. The total volume of rainfall in Kenya is estimated as 365.6 billion m3/year54, which is really a substantive amount of water. However, mean annual rainfall over the country is estimated to be 680 mm, which varies from about 200 mm in the ASAL zones to over 1,800 mm in the humid zones. The major disconnect is failure to harness the rainfall potential and store it strategically and in substantial amounts. The water storage developed in Kenya is very low; recording a per capita storage is 102 m3/person/year. The Vision 2030 has listed water storage as among the interventions to enable to country attain water security. But harnessing rainfall through various rainwater harvesting interventions55 has the added advantage of reducing surface runoff, floods and thus controlling land degradation, a major factor in attaining SLM. Rivers: Kenya has numerous rivers and watercourses majority of which are ephemeral. Large perennial rivers are few and most rivers originate from the major
51 Republic of Kenya. National Water Master Plan 2030 52 A country is considered water scarce if the total per capita water availability is less than 1,000 m3. It is water stressed if the
values is below 500 m3. 53 www.informaworld.com/smpp/content~db=all~content=a917971133 54 FAO Aquastat 2015. http://www.fao.org/nr/water/aquastat/data/query/results.html 55 Mati, B.M. (2007). 100 Ways to Manage Water for Smallholder Agriculture in Eastern and Southern Africa. A Compendium of
Technologies and Practices. SWMnet Working Paper 13. Nairobi, Kenya. https://sriwestafrica.files.wordpress.com/2014/05/1179993482swmnet-working-paper-13-100-ways-of-awm-in-esa.pdf

17
water towers and highlands areas. The rivers generally flow from Mt. Kenya and Aberdares, eastward towards the Indian Ocean. Rivers from Mau escarpment flow westwards into Lake Victoria include the Nyando, Gucha, Migori, Yala and the Mara. Other rivers originating from the north Rift highlands, such as the Turkwell, flow northwards into Lake Turkana. The two largest perennial rivers in Kenya are the Tana and the Athi/Galana Rivers, both of which drain into the Indian Ocean. They are also the only navigable rivers in the country. A few seasonal rivers originate from southern highlands of Ethiopia extending into Kenya along the mutual boundary, e.g. River Daua, which flows during the rainy season. Lakes: Kenya has a number of inland natural water resources and lakes. The country has nine lakes larger than 40 km2 but only four are freshwater lakes (Naivasha, Olbolosat, Baringo and Victoria). The rest are saline lakes in the Rift Valley, such as Lakes Turkana, Nakuru, Baringo, Bogoria, Elementaita, Magadi, and Jipe. Lakes Nakuru and Elementaita are alkaline, forming perfect breeding grounds for flamingoes. Lake Magadi is has very shallow water, being a solid salt lake during the dry season, and it has the largest deposits of soda ash in the world. The major issues facing Kenyan lakes include: Pollution from agricultural activities e.g. Lake Naivasha, solid waste and waste water pollution, e.g. Lake Victoria, over-fishing e.g. lakes Turkana and Baringo, Victoria, water over-extraction as in Lake Naivasha, as well as transboundary issues e.g. L. Turkana and L. Victoria. Groundwater: Groundwater could form the next frontier in meeting national water demand, as the resource is not fully exploited. It is estimated that Kenya has 55.973 billion m3/year is ground water, but the full potential is still unknown. In general, Kenya’s groundwater availability is extremely variable, both spatially and temporally, quality and quantity. Groundwater recharge varies from less than 5 percent of the annual rainfall in the ASALs where evapotranspiration losses are high, to 30 percent in areas having deep loamy soils, coral limestone and unconsolidated rocks where evapotranspiration losses are low. In humid and semi-humid regions, recharge rates may be higher. The sustainable extraction and use of ground water resources is a major component of SLM, and should be implemented in such a way as to prevent water degradation. Water demand for irrigation: To meet water demands of the expanded irrigation, Kenya plans to develop water resources for irrigation through construction of dams, ponds, weirs, pans, water harvesting, river abstractions and groundwater wells. The total irrigation water demand is estimated at 16,446 MCM/year or an overall average of 13,705 m3/ha, assuming 160% annual cropping intensity and 60% irrigation efficiency56. The annual total irrigation water demand for future projected irrigated area of 765,575 ha in 2030 and is estimated at 8,063 MCM/year, equivalent to a water demand of 94,949 m3/ha/year. Irrigation development and water use have great
56 Republic of Kenya, 2013. National Water Master Plan 2030

18
implications for SLM, contributing to the stabilizing of agricultural production against climatic shocks, but affecting the amounts of water available for environmental flows.
2.4 Biological Resources and Ecosystems Kenya’s rich biodiversity can be classified across six broad ecosystems, namely; forests, wetlands, grasslands, ASAL ecosystems, marine ecosystems and agro-ecosystems. These biomes harbor the country’s key biodiversity habitats and need to be protected. The government of Kenya recognizes that future sustained economic growth requires sound and equitable allocation of resources in management. However, the government plan is yet to be realized as most natural ecosystems, especially wetlands and forests, continue to be destroyed. The key sector issues include: Forests and woodlands: Constitute an important natural resource with great implications for SLM. Kenya has approximately 1.42 million hectares of closed canopy forest. Forests in Kenya can be classified into six broad categories: the high volcanic mountains and high ranges: e.g. Mts. Elgon, Kenya, Aberdares, Cherangani and Mau; the Western plateau: Kabarnet, Kakamega, Nandi, Trans – Mara;, the dry Northern mountains: Ndotos, Mathews, Leroghi, Kulal, Marsabit; Coastal forests: Arabuko – Sokoke, Tana, Kayas, coral and mangrove forests; southern hills: Taita Hills, Kasigau, Shimba Hills, Chyulu Hills, Nguruman. There are also riverine forests such as on the Tana and its tributaries, the Ewaso–Ng’iro, Kerio, Turkwell and Athi/Galana rivers. Forests are important for preserving the country’s water resources where over 75% of the country's renewable surface water originate. Kenya’s forests are estimated to contribute to 3.6% of Kenya's GDP57, excluding charcoal and direct subsistence uses. Kenya’s forests are endowed with a rich array of plant and animal life, and SLM is needed for their sustainability. Challenges facing Forests: Generally, Kenya’s forests have suffered progressive depletion due to human population pressure for new settlements and the supply of timber and non timber products. Over the years, the forest cover in Kenya drastically reduced due to poor protection, forest excision for settlement, wood fuel, legal/illegal logging, cultivation and poor enforcement of laws that have always existed to protect forests58. The montane forests of Kenya’s five water towers are surrounded by some of the most densely populated areas of Kenya and are therefore under significant pressure. The most threatened forests currently include Kakamega, the Mau Forest Complex and coastal forests. There are also currently approximately 165,000 hectares of plantation forestry in Kenya, which are generally poorly managed. One of the key identified drivers of deforestation and land degradation in Kenya is the demand for
57 National Forest Policy (2014). Republic of Kenya 58 The Forest Act-2005 (repealofCap385). Sessional Paper No. 9. Government of Kenya, Nairobi

19
fuel wood and charcoal, accounting for 70% of all energy consumed (90% in rural areas)59. There is need to shift to alternative energy sources. Kenya in its Vision 2030 proposes to increase the forest cover from 2% in 2010 to 10% coverage in the country under a protected area system (this target is not time bound). This will facilitate watershed conservation to enable forest recovery areas through forestation of water source forests for conservation of water resources in catchment areas. The National Water Master Plan-2030 proposes the forestation of the Five Water Towers that had suffered deforested areas between 1990 and 2010. This aims at increasing significant amount of forestation area, and also including afforestation of the other degraded areas and isolated smaller forests. Grasslands and Rangeland Vegetation– These comprise a wide range of vegetation types and are important natural resources taking up about 69.7% of the land area of Kenya60. Most rangelands are in the ASALs, which cover vast areas of Kenya and upon which majority of the livestock and wildlife depend. However, drought, overgrazing, shifting cultivation and unsustainable exploitation e.g. through charcoal burning, have destroyed the natural vegetation affecting especially perennial grasses indigenous trees and shrubs. Restoration of natural rangeland vegetation is usually faced with many challenges associated with communal ownership of resources, land tenure issues and generally, “the Tragedy of Commons”.
Wildlife: Kenya has abundant diversity in wildlife. The country is ranked third in Africa in terms of the diversity of mammalian species, with 14 of these species being endemic to the country61. These include the ‘big five’ i.e. lion, elephant, leopard, rhino and buffalo. Other large animals include the hippopotamus, giraffe, cheetah and other carnivores. Herbivores constitute a particularly large group – in numbers and species, which include; antelopes, zebras, impala, Thomson’s and Grant’s gazelles, topi, kongoni, wildebeest, waterbuck, dikdik and other species. There are apes such as the black and white colobus monkey which have several subspecies. Also, due to the huge variation in climate, topography and habitats, Kenya has some 1,132 different bird species. The country also hosts five hot spots of globally important biodiversity and 61 Important Bird Areas62.Other animal species such as reptiles, amphibians and insects contribute to the overall biodiversity of natural habitats. Wildlife depend on natural resources (water, vegetation, land) for their survival. Some 75% of Kenya’s wildlife is found in the dry lands and 92% of Kenya’s Protected Areas (Parks and Reserves) are found in ASALs. It is estimated that currently nearly 80% of
59 UNEP 2009. Water Security and Ecosystem Services. The Critical Connection. United Nations Environment Programme, Nairobi, Kenya
60 MENR (2016). Land Degradation Assessment in Kenya: Based on a Study of Land Degradation Assessment (LADA) with Remote Sensing and GIS, for Sustainable Land Management (SLM) in Kenya. Republic of Kenya, Ministry of Environment and Natural Resources (MENR), Nairobi.
61 IGAD (2007). IGAD Environment Outlook. Intergovernmental Authority on Development (IGAD). Djibouti 62 Bennun, L. and Njoroge, P. (1999) Important Bird Areas in Kenya. Nature Kenya, Nairobi.

20
all wildlife in Kenya are located outside protected areas. Thus, wildlife face many dangers including poaching, encroachment by human settlements and agriculture causing human-wildlife conflicts; habitat destruction and pollution of water resources. These challenges are further aggravated by reduction in dispersal areas and blockage of wildlife migration corridors. Thus, SLM is about protecting wildlife and rehabilitating their natural habitats.
Coastal and Marine Ecosystems: Kenya has a long marine coastline covering 880 km (536 km direct distance) between her borders with both Somalia and Tanzania63.. Kenya’s territorial sea area is 13,800 sq. km, with approximately 230,000 km2 lying within the 200 nautical mile Exclusive Economic Zone. Kenya’s coastal and marine ecosystems support some of the most spectacular coral reefs, sea grass beds, mangroves, salt marshes and salt flats that exhibit remarkable levels of species richness and endemism. Coral reefs are important feeding and breeding grounds for numerous marine species, including fish and provide recreational activities for tourists. However, this rich biodiversity is not fully understood ecologically and much less regulated, managed and conserved. Thus, the conservation of Kenya’s marine ecosystems and marine biodiversity is a high priority for the country64. Coastal marine resources offer a great potential to sustain a number of economic activities, such as tourism, agriculture, fishing, mining and water sports. But this sustainability requires adoption of SLM.
Mangroves: Mangroves cover around 600 sq. km of the Kenyan coast, with approximately 67% being found in Lamu County. It is estimated that around 100 sq. km of mangrove forest, or 14% of the original area, has been lost due to land conversion, over-exploitation, or pollution65. All nine species of true mangroves found in East Africa occur in Kenya. Mangroves provide feeding, breeding and refuge habitats for many species of fish and shellfish important in near-shore fisheries. There is a symbiotic relationship between mangroves and nearby coral reefs, mediated through sediment-trapping and nutrient-cycling ecosystem services that mangroves provide. By slowing water runoff from the land through their extensive root network, mangroves cause sediment to settle that could otherwise damage nearby reefs66.
Coral Reefs: Kenya’s coral reefs are part of the northern end of the East African fringing reef system, decreasing in extent, size and diversity going northwards. Kenya’s reefs have about 220 species of true corals. Coral reefs are among the most productive of all marine ecosystems, providing habitat for numerous species, including turtles
63IGAD (2007). IGAD Environment Outlook. Intergovernmental Authority on Development (IGAD). Djibouti. 64 Government of Kenya. 2009. State of the Coast Report: Towards Integrated Management of Coastal and Marine
Resources in Kenya. National Environment Management Authority 65 NEMA and UNDP. 2009. Fourth National Report to the Conference of Parties to the Convention on Biological Diversity.
National Environmental Management Authority. Nairobi, Kenya 66 Obura, D. 2011. Corals and Climate Change: Building Resilience into Management. Swara. 2011: 3, July-Sept

21
and dugongs. Their ecosystem services, such as protecting the coastline from ocean waves, and predators such as sharks, are very important to ecosystem conservation.
2.5 Environment and Pollution Environment: The National Environment Policy67 defines environment as; “a broad term representing the totality of the surrounding such as plants, animals microorganisms, socio economic and cultural factors. It includes the physical factors of the surroundings of human beings such as land, water, atmosphere, sound, odour, taste, the biological factors of animals and plants and the social factors of aesthetics and includes both the natural and the built environment”. Generally, there are about 77 statutes in Kenya that relate to environmental concerns, albeit these were harmonized through the Environmental Management and Coordination Act of 1999 (EMCA). More specifically, the Constitution of Kenya under Article 42 provides safeguards for the environment stipulating that “Every person has the right to a clean and healthy environment”. The Kenya Vision 2030 has placed the Environment at the top of its agenda, stipulating that Kenya aims to be a nation that has a clean, secure and sustainable environment by 2030. However, environmental degradation is escalating in Kenya due to exploitative land use practices, deforestation, overgrazing, poorly planned and expanding human settlements, industrialization and pollution. Poverty is another major cause and consequence of environmental degradation and resources depletion. The poor rely heavily on natural resources for their livelihoods, and are unable to put land to rest or add inputs. Environmental issues affect almost all spheres of national development and thus have a bearing on SLM. Pollution: There are many areas in Kenya which are threatened by pollution from solid waste, liquid effluents and air pollution. Agriculture is both a source of pollution, as well as a victim. Non-point source pollution from intensified agriculture and degraded agricultural lands contributes to the pollution of water resources. On the other hand, polluted water is used for irrigation of food crops in peri-urban areas, especially in Nairobi. The main drivers of environmental health risks are rapid population growth, rural-urban migration leading to overstretched solid and liquid waste management services, poor disposal of hospital wastes, rapid growth of industrial and commercial enterprises and proliferation of slums or unplanned settlements. This exerts pressure on natural resources and the available infrastructure, impacting on health services, housing, sanitation, education, water services, transport and waste management. Solid waste: Solid waste management is increasingly becoming an important issue that has implications for SLM, as it affects the integrity of land, water, air, human health and the environment. The rapid urbanization, industrialization and changing consumer patterns have produced increasing amounts of solid waste, of which less
67 National Environment Policy, 2014.Sessional Paper No. 10 of 2014 on the National Environment Policy. Ministry of
Environment Water and Natural Resources, Republic of Kenya.

22
than 40% is collected and disposed off at designated dumpsites68. Nairobi alone produces around 2,400 tons of solid waste per day69, but only 33% of the waste is collected and disposed at Nairobi’s only dumpsite in Dandora. In the rural areas, pesticides and other agro-chemical wastes pose a major threat due to their toxicity, potential to pollute and threat to human health. Pesticide wastes are extremely hazardous and can contain persistent organic pollutants (POPs), which can accumulate in the food chain if not well managed. This can cause negative impacts on human health, ranging from waterborne diseases like typhoid, cholera and diarrhea, increased upper respiratory diseases, to malaria and various allergies. The challenges that solid waste pose are varied, and are projected to escalate as the population and the economy grows. Addressing the solid waste menace is important in achieving SLM. Water pollution: Currently, Kenya does not have adequate infrastructure to manage both wastewater and solid waste, hence most such wastes end up in water sources therefore polluting them. The urban and peri-urban areas face the highest risks of pollution, with point-source pollution from domestic, commercial and industrial activities. Out of some 175 urban centers in the country, only 47 operate conventional sewerage treatment plants. The proportion of population connected to functional sewerage facilities is only 6%. Around 76% of the population use on-site treatment facilities, which include “unimproved sanitation”, such as pit latrines without slab, while around 18% do not have sanitation facilities70. In the rural areas, excessive cultivation of water catchment areas results in soil erosion and pollution from effluents of agricultural pesticides and heavy metals affecting water sources. The cascade effect is increasing eutrophication and siltation of lakes, dams and pans. The impacts of pollution on water resources is manifested by poor water quality which causes toxicity to humans, animals and aquatic life, loss of aesthetic value and habitat destruction. These issues need to be factored in SLM planning. Air pollution results from environmental degradation and is a leading cause of respiratory diseases such as chronic obstructive pulmonary disease, lung cancer, pulmonary heart disease and bronchitis. Although there is no system in place to collect data on air quality in Kenya, pollution levels in Nairobi are estimated to be 45μg/m3, or three times higher than the World Health Organization (WHO) recommended level of 15μg/m3. The high particulate matter in the air emanates from industrial and commercial activities, which are concentrated in urban areas and from emissions by vehicles and other forms of transport. In rural areas, the quality of air is affected mostly by over-reliance on wood fuel, agricultural activities and poor housing. Air pollution can be reduced or eradicated using SLM interventions.
68Ministry of Environment and Natural Resources, 2014.A circular economy solid waste management approach for urban
areas in Kenya. NAMA Report for Kenya 69 Japan International Corporation Agency (JICA) (2010). Preparatory Survey for Integrated Solid Waste Management in
Nairobi City in the Republic of Kenya.Available from http://open_jicareport.jica.go.jp/ pdf/12005443.pdf. 70 Republic of Kenya (2013). National Water Master Plan 2030

23
Forest fires: Most of the forests in Kenya, especially those on Mt. Kenya, the Aberdares and Mt. Elgon, are prone to fire. These fires occur mostly during the dry season and decimate both the indigenous and plantation forests. It is estimated that about 78 fires occur annually in the country71. For instance, Kenya has lost more than 5,700 ha of forests per year to forest fires over last 20 years72. On Mt. Kenya, fires occur at very high altitudes even within the moorland. Ideally, forests should be protected from fire using firebreaks and regular surveillance, but these measures are not effectively applied. As a result, fires break out every year due to either arson or accidentally. The effects of forest fires last long since vegetation is badly destroyed and biodiversities are destabilized. Lasting solutions are needed to prevent and control forest fires as an environmental problem. Mining: Mining occurs in various parts of Kenya and is generally associated with negative environmental effects, disrupting the natural landscapes physically, chemically and biologically. Scarification of land surface by mining activities, including extraction of building stones from quarries leaves unsightly craters on the surface. Sand harvesting is one of the most common mining activities especially in the ASALs, with negative impacts on water resources. The Government of Kenya has instituted safeguards for environmental conservation through the Mining Act73, and developers of mining projects are required to carry out environmental impact assessments (EIA) prior to project implementation. Under Article 179, the Act provides guidelines on land use and environmental protection in mining sites. It supports the sustainable use of land through restoration of abandoned mines and quarries and prohibits seepage of toxic waste into streams, rivers, lakes and wetlands. Further, the Act instructs that upon completion of prospecting or mining, the land in question should be restored to its original status or to an acceptable and reasonable condition as close as possible to its original state. However, in the past, mining areas have not been targeted by SLM programmes, an issue that this Strategy addresses.
2.6 Energy The Kenya Vision 2030 has identified energy as one of the infrastructural "enablers" upon which the economic pillars of this long-term development strategy will be built. However, wood fuel still provides the basic energy needs of most rural communities, urban poor and the informal sector. Kenya has an estimated hydropower potential of about 6,000 MW comprising of large hydropower stations (sites with capacity of more than 10 MW) and small hydropower stations. In 2015, about 2,307.5 MW of power was being generated, of which 820.7 MW was hydropower74. The potential for small hydropower is over 3,000 MW, of which less than 25 MW has been developed. As of
71 Forest Fire Situation in Kenya. http://www.fao.org/docrep/004/X6809E/X6809E06.htm 72 MENR (2009) Kenya Climate Change Response Strategy. Available at: www.environment.go.ke 73 The Mining Act, 2016.Kenya Gazette Supplement No. 71 (Acts No. 12) Republic of Kenya. 74 Republic of Kenya, 2016. Statistical Abstracts. National Bureau of Statistics

24
2014 only about 35 % of the Kenyan population was connected to electricity75. As the Government seeks to increase the country’s power production through a 5000+ MW76 programme as per the Vision 2030, SLM will benefit as more people switch to using clean energy, and stop cutting trees for fuelwood and charcoal. Fuelwood and Charcoal: The significance of the energy sector to SLM is evident from the escalating destruction of trees for fuel and charcoal. At the national level, trees are threatened because firewood and charcoal account for about 69% of the total primary energy consumption (petroleum 22%, electricity 9%, others account for 1%)77. Furthermore, almost 90% of the rural population is dependent on firewood for cooking and heating, while 82% of urban households depend on charcoal. In Kenya, demand for wood is estimated at 41.7 million m3 per year, including 18.7 million m3 for fuel wood and 16.3 million m3 for charcoal78, but the amount that can be harvested sustainably is estimated at just 31.4 million m3. This means that every year, Kenya is losing 10.3 million m3 of wood from its forests, a serious environmental concern. The huge volumes of biomass extracted for fuel in the country portend escalating land degradation. Addressing the energy sub-sector is an important entry point for the success of SLM in Kenya. Oil and Gas: Kenya is a major consumer of oil and gas, which, although having positive impacts on the economy, can portend threats to the environment and cause pollution. Oil and gas are imported commodities in Kenya. But this is set to change after Kenya discovered petroleum in 2012, first in Turkana. Since then, there have been claims of oil and gas finds in northern Kenya, around Lake Victoria and off-shore around Lamu, while coal has been discovered in the Mua hills of Kitui. These mineral finds present great opportunities for Kenya’s overall economic development. It is expected to translate into lower costs of cooking gas, which in turn would reduce pressure on wood fuel and charcoal, thus sparing trees from destruction. However, there is no commercial production of oil and gas in Kenya as originally projected to commence in 2016. Since mineral and oil extraction carries with it exposure to the environment of harmful substances including oil spills, these aspects should be factored as an SLM agenda.
2.7 Infrastructure Development Kenya leads in the East African region in terms of infrastructure mega projects. For instance, in 2015, the country had 20 ongoing large infrastructure projects79. These have included transport sector (roads, rail, airports, sea ports) taking up 51% of the energy and 30% of development projects. They include the high-speed Standard Gauge
75 Draft National Energy and Petroleum Policy (2015). Ministry of Energy and Petroleum 76 The National Energy and Petroleum Policy(2015) 77 Kenya Energy Situation 2015.http://data.worldbank.org/topic/energy-and-mining 78 Ministry of Environment, Water and Natural Resources (2013).Analysis of Demand and Supply of Wood Products in Kenya.
Study carried out by Wanleys Consultancy Services. Nairobi. http://www.kenyaforestservice. org/documents/redd/ 79 African Development Bank, 2014. Kenya Country Strategy Paper 2014-2018

25
Railway (SGR) to be complete in 2017. Road construction is the largest infrastructural development that has implications for land degradation and SLM. According to the Kenya National Highways Authority (KeNHA), the country has a road network of about 177,800 km, of which 63,575 km is classified, but only 9,273 km are paved (tarmac). However, infrastructure development can cause land degradation through a number of ways. This is because road drainages are associated with point-source runoff responsible for soil erosion including gullies, and these have to be factored as part of SLM. Infrastructure development also enhances SLM through efficient supply of goods and services, facilitating SLM activities in remote areas. Proposed infrastructure should also be factored in SLM, such as LAPSSET (Lamu Port-Southern Sudan-Ethiopia Transport) Corridor, and the proposed High Grand Falls dam80, planned to be the largest dam in Kenya, with a capacity of over 5.6 billion cubic metres. The dam will also be used to generate between 500 MW and 700 MW of electricity and help to control flooding in the Tana delta that displaces thousands of people every year. Covering an area of 165 sq. km, the High Grand Falls dam will straddle the three counties of Tharaka-Nithi, Kitui and Tana River. Apart from generation of electricity, the massive water in the dam will be used to irrigate more than 200,000 acres of land in downstream areas. These infrastructure developments, while expected to spur economic development through expansion of irrigation, improved transport, commerce and tourism, will also have implications on land degradation as more land is opened to human habitation, and formerly serene environments are disrupted.
2.8 Tourism Tourism is a key economic sector in Kenya, coming only second after agriculture as a major foreign exchange earner. Kenya’s tourism greatly depends on its natural beauty and wildlife, which accounts for 90 per cent of safari tourism and 75 per cent of total tourism earnings. However, this unique heritage is under threat from destruction by human activities and effects of climate change81. The continued decimation of wildlife and loss of critical habitats is faced with human encroachment, with activities such as overgrazing, poaching and charcoal burning in the niche areas that are tourist attractions affecting the sector. The Tourism Act of 2011 provides for the development, management, marketing and regulation of sustainable tourism, supporting tourism-related activities and services. The Act among other things provides for guidelines and measures for sustainable tourism, relating the sector to environmental issues82. Thus, tourism inherently depends on natural resources; land, water and biodiversity, as well as infrastructure (hotels, roads) and the service sector (food, vehicles). SLM is an
80 www.megaprojects.co.ke 81 Mogaka, H. & Barrow, N. (2007).Kenya’s Dry lands – Wastelands or an Undervalued National Economic Resource.IUCN. 82 UN (2012).Sustainable Development in Kenya: Stocktaking in the Run up to Rio+20. Retrieved November 10, 2016, from:
https://sustainabledevelopment.un.org/content/documents/985kenya.pdf

26
important intervention that could revitalize the tourism sector, by protecting and enhancing the natural assets that are Kenya’s tourist attractions. Ecotourism: Ecotourism is concerned with touristic activities that consciously uphold environmental conservation and community participation, enhancing socio-economic benefits to local communities. This is especially relevant in Kenya where human-wildlife conflicts, poaching and competition with more intensive land use systems such as agriculture are major threats to natural resources upon which ecosystems, especially wildlife, depend. Ecotourism is about active tourism, e.g. trekking, bird watching, agro-tourism, mountain climbing, nature trails, fishing, boating, cultural tourism e.g. visiting indigenous communities and interacting with them. The concept embraces the educational, sustainable and nature-based components. It helps conserve ecosystems and natural areas, facilitates environmental awareness among local communities, promotes economic incentives e.g. sale of handicrafts, local environmentally safe goods and facilitates collective ownership and control of natural resources, with profits to community development programmes. Ecotourism is one way to enhance SLM through tourism and vice versa (enhance tourism through SLM).
2.9 Trade Trade provides a platform over which individuals and nations produce trade-able goods in exchange for those which they need but do not produce in sufficient quantities to meet their needs. Trade is therefore an important driver of production and facilitator of consumption in all countries, Kenya included. In 2015, Kenya’s total external trade (exports and imports of goods) was Kshs.2,158 billion83 (US$21.6 billion) accounting for 36.8% of the GDP. Apart from the macro economic impacts, trade has both positive and negative impacts on SLM, by creating demand for production of more goods and changing consumption patterns. Trade does have positive impacts on SLM, facilitating the conservation of Kenya’s land resources through a number of ways: Firstly, as populations have increased, trade has become an important mechanism for intensified agriculture, improving incomes and a monetary economy, thus reduction of numbers of people reliant on natural resources for their survival. Secondly, the demand for timber and non-timber wood products has created incentives for people to plant trees, greatly contributing to increased vegetative cover in various parts of the country. Trade has also spawned a recycling industry in paper and plastics which has significantly reduced solid waste menace. Furthermore, the plastic industry, though perceived negatively, has contributed to saving millions of trees as alternative source products such as packaging materials and furniture. The negative impacts of trade on SLM are quite conspicuous. Trade in charcoal and timber causes deforestation, loss of vegetation cover and desertification. Also, illegal trade in game trophies and rare timber products has contributed to biodiversity
83 Republic of Kenya, Economic Survey 2016

27
degradation. For example, the extent of poaching and illegal trade in game trophies is manifested by the huge haul (105 tons) of ivory and rhino horns that were burnt by the government in 2015. In addition, the MENR has indicated that about 2.4 million tons of charcoal worth more KShs.132 billion were traded in Kenya in 2015, most of which was produced from the fragile ASALs. But legitimate trade can also lead to land degradation. For instance, pursuit of extensive crop production in order to meet local and export food demands has led to expansion of agriculture into fragile ecosystems (rangelands, catchment areas and wetlands) resulting in land degradation through soil erosion, nutrient depletion and aridification. Moreover, trade is a facilitator of the emerging consumption patterns thus contributing to environmental damage through disposal of wastes, including products such as plastics, chemical effluents and electronic waste.
2.10 Climate Change Threats There is growing evidence that climate change is occurring in Kenya. The frequency of droughts, floods, and other extreme climatic events has increased over the last five decades. Since the early 1960s, both minimum and maximum temperatures have been increasing (warming) throughout the country. The minimum temperature has risen generally by 0.7–2.0oC and the maximum by 0.2–1.3oC, depending on the season and the region84. Temperatures are increasing and the six warmest years have all occurred since 1987. Also, the frequency of ‘hot’ days has increased dramatically, by 57 days per year whilst cold nights have declined by 42 days per year. Projections indicate increases of 1-3.5 degrees centigrade by 2050s85. The general warming is leading to reduced glaciers on Mt Kenya and sea level rise along the coast. This has implications for river flows and sustainability of water supplies. Changing rainfall patterns: Rainfall in Kenya has become highly variable with increased climate variability and occurrence of extreme events. The climate is also influenced by El Nino events, becoming wetter in October to December in ENSO events and drier than average in La Nina years. For instance, the long rains in central and eastern Kenya have declined more than 100 millimeters since the mid-1970s86. A warming of more than 1° Celsius may exacerbate drying impacts, especially in lowland areas. The drying trends could particularly impact on critical crop growing areas in eastern and central Kenya where prime arable land could diminish substantially. For the ASALs, climate change could reduce the growing seasons for pastures and cause drying up of water sources, particularly in the longer term i.e. 20-50 years. Moreover, the number of rain-days has reduced meaning more intensive storms are experienced,
84 Government of Kenya, 2010.National Climate Change Response Strategy. 85 GoK2010 State of the Environment Report, 86 Thornton P., Herrero M., Freeman A., Mwai O., Rege E., Jones P., and McDermott J., 2008. “Vulnerability, Climate Change
and Livestock – Research Opportunities and Challenges for Poverty Alleviation”. ILRI, Kenya
28
especially in the ASALs, where seasonal rainfall has also declined87. As a result, climate change affects land degradation in many ways, including escalating wind erosion due to drying of land and loss of natural vegetation. These phenomena continue to impact other sectors including agriculture, health and water resources. The continued annual burden of the extreme climatic events could cost the Kenyan economy as much as US$500 million a year88, which is equivalent to approximately 2.6 percent of the country’s GDP with implications for long-term economic growth. SLM is among the important ways of building resilience and adaptation to climate change. Drought: Drought is a major problem in Kenya with repercussions on land degradation and productivity. Kenya experiences drought on a cyclic basis and there are indications that escalating drought crises are linked to climate change. For instance, since the 1970s, serious droughts have been recorded89 in 1972, 1974/75, 1977, 1980, 1982, 1983/84, 1991/92, 1995/96, 1999/2000, 2005/2006, 2009 and in 2010/2011. Between 1975 and 2011 there were at least ten serious droughts, three of them in the last seven years (2005-6, 2008-9 and 2010-11)90. Drought recurrence is getting ever more frequent, and over the last decade, drought events occurred every two years. Droughts result in drying out of water sources, livestock deaths, impoverishment of both farmers and livestock keepers, as well as decline in the national economy. Furthermore, droughts escalate land degradation through loss of vegetation cover, increasing propensity for soil erosion, desertification and lowering of productivity. However, even though the Government has instituted initiatives such as “Ending Drought Emergencies (EDE)”, long-term sustainability has been elusive and there is need for SLM to enable coping, adapting and mitigating the impacts of drought in Kenya. Floods: Excessive flooding in Kenya has increased both spatially and in frequency of occurrence, as well as in terms of the magnitudes of the destruction that ensues. The increased incidences of floods are linked to both human activities (encroachment of catchment areas, destruction of riparian lands, poor land management, unplanned urbanization) as well as climate change (high intensity storms). Floods have increasingly become a major threat to life, property and a major cause of land degradation. Areas most affected by floods in Kenya include the Lake Victoria Basin, Lower Tana River basin, Nairobi, Mombasa, Kwale and parts of Ewaso Ng’iro North basin91. Floods also cause landslides with excessive loss of soil and vegetation, the most affected areas being slopes of the Aberdares in Muranga and Nyeri, Mt. Kenya
87 Recha, J., Mati, B., Nyasimi, M., Kimeli, P., Kinyangi, J. and Radney, M. (2016).Changing rainfall patterns and farmers’
adaptation through soil water management practices in semi-arid eastern Kenya .Arid Land Research and Management. Taylor & Francis.http://www.tandfonline.com/doi/pdf/10.1080/15324982.2015.1091398
88 National Climate Change Action Plan (NCCAP) 2013 -2017. Republic of Kenya, Vision 2030.GoK, 2013 89 Republic of Kenya (2009), National Policy on Disaster Management .Nairobi, Kenya. 90 Republic of Kenya, 2013. Sector Plan for Drought Risk Management and Ending Drought Emergencies. Second Medium
Term Plan (2013 – 2017) 91 Republic of Kenya (2013). National Water Master Plan, 2030

29
areas in Meru and parts of Cherangani hills. Flooding is a phenomenon that can be mitigated through the adoption of SLM.
2.11 Other Emerging Issues There are many emerging issues that could result in land degradation and/or have implications for SLM. These cut across environmental, policy, technological and social sectors, to include; irrigation expansion, urban growth, newly discovered oil and gas, refugee crises and infrastructure development (roads, rail, dams). Urbanization – Kenya’s urban centres are expanding rapidly pushed by population growth, rural-urban migration and prospects for employment as the country has the largest economy in East Africa. There is also a significant potential to further capitalize on regional markets and strengthen Kenya’s position as the region’s economic powerhouse. Nairobi, the capital of Kenya is expanding rapidly and connecting with 13 satellite towns around the capital e.g. Ruiru, Thika, Kiambu, Athi River, Ngong and Limuru. There are plans to build new techno cities e.g. Konza and Tatu city. All these developments carry with them extensive land conversions, from agricultural or rangelands to paved areas which generate large volumes of runoff and/or pollution of water and air. Urbanization often leads to destruction of sensitive ecosystems, poor waste management, pollution and health issues. Positive impacts of urbanization include relocation of populations from catchment areas and less reliance on natural resources (e.g. firewood) for livelihoods. Whichever way, urbanization and SLM are inherently inter-connected. Immigration and Refugees: Kenya receives immigrants from around the world as temporary residents (e.g. visitors, students, researchers, and work permit holders), long-term residents (e.g. spouses of Kenyan residents or long-term business investors), asylum-seekers and refugees. However, Kenya ranks among the largest refugee hosting countries in Africa. As of March 2015, UNHCR estimated the number of refugees and asylum-seekers in Kenya were 586,224 individuals, located mainly in Dadaab and Alinjugur camps (351,446), Kakuma camp (181,821) and Nairobi (52,957). Refugees primarily originate from Somalia, Ethiopia, Democratic Republic of the Congo, South Sudan and Burundi92. Refugee-hosting areas, notably Dadaab and Kakuma, are semi-arid environments that are vulnerable to the effects of climate and environmental degradation. A large number of refugees are internal environmental refugees93, who are dislocated from their rural livelihoods due to drought and sometimes floods. Refugees normally use huge quantities of firewood extracted from surrounding scrublands and bushes, further escalating land degradation.
92 Migration in Kenya: A Country Profile. International Organization for Migration,
2015.http://publications.iom.int/system/files/pdf/migration_profile_kenya.pdf 93 GoK, 2011.Livestock Sub-Sector Stakeholders’ Conference for North Eastern Kenya. Proceedings of a Conference, 12th –
14th January 2011. Garissa, Kenya.

30
Insecurity: Large areas of Kenya, especially within the ASALs of northern Kenya, have for long faced various security threats. Some of these stem from traditional cultures of the local people that encouraged cattle rustling as a way to restock livestock, and which have persisted to date. But modern-day insecurity is driven by a multiplicity of issues, ranging from competition over grazing and water resources, ethnic conflicts and sometimes, cross-border insecurity in neighbouring countries. The proliferation of small arms has escalated the insecurity problem, extending to both rural and urban areas. Insecurity in the border areas has international ramifications94, with terrorism as an emerging threat that hampers development of the same areas prone to both environmental and ethnic strife. Insecurity is further aggravated by poorly developed infrastructure for such large areas with poor roads and communication networks, dispersed populations and a heavy presence of illegal firearms. Weak institutional presence which generally translates into weak law enforcement also contributes to insecurity and thus to land degradation, and difficulties in implementing SLM.
94 Republic of Kenya (2012).National policy for the sustainable development of northern Kenya and other arid lands.
Ministry of State for Development of Northern Kenya and other Arid Lands. Sessional Paper No.8 of 2012

31
3. RATIONALE AND JUSTIFICATION FOR THE KSIF ON SLM
3.1 Legal, Policy and Institutional Frameworks Guiding SLM The Government of Kenya has over the years instituted various laws, policies, strategies, development plans and institutional frameworks designed to curtail land degradation, protect the environment and facilitate SLM. In a recent study95, some 89 documents were identified variously being national polices, laws, strategies and development plans that have bearing on SLM. Added to this is the fact that each of the 47 Counties in Kenya is also developing their respective laws, policies and strategies, a large number of which will have an SLM function. However, the numerous documents have resulted in the scatter of ideas, overlap of jurisdictions and poor targeting of SLM investments and interventions. Indeed there is no one-stop document that targets SLM tacitly at the national level. There is therefore need for realignment of the existing legal, policy and institutional instruments to target land degradation and SLM, as with this KSIF. But first, there is ample evidence that the Government of Kenya supports the formulation and implementation of this strategy. 3.1.1 SLM is Entrenched in Kenya’s Legal Instruments A large body of laws and statutes have been developed that carry tenets of SLM. Top among these is the Constitution of Kenya96that was promulgated in August 2010. Hailed as a ‘Green’ Constitution, it recognizes sustainable and productive management of land resources and protection of genetic and biological diversity. Chapter Five is entirely dedicated to land and environment. The constitution also contains elaborate provisions with considerable implications for sustainable development. These range from environmental principles and implications of Multilateral Environmental Agreements (MEAs) to the right to a clean and healthy environment as enshrined in the Bill of Rights. It also embodies a host of social and economic rights which are of environmental nature such as the right to water, food and shelter. Under the devolved system of government97, the Constitution assigns responsibility for agriculture and the environment to the 47 Counties meaning that SLM is mostly under the mandate of counties. Other legal instruments supporting SLM include the Agriculture, Fisheries and Food Authority (AFFA) Act No. 13 of 2013, the Environmental Management and Co-ordination Act (EMCA) No.8 of 1999, the Land Act No. 6 of 2012, the Forest Act of 2005, the Water Act No.43 of 2016, the Wildlife (Conservation and Management) Act, the Physical Planning Act of 1996 and the Occupational Health and Safety Act of 2007. This shows that upscaling SLM is supported by a number of legal instruments in Kenya.
95 Republic of Kenya, 2016.Overview of the policy, legislative and institutional frameworks for sustainable land management
in the public sector in Kenya. Ministry of Environment and Natural Resources (MENR) and NEPAD Planning and Coordinating Agency (NPCA)
96 The Constitution of Kenya (2010).The Government of the Republic of Kenya. 97 GoK, 2013. Devolution in Kenya: Opportunities and Challenges for the Water Sector. Water and Sanitation Program Policy
Note.

32
3.1.2 Policy Support for SLM There are many policy instruments which have significant implications SLM, but they relate closely with agriculture, land, water, forests, trade and industry and the environment. The key policy instrument in Kenya is the Vision 2030, which proposes to turn Kenya into a “middle-income country providing a high quality of life to all its citizens in a clean and secure environment by the year 2030”. Other instruments such as the Agricultural Sector Development Strategy (ASDS)98, the National Environment Policy99, the Land Policy100, the National Policy for the Sustainable Development of Northern Kenya and other Arid Lands (2012) and the National Climate Change Response Strategy (NCCRS) are among the policies that support SLM. Despite so many policy instruments, SLM is not holistically addressed. Instead, the policies are sectoral rather than integrated in how they address management of natural resources. This has proved inadequate in addressing SLM implementation challenges. In addition, weak enforcement of laws and poor implementation of policies remain major concerns. As per the National Environment Policy101, the KSIF adopts the following tenets:
a) Environmental Right: Every person in Kenya has a right to a clean and healthy environment and a duty to safeguard and enhance the environment. This also includes planned urbanization, alongside waste management and pollution control.
b) Ecosystem Approach: An integrated ecosystem approach to conserving environmental resources will be adopted and enhanced to ensure that all ecosystems are managed in an integrated manner while also providing a range of benefits to the citizenry.
c) Sustainable Resource Use: Environmental resources will be utilized in a manner that does not compromise the quality and value of the resource or decrease the carrying capacity of supporting ecosystems.
d) Public Participation: A coordinated and participatory approach to environmental protection and management will be enhanced to ensure that the relevant government agencies, county governments, private sector, civil society and communities are involved in planning, implementation and decision making processes.
e) Subsidiarity: The management of the environment and natural resources will be through decentralization and devolution of authority and responsibilities to the lowest level possible.
f) Polluter Pays Principle: The polluter and users of environmental and natural resources shall bear the full environmental and social costs of their activities.
g) (International Cooperation: MEAs and regional instruments will be domesticated and implemented cooperatively for better environmental management of shared
98 Government of Kenya, 2010. Agricultural Sector Development Strategy (2010–2020) 99 Republic of Kenya, 2013. National Environment Policy, 2013.Ministry of Environment, Water and Natural Resources, Nairobi. 100 Republic of Kenya, 2009. Sessional Paper No. 3 of 2009 on National Land Policy. Ministry of Lands, Nairobi 101 Republic of Kenya, 2013. National Environment Policy, 2013.Ministry of Environment, Water and Natural Resources, Nairobi.

33
resources. Strengthen national and regional partnerships in implementation of relevant conventions relating to technology transfer to better utilize the country’s biological resources.
h) Benefit sharing: Where benefits will accrue from utilization of biodiversity, these will be shared in order to promote conservation and sustainable use of biodiversity. Also, to involve and empower communities in catchment management and ecosystem restoration.
3.1.3 KSIF is Linked to National Development Priorities Kenya has developed and implements many development plans that inform this integrated SLM Country Investment Framework. The Framework will draw linkages to other national development priorities which include: the National Climate Change Response Strategy (NCCRS)102 that seeks to mainstream climate change adaptation and mitigation issues in line with the Kyoto Protocol linked to the United Nations Framework Convention on Climate Change (UNFCCC). Through the National Climate Change Action Plan (NCCAP), several priority issues have been brought up to actualize the strategic goals of the NCCRS, the primary focus being on the need for enhancement of investment in SLM as a necessary adaptation measure; Conservation of biodiversity in line with the Cartagena Protocol on Biosafety to the Convention on Biological Diversity (CBD); Combating desertification by implementing the United Nations Convention on Combating Desertification (UNCCD); Food security and poverty alleviation programmes; Attainment of at least 10% Forest Cover in fulfillment of the Reduced Emissions from Deforestation and Degradation (REDD+). In addition, the KSIF is instrumental in supporting the programme on Ending Drought Emergencies. In recognition of the severity of droughts and impact on national development especially in the ASAL areas, the government has developed a sector plan103 for ending drought emergencies by the year 2022. Key efforts prioritized in the Plan touch on sustainable use and management of land and other natural resources. Thus, the KSIF will contribute to the attainment of the objectives on ending drought emergencies and eradicating disasters associated with drought.
3.1.4 Linkage with National and County Planning and Investment Frameworks The KSIF will be linked to investment frameworks within the national and county planning units for seamless integration of SLM into the planning systems, notably the Medium Term Investment Plans (MTIPs), the Medium Term Expenditure Frameworks (MTEFs) and the County Integrated Development Plans (CIDPs). This will ensure faster and efficient alignment of investments from the mainstream national and county government allocations to the SLM investment framework. It will also facilitate easy tracking of investments channeled towards SLM by both national and county governments, thus making it easy to undertake M&E and reviews on public
102 Republic of Kenya (2010). National Climate Change Response Strategy. Executive Brief. Government of Kenya. 103 Republic of Kenya. (2015). Sector plan for Drought Risk Management and Ending Drought Emergencies. National Drought
Management Authority (NDMA). Nairobi
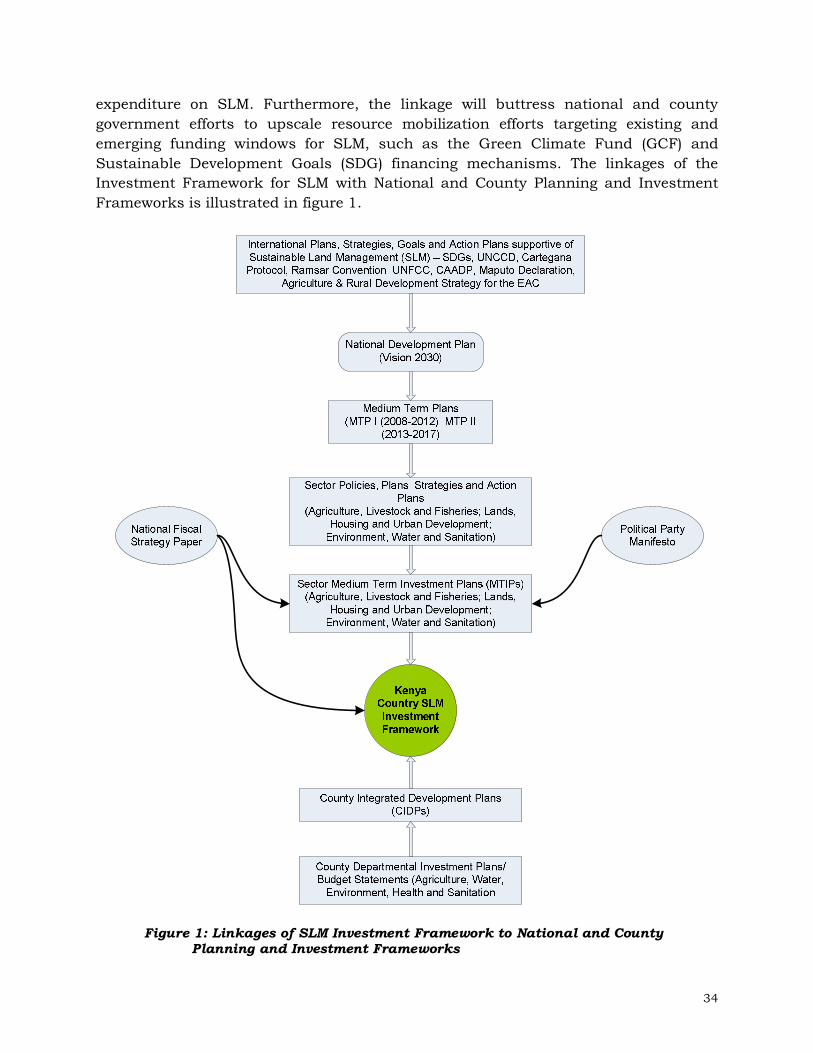
34
expenditure on SLM. Furthermore, the linkage will buttress national and county government efforts to upscale resource mobilization efforts targeting existing and emerging funding windows for SLM, such as the Green Climate Fund (GCF) and Sustainable Development Goals (SDG) financing mechanisms. The linkages of the Investment Framework for SLM with National and County Planning and Investment Frameworks is illustrated in figure 1.
Figure 1: Linkages of SLM Investment Framework to National and County Planning and Investment Frameworks

35
3.2. Synthesis of the findings of the Baseline Studies Various aspects of SLM appear across a number of documents and at local, national, regional and international levels. However, SLM in its full definition is yet to be realized due to existence of a number of gaps and barriers across policy, legal, institutional, technological and social levels. In order to close these gaps and identify appropriate remedies, the MENR initiated the five baseline studies: A synthesis of the findings of each of the studies is indicated below:
(i) Land Degradation Assessment (LADA) in Kenya
The study aimed at assessing the causes, extent and types of land degradation in the country, as a tool for planning and decision support on targeting of sustainable land management (SLM) interventions. The study made use of literature reviews, map data analysis, field visits and stakeholder consultations. Remote sensing (RS) and geographic information systems (GIS) tools were used to determine the areas undergoing serious land degradation. A set of 47 thematic maps were produced using RS/GIS tools, showing the various indicators of land degradation, and its severity. Trend analysis was performed for land use change and degradation over a 20-year period from 1990 to 2010. Land degradation mapping revealed that almost all the counties in Kenya are at risk from one form of land degradation or other covering 88.6% of the land area, of which 27.2% is very severely degraded and 61.4% is severely degraded. Land degradation affects especially the ASALs, where the soils are highly erodible and combined with high intensity storms, creates conditions for excessive runoff and soil erosion. The counties with high propensity for degradation include Samburu, Kitui, Garissa, Tana River, Mandera, Turkana, Marsabit, Baringo, West Pokot, Kajiado, Kilifi, Wajir and Makueni. Even some relatively wetter zones also have high propensity for soil erosion, especially on steep slopes of Mt. Kenya and the Aberdares, including parts of Muranga, Nyeri, Meru, Embu and Tharaka-Nithi. On the contrary, low degradation risks were found to be on protected areas and those with relatively flat terrains yet having adequate rainfall. These include the forest zones, national parks, tea-growing areas and plateaus e.g. Uasin Gishu, Trans Nzoia and parts of the Lake Victoria basin. The impacts of land degradation in Kenya are escalated by cyclic droughts, floods, as well as catchment factors such as steep slopes and highly erodible soils. However, human-induced degradation from activities that include destruction of forests, encroachment of water catchment areas, cultivation of steep slopes, overgrazing, poor land husbandry and poorly planned urban development pose the greatest threats. Meanwhile, sustainable land management (SLM) interventions do exist in isolated places in the country. These are in the form of tree planting in catchment areas, soil and water conservation on croplands and water harvesting

36
initiatives. The LADA study recommended, the upscaling of investments for SLM, and in particular; protection and reclamation of degraded water catchment areas soil and water conservation on farmlands, water harvesting, flood control and rehabilitation of degraded rangelands. It was observed that past initiatives on land degradation and SLM have been fragmented into projects, programmes and activities across different ministries and agencies. Thus, in the absence of coordinated SLM investment framework, lessons that could guide scaling up are not adequately captured. There is therefore need for a Strategy focused on SLM in Kenya.
(ii) Overview of the policy, legislative and institutional frameworks for sustainable land management in the public sector in Kenya. The aim of the study was to identify best approaches for mainstreaming SLM into national development policies, plans and regulatory frameworks. The study was advised by a thorough review of existing policy, legal, and institutional frameworks governing the land management, field visits and stakeholder consultations. Some 89 documents were identified that relate to LD and SLM, either as national laws, policies, strategies, institutional frameworks and development plans. The findings obtained that a large body of laws, policies, strategies, development plans and Institutional frameworks exist each having reference to land degradation and/or SLM. However, there were both gaps and overlaps in jurisdictions and thus, duplication of efforts across Ministries and sectors, each of which addresses certain aspects of SLM. An added dimension was that since 2013, Kenya adopted the devolved system of Government, and counties are yet to make their respective laws and policies. This is an opportunity to mainstream SLM in decision making at county levels. Emerging issues such as invasive species, biopiracy, petroleum mining, new infrastructure and insecurity were not adequately captured in the policies, legislation and institutional frameworks. Another dimension is that most of the policies do not mention or link with customary laws (with the exception of the ASAL Policy). Kenya has 42 ethnic communities, most of which have good customary laws that have tenets of environmental protection. These should be factored in national and county policies and development plans. There are gaps in terms of addressing sustainable land management in rangeland systems. Furthermore, there is no one-stop institution in Kenya that hosts SLM as a dedicated focal issue. Also, the country has neither a policy nor a strategic plan for addressing SLM holistically. Such a framework would be useful as a tool for policy advocacy, resources mobilization, investment planning, project targeting as well as responding to emerging issues and opportunities. The

37
prospects for a Kenya SLM Investment Framework (KSIF) are viable given that national policies already support such ventures. SLM is addressed variously by the Ministries of MoALF, MENR, MWI and the Ministry of Lands. However, the fragmentation of sectoral laws and conflicting institutional mandates is one of the main constraints to scaling up SLM. The development of a policy for the SLM sub-sector was thus recommended.
(iii) Cost benefit analysis of sustainable land and water management in three
water catchments of Kenya (Cherangani, Kinale-Kikuyu, Taita) The main objective of the study was to increase public and private investments in Sustainable Land Management (SLM) in Kenya, through demonstrating the economic benefits of SLM. Specifically, the study was to demonstrate the potential benefits and scope of SLM to reverse degradation in ecosystems that are key to overall national development. The study utilized field visits and household surveys to gather data using a probability-based approach. The base information was obtained from the 2009/2010 population census data of the Kenya National Bureau of Statistics (KNBS). A total of 388 households in the three study areas were interviewed using a pre-tested questionnaire. SLM practices included in the analysis comprised of (i) Agronomic measures such as conservation agriculture, manuring/composting, mixed cropping, contour cultivation, and mulching (ii) Structural measures included terraces, banks, bunds, constructions and palisades and (iii) Management measures such as land use change, area closure and rotational grazing. Economic and financial analysis of the selected SLM practices was undertaken to arrive at their Net Present Value (NPV) and Internal Rate of return (IRR) using a discount rate of 12% over 30 year period. The study demonstrated that the benefits accruing from adoption of SLM practices by the farmers exceed the costs incurred in installing/establishing the SLM structures in the long run. The benefits arose mainly from improved productivity of the crops in the three areas leading to increased incomes of the farmers. Different farmers, regardless of sites, adopted SLM practices based on individual decisions and peculiarities of their farms. However, terracing was the most common SLM practice in all the catchments and among many farmers. The study confirmed that availability of markets for products as an incentive to farmers to adopt SLM practices. Gender differentiation of the results showed that female farmers favoured SLM practices that would enhance their access to household needs like water and fuel (charcoal and firewood). Male farmers, on the other hand, chose low-maintenance practices like terraces and cut-off drains. The Net Present Value (NPV) of the SLM practices was much greater than zero indicating SLM practices are profitable when they are complementary. In particular, use of soil and water conservation (SWC) structures and reinforcing

38
them with agroforestry practices was found to be profitable. The economic analysis showed that adopting SLM practices over a 30-year and at a discount rate of 12% leads to a total NPV of KShs.1,037,267, KShs.778,490 and KShs.192,644 per hectare/year in Kinale-Kikuyu, Cherangani and Wundanyi respectively. Therefore investment in SLM practices was found to be economically viable as they enhanced productivity, improved food security and e ecosystem sustainability.
(iv) Report on public expenditure review and resource mobilization strategy for
sustainable land management in Kenya The report presented findings of a study on resource mobilization mechanisms and public expenditure for SLM in Kenya over the period 2010-2015. The study also covered two other issues: innovative sources for raising funding for SLM; and the case and steps to be taken to develop an SLM Monitoring and Evaluation (M&E) framework in the country.
On funding and resource allocation mechanisms, the main SLM activities are covered under two Medium Term Expenditure Framework (MTEF) clusters - the Agriculture and Rural Development (ARD) and the Environment, Water and Natural Resources sector. The report also noted that there were many projects in the sector. Out of the 207 projects that were being implemented in the sector during FY 2010/11 to FY 2014/15, about 95 projects had one or more SLM components. Despite this, the SLM development budget as a proportion of the total government development budget steadily declined from 32.5 percent in 2010/11 to 14.0 percent in 2014/15. There has also been shift in sources of funding with government contribution to SLM investments declining from 57 percent to 53 percent while the donors’ contribution has increased from 43 percent to 47 percent during the period under review. The relatively larger GoK funding as compared to the development partners is attributed to large government funding for national water and irrigation projects. As a result the financing gap for SLM has widened from KShs.109.3 billion in 2010/11 to KShs.145.5 billion in 2015/16. To close the growing gap, the report recommends among other measures: raising the profile of SLM interventions and linking them to national food security and environmental management issues; Tapping and enhancing SLM allocations at county level; and focus on attracting more funding from innovative funding mechanisms such as conservation trust funds, payment for eco-system services (PES), Green Water Credits, and Eco-labeling of products. Among the reasons cited for declining resources for SLM is lack of a clear institutional coordination framework and champion(s) of SLM. Information on SLM is scattered over many institutions and projects in the sector making it difficult to document or attribute impacts of various SLM interventions. This impairs visibility and appeal for funding SLM. The report therefore recommends establishment of a well-resourced Secretariat to be responsible for knowledge management and advocacy for the sector. The report also presented guidance for

39
the development of a sector M&E on which actors would base their activities. Apart from being the custodian for SLM information, a key task for the proposed Secretariat is therefore to develop and operationalize an M&E framework.
(v) Study on Payment for Ecosystem Services (PES) for Sasumua Reservoir
This report presents the findings of a study that was commissioned by MENR to undertake a situation analysis on PES for Sasumua catchment, which is in the Aberdares. The study was meant to establish baseline context on which to identify and document socio-economic and hydrological variables to benchmark and inform subsequent processes for instituting and measuring PES impacts. The Sasumua reservoir is an important national asset at it provides about 20% of water to Nairobi. It is surrounded by agricultural land, a forest reserve and national park. Agriculture provides livelihood to about 91% of the population and with a density of 200 persons/Km2, pressure on land is high which combined with poor agricultural practices, has resulted in soil erosion and other environmental challenges. Due to its nearness to the farmlands, the Sasumua reservoir is exposed to heavy sedimentation and water quality deterioration from farmlands soil erosion, roads runoff and landslides in the forest areas. The report indicated that farmers were generally willing to invest in soil and water conservation measures but were inhibited by high cost of installations. It notes that policy and institutional framework existed to support implementation of PES. However, while there were many sellers (farmers) for environmental services, but only one potential buyer – Nairobi City Water Sewerage Company (NCWSC). It therefore recommended a pilot phase in which the farmers represented by Water Resource Users Association (WRUAs) and public interest by government as a buyer of environmental services in a PES scheme.
3.3 Gaps and Bottlenecks in SLM Implementation 3.3.1 Technology gaps Despite the existence of many research centers, universities, NGOs and other institutions, technologies for SLM adoption by land users have remained elusive. In the agriculture sector, the collapse of the extension services through attrition and employment freeze since the 1990s has resulted in scanty extension services reaching farmers. The strength of extension lies in the ability to deliver new and well packaged information related to specific enterprises to beneficiaries and farmers. Moreover, different types of land-users require diverse and complex information to support investment in modern SLM technologies and production systems. This is often scarce and varies with enterprises and from one agro-climatic zone to the other. The private sector has also made inputs to extension services, especially for high-value marketable
40
produce, but these only reach commercial farmers, leaving the vast majority of poor farmers lacking sources of information. It is necessary to establish the required functions and review existing skills and experiences to support SLM functions, especially capacity building interventions. The types of technologies to handle flood management, solid waste, soil erosion, catchment protection and sustainable agriculture are still archaic and need to be improved.
3.3.2 Policy gaps While efforts have been made to promote SLM, there is no dedicated policy for SLM in Kenya. Policy issues touching on SLM are often conjoint and addressed in the context of other developmental priority areas like agriculture, water, environment and soils. Under such circumstances, priority setting with regard to effective implementation of SLM is limited by competition for resources between SLM priorities and other sectoral priorities. In this regard, there is need to raise the profile and publicity of SLM issues in order to be accorded the requisite consideration and weight for a dedicated policy.
3.3.3 Institutional gaps Although several institutions are engaged on one aspect of SLM or other, yet Kenya lacks a central coordinating mechanism for SLM investment in the country. However, the MoALF is the focal Ministry linking farmers to SLM, it does not host an affiliate institution (parastatal) dedicated to SLM issues. Both the Ministries of Environment and Water also handle various functions relating to SLM, which include; water allocation and management, irrigation, forestry, wildlife, agriculture and environmental restoration activities. But these are assigned to different institutions and ministries. This often results in duplication of efforts and inefficient use of resources. Implementation of SLM within the County governments is also complicated as each county tries to seek autonomy. Without clear coordinating mechanisms among these institutions, implementation of SLM in the country faces many challenges, hence the need for the KSIF coordinating mechanism.
3.3.4 Challenges with Monitoring and Evaluation Investments in SLM should be tracked and linked to key output areas in agriculture, environment, livelihoods and economic development. It is also necessary to quantify SLM impacts on attainment of national and regional development goals. However, there is no monitoring and evaluation framework to guide such a crucial exercise whose findings feed back into the investment loop to reinforce prioritization and promotion of SLM in the country. The KSIF addresses this issue by recommending an M& E for SLM which should be instituted and functionalized. An analysis of the key constraints and opportunities affecting SLM implementation is presented in Table 2.
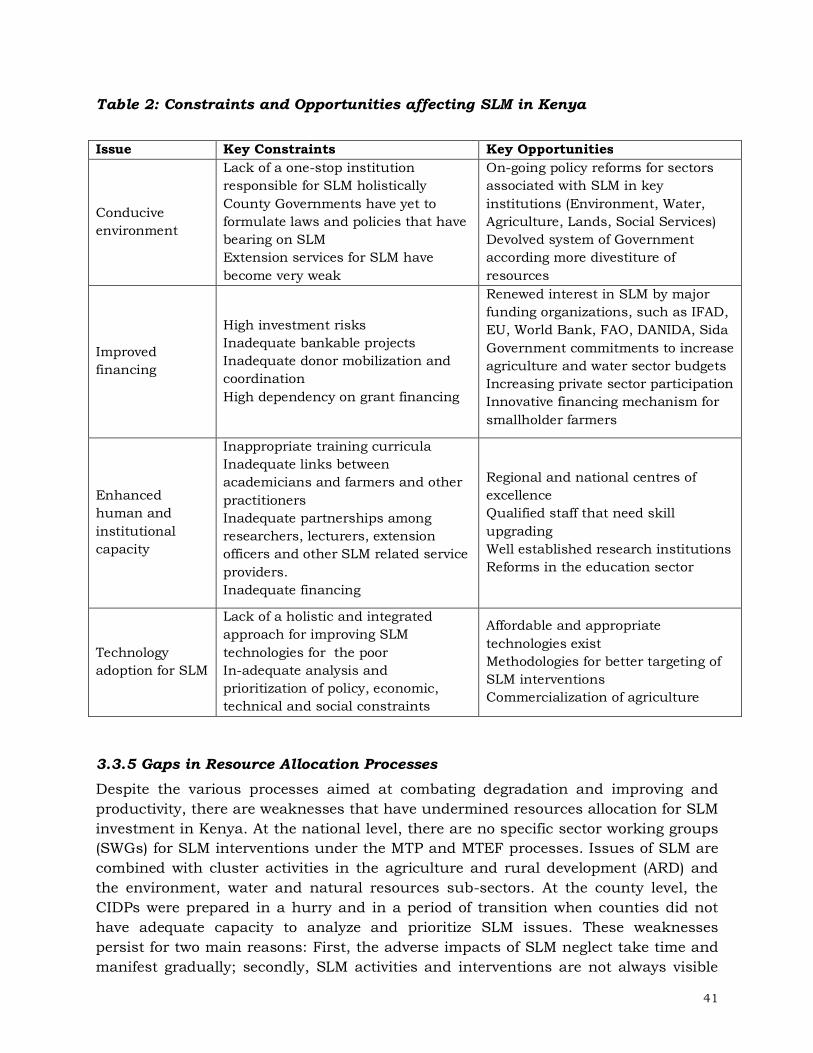
41
Table 2: Constraints and Opportunities affecting SLM in Kenya Issue Key Constraints Key Opportunities
Conducive environment
Lack of a one-stop institution responsible for SLM holistically County Governments have yet to formulate laws and policies that have bearing on SLM Extension services for SLM have become very weak
On-going policy reforms for sectors associated with SLM in key institutions (Environment, Water, Agriculture, Lands, Social Services) Devolved system of Government according more divestiture of resources
Improved financing
High investment risks Inadequate bankable projects Inadequate donor mobilization and coordination High dependency on grant financing
Renewed interest in SLM by major funding organizations, such as IFAD, EU, World Bank, FAO, DANIDA, Sida Government commitments to increase agriculture and water sector budgets Increasing private sector participation Innovative financing mechanism for smallholder farmers
Enhanced human and institutional capacity
Inappropriate training curricula Inadequate links between academicians and farmers and other practitioners Inadequate partnerships among researchers, lecturers, extension officers and other SLM related service providers. Inadequate financing
Regional and national centres of excellence Qualified staff that need skill upgrading Well established research institutions Reforms in the education sector
Technology adoption for SLM
Lack of a holistic and integrated approach for improving SLM technologies for the poor In-adequate analysis and prioritization of policy, economic, technical and social constraints
Affordable and appropriate technologies exist Methodologies for better targeting of SLM interventions Commercialization of agriculture
3.3.5 Gaps in Resource Allocation Processes Despite the various processes aimed at combating degradation and improving and productivity, there are weaknesses that have undermined resources allocation for SLM investment in Kenya. At the national level, there are no specific sector working groups (SWGs) for SLM interventions under the MTP and MTEF processes. Issues of SLM are combined with cluster activities in the agriculture and rural development (ARD) and the environment, water and natural resources sub-sectors. At the county level, the CIDPs were prepared in a hurry and in a period of transition when counties did not have adequate capacity to analyze and prioritize SLM issues. These weaknesses persist for two main reasons: First, the adverse impacts of SLM neglect take time and manifest gradually; secondly, SLM activities and interventions are not always visible

42
enough to the technical officers, policy makers and even the political leaders to attract attention that would lead to increases in the SLM budgetary provision. As a result, the financing gap for SLM has been widening (Table 3). Table 3: Financing gap for SLM
Financial Year 2010/11 2011/12 2012/13 2013/14 2014/15 2015/16 2016/17
Resource allocation 84.10 73.20 84.40 64.60 69.60 87.90 93.50
Resource requirement 193.4 197.60 211.05 217.65 220.75 233.40 248.05
Financing gap 109.3 124.40 126.65 153.05 151.15 145.5 154.60
Source: MTEF Sector Reports 3.3.6 The need for an Inter-sectoral coordination mechanism for SLM SLM has for years been addressed through individual projects and programmes hosted by Government Departments or NGOs, with little coordination or interaction of the actors, ideas or utilization of the lessons learnt. This has led to duplication of efforts and inefficient use of resources, as well as gaps that should not have existed. For several decades now, the implementation of SLM initiatives in Kenya has remained sectorized not only across Ministries but also across Departments within a given Ministry, as well as across other sectors such as NGOs, research institutes, private sector and multilateral agencies. For this reason, an inter-sectoral/inter-ministerial coordination mechanism is necessary for implementation of the KSIF. The sectors under which SLM is implemented will be identified and addressed in the KSIF. This is because SLM combines several interventions ranging from restoration of degraded lands, re-afforestation programmes, integrated water resources management, protection of biodiversity, environmental management and land use planning; including planned settlements (rural and urban). At national levels, some eight sectors can be delineated as having a direct bearing on land degradation and hence SLM, and which are factored in the KSIF. These include; (i) environment, (ii) agriculture, (iii) water, (iv) lands, (iv) infrastructure, (vi) people, (vii) finances/economy, and (viii) laws/ governance/ policy. Other indirect sectors include education, health, industry and trade.

43
4. KSIF PROGRAM DESCRIPTION The Kenya Investment Strategy Framework for SLM (KSIF) is designed, taking account of the country context, sector issues, the legislative, policy and institutional arrangements at the national and county levels, as well as the salient technological issues, gaps, priorities and visions. The Goal, Purpose, Development Objectives, Environmental Objectives, Guiding Principles, Outputs, Timelines, Components and Activities that constitute the KSIF are described. 4.1 KSIF Goal, Purpose, Objectives and Guiding Principles 4.1.1 Goal The overall goal of the KSIF is to provide a national level strategic planning framework, for guiding the inter-sectoral coordination, planning, prioritization and implementation of integrated approaches, and stimulating cost effective investments and budgetary support for SLM, thereby contributing to the attainment of Kenya Vision 2030 targets on economic development, food security and sustainable livelihoods. 4.1.2 Purpose The Purpose is to develop a programmatic Kenya Strategic Investment Framework (KSIF) for scaling up actions and investments for sustainable land management (SLM) in Kenya. 4.1.3 Development Objective The overall Development Objective of the KSIF is to restore, sustain, enhance and protect the productivity of Kenya’s natural capital through improved investments, sector coordination and scaling up of SLM interventions. The Specific Objectives of the KSIF include:
(i) Providing a national level strategic framework for planning, harmonization and implementation of SLM initiatives, programmes and projects in Kenya.
(ii) Providing strategic directions for enhancing investments for SLM in the country. (iii) Identifying opportunities for sector coordination, stakeholder participation,
capacity building, engaging partnerships and advocacy for SLM. (iv) Facilitating the integration of SLM into national, county and sectoral policies,
legislations, strategies and development plans. (v) Enhancing knowledge management, development, networking, common focus
and logical tracking of SLM initiatives. 4.1.4 Overall Environmental Objective The overall Environmental Objective of the KSIF is to rebuild Kenya’s natural capital assets by overcoming the causes and mitigating the negative impacts of land degradation, while also building long-term ecosystem sustainability, facilitating climate change resilience and environmental health.

44
4.1.5 KSIF Guiding Principles Implementation of a programmatic country SIF to combat land degradation and enhance the sustainable use and management of Kenya’s land resources (specifically its soils, water, minerals, flora and fauna) shall be based on the following key guiding principles:
1) Increased Land Productivity: The choice of SLM interventions shall encourage putting land to its most optimum productive potential through wise choice of enterprises (e.g. crop types/varieties, livestock, forestry, wildlife, mining, commerce and industry), as well as enhancing the productive capacity of each enterprise (e.g. soil fertility improvements, irrigation, improved seed, fodder production, marketing) and taking care of environmental concerns.
2) Poverty Reduction: Enhancing adoption of SLM shall be guided by the choice of most viable technologies, best practices and initiatives that facilitate increased productivity, poverty reduction and wealth creation for communities, while also addressing the labour burden, ergonomics, social and economic sustainability.
3) Ecosystem Sustainability: the management and exploitation of Kenya’s land resources shall be undertaken in a manner that upholds the maintenance and/or enhancement of essential ecosystems and ecological processes, biodiversity (natural flora and fauna as well as agro-biodiversity) and the natural resource base. Thus the technologies, practices and production processes used for sustaining and increasing crop, livestock and forestry production shall be designed to accord beneficial environmental impacts.
4) Economic Viability: the management and exploitation of Kenya’s land resources shall be undertaken in a manner that is economically viable and efficient (i.e. the benefits are commensurate with the costs) and which ensures that resources are utilized and managed in a way that will retain their potential to support future generations. This will include optimizing both the tangible and intangible economic benefits for the greatest possible number of people while ensuring, as far as possible, sustainability of the country’s natural resource base and ensuring that ‘public goods’ do not reduce the incentives for private investment in SLM.
5) Improved Financing: the implementation of the KSIF shall seek and facilitate sources of sustainable funding for SLM activities through innovative and viable means. This shall include (but not limited to) sourcing funding from the national and county governments, development partners, NGOs, private sector and through cost sharing by stakeholders to promote responsibility for resource management by local stakeholders.
6) Improved Livelihoods: the management and exploitation of Kenya’s land resources shall be undertaken in a manner that enables those, whose livelihoods are dependent on their utilization, to engage in a diverse range of livelihood activities that will meet their basic welfare needs (for cash, food,

45
water, fuel and shelter) while ensuring that the productive potential, and ecosystem functions and services, of these resources is restored, sustained and enhanced, thereby enabling them and succeeding generations, to use natural resources for meeting future livelihood needs.
7) Social and Cultural Sustainability: the management and exploitation of Kenya’s land resources shall be undertaken in a manner that: (i) is compatible with the culture and values of the people affected by it; (ii) increases people’s ability to control the utilization of their local resources and other factors that determine their livelihood opportunities; (iii) maintains and strengthens community identity; (iv) ensures that the costs and benefits of SLM are shared equitably between and within communities and individual households; and (v) encourages public private investment partnerships for implementation of SLM.
8) Institutional Sustainability: the implementation of SLM initiatives shall uphold institutional sustainability by supporting existing community-based organizations, non government organizations (NGOs), private sector and County government institutions, in the planning, implementation and monitoring of SLM activities and capacity development (skills, manpower, equipment, facilities and budget) to sustain the delivery of the services required from them.
9) Multi-Sectoral Approach: the KSIF shall be implemented through a multi-sectoral coordination mechanisms that ensures all sectors that impact on or are impacted by SLM are taken into consideration. These include; agriculture, land, water, forestry, health, trade, tourism, energy, mining, commerce and industry.
10) Participation and Inclusiveness: the implementation of the KSIF shall ensure a participatory and inclusive process and stakeholder involvement in all stages of planning, implementation and management of SLM, pursuing a holistic approach to ensure that components, people, planners and managers and beneficiaries interact at all levels.
11) Sensitivity to Gender, Minorities and Vulnerable Groups: the KSIF shall ensure the inclusivity both women and men, youth and people with disabilities in implementing various initiatives, to ensure inclusivity of all cadres of stakeholders. The SLM interventions shall target to reach minorities and vulnerable groups such as the landless and the poor, as these face certain limitations in tackling land degradation.
12) Knowledge Management and Decision Support: the implementation of the KSIF shall seek to add scientific and new knowledge in its decision support systems so as to improve efficiencies, cost-effectiveness and service delivery. A knowledge depository/portal, retrieval and dissemination system will be developed. The KSIF upholds research, science, technology and innovation in guiding and improving the SLM decisions and actions.

46
13) International Responsiveness: Kenya has ratified several international multilateral environmental agreements (MEAs), which have a bearing on SLM such as the United Nations Convention to Combat Desertification (UNCCD), Ramsar Convention on Wetlands, United Nations Framework Convention on Climate Change (UNFCCC) and the Sustainable Development Goals (SDGs). The KSIF interventions will contribute to the fulfillment of these MEAs.
4.1.6 Planned Outputs
A dedicated policy on SLM developed
An Inter-sectoral coordinating unit for SLM established and functionalized to facilitate inclusive implementation of the Strategy,
Programmes, projects and activities for scaling up SLM implemented,
The policy, legal, institutional frameworks and investments for SLM enhanced;
Capacity built of the institutions, actors and stakeholders to strengthen the technical, socio-economic and support services for SLM;
Research and extension for SLM utilized supporting implementation of SLM best practices
SLM knowledge management, M&E and information dissemination strengthened for adding value to tracking and improvements in SLM investments and interventions
4.1.7 KSIF Timelines The KSIF will cover a ten (10) year period, implemented in two, five-year phases, to coincide with the GoK medium-term planning framework (MTP), as follows:
Phase I: 2017 – 2022 (to coincide with the 3rd MTP under Vision 2030) Phase II: 2022 – 2027, (to coincide with the 4th MTP under Vision 2030)
The phasing approach will enable mid-term assessment and bringing on board emerging issues. 4.2 Geographic Priority Areas to Target the SLM Framework Kenya’s landscape, climate and land use systems have seen the country become ever more vulnerable to almost all forms of land degradation. The recent LADA104 study obtained that almost all the counties in Kenya are at risk from one form of land degradation or other. The problem is serious because high land degradation is likely to occur on about 61.4% the total area of Kenya, while very high degradation affects 27.2% of the land (see Annex 6.1). However, in terms of severity and the apparent risks, the spatial distribution of land degradation hot spots in the country were
104 MENR (2016). Land Degradation Assessment in Kenya: Based on a Study of Land Degradation Assessment (LADA) with
Remote Sensing and GIS, for Sustainable Land Management (SLM) in Kenya. Republic of Kenya, Ministry of Environment and Natural Resources (MENR), Nairobi.

47
determined by considering the topographic, agro-climatic, land use and socio-economic factors such as poverty. Based on these criteria, some Five (5) broad types of hot spots are targeted for SLM interventions in the country, geographic grouped as:
(i) The water towers (including ASAL water towers) (ii) Smallholder rainfed agricultural areas (iii) Rangelands in ASAL areas (iv) Flood-prone areas, and (v) Urban and peri-urban areas undergoing rapid land conversion.
These geographic hot spots cover large areas, and the selection of areas to target the SLM interventions were identified using the criteria shown in Table 4. Table 4: Geographic Hot Spot and Selection Criteria for SLM Target Areas Geographic hot spot Issues Sticking points for Selection of Target Areas
1) Water towers (including ASAL water towers)
Threats: Deforestation, loss of biodiversity due to human
encroachment, charcoal burning, poaching Water towers also host large numbers of farmers, who grow crop and keep livestock, and often use the forest resources
Opportunities Protection of water sources and biodiversity. ecological balance (including carbon sequestration)
Selected areas Forest margins in the five major water towers (Mau Range, Aberdares, Mt. Kenya, Mt. Elgon, Cherengani)
ASAL water towers and (e.g. Mt. Marsabit, Mt. Kulal, Mathews Range, Nyiru and Ndoto mountains)
Major hills (e.g. Taita Hills, Tugen Hills, Nyambene) Riparian lands.
2) Smallholder rainfed agricultural areas
Threats: Aridification (water degradation), soil erosion, loss of soil fertility
Opportunities Targets high population densities Need to intensify agriculture sustainably Targets food security, cash crops, mixed farming
Selected areas Agricultural areas covering agro-climatic zones II – IV
3) Rangelands in ASAL areas
Threats: Loss of vegetative cover, biodiversity degradation, soil erosion, charcoal burning, invasive species Water scarcity (poorly distributed water resources) Recurrent droughts and prolonged dry spells Floods also occur in some ASAL areas
Opportunities Covers vast areas of Kenya’s land Natural vegetation and biodiversity (natural gene bank) Zone hosts most of the national parks (strategic heritage) Growing demand for livestock products (milk, meat, skins) Infrastructure development to improve livestock marketing Irrigation (could be extended to cover livestock) The floods which occur in some areas could be harnessed

48
Selected areas Rangeland areas in agro-climatic zones IV-VII
4) Flood-prone areas
Threats: Flooding (water degradation), Loss of soil fertility Destruction of lives and property, including infrastructure
Opportunities Flood water can be harnessed and used in agriculture and other water supplies
Selected areas Lake Victoria Basin, Lower Tana Basin, parts of Athi River basin, and parts of Ewaso Ng’iro North Basin and flat areas in northern Kenya.
5) Urban and Peri-urban areas prone to Land conversion
Threats: Land conversion (from unplanned settlements) Chemical degradation-Industrial effluents, solid waste, waste-water and air pollution
Opportunities Urbanization creates market demand for food Programmes with a “green” component can be supported by urban funding
Selected areas All 47 cities/towns that are headquarters of County Governments and urban areas with populations exceeding 100,000 as per 2009 population census.
4.2.1 The Water Towers/Forest areas (including ASAL water towers) The term “Water Towers” in Kenya refers to the major mountains and highlands of the country, having relatively humid climates, and the sources of major perennial rivers. The five major water towers therefore specifically refer to Mt. Kenya, the Aberdares, the Mau escarpment, Cherangani/Tugen Hills and Mt. Elgon (Annex 6.2). Other smaller water catchment areas include several hills and highlands, such as the Chyulu, Iveti, Nyambene, Manga, Maragoli, Ngong, Shimba and Taita Hills. The term “ASAL Water Towers”, carries relatively the same meaning, i.e. “major highlands and hills in the arid and semi-arid lands (ASAL) of Kenya, which are sources of rivers and/or ephemeral streams and having natural features and ecosystems which are different from the surrounding lowlands”105. These include Mts. Marsabit, Kulal, Ndoto, Nyiru, Mathews Range and other dryland highlands. Most of the water towers in Kenya have been affected by rapid destruction of vegetative cover as a result of encroachment of human activities. The issues for water towers and forests are summarized in Box 1.
Box 1: SLM Issues in the Water Towers/Forest Areas
Why is the zone important? The water towers contain Kenya’s water catchment areas as well as forests, some of which are protected areas. Kenya’s forests are estimated to contribute to 3.6% of Kenya's GDP106, excluding charcoal and direct subsistence uses. Forests also support most of the productive and service sectors in the country, particularly agriculture, fisheries, livestock, energy, wildlife, water, tourism, trade and industry that contributes between 33% to 39 % of the
105 Assessment of Ecosystem Services in Kenya’s ASAL Water Towers (Marsabit and Samburu).Food and Agriculture
Organization of the United Nations (FAO); Kenya Country Office. Consultancy Report, 2016. 106 National Forest Policy (2014). Republic of Kenya

49
country's GDP. Biomass from forests comprises about 80% of all energy used in the country. In addition, forest products support a thriving industry which includes pulp and paper, timber, wood products, furniture and joinery, building and construction materials. The water towers also are home to large numbers of farmers, hunter gatherers, herders and others (e.g. tree loggers) who make use of forest resources sometimes unsustainably. Trees also facilitate the rehabilitation of degraded lands, leading to improved environments and ecosystem recovery. Forests also act as carbon sinks, providing an opportunity for the country to benefit from international carbon markets. Land Degradation Impacts & Drivers Deforestation in Kenya’s water towers is estimated at 50,000 hectares annually, with a consequent yearly loss to the economy of over USD 19 million107. This threatens the supply of more than 70% of the country’s water supply, resulting in a reduction of water availability by close to 62 million cubic meters, which in turn leads to loss of irrigation and hydro-electric power potential. Degradation translates to a rise in the cost of water treatment, and increased incidences of water-borne diseases. Other challenges in the water towers include; population pressure resulting in forest excision for settlement, illegal logging and charcoal burning. Thus, environmental degradation has been increasing, the rivers are polluted and the dams are silting up very fast. High sediment loads of between 1,000 and 5,000 t/km2/yr have been documented at major gauging stations. Other issues that contribute to catchment degradation include excessive abstraction of surface and groundwater, soil erosion causing turbidity and siltation, high nutrient levels causing eutrophication of lakes, dams and pans and pollution from toxic chemicals, including pesticides and heavy metals. SLM Practices with Potential Since the water towers host both protected lands (natural ecosystems) and human settlements, especially smallholder farmers (agro-ecosystems), interventions must target both types of ecosystems. This means protecting existing forests and catchment areas from further degradation and restoration of those already degraded. Interventions include; afforestation programmes, farm forestry and agroforestry. Planted forests facilitate the recovery of forest resources and commercial use of forested areas. Forests shield the soil surface from heavy rainfall and reduce the rate of runoff by increasing infiltration. Forests decrease flooding, mitigate soil erosion and limit the sedimentation of rivers and reservoirs. Other interventions include water harvesting structures (to increase catchment storage and reduce flooding), revegetation of riparian lands and protection of wetlands. Soil and water conservation measure in the cultivated areas also contribute to securing water towers form further degradation. Also, providing alternative energy, e.g. developing micro and pico-hydropower to ease pressure on wood-based fuels (firewood, charcoal), use of biogas and subsidies for other energy sources such as LPG, so as to reduce pressure on wood-based energy sources. Counties in Target Zone Kirinyaga, Meru, Embu, Nyeri, Tharaka-Nithi, Kiambu, Nyandarua, Muranga, Kakamega, Bungoma, Trans-Nzoia, Kericho, Bomet, Nakuru, Nandi, Elgeyo-Marakwet, Baringo, Marsabit, Samburu, Taita-Taveta, Kwale, Machakos. The Vision for this geographic area therefore is –Restoration of forest/ vegetation cover to enhance the hydrological and ecosystem functioning of water towers.
107 National Forest Policy, 2014
50
The agro-climatic zones to focus SLM interventions can be classified into in six broad categories as follows:
(i) The volcanic mountains and highland ranges: e.g. Mts. Kenya, Elgon, Aberdares, Cherangani and Mau;
(ii) ASAL water towers: Mts. Marsabit, Nyiru, Ndotos, Mathews, Kulal, Kabarnet, (iii) Southern hills: Taita Hills, Kasigau, Shimba Hills, Chyulu Hills, Nguruman. (iv) Coastal forests: Arabuko–Sokoke, Tana delta, Kayas, coralrag, mangroves.
4.2.2 Smallholder Rainfed Agricultural Lands Kenya’s agriculture108 is dominated by small-scale farms averaging 0.2–3 ha, which lie mainly in the high rainfall areas. The smallholder agriculture is responsible for 75% of agricultural production but this covers about 46% of the cultivated land (Annex 6.3). But smallholder rainfed farming systems face many challenges that require resolution through SLM and thus, are accorded attention through the KSIF, as shown in Box 2.
Box 2: SLM issues in the Rainfed Agricultural Lands
Why is the zone important? The majority of the farmers in Keya are smallholders located in the rural areas who cultivate land parcels about 2 hectares or less. A large number of these farmers cultivate areas on steep slopes and fragile soils which are highly susceptible to erosion. The farmers depend on already degraded lands to meet their food requirements. The ever increasing demand for food with an increasing population in Kenya but with stagnant or declining agricultural productivity has led to extensive land use systems109. Often, smallholder farmers expand their farming systems to new and sometimes fragile ecosystems, and lacking incentives, they engage in unsustainable farming practices that contribute to degradation of these areas. Thus, poor farmers are unable to invest in inputs such as fertilizers, manures, pesticides, machinery or irrigation, resulting in low agricultural production.
Land degradation impacts & drivers It is estimated that smallholder farming systems in the highlands of Kenya loose an equivalent of 112 kg N, 2.5 kg P and 70 kg K due to nutrient removals in form of crop harvest, leaching and soil erosion110. Poor soils result in reduced above ground productivity. It is obvious that poverty poses a major challenge as a contributing factor to degradation of smallholder farmlands. The cascade effects are loss of soil and its fertility, as well as increased sediment loading in rivers, dams and lakes, further affecting water resources.
SLM practices with potential Soil and water conservation; terraces, grass strips, stone lines, vegetative buffers
108 Government of Kenya, 2010. Agricultural Sector Development Strategy (2010–2020), Ministry of Agriculture. 109 Kiptoo, O.K. &Mirzabaev, A. (2014).Economics of Land Degradation in Eastern Africa.ZEF Working Paper Series No.
128.IFPRI. Germany: University of Bonn. 110 Smaling E.M.A., Stoorvogel J.J., Windmeijer P.N. (1993) Calculating soil nutrient balances in Africa at different scales: II
County scale. Fertilizer Research 35:237‐250

51
Integrated soil fertility management, manures, cover crops, mulching, crop rotations Conservation agriculture- minimum tillage, stubble mulching, spot tillage, strip cultivation,
deep tillage Rainwater harvesting; retention ditches, micro-basins (e.g. zai), pitting systems, Runoff diversion with supplemental irrigation; spate Irrigation, road runoff harvesting Agroforestry systems and tree planting, including woodlots, hedgerow intercropping Protection of riparian lands and wetlands e.g. pegging and planting grass or trees
Counties in Target Zone Baringo, Bomet, Bungoma, Busia, Elgeyo-Marakwet, Embu, Homa Bay, Kakamega, Kericho, Kiambu, Kilifi, Kirinyaga, Kisii, Kitui, Kwale, Laikipia, Machakos, Makueni, Meru, Migori, Muranga, Nakuru, Nandi, Nyamira, Nyandarua, Nyeri, Siaya, Taita-Taveta, Tharaka-Nithi, Trans-Nzoia, Uasin-Gishu, Vihiga. The Vision for this land use category therefore is – Improved soil and water management for increased agricultural productivity while sustaining vital ecosystems.
4.2.3 Rangelands in ASAL areas Rangelands cover about 70% of the total area of Kenya, and host most of the livestock (Annex 6.4). Extensive grazing has remained, and will continue to be a major source of livelihoods for pastoralists and agro-pastoralists in the rangelands of Kenya111. But most of the rangelands are in the ASALs where pastoralists and agro-pastoralists face competition from increasing influx of farmers from the overcrowded high rainfall areas. The excessive pressure on the vegetation in Kenya’s rangelands faces an onslaught from both land excision for agriculture as well as increasing livestock densities on the ever dwindling land space left for grazing. This has adversely affected the production potential and carrying capacity of Kenya’s rangelands. Rangeland degradation is manifested by the losses of vegetation cover and increase in proportion of bare soil surface. The loss of vegetation cover and increased erosion can be attributed to livestock overgrazing. The main issues impacting on land degradation and SLM in ASAL zones is summarized in Box 3.
Box 3: SLM issues in Rangelands in the ASAL areas
Why is this zone important? Most of the rangelands are located within the ASALs, which in turn cover over 84% of total land mass of Kenya. The ASALs are characterized by low, erratic rainfall, high evapotranspiration rates, poor soil fertility and few water resources. Due to these factors, land degradation is particularly severe in the ASAL rangelands as the soils are highly erodible and natural vegetation is scanty due to a combination of harsh climate and overgrazing. Tackling the effects of regular droughts (including climate change), soil erosion, aridification, loss of biodiversity and food insecurity are major challenges to be overcome in these zones.
111 Republic of Kenya (2012).National policy for the sustainable development of northern Kenya and other arid lands.
Ministry of State for Development of Northern Kenya and other Arid Lands. Sessional Paper No.8 of 2012

52
Land degradation impacts & drivers The growth of the pastoralist population and subsequent increase of the livestock population have led to the extension of grazing activities into semi-arid marginal lands and forests, causing severe degradation and declining livestock productivity. Overgrazing in the drier areas is most evident around watering points and settlement areas which are denuded. This leads to depletion of the natural grass seed banks such that even when good rains occur, grass or other palatable vegetative material rarely regenerates. Sometimes herders graze livestock within protected areas, while poorly planned settlements have blocked wildlife migration corridors causing human-wildlife conflicts. The reduced space for migratory pastoralism has led to semi-settled adaptation by pastoralist, conversion into agro-pastoralists and overgrazing has escalated leading to denudation of vegetation and thus land degradation. SLM practices with potential Water harvesting – Small dams, weirs, ponds, pans, tanks, underground cisterns,
infiltration galleries Runoff harvesting for soil moisture conservation to grow trees, grasses/fodders – semi-
circlular bunds, basins, pits, ditches, road runoff harvesting Contour bunding/ contour strips to improve infiltration which can be mechanized Controlled grazing – rotational grazing and de-stocking Reseeding rangelands.
Counties in Target Zone Baringo, Elgeyo-Marakwet, Garissa, Isiolo, Kajiado, Laikipia, Lamu, Mandera, Marsabit, Narok, Samburu, Tana River, Turkana, Wajir, West Pokot, Tharaka-Nithi, Makueni and Kitui. The Vision for this land use category is: – improved water supply/ availability to pastoral communities, increased vegetative/ biomass cover and reduced conflicts in resource use. 4.2.4 Flood-prone areas Large areas of Kenya are at risk of flooding which results in soil erosion, loss of property and even lives. Floods have increasingly become a major threat to life, property and the environment, a factor associated with land degradation and climate change. All the six major drainage basins in Kenya experience floods in one way or another, although at different magnitudes (Annex 6.5). Generally, the most flood-prone areas include the Lake Victoria basin, along the lower Tana, Ewaso-Ng’iro North and parts of the Coast. The salient issues affecting land degradation and SLM in flood-prone areas are summarized in Box 4.
Box 4: SLM issues in Flood-prone Areas
Why is this zone important? There are some 21 sub-basins112 in Kenya that suffer regular flood disasters. These include; Lake Victoria North – Yala, Swamp, lower Nzioa Lake Victoria South –Kano Plain, Sondu River mouth, Kuja River mouth, Kisumu Rift Valley - Middle/Lower Turkwel, Lower Kerio, Nakuru, Narok, Mogotio
112 Republic of Kenya (2013).National Water Master Plan, 2030
53
Athi Catchment – Downmost Athi, Lumi River mouth, Nairobi City, Kwale, Mombasa Tana Basin – Lower Tana, Ijara Ewaso-Ngiro North - Middle/Lower Ewaso Ng'iro North, Wajir, Mandera, Isiolo
Land degradation impacts & drivers Floods lead to many problems, including causing damage to life and property, washing away of homes, bridges, roads and other infrastructure, as well as loss of crops and livestock. Also, floods spread diseases such as diarrhea in humans and Rift-Valley fever in livestock. For instance, flash floods in Narok and Homa Bay, landslides/ mudslides on Mt. Elgon, Kisii, and West Pokot have caused a lot of damage, including road accidents in Nairobi, Machakos and other areas. In one example113, floods in 2015 resulted in 112 deaths and 73 recorded injuries, while a total of 40,121Households (HHs) (240,726 people) were adversely affected, of which 17,254 HHs (103,524 people) were displaced. It was also reported that 4,100 head of cattle Were washed away by the flood waters, further exposing the already displaced families to loss of livelihoods and household income. Other effects of the rains countrywide include varied damage to public amenities such as schools and the destruction of farmlands in Mt. Elgon, Kirinyaga, Narok, Busia, Kisumu, Tana River, Trans Nzoia, Busia, and Bungoma counties. SLM practices with potential Flooding can be reduced or mitigated through structural measures such as dykes, dams, retarding ponds, river training, urban drainage measures and water harvesting with small storages upstream. It also incorporates the concept of using the natural retarding effects of lands subject to frequent floods such as pasture management. Counties in Target Zone Kisumu, Busia, Homa Bay, Tana River, Kwale, Marsabit, Isiolo, Garissa, Mandera, Wajir, Narok, Lamu, Nandi, Machakos, Kisii, Uasin Gishu, Nyandarua, West Pokot, Trans Nzoia, Nairobi and Bungoma counties. The Vision for these areas therefore is – Prevention of flooding through improved catchment protection, proper land use, water control and drainage infrastructure.
4.2.5 Urban and peri-urban areas faced with rapid land conversion There is rapid urbanization in Kenya with rural to urban migration on the increase, as poverty in rural areas drives people into towns in search of employment. The need for housing has resulted in land conversion around urban and peri-urban areas, resulting in unplanned settlements. The grouping of human beings in small plots generates large quantities of both solid and liquid wastes which, when not properly disposed can cause pollution of water, air and the environment, resulting in disease. This has negative impacts on health of people as well as ecosystems. Urbanization and other related activities are responsible for poor water quality, pollution within and beyond the vicinity of the urban centres. The main issues affecting land degradation and SLM in urban and peri-urban areas are summarized in Box 5.
113 Emergency Plan of Action (EPoA) Kenya : Floods. Report by the International Federation of the Red Cross and Red Cross
Societies. 4 January, 2016. http://reliefweb.int/sites/reliefweb.int/files/resources/MDRKE036.pdf

54
Box 5: SLM issues in the Urban and Peri-urban areas Why is this zone important? Because areas surrounding major cities and towns are undergoing rapid land conversion from agricultural to unplanned settlements. This is driven by the fact that urban land is expensive when compared with land prices of the same quality in the rural areas. Thus rural people are selling their farmlands or converting them into residential or commeercial estates. The peri-urban areas suffer from lack of outright authority as existing institutions are not structured to handle the different land use changes. It is where government and local authorities’ responsibilities and mandates are sometimes not clear or sometimes in conflict. As such, there is poor oversight of human settlements, control of pollution and waste management. This results in environmental degradation and ecosystem loss with effluents and other pollutants becoming a menace. It is therefore necessary to include urban and peri-urban areas as a special category targeted by SLM interventions.
Land degradation impacts & drivers Water pollution is a major problem, especially in Nairobi, Mombasa and Kisumu, where
there is an increasing tendency towards inadequate waste water management. Expansion of slums/informal settlements due to rural-urban. For instance, Nairobi is
home to some of the largest slums in Africa, such as Kibera, Mathare, Korogocho, Viwandani, Sinai and others.
Waste collection and disposal is poor or non-existent yet there is increased generation of solid wastes in cities and towns.
Air Pollution is caused by factories, uncollected garbage, open sewers and heavy traffic. This has implications for ecosystems within and beyond the urban centers.
Most urban and peri-urban environs are over-crowded with buildings with little space and/or greenery for carbon sequestration, recreation or natural aesthetics.
SLM practices with potential Urban planning (factories, roads, housing, amenities) Green infrastructure- create green zones/ protected forests adjacent urban areas Waste disposal and management (solid waste, waste-water) Drainage of storm flows in a safe manner (isolate storm-water from sewers) Soil and water conservation (some urban areas are on hilly areas) Rainwater harvesting and storage (to reduce flooding, to augment water supplies) Support peri-urban agriculture with clean irrigation water (from stormwater or recycled) Reduce the high demand for charcoal by subsidizing other energy types (e.g. LPG).
Counties/urban centres in Target Zone All 47 cities/towns that are headquarters of County Governments and urban areas with populations exceeding 100,000 as per 2009 population census. The Vision for this land use category therefore is – Properly planned, developed and functional urban, peri-urban and settled environments in harmony with natural resource base and ecosystem resilience.

55
4.3 KSIF Programme Components
The KSIF has five Programme areas through which specific activities are proposed, to be implemented within the ten-year span of this Strategy. The Five Programme Components are:
Component-1: Implement on-the-ground projects and activities to promote and up-scale SLM;
Component-2: Enhance policy, legal, institutional frameworks and investments in SLM;
Component-3: Capacity building to strengthen the technical, socio-economic and support services for SLM;
Component-4: Support research and extension support for SLM best practices; and
Component-5: Strengthen SLM knowledge management, M&E and information dissemination.
These five components are described separately, and each has within it a number of sub-components. But promoting SLM requires a multi-dimensional approach as it involves a number of cross cutting issues and activities. Thus, each component should not be seen as stand-alone activity to be implemented in separate projects, but rather, most SLM project activities are expected to be multi-focal rather than sector specific and will include a blend of two or more components or sub-components. Gender mainstreaming will be a core component of the implementation of activities across all the components (the reason there is no component called ‘gender mainstreaming’). The range of projects and activities to be implemented under the auspices of the KSIF are presented within the main components and sub-components as follows: Component-1: Implement On-the-Ground Projects and Activities to Promote and
Up-Scale SLM This Component will support investments in projects and activities that facilitate the adoption, implementation and scaling-up of proven SLM technologies and best practices, bearing tangible impacts to land users and on the ground. The indicative budget for Component-1 is KShs.415.66 billion (US$4.1566 billion). (a) Objectives of Component-1 are to: 1) Curb and reverse the problems of land degradation and facilitate the recovery
and/or restoration of affected areas, 2) Reduce of rural poverty, food insecurity, environmental damage and vulnerability
to climate change and other weather shocks through SLM interventions, 3) Enhance the productive capacities and protective functions of Kenya’s diverse
natural resource base (land, water, biodiversity), 4) Scale up to a wider scale the best practices, technologies and initiatives that have
been proven to be successful in bringing about SLM benefits to relevant agro-ecologies, land use systems and people’s livelihoods in the country.

56
(b) Expected Outcomes of Component-1 The investment in SLM field activities (Component-1) will lead to the restoration, recovery and improvements in the productive capacity and protective functions of Kenya’s land resources, resulting in increased agricultural productivity, wealth creation, healthy environments and resilient ecosystems.
(c) Desirable Attributes of SLM technologies and Practices for delivering on Component-1
The KSIF proposes to promote SLM technologies, practices and approaches which: (i) Significantly influence improvements in agricultural productivity (crops,
livestock), and/or reduce the risks of crop failure, (ii) Are applicable to relatively large areas and/or adaptable by large numbers of
land users, with good scope for scalability, preferably having been tested in Kenya, sub-Saharan Africa or elsewhere,
(iii) Are technically viable, cost-effective, affordable, socially acceptable, relatively low risk, with consideration for labour efficiency and ecosystem resilience
(iv) Can be brought to scale with modest investments and having viable economic returns, e.g. high benefit-cost ratio
(v) Should not impact negatively on the environment and (preferably) can facilitate climate change adaptation/ resilience,
(vi) Should have good potential for increasing physical and economic water productivity, while also improving water availability and access,
(vii) Can be implemented in the context of integrated water resources management (IWRM), and
(viii) Accord sensitivity to gender equity, inclusivity of youth, minorities and vulnerable members of society.
(d) SLM Interventions under Component-1
Component-1 identifies the types of SLM technologies and best practices to be implemented at field level through the KSIF. Indeed there are hundreds114 of SLM technologies and practices to choose from, but only the most relevant in the Kenyan context have been proposed. Each project activity answer to the Guiding Principles of the KSIF (see section 4.1.5). In particular, field level SLM interventions will be identified, planned and implemented according to the principles and practice of community based participatory planning and management, as per the TerrAfrica Guidelines115. Thus, the proposed sub-components and project activities under Component-1 include:
114 Mati, B.M. (2007). 100 Ways to Manage Water for Smallholder Agriculture in Eastern and Southern Africa. SWMnet
proceedings 13. Nairobi, Kenya. www.asareca.org/swmnet/imawesa. 115 Sustainable Land Management in Practice – Guidelines and Best Practices for Sub-Saharan Africa. TerrAfrica, World
Overview of Conservation Approaches and Technologies (WOCAT) and Food and Agriculture Organization of the United Nations (FAO), 2011.

57
Sub-Component 1.1: Micro-Watershed Approach Target areas within the water towers and highland zones will be identified using the micro-watershed management approach. This approach identifies communities in a given sub-catchment and implements projects that have integrated water resources management (IWRM) approaches. This includes developing not only the physical structures, but also, the capacities of target communities will be built enabling them to undertake participatory micro-watershed management planning and overall watershed management. Beneficiary communities will be empowered to rehabilitate degraded areas and micro-watersheds. Transition to catchment based water resources management will be a major driving principal under this theme.
Sub-Component 1.2: Support Tree Planting (Farm Forestry and Agroforestry)
The KSIF will facilitate the re-greening of Kenya by adding value to the interventions by other actors (e.g. KFS, GBM, WRMA, MENR) who already support re-afforestation programmes and activities. The Strategy proposes to support farm forestry and agroforestry, particularly targeting smallholder land users (farmers, herders, peri-urban dwellers). This is because large sections of catchment areas and water towers are already inhabited and cultivated by smallholder farmers. Thus, farm forestry and agroforestry will help return some of the trees back onto the catchment areas. Furthermore, most of rural and poor households in Kenya depend on firewood or charcoal for fuel, much of it outsourced from forests and planted trees. Distribution of subsidized tree seedlings and tree nurseries are will form an entry point for this component. The strategy proposes to increase tree cover by an additional 10 million trees in the ten-year period, mostly as farm forestry, woodlots and agroforestry.
Sub-Component 1.3: Soil and Water Conservation (SWC) Programmes
This will involve promoting both structural and agronomic SWC measures. SLM structural technologies116, (sometimes referred to as engineering or physical measures), which include; various types of terraces (fanya juu, bench terraces, reverse-slope bench, orchard terraces), contour bunds, cut-off drains, artificial waterways, check dams and gully control. Agronomic conservation measures include installing grass strips, windbreaks, stone lines, trash lines and vegetative buffers. These interventions lead to a reduction in slope steepness and are carried out primarily to control runoff and reduce soil erosion, as they optimize infiltration and increase groundwater re-charge. These measures can be labour intensive when first installed, albeit they have low maintenance requirements. They are particularly amenable for use in smallholder agricultural systems across both humid and semi arid zones.
116 Mati, B. M. (2005). Overview of water and soil nutrient management under smallholder rain-fed agriculture in East
Africa. Working Paper 105. Colombo, Sri Lanka: International Water Management Institute (IWMI). www.iwmi.cgiar.org/pubs/working/WOR105.pdf

58
Sub-Component 1.4: Integrated Soil Fertility Management Improving soil fertility is an important component of SLM. This is because most agricultural soils in Kenya are deficient in phosphorus and carbon, hence fertilizers are usually required alongside manures. Farmers normally use small quantities of chemical fertilizers and/or farmyard manures, but generally, soil fertility replenishment is below required doses. This sub--component will upscale integrated soil fertility management (ISFM) through agronomic measures such as; conservation agriculture (deep tillage, stubble mulch tillage, strip cultivation), mulching, early planting, inter-cropping, optimum plant spacing, contour cultivation, composting, manure application, use of appropriate fertilizers and land husbandry practices that improve soil fertility and crop performance.
Sub-Component 1.5: Water Harvesting and Storage
Almost all parts of Kenya are subject high runoff flows which cause erosion damage and/or flooding, while the rainfall excess gets wasted in various sinks such as the ocean. This sub-component will support water harvesting initiatives in both the catchment areas as well as in the ASAL zones. It will support the planning, construction and where possible, rehabilitation of existing water harvesting and storage structures117 including; ponds, pans, tanks, underground cisterns, sand and sub-surface dams, small earth dams and weirs. It will also support the best management practices for the utilization of water for both economic (supplemental irrigation, livestock watering, commercial enterprises), social (e.g. drinking, hygiene, schools) and environmental services (growing trees, recharging groundwater aquifers). Depending on the type and design of the storage structure, many smallholder farmers may not afford. Therefore, subsidies are recommended for this sub-component. Generally, the added value from these rainwater storage systems can be very high and they offer great potential for poverty reduction, improving livelihoods and environmental recovery. In the ASAL water towers, the mountains and hills receive fogs and mists which provide a substantive amount of hidden precipitation. These mists can be harnessed through fog harvesting by using special equipment known as fog collectors, and this will be factored as a form of water harvesting.
Sub-Component 1.6: Runoff harvesting (Runoff farming)
Runoff harvesting for crop production, is the process of concentrating rainfall as runoff from a larger area for supplemental irrigation or conservation measures that ensure all rainfall infiltrates in the soil. It is called Runoff farming or “green water” because water is stores in the soil profile as soil moisture118. Water harvesting can be used to concentrate rainfall for purposes other than crop production. Runoff farming structures are of many types, the most common
117 Mati, B.M., Mulinge, W.M., Adgo, E.T. Kajiru, G.J., Nkuba, J.M. and Akalu T.F. 2011. Rainwater harvesting improves returns
on investment in smallholder agriculture in Sub-Saharan Africa. In “Integrated Watershed Management and Improved Livelihoods: Upgrading Rainfed Agriculture”. SP Wani, J. Rockstrom and KL Sahrawat (eds). Taylor and Francis, 249-279.
118 Oweis, T., Prinz, P. and Hachum, A. (2001). Water Harvesting. Indigenous knowledge for the future of the drier Environments. International Centre for Agricultural Research in the Dry Areas (ICARDA). Aleppo, Syria.

59
being; retention ditches (infiltration ditch, diversion ditch), road runoff harvesting, micro-catchment water harvesting systems – which include pitting, systems e.g. zai pits, micro-basins, semi-circular bunds, negarims and double-dug beds. However, these structure can be labour-intensive due to the tedious manual labour required to excavate runoff farming structures.
Sub-Component 1.7: Tools and Equipment for SLM Implementation
A major reason for the poor performance of agriculture in Kenya is due to lack of appropriate equipment, unavailable and/or inefficient energy sources and use of rudimentary tools such as the hand-hoe and animal-drawn plows. Aware that the use of rudimentary agricultural equipment and energy in Kenya is partly to blame for declining interest by youth and educated people in agriculture, improvements are thus needed as a precondition for widespread adoption of SLM technologies. This is especially aimed at reducing labour drudgery, improving labour productivity, efficiency and timeliness of SLM interventions. Improving the equipment, tools and energy to manage water and land (upgrade the hoe) e.g. walking tractors, push-pull weeders, manual or animal drawn planters, motorized auger-hole diggers, improved cultivators, and other equipment that require less manual labour, are needed. Improvements in farm equipment, tools and energy for water management have many benefits including saving time, reducing the labour burden associated with water harvesting activities such as digging zai pits or terraces, and which are partly the reason for the poor adoption of SLM technologies. This Strategy will support upgrading and promoting improved tools, equipment small machinery especially those for SLM activities such as digging holes for tree planting, mechanized trenching, conservation tillage and small excavators for water pans and other water harvesting structures. It is envisioned to be a private-sector led PPP initiative linking land users to affordable tools, machinery and equipment.
Sub-Component 1.8: Supplemental (small-scale) Irrigation
Supplemental Irrigation (or supplementary irrigation) is the application of small amounts of water to rainfed crops when rainfall is inadequate or during prolonged dry spells, to mitigate crop failure and/or to improve yields. It also includes spate irrigation119, which is a form of floodwater farming that utilizes flood flows from an area upstream of the cropped area. This Strategy targets to support smallholder farmers whose agricultural productivity is hampered by erratic rainfall, prolonged dry spells and climate change impacts. This will be through small-scale irrigation utilizing water harvesting as the main source of supplemental irrigation water. Supplemental and spate irrigation using harvested rainwater are opportunities that have remained largely been ignored in past programmes and which have the potential to revolutionize both agriculture and environmental conservation considerably, ensuring that crop failures from
119 Steenbergen, F. van., Lawrence, P., Mehari Haile, A., Faures, J.M., and M. Salman (2011). Guidelines on spate irrigation.
FAO, Rome.

60
prolonged drought are mitigated. The main objective is to bridge the moisture deficits that usually lead to crop failures or poor yields among smallholder farmers practicing rainfed agriculture, especially in the drier zones. To achieve this target, the Strategy supports construction of small pans, ponds and weirs at household and community levels. Increasing agricultural productivity also includes livestock and growing of feeds and fodders, which will also be enhanced through supplemental irrigation.
Sub-Component 1.9: Energy Saving Initiatives
This Strategy will support activities that reduce reliance on wood fuel and charcoal as household energy sources, as one way of conserving trees and forests. The activities to be promoted include facilitating adoption of subsidized energy-saving stoves (with efficiency improvements of at least 30-50% compared to traditional charcoal stoves) in homes and institutions. The Strategy will also support use of renewable energy e.g. adoption of biogas will be promoted to reduce the pressure on wood products. To promote sustainability of this intervention, local artisans will be trained in the fabrication of energy saving stoves and construction of biogas units. The Strategy also supports subsidies/reducing the cost of cooking gas (LPG), to the extent that LPG becomes cheaper than charcoal. That way, market forces will render charcoal trade irrelevant thus reducing pressure on biomass-based fuels. This is a viable option (it has worked in India) given the recent discoveries of petroleum and natural gas in Kenya and in the East African region. The KSIF will also facilitate the development of micro and pico scale hydropower sub-projects in the water towers, for village-level electrification thus relieving pressure on biomass-based energy.
Sub-Component 1.10: Integrated Rangeland Management Programmes
This will include; promoting sustainable livestock production by improving livestock breeds, management and marketing, reducing stocking rates through conservative grazing, controlled grazing by creating pastoral unions and transhumance corridors, area closure, rotational grazing, support to the growing agro-pastoralism, disaster management and preparedness and climate change adaptation and resilience programmes, revegetation of degraded rangelands including grass re-seeding, establishing forage trees along with grasses and legumes, thus enhancing biodiversity, improving the availability of livestock watering points. It is important to retain the protected areas as they suffer less from land degradation. Indeed most of the national parks and game reserves are in the ASALs and have lower degradation compared to surrounding grazing areas.
Sub-Component 1.11: Flood Control and Management
This Strategy supports improving the control, regulation and utilization of water in flood-prone areas and those having high water tables and water-logged soils. Although flood damage affects large parts of Kenya in both rural and urban

61
areas, few programmes have been implemented to provide a lasting solution to the problem. This Strategy therefore proposes to implement flood control and management interventions that are scientifically proven to work, and which have positive socio-economic and environmental impacts. These include structural measures such as river training, construction of dykes, water retaining ponds/dams, urban storm-water drainage systems as well as bed and furrow systems in agricultural lands. Other interventions will include awareness creation and capacity building in the management of flood waters and waterlogging soils.
Sub-Component 1.12: PES and Carbon Markets Schemes
There are a number of international and local incentive mechanisms that link tree planting and conservation activities to benefits for upstream land users and financial obligations for downstream water users. These include payment for ecosystem services (PES), voluntary carbon markets (VCM), carbon mitigation funds, REDD+, Water Funds and other benefit schemes. Kenya has already experimented with PES schemes showing they could be applied to encourage conservation and rehabilitation of the water towers. In the ASAL rangelands, financial incentives for ecosystem conservation programmes can also be implemented, modeled on pastoral unions and range rehabilitation programmes. This strategy will develop incentive mechanisms to support conservation of water towers modeled on successful experiences of PES schemes and water funds and carbon markets, e.g. the Green Climate Fund.
Sub-Component 1.13: Greening of Urban and Peri-Urban Areas
This will involve planning, controlling and managing the solid waste, wastewater - including storm water, generated in the urban and peri-urban areas. These wastes and effluents are polluting surface and ground water resources and the environment within and beyond the sources. Entrenching mechanisms for regulated urban and peri-urban agriculture, facilitating solid waste collection and disposal (includes recycling), waste-water management (includes disposal, cleansing, control of pollution e.g. through constructed wetlands) and urban water harvesting systems (includes safety and regulation of use). The Strategy supports activities in peri-urban areas that enhance environmental health and functional natural ecosystems. Under this component, this Strategy proposes that all 47 cities/towns that are County Headquarters and towns whose populations exceed 100,000 should allocate land and develop “Green Zones” dedicated to the greening of that city/town. The Green Zone will enhance carbon sequestration, acting as a carbon sink or “lungs” for that town. It will also provide a natural gene bank for conservation of biodiversity in that agro-ecology.
Sub-Component 1.14: Alternative Livelihood Interventions
These are projects/ activities which facilitate reducing pressure on forests, rangelands and other natural ecosystems. The Strategy proposes to support

62
small and light industries that enhance people’s talents and indigenous knowledge, to create non-destructive enterprises using the natural resources in their vicinity. The enterprises may range from agricultural activities such as; zero grazing units, keeping small ruminants, growing high value crops e.g. fruits, vegetables, spices, bee-keeping. Also, non-agricultural enterprises that support conservation efforts will be supported, e.g. ecotourism, brick making (to use bricks rather than wood for building), basket weaving, recycling of plastics (e.g. to make posts), garbage collection and recycling among others. Beneficiaries for these enterprises will be targeted at youth, the unemployed and vulnerable members of society.
SLM Interventions identified for Respective Target Geographic Zones
The SLM interventions described above will be implemented as sub-projects that will focus the activities taking cognizance of the clustering of the country into five geographic zones. This is meant for targeting the KSIF to tackle common challenges holistically. It is instructive that a single project would most likely combine two or more of the technologies /practices identified here (Box 6).
Box 6. Component 1: Technologies/Practices for scaling-up SLM in each Geographic Zone
Geographic hot spot
Recommended SLM Interventions for the Target Hot Spot
1) Water towers/ Forest areas (including ASAL water towers)
i. Micro-watershed approach in to implement IWRM ii. Farm forestry and Agroforestry iii. Soil and water conservation structures (terraces, contour bunds, cutoff
drains, infiltration strips, vegetative buffers) iv. Integrated soil fertility programmes (fertilizers, manures, Compost
making, cover crops) v. Water harvesting structures (weirs, small dams, ponds, pans, cisterns) vi. Energy saving stoves, biogas units, micro hydropower, subsidized LPG vii. Alternative livelihoods (eco-tourism, brick making, sustainable use of
forest products, e.g. bee keeping) viii. PES schemes and Voluntary Carbon Markets (VCM), Water Funds
2) Smallholder rainfed agricultural areas
i. Soil and water conservation structures (terraces, contour bunds, cutoff drains, infiltration strips, vegetative buffers)
i. Integrated soil fertility for croplands (subsidized fertilizers, manures, compost making, cover crops, mulching, CA)
ii. Water harvesting structures (weirs, small dams, ponds, pans, cisterns) iii. Runoff farming (semi-circular bunds, zai pits, micro-basins) iv. Supplemental irrigation – spate diversion v. Tools and equipment for SLM implementation (walking tractors, trenching
and pitting tools) vi. Farm forestry and agroforestry ix. Energy saving stoves, biogas units, subsidized LPG vii. PES schemes/Voluntary Carbon Markets (VCM), water funds
3) Rangelands in ASAL areas
i. Integrated rangeland management and rehabilitation (controlled grazing) ii. Revegetation of degraded rangelands (grass re-seeding)

63
iii. Erosion control structures (ditches, infiltration strips iv. Water harvesting structures (weirs, small dams, ponds, pans, cisterns) v. Runoff harvesting, runoff farming technologies vi. Alternative livelihoods (eco-tourism, use of invasive species to make
artifacts) 4) Flood-prone
areas i. Flood control structures (dykes, check dams ii. Runoff diversion and storage (canals, cut-off drains, dams, ponds) iii. Drainage of waterlogging soils iv. Water harvesting structures (weirs, dams, ponds, pans, cisterns) to off-
set floods upstream v. Supplemental irrigation/ spate irrigation to utilize flood waters elsewhere vi. Catchment protection works to protect downstream areas from flooding
5) Urban and Peri-urban areas prone to Land conversion
i. Developing green zones/protected forests and green infrastructure ii. Storm-water management (urban rainwater harvesting, storage,
cleansing and use (e.g. recycling, peri-urban irrigation, on green zones) iii. Water saving technologies (household, commercial, industrial) iv. Solid waste management (includes recycling) v. Waste-water management (includes disposal, cleansing, re-use) vi. Integrated peri-urban agriculture vii. Energy solutions to reduce dependence on charcoal and woodfuel viii. Alternative livelihoods (e.g. solid waste recycling, making artifacts).
Component-2: Enhancing Policy, Legal, Institutional and Investment Support This Component will identify and address the key barriers and bottlenecks to SLM within the policy, legal, regulatory, institutional and financial environment, and identify ways to improve investments for the SLM sector. The indicative budget for Component-2 is KShs.47.51 billion (US$475.1 million). (a) Objectives of Component-2 are to:
1) Establish an SLM inter-sectoral Coordination Platform which will provide a forum for strengthening collaboration, sharing information, joint planning and implementation of activities, with clear separation of roles and responsibilities.
2) Identifying the key policy, legal, regulatory, institutional and financial barriers and bottlenecks to SLM
3) Determine how these (policies, laws, institutions), should be addressed (identify which of these can be changed, what changes are required) to create the right enabling environment for the adoption and scaling up of SLM.
4) Identify the sources and investments for the promotion and scaling up of SLM, building on current efforts to take advantage of emerging opportunities.
(b) Expected Outcomes of Component-2 The reforms achieved through Component-2 will result in improved national, county and community level enabling policy, legal, regulatory, institutional and financial environment, as well as increased investments for the implementation and scaling up of SLM activities.

64
(c) Activities to be implemented under Component-2
The Activities to be undertaken under this component will seek to improve the enabling policy, legal, regulatory, institutional environment, as well as increased investment flows into the SLM sector. The main Activities under component-2 fall within the following four sub-component areas: Sub-component 2.1: Establishing inter-sectoral coordination mechanism for SLM
The formulation and implementation KSIF will be led by a Government Ministry (likely to be the Ministry responsible for natural resources/environment), as an apex institution that will guide the process. The Principal Secretaries (PSs) of the participating ministries which carry a mandate on certain components of SLM will take leadership of the process. Some seven ministries that fit this mandate include:
i. The Ministry responsible for natural resources (forests, wildlife, environment) ii. The Ministry responsible for agriculture and livestock iii. The Ministry responsible for water resources and management iv. The Ministry responsible for lands, settlements and urban development v. The Ministry responsible for finance /national treasury vi. The Ministry responsible for devolution/counties and planning. vii. The Ministry responsible for energy, infrastructure and rural development.
Each Ministry will then identify key Departmental Heads and respective parastatals to be enjoined in the Inter-Ministerial coordination. As an example, the SLM coordination mechanism may include NEMA, KFS, KWS as affiliate institutions into the KSIF inter-ministerial apex body. Other partners will include NGOs, private sector institutions, development partners including TerrAfrica partners in Kenya (e.g. World Bank, UNDP, IFAD, FAO, NEPAD).
Sub-component 2.2: Review and support for SLM policy environment The KSIF will facilitate the development, review and harmonization of policies, strategies, strategic plans and development tools that impact on or are impacted by SLM. In addition, counties which are formulating policies with bearing on SLM will be accorded technical backstopping through the KSIF, so as to develop SLM responsive policies and strategies and to accommodate of local contexts.
Sub-component 2.3: Review and support for legal and regulatory frameworks for SLM
The KSIF will facilitate the inclusion of SLM components in future laws and institutional frameworks implemented at national levels. It will also support counties through technical backstopping to develop their laws and bylaws that are facilitative of SLM at grassroots level.
65
Sub-component 2.4 – Identify mechanisms to upscale investments for SLM
This will entail innovative sourcing of investments, such as from development partners, funding institutions, banks, microfinance institutions, grant givers, loans and technical support for SLM.
Component-3: Capacity Building to Strengthen the Technical, Socio-Economic and Support Services for SLM
This component will facilitate capacity building of beneficiaries, implementers and stakeholders of KSIF projects and activities. This will entail imparting technical skills (knowledge) and improving operational capacity (manpower, budget, equipment and facilities) for scaling up of SLM best practices. This will be implemented through the various public and private sector agencies at national, county and community levels. The indicative budget for Component-3 is KShs.89.08 billion (US$890.8 million).
(a) Objectives of Component-3 are to: 1) Improve the technical and managerial skills, as well as the operational capacities
of individuals, communities and professionals in both the public and private sector for the implementation and scaling up of SLM best practices.
2) Mainstream the concepts and principles of SLM within the development plans, strategies and activities of key stakeholder institutions providing planning, implementation, funding, advisory and other support services to land users.
3) Improve the institutional capacities of stakeholder organizations in both public and private sector to facilitate implementation of best practices for SLM.
(b) Expected Outcomes of Component-3 The expected outcome from component-3 will be improved human and institutional capacities for planning, implementation, advisory and other support services at the national, county, watershed and community levels leading to wider adoption and implementation of SLM best practices. (c) Activities Implemented under Component-3
This component will be achieved through some seven (7) sub-components as follows:
Sub-component 3.1: Building the capacity of the land users: This sub-component will entail building the technical capacity of land users (farmers, herders, fishers, hunter-gatherers, urban and peri-urban dwellers) on SLM best practices. This will be achieved through (i) identifying knowledge gaps in SLM technologies, practices and approaches, (ii) determining the impediments to SLM investments at farm level; (iii) design and appraise SLM-relevant training projects/activities that address these needs (iv) implement innovative training and extension programmes for land users, targeted for local contexts and needs.
66
Sub-component 3.2: Building the capacity of the policy makers
This sub-component will focus on building capacity of the national, watershed and county level government policy makers, development planners and practitioners. The aim is to mainstream the concepts and principles of SLM into the national, watershed and county level strategic development plans and policies. This will entail awareness raising activities designed to sensitize officials, policy makers and relevant stakeholders on technological, socio-economic, political and environmental tenets of SLM. It will include; (i) Conducting a needs assessment of the knowledge gaps and capacities among policy makers, decision makers and other support agents of SLM; (ii) Implementing awareness raising and capacity building activities to address these needs,; and (ii) Providing institutional support e.g. transport, office equipment, staff, field equipment such as soil assessment gadgets, so as to facilitate the technical oversight expected of them for planning, implementation and M&E of SLM initiatives.
Sub-component 3.3: Building the capacity of extension service providers
This sub-component will build the capacity of national, county, watershed and community level extension (advisory) workers and other “knowledge support agents” relevant to SLM. It will also (i) support community-based participatory SLM planning and technology development; (ii) support training and re-training of extension workers on SLM technologies and best practices; and (iii) Support developing extension service provision modeled on use of ICT technologies.
Sub-component 3.4: Capacity building for research support service providers
This sub-component will focus on building the technical skills (knowledge) and operational capacity (manpower, budget, equipment and facilities) amongst the research institutions engaged as partners in KSIF implementation. They will be supported to undertake adaptive and participatory research with land users to identify locally appropriate SLM solutions. Many good aspects of SLM practiced on other parts of sub-Saharan Africa have not been tested in Kenya. This sub-component will therefore support applied participatory research, which meets identified knowledge gaps and has practical applicability in the local contexts.
Sub-component 3.5: Capacity strengthening of equipment and input suppliers
This sub-component will focus on improving the tools, equipments and inputs for SLM. It will be implemented through PPP arrangements by working closely with the private sector. The main activities include; (i) supporting the local manufacture of affordable machinery, tools, equipment and inputs (e.g. sub-soilers, tined tools, compost making) (ii) Awareness creation and equipping traders with knowledge to make/purchase improved tools, equipment and inputs that enhance SLM (iii) Linking traders and input suppliers with land users e.g. through ICT platforms; (iv) Support services to ensure that tools,

67
equipments and inputs for SLM are made available within close proximity to land users (in small market centres); and (v) Advocacy to encourage the Government to subsidize machinery, tools, equipment and input for SLM work.
Sub-component 3.6: Improving Access to Credit and Financial Services for SLM: This sub-component will focus on improving access to credit and financial services for supporting SLM work. This will entail strengthening and expanding linkages between land users and micro-finance, banks and other investment institutions. Where appropriate, efforts will be directed at establishing innovative, community-based savings and credit schemes, owned and operated by land users to support their SLM work.
Sub-component 3.7: Strengthening commercial and alternative livelihood options
This sub-component will facilitate linking SLM to the agricultural and commercial value chain, so as to stimulate income generating activities. It will support improvement of market linkages through which communities can sell of their agricultural produce, livestock and allowable forestry products. It will also include value addition of agricultural produce (e.g. packaging of legumes and honey, hay making) so as to facilitate small scale industries and creation of alternative livelihood options. The component will also facilitate improving access to, and use of, market information through ICT and other media.
Component-4: Supporting Research and Extension for SLM Best Practices This component is intended to contribute to improved knowledge on SLM technologies, practices, approaches, including the socio-economic and institutional contexts. There is need for scaling up and scaling out the lessons learnt and thus the use of research, science and innovation in informing the implementation process. Thus, research, science and technology are necessary for informing SLM best practices and to enable reaping optimum benefits for land users and the environment. The indicative budget for Component-4 is KShs.23.76 billion (US$237.6 million). (c) Objectives of Component-4 are to:
1) Seek solutions to the land degradation constraints facing communities and ecosystems (technical, policy, social-economic)
2) Provide improved and innovative knowledge to facilitate implementation of SLM best practices (technologies, approaches)
3) Upgrade the extension services for SLM taking cognizance of the inter-sectoral implementation of KSIF.

68
(d) Expected Outcomes of Component-4 The expected outcomes from component-4 include; scientific and innovative SLM technologies, practices and approaches implemented, facilitating improved land productivity, livelihoods and sustainable environments.
(c) Activities Implemented under Component-4
This component will be achieved through some three (3) sub-components as follows: Sub-component 4.1: Participatory Action Research to Inform SLM Best Practices:
This component will identify a number of SLM challenges facing land users that require research solutions, as well as new and emerging technologies that require local validation before they can be upscaled. The component will support participatory action research that has relevance to local conditions, implemented preferably within target watersheds, and with the involvement of communities and relevant stakeholders. Topics for research will include among others; management of problem soils, flood control, improving agricultural productivity sustainably, improving water resources, catchment protection, pollution control, waste management/recycling, water harvesting and conservation technologies, recouping investments from SLM, socio-economic studies and the wise use of resources.
Sub-component 4.2: Support land users to conduct on-farm trials on SLM
This component will work with land users (farmers, fishers, herders, traders) at community level facilitating simple experimentation and on-farm trials of SLM technologies and issues. It will also enhance record keeping and tracking of farm level activities and outputs. Land users will be supported through technical backstopping (by researchers, extension workers) and knowledge packages to conduct field trials of suitable SLM technologies, implemented in concurrence with sub-component 4.1.
Sub-component 4.3: Revitalize inter-sectoral extension system for SLM
Previous extension services were mainly provided through the Ministry of Agriculture and targeted mostly cultivated lands. As KSIF has a multi-dimensional approach, extension services for SLM are scanty given that the government has not been employing enough extension workers over the last 20 years. This component will bridge that gap by developing the extension personnel capacity well versed with all aspects of SLM. Extension staff will thus be recruited and trained for this purpose. In addition, extension methodologies e.g. farmer field schools, pastoral field schools, will be applied so that SLM is taken to the people using tested practical approaches. Further, the KSIF will engage extension staff from both public and private sectors to ensure the proper down-scaling of the Strategy.

69
Component-5: Strengthening SLM Knowledge Management, M&E and Information Dissemination
This component will gather knowledge and document relevant project activities, lessons learnt and knowledge generated, organizing it into a coherent knowledge-base. It will also facilitate the effectively management and dissemination of knowledge in user friendly formats to all stakeholders according to their knowledge needs and capacities. A transparent and participatory M&E system will be developed to help track the progress of the KSIF. The indicative budget for Component-5 is KShs.17.816 billion (US$178.2 million). (a) Objectives of Component-5 are to:
1) Provide practical information on SLM technologies, practices and approaches for implementation and scaling up.
2) Facilitate the systematic documentation of the various SLM technologies and approaches that have been proved successful in Kenya, including indigenous technologies/knowledge, new knowledge emerging from KSIF activities and from other sources.
3) Bridge the knowledge gap between researchers, policy makers, development partners, extension workers with land users and other stakeholders for upgrading best practices in SLM.
4) Track the progress of the KSIF implementation and institute feedback mechanisms so as to positively inform the Strategy along the way.
5) Disseminate the knowledge gathered/gained through the implementation of this Strategy to all users and stakeholders, including to the external world.
(e) Expected Outcomes of Component-5 The expected outcome from component-5 will be a robust and interactive knowledge base contributing to the effective implementation of the KSIF, for the promotion and scaling up of SLM in Kenya.
(c) Activities Implemented under Component-5
This component will be achieved through some five (5) sub-components as follows: Sub-component 5.1: Documenting successful SLM technologies and approaches
This sub-component aims to systematically document the wide range of SLM technologies, practices and approaches that have been successful in combating land degradation and promoting sustainable crop, livestock and forestry production in different parts of the country. It will document SLM interventions over the last 50 years and any emerging ones, including indigenous technologies (ITK) and farmer innovations. A structured format will be developed aligned to TerrAfrica guidelines for documentation and development of the database.

70
Sub-component 5.2 – Establishing a Kenya SLM Information System (KSLM-IS) Through this sub-component, a central knowledge base for SLM will be established. It will collate and archive a comprehensive SLM database drawing from interventions from the national, watershed, county and local level public and private sector stakeholders. The Kenya SLM Information System (KSLM-IS) will have two sub-activities; (i) development and operationalization of an integrated geographical information system (GIS), and (ii) development and institutionalization of an integrated Kenya SLM Information System (KSLM-IS). This information system will be updated regularly and linked to other relevant databases and platforms.
Sub-component 5.3 – Development and operationalization of a Results-based
Monitoring and Evaluation (M&E) Framework The Results –based M&E framework has beed developed (see Chapter 6).
Sub-component 5.4: Dissemination of SLM knowledge to users
This will evolve as result of implementation of the KSIF. This sub-component will facilitate making use of the results of the applied research and lessons learnt within the time-frame of the KSIF, so that implementation is guided by emerging issues for effectiveness and applicability in varying localities for improvement and up-scaling of best practices.
Sub-component 5.5: Development and implementation of Communication Strategy
A communication, advocacy and consensus building strategy centered on a common SLM vision is a key priority in the delivery of the investment framework. Based on needs assessment, a communication strategy will be developed specifying what knowledge products and services will be delivered to which target stakeholder cadres, their actions, information gathering and sharing modalities and feedback mechanisms (analogue, ICT, print, electronic and other media).

71
5. KSIF IMPLEMENTATION ARRANGEMENTS
The Kenya Strategic Investment Framework (KSIF) for Sustainable Land Management will be implemented in target micro-basins across all counties in the country. However, SLM interventions will be targeted at identified areas in a phased approach, to facilitate the country meet the targets on increased productivity and natural resources protection and sustainable management. The KSIF will enhance capacities for institutional, investment, technical and activity implementation for SLM, making use of research, lessons learning, monitoring and evaluation as interlinked processes. At the policy level, the KSIF will coordinated and advised by a multi-stakeholder, inter-sectoral mechanism, organized and implemented as follows:
5.1 Institutional Partners In view of the large number of actors in the SLM sector, an institutional mechanism is necessary for coordinated planning and implementation of activities, so as to accord improving the effectiveness of investments made. The approach to sector coordination mechanism reflects the devolution of SLM functions to counties as well as responsibilities for specific sector functions across national government ministries. While SLM will continue to be government-led, it has inherent consideration such as ‘inclusiveness’ to facilitate participation of other stakeholder constituencies for requisite buy-in by stakeholders, thus influencing decisions and facilitating high efficiency of the coordination effort. The coordination mechanism is intended to be lean and result-oriented in view of competing demands on resources. This calls for involvement of relevant partners for SLM sector coordination, with institutional partners drawn from the national and county governments, development partners, private sector, research and training institutes, and the civil society. 5.1.1 National Government Ministries and SAGAs The KSIF will be led by a core team of inter-ministerial coordination mechanism comprising ministries that carry mandates relevant to SLM. Led by the Ministry responsible for natural resources and environment, the other core Ministries include those responsible for agriculture and livestock, water resources, lands, settlements/housing, local authorities/urban development, finance, planning, and social services. This core inter-ministerial coordinating body will co-opt as members, the Semi-Autonomous Government Agencies (SAGAs) whose functions involve various aspects of SLM. Table 5 shows some of the main public institutions related to respective ministries, which could be involved in the implementation of KSIF.

72
Table 5: Public Sector Institutions for KSIF Engagement Public Sector Institution Sustainable Land Management (SLM) relevance Ministry responsible for environment and natural resources • Kenya Wildlife Service (KWS) • Kenya Forest Service (KFS) • Kenya forest Research institute
(KEFRI) • National Environmental Management
Authority (NEMA) • Department of Remote Sensing and
Resource Surveys (DRSRS) • Kenya Meteorological Services (KMS)
• Species and ecosystems management of wild
species and ecosystems • Management of forest ecosystems and
crosscutting areas • Management of species and ecosystem research
on floral species • Ecosystem, habitats research/ mapping of species
and ecosystems • Species, ecosystems and natural resources /
Cross-cutting Ministry responsible for lands, housing and urban development • Land Property Tribunals • County Land Management Boards &
Tribunals • Land Courts
• Handles land use planning • Settlement elements
Ministry responsible for agriculture, livestock and fisheries
• Agriculture, Fisheries and Food Authority (AFFA)
• Kenya Agricultural and Livestock Research Organization (KALRO)
• Kenya Plant Health Inspectorate Services (KEPHIS)
Kenya Marine and Fisheries Research institute (KMFRI)
Kenya Animal Genetic Resources Centre (KAGRC)
National Cereals and Produce Board (NCPB)
Department of Veterinary Services
• Policy direction on food security • Strategic food reserve and input programmes • Research on agriculture and technologies for
SLM; Livestock, social and economic issues • Plant health • Research on fish species and management of
aquatic resources • Research and management of genetic resources to
ecosystems • Licensing, regulation, setting of standards and
enforcement of the same in agricultural sector • Food security, strategies and management • Veterinary services
Ministry responsible for water resources • Water Resources Authority • National Public Water Works • National Water Harvesting and Storage
Authority • Institutions at the watershed level e.g.
basin water resources committees and Water resources users associations (WRUAs)
• Policy development and oversight on water resources, services and management
• Water resources allocation, regulation and management
• Infrastructure development for water services • Financing and resource mobilization for water
programmes • Training of skilled water resource managers • Protection and management of water towers, river
basins, natural and developed water sources Ministry responsible for devolution

73
Public Sector Institution Sustainable Land Management (SLM) relevance and planning • National Drought Management
Authority (NDMA) • Department of Remote Sensing and
Resource Survey (DRSRS) • Kenya National Bureau of Statistics • Kenya Institute of Public Policy
Research and Analysis (KIPPRA)
• Drought mitigation planning, sustainable land use, livelihoods in ASAL areas
• Sector-specific planning modules and coordination of all socio-economic, political and environmental functions in the Counties
• Sector wide planning for implementation of investment plans and programmes including land, environment, agriculture and water
• Research on public policy issues bearing on SLM Ministry responsible for education, science and technology • National Commission for Science,
Technology and Innovation (NACOSTI) • Universities and tertiary training
Institutions • Schools (youth and children)
• Coordination of research on crosscutting agriculture, land use and natural resource management (forests, water, soils, ecosystems)
• Research and knowledge dissemination on SLM technologies and practices
• Development and adaptation of SLM technologies Capacity building of SLM workers
County governments All 47 counties are included in the KSIF
• Implementation of devolved functions bearing on SLM
• Implementation of county-level policies, strategies projects and activities
• Oversight of community based organizations
National Land Commission • Land governance and administration
5.1.2 County governments Implementation of SLM interventions will be mainly undertaken at county level. It is therefore vital that county governments be facilitated to build structures for implementing SLM down to farm level. Just as in the national government, SLM issues at county level in many cases fall across more than one Department. In this regard, there will be need to create forums for inter departmental consultation and coordination for planning and investments. At the policy level, the County Executive Committees chaired by the Governor will lead the process. In addition, there are interventions such as catchment protection or exploitation of resources such as water and forests that cut across more than one county, requiring inter-county coordination. 5.1.3 Development partners There are many development partners involved in SLM in Kenya, who will be engaged in the implementation of the KSIF. Development partners play a key role of not only providing financial resources for SLM, but are important for expertise. The KSIF inter-sectoral arrangement will recognize the unique competencies of each partner and assign responsibilities equitably among the government and development partners. The partnership will be organized in the context of reciprocity where the government creates an enabling investment environment for development partners to make their contributions and support the government in delivering on its development.

74
5.1.4 Private Sector The private sector is actively involved in SLM investments such as agroforestry. In addition a number of private sector companies such as seed companies play a role in research and production of climate-smart agro inputs for different ecological conditions like ASAL areas. The private sector however lacks a coordinating body for their voice in SLM. 5.1.5 Research and Capacity Building Institutions Research and Development is required to support adoption of appropriate of sustainable land use regimes, tackle land degradation and development of context-specific tools and technologies for promotion of SLM. Also, capacity building on SLM is conducted at all levels from universities to farm level. Thus technical capacity for SLM is concentrated across the various research institutes, universities, tertiary training institutes which are also sources of innovations and new technologies. The inter-sectoral coordination mechanism will involve researchers and other think tanks e.g. KIPRA to help advance innovation, science and technology in the implementation of the Strategy. The international development and research organizations such as UNEP, UNHABITAT, ICRAF, ICIPE, and ILRI play an important role of ecosystem research programmes touching on land, water, agriculture and SLM in addition to financing government-led SLM related projects in the different sectors and SLM knowledge and technology development and transfer. 5.1.6 Non-State Actors Non-state actors (NSAs) include the civil society organizations, non-governmental organizations (NGOs) and other interest groups that are active in sectors that uphold SLM. These play an important role in advocacy work, capacity building and dissemination of SLM technologies and practices. They also include community based organizations (CBOs) such as water resource users associations (WRUAs), beach management units (BMUs), community forest associations (CFAs) and farmer common interest groups (CIGs). It is important that active NSAs comprise an important stakeholder group as implementers of the SLM projects and activities, and should be represented in the inter-sectoral coordination mechanism.
5.2 Organizational Structure for KSIF Implementation at National Level The implementation arrangements for the KSIF are organized in such a way as to accord the voice of all stakeholders to reach and inform plausible decisions and actions. To avoid duplication of efforts and overlap in jurisdictions, an inter-sectoral coordination mechanism will be instituted, with responsibilities accorded to the various actors at national level. Pursuing national level coordination structures is aimed at achieving two important purposes. Firstly, to enhance horizontal

75
coordination between ‘sub-sectors’ comprising the SLM sector i.e. agriculture, lands, environment and water. Secondly, to stimulate coordination between State Departments and agencies dealing with SLM issues in each national ministry level. The issue on internal coordination between State Departments in a ministry is best left to individual Cabinet Secretaries to handle since each ministry is unique. Hence the structures proposed here below are meant to facilitate horizontal sub sectors coordination: 5.2.1. Inter-Ministerial SLM Coordination Committee (IMCC) The primary function of the IMCC shall be to serve as a platform for high-level consultation between the ministries contributing to the core SLM sector development. The IMCC membership shall comprise the CSs and PSs of Ministries responsible for environment, natural resources, agriculture, livestock, fisheries, blue economy, water and irrigation, lands, and urban development and housing. The IMCC may co-opt other members on an ad hoc basis to provide professional or technical advice on specific agenda issues. The ministries responsible for devolution and planning and The National Treasury must at all times be kept informed even if not full time members of IMCC. The specific functions of IMCC will include:
• Provide policy and strategic direction for the sector • Lobbying and resources mobilization • Provides oversight on policy implementation • Monitoring and evaluating SLM implementation • Approve sector programmes, work plan budgets regular basis • Oversee the functioning of the KSIF Secretariat
In addition to IMCC, other national forums that bring together high level policy makers should be used to propel the agenda of SLM. These forums include the cabinet meetings, the sectoral summits and national days’ messages. 5.2.2 Inter-Ministerial SLM Technical Committee (IMTC) This will be the technical body for the IMCC. Its main function at the sector level will be to provide a platform for SLM technical coordination between ministries. It will have representatives from the State Departments and agencies involved in SLM interventions and research. IMTC may co-opt members from private, civil society and public sectors to provide expertise on the issues that involve them. Its main functions will be:
Recommend for approval by IMCC annual work plan and budgets; Monitor implementation of the SLM including reviewing reports and conducting
field missions for fact finding; Strengthen cooperation and consultations among all the implementing units
and stakeholders; Approve call for proposals as well as innovations for funding and

76
Recommend studies on specific areas of the Programme which they assess as important for Programme implementation.
5.2.3 KSIF SLM Secretariat (KSS) The primary function of KSS will be to provide secretariat-related functions to IMCC, IMTC and linkage for the SLM institutions at the two levels of government. Additionally, KSS will host the SLM data base and knowledge management and other functions delegated by IMCC. For KSS to be perceived to be an impartial body between the two levels of government as well as between the national government ministries, it will be desirable to locate it outside of the key participating ministries. The staff of KSS should ideally be appointed jointly by the IMCC and COG Committees that are responsible for SLM. The operations of KSS will be funded through contributions from county governments, national government ministries in SLM and development partners. At sectoral level, the primary functions of the KSS will be to:
Facilitate better consultations between the two levels of government on SLM matters by ensuring efficient information exchange;
Facilitate intergovernmental meetings; Ensure that intergovernmental bodies and sectoral programmes receive effective
secretariat support; Act as the central repository for sector reports and data Host the M&E function Manage research activities and consultancies initiated by the SLM governing
bodies. It is recognized that establishing an autonomous KSS in the present environment where public policy stance is to reduce and consolidate public institutions may be difficult while convincing county governments to fund such a body maybe a slow process. In the circumstances, it is recommended that a Unit be established within the ministry responsible for environment and natural resources to take over the task of propelling forward the KSIF agenda while awaiting the establishment of an autonomous KSS to emerge.
5.3 Organization Structures for KSIF Implementation at County Level Recognizing that SLM implementation will mainly be undertaken at county level, KSIF proposed interventions at county level are aimed mostly to strengthen and build capacities for county institutions to effectively and efficiently use available human and financial resources to implement SLM agenda. In this connection, the organization structure proposed here for counties takes into account the feedback from the regional stakeholder meetings that have been held to create awareness and sensitize stakeholders on the need to create platforms for mobilizing resources and articulating implementation of SLM agenda. The proposed structure also aims at balancing administrative efficiency with stakeholder inclusion and the need to
77
address SLM priority needs which are best served from a purview of catchment or watersheds and at grassroots levels. 5.3.1 County Executive Committee At the policy level, the County Executive Committees chaired by the Governors will be the top decision making body for KSIF matters in the county. Since County Departments are not more than 10, the Committees will be adequate and competent to handle SLM issues without crowding Governors county business. The other advantage is that Governors will be well appraised with SLM issues that he can cascade to inter-county or intergovernmental level. 5.3.2 County SLM Committee (CSLM) Many counties already have steering committees for agriculture, environment or other broad socio-economic issues. It is proposed that these committees mandate where possible be expanded to include the SLM agenda instead of creating new institutions. Where such committees do not exist, new County SLM Committees may be created to perform the following functions in the implementation of the KSIF:
Policy guidance at county level for SLM Domestication of national SLM policies into county policies Lobby for SLM resources Approve annual county SLM work plans and budgets; Ensure SLM work plan is mainstreamed into the county budget estimates and
CIDPs; Monitor the implementation of SLM in the county.
Membership–The membership and governance arrangements for county SLM committees will be left for the county authorities to determine due to their unique setups. However as a minimum standard, the Members of County SLM Committee should comprise the CECMs and County Officers responsible for environment, agriculture and livestock, water, lands and other relevant SLM functions. Other members may include representatives of SAGAs, NGOS and CBOs active in the county in the area of SLM, business community, women and youth groups. The committee may co-opt any other person for the purpose of providing professional and technical expertise. The Committee shall meet quarterly or more often as may be required to ensure effective implementation of the SLM activities at the county. 5.3.3 Watershed SLM Committee (WSLM) The Watershed SLM Committee (WSLM) will be involved in the identification, prioritization of SLM investments in the catchment. Other functions include:
Creating awareness of SLM issues Monitoring and evaluation Documenting success stories

78
The membership of Committee should include local level County Administrators, Members of County Assembly (MCAs) and representatives from agriculture, environment, CSOs, WRUAs and CFA (where they exist), women and youth and PLWDs in the sub county. 5.3.4 County SLM Secretariat At each county, there shall be a County SLM Secretariat (CSS) composed of a manager, policy & institutional development and M&E and communication expert. The CSS will report to County SLM Committee. Its main functions shall be to provide secretariat services to county steering committees (Figure 2). Other functions will include: Supporting CSLM and WSLM to strengthen sector coordination within the
county; Compiling SLM annual work plans and presenting them to CSLM Committee Facilitating the implementation of county SLM coordination activities; Writing county Programme reports (semi-annually and annually); Collecting and analyzing SLM activities data and information; Organizing monitoring missions for CSLM and WSLM committees and other
stakeholders. Link up with KSIF Secretariat.
Figure 2: County SLM Coordination Structure 5.3.5 Engaging the County Political system: Council of Governors Committees - The Council of Governors is a Constitutional Office and apex body for county governments’ coordination. It is therefore a powerful institution for mobilizing and lobbying resources for SLM. The COG works through technical committees. These committees provide platforms for lobbying resources for
Governor County Executive Committee
County SLM Committee
Watershed SLM Committee
Watershed SLM Committee
Watershed SLM Committee
County SLM Secretariat

79
SLM investments. The Committees that are relevant for SLM include: i Agriculture Committee ii Arid and Semi-Arid Land (ASAL) Committee iii Finance and Economic Affairs Committee iv Intergovernmental Relations Committee v Urban Development, Planning and Lands Committee vi Water, Forestry and Mining Committee.
5.4 Organization structure for intergovernmental Coordination In this early stages in the implementation of devolution, there is considerable ‘push and pull’ between national and county governments on roles, responsibilities and resource flows and utilization. An intergovernmental coordination mechanism will provide structured framework for consultation and coordination of SLM issues between the two levels of government and ensure that SLM issues do not fall between cracks just because functions are devolved. Intergovernmental SLM Forum – The purpose of the SLM forum is to raise the political profile of the SLM sector by bringing together sector leaders and stakeholders to discuss and report on the performance of the sector. The platform will therefore be the highest consultative forum for the sector. The forum will set the overall sector policy direction, investments requirements and progress in the implementation of sector plans. Both county and national government will take advantage of the forum to meet current and potential investors to elaborate on investment programme for the sector and seek pledges and commitments for funding the sector. The agricultural sector has an existing national forum that meets annually or biannually. Many of the issues discussed at that forum are relevant to SLM. The stakeholders are also largely the same as for SLM. Hence, instead of creating a parallel forum consideration for expanding the mandate of the agricultural forum to embrace SLM should be looked into. Governance structure - Members to represent national and county government ministries and departments, private sector, farmers, pastoralists, fisherfolk, development partners and civil society organizations. The specific features of the forum shall include:
The forum to be co-chaired by the CS for Ministry responsible for natural resources and Chairman of COG Committees responsible for SLM in rotation
To convene every two to three years Permanent members comprise Cabinet Secretaries and Principal Secretaries in
the core ministries responsible for SLM Representatives of CECMs for environment and agriculture Representatives of private businesses with significant investments or potential
to invest in the sector, Representatives of Development Partners

80
Representatives of major NGOs who are investing in or are likely to invest in the sector.
Intergovernmental SLM Technical Committee (IGTC) – The Committee will comprise ten representatives appointed from the two levels of government. The representatives will be senior technical experts. Their roles will be to:
Facilitate coordination, harmonization and liaison between national and county government pertaining to: a) development, review and implementation of policies, legislations, standards, b) coordination of projects and inputs, c) establishment of effective systems for research and extension, and d) institutional capacity building;
Facilitate monitoring and evaluation of the implementation of sector plans. This will include acting as host for the coordination unit for the proposed sector M&E system and oversee establishment and operation of a database to facilitate monitoring of policy implementation and evidence based policy analysis, to ensure effective implementation of the planned sector performance M&E system. As part of this effort, receive and circulate progress reports from entities in the two levels of government;
Figure 3: Overall Organization Structure for SLM
Produce annual intergovernmental reports on matters pertaining to the sector, as required by the Inter-Ministerial Coordination Committee (IMCC) and inter-governmental Forum (IGF);
Facilitate capacity building of national and county bodies aimed at
SLM Forum (IGF)
COG Committee Chairmen for SLM Related Committees
Members of IMCC
Representatives of DPs
CECM Caucuses Chairmen
Representatives of NGOs
Representative of Private Sector
Technical Committee (IGTC)
KSIF Secretariat (KSS)
National Land Commission

81
mainstreaming good intergovernmental governance, coordination and partnership practices across the sector; and
Prepare and follow-up on decisions of national and county governments, including meetings of the IGF, and multi-stakeholder consultation bodies.
5.5 Enhancing Sustainability The main benefits of SLM shall arise from restoration, recovery, protection and improvements in the productive capacity of land resources, which will result in Kenyans enjoying increased agricultural productivity, wealth creation, healthy environments and resilient ecosystems. To sustain these interventions and benefits to the citizens KSIF shall invest resources in capacity building in the following areas:
Institutional sustainability – This will entail strengthening existing coordination institutions or establishing new ones where none exists. Strong institutions are needed not only to implement agreed and identified priority interventions but also to provide continuity and institutional memory.
KSIF shall also encourage adequate resources to be provided in technical training because in the last couple of years the advisory and extension services capacity has declined due non-recruitment and retirement of staff. This gap in services delivery is unlikely to be filled through public services only. Therefore, the private sector must increasingly be integrated to provide advisory and extension services through innovative delivery systems such as contracted services delivery models or PPPs. Without adequate and qualified technical capacity the identified SLM interventions will not be effectively implemented.
The other strategy for enhancing sustainability is to devote adequate resources in relevant research. Many traditional SLM interventions are not only expensive to implement, but also laborious. Research in appropriate cost reduction and labour saving technologies will therefore be needed to sustain implementation of SLM interventions and benefits.
In addition, KSIF will encourage both national and county governments to prioritize allocation of own financial resources to SLM. This is because donor resources are never adequate and occasionally suffer abrupt interruptions due to differences between donors and recipients. Furthermore, donor resources may come with conditionality that may not fully respect the recipient’s socio-economic priorities. Raising the domestic financial contributions for SLM interventions will be a more sustainable way of funding SLM.
5.6 Stakeholder Involvement The Constitution of Kenya envisages a culture of openness and accountability in running public affairs. It therefore requires public participation in policy formulation,

82
service delivery and implementation of programs and projects. This key requirement will be implemented in KSIF in the following ways:
Resource allocation – budget hearings in which stakeholders are invited to discuss sector and cross-sector planning and prioritization according to deliverables in the Vision 2030, MTPs, strategic plans and development programs. The public is also invited to make written submissions on their views and expectations on various issues
Inclusiveness in decision making bodies – key stakeholders will be involved in SLM decision making platforms at all levels
Participatory monitoring of KSIF results. 5.7 Implementation Plan and Scaling up strategy KSIF will initially be implemented over 10 year period in two phases to coincide with formulation of MTP. This is important in order synchronize MTP activities with budget formulation and prioritization of SLM investment. Table 6 provides an implementation plan of high level activities needed to implement SLM interventions. Phase 1 (2017- 2022): The main activities during this phase will be foundation in nature and will entail establishment and strengthening capacities for SLM coordination institutions such as IMCC, IMTC, County SLM Steering Committees, recruitment of staff, training, establishment of KSIF Secretariat, review of policies and regulatory frameworks and mobilizing resources. Another key activity during this phase will be establishment of the M&E system for SLM at national and county levels. Phase 2 (2022 – 2027): While some of the SLM investments are on-going or shall commence during phase 1, the main implementation will be undertaken during phase 2. It is also in phase 2 that interventions that shall prove successful in phase 1 will be scaled up. Table 6: Implementation Plan for KSIF
Key Strategic Activity Lead Agencies Period Expected results
1. Promote implementation/ application of SLM best practices and technologies
All actors/ stakeholders All years
Restoration, protection, recovery and improvements in the productive capacity land resources, resulting in increased agricultural productivity, wealth creation, healthy environments and resilient ecosystems.
1.1 Convene a high level meeting for KSIF
Ministry responsible for environment and natural resources
2017 Build a consensus on SLM priorities and approaches.
1.2 Entrench in the national and county development plans and strategies
National/ county governments
All years Ensure adequate allocation for SLM implementation
1.3 Hold a High Level Summit Ministry responsible 2017, Increased awareness and

83
for SLM with all key stakeholders
for environment and natural resources
2022 political goodwill for SLM
2. Create enabling environment for coordinated SLM planning, budgeting and investment
National/ county governments.
Establishment of an institutional framework for a coordinated inter-sectoral joint planning, budgeting, investments and sharing information
2.1 Establish and operationalize Inter Ministerial Coordination Committee (IMCC)
Ministry responsible for environment and natural resources
2017 Coordinated planning and resource mobilization for SLM investments
2.2 Establish and operationalize the Inter Ministerial Technical Committee (IMTC)
Ministry responsible for environment and natural resources
2017 Coordinated planning and resource mobilization for SLM investments
2.3 Operationalize county SLM platforms
County governments.
2017 Coordinated planning and resource allocation for SLM investments
2.4 Recruit Staff for KSIF Secretariat
IMCC 2017 A functional and widely accepted Secretariat
2.5 Establish and operationalize intergovernmental SLM platforms
IMCC 2018 Synergy between county and national government on SLM implementation
2.6 Develop a national policy for SLM
Ministry responsible for environment and natural resources and KSS
2019 Provide a basis for prioritization and development of rules, and guidelines on resources allocation for SLM
3. Mobilize resources for SLM implementation
Increased and sustainable funding for SLM
3.1 Develop guidelines for SLM PPP
Ministry responsible for environment and natural resources
2020 Encourage private sector investment in SLM
3.2 Issue guidelines for PES Ministry responsible for environment and natural resources
2021 Encourage engagement of land owners and possible funders in investing in SLM
3.3 Diagnostic Trade Integration Study and related actions for SLM to facilitate ATF
KSS. 2023 Innovative funding mechanisms for SLM
3.4 Establish a Trust Fund for SLM
Ministry responsible for environment and natural resources
2024 Harness global funds
4. Establish an M&E Framework for SLM
Provide parameters for assessing change
4.1 Develop KSLM-IS and data collection tools and processes for SLM
KSS. 2017 Create a dashboard on SLM investments and interventions
4.2 Conduct a baseline study for SLM
KSS. 2017/18 Establish baseline conditions on which SLM achievements
4.3 Conduct a midterm and end term review of SLM
KSS. 2021 & 2026
Assess whether interventions are effectiveness and whether need to change course
5. Develop and operationalize communication strategy for SLM
KSS 2019 Improved profile awareness and consensus around SLM

84
6: STRATEGY FOR FINANCING AND RESOURCE MOBILIZATION
6.1 Resource Allocation Processes and Mechanisms The government budget is the main source of funding for SLM in Kenya and is likely to remain so for the foreseeable future. Recognizing this reality means that financial resources for SLM within the context of Kenya’s development blue print, Vision 2030 will be determined by two main planning tools:
(i) The 5 year Medium Tem Plans (MTPs) - which operationalize the Vision 2030 and list priorities that the country wants to pursue within the 5 Year period. It is therefore an important entry point for prioritizing SLM investments.
(ii) The Medium Term Expenditure Framework (MTEF) process- which is a 3-
year rolling tool for government policy and expenditure planning that helps to balance public institutions policy and investment priorities against what is affordable and available. This process is entrenched in law through Sections 35–42 of the Public Finance Management Act (PFMA 2012).
To a limited extent, development partners, NGOs and private sector trusts also provide resources for SLM investments at county, watershed and national levels. These resources complement private sector SLM investments at farm level. Unfortunately, these flows are not reflected in the national or county government budgets. However, such direct flows are not substantial and therefore unlikely to distort the policy and investment framework. At the national level, the prioritization and planning of public expenditures and investments under both MTP and MTEF processes undergo several stages starting with the establishment of Sector Working Groups (SWGs) composed of ministries, departments, agencies and other stakeholders. The SWGs discuss intra-sector and cross-sector planning and priorities to deliver objectives of Vision 2030, MTPs, strategic plans and development programs. The process culminates with the determination of sector resource envelope by the National Treasury which forms the basis of the budget for individual ministries and their related agencies. This is presented as part of the national budget by the Minister for Finance and subsequent passing of Appropriation Bill by Parliament.
Resources allocation at county level follows a process similar to that of national government except that instead of MTPs, counties prepare 5 Year County Integrated Development Plans (CIDPs) as the main planning and investment mechanism for county governments. It had been expected that counties would prepare sector specific strategic plans, but very few have succeeded in doing so. The CIDPs therefore remains the planning frameworks on which counties formulate annual budgets which after approval by County Assembles form basis for transfer of resources from the national government.

85
6.2: On-going and Planned Investments in SLM In identifying the types, current and future investments for the KSIF, the main sources of funding for SLM were categorized into (i) public (both national and county), (ii) external donor funding (multilateral, bilateral and the other agencies and trust funds), (iii) private sector funding including among others corporates, NGOs and research organizations, and (iv) innovative funding mechanisms such as payment for environmental services or payment for eco-system services (PES) and Water Funds and Eco-labeling of products. According to the SLM PER report undertaken as a background study for KSIF (MENR, 2016) there a vast number of on-going programs and projects funded by the government and donors that have SLM investments embedded in them. According to the SLM Public Expenditure Review (PER) report, between 2010/11 and 2014/15 financial year (FY) there were over 207 programs and projects implemented in the sector, of which about 92 (44% of total) had one or more SLM components120. As shown in Table 7, the cross-sectoral thematic areas such as policy support, capacity building continue to attract the highest level of funding, followed by agricultural management investments and integrated watershed management. Trends in ongoing investments indicate that SLM is still viewed as a cross-sectoral intervention, which is commendable, but it also flaunt with risks due to lack of clear domicile of SLM function. Table 7: Summary of Previous Budget for SLM components (2010-2015)
SLM Thematic Areas Number of Programs/ Projects
Funding (KES Billion)
%of total funding
Cross-Sectoral Activities 23 52.06 36.8 Sustainable Agricultural Management Activities 37 35.81 25.3 Integrated Watershed Management 4 30.89 21.8 Sustainable Range & Pasture Management Activities
12 11.53 8.1
Sustainable Forest &Woodland Management Activities
10 8.49 6.0
Fisheries Activities 6 2.59 1.8 Total for five years (2010- 2015) 92 141.40 100.0
Source: MENR PER report (2016)
Based on the LADA report121 it is clear that certain key thematic areas and agro-climatic zones that are highly degraded are missing in the current SLM investments.
120 An Assessment of the Alignment of the Agricultural Sector Programmes/Projects to ASDS and MTIP, ASCU, July 2012 121 MENR (2016). Land Degradation Assessment in Kenya: Based on a Study of Land Degradation Assessment (LADA) with
Remote Sensing and GIS, for Sustainable Land Management (SLM) in Kenya. Republic of Kenya, Ministry of Environment and Natural Resources (MENR), Nairobi.
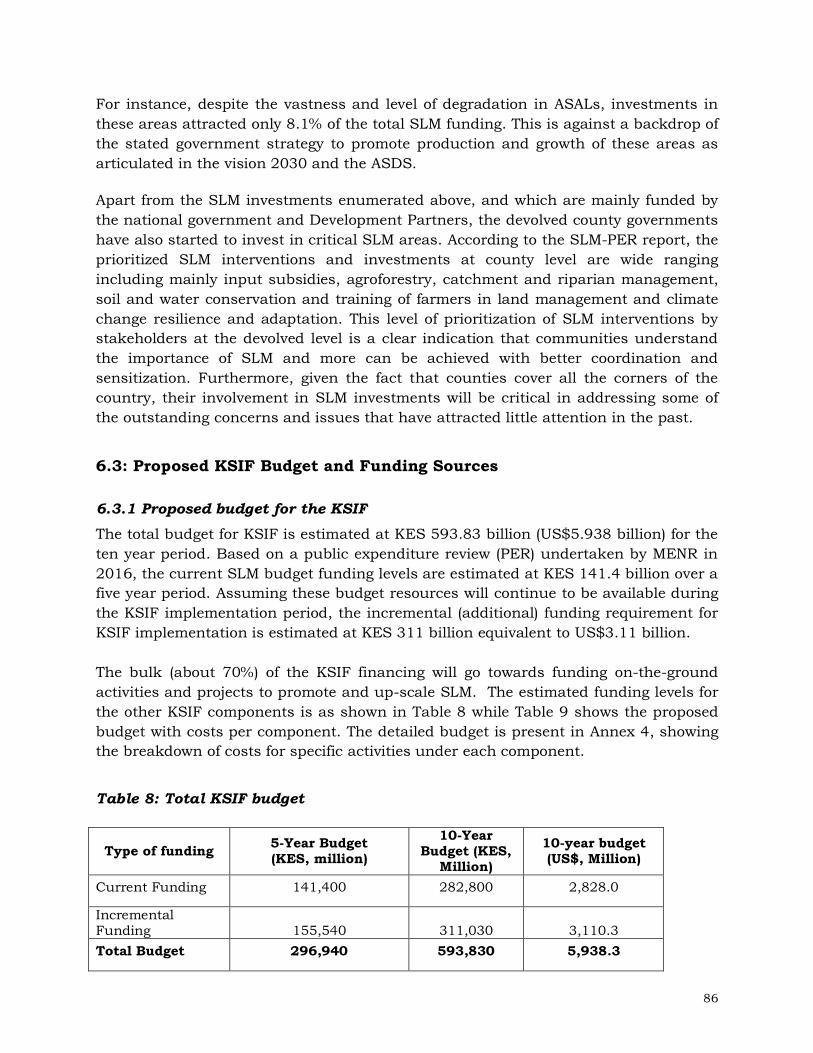
86
For instance, despite the vastness and level of degradation in ASALs, investments in these areas attracted only 8.1% of the total SLM funding. This is against a backdrop of the stated government strategy to promote production and growth of these areas as articulated in the vision 2030 and the ASDS. Apart from the SLM investments enumerated above, and which are mainly funded by the national government and Development Partners, the devolved county governments have also started to invest in critical SLM areas. According to the SLM-PER report, the prioritized SLM interventions and investments at county level are wide ranging including mainly input subsidies, agroforestry, catchment and riparian management, soil and water conservation and training of farmers in land management and climate change resilience and adaptation. This level of prioritization of SLM interventions by stakeholders at the devolved level is a clear indication that communities understand the importance of SLM and more can be achieved with better coordination and sensitization. Furthermore, given the fact that counties cover all the corners of the country, their involvement in SLM investments will be critical in addressing some of the outstanding concerns and issues that have attracted little attention in the past.
6.3: Proposed KSIF Budget and Funding Sources 6.3.1 Proposed budget for the KSIF The total budget for KSIF is estimated at KES 593.83 billion (US$5.938 billion) for the ten year period. Based on a public expenditure review (PER) undertaken by MENR in 2016, the current SLM budget funding levels are estimated at KES 141.4 billion over a five year period. Assuming these budget resources will continue to be available during the KSIF implementation period, the incremental (additional) funding requirement for KSIF implementation is estimated at KES 311 billion equivalent to US$3.11 billion. The bulk (about 70%) of the KSIF financing will go towards funding on-the-ground activities and projects to promote and up-scale SLM. The estimated funding levels for the other KSIF components is as shown in Table 8 while Table 9 shows the proposed budget with costs per component. The detailed budget is present in Annex 4, showing the breakdown of costs for specific activities under each component.
Table 8: Total KSIF budget
Type of funding 5-Year Budget (KES, million)
10-Year Budget (KES,
Million) 10-year budget (US$, Million)
Current Funding 141,400 282,800 2,828.0
Incremental Funding 155,540 311,030 3,110.3 Total Budget 296,940 593,830 5,938.3

87
Table 9: KSIF budget per component
Component Projected Total
Budget (US$ Million)
Percentage of Total Budget
Component 1: On-the-Ground Activities and Projects to Promote and Up-Scale SLM
4,156.6 70%
Component 2: Enhancing the Policy, Legal, Institutional Frameworks and Investments for SLM
475.1 8%
Component 3: Capacity Building to Strengthen the Technical, Socio-Economic and Support Services for SLM
890.8 15%
Component 4: Supporting Research and Extension for SLM Best Practices
237.6 4%
Component 5: Strengthening SLM Knowledge Management, M&E and Information Dissemination
178.2 3%
Total Budget for KSIF (10 years) 5,938.3 100%
6.3.2 Funding Sources (a) National Government
The Kenyan Government in partnership with development partners who include multilateral and bilateral organizations, NGOs, CBOs and the private sector, will continue providing resources and funding for SLM investments and thus, KSIF. The budget sources will rely on the government cycle mainly focused on the MTEF process. Based on the 2016 budget review and outlook paper (BROP)122, environmental protection, water and natural resources sector budget allocation ceiling for 2017/18 to 2019/20 was set at 5.5% of the national budget composed of 1.2% recurrent and 4.4% development expenditures, respectively. The ceilings for agriculture, rural and urban sector were set at 2.8% (1% recurrent and 2% development). Based on these sector ceilings, the environment and agriculture sectors were expected to receive KES 88.9 and 46.5 billion, respectively in 2016/17. In total, the two sectors were projected to receive a total of KES 559.6 billion for the entire four year MTEF period (2017/17 to 2019/20). During the ten year KSIF period, the sectors are projected to receive KES 1,512.2 billion of which 332.6 billion will be used for SLM investments123. With KSIF in place, the expectations are that the resources allocated for SLM investments will gradually increase to 353 billion124 . These are the resources which KSIF can draw from the national budget. The budget ceilings also include funding from development
122 National Treasury (Sept 2016): Budget Review and Outlook Paper 123 This scenario is based on the 5% and 4% growth in budget allocations to Environment and Agricultural sectors as per
2016 BROP. The SLM allocation is based on 22% of total sector budget as per the 2016 PER report, 124 This scenario is based on the pleasurable assumption that with KSIF in place, SLM share of sector budget will increase by
7% per year up to 2026/27.

88
partners, majority of who operate within the MTEF framework with an estimated 10% operating off-budget. As noted in the PER report (MENR, 2016), there is need to establish a clear link between SLM interventions and food security, productivity and poverty reduction in order to attract more budgetary resources. Policy makers at national and county levels need to be sensitized on this linkage to win their much needed support during KSIF implementation. Furthermore, there is need to monitor and improve public expenditure allocated to SLM programs/projects and activities to increase absorption and make a case for more resources. (b) Funding from County Governments Another key and emerging source of funding for KSIF is the county governments who as indicated in the PER report, have prioritized SLM investments in their CIDPs. Based on estimates made under PER report, counties had allocated close to KES 17 billion for SLM investments in their 2016/17 CIDPs. With better coordination and sensitization this level of funding could be doubled to KES 34 billion during the next CIDP cycle of five years and 70 billion in the ten year KSIF period. In particular it is important for the SLM coordinating body to make the necessary arrangements for participation on CIDPs formulation, prioritization, implementation and M&E. The devolved SLM platforms will be an important entry point in this endeavor. (c) Development Partners The Development Partners (DPs) mainly through stand-alone projects and programs are estimated to fund almost half of the SLM development budget (MENR, 2016). However, the level of funding from this source has declining over the last decade. This declining trend needs to be reserved by putting into place measures to attract more SLM funding from ongoing and proposed programs and projects. Furthermore, a strategic shift is required to target the expanding funding earmarked for climate change and the international Sustainable Development Goals (SDGs). This will require establishing a clear link between climate change mitigation, resilience and adaptation, with SLM interventions such as; agroforestry, water harvesting, soil fertility management. The SLM sector can also benefit from encouraging the formation of a donor (sub) group dedicated to SLM issues for better coordination and resource mobilization. There are also several programs that are planned to support various aspects related to SLM. These programs are mainly funded by DPs and the national government. Of particular mention is the proposed Kenya National Climate Smart Agricultural Project (KSCSAP) to be funded jointly by the World Bank and the Government at an estimated funding of US$ 200 million. KCSAP will focus on increasing agricultural productivity and build resilience to climate change risks in the targeted smallholder farming and pastoral communities in Kenya. The EU is also in the process of formulating a 50 million Euros project to support improving food security, climate change resilience and

89
restoration of water towers. These among other projects indicate the potential that the SLM sub-sector can use to fund implementation of the KSIF and SLM investments. The KSIF should also tap into the various global SLM and climate change funding. The architecture of such funding mechanisms is complex including multi-lateral and bi-lateral funds, the private sector and other organizations. Other sources include climate change international funding sources e.g. REDD+, GCF, CSA and others through the United Nations Framework Convention on Climate Change (UNFCCC). Experience from elsewhere shows that there is limited awareness in most countries on the existence and eligibility criteria of many of these funds. There is therefore need to strengthen the identification and understanding of these funding sources and mechanisms as a source of funding for KSIF. (d) Trust Funds and other sources There are number of trust funds and other devolved that currently exist that can be tapped to fund SLM investments. These include;
Constituency development funds (CDF) Trust funds such as the National Environment Trust Fund (NETFUND), Kenya
Land Conservation Trust (KLCT), Community Development Trust Fund (CDTF), Kenya Wildlife Trust and Water Sector Trust Fund.
Funding through off-budget programs by DPs, NGOs, research institutions and private sector, although not quantified, could be key sources of funding for KSIF.
6.4: Innovative Resource Mobilization Plan To mobilize resources for KSIF implementation, the country needs to adopt a more innovative resource mobilization strategy to stem the declining funding levels from traditional sources. The strategy should also ensure the financing for SLM investments is done in a sustainable manner with institutional structures established to mobilize and manage the funds. 6.4.1 Establishment of Sustainable Land Management Fund (SLMF) To ensure institutional sustainability, it is proposed that a Sustainable Land Management Fund (SLMF) be established as a basket fund to mobilize resources from domestic, external and global innovative financing sources. The Fund will be mandated to finance SLM investments and other related activities geared towards combating land degradation. The SLMF, jointly with national and county governments will develop programs for implementation based on the identified components of the KSIF. The Fund will be administered by the proposed SLM Coordination body and disbursements of funds will be done to specific SLM projects, programmes and activities, counties and agencies with clear operational guidelines that ensure transparency and accountability. Experiences gathered in the country in managing community micro-projects will be used to guide the formulation of the operational

90
guidelines. The policy and legal instruments necessary to establish the Fund exist, but will be streamlined as a priority during KSIF implementation. 6.4.2 Financial Sustainability Financing instruments and financing mechanisms that can supplement the budgetary resources will also be necessary to close the financing gap and ensure sustainability. Table 10 summarizes some of the innovative financing mechanisms and instruments that have been identified to support SLM investments. These mechanisms and instruments were identified based on their relevance to the country taking into account the need to upscale past initiatives with potential for growth. Others were identified to offer incentives to promote SLM investments while some instruments were identified to discourage further land degradation. Among the key areas of focus include tapping the huge potential offered by the relatively well developed private sector in the country. In this regard, SLM Public Private Partnerships (PPPs) guidelines will be developed to mainstream private sector investments. It is also proposed that companies offering corporate social responsibility (CSRs) funding for SLM investments can be offered incentives of various types. Measures will also be put in place to tap more global funds especially targeting emerging SLM, climate adaptation and resilience funding. Vital lessons learned in the past through piloting of PES and carbon financing in the country will be put into good use in supporting the up-scaling of innovative funding mechanisms. Other measures and mechanisms identified will focus on linking SLM to trade; subsidies on liquefied petroleum gas (LPG) to reduce deforestation and land degradation. Also, to institute regulatory biodiversity off-sets; taxes, levies and payments (Polluter Pays Principle) for activities that cause land degradation, such as mining, sand harvesting and factories. Also, offering premiums and tax rebates for organically produced foods to reduce use of chemical inputs, reducing pollution. Table 10: Sources and Strategies for Resource Mobilization for KSIF Source/ Instrument Purpose Strategy/Action
Private sector including NGOs, CBOs
Tap private sector funding for SLM
Mapping exercise to be undertaken as a matter of priority, and an SLM Public-Private-Partnerships (PPPs) guidelines formulated and adopted in line with national PPP legal framework. Offer higher tax breaks for companies offering CSRs funding to SLM investments
Global Funds
To target SLM, climate adaptation and resilience funding.
Create awareness of the existence of many global funds and eligibility criteria to access such funds;
to identify and target relevant sources and
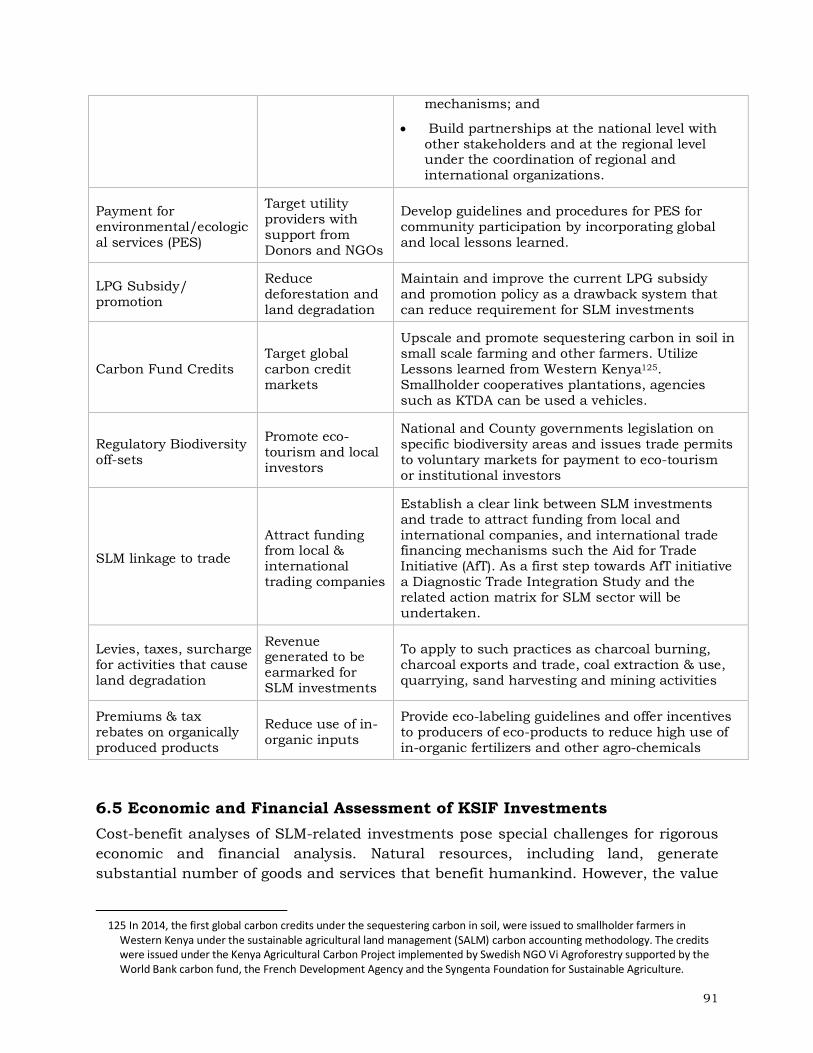
91
mechanisms; and
Build partnerships at the national level with other stakeholders and at the regional level under the coordination of regional and international organizations.
Payment for environmental/ecological services (PES)
Target utility providers with support from Donors and NGOs
Develop guidelines and procedures for PES for community participation by incorporating global and local lessons learned.
LPG Subsidy/ promotion
Reduce deforestation and land degradation
Maintain and improve the current LPG subsidy and promotion policy as a drawback system that can reduce requirement for SLM investments
Carbon Fund Credits Target global carbon credit markets
Upscale and promote sequestering carbon in soil in small scale farming and other farmers. Utilize Lessons learned from Western Kenya125. Smallholder cooperatives plantations, agencies such as KTDA can be used a vehicles.
Regulatory Biodiversity off-sets
Promote eco-tourism and local investors
National and County governments legislation on specific biodiversity areas and issues trade permits to voluntary markets for payment to eco-tourism or institutional investors
SLM linkage to trade
Attract funding from local & international trading companies
Establish a clear link between SLM investments and trade to attract funding from local and international companies, and international trade financing mechanisms such the Aid for Trade Initiative (AfT). As a first step towards AfT initiative a Diagnostic Trade Integration Study and the related action matrix for SLM sector will be undertaken.
Levies, taxes, surcharge for activities that cause land degradation
Revenue generated to be earmarked for SLM investments
To apply to such practices as charcoal burning, charcoal exports and trade, coal extraction & use, quarrying, sand harvesting and mining activities
Premiums & tax rebates on organically produced products
Reduce use of in-organic inputs
Provide eco-labeling guidelines and offer incentives to producers of eco-products to reduce high use of in-organic fertilizers and other agro-chemicals
6.5 Economic and Financial Assessment of KSIF Investments Cost-benefit analyses of SLM-related investments pose special challenges for rigorous economic and financial analysis. Natural resources, including land, generate substantial number of goods and services that benefit humankind. However, the value
125 In 2014, the first global carbon credits under the sequestering carbon in soil, were issued to smallholder farmers in
Western Kenya under the sustainable agricultural land management (SALM) carbon accounting methodology. The credits were issued under the Kenya Agricultural Carbon Project implemented by Swedish NGO Vi Agroforestry supported by the World Bank carbon fund, the French Development Agency and the Syngenta Foundation for Sustainable Agriculture.
92
of most these goods and services is not determined through market mechanisms. Theoretically, all direct and indirect use benefits of natural resources are capable of being measured in monetary terms. In practice, however, there is limited evidence of such quantification and even where available their accuracy is questionable. Most of these benefits also take a long time (over a generation) to be realized. SLM investments proposed under KSIF are likely to generate positive on-site benefits, such as increased land productivity, reduction of degradation, enhanced soil fertility and improved rangeland cover and reduced sedimentation of reservoirs and lakes. These contribute to reduced frequency and severity of flooding and lower costs of electricity and sustainable water-supplies. However, the precise quantification of the complex relation between watershed and range management and other investments to their physical effects, and their translation into monetary value require long-term data and biophysical modeling, a task that may take years. Furthermore, the quantification of economic benefits of KSIF components, such as capacity building and strengthening the enabling environment are difficult to quantify. Hence, estimation of single summary measures, such as Internal Rate of Return (IRR) or Net Present Value (NPV) for the KSIF was not possible at this design stage. Despite these challenges, evidence within the country and globally indicate that the adoption of recommended SLM practices is profitable from both the private and social perspectives. For instance, the economic and financial analysis undertaken as part of KAPSLMP design indicate that farmers would realize an IRR of 39 percent and an NPV of US$2,784 per ha in average across the operational areas126. The social IRR and NPV were estimated at 36 percent and US$3,020 per ha, respectively. The analyses also indicated that adoption of SLM practices is profitable over a wide range of output and input prices, and would be greatly enhanced with better policy and institutional environment which the implementation of KSIF is expected to provide. These positive findings were also confirmed by an SLM cost benefit study undertaken in 2016127. According to this study, the NPV of the SLM practices were profitable. In particular, use of soil and water conservation (SWC) structures and reinforcing them with agroforestry practices was found to be profitable. The study further showed that adopting SLM practices leads to a total NPV of Kenyan Shillings (KES) 408,373, 306,492 and 75,844 per acre/year in Kinale-Kikuyu, Cherangani and Wundanyi catchment areas respectively, based on a 30 year period and a discount rate of 12%. With the enabling SLM investment environment under KSIF, it is anticipated that the benefits to farmers, livestock keepers, communities, and the environment will far outstrip the cost of SLM interventions. The magnitude of the benefits and rates of return will be determined during specific KSIF implementation programs.
126 World Bank (2010): Project Appraisal Document, Kenya Agricultural Productivity and Sustainable Land Management
Project (KAPSLMP) 127 MENR (2016): Cost benefit analysis of sustainable land and water management in three water catchments of Kenya
(Cherangani, Kinale-Kikuyu, Wundanyi)

93
7. MONITORING AND EVALUATION FRAMEWORK
7.1: Monitoring and Evaluation Objectives A programmatic Monitoring and Evaluation (M&E) framework for KSIF has the main objective to institutionalize tracking the progress and performance of the KSIF. It also helps monitor developments in policies, institutions and key investments and their performance indicators at the national and at the devolved levels. The framework defines the structures, roles and responsibilities of the various institutions and establishes mechanisms for data collection and management, as well as feedback mechanisms and knowledge sharing at national, county and other levels. Continuous, periodic and in-depth impact assessments will be used to monitor and evaluate the achievements of the framework. The M&E framework also incorporates mechanisms for public participation, to meet constitutional requirements for policy and program implementation. As noted by TerrAfrica128, some of the key barriers to the adoption and scaling up of SLM practices in sub-Saharan Africa relate to; the general inability or weakness of all stakeholders involved in SLM programmes and projects to collate, analyze and systematically provide feedback, bringing forth new knowledge that can aid the design or adoption of new initiatives. More specifically, the M&E framework is designed ensure that;
(i) Key SLM interventions, their outcomes and impacts at all levels are well documented and measured.
(ii) Timely feedback is provided to policy makers and other stakeholders on the implementation progress and outcomes, for their action and response.
(iii) There is agreement on a common set of indicators at national, county and community level, and
(iv) Baseline data and realistic targets are set for each of the indicators and a there is a common reporting format.
Given the hierarchical nature of SLM implementation, the M&E framework emphasizes the need to have an institutional framework that can coordinate and facilitate this important function of KSIF with the national government taking the lead. The M&E results framework with targets and indicators at various levels is outlined in Annex 2. The Results Framework also outlines indicators for the priority SLM interventions as identified under KSIF.
7.2: Benchmarks and Targets During the preparation of the KSIF, it was apparent that there is scant baseline data that could be used to set bench marks and targets for SLM. However an M&E system is as good as its baseline and targets, because by monitoring these two aspects it is possible to measure progress or lack of it. Generation of baseline data is usually costly, time consuming and the activity has to be well planned to ensure involvement
128 TerrAfrica – Comprehensive Monitoring and Evaluation System Document; NEPAD 2014

94
of key stakeholders. As part of KSIF implementation, a baseline study to quantify the indicators identified in the results framework will be undertaken as priority within year one. The targets set in the results framework are guided by the need for them to be realistic, achievable and measurable. The targets set in the results framework (Annexes 2 and 3) will guide the achievement of benchmarks and targets. However, taking cognizance of the fact that KSIF is based on long term interventions spanning to 10 years, a phased approach is recommended. The first phase will focus on first 5 years (2017-2022), while the phase II takes the second term (2022-2027) to total ten (10) years. During Phase II new challenges, knowledge, emerging issues and opportunities will be taken on board to refine the outcome indicators and targets. Apart from monitoring there will be need to evaluate129 the SLM investments periodically. This will help determine the relevance and fulfillment of developmental objectives, efficiency, effectiveness, impact and sustainability of the investments. Such an evaluation will provide information that enables the incorporation of lessons learned into the decision-making processes of both funding agencies and beneficiaries. It is therefore recommended that during KSIF implementation, an impact assessment plan will be put into place to periodically guide in assessment.
7.3: Data Collection and Processing Arrangements During implementation of the KSIF, the results framework and the monitoring system will be agreed upon and shared with key stakeholders to guide reporting and feedback. However, as noted elsewhere in this report, the SLM sector in Kenya is characterized by multiplicity of institutions, policies, strategies and planning frameworks, legal and regulatory frameworks that in some instances contradict each other. To foster a coordinated approach for SLM knowledge, A structured data collection and processing system, from the grassroots, counties and at national level will be put in place as part of KSIF implementation. This structure will ensure that indicators will be relevant for various levels to inform the national results framework. Simple and cost effective data collection instruments based on modern information technology platforms, including mobile phone technology, will be used for information gathering and dissemination. Where necessary, other technologies in data collection such as GIS, satellite imagery and real-time data collection tools will be used. All these will contribute to building up a coherent central depository of SLM data/information and hosting the KSIF-IS, culminating in a one-stop SLM knowledge hub. Establishing a fully functional M&E system for the KSIF can face financial constraints in the light of other competing priorities. Therefore, key areas of SLM investments will be prioritized and scaled up based on lessons learnt. Initial activities could be directed
129 Evaluation is defined as “an assessment, as systematic and objective as possible, of an on-going or completed project,
programme or policy, its design, implementation and results.

95
at the land degradation hotspots with aim of having a fully operational M&E framework by year 3 of KSIF implementation.
7.4: SLM Management Information System (KSLM-IS) The concept of management information system (MIS) has been evolving in recent years. The concept involves putting together the most efficient elements that provide timely information and feedback for decision making at various levels. Essential elements are the people-users, personnel, data and information, hardware and software as well as resources such as finances. It also includes data collection methods, storage, processing, output and data exchange mechanisms. In the context of KSIF monitoring framework, the KSLM-IS will involve investments in data and information systems in an integrated IT system. Given the high penetration of mobile phones technology in the country, the KSLM-IS system will wherever possible utilize those tools, as well as other emerging technologies that proof to be more efficient and effective. In effect, the KSIF’s M&E system could become a real-time, efficient tool for decision making and knowledge sharing.
7.5: Communication Plan The organizations and programs that succeed are those which collect relevant information, analyze and disseminate knowledge effectively, thereby becoming a knowledge hub for stakeholders. Given the multiplicity of SLM stakeholders in Kenya, a well-designed information dissemination strategy backed by a communication plan is essential for the success of the KSIF. In its simplest form, a communications plan outlines who needs to be communicated with what information, how to do it, how often and the content. There are also other considerations such as clientele typologies, timing and budget. An effective communications plan is therefore necessary for the implementation of the KSIF, to track and facilitate achievement of stated goals, objectives and deliverables. This will help improve the operational efficiency and manage the inputs, outputs and expectations of stakeholders and target audiences. Developing the communication plan for the KSIF will be among the early activities for functionalizing this Strategy.

96
8. ANNEXES Annex 1: Methodology used in developing the KSIF The KSIF was developed through a participatory process and thorough assessment of the situation analysis. The process involved gathering data from literature, reports and other sources, thematic baseline studies which included field visits, data analysis, stakeholder consultations, preparation of draft reports, peer reviews and preparation of the final KSIF. More specifically, the following activities were implemented: (a) Baseline studies In the period 2015-2016, the Government of Kenya, through the Kenya Agricultural Productivity and Sustainable Land Management Project (KAPSLMP) of the Ministry of Environment and Natural Resources (MENR), conducted a series of four baseline studies to identify available resources, gaps and opportunities, and to chart the way forward towards the formulation of a KSIF for SLM. These studies were: (vi) Land degradation assessment (LADA) in Kenya: Based on a study of land
degradation assessment with remote sensing and GIS, for Sustainable Land Management (SLM) in Kenya;
(vii) Overview of the policy, legislative and institutional frameworks for sustainable land management in the public sector in Kenya;
(viii) Cost-benefit analysis of sustainable land and water management in three water catchments of Kenya (Cherangani, Kinale-Kikuyu, Wundanyi),; and
(ix) Report on public expenditure review (PER) and resource mobilization strategy for sustainable land management in Kenya.
(b) Collection of primary and secondary data to inform the KSIF Review of literature This involved desk reviews of literature on SLM, including stocktaking of what exists or has been done, with critical analysis to identify: The status, trends and driving forces of land degradation as well as related
technical and socio-economic issues. It also captured the policy, legal, regulatory, institutional, political, financial and socio-economic factors driving land degradation and/or supporting SLM, to provide an informed position for developing the KSIF.
Relevant documents were reviewed such as national, sector and county development Strategies, policies and development plans, programs, projects, as well as technical reports, progress and evaluation reports, and documents that have bearing on land degradation and SLM in Kenya.
Successful and promising SLM interventions130 were identified and clustered by theme131, geographic/ agro-climatic zones, technical and socio economic factors.
Options to scale-up SLM technologies/practices were identified and described.
130 From Government reports, development partners, SAGAs, NGOs, private sector. 131 Four of the themes or categories are proposed, according to the earlier CSIF Guidelines and the SIP: (i) on the ground
activities; (ii) enabling environment activities; (iii) extension services; (iv) knowledge management.

97
(c) Stakeholder Consultations
A series of stakeholder consultations were implemented during the development of the KSIF. At least six forums were held to identify key SLM issues, gaps and solutions as perceived by stakeholders. These issue based workshops targeted addressing issues as stratified according to agro-climatic zones. The stakeholder workshops held and the respective venues are listed here:
1) Smallholder agriculture and water tower issues from Central and Eastern Kenya, (Nyeri)
2) Western Kenya and the Rift Valley for smallholder land use systems (Kisumu); 3) Lowlands and coastal zones (Mombasa); 4) Rangelands/livestock systems for pastoral and agro-pastoral areas (Mwingi); 5) County Executive Council Members (CECMs)– from all 47 counties (Naivasha);
and 6) High level policy meeting with PSs, Directors (MENR, MLHUP, MWI, MoALF, WRMA),
and stakeholders who included development partners, SAGAs, private sector, NGOs, to discuss the draft KSIF, the implementation arrangements and their respective roles and responsibilities (Nairobi); and
7) Peer Review of the draft KSIF by the National Technical Steering Committee of KAPSLMP (Naivasha).
(d) Gap Analysis Using the information gathered from both literature and stakeholder consultations, various techniques were used, including SWOT analysis (Strengths, Weaknesses, Opportunities, and Threats), PEST (Political, Economic, Social, and Technological) analysis, and Political, Economic, Social, Technological, Legal and Environmental (PESTLE) to identify the key SLM related issues across sectors, as well as the gaps and opportunities for focusing the KSIF. The information gathered helped guide the development of the KSIF through:
Picking out legal and policy statements that support proposals to be made in the KSIF,
Identifying gaps that require redress (in policies, technologies and investments) Identifying areas of interventions for SLM targeting that fit a programmatic
approach, Defining the investment structures for SLM that bring about the desired
results, Identifying the most optimal institutional frameworks to facilitate success of the
KSIF implementation, and Mapping out a coordinated approach to the implementation of the KSIF.
(e) Developing Content for the KSIF Using the findings of the activities described above and the TerrAfrica Country Support Tool as guidelines and reference, the harmonized SLM Country Program (KSIF) was drafted, showing the indicative resource requirement with emphasis on:

98
i. Diagnostics (e.g. biophysical/spatial, policy/institutional, technical, financial) and analysis of key bottlenecks and opportunities;
ii. Developed a log-frame matrix for the list of sector and cross-sectoral SLM priority action areas and prepared a phased SLM country programme indicating the expected outputs, indicators and estimated cost of activities outlined as per TerrAfrica activity guidelines
iii. Developed a set of priority investments, to support activities at national, county and community levels and a national level investments and budget.
v. Indicated the modalities and lines of communication for data collection, information sharing and stakeholder involvement in the country platform.
v. Developed a Monitoring and Evaluation (M&E) framework for the KSIF
vi. Made recommendations for the implementation arrangements and coordination mechanisms of the KSIF, taking into account the existing institutional mechanisms and recent institutional development.
vii. Prepared a final report which constitutes the KSIF.
viii. Prepared a Policy Brief which is the synthesis of the main messages contained in the KSIF.

99
Annex 2: Results Framework for the KSIF Summary of Outcome Indicators
Goal: The overall goal of the KSIF is to provide a national level strategic planning framework, for guiding the inter-sectoral coordination, planning, prioritization and implementation of integrated approaches, stimulating cost effective investments and budgetary support for SLM, thereby contributing to the attainment of Kenya Vision 2030 targets on economic development, food security and sustainable livelihoods.
Development and Environmental Objectives and Key Indicators
Objective(s) Outcome indicators Use of result information Development Objective: To restore, sustain, enhance
and protect the productivity of the country’s natural resource base through improved investments, sector coordination and scaling up of SLM interventions.
Environmental Objective: To rebuild Kenya’s natural
capital assets by overcoming the causes and mitigating the negative impacts of land degradation, while also building long-term ecosystem sustainability, facilitating climate change resilience and environmental health.
1. Percentage of land identified as degraded reduced (reported per priority AEZ)
2. Land users adopting SLM practices (reported per priority AEZ)
3. Improved score on composite index for SLM enabling environment (CISEE)
4. Percentage increase in core SLM funding from national & county governments, including funding by development partners
To evaluate the impact of
KSIF Help to determine or
assess the contribution of KSIF components/interventions to DO/EO outcomes
Risks towards achievement of the KSIF Development and Environmental Objectives The major risks in achieving the Development and Environmental Objectives and outcomes are mainly financial, institutional and socio-economic. The successful implementation of KSIF is pegged on enhanced mobilization of financial resources from various sources, if this is not achieved, and then achievement of the DO and other outcomes will be at risk. To mitigate this risk, it is important to ensure that resource mobilization strategy developed as part of KSIF is put into place and in particular the proposed Sustainable Land Management Fund (SLMF). The institutional arrangements for KSIF implementation also pose a major risk to achievement of the DO and other outcomes. Without a robust institutional arrangements at national, county and community level, the implementation of the SLM investments as identified in KSIF will remain uncoordinated with limited impact. The institutional mechanisms for inter-governmental coordination and community participation remain a key success factor.

100
Annex 3: Detailed KSIF Results Framework Thematic area/
component Result/outcome Indicator Baseline
(BL) Targets
2017 to 2027 Data
Source Responsibility Use of result
information
Component 1: On-the-Ground Activities and Projects to Promote and Up-Scale SLM
Investments to promote upscaling of SLM
SLM scaled up in priority hot spots and thematic areas
1. Number or % of land users adopting SLM practices (per priority zone,)
2. Hectares or No of SLM practices adopted (per Priority zone)
3. % reduction in degraded land (per priority zone).
Baseline established at inception /2017
Increase by 5% per year over the KSIF duration
Increase to 10% by 2027 (1% increase per year)
Surveys, MIS, progress Reports, LADA
MENR, SLM coordination body, SLM Secretariat county forums & focal points.
Provide feedback on level of adoption of technologies and practices.
Component II: Enhancing the Policy, Legal, Institutional Frameworks and Investments for SLM 2.1Establishing an inter-sectoral coordination mechanism for SLM 2.2 Support the improvement of policy environment for SLM
Improved policies and institutions at national and lower levels
a) SLM policy developed and approved
b) National SLM coordination institutional structure established and functional.
c) Inter-governmental SLM coordination sub-committee established.
d) Improved score on composite index for SLM enabling environment (CISEE)
Baseline at December 2016 is zero as no such policy/ structures currently exists
SLM policy developed & approved by 2018
The CISEE to increase by 10% each year up to 2022 from the base year and by 2027 should have accelerated to reach 100%
Expert survey tool to assess the CISEE
MENR, SLM coordination body, SLM Secretariat
SLM prioritized at national and county levels and linked to national goals
2.3: Strengthening coordination at national and lower levels
SLM interventions are mainstreamed in GOK programs (both national and County) and donor programs
a) Country coalition strengthened – measured by improved score on coalition assessment tool
b) SLM actions included in National development plans, sector plans and MTEFs.
c) No of CIDPs prioritizing SLM interventions
d) No of DP programs/programs with SLM actions
Baseline established inception
/2017
Country coalition score to increase by 10% per year up to 2022 and to accelerate to reach 100% by 2027
SLM included in national plan and at least 70% of the CIDPS by 2022 and in 100% of CIDPs in 2027
3 programs by 2022 and 5 national programs by 2027
Expert survey tool
MENR, SLM coordination body, SLM Secretariat
Mainstreaming SLM investments for enhanced funding and implementation
2.4: Identify mechanisms to upscale funding for SLM
Increased funding and utilization for SLM
a) % increase in amount of funding from GOK, County governments, development
BL established at inception
5% annual increase from Baseline year
PERs,
Sector document,
MENR, SLM coordination body, SLM
Demonstrate tangible increase in SLM funding

101
interventions partners and other sources
b) % of total annual SLM funding actually utilized (absorbed)
/2017 5% increase from BL to reach 100% in 2027
Budget data, CIDPs
Secretariat,
Component III: Capacity Building to Strengthen the Technical, Socio-Economic and Support Services for SLM
Strengthening commercial and advisory services for adoption and use of SLM technologies and alternative livelihood)
Enhanced adoption of SLM production and marketing technologies
a) # of personnel/farmers/livestock keepers and other stakeholders trained
b) Number of value chains developed and based on SLM technologies
c) Number of investments in alternative livelihoods in support of SLM (national and per County)
Baseline established at inception /2017
# trained increase by 10% per year from BASELINE
# of VCs & investments increase by 5% per year
MENR, SLM coordination body, SLM Secretariat, County and SLM fora reports, M&E reports
To demonstrate enhanced capacity and actual implementation and local level
Enhanced integration of SLM interventions as part of climate change adaptation and mitigation
d) % of national and county strategies/plans with SLM interventions to manage climate change.
e) Funding level (KES) of SLM activities as part of climate change interventions (national & county)
Baseline established at inception /2017
Increase of 30% by 2022 and 75% by 2027
National & sector strategies, CIDPs, climate change coalition reports
MENR, SLM coordination body, SLM Secretariat UNFCCC, UNCDD, focal points
Demonstrate clear link of SLM and climate risk management & increased investments
Component IV: Supporting Research and Extension for SLM Best Practices
Increased SLM research funding
% increase of total SLM funding earmarked for SLM research Programs
#of SLM technologies/practices/data bases developed
Baseline established at inception /2017
5% increase per year from Baseline
MENR, SLM coordination body, SLM Secretariat, KARLO, universities & other Research Organisations
Demonstrate increase in research funding & output
Component V: Strengthening SLM Knowledge Management, M&E and Information Dissemination
Monitoring SLM technology generation and dissemination, and
Enhanced data on SLM Technology generation and
a) An electronic data set on SLM technologies & MIS established
b) Number of institutions/agencies
Baseline established at inception
Institutional M&E system &MIS established and
MENR, SLM coordination body, SLM
Increased capacity on knowledge sharing, advocacy
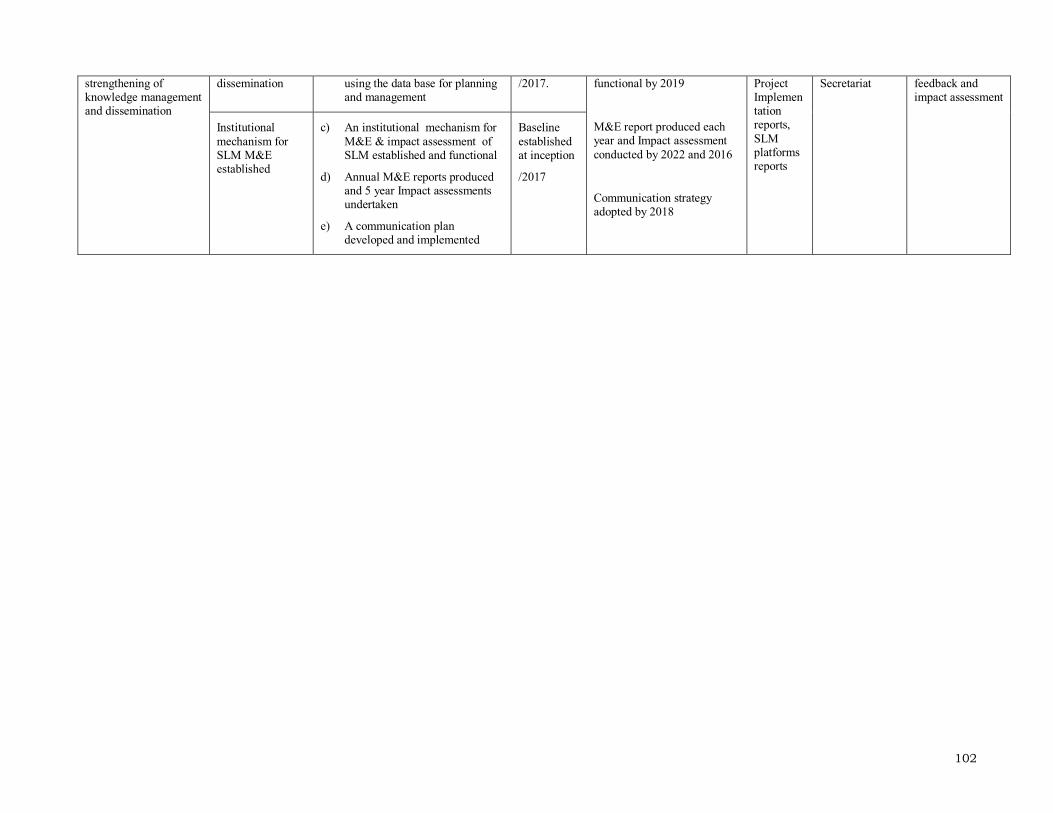
102
strengthening of knowledge management and dissemination
dissemination using the data base for planning and management
/2017. functional by 2019
M&E report produced each year and Impact assessment conducted by 2022 and 2016
Communication strategy adopted by 2018
Project Implementation reports, SLM platforms reports
Secretariat feedback and impact assessment
Institutional mechanism for SLM M&E established
c) An institutional mechanism for M&E & impact assessment of SLM established and functional
d) Annual M&E reports produced and 5 year Impact assessments undertaken
e) A communication plan developed and implemented
Baseline established at inception
/2017

103
Annex 4: Estimated Cost of Investments for KSIF Component-1 per Sub-Component and Priority Activities for the 10 Year Period
Component-1: Implement On-the-Ground Projects and Activities to Promote and Up-Scale SLM
Sub-Component Priority practices/Activities
Initial cost (US$)
Total Cost (US$)132
Unit Target Total Cost (US$)
Benefits (economic, ecosystem, climate)
1.1: Micro-Watershed Approach
Community Micro-projects set up and functional
500,000 550,000 # 500 275,000,000
Conserve critical catchments; improve soil & water management, improved yields and incomes. Improved ecosystems management.
1.2: Agroforestry Programmes
Tree seedlings distributed & planted
100 110 # 10,000,0
00 1,100,000,000
Improve soil fertility, reduce deforestation, reduce erosion and improve yields and incomes. Climate change and carbon sequestering measure/ practice
1.3: Soil& Water Conservation
Terracing, contour bunds, cut-off ditches, infiltration strips, vegetative buffers (10% of total cultivated areas)
400 440 Ha 400,000 176,000,000
Reduce soil erosion. Increase ground water recharge. Improve yields, incomes and ecosystem services. Climate change adaptation measure/practice
1.4: Integrated Soil Fertility Management
Conservation agric/other practices (10% of total cultivated area)
400 440 Ha 500,000 220,000,000 Enhance soil fertility, productivity and incomes.
1.5: Water Harvesting and Storage
Subsidy for storage structures (pans, ponds, weirs )
100,000 110,000 # 500 55,000,000 Improve water availability for farming, livestock and human use. Higher yields and incomes
1.6: Runoff harvesting (Runoff farming)
Runoff harvesting structures (micro-basins, bunds, trenches, pitting)
550 605 # 200,000 121,000,000 Check erosion; improve water availability, ground water recharge, productivity and incomes.
1.7: Tools and Equipment for SLM Implementation
Policy and small subsidy for equipment
10,000 11,000 # 10,000 110,000,000 Reduce drudgery, enhance land &labor productivity, and incomes
1.8: Supplemental Diversion structures, 3,000 3,300 Ha 50,000 165,000,000 Improve water availability for
132 Initial costs plus 10% maintenance and operational costs

104
Irrigation small storages farming, livestock and human use. Higher yields and incomes.
1.9: Energy Saving initiatives
biogas, micro & pico-hydro, energy saving jikos, LPG subsidies
500 550 # 20,000 11,000,000 Mitigation measure to reduce de-forestation, improve ecosystem management
1.10: Integrated Rangeland Management Programmes
Livestock Management 10,000,000 # 30 300,000,000 Improve land degradation in
ASALs, rangelands with improved productivity and incomes. Higher ecosystem management, and climate change adaptation and mitigation measure/practice.
Reseeding/Range management 2,000 2,200 Ha 500,000 1,100,000,000
1.11: Drainage of Waterlogging and Flood-Prone Areas
Construction of dykes. Land drainage structures
400,000 440,000 # 390 171,600,000 Make available land for economic activities, reduce losses and enhance yields and incomes
1.12: PES Schemes& carbon sequestering Pilot projects 1,000,000 1,100,000 # 20 22,000,000 Alternative funding mechanisms
and ecosystem management 1.13: Pollution Control
from Urban and Peri-Urban Areas
Solid waste recycling, storm water management
2,000,000 2,200,000 # 50 110,000,000 Reduce pollution and improve ecosystems management
1.14: Alternative Livelihoods
Micro-projects (eco-tourism, soil waste recycling, use of invasive species
1,000,000 1,100,000 # 200 220,000,000 Offer incentives for adoption of SLM practices diversify enterprises and safeguard incomes.
Total 4,156,600,000
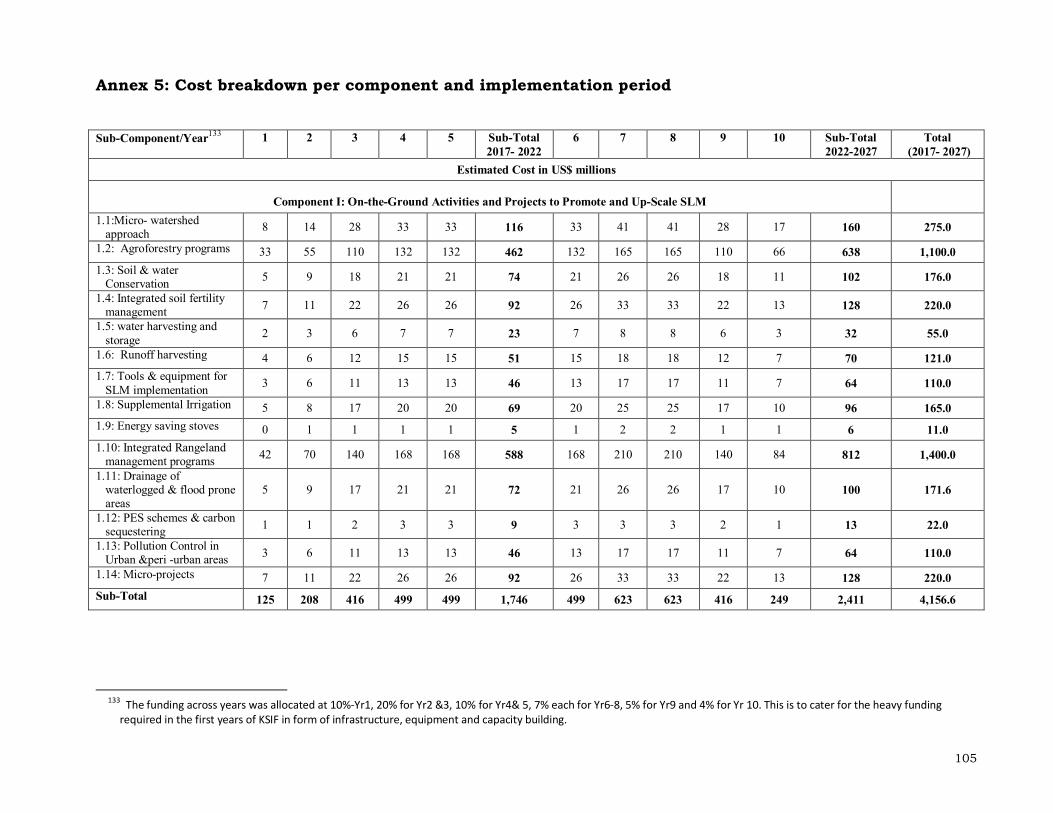
105
Annex 5: Cost breakdown per component and implementation period
Sub-Component/Year133 1 2 3 4 5 Sub-Total 2017- 2022
6 7 8 9 10 Sub-Total 2022-2027
Total (2017- 2027)
Estimated Cost in US$ millions
Component I: On-the-Ground Activities and Projects to Promote and Up-Scale SLM
1.1:Micro- watershed approach 8 14 28 33 33 116 33 41 41 28 17 160 275.0
1.2: Agroforestry programs 33 55 110 132 132 462 132 165 165 110 66 638 1,100.0 1.3: Soil & water
Conservation 5 9 18 21 21 74 21 26 26 18 11 102 176.0
1.4: Integrated soil fertility management 7 11 22 26 26 92 26 33 33 22 13 128 220.0
1.5: water harvesting and storage 2 3 6 7 7 23 7 8 8 6 3 32 55.0
1.6: Runoff harvesting 4 6 12 15 15 51 15 18 18 12 7 70 121.0 1.7: Tools & equipment for
SLM implementation 3 6 11 13 13 46 13 17 17 11 7 64 110.0
1.8: Supplemental Irrigation 5 8 17 20 20 69 20 25 25 17 10 96 165.0 1.9: Energy saving stoves 0 1 1 1 1 5 1 2 2 1 1 6 11.0 1.10: Integrated Rangeland
management programs 42 70 140 168 168 588 168 210 210 140 84 812 1,400.0
1.11: Drainage of waterlogged & flood prone areas
5 9 17 21 21 72 21 26 26 17 10 100 171.6
1.12: PES schemes & carbon sequestering 1 1 2 3 3 9 3 3 3 2 1 13 22.0
1.13: Pollution Control in Urban &peri -urban areas 3 6 11 13 13 46 13 17 17 11 7 64 110.0
1.14: Micro-projects 7 11 22 26 26 92 26 33 33 22 13 128 220.0 Sub-Total 125 208 416 499 499 1,746 499 623 623 416 249 2,411 4,156.6
133 The funding across years was allocated at 10%-Yr1, 20% for Yr2 &3, 10% for Yr4& 5, 7% each for Yr6-8, 5% for Yr9 and 4% for Yr 10. This is to cater for the heavy funding
required in the first years of KSIF in form of infrastructure, equipment and capacity building.

106
Component 2: Enhancing the policy, legal, institutional frameworks and investments in SLM134
2.1:inter-sectoral
coordination mechanism for SLM
23.8 47.5 47.5 23.8 23.8 166 16.6 16.6 16.6 11.9 9.5 71 237.6
2.2:Review and support for SLM policy environment
7.1 14.3 14.3 7.1 7.1 50 5.0 5.0 5.0 3.6 2.9 21 71.3
2.3:Review and support for legal and regulatory frameworks for SLM
9.5 19.0 19.0 9.5 9.5 67 6.7 6.7 6.7 4.8 3.8 29 95.0
2.4: Identify mechanisms to upscale investments/funding
7.1 14.3 14.3 7.1 7.1 50 5.0 5.0 5.0 3.6 2.9 21 71.3
Sub-Total 47.5 95.0 95.0 47.5 47.5 333 33.3 33.3 33.3 23.8 19.0 143 475.1
Component 3: Capacity Building to Strengthen the Technical, Socio-Economic and Support Services for SLM135
3.1: Building the capacity of the land users 44.5 89.1 89.1 44.5 44.5 312 31.2 31.2 31.2 22.3 17.8 134 445.4
3.2: Building the capacity of policy makers 4.5 8.9 8.9 4.5 4.5 31 3.1 3.1 3.1 2.2 1.8 13 44.5
3.3: Building the capacity of extension service providers 17.8 35.6 35.6 17.8 17.8 125 12.5 12.5 12.5 8.9 7.1 53 178.2
3.4: Capacity building for research support service providers
8.9 17.8 17.8 8.9 8.9 62 6.2 6.2 6.2 4.5 3.6 27 89.1
3.5: Strengthening the capacity of equipment & input suppliers
7.1 14.3 14.3 7.1 7.1 50 5.0 5.0 5.0 3.6 2.9 21 71.3
3.6: Improving access to credit and financial Services 2.7 5.3 5.3 2.7 2.7 19 1.9 1.9 1.9 1.3 1.1 8 26.7
3.7: Strengthening commercial and alternative livelihood options
3.6 7.1 7.1 3.6 3.6 25 2.5 2.5 2.5 1.8 1.4 11 35.6
Sub-Total 89.1 178.2 178.2 89.1 89.1 624 62.4 62.4 62.4 44.5 35.6 267 890.8
134 The bulk (50%) of funding allocated to component 2.1 to cater for coordination activities across the 47 counties, including the operations of the county SLM platforms.
Component 2.3 which also offers support to counties was allocated 20% of the funding while the rest of the sub-components were allocated 15% each of the total component funding.
135 Bulk of funding (50%) allocated to sub-component 3.1 to build capacity of land users across the country, 20% to sub-component 3.3 for building capacity of extension staff in 47 counties, 10% to research sub-component, 8% to input users sub-component, 5% to policy makers sub-component while the commercial advisory services and financial institutions sub-components are allocated 4% and 3% of the total component funding.

107
Component 4: Supporting Research and Extension for SLM Best Practices136
4.1: Participatory action research to inform SLM best practices
10.7 21.4 21.4 10.7 10.7 75 7.5 7.5 7.5 5.3 4.3 32 106.9
4.2: Support land users to conduct on-farm trials 8.3 16.6 16.6 8.3 8.3 58 5.8 5.8 5.8 4.2 3.3 25 83.2
4.3: Revitalize inter-sectoral extension system for SLM 4.8 9.5 9.5 4.8 4.8 33 3.3 3.3 3.3 2.4 1.9 14 47.5
Sub-Total 23.8 47.5 47.5 23.8 23.8 166 16.6 16.6 16.6 11.9 9.5 71 237.6
Component 5: Strengthening SLM Knowledge Management, M&E and Information Dissemination137 5.1:Documenting successful
SLM technologies and approaches
2.7 5.3 5.3 2.7 2.7 19 1.9 1.9 1.9 1.3 1.1 8 26.7
5.2:Establishing a Kenya SLM Information System (KSLM-IS)
4.5 8.9 8.9 4.5 4.5 31 3.1 3.1 3.1 2.2 1.8 13 44.6
5.3:Development and operationalization of M&E Framework
5.3 10.7 10.7 5.3 5.3 37 3.7 3.7 3.7 2.7 2.1 16 53.5
5.4: Dissemination of SLM knowledge to users 2.7 5.3 5.3 2.7 2.7 19 1.9 1.9 1.9 1.3 1.1 8 26.7
5.5: Development and implementation of SLM Communication Strategy
2.7 5.3 5.3 2.7 2.7 19 1.9 1.9 1.9 1.3 1.1 8 26.7
Sub-Total 17.8 35.6 35.6 17.8 17.8 125 12.5 12.5 12.5 8.9 7.1 53 178.2
Total Budget for the KSIF 302.8 564.1 772.0 676.9 676.9 2,992.9 623.51 748.2 748.209 504.7 320.64 2,945.3 5,938.3
136Basic research sub-component allocated 45% of funding to cater for basic research, laboratory & other equipment, transport and operational costs; support to land users 35%
for adaptive research and operations, and research- extension linkages 20% of the total component funding. 137 M&E subcomponent allocated 30% to set up the M&E across the country and for mid-term and final impact assessments, KSLM-IS sub-component allocated 25% to fund the
setting up of the MIS system and data collection tools, and the other three sub-components 15% of the total component funding.

108
Annex 6: Thematic maps showing criteria for geographic targeting of KSIF Annex6.1: Map of Kenya showing land degradation risk

109
Annex 6.2: Map of Kenya showing the major water towers
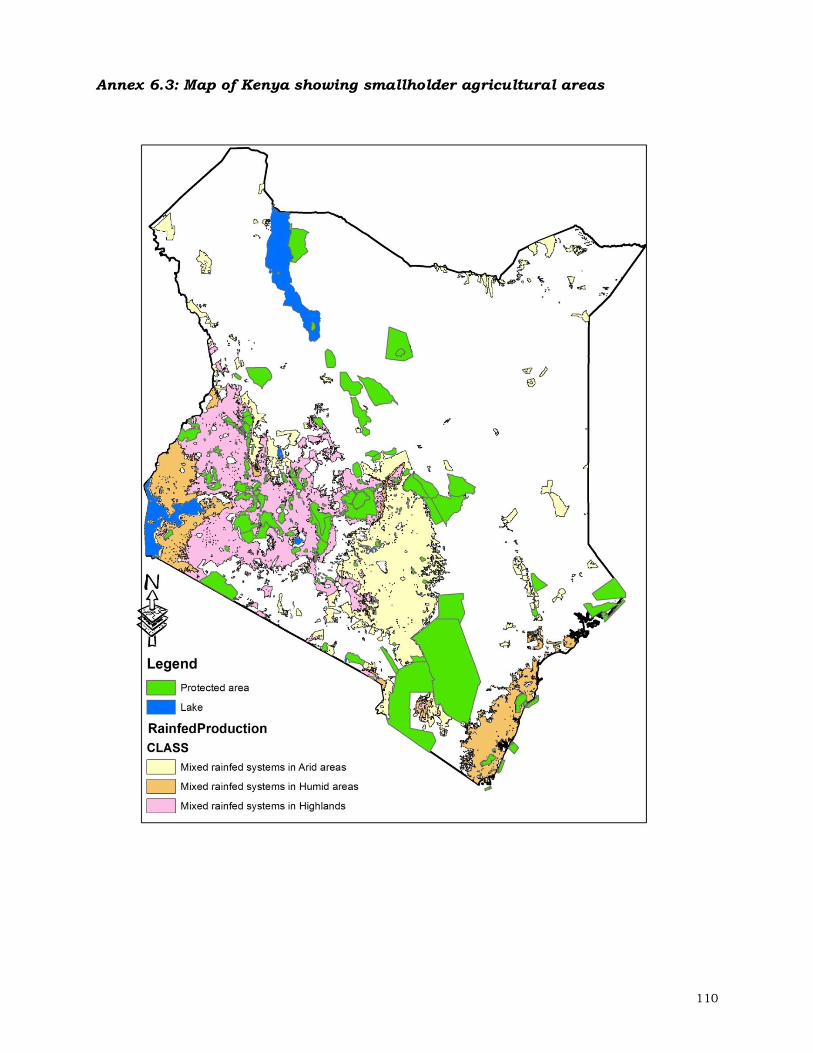
110
Annex 6.3: Map of Kenya showing smallholder agricultural areas

111
Annex 6.4: Map of Kenya showing cattle density and ASAL areas

112
Annex 6.5: Map of Kenya showing flood-prone areas

113
Annex 6.6: Map showing major urban centres in Kenya prone to land conversion
NAIROBI
Mombasa