2017 annual report - australian vintage · welcome to the 2017 annual report for australian vintage...
TRANSCRIPT

2017 ANNUAL REPORT

Head Office
275 Sir Donald Bradman Drive
Cowandilla SA 5033
T +61 8 8172 8333
F +61 8 8172 8399
Sydney Office
2 Queens Place
Balmain NSW 2041
T +61 2 8345 6377
F +61 2 8345 6366
Registered Office
275 Sir Donald Bradman Drive
Cowandilla SA 5033
T +61 8 8172 8333
F +61 8 8172 8399
Company Secretary
Michael Noack
Chief Financial Officer
Michael Noack
Auditor
Deloitte Touche Tohmatsu
11 Waymouth Street
Adelaide SA 5000
Bankers
National Australia Bank
500 Bourke Street
Melbourne Vic 3000
Share Register
Computershare Investor Services
115 Grenfell Street
Adelaide SA 5000
T +61 8 8236 2300
F +61 8 8236 2305
www.australianvintage.com.au
ACN 052 179 932
McGuigan Hunter Valley Cellar Door & Administration
Cnr Broke & McDonalds Roads
Pokolbin NSW 2320
T +61 2 4998 4199
F +61 2 4998 4188
Tempus Two Cellar Door
Cnr Broke & McDonalds Roads
Pokolbin NSW 2320
T +61 2 4993 3999
F +61 2 4993 3988
Nepenthe Cellar Door
93 Jones Road
Balhannah SA 5242
T +61 8 8398 8899
F +61 8 8398 8895
Buronga Hill Winery
557A Silver City Highway
Buronga NSW 2739
T +61 3 5022 5100
F +61 3 5022 5135
Merbein Packaging
2 Wentworth Road
Merbein Vic 3505
T +61 3 5021 9303
F +61 3 5021 6490
As a company so reliant on our environment and natural resources, we at Australian Vintage Limited are proud to produce our 2017 Annual Report on Carbon Neutral and 100% recycled paper.
EcoStar is an environmentally responsible paper made carbon neutral (CN) and the fibre source has been independently certified by the Forest Stewardship Council (FSC). ecoStar is manufactured from 100%
post consumer recycled paper in a process chlorine free environment under the ISO 14001 environmental management system which guarantees continuous improvement. Carbon Neutral: the carbon emissions of the
manufacturing process for ecoStar include: Incoming deliveries – raw materials and wrapping; Premises – energy consumption on site, waste treatment and disposal; Energy of materials – raw materials; Outgoing deliveries –
transportation of the finished product to Raleigh Paper warehouses have been measured and offset.
International Winemaker of the Year for a world record 4th time

Contents
Board of Directors 2
Chairman’s Report 4
Chief Executive Officer’s Report 6
Company Profile 8
Corporate Governance Statement 11
Shareholders’ Information 20
Directors’ Report 22
Declaration of Independence 38
Independent Audit Report 39
Directors’ Declaration 43
Financial Report
Consolidated Statement of Profit or Loss and Other Comprehensive Income 45
Consolidated Statement of Financial Position 46
Consolidated Statement of Changes in Equity 47
Consolidated Statement of Cash Flows 48
Notes to the Financial Statements
Note 1: General Information 49
Note 2: Adoption of new and revised Accounting Standards 49
Note 3: Summary of accounting policies 50
Note 4: Critical accounting judgments and key sources of estimation uncertainty 58
Note 5: Profit / (Loss) from operations 59
Note 6: Income taxes 60
Note 7: Key management personnel compensation 61
Note 8: Executive performance rights and share option plan 62
Note 9: Remuneration of auditors 63
Note 10: Current trade and other receivables 63
Note 11: Current inventories 64
Note 12: Other financial assets 64
Note 13: Other current assets 64
Note 14: Non-current inventories 64
Note 15: Other non-current financial assets 64
Note 16: Property, plant and equipment 64
Note 17: Goodwill 66
Note 18: Other intangible assets 67
Note 19: Water licences 67
Note 20: Assets pledged as security 68
Note 21: Current trade and other payables 68
Note 22: Current borrowings 68
Note 23: Other current financial liabilities 68
Note 24: Current provisions 68
Note 25: Other current liabilities 68
Note 26: Non-current borrowings 69
Note 27: Non-current other financial liabilities 69
Note 28: Non-current provisions 69
Note 29: Provisions 69
Note 30: Employee superannuation plans 69
Note 31: Issued capital 70
Note 32: Reserves 70
Note 33: Accumulated losses 70
Note 34: Earnings per share 71
Note 35: Dividends 71
Note 36: Leases and other commitments 72
Note 37: Contingent liabilities 72
Note 38: Subsidiaries 73
Note 39: Segment information 76
Note 40: Related party transactions 77
Note 41: Notes to the cash flow statement 78
Note 42: Financial instruments 79
Note 43: Events after the reporting period 87
Note 44: Parent Entity Disclosures 88

2 :: BOARD OF DIRECTORS
PERRY R GUNNER Non-Executive Director
Over 30 years’ experience in the wine industry. Former Chairman and Chief Executive Officer of
Orlando Wyndham Group Pty Limited. Chairman of Freedom Foods Group Limited and Deputy
Chairman of A2 Corporation Limited (N.Z.). Chairman of the Risk Committee.
After 20 years of service to the company, Perry resigned on 30th August, 2017.
RICHARD H DAVIS Chairman
Chairman of Monash IVF Group Limited and Director (and previously CEO) of InvoCare Limited
where he previously spent almost 20 years growing and managing the business. Former
accounting partner for a national accounting firm.
NEIL A MCGUIGAN Chief Executive Officer
Neil was previously the General Manager of Production and Wine Supply at Australian Vintage
Limited. He was appointed as a Director and as the CEO on 21 July 2010. Neil has over 37
years’ experience in the wine industry. He previously worked at the then privately owned Briar
Ridge before leaving in 2000 to run Rothbury Estate and its satellites in the Upper Hunter, Cowra
and Mudgee for the Foster’s Group.
Australian Vintage Board of Directors

BOARD OF DIRECTORS :: 3
PETER J PERRIN Non-Executive Director
General Manager of Torbreck Vintners. Trustee of The Wolf Blass Foundation. Peter has spent
35 years in the Australian Wine industry. His experience spans living in the USA in the early 80’s
launching the first successful push of Australian wines into North America with Lindeman’s. He then
joined Wolf Blass as the first export manager, travelling the world and establishing international
sales offices’ for Mildara Blass and Beringer Blass estates over the next 15 years. Peter has sat on
many Australian Wine Industry Boards and run a number of successful wine companies.
JIANG YUAN (DIXON) Non-Executive Director
Founder of www.yesmywine.com, the largest imported wine platform in the world, based in China.
Well known for pioneering data analytics and an innovator in imported wines in China, Dixon has
considerable experience in distribution and selling of wine into Asia.
JOHN D DAVIES Non-Executive Director
Fellow of the Institute of Chartered Accountants having worked for 36 years with Ernst & Young.
John was elected to Ernst & Young’s Asia Pacific Board of Partners for a 6 year period until his
retirement in 2011. During his career he provided professional services to many of Australia’s
leading wine companies and he also owns a commercial vineyard in central Victoria. Chairman
of the Audit Committee.
NASEEMA SPARKS AM Non-Executive Director
Currently Deputy Chairperson of Racing NSW and Director of Melbourne IT Limited, PMP
Limited, Grays e-Commerce Group Ltd and AIG Australia. Former Chairperson of Deals Direct
Group with extensive experience in marketing and digital media after a successful career with
M&C Saatchi, one of Australia’s largest and most successful advertising businesses. Naseema
holds post graduate market and research qualifications and an MBA from Melbourne Business
School. Chairperson of the Remuneration and Nomination Committee.

4 :: RICHARD DAVIS | CHAIRMAN’S REPORT
Dear Shareholder
Welcome to the 2017 Annual Report for Australian Vintage Limited (AVL).
In the year ended 30 June 2017, AVL recorded a net profit after tax of $4.3 million compared to a loss of $2.2 million in the prior period. Excluding the one-off payment in 2016 for the vineyard lease termination, this year’s result of $4.3 million compares to $7.0 million in the prior period. Cash flow from operating activities improved by $7.5 million to $14.0 million. The unfavorable GBP impacted our result significantly and based on the average exchange rate that was present in the 2016 financial year, this year’s cash flow would have been $4.7 million higher and our after tax profit would have been $3.3 million higher.
Over the last couple of years, we have been able to exit an onerous vineyard lease and onerous grape supply contract. This has enabled AVL to reduce the cost of grapes through the replacement of most of these grapes with grapes at market price. The Company calculated grape cost savings of between $8.0 million to $9.0 million
per year when compared to the average grape prices paid in 2015. Whilst these grape savings have been achieved when compared to 2015 prices, the benefits have been slightly eroded due to increasing grape prices since 2015. Furthermore, the underutilisation of our large winery, where we processed 93,000 tonnes against a capacity of 120,000 tonnes, has added costs to our wine. We have recently signed a processing agreement which will remedy most of the future winery underutilisation issue.
AVL continues to grow its branded business with sales volumes of AVL’s three key brands, McGuigan, Tempus Two and Nepenthe continuing to grow against some market conditions that have seen wine volumes decline. The current strategy of increasing sales of our three key brands, growing our export business and controlling costs is the right strategy. This strategy has remained consistent over the last 5 years.
Whilst the UK continues to be our main overseas market, we have a strong focus on growing and strengthening our distribution channels in the key overseas markets of Asia and the United States. In the 6 month period to 30 June 2017, our sales into Asia have increased by 60% when compared to the same 6 month period in the previous financial year. Whilst some of this increase is due to timing of orders, it does reflect that our focus on Asia is starting to achieve positive results. Our distributor in the United States, Palm Bay, have launched Tempus Two to great acceptance with the launch of McGuigan “The Plan” to be executed in early 2018.
The UK market remains a tough market with the exchange rate making it hard to achieve a satisfactory return. AVL has taken some price increases but these increases have not covered the impact of the unfavourable exchange rate. For the next 12 months, we will continue to focus on improving sales mix and implementing further price increases.
Whilst the margins from the UK are currently not what we expect, we maintain our faith in this market and believe that in the medium to long term, margins will improve. It is also important to understand that this market provides AVL with significant volume of sales which in turn is critical to controlling our stock levels and ensuring that our large winery is utilised efficiently by processing as many tonnes as possible.
In May 2017, AVL made a strategic decision to issue 15% of its existing capital at a 7.1% premium to Vintage China Fund. The issue of the shares at 46.01 cents per share raised $16.5 million and most of these funds will be used for capital projects that will provide for greater efficiency at our production facilities. Also, as part of this share placement, Vintage China gained exclusive rights to distribute AVL products, excluding McGuigan brands, into mainland China.
Due to the continued growing confidence in the medium to long term outlook of the Company, the Board has agreed to pay a dividend. A fully franked dividend of 1.0 cents per share will be paid to all eligible shareholders on 10 November 2017 and the Company’s Dividend Reinvestment Plan will also be in operation.
Sales and EBIT Revenue for the year decreased 7% or $16.2 million due to the unfavourable foreign currency which accounted for $17.5 million of this decrease.
Australasia / North America packaged sales, which covers Australia, New Zealand, Asia and North America were down 1% on last year with an increase in bottled sales of 1% and a decrease of 6% in our cask sales:
• Australian sales decreased by 2% due to a 6% decline in cask sales. This decline is in line with the cask consumption trends in the Australian domestic market.
• Sales to New Zealand were down due to new legislation on promotion depth and frequency. Since this new legislation was introduced, sales have recovered to levels seen in the previous year. In the last 6 months, sales to New Zealand have been in line with the previous year’s corresponding period.

RICHARD DAVIS | CHAIRMAN’S REPORT :: 5
• Sales to Asia have grown by 19% with the last 6 months sales showing a 60% sales growth when compared to the same corresponding 6 month period in the prior period.
• North America sales were down 2% due to increased margin expectation from the liquor boards in Canada. Sales through our United States based distributor, Palm Bay, are in line with expectation.
UK/Europe packaged and bulk sales were down by 14% on last year with packaged sales down 12% or $12.3 million and bulk and private label sales down 54% or $1.8 million. The unfavourable GBP negatively impacted packaged sales by $17.3 million when compared to the prior period.
Earnings before interest and tax (EBIT) is $11.3 million compared to $3.2 million in the prior period. Before one off items, EBIT is $11.3 million compared to $16.4 million:
• Australasia / North America packaged segment EBIT is in line with last year;
• The UK / Europe segment was significantly impacted by the unfavourable GBP. Actual sales volumes improved on last year in a market that saw wine sales decline. The contribution from this segment was down by $3.3 million due to the unfavourable GBP.
• Australasia / North America Bulk segment contribution declined by $1.5 million due to losses on some bulk wine sales. These bulk sales were made to remove wine that was not required for future sales
Financial Position Cash flow from operating activities improved by $7.5 million to $14.0 million due mainly to lower grape costs partially offset by the unfavourable movement in foreign currency which impacted cash flow by negative $4.7 million.
The gearing ratio (net debt to total equity) is at a comfortable 29% compared to 38% as at June 2016. The improved gearing is due to the recent share placement and improved cash flow.
OutlookAVL continues to focus on growing its three key brands, McGuigan, Tempus Two and Nepenthe and whilst the last 12 months have been challenging, due mainly to the unfavourable GBP, we remain confident that our strategy is the correct one.
One of the most pleasing aspects of our business is the cash flow from operating activities which improved by $7.5 million over the prior period.
As foreshadowed in our May 2017 press release on the placement to Vintage China, the company will be undertaking several major capital projects to further improve efficiencies and quality of wine.
Our total capital spend for the next 12 months will be approximately $19.0 million and will focus on:
• Major efficiency upgrades at the Buronga Hill Winery
• Efficiency improvements at our Merbein packaging facility
• Vineyard developments at existing owned vineyards
Our proposed capital spend will incorporate several sustainability initiatives including:
• The completion of the 1,640Kw solar panel system at our Buronga Hill Winery
• The installation of a 300Kw solar panel system at our Merbein Packaging facility
• The development of a vineyard adjacent to our Buronga Hill Winery that will use the waste water from the winery
AVL has transformed over the last 10 years from a bulk wine company to a quality and well respected branded wine business. This global transformation will continue as we push into the Asian and US markets. Our persistence on improving efficiency will mean that AVL will spend $19.0 million on capital projects over the next 12 months.
Board RetirementAt the end of August 2017, one of our directors, Perry Gunner, retired from the Board. Perry has had a long association with AVL having been appointed a director of Simeon Wines Limited in 1993 and continuing his directorship through the successful merger between Simeon Wines Ltd and Brian McGuigan Wines Ltd in 2002 to form McGuigan Simeon Wines Ltd which changed its name to Australian Vintage Ltd in 2008.
During Perry’s time, as non-executive director, chairman of the Risk Committee and member of the Remuneration and Nomination Committee, his extensive business and wine industry knowledge has contributed greatly to the growth of the business from listing through to where we are now.
I would like to congratulate Perry for his dedication and leadership and wish him all the best for the future.
On behalf of the Board and shareholders I would like to thank Neil McGuigan, his management team and all the staff of Australian Vintage who continue to overcome the challenges with innovation, commitment and enthusiasm.
Finally, I would like to thank our shareholders, for your ongoing investment, support and belief in this Company.
RICHARD DAVIS Chairman
6 :: NEIL MCGUIGAN | CHIEF EXECUTIVE OFFICER’S REPORT
Dear fellow shareholders,
The 2017 financial year was another year of brand growth, sales consolidation in AVL’s traditional markets and the emergence of new opportunities in the USA and in China. Management is disappointed with the company’s FY17 profit result which was largely driven by the outcome of the Brexit vote in the UK. Despite this, cashflow due to our trading activities was encouragingly positive by $14 million.
AVL’s result was adversely affected by two issues during FY17.
1. Brexit
The weakening of the GBP against the Australian dollar continued to unfavourably affect our margins in the UK. However, management remains confident that our strategy for the UK is correct as we continue to drive the McGuigan brand in the independent sector. Over the last twelve months this has helped the McGuigan brand volume grow by 6% in the UK against a market that saw Australian exports to the UK decline by 10%. Other opportunities are also starting to emerge for Tempus Two and for some of our bespoke ranges. Interestingly, if the FY16 average exchange rate was mirrored in FY17 our profit would have been $7.6 million and cash flow would have been $18.7 million.
2. Price Realisation
The success of the Black Label brand in Australian retail created great competition between chains which saw a decline in the selling price of our most important range. For the long-term health of the brand, management took a stance to decrease promotional support which resulted in a short term slowing of sales in Australia. Sales of Black Label are now back on track but at a more realistic selling price for wines of this quality.
At the same time management was resolving these issues two very positive developments occurred in the USA and China.
The signing of a distribution agreement with Palm Bay for the Tempus Two and McGuigan brands in the USA was a great outcome for the business. Palm Bay is a very large and well-respected national distributor in the USA. They have already launched the Tempus Two brand and after considerable label and product research they will be launching McGuigan “The Plan” in January 2018.
Plus, the signing of a second distribution agreement in China for all AVL’s brands (apart from McGuigan) was also a very exciting development during 2017. The distribution agreement with Vintage China was coupled with a 15% share placement at a 7.1% premium to market price.
We are confident that AVL can establish a significant second distribution channel in China through Vintage China.
The Company’s strategies articulated previously remain, those being:
• Growing and strengthening our distribution channels in the China / Asia region, UK and North America.
• Building branded sales and profitability both domestically and internationally. This includes creating appropriate new products for developing and emerging markets.
• Reviewing and decreasing our cost base.
The next few years show robust sales, marketing and advertising campaigns to continue to drive the branded business. This is the correct strategy and we will never waiver from this direction.
Australian Vintage has continued to
enhance our brands award winning
credentials, with some outstanding
performances across the board

NEIL MCGUIGAN | CHIEF EXECUTIVE OFFICER’S REPORT :: 7
NEIL MCGUIGAN Chief Executive Officer
This year we’ve continued to enhance our brands award winning credentials, with some outstanding performances across the board.
McGuigan Awards
• In 2016 McGuigan received a total of 425 awards, including 27 Trophies; 73 Gold and 121 Silver medals.
• McGuigan Wines is the only winery in the world to have been crowned International Winemaker of the Year four times by the prestigious International Wine & Spirits Competition in London, having achieved the feat in 2009, 2011 and 2012, and again in 2016.
• Australian Winery of the Year, 2017 New York International Wine Competition. This USA award is incredibly timely for us considering the launch of “The Plan” in January 2018.
Tempus Two Awards
• In 2016 Tempus Two received a total of 133 awards, including 6 Trophies; 14 Gold and 39 Silver medals.
• Cairns Wine Show: Champion White of Show – Tempus Two Pewter Series Chardonnay Poppy’s Block 2015
• Hunter Valley Wine Show: Best Rosé of Show Trophy – Tempus Two Copper Series Shiraz Rosé 2016
Nepenthe Awards
• In 2016 Nepenthe received a total of 185 awards, including 3 Trophies; 15 Gold, and 35 Silver medals.
• Sydney Royal Wine Show: Best Other White Varietal Trophy - Nepenthe Winemakers Selection Gruner Veltliner 2016.
• Hong Kong IWSC: Best Chardonnay Trophy - Nepenthe Pinnacle Ithaca Chardonnay 2015
• Australian Cool Climate Wine Show: Best Other Dry White Varieties and/or Blends Trophy - Nepenthe Winemakers Select Viognier 2015
• Adelaide Hills Wine Show: Best Other White Varieties Trophy - Nepenthe Winemaker Select Arneis 201
We are committed to continuing to inspire and delight our consumers the world over, as highlighted by our promotional programmes that are carried out across our key markets.
McGuigan Wines
This year we focussed on two above the line advertising campaigns around “Bring a McGuigan” and the crowning of McGuigan Wines as the International Winemaker of the Year for the fourth time.
Both campaigns were run in Australia and the UK and delivered the required ‘cut through’ to move the McGuigan brand awareness from 43% to 50% in Australia, and from 28% to 30% in the United Kingdom.
Tempus Two
Tempus Two has continued to build its positioning of “elegance with attitude” through high profile brand partnerships and sponsorships, namely Mercedes Benz Fashion Week; Portsea Polo and the Victorian Polo Season; and a partnership with internationally renowned design label Bec + Bridge.
The brand can now be found in the USA and in the United Kingdom through premium retailer Waitrose, and in China through our national distributor Vintage China.
Nepenthe Wines
Small batch boutique winery Nepenthe continued to hold true to the mantra of Nepenthe is the Adelaide Hills through an association with leading ‘foodie’ festival Taste Melbourne, as well as flying the flag for the region with several high-profile wine show trophies and wine writer reviews. After years of planning, the launch of the super-premium Nepenthe Apex range is well advanced and timed for May next year as chief winemaker James Evers continues to put his stamp on the brand.
Finally, your management team remains very confident that our strategies will deliver the business to an appropriate level of return in the future. However, we must remain patient and continue to drive the branded sales and at the same time control costs, innovate and develop new opportunities.
Rest assured we are committed to delivering on our plans and we remain optimistic about the long-term future of our company.

8 :: COMPANY PROFILE
Australian Vintage is a leading Australian wine company. With a fully integrated wine business model, the breadth of our capabilities extends to vineyards, boutique and large volume wine production, packaging, marketing and distribution.
With significant vineyard holdings and leases across South-Eastern Australia, we pride ourselves on producing outstanding and innovative wines for wine lovers the world over. This is reflected in our commitment to quality grape and wine production, the strength of our dynamic and award-winning wine brands, and the passion of the people behind them.
Today Australian Vintage is at the forefront of the Australian wine industry with our vineyards and grape supply capacity extending throughout some of Australia’s most captivating and diverse wine regions including the Hunter and Barossa Valleys; the Murray-Darling, Langhorne Creek and Limestone Coast regions; as well as the Adelaide Hills and Eden Valley.
Our dynamic and award-winning wine brands are recognised and enjoyed across the globe. Over the past twelve months we continued our international awards success at the world’s most prestigious wine competitions, with our wines consistently winning trophies, ‘best in class’ and ‘best in show’ accolades. Over the course of the year McGuigan received a total of 425 trophies and medals, including 27 Trophies; 13 Top Gold; 60 Gold; 6 Top Silver and 115 Silver medals.
McGuigan Wines continued to cement its award-winning pedigree after being crowned International Winemaker of the Year for a world record fourth time at the prestigious International Wine & Spirits Competition in London. Having already achieved the feat in 2009, 2011 and 2012, McGuigan Wines is the only winery in the world to have been recognised as ‘the world’s best winemaker’ four times. The success was built, in part, on the back of McGuigan Handmade Shiraz 2007, which was awarded the coveted Shiraz | Syrah Trophy.
It's a timely result given the brands planned launch into the United States market in early 2018, McGuigan Wines was awarded the Australian Winery of the Year Trophy at the New York International Wine Competition on the back of a host of trophy and gold medal wins.
At the Decanter World Wine Awards in London, the 2007 McGuigan Shortlist Semillon was awarded the Best Single Variety £15+ Trophy. In other words, the #1 wine – across all single varietal white, red and sparkling wines £15+ – of show. Success also followed at the Decanter Asia Wine Awards with McGuigan taking home the Best Australian White Single Varietal Trophy, again for the McGuigan Shortlist Semillon 2007.
McGuigan Wines was shortlisted for White Winemaker of the Year at the International Wine Challenge in London, having taken the title in 2009, 2012 and 2013. Central to the success was the McGuigan Shortlist Riesling 2010 which was awarded the Australian White Wine of Show Trophy.
Completing a fantastic year for the brand, McGuigan Wines was also awarded the Best Australian Wine Trophy at the Hong Kong IWSC; Best Dry White Wine of Show Trophy at the Rutherglen Wine Show; the Champion Chardonnay of Show Trophy at the National Cool Climate Wine Show and the Best Wine of Show Trophy at the Perth Wine Show.
Tempus Two continued to enjoy stand out success on the domestic and international show circuits, receiving a total of 133 trophies and medals, including 6 Trophies; 2 Top Gold; 12 Gold; and 39 Silver medals over the past twelve months. One of the highlights was the Cairns Wine Show where the Tempus Two Pewter Series Chardonnay Poppy’s Block 2015 was awarded the Champion White in Show Trophy and overall Champion Wine in Show Trophy. The China Wine & Spirits Awards delivered more accolades, with the brand winning the Australian Wine of the Year Trophy for the Tempus Two Pewter Series Chardonnay 2014.
The Tempus Two Pewter Series Chardonnay Poppy’s Block 2015 continued its outstanding performance, taking home the Best Chardonnay of Show Trophy and Best Wine of Show Trophy at the Riverina Wine Show, whilst rosé was back in fashion at the Hunter Valley Wine Show with the Tempus Two Copper Series Shiraz Rosé 2016 being awarded the Best Rosé of Show Trophy.
Small batch boutique winery Nepenthe continued to shine, picking up the Best Other White Varietal Trophy at the Sydney Royal Wine Show for the standout Nepenthe Winemakers Selection Gruner Veltliner 2016. Another alternate variety, Nepenthe Winemakers Select Viognier 2015 triumphed at the Australian Cool Climate Wine Show winning the Best Other Dry White Varieties and | or Blends Trophy whilst the Nepenthe Winemaker Select Arneis 2016 made it a trifecta of wins for alternate varieties taking home the Best Other White Varieties Trophy at the Adelaide Hills Wine Show.
Nepenthe continued to excel abroad, with the Hong Kong IWSC recognising the Nepenthe Pinnacle Ithaca Chardonnay 2015 with the Best Chardonnay of Show Trophy, and the China Wine & Spirit Awards bestowing Double Gold on the Nepenthe Pinnacle Gateblock Shiraz 2013 and Double Gold on the Nepenthe Altitude Sauvignon Blanc 2015.
Our core branded portfolio has continued to outperform the market both domestically and in key export countries. Quality, consistency and value – along with ongoing and sustained international awards – have resulted in our brands enjoying excellent growth globally.

COMPANY PROFILE :: 9
Wine brands
McGuigan Wines
The McGuigan name is synonymous with Australian winemaking. Four generations of the McGuigan family have made wine their life demonstrating a deep commitment and passion for Australian wine. This energy, drive and uncompromising dedication to craft the finest Australian wines is reflected in our international success, having been crowned International Winemaker of the Year at the prestigious International Wine & Spirits Competition (IWSC) in London a record four times, becoming the only winery worldwide to have done so.
A global brand available throughout the world, our winemaking philosophy and Hunter Valley heritage keeps us grounded. Quality, consistency and value are at the core of everything we do, yet we are progressive, continuing to innovate and operate as the consumer’s champion and their accessible guide to wine. It’s this point of difference that drives us to always make the best possible wine at the best possible price, constantly exceeding customer expectations by over-delivering on quality on every occasion.
Tempus Two
Tempus Two’s roots are firmly planted in one of Australia’s oldest wine regions, the Hunter Valley. Our award winning, architecturally designed Cellar Door is set among the rolling green vineyards of Pokolbin, in the heart of the Hunter Valley, and embodies the true spirit of Tempus Two; wines that look as good as they taste.
Tempus Two is synonymous with style, and it is reflected in everything we do. Our labels and bottles – whilst different and non-conventional - are the epitome of style. Our wines are developed with passion and sophistication and are a testament to our contemporary and distinctive look and feel. The company we keep reflects this – we’re aligned with like-minded fashionable brands including Mercedes Benz Fashion Week and the Portsea Polo season.
Tempus Two is elegance with attitude.
Nepenthe Nepenthe is situated in the cool climate, high altitude and picturesque Adelaide Hills region in South Australia. Our hand-crafted, premium and award-winning cult wines are built on the strength of varietal faithfulness and subtle regional nuances. Passionate winemaking, innovative grape varieties and careful vineyard management ensure that Nepenthe’s exciting and elegant range of wines are the benchmark for the region.
Our mantra is simple - Nepenthe is the Adelaide Hills.

NET PROFIT - $MILLION
2013 7.12014 10.52015 9.42016 (2.2) 2017 4.3 -2 0 2 4 6 8 10 12
10 :: COMPANY PROFILE
EBIT (BEFORE ONE OFF ITEMS) - $MILLION
2013 20.82014 19.72015 16.72016 16.42017 11.3 0 5 10 15 20 25 30 35
TOTAL REVENUE - $MILLION
2013 208.52014 214.82015 230.92016 242.72017 226.5 0 40 80 120 160 200 240 280
EBITDA (BEFORE ONE OFF ITEMS) - $MILLION
2013 27.92014 26.82015 23.32016 23.82017 18.7 0 5 10 15 20 25 30 35
CASH FLOW FROM OPERATING ACTIVITIES - $MILLION
2013 (4.3)2014 (3.6)2015 2.12016 6.52017 14.0 -6 -3 0 3 6 9 12 15
EARNINGS PER SHARE - CENTS
2013 5.32014 5.12015 4.02016 (0.9)2017 1.8 -1 0 1 2 3 4 5 6

CORPORATE GOVERNANCE STATEMENT :: 11
The Directors are responsible for the corporate governance practices of the Company. This statement sets out the main corporate governance practices of the Company which the directors, management and employees of the Company are required to follow.
Following a full review of its corporate governance systems and policies, the Company’s corporate governance practices have, in the opinion of the Board, complied with the third edition of the Corporate Governance Principles and Recommendations published by the ASX Corporate Governance Council, for the period ended 30 June 2017.
Each of the Corporate Governance Principles and Recommendations published by the ASX Corporate Governance Council (“ASX Principles”) are referred to consecutively below and the information provided under each Principle is done so in accordance with recommendations made by the ASX Corporate Governance Council.
IntroductionCorporate Governance is the system or process by which a company is directed or controlled. It is concerned with the manner in which the Directors ensure that an organisation’s systems and processes are properly controlled and functioning effectively and that management is complying with the policies and directives of the Board. Corporate Governance structures provide a controlled process for risks taken by a company to be subjected to accountability and control systems commensurate with the risks involved.
ASX Principle 1: Lay Solid Foundations for Management and Oversight
Recommendation 1.1 - Roles and Responsibilities of the Board of Directors and Management
Board information contained in this Corporate Governance Statement and the Board Charter can be found at www.australianvintage.com.au.
Responsibility for the overall direction and management of the Company, the Company's corporate governance and the internal workings, including establishing goals for management and monitoring the attainment of these goals, of the Company will rest with its board of directors (“Board”).
The primary responsibilities of the Board include:
• the establishment of the long-term goals of the Company and strategic plans to achieve those goals;
• ensuring that the Company has implemented adequate systems of internal controls and codes of conduct together with appropriate monitoring of compliance activities;
• provision of strategic guidance for the Company and oversight of management of the Company including ensuring that systems are in place to facilitate the effective management of the principal risks of the Company;
• appointing and overseeing the Chief Executive Officer and ratifying the appointments of the Chief Financial Officer and the Company Secretary;
• the review and adoption of annual budgets for the financial performance of the Company and monitoring the results on a monthly basis; and
• establishment of proper succession plans for management of the Company.
The Company's management has authority to implement all other aspects of the management of the Company which are not reserved to the Board or Board committees (including the implementation of Board strategies). The management of the Company is conducted by the Chief Executive Officer. The Chief Executive Officer is accountable to the Board for all authority delegated to executive management. The roles of Chairman and Chief Executive Officer are separate. A further detailed list of Board responsibilities can be found in the Board Charter available at www.australianvintage.com.au in the "Investors" section under “Corporate Governance”.
Recommendation 1.2 - Checks and Information
In relation to appointing a new person, or putting forward to shareholders a candidate for election, as a director the Company will verify via appropriate independent checks that any new proposed director is capable of holding a position as a director and is a fit and proper person for that purpose as per the requirements of the Corporations Act and other relevant legislative requirements.
In addition, the Company will continue to provide Shareholders with all material information in its possession relevant to a decision whether or not to elect or re-elect a director.
Recommendation 1.3 - Written Agreements
The Company has written agreements in place with each Director and Senior Executive setting out the terms of their appointment.

12 :: CORPORATE GOVERNANCE STATEMENT
Recommendation 1.4 - Company Secretary
The Company Secretary is accountable directly to the Board, through the Chair, on all matters to do with the proper functioning of the Board.
Recommendation 1.5 - Workplace Diversity
At Australian Vintage we recognise that an inclusive culture which embraces diversity is integral to our continuing success. The Company is committed to diversity in the workplace and has implemented a group-wide Diversity Policy. The details of the Policy are available at www.australianvintage.com.au in the "Investors" section under “Corporate Governance”.
In accordance with its Diversity Policy, the Board has adopted measurable objectives for achieving gender diversity. All levels of management are required under the Company’s Diversity Policy to monitor and report annually to the Remuneration and Nomination Committee of the Board on the progress and effectiveness of these objectives.
In relation to the constitution of the Board, the Company has a number of initiatives in place to meet its strategic imperative of ensuring the Company has a diverse Board and to achieve its measurable objective regarding Board diversity. These include:
• ensuring a diverse range of qualified candidates is considered for Board appointments;
• evolving a Board skills matrix and using the matrix to identify any gaps in the experience, skills and background, including gender and diversity generally, of Directors on the Board;
• participating in programs to assist in the development of a broader pool of skilled and experienced Board candidates;
• including diversity as a regular agenda item for Committee meetings; and
• reporting on the use of professional intermediaries (such as external search firms) to identify and assess qualified candidates.
The Board will continue to review its structure and membership to ensure that it meets operational requirements and will endeavour to continue to maintain Board diversity in the future.
Similar initiatives are in place to meet the objective of a diverse management team.
The objectives for diversity for FY17, along with outcomes achieved are as follows:
Workplace Diversity Objective FY17 Workplace Diversity Outcomes FY17
Strategy
• Continue to drive and bring to life the gender objectives and strategies outlined in the Company’s Diversity Policy.
• Communicate the Company’s diversity agenda to the business and actively promote its benefits.
• The Company has published its Diversity policy; and along with other key employee communications supports and advocates for diversity and other workplace initiatives throughout the year
Stakeholder Management
• Actively promote the Company’s diversity agenda in day to day activities with management to achieve buy in and to integrate into the Company’s culture.
• Improved workplace flexibility with increased job share and part-time arrangements.
Gender Composition
• Maintain female representation of 20% on the Board.
• Maintain female representation in management roles in line with national benchmarks.
• The appointment of two new Directors to the Board resulted in a slight drop in female representation to 16.67%. While gender diversity has decreased, diversity in other areas such as age and ethnicity have increased due to the appointment of Jiang Yuan to the Board.
• The senior management composition has increased to 20% female representation.

CORPORATE GOVERNANCE STATEMENT :: 13
Workplace Diversity Objective FY17 Workplace Diversity Outcomes FY17
Talent Pipeline
• Ensure that the Company’s recruitment and selection procedure reflects candidate and interview panel diversity along with equal gender candidate split where possible.
• Analyse talent matrix to identify female talent for mentoring/succession planning.
• The Company’s recruitment and selection processes resulted in 37.5% of all permanent appointments within FY17 being female.
• The Company’s succession planning was undertaken at senior management level in FY17, with 20% of potential successors identified being female. The company is targeting an equitable ratio for succession by FY20.
Benefits
• Promote the Company’s parental leave procedures and flexible work arrangements policy to retain talent.
• 13 Employees enjoyed the benefits of either Parental Leave or Paternity Leave during FY16, with:
– 12 females accessing a period of Parental Leave (with an 91.66% return to work rate in either full or part-time capacity); and
– 1 male accessing their Paternity Leave provisions.
The above objectives remain in place for FY18 and the Company commits to continuing progress with respect to workplace diversity.
The following tables show the proportional representation of men and women at various levels within the Company’s workforce as at 30 June 2017.
Workforce Gender Profile
ALL STAFF TOTAL FEMALES TOTAL MALES % OF FEMALES % OF MALES
Total Employees 423 145 278 34.27% 65.72%
Non-Executive Directors 6 1 5 16.67% 83.33%
Senior Executives* 10 2 8 20% 80%
Other (Non Production)(inc UK / HK)** 168 84 84 50% 50%
Other (Production) 255 61 194 23.93% 76.07%
* Senior Executive has been defined as a member of the Company’s Leadership Team.
** Includes the Senior Executives.
Recommendations 1.6 and 1.7 - Board and Executive Performance Evaluation
The Board undertakes a peer assessment review of the performance of the Chief Executive Officer each year. Numerous performance indicators have been developed to assist in the assessment.
The Board also conducts an annual review of Board performance in accordance with the Company’s Board Performance Measurement policy, which is available at www.australianvintage.com.au in the "Investors" section under “Corporate Governance”.
The Chief Executive Officer reviews performance of key executives continuously on an informal basis (by assessing achievements against budgets and other goals and key performance indicators) and at least twice in each year on a formal basis with a face-to-face performance review.
All of these reviews have been conducted in relation to FY17 in accordance with the relevant processes.

14 :: CORPORATE GOVERNANCE STATEMENT
ASX Principle 2: Structure the Board to Add Value
Recommendation 2.1 - Remuneration and Nomination Committee
The Company's aim in determining Board membership is to create a balanced and informed Board to assist the Company in making decisions relating to all corporate matters.
New Directors are nominated by existing Board Members (following a search process undertaken by an independent service provider to identify suitably qualified candidates) through the delegated functions of the Remuneration and Nomination Committee. New Directors are invited to become members of the Board on the basis of a majority vote of Directors. Consideration is given to Director's experience and qualifications with a view to ensuring effectiveness and an appropriate balance of skills.
Details of membership of the Remuneration and Nomination Committee and its function are provided below under the heading “ASX Principle 8: Remunerate Responsibly and Fairly”.
Recommendation 2.2 - Mix of Skills
Members of the Board have been brought together to provide a blend of qualifications, skills and experience required for managing a company operating in the wine industry. The skills of each Director are detailed in the matrix below. The experience, expertise and period in office of each Director are detailed in the Director’s Report included in this Annual Report.
BOARD SKILLS MATRIX
BUSINESS MANAGEMENT
INDUSTRY
ACCOUNTING / FINANCE
MARKETING / DIGITAL
INTERNATIONAL BUSINESS
Richard Davis x x x
Perry Gunner x x x x
Naseema Sparks x x
John Davies x x x
Neil McGuigan x x x
Peter Perrin x x x x
Jiang Yuan x x x x
Recommendations 2.3, 2.4 and 2.5 - Independent Directors
The Board is to comprise a majority of Non-Executive Directors where the Chairman of the Board is also a Non-Executive, independent Director and hence not the Chief Executive Officer (Managing Director). With the exception of the Chairman all Non-Executive Directors are appointed on the same terms and conditions. No Director, other than the Chief Executive Officer (Managing Director), shall hold office for any longer than three years without submitting themselves for re-election.
The Board currently consists of:
Richard Davis Chairman Independent, Non-Executive
Neil McGuigan Chief Executive Officer Non-Independent, Executive
Perry Gunner Independent, Non-Executive
Naseema Sparks Independent, Non-Executive
John Davies Independent, Non-Executive
Peter Perrin Independent, Non-Executive
Jiang Yuan Non-Independent, Non-Executive
The terms of office held by each Director are detailed in the Director's Report included in this Annual Report.
The Board has adopted the definition of independence set out in the ASX Principles.

CORPORATE GOVERNANCE STATEMENT :: 15
There are several tests that are applied in determining the independence of each Director. An Independent Director must:
• not be a substantial shareholder of the Company (or be associated with a substantial shareholder of the Company);
• not have been employed in an executive capacity within the Company (or a member of the Company's group) and there has not been a period of at least three years between ceasing such employment and serving on the Board;
• not have acted as a material professional adviser or consultant, or a material supplier, customer or contractor to the Company within the last three years;
• not have a material contractual relationship with the Company (other than his or her relationship as Director of the Company). A material contractual relationship between the Company and another entity that a Director is associated with or employed by is based by the Company on a 5% materiality level;
• be free from any interest or business which could be perceived as having a material effect on the Company, or the best interests of the Company. The Company entered into an arrangement with Neil McGuigan at the time he was appointed Chief Executive Officer which allows him to sell wine under the ‘Neil McGuigan’ label through direct marketing channels only subject to certain conditions which include not using the Company’s reputation in its brands and awards in promoting the sale of those products. The Company considers this arrangement to be immaterial and does not create a conflict with the best interests of the Company;
• not have close family ties with any person who falls within the categories described above; and
• not have been a director of the Company for such a period that his or her independence may have been compromised.
Having regard to the criteria above, the Board generally considers a Director to be independent if he or she is not a member of management and is free of any interest and any other business relationship which could, or could reasonably be perceived to, materially interfere with the Director's ability to act in the best interests of the Company.
Each Director's independence is assessed by the Board on an individual basis, having regard to the materiality guidelines detailed above and focussing on an assessment of each Director's capacity to bring independence of judgement to Board decisions. In this context, Directors are required to promptly disclose to the Board their interests in contracts, family ties and cross-directorships which may be relevant in considering their independence.
Jiang Yuan was classified as a non-independent director due to his directorship of Vintage China Fund, a substantial shareholder of the Company. All other non-executive Directors were considered to be free of any relationship that could possibly interfere with the Director acting in the best interests of the Company.
Recommendation 2.6 - Induction Program
The Company has established a program for inducting new directors and will continue to provide directors with appropriate professional development opportunities for them to develop and maintain their skills and knowledge needed to perform their role as directors effectively.
ASX Principle 3: Promote Ethical and Responsible Decision Making
Recommendation 3.1 - Ethics and Code of Conduct
The Board and management ensure that the business processes of the Company are at all times conducted according to sound ethical and legal principles. The Board has established a formal Ethics and General Conduct Code. This code is available at www.australianvintage.com.au in the "Investors" section under “Corporate Governance”.
The Code has been established to define the practices necessary to maintain confidence in the Company's integrity and comply with the Company's legal obligations and other obligations to legitimate stakeholders. The Code deals with numerous issues including confidentiality, conflicts of interest, compliance with the law, fair dealing, unethical behaviour, corporate fiduciary duties, care and diligence as well as the reporting requirements and action to be taken in the event of failure to comply with the Code.
ASX Principle 4: Safeguard Integrity in Financial Reporting
Recommendation 4.1 - Audit Committee
The Audit Committee consists of three Independent Non-Executive Directors. The current members of the Audit Committee are:
• John Davies (Chairman)
• Richard Davis
• Naseema Sparks

16 :: CORPORATE GOVERNANCE STATEMENT
Details of the qualifications of Audit Committee members and their attendance at committee meetings throughout the financial year are detailed in the Directors' Report enclosed in this Annual Report.
The nomination and review of existing audit arrangements is undertaken by the Audit Committee. The Audit Committee addresses issues surrounding the integrity of financial information presented to the Board and shareholders, including the review of external auditor engagements and internal financial reporting policies and controls.
The Audit Committee is responsible for reviewing the consistency of the Company’s internal accounting policies on a year-to-year basis as well as compliance with relevant accounting standards and legislation. The Audit Committee is also responsible for reviewing the processes and controls for the identification and management of financial risks.
The Audit Committee also advises the Board and makes recommendations in relation to policy and procedures and application of principles of Corporate Governance. The Committee addresses issues of proper Corporate Governance procedures and practices in order to ensure that the Company maintains the highest integrity and best practice with respect to such matters.
The Audit Committee generally invites the Chief Financial Officer and (on certain occasions) external auditors to attend Audit Committee meetings.
The Audit Committee or its Chairperson meets formally with the Board at least twice a year to discuss the relationship with external auditors, the Company’s financial reporting and any other matters of relevance called upon by the Board or the Chairperson of the Audit Committee for discussion.
The Chairperson of the Audit Committee, who is not the Chair of the Board, attends the Annual General Meeting of the Company in order to respond to any questions which may be raised by shareholders in relation to accounting/financial management, information, control or the contents of any financial reports.
The Audit Committee's Terms of Reference and Charter can be viewed at www.australianvintage.com.au under “Corporate Governance”.
Recommendation 4.2 - CEO and CFO Declaration
The Company has implemented a process where the Chief Financial Officer and Chief Executive Officer declare in writing to the Board, prior to approval of the Company's financial statements for a financial period, that:
• the Company’s financial records have been properly maintained;
• the financial reports present a true and fair view in all material respects of the Company’s financial condition and operational results and are in accordance with relevant accounting standards; and
• their opinion has been formed on a sound system of risk management and internal compliance and control which operates efficiently and effectively in all material respects.
Recommendation 4.3 - External Auditor at AGM
The Company’s external auditor attends the Annual General Meeting of the Company and is available to answer questions from shareholders about the conduct of the audit and the preparation and content of the Audit Report.
ASX Principle 5: Make Timely and Balanced Disclosure
Recommendation 5.1 - Continuous Disclosure
The Company has a written policy in place for complying with its continuous disclosure obligations under the Australian Securities Exchange Listing Rules and the Corporations Act, which is available at www.australianvintage.com.au in the "Investors" section under “Corporate Governance”.
This policy establishes procedures to ensure that the Directors and management are aware of and fulfil their obligations in relation to the timely disclosure of material price-sensitive information. When the Company makes an announcement the announcement is released to the ASX and the Company Secretary is responsible for communications with the ASX. All material information released to the ASX is published on the Company's website at www.australianvintage.com.au under “Company Announcements”. This includes ASX announcements, annual reports, notices of meetings, media releases etc. The policy sets out the type of information which requires disclosure as well as the internal policies governing the method and timing of disclosure.

CORPORATE GOVERNANCE STATEMENT :: 17
ASX Principle 6: Respect the Rights of Shareholders
Recommendation 6.1 - Information Available via Website
The Company, in addition to providing shareholders and the market generally information about the Company through distribution of the Annual Report, the Half Yearly Report, the Chairman’s and Chief Executive Officer’s addresses to the Annual General Meeting, provides information about the Company and its corporate governance on the Company's website.
All Company Corporate Governance charters, policies and procedures are publicly available. This includes:
• the division of responsibilities between the Board and management is set out in the Board Charter;
• the Company's share trading policy; and
• the Audit Committee, the Risk Committee and Remuneration and Nomination Committee Terms of Reference and Charters.
This corporate governance information can be located on the Australian Vintage Limited website at www.australianvintage.com.au under “Corporate Governance”.
Recommendation 6.2 - Investor Relations
The Company has also implemented an Investor Relations Strategy to facilitate effective two-way communication with investors, which is available at www.australianvintage.com.au in the "Investors" section under “Corporate Governance”. Shareholders and other stakeholders are also encouraged to contact the Company directly regarding any enquiries they may have.
Recommendation 6.3 - Shareholder Meetings
The Company allows Shareholders who are not able to attend the Annual General Meeting the opportunity to ask questions of, or make comments on, the management of the Company ahead of that meeting. Where appropriate such questions are answered at the Annual General Meeting.
The Company does not consider that it is necessary to use technology such as webcasting to facilitate participation of Shareholders at its Annual General Meeting taking into consideration its size, the number of Shareholders and the location at which the Annual General Meeting is held each year.
Recommendation 6.4 - Electronic Communications
The Company provides shareholders with the option to receive communications from, and send communications to, the Company and its share registry (currently Computershare) electronically.
ASX Principle 7: Recognise and Manage Risk
Recommendation 7.1 - Risk Management
The Board, through the Risk Committee and Audit Committee, reviews and oversees the Company’s risk management systems.
Risk Committee
The Risk Committee determines the Company’s risk profile and is responsible for overseeing and approving risk management strategy and policies, internal compliance and internal control. The Risk Committee does not have responsibility for strategic (Board responsibility) or financial risk management, which is the focus of the Company’s Audit Committee.
The Risk Committee comprises at least three members, with at least two members being independent non-executive directors. The current members of the Risk Committee are:
• Perry Gunner (Chairman)
• Richard Davis
• John Davies
The Risk Committee Charter is available at www.australianvintage.com.au in the "Investors" section under “Corporate Governance".
The attendance of committee members at each committee meeting during the financial year is detailed in the Directors' Report enclosed in this Annual Report.
The Board identifies and discusses areas of significant business risk. The Board ensures, together with management, that processes are in place to manage those risks and reviews those arrangements annually. The Board has reviewed the Group’s risk management framework during the year and confirmed that it remains sound.

18 :: CORPORATE GOVERNANCE STATEMENT
The Board has delegated to the Audit Committee the responsibility to oversee financial risk and to the Risk Committee all other risks associated with the business.
The Board, committees and management ensure that appropriate insurance programmes for the Company are also in place to provide insurance cover in areas of the business assessed as appropriate for cover having regard to all of the relevant circumstances.
Comprehensive practices are established such that:
• capital expenditure and revenue commitments above a certain size require prior Board approval;
• financial exposures are controlled, including the use of derivatives;
• occupational health and safety standards and management systems are monitored and reviewed to achieve high standards of performance and compliance with regulations; and
• business transactions are properly authorised and executed.
All reports to the Board on strategic and operational issues incorporate an assessment by management of the associated risks, which ensures that the Board is in a position to make fully-informed business judgements on these issues. In addition, the committees receive risk management updates which address the material business risks facing the Company and the systems and policies in place to manage those risks.
Recommendation 7.2 - Risk Review
As part of the Board delegation of the oversight of risk to the committees referred to above, each committee will be required to review the Company's risk management framework (as it applies to the relevant risks) annually to satisfy themselves that it continues to be sound.
These reviews have been conducted in relation to FY17 in accordance with the relevant processes.
Recommendation 7.3 - Internal Audit
The Company does not have an internal audit function but has implemented the following processes to evaluate and continually improve the effectiveness of its risk management and internal control processes.
The Board is responsible for the overall internal control framework, but recognises that no cost effective internal control system will preclude all errors and irregularities.
The Board has instigated the following internal control framework:
• Financial reporting – Monthly actual results are reported against budgets approved by the directors and revised forecasts for the year are prepared regularly.
• Continuous disclosure – A comprehensive policy and process is in place to identify matters that may have a material effect on the price of the Company’s securities and notify them to the ASX and post them on the Company’s website. The Board and the Company Secretary are responsible for all communications with the ASX.
• Quality and integrity of personnel – Formal appraisals are conducted at least annually for all employees.
• Operating units control – The Chief Executive Officer and Chief Financial Officer ensure compliance with financial controls and procedures including information systems controls detailed in procedures manuals.
• Investment appraisal – Guidelines for capital expenditure include annual budgets, detailed appraisal and review procedures, levels of authority and due diligence requirements where businesses are being acquired or divested.
Recommendation 7.4 - Material Risks
The Company has material exposure to economic risks, in particular, the movement in the GBP. Further details regarding this impact of these risks and how the Company intends to manage those risks is set out in the Director’s Report included in this Annual Report.
Each senior executive, with input and assistance from their direct reports, identifies key risks for their areas of responsibility and function which are in turn aggregated into an overall corporate risk register. Each risk is assessed and assigned an inherent risk rating and risk mitigation strategies are developed by senior executives designed to reduce the inherent risk profile to an acceptable level consistent with the requirements of the Risk Committee and the Board.
The risk register is continuously reviewed and maintained as new risks are identified or incidents occur, or mitigating controls change. Extracts of the risk register are provided to the Risk Committee (or Audit Committee in the case of financial risks), together with specific commentary or information on significant changes to the risks or the ratings.
CORPORATE GOVERNANCE STATEMENT :: 19
Specific major risks or incidents are reported, as and when they occur, to the CEO and other key management personnel who are responsible for escalating these to the Risk Committee (or Audit Committee in the case of financial risks) and Board, where necessary, if the event occurs outside the regular cycle of Committee meetings. The Risk or Audit Committee (as the case requires) is informed of the effectiveness of actions to mitigate the impact of risk events. In addition, the Risk Committee considers developments or improvements in risk management and controls, including the adequacy of insurance programmes.
Separate records and registers are maintained for other more common or recurring risks; for example, arising from customer complaints and occupational health and safety issues. These are managed and reported to the Committee by relevant managers.
ASX Principle 8: Remunerate Fairly and Responsibly
Recommendation 8.1 - Remuneration and Nomination Committee
The Remuneration and Nomination Committee consists of three independent non-executive Directors. The current members of the Remuneration and Nomination Committee are:
• Naseema Sparks (Chairman)
• Richard Davis
• Perry Gunner
The attendance of committee members at each committee meeting during the financial year is detailed in the Directors' Report enclosed in this Annual Report.
The procedure for establishing and reviewing remuneration for senior executives and non-executive members of the Board is undertaken by the Remuneration and Nomination Committee. The shareholders in general meeting approve the aggregate remuneration for non-executive Directors.
Particulars concerning Directors’ and Executives’ remuneration and the Company’s performance rights and option plan are set out in notes to the financial statements and the Remuneration Report.
For further details on the roles and responsibilities of the Remuneration and Nomination Committee see the Committee's Charter and Terms of Reference available at www.australianvintage.com.au in the "Investors" section under “Corporate Governance”.
For more information on the Company’s remuneration, see the Remuneration Report within this Annual Report.
Recommendation 8.2 - Policies and Procedures
The Company has developed a Remuneration Policy which describes the Company’s remuneration policies and the rationale behind them. The Remuneration Policy is available at www.australianvintage.com.au in the "Investors" section under “Corporate Governance”.
Non executive directors will be paid in cash in line with a resolution passed at the Company’s Annual General Meeting dated 25 November 2009. Non executive directors do not receive any performance-based remuneration and are not paid any retirement benefits other than superannuation.
Executives are paid primarily by cash salary (but also, in some cases as to part, with performance rights and options). The Company's Remuneration Policy is reviewed annually by the Remuneration and Nomination Committee.
In determining Executive remuneration, regard is had to the Executive's level of responsibility, skills, experience, reputation, efforts and results and the ability to retain executives having regard to the competitive nature of hiring key staff.
Recommendation 8.3 - Equity Based Remuneration
The Company issued performance rights and/or options pursuant to the AVG Performance Rights and Option Plan (“Plan”) which received approval of shareholders of the company at the Annual General Meetings held on 28 November 2012 and 17 November 2015.
The Company’s policy is that participants in the Plan are specifically prohibited from hedging the exposure to the Company’s share price during the vesting period in respect of their unvested options or performance rights. This prohibition is reflected in the terms of the letter of offer to participate in the Plan.
For further information regarding Executive remuneration through options see the Remuneration Report in this Annual Report at www.australianvintage.com.au.

20 :: SHAREHOLDERS’ INFORMATION
The shareholder information set out below was applicable as at 11th September 2017.
ShareholdersDistribution of Shareholders
Analysis of shareholders of fully paid ordinary shares by size of holdings:
NUMBER OF SHARES NUMBER OF SHAREHOLDERS
1 - 1,000 1,652
1,001 - 5,000 2,449
5,001 - 10,000 734
10,001 - 100,000 1,020
100,001 Over 165
6,020
The percentage of the total holding of the twenty largest holders of Ordinary Shares was 68.49%.
Substantial shareholders
The names of substantial shareholders who have notified the Company in accordance with section 671B of the Corporate Law are:
NAME ORDINARY SHARES (as per last substantial holder notice)
Allan Gray Investment Management 46,452,386
Vintage China Funds GP Limited 35,939,386
Renaissance Smaller Companies Pty Ltd 13,839,095
Brandes 11,624,939

SHAREHOLDERS’ INFORMATION :: 21
Twenty largest shareholders
The names of the twenty largest shareholders of Ordinary Shares are as follows:
NUMBER OF ORDINARY % OF LISTED SHARES HELD SHARES HELD SHARES
1. Citicorp Nominees Pty Limited 35,969,615 13.05
2. Vintage China Funds GP Limited 35,939,389 13.04
3. HSBC Custody Nominees (Australia) Limited 35,255,974 12.79
4. J P Morgan Nominees Australia Limited 24,495,222 8.89
5. National Nominees Limited 16,050,690 5.82
6. RBC Investor Services Australia Nominees Pty Limited (MBA A/C) 8,512,855 3.09
7. Sandhurst Trustees Ltd (Wentworth Williamson A/C) 6,333,084 2.30
8. Secvest Capital Pty Limited 4,202,996 1.53
9. BNP Paribas Nominees Pty Ltd (IB AU Noms Retailclient DRP) 3,994,589 1.45
10. Garrett Smythe Ltd 3,323,553 1.21
11. BNP Paribas Noms (NZ) Ltd (DRP) 3,245,071 1.18
12. Mr Graham John Harvey 1,700,000 0.62
13. Ms Liang Chen 1,500,000 0.54
14. Henleaze Investments Pty Ltd 1,500,000 0.54
15. Sunrise Vineyards Pty Ltd (Moularadellis S/F A/C) 1,360,000 0.49
16. 127 Victoria Pty Ltd 1,300,000 0.47
17. Wauchope & Kilgour Pty Ltd 1,050,000 0.38
18. Mr Brian Frederick Ditchfield 1,000,000 0.36
19. Mornington Australia Pty Ltd (Rubicon Superannuation A/C) 1,000,000 0.36
20. Secvest Capital Pty Ltd 1,000,000 0.36
Totals: Top 20 Holders of Fully Paid Ordinary Shares 188,733,038 68.49
Total Remaining Holders Balance 86,835,283 31.51

22 :: DIRECTORS’ REPORT
Directors’ reportFOR THE FINANCIAL YEAR ENDED 30 JUNE 2017
The Directors of Australian Vintage Ltd submit herewith the annual financial report for the financial year ended 30 June 2017. In order to comply with the provisions of the Corporations Act 2001, the Directors report as follows:
DirectorsThe names and particulars of the Directors of the Company during or since the end of the financial year are:
Richard H Davis B. Ec, Age 61(Chairman - appointed 1st June 2015, Non-Executive) Director since 5 May 2009.
Chairman of Monash IVF Group Limited and Director (and previously CEO) of InvoCare Limited where he previously spent almost 20 years growing and managing the business. Former accounting partner for a national accounting firm.
Neil A McGuigan B. App. Sc. (OENO), Age 59(Chief Executive Officer) Director since 21 July 2010.
Neil was previously the General Manager of Production and Wine Supply at Australian Vintage Ltd. He was appointed as a director and as the CEO on 21 July 2010. Neil has over 37 years’ experience in the wine industry. He previously worked at the then privately owned Briar Ridge before leaving in 2000 to run Rothbury Estate and its satellites in the Upper Hunter, Cowra and Mudgee for the Foster's Group.
Perry R Gunner B. Ag. Sc, Grad. Dip, Bus. Admin, Age 70(Non-Executive) Director since 28 June 2002
Over 30 years’ experience in the wine industry. Former Chairman and Chief Executive Officer of Orlando Wyndham Group Pty Limited. Chairman of Freedom Foods Group Limited and Deputy Chairman of A2 Corporation Limited (N.Z.). Chairman of the Risk Committee.
John D Davies FCA, Dip. Bus S, Age 64(Non-Executive) Director since 28 January 2015
Fellow of the Institute of Chartered Accountants having worked for 36 years with Ernst & Young. John was elected to Ernst & Young’s Asia Pacific Board of Partners for a 6 year period until his retirement in 2011. During his career he provided professional services to many of Australia’s leading wine companies and he also owns a commercial vineyard in central Victoria. Chairman of the Audit Committee.
Naseema Sparks AM, Age 64(Non-Executive) Director since 28 January 2015
Currently Deputy Chairperson of Racing NSW and Director of Melbourne IT Limited, PMP Limited and AIG Australia. Former Chairperson of Deals Direct Group with extensive experience in marketing and digital media after a successful career with M&C Saatchi, one of Australia’s largest and most successful advertising businesses. Naseema holds post graduate market and research qualifications and an MBA from Melbourne Business School. In 2016 was awarded a Member of the Order of Australia in recognition to significant service to business and commerce and to women through advancing female participation and retention in the workforce. Chairperson of the Remuneration Committee.
Peter J Perrin, Age 59(Non-Executive) Director since 28 March 2017
General Manager of Torbreck Vintners. Trustee of The Wolf Blass Foundation. 35 years' experience in the sales and marketing of premium Australian wines both in Australia and overseas.
Jiang Yuan (Dixon), Age 40(Non-Independent, Non-Executive) Director since 7 June 2017
Founder of www.yesmywine.com, the largest imported wine platform in the world, based in China.
Well known for pioneering data analytics and an innovator in imported wines in China, Dixon has considerable experience in distribution and selling of wine into Asia.

DIRECTORS’ REPORT :: 23
Directorships of other listed companiesDirectorships of other listed companies held by Directors in the 3 years immediately before the end of the financial year are as follows:
NAME COMPANY PERIOD OF DIRECTORSHIP
Richard Davis InvoCare Limited Since 2012 Monash IVF Group Limited Since 2014
Perry Gunner Freedom Foods Group Limited Since 2003 A2 Corporation Ltd (N.Z.) 2010 to 2015
Naseema Sparks PMP Limited Since 2010 Melbourne IT Limited Since 2012 Grays e-Commerce Group Limited 2014 - 2016
Company Secretary
Michael H Noack (appointed 23 November 2005)
B Accountancy (University of South Australia), Fellow of ASCPA, Graduate Diploma in Systems Analysis (University of South Australia) and Fellow of the Chartered Secretaries Australia. Michael has been with Australian Vintage Ltd since the merger in 2002 and was previously Chief Financial Officer and Company Secretary of Simeon Wines Limited. Michael has been the Chief Financial Officer since 2002.
Principal activitiesThe consolidated entity’s principal activities in the course of the financial year were wine making, wine marketing and vineyard management.
Changes in state of affairsDuring the financial year there was no significant change in the state of affairs of the consolidated entity other than that referred to in the financial statements or notes thereto.
Environmental regulationsThe consolidated entity holds licences issued by the Environmental Protection Authorities in various states which specify limits associated with the discharge of winery waste. There have been no known breaches of the licence conditions.
DividendsIn respect of the financial year ended 30 June 2017, a fully franked dividend of 1.0 cents per share has been declared and will be paid on 10th November 2017. In respect of the financial year ended 30 June 2016, a fully franked dividend of 1.5 cents per share was paid on the 9th November 2016.
Review of operations and future developmentsKey Points
• Net Profit after tax $4.3 million compared to after tax loss of $2.2 million in the prior period
• Net Profit after tax and before one off items $4.3 million compared to $7.0 million in prior period
• Cash Flow from Operating Activities positive $14.0 million compared to $6.5 million in prior period
• Net Debt of $82.8 million compared to $101.4 million as at 30 June 2016
• Revenue down $16.2 million to $226.5 million, with unfavourable foreign currency impacting revenue by negative $17.5 million
• Sales volumes of McGuigan, Tempus Two and Nepenthe up 4%
• 1.0 cent per share fully franked final dividend declared

24 :: DIRECTORS’ REPORT
Review of operations and future developments (continued)
Although profitability is not where we want it, when you consider the fall of the GBP following Brexit, our financial result is credible, especially when you consider our positive cash flow of $14 million. Based on the average exchange rate that was present in the 2016 financial year, our 2017 cash flow would have been $4.7 million higher and our net profit after tax would also have been $3.3 million higher. This clearly demonstrates that our long-term strategies are correct.
Our core business continues to improve with sales volumes of AVL’s three key brands, McGuigan, Tempus Two and Nepenthe continuing to grow against some market conditions that have seen wine volumes decline.
During the year we increased our focus on the Tempus Two brand which resulted in a 28% improvement in sales and a 50% increase in gross margin. Over the last 12 months the McGuigan brand has grown by 6% in volume in the UK market against a market decline of 3.1%.
Whilst the UK continues to be our main overseas market, we have a strong focus on growing and strengthening our distribution channels in the key overseas markets of Asia and the United States. In the 6 month period to 30 June 2017, sales into Asia have increased by 60% and contribution increased by 241% when compared to the same 6 month period in the prior period. Whilst some of this increase is due to the timing of orders, it does reflect that our partnership with COFCO is the right strategy. For the full year, sales into Asia increased by 19% and contribution by 21%. We expect this trend to continue.
The UK market remains a tough market with the current exchange rate making it hard to achieve a satisfactory return. The Company has taken some price increases in early January 2017, but this does not cover the full impact of the unfavourable exchange rates. For the next 12 months, we will continue to focus on improving sales mix and implementing further price increases.
The focus on our quality of wine has again been rewarded with the company’s wines continuing to win awards at significant wine shows. At the recently held San Francisco International Wine Competition, the McGuigan Shortlist Riesling and the Farms Shiraz won double golds, other McGuigan brands picked up a further 5 golds, Nepenthe received 4 gold medals and Tempus Two received 3 gold medals. These awards are on top of the 425 trophies and medals that we received in the last 12 months to June 2017. Having won the International Winemaker of the Year four times at the prestigious International Wine and Spirits Competition in London, the company continues to produce world leading quality wine.
Sales
Revenue for the year decreased 7% or $16.2 million due to the unfavourable foreign currency which accounted for $17.5 million of this decrease.
Australasia / North America packaged sales were down 1% on last year with an increase in bottled sales of 1% and a decrease of 6% in our cask sales. Our new distributor in the USA, Palm Bay, have launched Tempus Two to great acceptance with the launch of McGuigan “The Plan” to be executed early in 2018.
Sales movements within the Australasia / North America packaged segment:-
DIVISION MOVEMENT IN SALES (%)
Australia (2)
New Zealand (14)
Asia 19
North America (2)
Australian sales decreased by 2% due to a 6% decline in cask sales. This decline is in line with the consumption trend of casks in the Australian domestic market. Due to significant pricing pressure on the McGuigan brand in Australia, the company took a stance on promotional support and as a result, sales of this brand dropped during part of the year. Sales of Black Label are now back on track and growing
Sales to New Zealand were down due to new legislation on promotion depth and frequency. Since this new legislation was introduced, sales have recovered to levels seen in the previous year. In the last 6 months, sales to New Zealand have been in line with the previous year’s corresponding period.
Sales to Asia have grown by 19% with the last 6 months showing a 60% growth when compared to the same corresponding period in the prior period.
UK / Europe packaged and bulk sales were down by 14% on last year with packaged sales down 12% or $12.3 million and bulk and private label sales down 54% or $1.8 million. The unfavourable GBP negatively impacted sales by $17.3 million when compared to the prior period.

DIRECTORS’ REPORT :: 25
Review of operations and future developments (continued) 12 MONTHS TO CHANGE 30/6/17 30/6/16 Variation SALES BY SEGMENT $000 $000 $000 %
Australasia / North America Packaged 106,005 106,672 (667) (1)
UK / Europe 88,454 102,506 (14,052) (14)
Cellar Door 7,834 8,185 (351) (4)
Australasia / North America bulk & processing 20,358 22,222 (1,864) (8)
Vineyards 3,799 3,101 698 23
226,450 242,686 (16,236) (7)
EBIT and Net Profit
EBIT is $11.3 million compared to $3.2 million in the previous period. Before one off items EBIT is $11.3 million compared to $16.4 million. The contribution from the Australasia / North America packaged segment was in line with last year.
The UK/Europe segment was significantly impacted by the unfavourable GBP. Actual sales volumes improved on last year in a market that saw wine sales decline. The contribution from this segment was down by $3.3 million due to the unfavourable GBP.
Australasia/North America Bulk segment contribution declined by $1.5 million due to losses on some bulk wine sales. These bulk sales were made to remove wine that was not required for future sales.
The decreased contribution from the vineyard segment was due to a change in accounting standards on vines.
12 MONTHS TO CHANGE 30/6/17 30/6/16 RESULTS $000 $000 $000 %
Australasia / North America Packaged 6,258 6,249 9 -
UK / Europe 208 3,500 (3,292) (94)
Cellar Door 1,456 1,568 (112) (7)
Australasia / North America bulk and processing (1,075) 447 (1,522) (340)
Vineyards 4,414 4,610 (196) (4)
EBIT 11,261 16,374 (5,113) (31)
Finance costs (5,025) (5,790) 765 13
Interest received 15 15 - -
Profit Before Tax 6,251 10,599 (4,348) (41)
Tax (1,948) (3,590) 1,642 46
Net Profit (before one off items) 4,303 7,009 (2,706) (39)
Vineyard lease exit - (13,148) 13,148
Tax - 3,944 (3,944)
Total one off items (after tax) - (9,204) 9,204
Total Net Profit / (Loss) (after one off adjustments) 4,303 (2,195) 6,498

26 :: DIRECTORS’ REPORT
Review of operations and future developments (continued)Financial Position
Due to the recent $16.5 million placement of shares and the improved cash flow from operating activities, the net debt decreased by $18.6 million. The gearing ratio is now at a comfortable 29% (38% as at 30 June 2016). The existing banking facility remains in place until September 2019.
Outlook
The Company continues to focus on growing its three key brands, McGuigan, Tempus Two and Nepenthe and whilst the last 12 months have been challenging due mainly to the unfavourable GBP, we remain confident that our strategy is the correct one.
One of the most pleasing aspects of our business is the cash flow from operating activities which improved by $7.5 million over the prior period.
Over the last 12 months the McGuigan brand has grown by 6% in the UK against a total UK wine market decline of 10% and the McGuigan Black Label Red remains the biggest selling red wine in Australia. Our major brand continues to perform well.
As foreshadowed in our May 2017 press release on the placement to Vintage China, the company will be undertaking major capital projects to further improve efficiencies and quality of wine. Our total capital spend for the next 12 months will be approximately $19.0 million and will focus on:
AREA OF SPEND $M
Major efficiency upgrades at Buronga Hill Winery 5.3
Efficiency improvements at our Merbein packaging facility 6.1
Vineyard developments 1.9
IT upgrade 0.9
Other (normal replacement capital) 4.8
19.0
Our proposed capital spend will incorporate several sustainability initiatives including:
• The completion of the 1,640Kw solar panel system at our Buronga Hill Winery
• The installation of a 300Kw solar panel system at our Merbein Packaging facility
• The development of a vineyard adjacent to our Buronga Hill Winery that will use the waste water from the winery
Australian Vintage has transformed over the last 10 years from a bulk wine company to a quality and well respected branded wine business. This global transformation will continue as we push into the Asian and US markets. Our persistence on improving efficiency will mean that the company will spend $19.0 million on capital projects over the next 12 months.
Based on the GBP exchange rate remaining at around 61 pence and a normal 2018 vintage, we expect our 2018 result to be at least 10% up on this year's Net Profit After Tax result.
Assuming no price adjustment for the next 12 months, a 1 pence movement in the GBP impacts or Net Profit after tax by approximately $0.4M.
A further market update will be provided at our Annual General meeting in November 2017.
As part of our ongoing confidence in the medium to long term outlook of Australian Vintage, the board has agreed to pay a dividend. A fully franked dividend of 1.0c per share will be paid to all shareholders on 10 November 2017. The Record Date to establish shareholder dividend entitlements is 20 October 2017. The Company's Dividend Reinvestment Plan (DRP) will operate for the dividend payable on 10 November 2017. Shares issued under the DRP will be at a 2.5% discount to the weighted average market price of all Company shares sold on the ASX during the 5 business days after the Record Date.
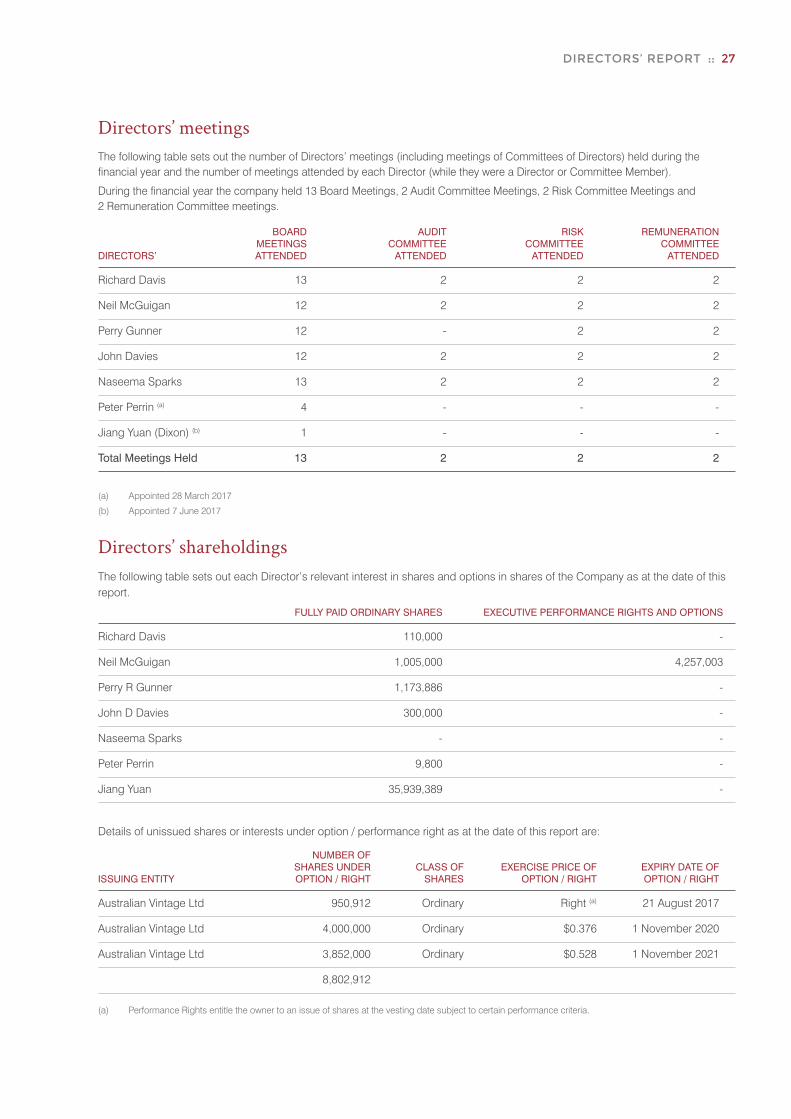
DIRECTORS’ REPORT :: 27
Directors’ meetingsThe following table sets out the number of Directors’ meetings (including meetings of Committees of Directors) held during the financial year and the number of meetings attended by each Director (while they were a Director or Committee Member).
During the financial year the company held 13 Board Meetings, 2 Audit Committee Meetings, 2 Risk Committee Meetings and 2 Remuneration Committee meetings. BOARD AUDIT RISK REMUNERATION MEETINGS COMMITTEE COMMITTEE COMMITTEE DIRECTORS’ ATTENDED ATTENDED ATTENDED ATTENDED
Richard Davis 13 2 2 2
Neil McGuigan 12 2 2 2
Perry Gunner 12 - 2 2
John Davies 12 2 2 2
Naseema Sparks 13 2 2 2
Peter Perrin (a) 4 - - -
Jiang Yuan (Dixon) (b) 1 - - -
Total Meetings Held 13 2 2 2
(a) Appointed 28 March 2017
(b) Appointed 7 June 2017
Directors’ shareholdingsThe following table sets out each Director’s relevant interest in shares and options in shares of the Company as at the date of this report.
FULLY PAID ORDINARY SHARES EXECUTIVE PERFORMANCE RIGHTS AND OPTIONS
Richard Davis 110,000 -
Neil McGuigan 1,005,000 4,257,003
Perry R Gunner 1,173,886 -
John D Davies 300,000 -
Naseema Sparks - -
Peter Perrin 9,800 -
Jiang Yuan 35,939,389 -
Details of unissued shares or interests under option / performance right as at the date of this report are:
NUMBER OF SHARES UNDER CLASS OF EXERCISE PRICE OF EXPIRY DATE OF ISSUING ENTITY OPTION / RIGHT SHARES OPTION / RIGHT OPTION / RIGHT
Australian Vintage Ltd 950,912 Ordinary Right (a) 21 August 2017
Australian Vintage Ltd 4,000,000 Ordinary $0.376 1 November 2020
Australian Vintage Ltd 3,852,000 Ordinary $0.528 1 November 2021
8,802,912
(a) Performance Rights entitle the owner to an issue of shares at the vesting date subject to certain performance criteria.

28 :: DIRECTORS’ REPORT
Remuneration ReportFor the purpose of the disclosure Key Management Personnel (KMP) are defined as an individual who is responsible for strategic planning, management and performance of a division or function and reports directly to the Chief Executive Officer.
Key Management Personnel for the year comprised:
NAME POSITION DATES
Non-executive Directors
Richard H Davis Chairman Full Year
Perry R Gunner Non-executive Director Full Year
John D Davies Non-executive Director Full Year
Naseema Sparks Non-executive Director Full Year
Peter Perrin Non-executive Director Since 28 March 2017
Jiang Yuan Non-executive Director Since 7 June 2017
Executives
Neil McGuigan Chief Executive Officer Full Year
Mike Noack Company Secretary & Chief Financial Officer Full Year
Cameron Ferguson General Manager, Sales & Marketing, Australasia / North America Full Year
Julian Dyer General Manager, UK / Europe Full Year
Flora Sarris General Counsel Resigned 17 August 2016
Remuneration Committee and Director Compensation
The Remuneration Committee reviews the fee levels for Non-Executive Directors from time to time utilising appropriate remuneration benchmark data from comparable Australian ASX listed companies of similar size as a guide to independent market levels of remuneration such positions attract. A review of fees was undertaken within the year ended 30th June 2017, with advice received that Non-Executive Director compensation is aligned with the market. Currently, Shareholders have approved a pool of funds up to $600,000 per annum to compensate all Non-Executive Directors remuneration for their ordinary services as Directors.
The current level of Non-Executive Director compensation sits comfortably within the pool of funds approved by the Shareholders.
Remuneration Components for Non-Executive Directors
Non-executive Directors receive remuneration in cash, superannuation and wine.
Remuneration Committee and Executive Compensation
The Remuneration Committee reviews the compensation package for the Chief Executive Officer on an annual basis and makes recommendations to the Board for approval.
The Chief Executive Officer reviews the compensation packages of all other Executives and makes recommendations to the Remuneration Committee for approval.
Compensation packages are reviewed and determined with due regard to current market rates and are benchmarked against comparable industry salaries, as well as utilising appropriate remuneration benchmark data from comparable Australian ASX listed companies of similar size as a guide . Remuneration packages are set at levels that are intended to attract and retain executives capable of managing the consolidated entity’s diverse operations.

DIRECTORS’ REPORT :: 29
Remuneration Report (continued)Remuneration Objectives & Principles
In the 2016/17 review process, the Board revised its remuneration objectives and principles with respect to both the Chief Executive Officer and Executive compensation as follows:
1. To provide a fair and reasonable remuneration structure for all employees
2. To provide attractive rewards and incentives to retain key individuals
3. To link senior executive rewards to accretion in shareholder value
4. The remuneration strategy must be easily understood by the board, management and shareholders and must:
a) Reinforce organisation strategy and the objectives of the five-year plan
b) Facilitate corporate values and behaviours identified as core to the culture
c) Be proactive and dynamic so as to reflect changes in trends and future business opportunities
In alignment with those remuneration objectives and principles, AVL is shifting its approach to remuneration with respect to the positions of the Chief Executive Officer and other Executives. The goal is to move to a Total Reward Framework over coming years, with AVL taking a balanced approach to its Fixed and Variable pay mix on offer to its Executives.
The below reflects the above and represents a target pay mix for the Chief Executive Officer and other Executives and was first adopted in the year ended 30th June 2016 and is being progressively implemented in conjunction with remuneration reviews over the coming three to four years.
EXECUTIVE TOTAL REWARD FRAMEWORK
ê ê
Fixed Remuneration (Target of 50% by FY20)
At Risk Remuneration (Variable Reward)
Short-Term Incentive (Target of 25% by FY20)
Long-Term Incentive (Target of 25% by FY20)
Comprises:
• Cash salary (base);
• Salary sacrificed items;
• Company motor vehicles;
• Allowances; and
• Employer superannuation contributions in line with statutory obligations.
An STI opportunity targeting 25% of Total Remuneration
Comprises a performance rights and share option scheme, with a three year rolling vesting period, with performance and, in some years, service hurdles. Target of 25% of Total Remuneration.
For FY16 and FY17, the use of a service hurdle within the Long-Term incentive arrangements reflects the need to focus on both retention of critical key management personnel, who are in positions to influence shareholder return via the delivery of the five-year strategy; as well as incentivise those individuals on performance outcomes. The service hurdle will be discontinued in FY18.

30 :: DIRECTORS’ REPORT
Remuneration Report (continued)Remuneration Components
The Chief Executive Officer and other Executive compensation packages consist of the below three components:
1. Base Compensation
This component is not performance linked and generally consists of salary, motor vehicle, wine allowance and post-employment superannuation entitlement (where applicable). The base amount is reviewed annually by Remuneration Committee for the Chief Executive Officer (“CEO”). The base amount for other executives is reviewed by the CEO, who makes recommendation to the Remuneration Committee for approval. Any adjustments made during the year will either be as a result of market rate changes in order for the Company to remain competitive or to reflect any changes in level of responsibility in the event the role has broadened.
2. Short Term Incentives
Short term incentive (STI) payments take into account the extent to which specific financial and operating targets are set at the start of the financial year have been achieved. The targets consist of a number of key performance indicators (KPI’s) covering both financial and non-financial measures of performance. Non-financial measures may include items such as corporate risk control and work health and safety outcomes, as well as related organisational behaviours that may impact culture. However, the primary measure is the performance against profit targets, with Company Performance set at a minimum of 90% achievement of financial year budget and acting as a first gate to determine the incentive opportunity to be made available for assessment in terms of the Financial opportunity. The Remuneration Committee may, from time to time, elect to make exceptions to this principle in the event of extraordinary circumstances and in the circumstances where an incentive payment may support retention of critical talent.
Short term incentive payments are made by way of a cash bonus, incorporating superannuation.
Objectives and performance indicators are determined annually as follows:
• Chief Executive Officer (CEO) – by the Remuneration Committee and approved by the Board, following consultation with the CEO
• Executives – by the CEO and approved by the Remuneration Committee, following consultation with each Executive member
The maximum amount of bonus payable in respect of the financial year is determined by the CEO and the Remuneration Committee. For the purpose of determining any bonus entitlement, along with corporate financial and behavioural objectives, individual performance is assessed against the set objectives and performance indicators set and agreed each year. The objectives and performance indicators relate to specific duties and Company performance, and are calculated as follows:
Financial Opportunity multiplied by
Corporate Results outcome
+
Behaviours Opportunity multiplied by
individual assessed results
+
Operational Opportunity multiplied by
individual assessed results
= STI Awarded
The table below shows the maximum STI payments for 2017, the breakdown between financial and operational key performance indicator targets and the actual percentage of the maximum STI achieved:
2017 2017 KEY PERFORMANCE TARGETS 2017 MINIMUM MAXIMUM % OF MAXIMUM BONUS BONUS GRANTED (1)
$ $ FINANCIAL BEHAVIOURS OPERATIONAL
Neil McGuigan 0 300,000 40% 10% 50% 76.5%
Michael Noack 0 125,276 25% 10% 65% 83.7%
Cameron Ferguson 0 124,844 25% 10% 65% 74.7%
Julian Dyer 0 114,456 25% 10% 65% 74.7%
(1) The 2017 STI payment was based on the actual net profit compared to the budget net profit which included the impact of BREXIT. In approving the STI 2017 payment, the board also took into account the amount of time and effort management dedicated to securing the recent placement to Vintage China which has resulted in significant improved liquidity for the company, the positive volume growth performance in UK in spite of ongoing currency challenges and the need to maintain motivation and manage retention of key staff.

DIRECTORS’ REPORT :: 31
Remuneration Report (continued)Remuneration Components (continued)
3. Long Term Incentives
Performance Rights and Options Plan:
Established in August 2012, this long term incentive is provided as a right to an issue of shares. This right or option is subject to the achievement of set growth rates in earnings per share until the vesting date and the satisfaction of continuous employment criteria. The plan is available to senior management as approved by the Board. Rights and options can be exercised if following criteria are met:
Rights issued July 2013:
• For all rights, continuous employment must be maintained up until the exercise date.
• 25% of Performance Rights will vest if the Earnings Per Share (EPS) for the four years 2014 to 2017 inclusive achieves a compound annual growth rate (CAGR) of at least 5% per annum using the 30th June 2013 financial year results as a base year.
• 100% of Performance Rights will vest if the EPS for the four years 2014 to 2017 inclusive achieves a CAGR of at least 15% per annum using the 30th June 2013 financial year results as a base year.
• Vesting between 50% to 100% will occur on a straight-line basis where the Company achieves a CAGR of between 5% and 15% for the four years between 2014 to 2017 inclusive using the 30th June 2013 financial year results as a base year.
• All these rights expired on 22nd August 2017.
Options issued November and December 2015:
• 20% of options will vest if continuous employment is maintained up to 1st July 2019.
• 40% of the options are subject to an EPS hurdle. If the EPS CAGR for the three years FY16 to FY18 inclusive is less than 7.5% no options will vest under this performance condition. If the EPS CAGR is between 7.5% and 15% vesting occurs on a straight line between 25% and 100%.
• 40% of the options are subject to a Total Shareholder Return (TSR) hurdle. If TSR for the three years FY16 to FY18 is less than 10%, no options will be vested under this performance condition. If the TSR is between 10% and 15% vesting occurs on a straight line between 25% and 100%.
Options issued November and December 2016:
• 30% of options will vest if continuous employment is maintained up to 1st July 2020.
• 30% of the options are subject to an EPS hurdle. If the EPS CAGR for the three years FY17 to FY19 inclusive is less than 7.5% no options will vest under this performance condition. If the EPS CAGR is between 7.5% and 15% vesting occurs on a straight line between 25% and 100%.
• 40% of the options are subject to a TSR hurdle. If TSR for the three years FY17 to FY19 is less than 10%, no options will be vested under this performance condition. If the TSR is between 10% and 15% vesting occurs on a straight line between 25% and 100%.
Key Management Personnel and employee share option and performance rights plans
During and since the end of the financial year under the Performance Rights and Option Plan there were 2,852,000 (2016 : 3,250,000) share options granted to key management personnel as part of their remuneration. No shares were issued during or since the end of the financial year as a result of the exercise of performance rights or options under the above Plans.

32 :: DIRECTORS’ REPORT
Remuneration Report (continued)
Relative proportions of fixed vs variable remuneration expense
FIXED REMUNERATION AT RISK - STI AT RISK - LTI
2017 2016 2017 2016 2017 2016
Non-executive DirectorsRichard Davis 100% 100% 0% 0% 0% 0%
Perry R Gunner 100% 100% 0% 0% 0% 0%
John Davies 100% 100% 0% 0% 0% 0%
Naseema Sparks 100% 100% 0% 0% 0% 0%
Peter Perrin 100% 100% 0% 0% 0% 0%
Jiang Yuan 100% 100% 0% 0% 0% 0%
ExecutivesNeil McGuigan 70% 72% 22% 25% 8% 3%
Michael Noack 81% 81% 17% 18% 2% 1%
Cameron Ferguson 77% 79% 20% 20% 3% 1%
Julian Dyer 78% 82% 19% 17% 3% 1%
In accordance with the provisions of the Company’s share option and performance rights plan, as at the date of this report, key management personnel hold the following performance rights and options:
KEY MANAGEMENT PERSONNEL NUMBER GRANTED EXERCISE PRICE GRANT DATE EXPIRY DATE
Neil McGuigan Options 2,000,000 $0.376 17 November 2015 1 November 2020
Options 2,000,000 $0.528 23 November 2016 1 November 2021
Rights 257,003 N/A 22 July 2013 22 August 2017
Michael Noack Options 450,000 $0.376 4 December 2015 1 November 2020
Options 284,000 $0.528 19 December 2016 1 November 2021
Rights 128,502 N/A 22 July 2013 22 August 2017
Cameron Ferguson Options 400,000 $0.376 4 December 2015 1 November 2020
Options 284,000 $0.528 19 December 2016 1 November 2021
Rights 128,502 N/A 22 July 2013 22 August 2017
Julian Dyer Options 400,000 $0.376 4 December 2015 1 November 2020
Options 284,000 $0.528 19 December 2016 1 November 2021
Rights 128,502 N/A 22 July 2013 22 August 2017
TOTAL 6,744,509
There were no rights or options exercised during the year. There were no rights or options that lapsed or vested during the year.
The following table summarises the value of options granted to key management personnel during the financial year:
VALUE OF OPTIONS GRANTED AT THE GRANT DATE (1)
Neil McGuigan 188,820
Michael Noack 27,264
Cameron Ferguson 27,264
Julian Dyer 27,264
(1) The value of options granted during the financial year is calculated as at the grant date using a binomial pricing model. This grant date value is allocated to remuneration on a straight-line basis over the period from grant date to vesting date.

DIRECTORS’ REPORT :: 33
Remuneration Report (continued)
Key Management Personnel equity holdings
Fully paid ordinary shares issued by Australian Vintage Ltd and held by key management personnel are as follows:
RECEIVED ON BALANCE @ GRANTED AS EXERCISE OF NET OTHER BALANCE @ BALANCE HELD 1/7/16 REMUNERATION OPTIONS CHANGE 30/6/17 NOMINALLY 2017 No. No. No. No. No. No.
Non-executive Directors
Richard H Davis 110,000 - - - 110,000 -
Perry R Gunner 879,986 - - 293,900 1,173,886 -
John Davies 300,000 - - - 300,000 -
Naseema Sparks - - - - - -
Peter Perrin - - - 9,800 9,800 -
Jiang Yuan - - - 35,939,389 35,939,389 -
Executives
Neil McGuigan 915,000 - - 90,000 1,005,000 -
Michael Noack 228,841 - - 110 228,951 -
Cameron Ferguson - - - - - -
Julian Dyer - - - - - -
Flora Saris 48,000 - - (48,000) - -
2,481,827 - - 36,285,199 38,767,026 -
Performance Rights and Options issued by Australian Vintage Ltd and held by key management personnel are as follows:
VESTED VESTED OPTIONS BUT NOT AND VESTED BAL. @ GRANTED AS EXPIRED/ BAL. @ BAL. VESTED EXERCIS- EXERCIS- DURING 1/7/16 REMUNERATION EXERCISED CANCELLED 30/6/17 @ 30/6/17 ABLE ABLE THE YEAR 2017 No. No. No. No. No. No. No. No. No.
Neil McGuigan 2,652,260 2,000,000 - (395,257) 4,257,003 - - - -
Michael Noack 736,605 284,000 - (158,103) 862,502 - - - -
Cameron Ferguson 726,130 284,000 - (197,628) 812,502 - - - -
Julian Dyer 528,502 284,000 - - 812,502 - - - -
Flora Sarris 260,904 - - (260,904) - - - - -
4,904,401 2,852,000 - (1,011,892) 6,744,509 - - - -
All performance rights and options granted to key management personnel during the financial year were made in accordance with the provisions of the Australian Vintage Ltd Performance Rights and Options Plan.

34 :: DIRECTORS’ REPORT
Remuneration Report (continued)Key Management Personnel Remuneration
The following table discloses the remuneration for Key Management Personnel of the Company:
2017 SHORT-TERM BENEFITS POST EMPLOYMENT SHARE BASED PAYMENTS TOTAL
Salary Non - Super - Cash Equity Equity & Bonus Other Monetary annuation Other Settled Settled Settled Fees (a) Options(b) Shares $ $ $ $ $ $ $ $ $ $
Non-Executive directors
Richard Davis 107,763 - - 2,000 10,237 - - - - 120,000
Perry R Gunner 71,233 - - 2,000 6,767 - - - - 80,000
John Davies 71,233 - - 2,000 6,767 - - - - 80,000
Naseema Sparks 71,233 - - 2,000 6,767 - - - - 80,000
Peter Perrin(c) 18,841 - - 500 1,790 - - - - 21,131
Jiang Yuan(d) - - - - - - - - - -
Sub-total 340,303 - - 8,500 32,328 - - - - 381,131
Executives
Neil McGuigan 664,963 229,500 - 29,686 35,000 - - 77,900 - 1,037,049
Michael Noack 361,442 104,856 - 89,115 35,000 - - 14,330 - 604,743
Julian Dyer 285,831 85,498 - - 66,510 - - 13,285 - 451,124
Cameron Ferguson 311,943 93,259 - 26,200 29,634 - - 13,285 - 474,321
Flora Sarris(e) 31,062 - - - 2,951 60,065 - - - 94,078
Sub-total 1,655,241 513,113 - 145,001 169,095 60,065 - 118,800 - 2,661,315
TOTAL 1,995,544 513,113 - 153,501 201,423 60,065 - 118,800 - 3,042,446
2016
Salary Non - Super - Cash Equity Equity & Bonus Other Monetary annuation Other Settled Settled Settled Fees (a) Options(b) Shares $ $ $ $ $ $ $ $ $ $
Non-Executive directors
Richard Davis 107,763 - - 2,000 10,237 - - - - 120,000
Perry R Gunner 71,233 - - 2,000 6,767 - - - - 80,000
John Davies 71,233 - - 2,000 6,767 - - - - 80,000
Naseema Sparks 71,233 - - 2,000 6,767 - - - - 80,000
Sub-total 321,462 - - 8,000 30,538 - - - - 360,000
Executives
Neil McGuigan 638,780 248,400 - 32,649 35,000 - - 24,958 - 979,787
Michael Noack 358,689 108,784 - 89,115 35,000 - - 5,412 - 597,000
Julian Dyer 332,790 85,427 - - 74,778 - - 4,810 - 497,805
Cameron Ferguson 309,713 94,858 - 26,200 29,423 - - 4,810 - 465,004
Flora Sarris 248,196 83,728 - 1,200 23,579 - - - - 356,703
Sub-total 1,888,168 621,197 - 149,164 197,780 - - 39,990 - 2,896,299
TOTAL 2,209,630 621,197 - 157,164 228,318 - - 39,990 - 3,256,299
(a) Non-monetary items include provision of motor vehicle, insurance and wine benefits and applicable fringe benefits tax.
(b) Amortisation of share options granted over the vesting period.
(c) Appointed 28 March 2017
(d) Appointed 7 June 2017
(e) Resigned 17 August 2016. Other post employment relates to payment of leave entitlements.
No director or executive appointed during the period received a payment as part of his or her consideration for agreeing to the position.

DIRECTORS’ REPORT :: 35
Remuneration Report (continued)Company Performance
The tables below set out summary information about the Group’s earnings and movements in shareholder wealth for the five years to 30 June 2017:
30 JUNE 30 JUNE 30 JUNE 30 JUNE 30 JUNE 2013 2014 2015 2016 2017 $ M $ M $ M $ M $ M
Total Revenue 208.5 214.8 230.9 242.7 226.5
EBIT 24.1 23.8 17.5 3.2 11.3
EBIT (before one off items) 20.8 19.7 16.7 16.4 11.3
Net Profit/(Loss) after tax 7.1 10.5 9.4 (2.2) 4.3
Net Profit/(Loss) after tax before one off items 5.0 7.7 7.1 7.0 4.3
30 JUNE 30 JUNE 30 JUNE 30 JUNE 30 JUNE 2013 2014 2015 2016 2017
Earnings per share - cents 5.3 5.1 4.0 (0.9) 1.8
Dividends declared - cents 2.6 2.2 Nil 1.5 1.0
Market capitalisation - $ million 63.0 74.3 84.8 131.2 117.1
Enterprise value (debt + equity) - $ million 384.0 404.2 373.2 373.9 372.3
Share price at start of year - $ per share 0.340 0.475 0.320 0.365 0.565
Share price at end of year - $ per share 0.475 0.320 0.365 0.565 0.425
Service Agreements of Key Management Personnel
Compensation and other terms of employment for Key Management Personnel (excluding Non-executive Directors) are formalised in service agreements or letters of appointment. Termination benefits disclosed below do not apply in cases of misconduct or other specified circumstances.
Neil McGuigan
(i) Term of agreement – no specified term.
(ii) Compensation includes:
a. Base salary, superannuation and wine allowance.
b. Short term incentive – entitlement to a bonus subject to certain key performance criteria. Key performance criteria include defined financial (including company profitability), commercial and occupational health and safety targets.
c. Long term incentive – entitlement to participate in AVL’s Performance Rights and Share Options. The Performance Rights are subject to meeting growth target rates in earnings per share and the Share Options are subject to meeting growth rates in earnings share and total shareholder return, and service conditions.
(iii) If Mr McGuigan’s employment is terminated by the Company, the Company must pay the equivalent of one year’s total remuneration (excluding short term incentive). Mr McGuigan may resign by providing 6 months written notice to the Company or a lesser period as agreed by the company.

36 :: DIRECTORS’ REPORT
Remuneration Report (continued) Service Agreements of Key Management Personnel (continued)
Michael Noack
(i) Term of agreement - no specified term.
(ii) Compensation includes:
a. Base salary, superannuation, life/trauma insurance, motor vehicle allowance and wine allowance.
b. Short term incentive – entitlement to a bonus subject to certain key performance criteria. Key performance criteria include defined financial (including company profitability), commercial and occupational health and safety targets.
c. Long term incentive – entitlement to participate in AVL’s Performance Rights and Share Options. The Performance Rights are subject to meeting growth target rates in earnings per share and the Share Options are subject to meeting growth rates in earnings share and total shareholder return, and service conditions.
(iii) If Mr Noack’s employment is terminated by the company, the company must pay Mr Noack the equivalent of one year’s total remuneration (excluding short term incentive). Mr Noack may resign by providing 3 months written notice to the Company or a lesser period as agreed by the company.
Cameron Ferguson
(i) Term of agreement - no specified term.
(ii) Compensation includes:
a. Base salary, superannuation, motor vehicle allowance and wine allowance.
b. Short term incentive – entitlement to a bonus subject to certain key performance criteria. Key performance criteria include defined financial (including divisional profitability), commercial and occupational health and safety targets.
c. Long term incentive – entitlement to participate in AVL’s Performance Rights and Share Options. The Performance Rights are subject to meeting growth target rates in earnings per share and the Share Options are subject to meeting growth rates in earnings share and total shareholder return, and service conditions.
(iii) If Mr Ferguson’s is terminated by the company, the company must pay Mr Ferguson the equivalent of one year’s total remuneration (excluding short term incentive). Mr Ferguson may resign by providing 3 months written notice to the Company or a lesser period as agreed by the company.
Julian Dyer
(i) Term of agreement - no specified term.
(ii) Compensation includes:
a. Base salary and United Kingdom pension payment.
b. Short term incentive – entitlement to a bonus subject to certain key performance criteria. Key performance criteria include defined financial (including divisional profitability), commercial and occupational health and safety targets.
c. Long term incentive – entitlement to participate in AVL’s Performance Rights and Share Options. The Performance Rights are subject to meeting growth target rates in earnings per share and the Share Options are subject to meeting growth rates in earnings share and total shareholder return, and service conditions.
(iii) If Mr Dyer’s employment is terminated by the Company, the Company may restrain Mr Dyer from working for a Business in Competition/Company customer for a period of up to 6 months. The Company will pay Base Salary for period in which restraint is enforced. Mr Dyer may resign by providing 3 months written notice to the Company or a lesser period as agreed by the company.
DIRECTORS’ REPORT :: 37
Non-audit servicesThe Directors are satisfied that the provision of non-audit services, during the year, by the auditor (or by another person or firm on the auditor’s behalf) is compatible with the general standard of independence for auditors imposed by the Corporations Act 2001. The Audit Committee, in conjunction with the Chief Financial Officer, assesses the provision of non-audit services by the auditors to ensure that the auditor independence requirements of the Corporation Act 2001 in relation to the audit are met.
Details of amounts paid or payable to the auditor for non-audit services provided during the year by the auditor are outlined in note 9 to the financial statements.
The directors are of the opinion that the services as disclosed in note 9 to the financial statements do not compromise the external auditor’s independence, based on advice received from the Audit Committee, for the following reasons:
• All non-audit services have been reviewed and approved to ensure that they do not impact the integrity and objectivity of the auditor, and
• none of the services undermine the general principles relating to auditor independence as set out in Code of Conduct APES 110 Code of Ethics for Professional Accountants issued by the Accounting Professional & Ethical Standards Board, including reviewing or auditing the auditor’s own work, acting in a management or decision-making capacity for the company, acting as advocate for the company or jointly sharing economic risks and rewards.
Auditors’ independence declarationThe Auditors independence declaration is included on page 38.
Indemnification of officers and auditorsDuring the financial year, the Company paid a premium in respect of a contract insuring the Directors of the Company (as named previously), the Company Secretaries and all Executive Officers of the Company and of any related Body Corporate against a liability incurred as a Director, Secretary or Executive officer to the extent permitted by the Corporations Act 2001. The contract of insurance prohibits disclosure of the nature of the liability and the amount of the premium. The Company has not otherwise, during or since the financial year, indemnified or agreed to indemnify an officer or auditor of the Company or of any related body corporate against a liability incurred as such an officer or auditor.
Rounding off of amountsThe Company is a company of the kind referred to in ASIC Corporations (Rounding in Financial / Directors Reports) instrument 2016/191 and amounts in the Directors’ Report and the Financial Report have been rounded off to the nearest thousand dollars, unless otherwise indicated.
Subsequent EventsIn respect of the financial year ended 30 June 2017 a fully franked dividend of 1.0 cent per share was declared on the 30th August 2017 and will be paid on the 10th November 2017.
There have been no other matters or circumstances, other than that referred to in the financial statements or notes thereto, that have arisen since the end of the financial year, that have significantly affected, or may significantly affect, the operations of the Group, the results of those operations, or the state of affairs of the Group in future financial years.
Signed in accordance with a resolution of the Directors made pursuant to section 298(2) of the Corporations Act 2001.
On behalf of the Directors
RICHARD DAVIS Chairman 30th August 2017
NEIL MCGUIGAN Chief Executive Officer 30th August 2017

38 :: DECLARATION OF INDEPENDENCE
Deloitte Touche TohmatsuABN 74 490 121 060 11 Waymouth Street Adelaide, SA, 5000 Australia
Phone: +61 8 8407 7000www.deloitte.com.au
30 August 2017
The Board of DirectorsAustralian Vintage Ltd275 Sir Donald Bradman DriveCOWANDILLA SA 5033
Dear Board Members
Australian Vintage Ltd
In accordance with section 307C of the Corporations Act 2001, I am pleased to provide the following declaration of independence to the directors of Australian Vintage Ltd.
As lead audit partner for the audit of the financial statements of Australian Vintage Ltd for the financial year 30 June 2017, I declare that to the best of my knowledge and belief, there have been no contraventions of:
(i) the auditor independence requirements of the Corporations Act 2001 in relation to the audit; and
(ii) any applicable code of professional conduct in relation to the audit.
Yours faithfully
DELOITTE TOUCHE TOHMATSU
Jody BurtonPartner Chartered Accountants
Liability limited by a scheme approved under Professional Standards Legislation. Member of Deloitte Touche Tohmatsu Limited

INDEPENDENT AUDIT REPORT :: 39
Independent Auditor’s Report to the members of Australian Vintage Ltd
Report on the Audit of the Financial Report
Opinion
We have audited the financial report of Australian Vintage Ltd (the “Company”) and its subsidiaries (the “Group”), which comprises the consolidated statement of financial position as at 30 June 2017, the consolidated statement of profit or loss and other comprehensive income, the consolidated statement of changes in equity and the consolidated statement of cash flows for the year then ended, and notes to the financial statements, including a summary of significant accounting policies and the directors’ declaration.
In our opinion, the accompanying financial report of the Group is in accordance with the Corporations Act 2001, including:
(i) giving a true and fair view of the Group’s financial position as at 30 June 2017 and of its financial performance for the year then ended; and
(ii) complying with Australian Accounting Standards and the Corporations Regulations 2001.
Basis for Opinion
We conducted our audit in accordance with Australian Auditing Standards. Our responsibilities under those standards are further described in the Auditor’s Responsibilities for the Audit of the Financial Report section of our report. We are independent of the Group in accordance with the auditor independence requirements of the Corporations Act 2001 and the ethical requirements of the Accounting Professional and Ethical Standards Board’s APES 110 Code of Ethics for Professional Accountants (the Code) that are relevant to our audit of the financial report in Australia. We have also fulfilled our other ethical responsibilities in accordance with the Code.
We confirm that the independence declaration required by the Corporations Act 2001, which has been given to the directors of the Company, would be in the same terms if given to directors as at the time of this auditor’s report.
We believe that the audit evidence we have obtained is sufficient and appropriate to provide a basis for our opinion.
Key Audit Matters
Key audit matters are those matters that, in our professional judgement, were of most significance in our audit of the financial report for the current period. These matters were addressed in the context of our audit of the financial report as a whole, and in forming our opinion thereon, and we do not provide a separate opinion on these matters.
Deloitte Touche TohmatsuABN 74 490 121 060 11 Waymouth Street Adelaide, SA, 5000 Australia
Phone: +61 8 8407 7000www.deloitte.com.au
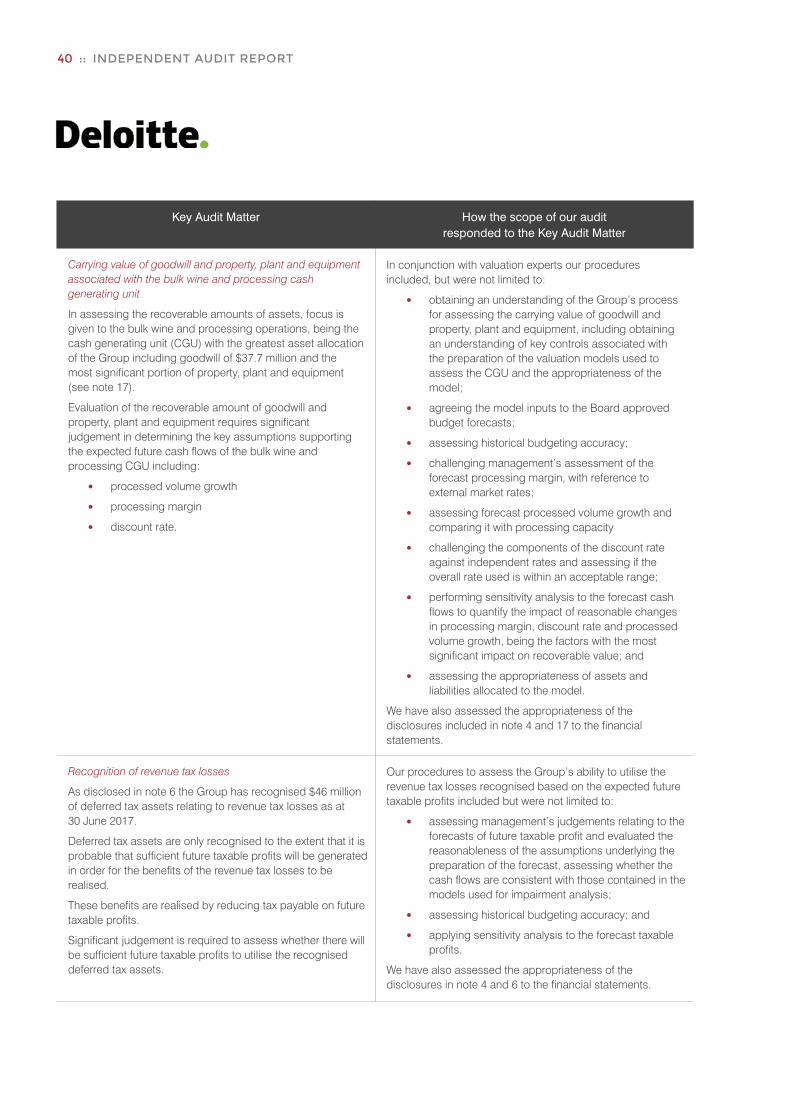
40 :: INDEPENDENT AUDIT REPORT
Key Audit Matter How the scope of our audit responded to the Key Audit Matter
Carrying value of goodwill and property, plant and equipment associated with the bulk wine and processing cash generating unit
In assessing the recoverable amounts of assets, focus is given to the bulk wine and processing operations, being the cash generating unit (CGU) with the greatest asset allocation of the Group including goodwill of $37.7 million and the most significant portion of property, plant and equipment (see note 17).
Evaluation of the recoverable amount of goodwill and property, plant and equipment requires significant judgement in determining the key assumptions supporting the expected future cash flows of the bulk wine and processing CGU including:
• processed volume growth
• processing margin
• discount rate.
In conjunction with valuation experts our procedures included, but were not limited to:
• obtaining an understanding of the Group’s process for assessing the carrying value of goodwill and property, plant and equipment, including obtaining an understanding of key controls associated with the preparation of the valuation models used to assess the CGU and the appropriateness of the model;
• agreeing the model inputs to the Board approved budget forecasts;
• assessing historical budgeting accuracy;
• challenging management’s assessment of the forecast processing margin, with reference to external market rates;
• assessing forecast processed volume growth and comparing it with processing capacity
• challenging the components of the discount rate against independent rates and assessing if the overall rate used is within an acceptable range;
• performing sensitivity analysis to the forecast cash flows to quantify the impact of reasonable changes in processing margin, discount rate and processed volume growth, being the factors with the most significant impact on recoverable value; and
• assessing the appropriateness of assets and liabilities allocated to the model.
We have also assessed the appropriateness of the disclosures included in note 4 and 17 to the financial statements.
Recognition of revenue tax losses
As disclosed in note 6 the Group has recognised $46 million of deferred tax assets relating to revenue tax losses as at 30 June 2017.
Deferred tax assets are only recognised to the extent that it is probable that sufficient future taxable profits will be generated in order for the benefits of the revenue tax losses to be realised.
These benefits are realised by reducing tax payable on future taxable profits.
Significant judgement is required to assess whether there will be sufficient future taxable profits to utilise the recognised deferred tax assets.
Our procedures to assess the Group’s ability to utilise the revenue tax losses recognised based on the expected future taxable profits included but were not limited to:
• assessing management’s judgements relating to the forecasts of future taxable profit and evaluated the reasonableness of the assumptions underlying the preparation of the forecast, assessing whether the cash flows are consistent with those contained in the models used for impairment analysis;
• assessing historical budgeting accuracy; and
• applying sensitivity analysis to the forecast taxable profits.
We have also assessed the appropriateness of the disclosures in note 4 and 6 to the financial statements.

INDEPENDENT AUDIT REPORT :: 41
Other Information
The directors are responsible for the other information. The other information comprises the Directors’ Report, which we obtained prior to the date of this auditor’s report, and also includes the following information which will be included in the Group’s annual report (but does not include the financial report and our auditor’s report thereon): Board of Directors Report, Chairman’s Report, Chief Executive Officer’s Report, Company Profile, Corporate Governance Statement and Shareholders’ Information which are expected to be made available to us after that date.
Our opinion on the financial report does not cover the other information and accordingly we do not and will not express any form of assurance conclusion thereon.
In connection with our audit of the financial report, our responsibility is to read the other information identified above and, in doing so, consider whether the other information is materially inconsistent with the financial report or our knowledge obtained in the audit, or otherwise appears to be materially misstated.
If, based on the work we have performed on the other information that we obtained prior to the date of this auditor’s report, we conclude that there is a material misstatement of this other information, we are required to report that fact. We have nothing to report in this regard.
When we read the Board of Directors, Chairman’s Report, Chief Executive Officer’s Report, Company Profile, Corporate Governance Statement and Shareholders’ Information, if we conclude that there is a material misstatement therein, we are required to communicate the matter to the directors and use our professional judgement to determine the appropriate action.
Responsibilities of the Directors for the Financial Report
The directors of the Company are responsible for the preparation of the financial report that gives a true and fair view in accordance with Australian Accounting Standards and the Corporations Act 2001 and for such internal control as the directors determine is necessary to enable the preparation of the financial report that gives a true and fair view and is free from material misstatement, whether due to fraud or error.
In preparing the financial report, the directors are responsible for assessing the ability of the Group to continue as a going concern, disclosing, as applicable, matters related to going concern and using the going concern basis of accounting unless the directors either intend to liquidate the Group or to cease operations, or has no realistic alternative but to do so.
Auditor’s Responsibilities for the Audit of the Financial Report
Our objectives are to obtain reasonable assurance about whether the financial report as a whole is free from material misstatement, whether due to fraud or error, and to issue an auditor’s report that includes our opinion. Reasonable assurance is a high level of assurance, but is not a guarantee that an audit conducted in accordance with the Australian Auditing Standards will always detect a material misstatement when it exists. Misstatements can arise from fraud or error and are considered material if, individually or in the aggregate, they could reasonably be expected to influence the economic decisions of users taken on the basis of this financial report.
As part of an audit in accordance with the Australian Auditing Standards, we exercise professional judgement and maintain professional scepticism throughout the audit. We also:
• Identify and assess the risks of material misstatement of the financial report, whether due to fraud or error, design and perform audit procedures responsive to those risks, and obtain audit evidence that is sufficient and appropriate to provide a basis for our opinion. The risk of not detecting a material misstatement resulting from fraud is higher than for one resulting from error, as fraud may involve collusion, forgery, intentional omissions, misrepresentations, or the override of internal control.
• Obtain an understanding of internal control relevant to the audit in order to design audit procedures that are appropriate in the circumstances, but not for the purpose of expressing an opinion on the effectiveness of the Group’s internal control.
• Evaluate the appropriateness of accounting policies used and the reasonableness of accounting estimates and related disclosures made by the directors.

42 :: INDEPENDENT AUDIT REPORT
• Conclude on the appropriateness of the directors’ use of the going concern basis of accounting and, based on the audit evidence obtained, whether a material uncertainty exists related to events or conditions that may cast significant doubt on the Group’s ability to continue as a going concern. If we conclude that a material uncertainty exists, we are required to draw attention in our auditor’s report to the related disclosures in the financial report or, if such disclosures are inadequate, to modify our opinion. Our conclusions are based on the audit evidence obtained up to the date of our auditor’s report. However, future events or conditions may cause the Group to cease to continue as a going concern.
• Evaluate the overall presentation, structure and content of the financial report, including the disclosures, and whether the financial report represents the underlying transactions and events in a manner that achieves fair presentation.
• Obtain sufficient appropriate audit evidence regarding the financial information of the entities or business activities within the Group to express an opinion on the financial report. We are responsible for the direction, supervision and performance of the Group’s audit. We remain solely responsible for our audit opinion.
We communicate with the directors regarding, among other matters, the planned scope and timing of the audit and significant audit findings, including any significant deficiencies in internal control that we identify during our audit.
We also provide the directors with a statement that we have complied with relevant ethical requirements regarding independence, and to communicate with them all relationships and other matters that may reasonably be thought to bear on our independence, and where applicable, related safeguards.
From the matters communicated with the directors, we determine those matters that were of most significance in the audit of the financial report of the current period and are therefore the key audit matters. We describe these matters in our auditor’s report unless law or regulation precludes public disclosure about the matter or when, in extremely rare circumstances, we determine that a matter should not be communicated in our report because the adverse consequences of doing so would reasonably be expected to outweigh the public interest benefits of such communication.
Report on the Remuneration Report
Opinion on the Remuneration Report
We have audited the Remuneration Report included in pages 28 to 36 of the director’s report for the year ended 30 June 2017.
In our opinion, the Remuneration Report of Australian Vintage Ltd, for the year ended 30 June 2017, complies with section 300A of the Corporations Act 2001.
Responsibilities
The directors of the Company are responsible for the preparation and presentation of the Remuneration Report in accordance with section 300A of the Corporations Act 2001. Our responsibility is to express an opinion on the Remuneration Report, based on our audit conducted in accordance with Australian Auditing Standards.
DELOITTE TOUCHE TOHMATSU
Jody BurtonPartnerChartered AccountantsAdelaide, 30 August 2017

DIRECTORS’ REPORT :: 43
Directors’ declaration
The Directors declare that:
(a) In the Directors’ opinion, there are reasonable grounds to believe that the company will be able to pay its debts as and when they become due and payable;
(b) the attached financial statements are in compliance with International Financial Reporting Standards as stated in note 2 to the financial statements;
(c) In the Directors’ opinion, the attached Financial Statements and notes thereto are in accordance with the Corporations Act 2001, including compliance with accounting standards and giving true and fair view of the financial position and performance of the consolidated entity; and
(d) The Directors’ have been given the declarations required by s.295A of the Corporations Act 2001.
At the date of this declaration, the Company is within the class of companies affected by ASIC class order 98/1418. The nature of the deed of cross guarantee is such that each company which is party to the deed guarantees to each creditor payment in full of any debt in accordance with the deed of cross guarantee.
In the Director’s opinion, there are reasonable grounds to believe that the Company and the companies to which the ASIC class order applies, as detailed in Note 38 to the Financial Statements will, as a group, be able to meet any obligations or liabilities to which they are or may become, subject by virtue of the deed of cross guarantee.
Signed in accordance with a resolution of the Directors made pursuant to s.295(5) of the Corporations Act 2001.
On behalf of the Directors
RICHARD DAVIS Chairman 30th August 2017
NEIL MCGUIGAN Chief Executive Officer 30th August 2017
2017 Financial ReportFOR THE FINANCIAL YEAR
ENDED 30 JUNE 2017
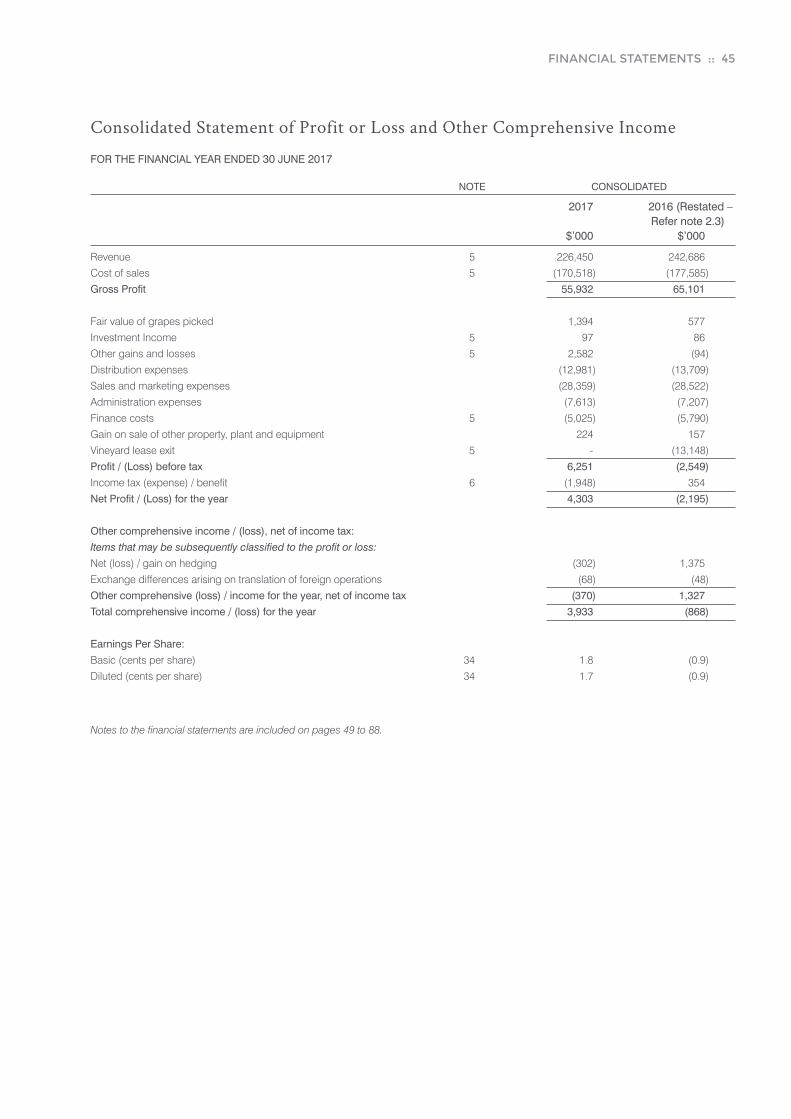
FINANCIAL STATEMENTS :: 45
Consolidated Statement of Profit or Loss and Other Comprehensive Income
FOR THE FINANCIAL YEAR ENDED 30 JUNE 2017
NOTE CONSOLIDATED
2017 2016 (Restated – Refer note 2.3) $’000 $’000
Revenue 5 226,450 242,686
Cost of sales 5 (170,518) (177,585)
Gross Profit 55,932 65,101
Fair value of grapes picked 1,394 577
Investment Income 5 97 86
Other gains and losses 5 2,582 (94)
Distribution expenses (12,981) (13,709)
Sales and marketing expenses (28,359) (28,522)
Administration expenses (7,613) (7,207)
Finance costs 5 (5,025) (5,790)
Gain on sale of other property, plant and equipment 224 157
Vineyard lease exit 5 - (13,148)
Profit / (Loss) before tax 6,251 (2,549)
Income tax (expense) / benefit 6 (1,948) 354
Net Profit / (Loss) for the year 4,303 (2,195)
Other comprehensive income / (loss), net of income tax:
Items that may be subsequently classified to the profit or loss:
Net (loss) / gain on hedging (302) 1,375
Exchange differences arising on translation of foreign operations (68) (48)
Other comprehensive (loss) / income for the year, net of income tax (370) 1,327
Total comprehensive income / (loss) for the year 3,933 (868)
Earnings Per Share:
Basic (cents per share) 34 1.8 (0.9)
Diluted (cents per share) 34 1.7 (0.9)
Notes to the financial statements are included on pages 49 to 88.

46 :: FINANCIAL STATEMENTS
Consolidated Statement of Financial Position
AS AT 30 JUNE 2017
NOTE CONSOLIDATED
2017 2016 (Restated – Refer note 2.3) $’000 $’000
Current Assets
Cash and cash equivalents 41 2,616 6,011
Trade and other receivables 10 40,197 42,789
Inventories 11 141,553 139,055
Other financial assets 12 680 827
Other 13 2,288 1,622
Total Current Assets 187,334 190,304
Non-Current Assets
Inventories 14 53,046 52,444
Other financial assets 15 396 334
Property, plant and equipment 16 97,308 92,592
Goodwill 17 37,685 37,685
Other intangible assets 18 5,296 5,784
Water Licenses 19 7,554 7,554
Deferred tax assets 6 36,945 38,644
Total Non-Current Assets 238,230 235,037
Total Assets 425,564 425,341
Current Liabilities
Trade and other payables 21 46,468 43,813
Borrowings 22 551 259
Other financial liabilities 23 194 248
Provisions 24 5,486 5,346
Other 25 - 215
Total Current Liabilities 52,699 49,881
Non-Current Liabilities
Borrowings 26 84,880 107,131
Other financial liabilities 27 28 309
Provisions 28 1,114 1,520
Total Non-Current Liabilities 86,022 108,960
Total Liabilities 138,721 158,841
Net Assets 286,843 266,500
Equity
Capital and reserves
Issued capital 31 463,009 443,266
Reserves 32 1,829 2,047
Accumulated losses 33 (177,995) (178,813)
Total Equity 286,843 266,500
Notes to the financial statements are included on pages 49 to 88.
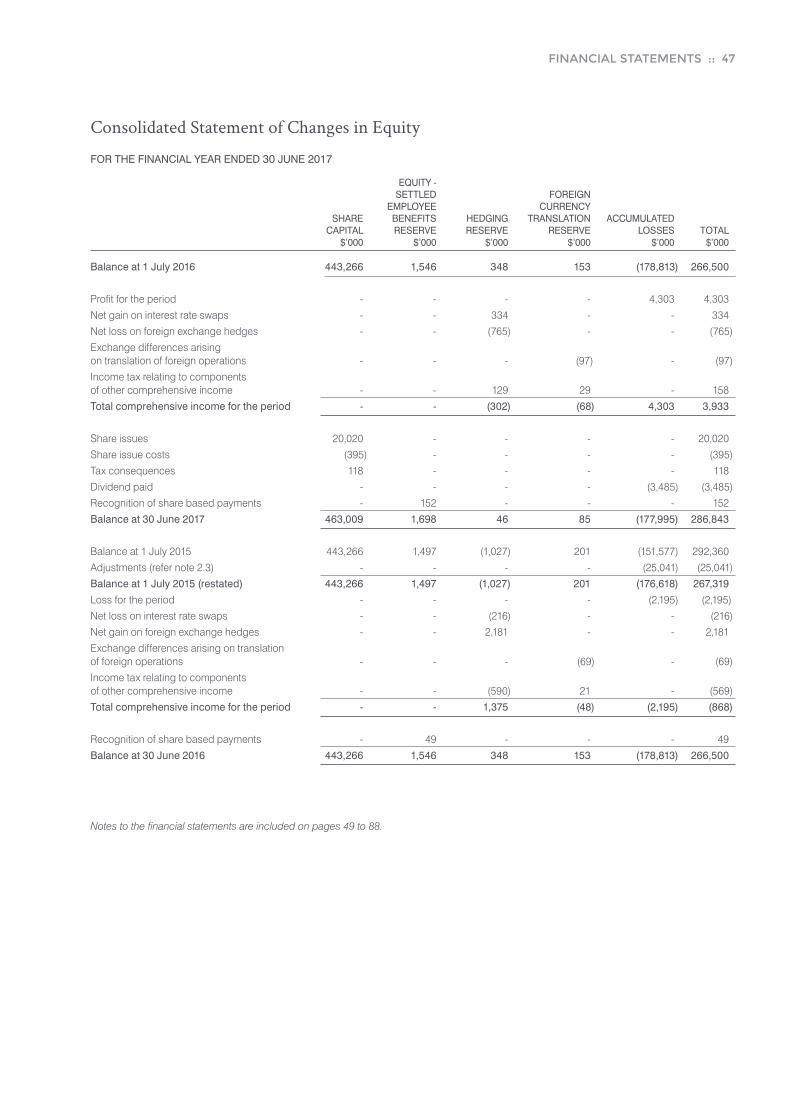
FINANCIAL STATEMENTS :: 47
Consolidated Statement of Changes in Equity
FOR THE FINANCIAL YEAR ENDED 30 JUNE 2017
EQUITY - SETTLED FOREIGN EMPLOYEE CURRENCY SHARE BENEFITS HEDGING TRANSLATION ACCUMULATED CAPITAL RESERVE RESERVE RESERVE LOSSES TOTAL $’000 $’000 $’000 $’000 $’000 $’000
Balance at 1 July 2016 443,266 1,546 348 153 (178,813) 266,500
Profit for the period - - - - 4,303 4,303
Net gain on interest rate swaps - - 334 - - 334
Net loss on foreign exchange hedges - - (765) - - (765)
Exchange differences arising on translation of foreign operations - - - (97) - (97)
Income tax relating to components of other comprehensive income - - 129 29 - 158
Total comprehensive income for the period - - (302) (68) 4,303 3,933
Share issues 20,020 - - - - 20,020
Share issue costs (395) - - - - (395)
Tax consequences 118 - - - - 118
Dividend paid - - - - (3,485) (3,485)
Recognition of share based payments - 152 - - - 152
Balance at 30 June 2017 463,009 1,698 46 85 (177,995) 286,843
Balance at 1 July 2015 443,266 1,497 (1,027) 201 (151,577) 292,360
Adjustments (refer note 2.3) - - - - (25,041) (25,041)
Balance at 1 July 2015 (restated) 443,266 1,497 (1,027) 201 (176,618) 267,319
Loss for the period - - - - (2,195) (2,195)
Net loss on interest rate swaps - - (216) - - (216)
Net gain on foreign exchange hedges - - 2,181 - - 2,181
Exchange differences arising on translation of foreign operations - - - (69) - (69)
Income tax relating to components of other comprehensive income - - (590) 21 - (569)
Total comprehensive income for the period - - 1,375 (48) (2,195) (868)
Recognition of share based payments - 49 - - - 49
Balance at 30 June 2016 443,266 1,546 348 153 (178,813) 266,500
Notes to the financial statements are included on pages 49 to 88.

48 :: FINANCIAL STATEMENTS
Consolidated Statement of Cash Flows
FOR THE FINANCIAL YEAR ENDED 30 JUNE 2017
NOTE CONSOLIDATED
2017 2016 $’000 $’000
Cash flows from operating activities
Receipts from customers 249,819 259,277
Termination payment on exit of vineyard lease - (4,946)
Other payments to suppliers and employees (230,000) (242,777)
Cash generated from operations 19,819 11,554
Interest and other costs of finance paid (5,838) (5,108)
Interest and bill discounts received 15 15
Net cash provided by operating activities 41 (d) 13,996 6,461
Cash flows from investing activities
Payments for property, plant and equipment (12,073) (4,148)
Payments for intangibles 18 (16) (280)
Payments for investments (119) -
Proceeds from sale of property, plant & equipment 635 183
Net cash used in investing activities (11,573) (4,245)
Cash flows from financing activities
Proceeds from borrowings 5,300 3,000
Proceeds from issue of shares 18,398 -
Share issue costs (395) -
Dividends paid (1,862) -
Repayment of borrowings (27,259) (1,514)
Net cash (used in) / provided by financing activities (5,818) 1,486
Net (decrease) / increase in cash and cash equivalents (3,395) 3,702
Cash and cash equivalents at the beginning of the financial year 6,011 2,309
Cash and cash equivalents at the end of the financial year 41 2,616 6,011
Notes to the financial statements are included on pages 49 to 88.

NOTES TO THE FINANCIAL STATEMENTS :: 49
Note 1: General InformationAustralian Vintage Ltd is a public company listed on the Australian Securities Exchange (trading under the symbol ‘AVG’), incorporated in Australia and with operations in Australia, Asia, North America, Europe and the United Kingdom.
Australian Vintage Ltd’s registered office and principal place of business are as follows:
Registered Office and principal place of business 275 Sir Donald Bradman Drive Cowandilla SA 5033 Tel: (08) 8172 8333
The consolidated entity’s principal activities in the course of the financial year were wine making, wine marketing, vineyard management and development.
Approval of financial statements
The financial statements were approved by the board of directors and authorised for issue on 30th August 2017.
Note 2: Adoption of new and revised Accounting StandardsApplication of new and revised International Financial Reporting Standards (IFRSs)
2.1 Adoption of new and revised Accounting Standards
In the current year, the Group has adopted all of the new and revised Standards and Interpretations issued by the Australian Accounting Standards Board (the AASB) that are relevant to its operations and effective for the current annual reporting period. Other than AASB 2014-6 Amendments to Australian Accounting Standards – Agriculture: Bearer Plants and the IFRS Interpretations Committee’s clarification on the measurement of deferred tax on indefinite life intangibles assets, the adoption of these standards did not have a significant impact on the consolidated financial statements. Refer to note 2.3 for disclosures of the impact.
2.2 New and revised Australian Accounting Standards in issue but not yet effective
At the date of authorisation of the financial statements, the Group has not applied the following new and revised Australian Accounting Standards, Interpretations and amendments that have been issued but are not yet effective.
Standards and Interpretations in Issue Not Yet Adopted
At the date of authorisation of the financial report, a number of Standards and Interpretations were in issue but not yet effective.
STANDARD / INTERPRETATION
EFFECTIVE FOR ANNUAL REPORTING PERIODS BEGINNING ON OR AFTER
EXPECTED TO BE INITIALLY APPLIED IN THE FINANCIAL YEAR ENDING
AASB 9 ‘Financial Instruments’, and the relevant amending standards 1 January 2018 30 June 2019
AASB 15 ‘Revenue from Contracts with Customers’ and AASB 2014-5 ‘Amendments to Australian Accounting Standards arising from AASB 15’, AASB 2015-8 ‘Amendments to Australian Accounting Standards – Effective date of AASB 15’
1 January 2018 30 June 2019
AASB 16 ‘Leases’ 1 January 2019 30 June 2020
Impact of New and Revised Requirements
Management is currently assessing the potential impact of the following standards:
AASB 9 ‘Financial Instruments’ (December 2009), and the relevant amending standards
AASB 9 applies to annual periods beginning on or after 1 January 2018. The directors of the Company anticipate that the application of AASB 9 in the future is not anticipated to have a material impact on amounts reported, based on current transactions, in respect of the Group’s financial assets and financial liabilities, but will affect disclosures made in the Group’s consolidated financial statements.
AASB 15 Revenue from Contracts with Customers, AASB 2014-5 Amendments to Australian Accounting Standards arising from AASB 15, AASB 2015-8 Amendments to Australian Accounting Standards – Effective Date of AASB 15, and AASB 2016-3 Amendments to Australian Accounting Standards –Clarifications to AASB 15
AASB 15 applies to annual periods beginning on or after 1 January 2018. The directors of the Company anticipate that the application of AASB 15 in the future will not have a material impact on the amounts reported, based on current transactions, but will affect disclosures made in the Group’s consolidated financial statements.
AASB 16 ‘Leases’
AASB 16 provides a comprehensive model for the identification of lease arrangements and their treatment in the financial statements of both lessees and lessors.
The accounting model for lessees will require lessees to recognise all leases on balance sheet, except for short-term leases and leases of low value assets.
AASB 16 applies to annual periods beginning on or after 1 January 2019. The directors of the Company anticipate that the application of AASB 16 in the future may have a material impact on the amounts reported and disclosures made in the Group’s consolidated financial statements. However, it is not practicable to provide a reasonable estimate of the effect of AASB 16 until the Group performs a detailed review.

50 :: NOTES TO THE FINANCIAL STATEMENTS
Note 2: Adoption of new and revised Accounting Standards (continued)2.3 Comparative Balances
(a) Effective from 1 July 2016 the Group has adopted AASB 2014-6 Amendments to Australian Accounting Standards – Agriculture: Bearer Plants, and the consequential amendments to AASB 116 Property, Plant and Equipment and AASB 141 Agriculture.
These amendments distinguish bearer plants (i.e. grape vines), from other biological assets (i.e. grapes). The updated standards consider bearer plants, which are solely used to grow produce over their productive lives, as similar to an item of machinery. Bearer plants are now accounted for under AASB 116. Agricultural produce growing on bearer plants remains within the scope of AASB 141 and continues to be measured at fair value less costs to sell.
Comparative financial information has been restated to reflect the above in accordance with relevant transitional requirements and AASB 108 Accounting Policies, Changes in Accounting Estimates and Errors. The changes reflect:
• Reclassification of the value of bearer plants from Agricultural assets to Property, plant and equipment;
• Depreciation expense in connection with bearer plants; and
• The consequential tax impact of the above
(b) Deferred tax measurement relating to indefinite life intangible assets
The IFRS Interpretations Committee has issued an agenda decision related to the expected manner of recovery of indefinite life intangible assets. The Committee was asked to clarify how an entity determines the expected manner of recovery of an intangible asset with an indefinite useful life for deferred tax measurement purposes. The Committee indicated that the fact that an entity does not amortise an indefinite life intangible asset does not necessarily mean that the carrying amount will be recovered only through sale and not use. Therefore the Group should determine the expected manner of recovery of the carrying amount of the intangible asset.
Previously the entity measured deferred tax liabilities on the assumption of the tax consequences that would arise solely from the sale of the assets. Under its new policy, the Group considers its expected manner of recovery. The Group has implemented this guidance on a retrospective basis as a change in accounting policy to AASB 112 Income Taxes.
The following tables summarize the impact of the adjustments on the comparative financial information
30 JUNE 2016 $ 000
IMPACT OF (a)
$ 000
IMPACT OF (b)
$ 000
30 JUNE 2016 RESTATED
$000
Consolidated statement of profit or loss and other comprehensive income (extract)
Cost of sales (181,350) 3,765 - (177,585) Fair value of grapes picked 4,206 (3,629) - 577 Profit before tax (2,685) 136 - (2,549) Income tax benefit 713 (359) - 354 Net Profit (1,972) (223) - (2,195) Earnings per share - - Basic (0.8) (0.1) - (0.9) - Diluted (0.8) (0.1) - (0.9) Consolidated statement of financial position (extract)
Inventories (current) 145,218 (6,163) - 139,055 Property, plant and equipment 81,375 11,217 - 92,592 Biological assets 32,828 (32,828) - - Deferred tax assets 36,134 4,118 (1,608) 38,644 Accumulated losses 153,549 23,656 1,608 178,813
Note 3: Summary of accounting policies
3.1 Statement of compliance
The financial report is a general purpose financial report which has been prepared in accordance with the Corporations Act 2001, Accounting Standards and Interpretations, and complies with other requirements of the law.
The financial report comprises the consolidated financial statements of the Group. For the purposes of preparing the consolidated financial statements, the company is a for-profit entity.
Accounting Standards include Australian equivalents to International Financial Reporting Standards (‘A-IFRS’). Compliance with the A-IFRS ensures that the financial statements and notes of the Group comply with International Financial Reporting Standards (‘IFRS’).
3.2 Basis of preparation
The consolidated financial statements have been prepared on the basis of historical cost, except for certain financial instruments that are measured at revalued amounts or fair values at the end of each reporting period, as explained in the accounting policies below and biological assets which are presented at market value.
Historical cost is generally based on the fair values of the consideration given in exchange for goods and services. All amounts are presented in Australian dollars, unless otherwise noted.

NOTES TO THE FINANCIAL STATEMENTS :: 51
Note 3: Summary of accounting policies (continued)
3.2 Basis of preparation (continued)
Fair value is the price that would be received to sell an asset or paid to transfer a liability in an orderly transaction between market participants at the measurement date, regardless of whether that price is directly observable or estimated using another valuation technique. In estimating the fair value of an asset or a liability, the Group takes into account the characteristics of the asset or liability if market participants would take those characteristics into account when pricing the asset or liability at the measurement date. Fair value for measurement and/or disclosure purposes in these consolidated financial statements is determined on such a basis, except for share-based payment transactions that are within the scope of AASB 102, leasing transactions that are within the scope of AASB 117, and measurements that have some similarities to fair value but are not fair value, such as net realisable value in AASB 102 or value in use in AASB 136.
In addition, for financial reporting purposes, fair value measurements are categorised into Level 1, 2 or 3 based on the degree to which the inputs to the fair value measurements are observable and the significance of the inputs to the fair value measurement in its entirety, which are described as follows:
• Level 1 inputs are quoted prices (unadjusted) in active markets for identical assets or liabilities that the entity can access at the measurement date;
• Level 2 inputs are inputs, other than quoted prices included within Level 1, that are observable for the asset or liability, either directly or indirectly; and
• Level 3 inputs are unobservable inputs for the asset or liability.
The company is a company of the kind referred to in ASIC Class Order 98/0100, dated 10 July 1998, and in accordance with that Class Order amounts in the financial report are rounded off to the nearest thousand dollars, unless otherwise indicated.
3.3 Basis of consolidation
The consolidated financial statements incorporate the financial statements of the Company and entities (including structured entities) controlled by the Company and its subsidiaries. Control is achieved when the Company:
• has power over the investee;
• is exposed, or has rights, to variable returns from its involvement with the investee; and
• has the ability to use its power to affect its returns.
Consolidation of a subsidiary begins when the Company obtains control over the subsidiary and ceases when the Company loses control of the subsidiary. Specifically, income and expenses of a subsidiary acquired or disposed of during the year are included in the consolidated statement of profit or loss and other comprehensive income from the date the Company gains control until the date when the Company ceases to control the subsidiary.
Profit or loss and each component of other comprehensive income are attributed to the owners of the Company and to the non-controlling interests.
Total comprehensive income of subsidiaries is attributed to the owners of the Company and to the non-controlling interests even if this results in the non-controlling interests having a deficit balance.
When necessary, adjustments are made to the financial statements of subsidiaries to bring their accounting policies into line with the Group’s accounting policies.
All intragroup assets and liabilities, equity, income, expenses and cash flows relating to transactions between members of the Group are eliminated in full on consolidation.
3.4 Borrowing costs
Borrowing costs directly attributable to the acquisition, construction or production of qualifying assets, which are assets that necessarily take a substantial period of time to get ready for their intended use or sale, are added to the cost of those assets, until such time as the assets are substantially ready for their intended use or sale. Investment income earned on the temporary investment of specific borrowings pending their expenditure on qualifying assets is deducted from the borrowing costs eligible for capitalisation.
All other borrowing costs are recognised in profit or loss in the period in which they are incurred.
3.5 Cash and cash equivalents
Cash comprises cash on hand and demand deposits. Cash equivalents are short term, highly liquid investments that are readily convertible to known amounts of cash and have maturity of less than 3 months at date of acquisition.
3.6 Derivative financial instruments
The Group enters into a variety of derivative financial instruments to manage its exposure to interest rate and foreign exchange rate risk, including forward exchange contracts, foreign currency options and interest rate swaps. Further details of derivative financial instruments are disclosed in note 42 to the financial statements.
Derivatives are initially recognised at fair value at the date a derivative contract is entered into and are subsequently remeasured to their fair value at each reporting date. The resulting gain or loss is recognised in profit or loss immediately unless the derivative is designated and effective as a hedging instrument, in which event, the timing of the recognition in profit or loss depends on the nature of the hedge relationship.
The Group designates certain derivatives as either hedges of the fair value of recognised assets or liabilities or firm commitments (fair value hedges) or hedges of highly probable forecast transactions or hedges of foreign currency risk of firm commitments (cash flow hedges).
The fair value of a hedging derivative is presented as a non-current asset or a non-current liability if the remaining maturity of the instrument is more than 12 months and it is not expected to be realised or settled within 12 months. Other derivatives are presented as current assets or current liabilities.

52 :: NOTES TO THE FINANCIAL STATEMENTS
Note 3: Summary of accounting policies (continued)
3.6 Derivative financial instruments (continued)
Embedded derivatives
Derivatives embedded in other financial instruments or other host contracts are treated as separate derivatives when their risks and characteristics are not closely related to those of host contracts and the host contracts are not measured at fair value with changes in fair value recognised in profit or loss.
Hedge accounting
The Group designates certain hedging instruments, which include derivatives in respect of foreign currency risk, as either fair value hedges or cash flow hedges.
Hedges of foreign exchange risk on firm commitments and highly probable forecast transactions are accounted for as cash flow hedges. At the inception of the hedge relationship the Group documents the relationship between the hedging instrument and hedged item, along with its risk management objectives and its strategy for undertaking various hedge transactions. Furthermore, at the inception of the hedge and on an ongoing basis, the Group documents whether the hedging instrument that is used in a hedging relationship is highly effective in offsetting changes in fair values or cash flows of the hedged item attributable to the hedged risk.
Note 42 contains details of the fair values of the derivative instruments used for hedging purposes. Movements in the hedging reserve are shown in the Statement of Changes in Equity.
Fair value hedge
Changes in the fair value of derivatives that are designated and qualify as fair value hedges are recorded in profit or loss immediately, together with any changes in the fair value of the hedged item that is attributable to the hedged risk.
Hedge accounting is discontinued when the Group revokes the hedging relationship, the hedging instrument expires or is sold, terminated, or exercised, or no longer qualifies for hedge accounting. The adjustment to the carrying amount of the hedged item arising from the hedged risk is amortised to profit or loss from that date.
Cash flow hedge
The effective portion of changes in the fair value of derivatives that are designated and qualify as cash flow hedges are deferred in equity. The gain or loss relating to the ineffective portion is recognised immediately in profit or loss as part of other expenses or other income. Amounts deferred in equity are recycled in profit or loss in the periods when the hedged item is recognised in profit or loss in the same line of the statement of comprehensive income as the recognised hedged item. However, when the forecast transaction that is hedged results in the recognition of a non-financial asset or a non-financial liability, the gains and losses previously deferred in equity are transferred from equity and included in the initial measurement of the cost of the asset or liability.
Hedge accounting is discontinued when the Group revokes the hedging relationship, the hedging instrument expires or is sold, terminated, or exercised, or no longer qualifies for hedge accounting. Any cumulative gain or loss deferred in equity at that time remains in equity and is recognised when the forecast transaction is ultimately recognised in profit or loss. When a forecast transaction is no longer expected to occur, the cumulative gain or loss that was deferred in equity is recognised immediately in profit or loss.
3.7 Employee benefits
A liability is recognised for benefits accruing to employees in respect of wages and salaries, annual leave and long service leave when it is probable that settlement will be required and they are capable of being measured reliably.
Liabilities recognised in respect of short term employee benefits, are measured at their nominal values using the remuneration rate expected to apply at the time of settlement.
Liabilities recognised in respect of long term employee benefits are measured as the present value of the estimated future cash outflows to be made by the Group in respect of services provided by employees up to reporting date.
Defined contribution plans
Contributions to defined contribution superannuation plans are expensed when employees have rendered service entitling them to the contributions.
3.8 Financial instruments
Financial assets and financial liabilities are recognised when a group entity becomes a party to the contractual provisions of the instrument.
Financial assets and financial liabilities are initially measured at fair value. Transaction costs that are directly attributable to the acquisition or issue of financial assets and financial liabilities (other than financial assets and financial liabilities at fair value through profit or loss) are added to or deducted from the fair value of the financial assets or financial liabilities, as appropriate, on initial recognition. Transaction costs directly attributable to the acquisition of financial assets or financial liabilities at fair value through profit and loss are recognised immediately in profit or loss.
Financial assets
Financial assets are classified into the following specified categories: financial assets ‘at fair value through profit or loss’ (FVTPL), ‘held to maturity’ investments, ‘available-for-sale’ (AFS) financial assets and ‘loans and receivables’. The classification depends on the nature and purpose of the financial assets and is determined at the time of initial recognition.
Investments in controlled entities
Investments in controlled entities are recorded at cost in the Company financial statements. Investments in associates have been accounted for under the equity method in the consolidated financial statements and the cost method in the Company financial statements. Other investments are recorded at fair value with gains or losses arising on re-measurement recognised in profit or loss.
Dividends are recognised on a receivable basis. Interest revenue is recognised on a time proportionate basis that takes into account the effective yield on the financial assets.

NOTES TO THE FINANCIAL STATEMENTS :: 53
Note 3: Summary of accounting policies (continued)
3.8 Financial instruments (continued)
Effective interest method
The effective interest method is a method of calculating the amortised cost of a financial asset and of allocating interest income over the relevant period.
Income is recognised on an effective interest rate basis for debt instruments other than those financial assets classified as at FVTPL.
Financial assets at FVTPL
Financial assets are classified as at FVTPL when the financial asset is either held for trading or it is designated as at FVTPL.
Loans and receivables
Trade receivables, loans, and other receivables that have fixed or determinable payments that are not quoted in an active market are classified as ‘loans and receivables’. Loans and receivables are measured at amortised cost using the effective interest method less impairment.
Interest is recognised by applying the effective interest rate, except for short term receivables when the effect of discounting is immaterial.
Impairment of financial assets
Financial assets, other than those at fair value through profit or loss, are assessed for indicators of impairment at each balance sheet date. Financial assets are impaired where there is objective evidence that as a result of one or more events that occurred after the initial recognition of the financial asset the estimated future cash flows of the investment have been impacted. For financial assets carried at amortised cost, the amount of the impairment is the difference between the asset’s carrying amount and the present value of estimated future cash flows, discounted at the original effective interest rate.
The carrying amount of the financial asset is reduced by the impairment loss directly for all financial assets with the exception of trade receivables where the carrying amount is reduced through the use of an allowance account. When a trade receivable is uncollectible, it is written off against the allowance account. Subsequent recoveries of amounts previously written off are credited against the allowance account. Changes in the carrying amount of the allowance account are recognised in profit or loss.
If, in a subsequent period, the amount of the impairment loss decreases and the decrease can be related objectively to an event occurring after the impairment was recognised, the previously recognised impairment loss is reversed through profit or loss to the extent the carrying amount of the investment at the date the impairment is reversed does not exceed what the amortised cost would have been had the impairment not been recognised.
Derecognition of financial assets
The Group derecognises a financial asset only when the contractual rights to the cash flows from the asset expire, or when it transfers the financial asset and substantially all the risks and rewards of ownership of the asset to another entity. If the Group neither transfers nor retains substantially all the risks and rewards of ownership of a transferred financial asset, the Group continues to recognise the financial asset and also recognises a collateralised borrowing for the proceeds received.
On derecognition of a financial asset in its entirety, the difference between the asset’s carrying amount and the sum of the consideration received and receivable and the cumulative gain or loss that has been recognised in other comprehensive income and accumulated in equity is recognised in profit and loss.
On derecognition of a financial asset other than in its entirety, (e.g. when the Group retains an option to repurchase part of the transferred asset or retains a residual interest that does not result in the retention of substantially all the risks and rewards of ownership and the Group retains control), the Group allocates the previous carrying amount of the financial asset between the part it continues to recognise under continuing involvement, and the part it no longer recognises on the basis of amount allocated to the part that is no longer recognised and the sum of the consideration received for the part no longer recognised and any cumulative gain or loss allocated to it that had been recognised in other comprehensive income is recognised in profit and loss. A cumulative gain or loss that has been recognised in other comprehensive income is allocated between the part that continues to be recognised and the part that is no longer recognised on the basis of the relative fair values of those parts.
3.9 Financial instruments issued by the Group
Debt and equity instruments
Debt and equity instruments are classified as either liabilities or as equity in accordance with the substance of the contractual arrangement.
Financial guarantee contract liabilities
Financial guarantee contract liabilities are measured initially at their fair values and subsequently at the higher of the amount recognised as a provision and the amount initially recognised less cumulative amortisation in accordance with the revenue recognition policies.
Financial liabilities
Financial liabilities are classified as either financial liabilities ‘at fair value through profit or loss’ or other financial liabilities.
Other financial liabilities
Other financial liabilities, including borrowings, are initially measured at fair value, net of transaction costs.
Other financial liabilities are subsequently measured at amortised cost using the effective interest method, with interest expense recognised on an effective yield basis.
The effective interest method is a method of calculating the amortised cost of a financial liability and of allocating interest expense over the relevant period. The effective interest rate is the rate that exactly discounts estimated future cash payments through the expected life of the financial liability, or, where appropriate, a shorter period.
De-recognition of financial liabilities
The Group derecognises financial liabilities when, and only when, the Group’s obligations are discharged, cancelled or they expire. The difference between the carrying amount of the financial liability derecognised and the consideration paid and payable is recognised in profit or loss.

54 :: NOTES TO THE FINANCIAL STATEMENTS
Note 3: Summary of accounting policies (continued)
3.10 Foreign currency
Foreign currency transactions
All foreign currency transactions during the financial year are brought to account using the exchange rate in effect at the date of the transaction. Foreign currency monetary items at reporting date are translated at the exchange rate existing at reporting date. Non-monetary assets and liabilities carried at fair value that are denominated in foreign currencies are translated at the rates prevailing at the date when the fair value was determined.
The individual financial statements of each group entity are presented in the currency of the primary economic environment in which the entity operates (its functional currency). For the purpose of the consolidated financial statements, the results and financial position of each entity are expressed in Australian dollars, which is the functional currency of Australian Vintage Ltd, and the presentation currency for the consolidated financial statements.
In preparing the financial statements of the individual entities, transactions in currencies other than the entity’s functional currency (foreign currencies) are recorded at the rates of exchange prevailing on the dates of the transactions. At each balance sheet date, monetary items denominated in foreign currencies are retranslated at the rates prevailing at the balance sheet date. Non-monetary items carried at fair value that are denominated in foreign currencies are retranslated at the rates prevailing on the date when the fair value was determined. Non-monetary items that are measured in terms of historical cost in a foreign currency are not retranslated.
Exchange differences are recognised in profit or loss in the period in which they arise except for:
• exchange differences which relate to assets under construction for future productive use, which are included in the cost of those assets where they are regarded as an adjustment to interest costs on foreign currency borrowings (refer note 3.8);
• exchange differences on transactions entered into in order to hedge certain foreign currency risks (refer note 3.8); and
• exchange differences on monetary items receivable from or payable to a foreign operation for which settlement is neither planned or likely to occur, which form part of the net investment in a foreign operation, and which are recognised in the foreign currency translation reserve and recognised in profit or loss on disposal of the net investment.
Foreign operations
On consolidation, the assets and liabilities of the Group’s overseas operations are translated into Australian dollars at exchange rates prevailing at the balance sheet date. Income and expense items are translated at the average exchange rates for the period.
Goodwill and fair value adjustments arising on the acquisition of a foreign entity are treated as assets and liabilities of the foreign entity and translated at exchange rates prevailing at the reporting date. Exchange differences arising are recognised in equity.
3.11 Goodwill
Goodwill arising in a business combination is recognised as an asset at the date that control is acquired (the acquisition date). Goodwill is measured as the excess of the sum of the consideration transferred, the amount of any non-controlling interests in the acquiree, and the fair value of the acquirer’s previously held equity interest in the acquiree (if any) over the net of the acquisition-date amounts of the identifiable assets acquired and the liabilities assumed.
If, after reassessment, the Group’s interest in the fair value of the acquiree’s identifiable net assets exceeds the sum of the consideration transferred, the amount of any non-controlling interests in the acquiree and the fair value of the acquirer’s previously held equity interest in the acquiree (if any), the excess is recognised immediately in profit or loss as a bargain purchase gain.
Goodwill is not amortised but is reviewed for impairment at least annually. For the purpose of impairment testing, goodwill is allocated to each of the Group’s cash-generating units expected to benefit from the synergies of the combination. Cash-generating units to which goodwill has been allocated are tested for impairment annually, or more frequently when there is an indication that the unit may be impaired. If the recoverable amount of the cash-generating unit is less than its carrying amount, the impairment loss is allocated first to reduce the carrying amount of any goodwill allocated to the unit and then to the other assets of the unit pro-rata on the basis of the carrying amount of each asset in the unit. An impairment loss recognised for goodwill is not reversed in a subsequent period. Any impairment loss for goodwill is recognised directly in profit or loss in the consolidated statement of comprehensive income.
On disposal of a subsidiary, the attributable amount of goodwill is included in the determination of the profit or loss on disposal.
3.12 Goods and services tax
Revenues, expenses and assets are recognised net of the amount of goods and services tax (GST), except:
(i) where the amount of GST incurred is not recoverable from the taxation authority, it is recognised as part of the cost of acquisition of an asset or as part of an item of expense; or
(ii) for receivables and payables which are recognised inclusive of GST.
The net amount of GST recoverable from, or payable to, the taxation authority is included as part of receivables or payables.
Cash flows are included in the cash flow statement on a gross basis. The GST component of cash flows arising from investing and financing activities which is recoverable from, or payable to, the taxation authority is classified as operating cash flows.
3.13 Grape vines and produce extracted from vines
Grape vines are classified as a separate biological asset class in accordance with Australian Accounting Standard AASB 141 “Agriculture”. The biological assets are measured on initial recognition and at each reporting date at their fair value less costs to sell unless the market determined prices or values are not available and for which alternative estimates of fair value are determined to be clearly unreliable. In the current financial year and the comparative financial year, the fair values have been estimated by the directors based on discounted cash flow analysis of each vineyard and reference to the current market value of similar assets recently exchanged in the open market. Produce harvested from vines owned by the Group are measured as revenue at fair value less estimated costs to sell at the point of harvest (including production costs). A gain or loss arising from a change in fair values less estimated costs to sell is included in the profit and loss in the period in which the gain/loss arises. The agricultural produce is recorded within inventory.

NOTES TO THE FINANCIAL STATEMENTS :: 55
Note 3: Summary of accounting policies (continued)
3.14 Impairment of long-lived assets
At each reporting date, the Group reviews the carrying amounts of its tangible and intangible assets to determine whether there is any indication that those assets have suffered an impairment loss. If any such indication exists, the recoverable amount of the asset is estimated in order to determine the extent of the impairment loss (if any). Where the asset does not generate cash flows that are independent from other assets, the Group estimates the recoverable amount of the cash-generating unit to which the asset belongs.
Goodwill, intangible assets with indefinite useful lives and intangible assets not yet available for use are tested for impairment annually and whenever there is an indication that the asset may be impaired. An impairment of goodwill is not subsequently reversed.
Recoverable amount is the higher of fair value less costs to sell and value in use. In assessing value in use, the estimated future cash flows are discounted to their present value using a pre-tax discount rate that reflects current market assessments of the time value of money and the risks specific to the asset for which the estimates of future cash flows have not been adjusted.
If the recoverable amount of an asset (or cash-generating unit) is estimated to be less than its carrying amount, the carrying amount of the asset (cash-generating unit) is reduced to its recoverable amount. An impairment loss is recognised in profit or loss immediately, unless the relevant asset is carried at fair value, in which case the impairment loss is treated as a revaluation decrease.
Where an impairment loss subsequently reverses, the carrying amount of the asset (cash-generating unit) is increased to the revised estimate of its recoverable amount, but only to the extent that the increased carrying amount does not exceed the carrying amount that would have been determined had no impairment loss been recognised for the asset (cash-generating unit) in prior years. A reversal of an impairment loss is recognised in profit or loss immediately, unless the relevant asset is carried at fair value, in which case the reversal of the impairment loss is treated as a revaluation increase.
3.15 Income tax
Income tax expense represents the sum of the tax currently payable and deferred tax.
Current tax
Current tax is calculated by reference to the amount of income taxes payable or recoverable in respect of the taxable profit or tax loss for the period. It is calculated using tax rates and tax laws that have been enacted or substantively enacted by reporting date. Current tax for current and prior periods is recognised as a liability (or asset) to the extent that it is unpaid (or refundable).
Deferred tax
Deferred tax is accounted for using the balance sheet liability method in respect of temporary differences arising from differences between the carrying amount of assets and liabilities in the financial statements and the corresponding tax base of those items.
In principle, deferred tax liabilities are recognised for all taxable temporary differences. Deferred tax assets are recognised to the extent that it is probable that sufficient taxable amounts will be available against which deductible temporary differences or unused tax losses and tax offsets can be utilised. However, deferred tax assets and liabilities are not recognised if the temporary differences giving rise to them arise from the initial recognition of assets and liabilities (other than as a result of a business combination) which affects neither taxable income nor accounting profit. Furthermore, a deferred tax liability is not recognised in relation to taxable temporary differences arising from goodwill.
Deferred tax liabilities are recognised for taxable temporary differences arising on investments in subsidiaries and associates except where the Group is able to control the reversal of the temporary differences and it is probable that the temporary differences will not reverse in the foreseeable future. Deferred tax assets arising from deductible temporary differences associated with these investments and interests are only recognised to the extent that it is probable that there will be sufficient taxable profits against which to utilise the benefits of the temporary differences and they are expected to reverse in the foreseeable future.
Deferred tax assets and liabilities are measured at the tax rates that are expected to apply to the period(s) when the asset and liability giving rise to them are realised or settled, based on tax rates (and tax laws) that have been enacted or substantively enacted by reporting date. The measurement of deferred tax liabilities and assets reflects the tax consequences that would follow from the manner in which the Group expects, at the reporting date, to recover or settle the carrying amount of its assets and liabilities.
Deferred tax assets and liabilities are offset when they relate to income taxes levied by the same taxation authority and the Group intends to settle its current tax assets and liabilities on a net basis.
Current and deferred tax for the period
Current and deferred tax is recognised as an expense or income in the statement of comprehensive income, except when it relates to items credited or debited directly to equity, in which case the deferred tax is also recognised directly in equity, or where it arises from the initial accounting for a business combination, in which case it is taken into account in the determination of goodwill or excess.
Tax consolidation
The company and all its wholly-owned Australian resident entities are part of a tax-consolidated group under Australian taxation law. Australian Vintage Ltd is the head entity in the tax-consolidated group.
Current tax liabilities and assets, and deferred tax assets arising from unused tax losses and relevant tax credits of the members of the tax-consolidated group are recognised by the company (as head entity in the tax-consolidated group).
Entities within the tax-consolidated group have entered into a tax funding arrangement and a tax-sharing agreement with the head entity. Under the terms of the tax funding arrangement, Australian Vintage Ltd and each of the entities in the tax-consolidated group has agreed to pay a tax equivalent payment to or from the head entity, based on the current tax liability or current tax asset of the entity.
3.16 Intangible assets
Brand names and Registered Trademarks
Brand names recognised by the Group are considered to have an indefinite useful life and are not amortised. Each period, the useful life of this type of asset is reviewed to determine whether events and circumstances continue to support an indefinite useful life assessment for the asset. Such assets are tested for impairment in accordance with the policy stated in Note 3.14.

56 :: NOTES TO THE FINANCIAL STATEMENTS
Note 3: Summary of accounting policies (continued)
3.16 Intangible assets (continued)
Software
Software is carried at cost less any accumulated amortisation and accumulated impairment losses. Amortisation is recognised on a straight line basis over the estimated useful life. The estimated useful life of the software package is 10 years. Estimated useful lives and amortisation methods are reviewed at the end of each annual reporting period, with the effect of any changes in estimate being accounted for on a prospective basis.
Intangible assets acquired in a business combination and recognised separately from goodwill are initially recognised at their fair value at the acquisition date (which is regarded as their cost).
Subsequent to initial recognition, intangible assets acquired in a business combination are reported at cost less accumulated amortisation and accumulated impairment losses, on the same basis as intangible assets that are acquired separately.
3.17 Inventories
Inventories are valued at the lower of cost and net realisable value. Costs, including an appropriate portion of fixed and variable overhead expenses, are assigned to inventory on hand by the method most appropriate to each particular class of inventory, with the majority being valued on a first in first out basis. Net realisable value represents the estimated selling price in the ordinary course of business less the estimated costs of completion and estimated costs necessary to make the sale.
Inventory is assessed for obsolescence on an ongoing basis and adjusted to net realisable value as required. The assessment takes into account the quality, age and saleability of the inventory on hand.
3.18 Leased assets
Leases are classified as finance leases whenever the terms of the lease transfer substantially all the risks and rewards of ownership to the lessee. All other leases are classified as operating leases.
Group as lessor
Rental income from operating leases is recognised on a straight line basis over the term of the relevant lease. However, contingent rentals arising under operating leases are recognised as income in a manner consistent with the basis on which they are determined.
Group as lessee
Assets held under finance leases are initially recognised at their fair value or, if lower, at amounts equal to the present value of the minimum lease payments, each determined at the inception of the lease. The corresponding liability to the lessor is included in the statement of financial position as a finance lease obligation.
Lease payments are apportioned between finance charges and reduction of the lease obligation so as to achieve a constant rate of interest on the remaining balance of the liability. Finance expenses are charged directly against income, unless they are directly attributable to qualifying assets, in which case they are capitalised in accordance with the Group’s general policy on borrowing costs. Refer to note 3.4.
Finance leased assets are amortised on a straight line basis over the estimated useful life of the asset.
Operating lease payments are recognised as an expense on a straight-line basis over the lease term, except where another systematic basis is more representative of the time pattern in which economic benefits from the leased asset are consumed.
3.19 Non-current assets held for sale
Non-current assets classified as held for sale are measured at the lower of carrying amount and fair value less costs to sell.
Non-current assets are classified as held for sale if their carrying amount will be recovered through a sale transaction rather than through continuing use. This condition is regarded as met only when management are committed to the sale, the sale is highly probable and the asset is available for immediate sale in its present condition and the sale of the asset is expected to be completed within one year from the date of classification.
3.20 Payables
Trade payables and other accounts payable are recognised when the Group becomes obliged to make future payments resulting from the purchase of goods and services.
3.21 Property, plant and equipment
Property, plant and equipment are initially measured at cost. Cost includes expenditure that is directly attributable to the acquisition of the item. In the event that settlement of all or part of the purchase consideration is deferred, cost is determined by discounting the amounts payable in the future to their present value as at the date of acquisition.
Buildings, plant and equipment, vineyard improvements and equipment under finance lease are measured at cost less accumulated depreciation and impairment. Freehold land is not depreciated.
Depreciation is provided on property, plant and equipment, including freehold buildings but excluding land. Depreciation is calculated on a straight line and diminishing value basis so as to write off the net cost of each asset over its expected useful life to its estimated residual value. The estimated useful lives, residual values and depreciation method are reviewed at each year end, with the effect of any changes in estimate accounted for on a prospective basis. Vineyard improvements are depreciated over the period of the lease or estimated useful life, whichever is the shorter, using the straight line method. The estimated useful lives, residual values and depreciation method are reviewed at the end of each annual reporting period, with the effect of any changes recognised on a prospective basis. Depreciation related to wineries, production and some vineyards is capitalised into inventory.
Assets held under finance leases are depreciated over their expected useful lives on the same basis as owned assets or, where shorter, the term of the relevant lease. The gain or loss arising on the disposal or retirement of an item of property, plant and equipment is determined as the difference between the sales proceeds and the carrying amount of the asset and is recognised in profit and loss.

NOTES TO THE FINANCIAL STATEMENTS :: 57
Note 3: Summary of accounting policies (continued)
3.21 Property, plant and equipment (continued)
The following estimated useful lives are used in the calculation of depreciation:
• Buildings 50 years
• Vineyard improvements 15-20 years
• Plant and equipment 5-33 years
• Plant and equipment under lease 5-15 years
• Vines 30 years
3.22 Provisions
Provisions are recognised when the Group has a present obligation (legal or constructive), the future sacrifice of economic benefits is probable, and the amount of the provision can be measured reliably. The amount recognised as a provision is the best estimate of the consideration required to settle the present obligation at reporting date, taking into account the risks and uncertainties surrounding the obligation. Where a provision is measured using the cash flows estimated to settle the present obligation, its carrying amount is the present value of those cash flows.
When some or all of the economic benefits required to settle a provision are expected to be recovered from a third party, the receivable is recognised as an asset if it is virtually certain that recovery will be received and the amount of the receivable can be measured reliably.
An onerous contract is considered to exist where the Group has a contract under which the unavoidable cost of meeting the contractual obligations exceed the economic benefits estimated to be received. Present obligations arising under onerous contracts are recognised as a provision to the extent that the present obligation exceeds the economic benefits estimated to be received.
A restructuring provision is recognised when the Group has developed a detailed formal plan for the restructuring and has raised a valid expectation in those affected that it will carry out the restructuring by starting to implement the plan or announcing its main features to those affected by it. The measurement of a restructuring provision includes only the direct expenditures arising from the restructuring, which are those amounts that are both necessarily entailed by the restructuring and not associated with the ongoing activities of the entity.
3.23 Revenue
Revenue is measured at the fair value of the consideration received or receivable. Revenue is reduced for estimated customer returns, rebates, discounts and other similar allowances.
Sale of goods
Revenue from the sale of goods is recognised when all the following conditions are satisfied:
• the Group has transferred to the buyer the significant risks and rewards of ownership of the goods;
• the Group retains neither continuing managerial involvement to the degree usually associated with ownership nor effective control over the goods sold;
• the amount of revenue can be measured reliably;
• it is probable that the economic benefits associated with the transaction will flow to the entity; and
• the costs incurred or to be incurred in respect of the transaction can be measured reliably.
Vineyard development/management contracts
Revenue is earned from the development and management of vineyards. Revenue from cost plus development contracts is recognised by reference to the recoverable costs incurred during the financial year plus the percentage of fees earned. Percentage of fees earned is measured by the proportion that costs incurred to date relate to the estimated total cost of the stage of the contract. Where a loss is expected to occur it is recognised immediately. Revenue from vineyard management contracts is recognised based on a percentage of completion method.
Contract Processing
Revenue from contract processing is recognised based on the percentage of winemaking process completed.
Interest Revenue
Interest revenue is accrued on a time basis by reference to the principal balance and the effective interest rate, which is the rate that exactly discounts estimated future cash receipts through the expected life of the financial asset to that asset’s net carrying amount. Interest income from a financial asset is recognised when it is probable that the economic benefit will flow to the Group and the amount of revenue can be measured reliably.
Rental Income
Rent is accrued on a time basis by reference to the total rent due to the Group for the reporting period.
3.24 Share-based payments
For cash-settled share-based payments, a liability equal to the portion of the goods or services received is recognised at the current fair value determined at each reporting date. Equity-settled share-based payments to employees are measured at the fair value of the equity instruments at the grant date.
3.25 Trade credits
Trade credits are recorded at the net present value of expected future usage. The Group reviews the recoverable amount of the trade credits at each reporting date and any shortfall against carrying value is charged to profit and loss.
3.26 Water licences
Water allocations with permanent rights are measured at cost on the date of acquisition. The permanent water licences have an indefinite useful life and are not subject to amortisation. Water allocations with permanent rights are assessed for impairment in each reporting period, with reference to current market prices. Water allocations with temporary rights are expensed in the year of purchase.

58 :: NOTES TO THE FINANCIAL STATEMENTS
Note 4: Critical accounting judgments and key sources of estimation uncertaintyIn the application of the Group’s accounting policies, management is required to make judgments, estimates and assumptions about carrying values of assets and liabilities that are not readily apparent from other sources. The estimates and associated assumptions are based on historical experience and other factors that are believed to be reasonable under the circumstance, the results of which form the basis of making the judgments. Actual results may differ from these estimates. The estimates and underlying assumptions are reviewed on an ongoing basis. Revisions to accounting estimates are recognised in the period in which the estimate is revised if the revision affects only that period, or in the period of the revision and future periods if the revision affects both current and future periods.
The following are the critical accounting judgments and key sources of estimation uncertainty that management has made in applying the Group’s accounting policies:
Impairment of goodwill
The goodwill arising from the acquisition of businesses has been reassessed through the estimation of the value in use of the bulk wine and processing cash generating unit to which goodwill has been allocated. The value in use calculation requires the Group to estimate the future cash flows expected to arise from the cash generating units based on forecasted volume, processing margin and select a discount rate in order to calculate present value.
Details of the assumptions and sensitivities performed are outlined in Note 17.
Income tax losses
The Group has recognised deferred tax assets in relation to unused tax losses and temporary differences as at the end of the reporting period. The recognition of deferred tax assets is after considering whether it is probable that the Group will have sufficient taxable profit in the foreseeable future and against which the deferred tax assets can be recovered.
The assessment of whether there will be sufficient taxable profit is subject to a level of judgment and if the actual conditions vary to the assumptions adopted, the carrying value of the asset would need to be reassessed.
Impairment of other intangibles
The carrying values of the brand names have been individually assessed as part of separate cash generating units (CGUs).
Impairment tests were performed on brand names using a discounted cash flow model.
There have been estimations applied to assumptions in the cash flow from the CGUs. Should these estimations vary, the carrying amount of the intangible assets would need to be reassessed.
Details of the assumptions and sensitivities performed are outlined in Note 18.

NOTES TO THE FINANCIAL STATEMENTS :: 59
Note 5: Profit / (Loss) from operationsThe following is an analysis of the Group’s revenue for the year from continuing operations CONSOLIDATED
2017 2016 $’000 $’000
(a) Revenue – continuing operations Revenue from the sale of goods 222,130 235,880 Revenue from contract processing 521 3,705 Revenue from rendering contract vineyard services 3,799 3,101 Total 226,450 242,686 Investment income Rental income 82 71 Interest income 15 15 Total 97 86 Other gains / (losses) Wine equalisation tax rebate 500 500 Gain / (loss) on unrealised foreign exchange 1,284 (1,519) Other rebates 488 773 Other 310 152 Total 2,582 (94)
(b) Profit / (Loss) before income tax Profit / (loss) before income tax has been arrived at after crediting / (charging) the following gains and losses: Gain on disposal of other property, plant and equipment 224 157 Gain / (Loss) on unrealised foreign exchange 1,284 (1,519)
Loss on vineyard lease exit (1) - (13,148)
(1) During the year ended 30th June 2016 the Group expensed $13,148,000 in relation to the termination and exit from the Del Rios vineyard lease. These costs included a termination payment, legal fees, vineyard running costs and other associated costs
Profit / (Loss) before income tax has been arrived at after charging the following expenses: Cost of sales 170,518 177,585
Operating lease rental expenses (minimum lease payments) 6,533 8,768 Employee benefit expense: Share-based payments: Equity settled share-based payments 152 49 152 49
Termination benefits 98 345 Superannuation benefits 2,561 2,580 Other employee benefits (incl. salaries and wages) 33,914 34,721 Total employee benefits expense 36,725 37,695
(c) Depreciation and amortisation expense: Depreciation of non-current assets - charged to cost of sales 4,943 4,722 Depreciation of non-current assets - other 2,002 2,134 Amortisation of non-current assets 504 598 Total depreciation and amortisation expense 7,449 7,454
(d) Finance costs: Interest on bank overdrafts and loans 4,902 5,582 Interest on obligations under finance lease 22 86 4,924 5,668 Unwinding of discounts 101 122 Total finance costs 5,025 5,790 The weighted average rate on funds borrowed is 4.32% per annum (2016: 4.24% per annum).

60 :: NOTES TO THE FINANCIAL STATEMENTS
Note 6: Income taxes CONSOLIDATED
2017 2016 $’000 $’000
(a) Income tax recognised in profit or loss
Current tax
Current tax (benefit) / expense in respect of the current year - -
- -
Deferred tax
Deferred tax expense / (benefit) relating to the current year 1,957 (332)
Adjustments recognised in the current year in relation to the current tax of prior years (9) (22)
1,948 (354)
Total income tax expense / (benefit) recognised in the current year relating to continuing operations 1,948 (354)
The prima facie income tax expense / (benefit) on pre-tax accounting income/(loss) from operations reconciles to the income tax expense in the financial statements as follows:
Profit / (Loss) from operations 6,251 (2,549)
Income expense / (benefit) expense calculated at 30% 1,875 (765)
Non-deductible expenses 82 433
Adjustments recognised in the current year in relation to tax of prior years (9) (22)
Total tax expense / (benefit) 1,948 (354)
The tax rate used for the 2017 and 2016 reconciliations above is the corporation tax rate of 30% payable by Australian Corporate entities on taxable profits under Australian tax law.
(b) Income tax recognised in other comprehensive income 276 (569)
(c) Taxable and deductible temporary differences arise from the following:
CONSOLIDATED
Opening Charged to Charged to Acquisitions/ Closing Balance Income Equity Disposals Balance Temporary differences 2017 $’000 $’000 $’000 $’000 $’000
Gross deferred tax liabilities:
Inventories (6,232) 694 - - (5,538)
Intangibles (1,472) (80) - - (1,552)
Property, plant and equipment (5,306) (1,963) - - (7,269)
Other (34) 5 - - (29)
(13,044) (1,344) - - (14,388)
Gross deferred tax assets:
Trade and other receivables 26 (25) - - 1
Inventories 118 1,125 - - 1,243
Trade and other payables 1,309 (163) - - 1,146
Provisions 2,651 (223) - - 2,428
Tax losses 47,170 (1,161) - - 46,009
Other 414 (166) 258 - 506
51,688 (613) 258 - 51,333
Net deferred tax asset 38,644 (1,957) 258 - 36,945

NOTES TO THE FINANCIAL STATEMENTS :: 61
Note 6: Income taxes (continued)
(c) Taxable and deductible temporary differences arise from the following (continued):
CONSOLIDATED
Opening Charged to Charged to Acquisitions/ Closing Balance Income Equity Disposals Balance Temporary differences 2016 $’000 $’000 $’000 $’000 $’000
Gross deferred tax liabilities:
Inventories (5,566) (666) - - (6,232)
Intangibles (1,508) 36 - - (1,472)
Property, plant and equipment (4,749) (557) - - (5,306)
Other (35) 1 - - (34)
(11,858) (1,186 ) - - (13,044)
Gross deferred tax assets:
Trade and other receivables 87 (61) - - 26
Inventories 11,100 (10,982) - - 118
Trade and other payables 677 632 - - 1,309
Provisions 3,042 (391) - - 2,651
Tax losses 34,822 12,348 - - 47,170
Other 1,011 (28) (569) - 414
50,739 1,518 (569) - 51,688
Net deferred tax asset 38,881 332 (569) - 38,644
There are no unrecognised revenue tax losses relating to the Group. The Group has not recognised $1,127,615 (2016: $1,062,000) of capital losses. The Directors expect the future financial performance of the Group will facilitate the full recovery of the revenue tax losses.
Tax Consolidation
Relevance of tax consolidation to the Group
The company and its wholly-owned Australian resident entities have formed a tax-consolidated group with effect from 1 July 2003 and are therefore taxed as a single entity from that date. The head entity within the tax-consolidated group is Australian Vintage Ltd. The members of the tax-consolidated group are identified in note 38.
Nature of tax funding arrangements and tax sharing agreements
Entities within the tax-consolidated group have entered into a tax funding arrangement and a tax-sharing agreement with the head entity. Under the terms of the tax funding arrangement, Australian Vintage Ltd and each of the entities in the tax-consolidated group has agreed to pay a tax equivalent payment to or from the head entity, based on the current tax liability or current tax asset of the entity. The tax funding arrangement requires each subsidiary to prepare an individual tax calculation to determine the amount payable or receivable. Such amounts are reflected in amounts receivable from or payable to other entities in the tax-consolidated group.
The tax sharing agreement entered into between members of the tax-consolidated group provides for the determination of the allocation or income tax liabilities between the entities should the head entity default on its tax payment obligation. No amounts have been recognised in the financial statements in respect of this agreement as payment of any amounts under the tax sharing agreement is considered remote. The effect of the tax sharing agreement is that each member’s liability for tax payable by the tax-consolidated group is limited to the amount payable to the head entity under the tax funding arrangement.
Note 7: Key management personnel compensationThe aggregate compensation of the key management personnel of the Group and the company is set out below:
CONSOLIDATED
2017 2016 $ $
Short-term employee benefits 2,662,158 2,894,991
Post-employment benefits 261,488 228,318
Share based payments 118,800 39,990
Termination benefits - -
3,042,446 3,256,299
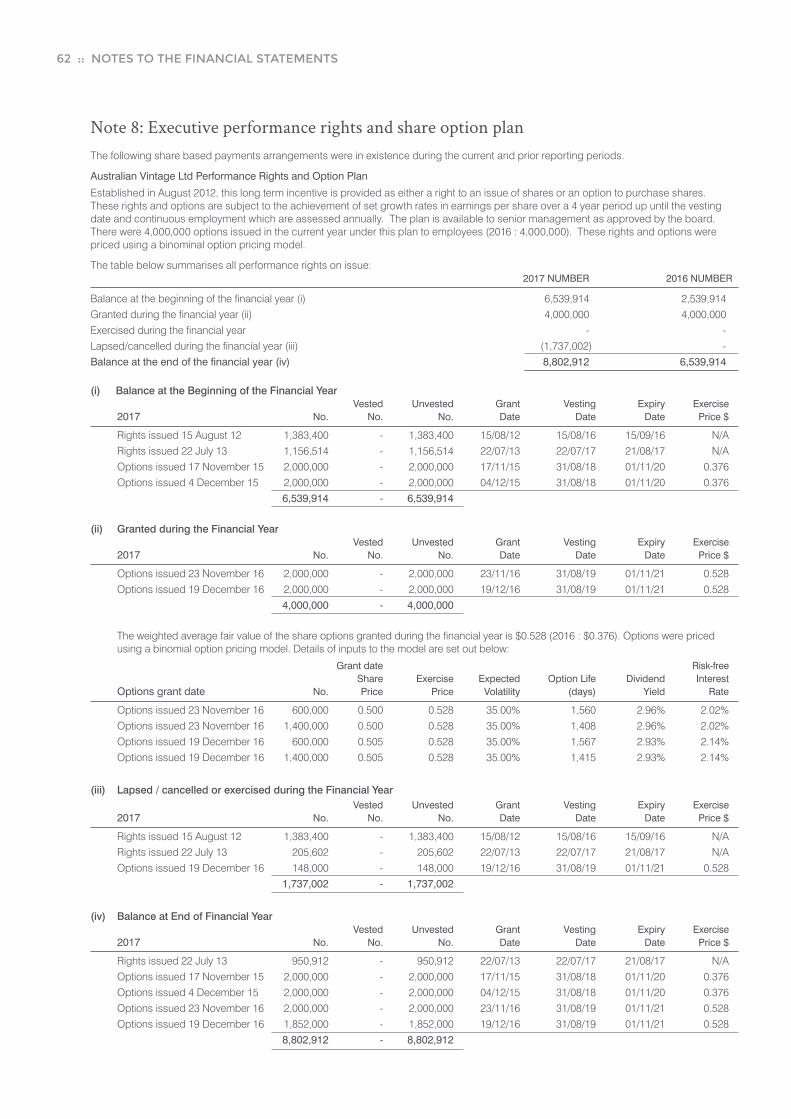
62 :: NOTES TO THE FINANCIAL STATEMENTS
Note 8: Executive performance rights and share option planThe following share based payments arrangements were in existence during the current and prior reporting periods.
Australian Vintage Ltd Performance Rights and Option Plan
Established in August 2012, this long term incentive is provided as either a right to an issue of shares or an option to purchase shares. These rights and options are subject to the achievement of set growth rates in earnings per share over a 4 year period up until the vesting date and continuous employment which are assessed annually. The plan is available to senior management as approved by the board. There were 4,000,000 options issued in the current year under this plan to employees (2016 : 4,000,000). These rights and options were priced using a binominal option pricing model.
The table below summarises all performance rights on issue: 2017 NUMBER 2016 NUMBER
Balance at the beginning of the financial year (i) 6,539,914 2,539,914Granted during the financial year (ii) 4,000,000 4,000,000Exercised during the financial year - -Lapsed/cancelled during the financial year (iii) (1,737,002) -Balance at the end of the financial year (iv) 8,802,912 6,539,914
(i) Balance at the Beginning of the Financial Year Vested Unvested Grant Vesting Expiry Exercise 2017 No. No. No. Date Date Date Price $
Rights issued 15 August 12 1,383,400 - 1,383,400 15/08/12 15/08/16 15/09/16 N/A Rights issued 22 July 13 1,156,514 - 1,156,514 22/07/13 22/07/17 21/08/17 N/A Options issued 17 November 15 2,000,000 - 2,000,000 17/11/15 31/08/18 01/11/20 0.376 Options issued 4 December 15 2,000,000 - 2,000,000 04/12/15 31/08/18 01/11/20 0.376 6,539,914 - 6,539,914
(ii) Granted during the Financial Year Vested Unvested Grant Vesting Expiry Exercise 2017 No. No. No. Date Date Date Price $
Options issued 23 November 16 2,000,000 - 2,000,000 23/11/16 31/08/19 01/11/21 0.528 Options issued 19 December 16 2,000,000 - 2,000,000 19/12/16 31/08/19 01/11/21 0.528 4,000,000 - 4,000,000
The weighted average fair value of the share options granted during the financial year is $0.528 (2016 : $0.376). Options were priced using a binomial option pricing model. Details of inputs to the model are set out below:
Grant date Risk-free Share Exercise Expected Option Life Dividend Interest Options grant date No. Price Price Volatility (days) Yield Rate
Options issued 23 November 16 600,000 0.500 0.528 35.00% 1,560 2.96% 2.02% Options issued 23 November 16 1,400,000 0.500 0.528 35.00% 1,408 2.96% 2.02% Options issued 19 December 16 600,000 0.505 0.528 35.00% 1,567 2.93% 2.14% Options issued 19 December 16 1,400,000 0.505 0.528 35.00% 1,415 2.93% 2.14%
(iii) Lapsed / cancelled or exercised during the Financial Year Vested Unvested Grant Vesting Expiry Exercise 2017 No. No. No. Date Date Date Price $
Rights issued 15 August 12 1,383,400 - 1,383,400 15/08/12 15/08/16 15/09/16 N/A Rights issued 22 July 13 205,602 - 205,602 22/07/13 22/07/17 21/08/17 N/A Options issued 19 December 16 148,000 - 148,000 19/12/16 31/08/19 01/11/21 0.528 1,737,002 - 1,737,002
(iv) Balance at End of Financial Year Vested Unvested Grant Vesting Expiry Exercise 2017 No. No. No. Date Date Date Price $
Rights issued 22 July 13 950,912 - 950,912 22/07/13 22/07/17 21/08/17 N/A Options issued 17 November 15 2,000,000 - 2,000,000 17/11/15 31/08/18 01/11/20 0.376 Options issued 4 December 15 2,000,000 - 2,000,000 04/12/15 31/08/18 01/11/20 0.376 Options issued 23 November 16 2,000,000 - 2,000,000 23/11/16 31/08/19 01/11/21 0.528 Options issued 19 December 16 1,852,000 - 1,852,000 19/12/16 31/08/19 01/11/21 0.528 8,802,912 - 8,802,912

NOTES TO THE FINANCIAL STATEMENTS :: 63
Note 9: Remuneration of auditors
CONSOLIDATED
2017 2016 $ $
Auditor of the parent company
Audit or review of financial report 386,100 377,100
Other services – other audit services 48,448 48,047
Other services – taxation advice - 9,000
Other services – taxation compliance 37,419 36,864
471,967 471,011
The external auditor of Australian Vintage Ltd is Deloitte Touche Tohmatsu.
Note 10: Current trade and other receivables CONSOLIDATED
2017 2016 $’000 $’000
Trade receivables (i) 39,142 41,806
Allowance for doubtful debts (4) (22)
39,138 41,784
Loans to other entities (ii) - 500
Other receivables 1,059 505
40,197 42,789
(i) The average credit period on sales of goods and rendering of services is 65 days (2016: 61 days). No interest is charged on outstanding trade receivables. An allowance has been made for estimated irrecoverable trade receivable amounts arising from the past sale of goods and rendering of services, determined by reference to past default experience.
(ii) Loan relates to vendor finance for stock sold as part of the Yaldara Winery sale. No interest is charged on this loan.
Before accepting any new customers, the Group uses a third party to assess the potential customer’s credit quality and defines credit limits by customer. Limits provided on customer accounts are reviewed throughout the year. Of the trade receivables balance at the end of the year, $21.6 million (2016: $23.4 million) is due from international and domestic supermarket groups. There are no other customers who represent more than 5% of the total balance of trade receivables.
Included in the Group’s trade receivable balance are debtors with a carrying amount of $2.0 million (2016: $3.0 million) which are past due at the reporting date for which the Group has not provided as there has not been a significant change in credit quality and the amounts are still considered recoverable. The Group does not hold any collateral over these balances.
Ageing of past due but not impaired
30 – 60 days 1,992 2,911
60 – 90 days 1 57
90 – 120 days 18 14
Total 2,011 2,982
Average age (days) 40 37
Movement in the allowance of doubtful debts
Balance at the beginning of the year (22) (392)
Impairment (losses) / reversals recognised on receivables (30) (447)
Amounts written off as not collectable 48 817
Balance at the end of the year (4) (22)
In determining the recoverability of a trade receivable, the Group considers any change in the credit quality of the trade receivable from the date credit was initially granted up to the reporting date. Accordingly, the directors believe that there is no further credit provision required in excess of the allowance for doubtful debts.
Included in the allowance for doubtful debts are no individually impaired trade receivables (2016 : Nil) which have been placed under liquidation. The impairment recognised represents the difference between the carrying amount of these trade receivables and the present value of the expected liquidation proceeds.

64 :: NOTES TO THE FINANCIAL STATEMENTS
Note 11: Current inventories CONSOLIDATED
2017 2016 $’000 $’000
Work in progress - bulk wine 101,779 97,859
Other stores and raw materials 3,939 4,043
Work in progress - other 4,828 6,440
Bottled wine 31,007 30,713
141,553 139,055
The cost of inventory recognised as an expense (or cost of sales) during the year in respect of continuing operations was $170.5 million (2016: $177.6 million).
Note 12: Other financial assetsHedge assets – foreign currency forwards and options 680 827
680 827
Note 13: Other current assetsPrepayments 2,288 1,622
2,288 1,622
Note 14: Non-current inventoriesWork in progress - Bulk wine 51,414 50,828
Bottled wine 1,632 1,616
53,046 52,444
Note 15: Other non-current financial assets Hedge assets – foreign currency forwards and options - 226
Investments in companies (i) 178 59
Other 218 49
396 334
(i) Relates to investments in wine related businesses
Note 16: Property, plant and equipment
(a) Carrying Values
Vineyard Improvements
at cost 14,492 14,169
accumulated depreciation (8,984) (8,289)
5,508 5,880 Freehold Land
at cost 12,868 13,076
Vines
At cost 33,497 32,828
accumulated depreciation (22,585) (21,611)
10,912 11,217
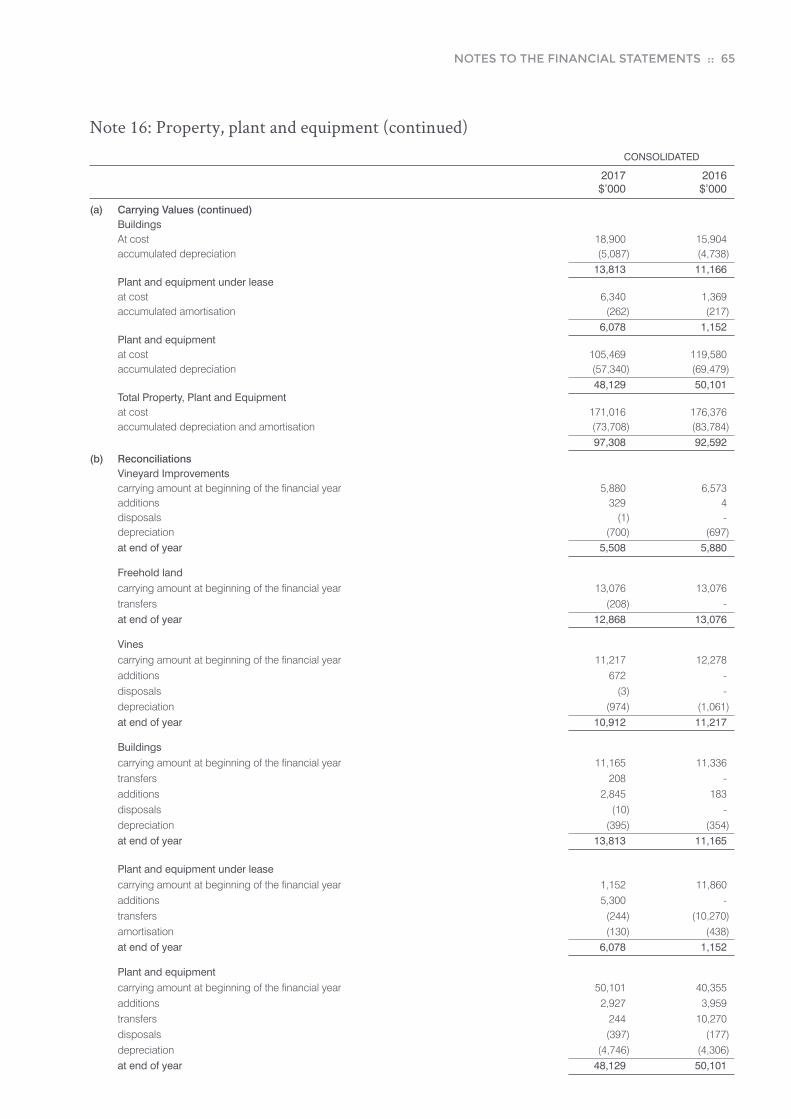
NOTES TO THE FINANCIAL STATEMENTS :: 65
Note 16: Property, plant and equipment (continued) CONSOLIDATED
2017 2016 $’000 $’000
(a) Carrying Values (continued) Buildings At cost 18,900 15,904 accumulated depreciation (5,087) (4,738) 13,813 11,166 Plant and equipment under lease at cost 6,340 1,369 accumulated amortisation (262) (217) 6,078 1,152 Plant and equipment at cost 105,469 119,580 accumulated depreciation (57,340) (69,479) 48,129 50,101 Total Property, Plant and Equipment at cost 171,016 176,376 accumulated depreciation and amortisation (73,708) (83,784) 97,308 92,592
(b) Reconciliations Vineyard Improvements carrying amount at beginning of the financial year 5,880 6,573 additions 329 4 disposals (1) - depreciation (700) (697) at end of year 5,508 5,880 Freehold land carrying amount at beginning of the financial year 13,076 13,076 transfers (208) - at end of year 12,868 13,076 Vines carrying amount at beginning of the financial year 11,217 12,278 additions 672 - disposals (3) - depreciation (974) (1,061) at end of year 10,912 11,217
Buildings carrying amount at beginning of the financial year 11,165 11,336 transfers 208 - additions 2,845 183 disposals (10) - depreciation (395) (354) at end of year 13,813 11,165 Plant and equipment under lease carrying amount at beginning of the financial year 1,152 11,860 additions 5,300 - transfers (244) (10,270) amortisation (130) (438) at end of year 6,078 1,152
Plant and equipment carrying amount at beginning of the financial year 50,101 40,355 additions 2,927 3,959 transfers 244 10,270 disposals (397) (177) depreciation (4,746) (4,306) at end of year 48,129 50,101

66 :: NOTES TO THE FINANCIAL STATEMENTS
Note 17: Goodwill
CONSOLIDATED
2017 2016 $’000 $’000
Gross carrying amount:
Balance at beginning of the financial year 44,085 44,085
Balance at end of the financial year 44,085 44,085
Accumulated impairment losses
Balance at beginning of financial year 6,400 6,400
Balance at end of financial year (i) 6,400 6,400
Net book value
At the beginning of the financial year 37,685 37,685
At the end of the financial year 37,685 37,685
Allocation of goodwill to cash-generating units
Goodwill has been allocated for impairment testing purposes to the following cash generating unit: Bulk wine and contract processing business 37,685 37,685
(i) The impairment of goodwill is tested each reporting date and is based on determining the recoverable amount of the bulk wine and processing cash generating unit (CGU). Given the unique nature of the assets, it is not possible to obtain comparable fair values to the assets owned by this Group and therefore the value in use method is the method used by the Group for assessing whether the assets in the CGU are impaired. The recoverable amount of this CGU has been determined based on a value in use method which calculates the net present value of the forecast cash flows expected from the CGU. The cash flows are based on the current management budgets and forecasts for the following 5 years and a terminal value to account for the cash flows beyond the 5th year. In preparing the impairment model, the Group started with the cash flows from the year ended 30 June 2017 and adjusted that base year for the budgets and 5-year plans approved by the Board of Directors.
The cash flows in the impairment model have been discounted to present value using a discount rate applicable to the cash flow. The Group has used the weighted average cost of capital as a guide to determine the discount rate applied to the cash flows as it is considered the most appropriate discount rate for the risk specific to the assets in the CGU.
The net present value of the cash flows has been compared to the assets within the CGU which include the goodwill balance above. In the current year, the Group applied a pre-tax discount rate of 12% p.a. (2016: 11.47% p.a.) to account for the risk associated with the assets in the current financial markets.
Assumptions
Key assumptions relate to forecast volume growth and processing margin, which have been sensitised and the results are outlined below.
The other assumptions used in the value in use calculations are as follows:
• Working capital levels used in future years;
• Pre-tax Discount rate of 12% (2016: 11.47%);
• Terminal Growth Rate of 2.5% (2016: 2.5%).
Discount Rate
The discount rate was determined after considering an appropriate: Beta; risk free interest rate; incremental cost of borrowing for the Group; and the debt / equity ratio.
The inputs used in the model have been sourced from industry and financial market reports relevant to the Group and the Australian wine industry and have been considered in relation to the Group.
Sensitivity Analysis
The bulk wine and processing business includes sales of bulk wine and contract processing to external customers, and processing of wine to internal business units.
Cash flow forecasts are based upon our most recent budget and 5-year financial plans approved by the Board. The 5-year plan incorporates assumptions regarding volume growth which are based upon anticipated market demand and past experience.
The Group has performed sensitivity analysis on the value in use calculation as follows:
• Volume growth is based upon Board approved budgets and 5-year plan forecasts. The net cash flow can be reduced by $3.5 million per annum (representing a 25% decline) before an impairment is recognised;
• The model is sensitive to the amount of the internal charge for wine processing. This charge can be reduced by 41% before an impairment is recognised;
• The discount rate can be increased by 3 percentage points (to 14.88%) before an impairment is recognised;
• Reducing the terminal growth rate to 0% does not cause the associated goodwill to be impaired;
The calculations are not very sensitive to exchange rates as the majority of cash flows from this business unit are denominated in Australian dollars.

NOTES TO THE FINANCIAL STATEMENTS :: 67
Note 18: Other intangible assets
CONSOLIDATED
2017 2016 $’000 $’000
Brand Names and Registered Trademarks:
Balance at 1 July 4,828 4,828
Disposed during the year - -
Balance at 30 June 4,828 4,828
Software:
Balance at 1 July 956 1,274
Costs incurred during the year 16 280
Amortisation expense (504) (598)
Balance at 30 June 468 956
Total other intangible assets 5,296 5,784
Brand names have been assessed as having an indefinite useful life as the assets are integral to the business. Brand names can be managed by another management team and similar assets in the wine industry are commonly defined as having an indefinite useful life.
The impairment of brand names is tested each reporting date and is based on the cash flows generated by each brand. The cash flows are based on the current management budgets and forecasts for the following 5 years and a terminal value to account for the cash flows beyond the 5th year.
Discount Rate
The cash flows have been discounted to present value. In the current year, the Group applied a pre-tax discount rate of 16.98% p.a. (2016: 16.3% p.a.) to account for the risk associated with the assets in the current financial markets.
The discount rate was determined after considering an appropriate: Beta; risk free interest rate; incremental cost of borrowing for the Group; and the debt /equity ratio.
The inputs used in the model have been sourced from industry and financial market reports relevant to the Group and the Australian wine industry and have been considered in relation to the Group.
Key Assumptions
The key assumptions used in the value in use calculations are as follows:
• Terminal Growth Rate of 2.5% (2016: 2.5%)
• Discount rate of 16.98% (2016: 16.3%)
• Revenue growth rate of 7% (2016: 6%)
No impairment charges relating to brands were recorded as the cash flows continued to support the carrying values of these brands.
Sensitivity Analysis
The Group has performed sensitivity analysis on the brand names valuation models as follows:
• The discount rate can be increased to 21.86% before an impairment is recognised.
• A decline of $0.39 million per annum (representing a 30% decline) in the net cash flow can occur before an impairment arises.
• Reducing revenue growth rates to 0% does not cause the brand names to be impaired.
• Reducing the terminal growth rate to 0% does not cause the brand names to be impaired.
Note 19: Water licences
Permanent water licences – at cost 7,554 7,554
Balance at 1 July 7,554 7,554
Balance at 30 June 7,554 7,554
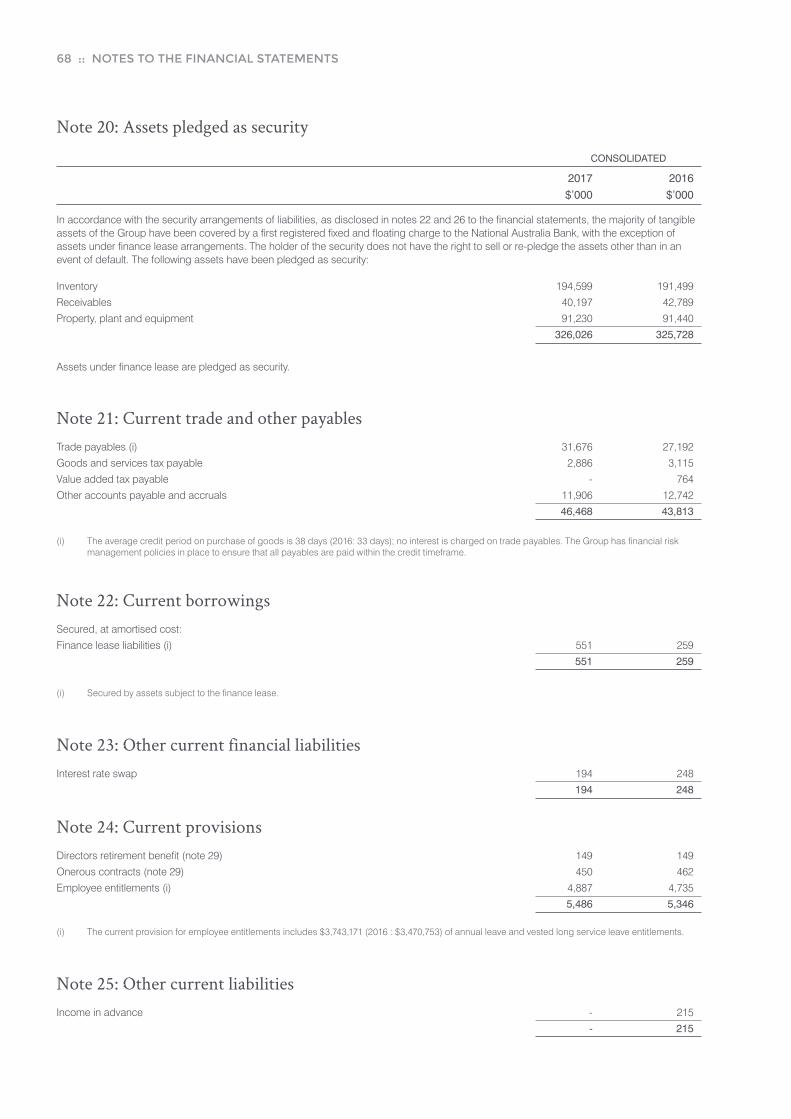
68 :: NOTES TO THE FINANCIAL STATEMENTS
Note 20: Assets pledged as security
CONSOLIDATED
2017 2016 $’000 $’000
In accordance with the security arrangements of liabilities, as disclosed in notes 22 and 26 to the financial statements, the majority of tangible assets of the Group have been covered by a first registered fixed and floating charge to the National Australia Bank, with the exception of assets under finance lease arrangements. The holder of the security does not have the right to sell or re-pledge the assets other than in an event of default. The following assets have been pledged as security:
Inventory 194,599 191,499
Receivables 40,197 42,789
Property, plant and equipment 91,230 91,440
326,026 325,728
Assets under finance lease are pledged as security.
Note 21: Current trade and other payablesTrade payables (i) 31,676 27,192
Goods and services tax payable 2,886 3,115
Value added tax payable - 764
Other accounts payable and accruals 11,906 12,742
46,468 43,813
(i) The average credit period on purchase of goods is 38 days (2016: 33 days); no interest is charged on trade payables. The Group has financial risk management policies in place to ensure that all payables are paid within the credit timeframe.
Note 22: Current borrowingsSecured, at amortised cost:
Finance lease liabilities (i) 551 259
551 259
(i) Secured by assets subject to the finance lease.
Note 23: Other current financial liabilitiesInterest rate swap 194 248
194 248
Note 24: Current provisionsDirectors retirement benefit (note 29) 149 149
Onerous contracts (note 29) 450 462
Employee entitlements (i) 4,887 4,735
5,486 5,346
(i) The current provision for employee entitlements includes $3,743,171 (2016 : $3,470,753) of annual leave and vested long service leave entitlements.
Note 25: Other current liabilitiesIncome in advance - 215
- 215
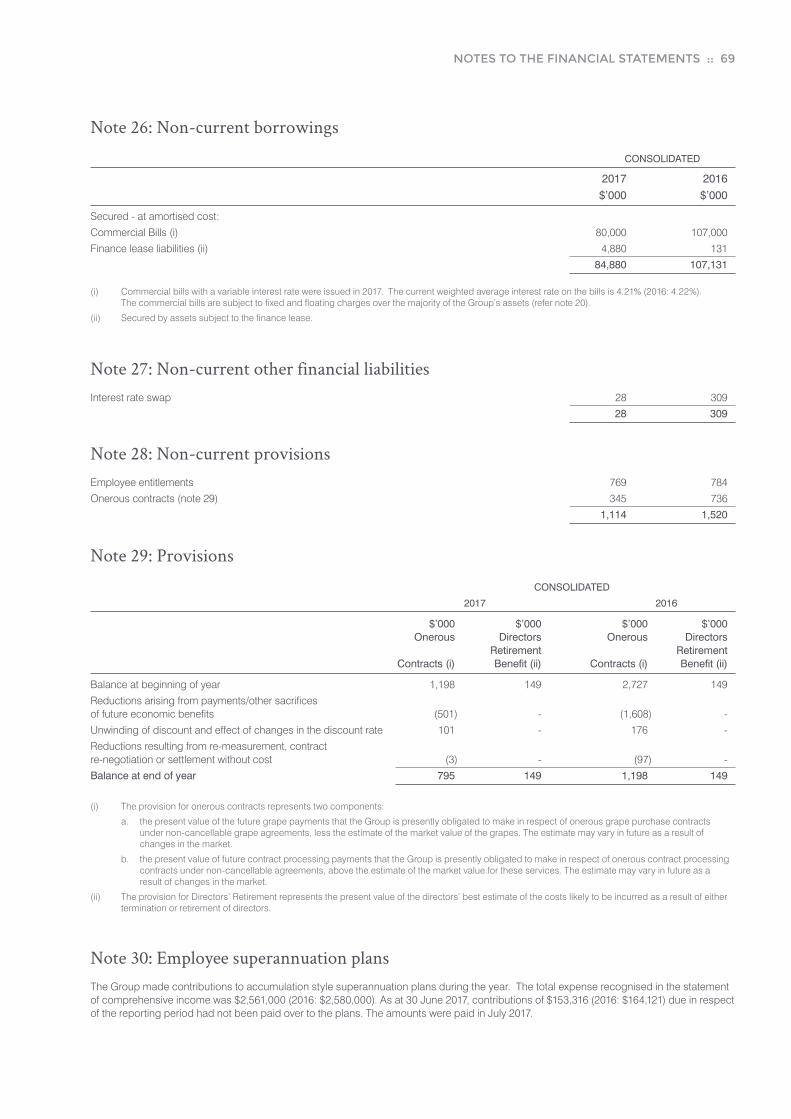
NOTES TO THE FINANCIAL STATEMENTS :: 69
Note 26: Non-current borrowings
CONSOLIDATED
2017 2016 $’000 $’000
Secured - at amortised cost:
Commercial Bills (i) 80,000 107,000
Finance lease liabilities (ii) 4,880 131
84,880 107,131
(i) Commercial bills with a variable interest rate were issued in 2017. The current weighted average interest rate on the bills is 4.21% (2016: 4.22%). The commercial bills are subject to fixed and floating charges over the majority of the Group’s assets (refer note 20).
(ii) Secured by assets subject to the finance lease.
Note 27: Non-current other financial liabilitiesInterest rate swap 28 309
28 309
Note 28: Non-current provisionsEmployee entitlements 769 784
Onerous contracts (note 29) 345 736
1,114 1,520
Note 29: Provisions
CONSOLIDATED
2017 2016
$’000 $’000 $’000 $’000 Onerous Directors Onerous Directors Retirement Retirement Contracts (i) Benefit (ii) Contracts (i) Benefit (ii)
Balance at beginning of year 1,198 149 2,727 149
Reductions arising from payments/other sacrifices of future economic benefits (501) - (1,608) -
Unwinding of discount and effect of changes in the discount rate 101 - 176 -
Reductions resulting from re-measurement, contract re-negotiation or settlement without cost (3) - (97) -
Balance at end of year 795 149 1,198 149
(i) The provision for onerous contracts represents two components:
a. the present value of the future grape payments that the Group is presently obligated to make in respect of onerous grape purchase contracts under non-cancellable grape agreements, less the estimate of the market value of the grapes. The estimate may vary in future as a result of changes in the market.
b. the present value of future contract processing payments that the Group is presently obligated to make in respect of onerous contract processing contracts under non-cancellable agreements, above the estimate of the market value for these services. The estimate may vary in future as a result of changes in the market.
(ii) The provision for Directors’ Retirement represents the present value of the directors’ best estimate of the costs likely to be incurred as a result of either termination or retirement of directors.
Note 30: Employee superannuation plansThe Group made contributions to accumulation style superannuation plans during the year. The total expense recognised in the statement of comprehensive income was $2,561,000 (2016: $2,580,000). As at 30 June 2017, contributions of $153,316 (2016: $164,121) due in respect of the reporting period had not been paid over to the plans. The amounts were paid in July 2017.
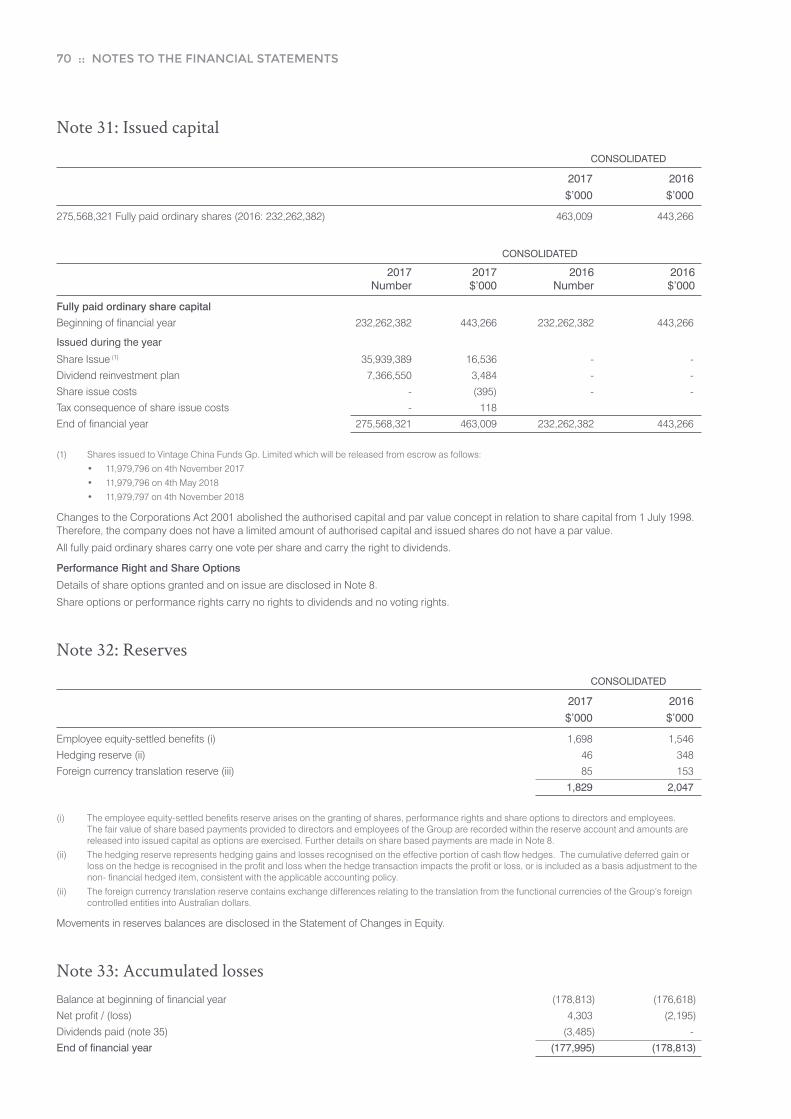
70 :: NOTES TO THE FINANCIAL STATEMENTS
Note 31: Issued capital
CONSOLIDATED
2017 2016 $’000 $’000
275,568,321 Fully paid ordinary shares (2016: 232,262,382) 463,009 443,266
CONSOLIDATED
2017 2017 2016 2016 Number $’000 Number $’000
Fully paid ordinary share capital
Beginning of financial year 232,262,382 443,266 232,262,382 443,266
Issued during the year
Share Issue (1) 35,939,389 16,536 - -
Dividend reinvestment plan 7,366,550 3,484 - -
Share issue costs - (395) - -
Tax consequence of share issue costs - 118
End of financial year 275,568,321 463,009 232,262,382 443,266
(1) Shares issued to Vintage China Funds Gp. Limited which will be released from escrow as follows:
• 11,979,796 on 4th November 2017
• 11,979,796 on 4th May 2018
• 11,979,797 on 4th November 2018
Changes to the Corporations Act 2001 abolished the authorised capital and par value concept in relation to share capital from 1 July 1998. Therefore, the company does not have a limited amount of authorised capital and issued shares do not have a par value.
All fully paid ordinary shares carry one vote per share and carry the right to dividends.
Performance Right and Share Options
Details of share options granted and on issue are disclosed in Note 8.
Share options or performance rights carry no rights to dividends and no voting rights.
Note 32: Reserves
CONSOLIDATED
2017 2016 $’000 $’000
Employee equity-settled benefits (i) 1,698 1,546
Hedging reserve (ii) 46 348
Foreign currency translation reserve (iii) 85 153
1,829 2,047
(i) The employee equity-settled benefits reserve arises on the granting of shares, performance rights and share options to directors and employees. The fair value of share based payments provided to directors and employees of the Group are recorded within the reserve account and amounts are released into issued capital as options are exercised. Further details on share based payments are made in Note 8.
(ii) The hedging reserve represents hedging gains and losses recognised on the effective portion of cash flow hedges. The cumulative deferred gain or loss on the hedge is recognised in the profit and loss when the hedge transaction impacts the profit or loss, or is included as a basis adjustment to the non- financial hedged item, consistent with the applicable accounting policy.
(ii) The foreign currency translation reserve contains exchange differences relating to the translation from the functional currencies of the Group’s foreign controlled entities into Australian dollars.
Movements in reserves balances are disclosed in the Statement of Changes in Equity.
Note 33: Accumulated lossesBalance at beginning of financial year (178,813) (176,618)
Net profit / (loss) 4,303 (2,195)
Dividends paid (note 35) (3,485) -
End of financial year (177,995) (178,813)
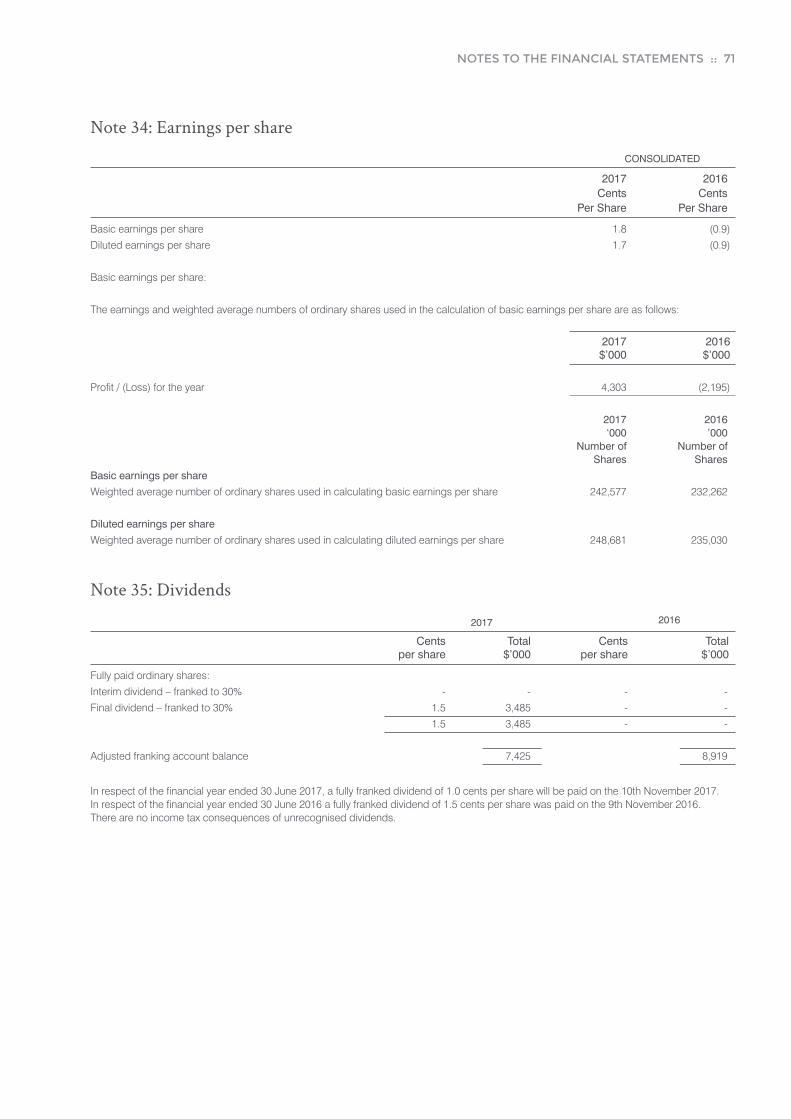
NOTES TO THE FINANCIAL STATEMENTS :: 71
Note 34: Earnings per share
CONSOLIDATED
2017 2016 Cents Cents Per Share Per Share
Basic earnings per share 1.8 (0.9)
Diluted earnings per share 1.7 (0.9)
Basic earnings per share:
The earnings and weighted average numbers of ordinary shares used in the calculation of basic earnings per share are as follows:
2017 2016 $’000 $’000
Profit / (Loss) for the year 4,303 (2,195)
2017 2016 ‘000 ’000 Number of Number of Shares Shares
Basic earnings per share
Weighted average number of ordinary shares used in calculating basic earnings per share 242,577 232,262
Diluted earnings per share
Weighted average number of ordinary shares used in calculating diluted earnings per share 248,681 235,030
Note 35: Dividends 2016 2017
Cents Total Cents Total per share $’000 per share $’000
Fully paid ordinary shares:
Interim dividend – franked to 30% - - - -
Final dividend – franked to 30% 1.5 3,485 - -
1.5 3,485 - -
Adjusted franking account balance 7,425 8,919
In respect of the financial year ended 30 June 2017, a fully franked dividend of 1.0 cents per share will be paid on the 10th November 2017. In respect of the financial year ended 30 June 2016 a fully franked dividend of 1.5 cents per share was paid on the 9th November 2016. There are no income tax consequences of unrecognised dividends.

72 :: NOTES TO THE FINANCIAL STATEMENTS
Note 36: Leases and other commitments
(a) Non-cancellable operating leases
The Group leases the following assets under normal economic terms. All operating lease contracts contain market review clauses in the event the Group exercises its option to renew.
- Vineyards (lease terms from 2 to 6 years)
- Plant and equipment (lease terms 1 – 7 years)
The following sets out payments recognised as an expense
CONSOLIDATED
2017 2016 $’000 $’000
Minimum lease payments 25,122 30,917
The following sets out the commitments to future lease payments relating to operating leases:
– not longer than 1 year 6,469 6,510
– longer than 1 year and not longer than 5 years 18,511 22,299
– longer than 5 years 142 2,108
25,122 30,917
(b) Finance leasesFinance leases relate to plant and equipment with a lease term of up to 7 years, expiring between 30 June 2017 and 30 June 2024.
Minimum Future Present Value of Minimum Lease payments Future Lease payments Consolidated Consolidated
2017 2016 2017 2016 $’000 $’000 $’000 $’000
No Later than 1 year 840 280 551 259
Later than 1 year and not later than 5 years 2,820 136 1,935 131
Later than 5 years 3,212 - 2,945 -
Minimum lease payments* 6,872 416 5,431 390
Less future finance changes (1,441) (26) - -
Present value of minimum lease payments 5,431 390 5,431 390
Current borrowings (note 24) 551 259
Non-Current borrowings (note 28) 4,880 131
5,431 390
* Minimum lease payments include the aggregate of all lease payments and any guaranteed residual.
The fair value of the finance lease liabilities is approximately equal to their carrying amount.
(c) Capital expenditure commitments
CONSOLIDATED
2017 2016 $’000 $’000
Property, Plant and Equipment
– not longer than 1 year 4,398 26
4,398 26
Note 37: Contingent liabilitiesBank guarantees 865 412
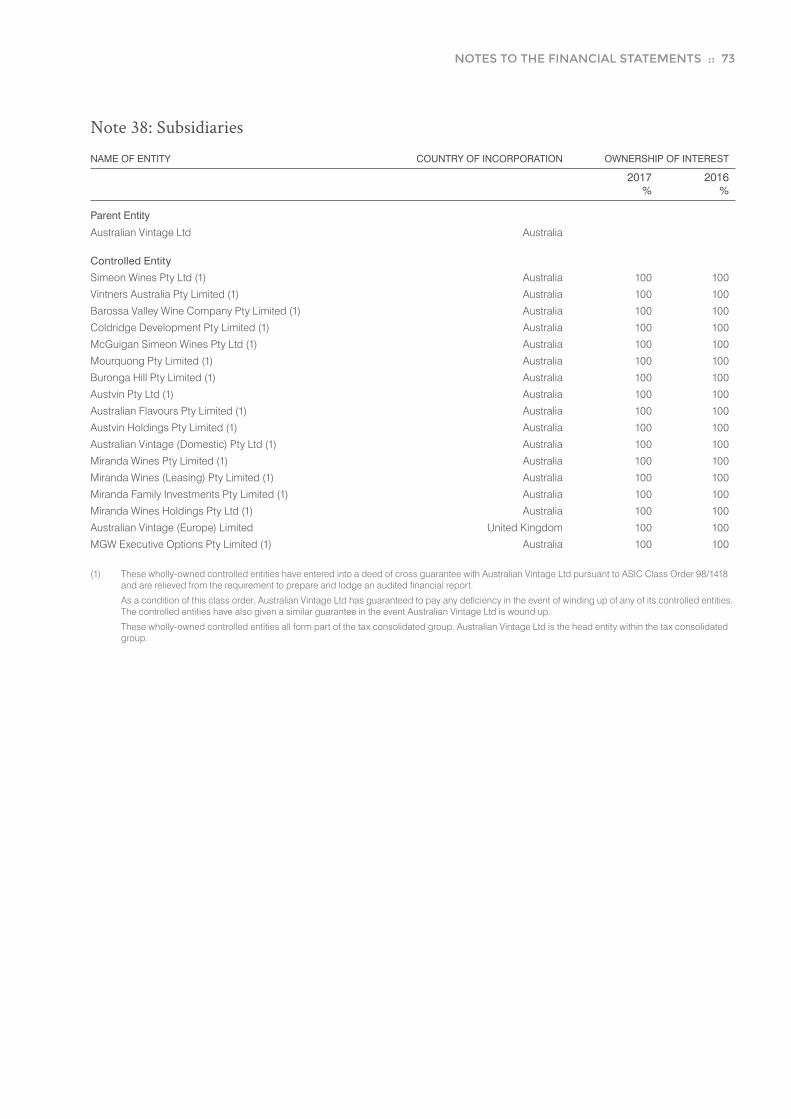
NOTES TO THE FINANCIAL STATEMENTS :: 73
Note 38: Subsidiaries
NAME OF ENTITY COUNTRY OF INCORPORATION OWNERSHIP OF INTEREST
2017 2016 % %
Parent Entity
Australian Vintage Ltd Australia
Controlled Entity
Simeon Wines Pty Ltd (1) Australia 100 100
Vintners Australia Pty Limited (1) Australia 100 100
Barossa Valley Wine Company Pty Limited (1) Australia 100 100
Coldridge Development Pty Limited (1) Australia 100 100
McGuigan Simeon Wines Pty Ltd (1) Australia 100 100
Mourquong Pty Limited (1) Australia 100 100
Buronga Hill Pty Limited (1) Australia 100 100
Austvin Pty Ltd (1) Australia 100 100
Australian Flavours Pty Limited (1) Australia 100 100
Austvin Holdings Pty Limited (1) Australia 100 100
Australian Vintage (Domestic) Pty Ltd (1) Australia 100 100
Miranda Wines Pty Limited (1) Australia 100 100
Miranda Wines (Leasing) Pty Limited (1) Australia 100 100
Miranda Family Investments Pty Limited (1) Australia 100 100
Miranda Wines Holdings Pty Ltd (1) Australia 100 100
Australian Vintage (Europe) Limited United Kingdom 100 100
MGW Executive Options Pty Limited (1) Australia 100 100
(1) These wholly-owned controlled entities have entered into a deed of cross guarantee with Australian Vintage Ltd pursuant to ASIC Class Order 98/1418 and are relieved from the requirement to prepare and lodge an audited financial report.
As a condition of this class order, Australian Vintage Ltd has guaranteed to pay any deficiency in the event of winding up of any of its controlled entities. The controlled entities have also given a similar guarantee in the event Australian Vintage Ltd is wound up.
These wholly-owned controlled entities all form part of the tax consolidated group. Australian Vintage Ltd is the head entity within the tax consolidated group.
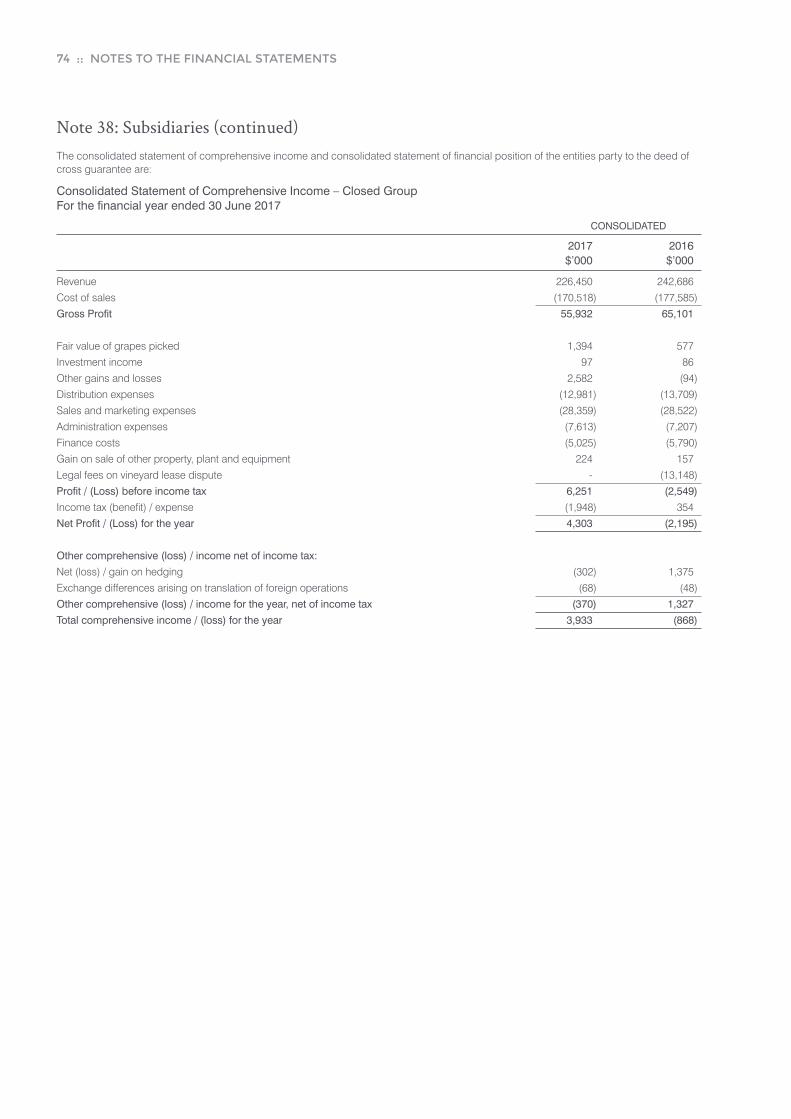
74 :: NOTES TO THE FINANCIAL STATEMENTS
Note 38: Subsidiaries (continued)The consolidated statement of comprehensive income and consolidated statement of financial position of the entities party to the deed of cross guarantee are:
Consolidated Statement of Comprehensive Income – Closed Group For the financial year ended 30 June 2017
CONSOLIDATED
2017 2016 $’000 $’000
Revenue 226,450 242,686
Cost of sales (170,518) (177,585)
Gross Profit 55,932 65,101
Fair value of grapes picked 1,394 577
Investment income 97 86
Other gains and losses 2,582 (94)
Distribution expenses (12,981) (13,709)
Sales and marketing expenses (28,359) (28,522)
Administration expenses (7,613) (7,207)
Finance costs (5,025) (5,790)
Gain on sale of other property, plant and equipment 224 157
Legal fees on vineyard lease dispute - (13,148)
Profit / (Loss) before income tax 6,251 (2,549)
Income tax (benefit) / expense (1,948) 354
Net Profit / (Loss) for the year 4,303 (2,195)
Other comprehensive (loss) / income net of income tax:
Net (loss) / gain on hedging (302) 1,375
Exchange differences arising on translation of foreign operations (68) (48)
Other comprehensive (loss) / income for the year, net of income tax (370) 1,327
Total comprehensive income / (loss) for the year 3,933 (868)

NOTES TO THE FINANCIAL STATEMENTS :: 75
Note 38: Subsidiaries (continued)
Consolidated Statement of Financial Position – Closed Group As at 30 June 2017
CONSOLIDATED
2017 2016 $’000 $’000
Current Assets
Cash and cash equivalents 2,602 5,994
Trade and other receivables 40,197 42,789
Inventories 141,553 139,055
Other financial assets 680 827
Other 2,239 1,578
Total Current Assets 187,271 190,243
Non-Current Assets
Inventories 53,046 52,444
Other financial assets 396 334
Property, plant and equipment 97,308 92,592
Goodwill 37,685 37,685
Other intangible assets 5,296 5,784
Water Licences 7,554 7,554
Deferred tax assets 36,945 38,644
Total Non-Current Assets 238,230 235,037
Total Assets 425,501 425,280
Current Liabilities
Trade and other payables 46,443 43,792
Borrowings 551 259
Other financial liabilities 194 248
Provisions 5,486 5,346
Other - 215
Total Current Liabilities 52,674 49,860
Non-Current Liabilities
Borrowings 84,880 107,131
Other financial liabilities 28 309
Provisions 1,114 1,520
Total Non-Current Liabilities 86,022 108,960
Total Liabilities 138,696 158,820
Net Assets 286,805 266,460
Equity
Issued capital 462,921 443,178
Reserves 1,851 2,067
Accumulated losses (177,967) (178,785)
Total Equity 286,805 266,460

76 :: NOTES TO THE FINANCIAL STATEMENTS
Note 39: Segment information
The Group’s reportable segments are as follows:
Australasia / North America Packaged
– supplies packaged wine within Australia, New Zealand, Asia and North America through retail and wholesale channels.
UK / Europe
– supplies packaged and bulk wine in the United Kingdom and Europe through retail and distributor channels.
Cellar Door
– supplies wine direct to the consumer through regional outlets.
Australasia / North America bulk wine and processing
– supplies bulk wine, grapes, concentrate and winery processing services throughout Australia, New Zealand, Asia and North America.
Vineyards
– provides vineyard management and maintenance services within Australia and includes fair value of grapes picked.
The revenue reported represents revenue generated from external customers.
The accounting policies of the reportable segments are the same as the Group’s accounting policies described in note 3. Segment revenue represents revenue generated from external customers. There were no inter-segment sales in the current year (2016 : Nil).
Segment profit represents the profit earned by each segment without allocation of interest revenue, finance costs and income tax expense. This is the measure reported to the chief operating decision maker for the purposes of resource allocation and assessment of segment performance.
The following is an analysis of the group’s revenue and results by reportable operating segment for the period:
Segments
Segments Revenue, Results and other segmental information
REVENUE REVENUE RESULTS RESULTS
2017 2016 2017 2016 $’000 $’000 $’000 $’000
Australasia / North America packaged 106,005 106,672 6,258 6,249
UK / Europe 88,454 102,506 208 3,500
Cellar door 7,834 8,185 1,456 1,568
Australasia / North America bulk wine and processing 20,358 22,222 (1,075) 447
Vineyards 3,799 3,101 4,414 4,610
Total 226,450 242,686 11,261 16,374
Finance costs – interest paid (5,025) (5,790)
Interest received 15 15
Vineyard lease exit - (13,148)
Profit / (Loss) before tax 6,251 (2,549)

NOTES TO THE FINANCIAL STATEMENTS :: 77
Note 39: Segment information (continued)
Geographical Segments
REVENUE FROM CUSTOMERS
2017 2016 $’000 $’000
Australia 105,781 112,967
UK / Europe 88,454 102,506
North America 13,342 10,882
Asia 14,371 12,056
Other 4,502 4,275
226,450 242,686
The group has sales to two major customers (2016: two) who individually account for greater than 10% of annual sales. The total sales for these customers were $63.4 million (2016: $66.9 million).
Note 40: Related party transactionsBalances and transactions between the Group and its subsidiaries, which are related parties of the Group are eliminated on consolidation and are not disclosed in this note. Details of transactions between the Group and other related parties are disclosed below.
Equity interests in related parties
Details of the percentage of ordinary shares held in controlled entities are disclosed in note 38 to the financial statements.
Key management personnel remuneration
Details of key management personnel compensation are disclosed in note 7 to the financial statements.
Other transactions with key management personnel
(i) During the year the Group entered into the following transactions with Woodnibs Pty Ltd and HVV Management Pty Ltd (entities associated with Neil McGuigan):
(a) The Group sold concentrate to the value of $1,565 (2016: $13,963) on normal commercial terms.
(b) The Group charged rent to the value of $8,711 (2016: $8,625) on normal commercial terms.
Parent entity
The ultimate parent company in the wholly-owned group is Australian Vintage Ltd.

78 :: NOTES TO THE FINANCIAL STATEMENTS
Note 41: Notes to the cash flow statement
(a) Reconciliation of cash
For the purposes of the cash flow statement, cash and cash equivalents includes cash on hand and in banks and investments in money market instruments, net of outstanding bank overdrafts. Cash and cash equivalents at the end of the financial year as shown in the cash flow statement is reconciled to the related items in the balance sheet as follows:
CONSOLIDATED
2017 2016 $’000 $’000
Cash 2,616 6,011
(b) Financing Facilities
Unsecured bank overdraft facility, reviewed annually and payable at call:
Amount Used - - Amount Unused 5,000 5,000
5,000 5,000
Reducing lease facility:
Amount Used 5,300 -
Amount Unused - -
5,300 -
Unsecured revolving lease facility:
Amount Used - 97
Amount Unused 350 253
350 350
Bank Guarantee / Surrender facility:
Amount Used 865 412
Amount Unused 1,785 2,238
2,650 2,650
Corporate purchasing card facility:
Amount Used 12 18
Amount Unused 488 482
500 500
Cash advance facility:
Amount Used 80,000 107,000
Amount Unused 30,000 9,000
110,000 116,000
Total facility 123,800 124,500
(c) Non-cash financing and investing activities
During the current year, the Group entered into the following non-cash investing and finance activities which are not reflected in the statement of cash flows:
• Australian Vintage Ltd operates a “Performance Rights and Options Plan”. This long term incentive plan provides the right to an issue of shares subject to continuous employment, and achievement of set growth rates in earnings per share and total shareholder return over a 4 year period. During the reporting period there were 4,000,000 options issued with a fair value of $0.095 per option (2016: 4,000,000 with fair value of $0.06 per option). During the period 1,737,002 options lapsed (2016: Nil).
• The Group issued 3,429,898 shares for $1,622,000 (2016 : Nil) under it’s Dividend Reinvestment Plan.

NOTES TO THE FINANCIAL STATEMENTS :: 79
Note 41: Notes to the cash flow statement (continued)
(d) Reconciliation of profit / (loss) for the period to net cash flows from operating activities
CONSOLIDATED
2017 2016 $’000 $’000
Profit / (Loss) from ordinary activities after income tax 4,303 (2,195)
Depreciation and amortisation of non-current assets 7,449 7,454
Profit on sale of non-current assets (224) (6)
Share based payments 152 49
Changes in net assets and liabilities, net of effects from acquisition and disposal of businesses
(Increase)/decrease in assets
Trade and other receivables 2,592 (3,031)
Inventories (3,100) 142
Other current assets (666) 3,245
Deferred tax assets 1,699 335
Increase / (decrease) in liabilities
Current trade and other payables 2,334 2,649
Provisions (266) (1,234)
Other (277) (280)
Net cash provided by operating activities 13,996 6,461
Note 42: Financial instruments
(a) Capital risk management
The Group manages its capital to ensure that entities in the Group will be able to continue as a going concern while maximising the return to stakeholders through the optimisation of the debt and equity balance. The group’s general strategy remains unchanged from 2016.
The capital structure of the Group consists of debt, which includes the borrowings disclosed in notes 22 and 26, cash and cash equivalents and equity attributable to equity holders of the parent, comprising issued capital, reserves and accumulated losses as disclosed in notes 31, 32 and 33 respectively. The Group operates primarily through distributor relationships established in the markets in which the Group trades. None of the Group’s entities are subject to externally imposed capital requirements.
Operating cash flows are used to maintain and expand the group’s assets, as well as to make the routine outflows of tax, dividends and repayment of maturing debt. The Group’s policy is to borrow centrally to meet anticipated future funding requirements.
Gearing ratio
The Board reviews the capital structure on an annual basis. As a part of this review the Board considers the cost of capital and the risks associated with each class of capital. The Group has a target gearing ratio of 40% in line with the industry norm, which is determined as the proportion of net debt to equity.
The gearing ratio at year end was as follows:
Financial assets
Debt (i) 85,431 107,390
Cash and cash equivalents (2,616) (6,011)
Net Debt 82,815 101,379
Equity (ii) 286,843 266,500
Net debt to equity ratio 28.9% 38.0%
(i) Debt is defined as long- and short-term borrowings, as detailed in notes 22 and 26.
The Group is also subject to bank covenants with its primary financier as follows:
- Leverage (Net Debt / EBITDA) must be below pre-defined levels.
- Interest coverage (EBITDA / Interest) must be above pre-defined levels.
- Gearing (Gross debt / Gross debt plus Equity) must be below pre-defined levels.
- The Group is able to declare a dividend provided certain ratios are met or the dividend is approved by the National Australia Bank or the dividend is underwritten
(ii) Equity includes all capital and reserves.

80 :: NOTES TO THE FINANCIAL STATEMENTS
Note 42: Financial instruments (continued)
(a) Capital risk management (continued)
Significant accounting policies
Details of the significant accounting policies and methods adopted (including the criteria for recognition, the bases of measurement, and the bases for recognition of income and expenses) for each class of financial asset, financial liability and equity instrument are disclosed in note 3.
(b) Categories of financial instruments CONSOLIDATED
2017 2016 $’000 $’000
Financial assets
Available for sale 178 59
Receivables 40,197 42,789
Cash and cash equivalents 2,616 6,011
Derivative instruments in designated hedge accounting relationships 680 1,053
Financial liabilities
Derivative instruments in designated hedge accounting relationships 222 557
Carried at amortised cost 131,899 151,203
At the reporting date there are no significant concentrations of credit risk relating to loans and receivables at fair value through profit or loss.
The carrying amount reflected above represents the Groups maximum exposure to credit risk for such loans and receivables.
(c) Financial risk management objectives
The Group’s Corporate Treasury function provides services to the business, co-ordinates access to domestic and international financial markets, monitors and manages the financial risks relating to the operations of the Group through internal risk reports which analyses exposures by degree and magnitude of risks. These risks include market risk (including currency risk, fair value interest rate risk and price risk), credit risk, liquidity risk and cash flow interest rate risk.
The Group seeks to minimise the effects of these risks, by using derivative financial instruments to hedge these risk exposures. The use of financial derivatives is governed by the Group’s policies approved by the board of directors, which provide principles on foreign exchange risk, interest rate risk, credit risk, the use of financial derivatives and non-derivative financial instruments, and the investment of excess liquidity. Compliance with policies and exposure limits is reviewed on a continuous basis. The Group does not enter into or trade financial instruments, including derivative financial instruments, for speculative purposes.
(d) Market risk
The Group’s activities expose it primarily to the financial risks of changes in foreign currency exchange rates (refer note 42(e)) and interest rates (refer note 42 (f)). The Group enters into a variety of derivative financial instruments to manage its exposure to interest rate and foreign currency risk, including:
• forward exchange contracts and foreign currency options to hedge the exchange rate risk arising on the export of wine to the United States, Europe and United Kingdom; and
• interest rate swaps to mitigate the risk of rising interest rates.
There has been no change to the Group’s exposure to market risks or the manner in which it manages and measures the risk from the previous period.
(e) Foreign currency risk management
The Group undertakes certain transactions denominated in foreign currencies, hence exposures to exchange rate fluctuations arise. Exchange rate exposures are managed within approved policy parameters utilising forward exchange contracts and foreign exchange options.
The carrying amount of the Group’s foreign currency denominated monetary assets and monetary liabilities at the reporting date are as follows:
LIABILITIES ASSETS
2017 2016 2017 2016 $’000 $’000 $’000 $’000
US dollars 615 - 369 432
GB pounds 6,089 7,274 10,674 17,474
Euro - - 593 1,352
Canadian Dollars - - 1,468 1,297
New Zealand Dollars 89 - - -

NOTES TO THE FINANCIAL STATEMENTS :: 81
Note 42: Financial instruments (continued)
(e) Foreign currency risk management (continued)
Foreign currency sensitivity analysis
The Group is exposed to US dollars, GB pounds, Euros and Canadian Dollars.
The following table details the Group’s sensitivity to a 10% increase and decrease in the Australian Dollar against the relevant foreign currencies. 10% is the sensitivity rate used when reporting foreign currency risk internally to key management and represents management’s assessment of the reasonably possible change in foreign exchange rates. The sensitivity analysis includes only outstanding foreign currency denominated monetary items and adjusts their translation at the period end for a 10% change in foreign currency rates. A positive number indicates an increase in profit or loss and other equity where the Australian Dollar weakens 10% against the relevant currency. For a 10% strengthening of the Australian dollar against the currency, there would be a comparable impact on the profit or equity and the balances below would be negative.
For a weakening or strengthening of the Australian Dollar against the respective currency, the impact on the net profit after tax would be as follows:
CONSOLIDATED
2017 2016 $’000 $’000
Increase (Deterioration) in foreign exchange rate by 10%
Profit or loss – GBP Impact (300) (588)
Profit or loss – USD Impact 5 (14)
Profit or loss – EURO Impact (38) (84)
Profit or loss – CAD Impact (95) (83)
Profit or loss – NZD impact 6 -
Decrease (Improvement) in foreign exchange rate by 10%
Profit or loss – GBP Impact 340 718
Profit or loss – USD Impact (30) 17
Profit or loss – EURO Impact 47 103
Profit or loss – CAD Impact 116 101
Profit or loss – NZD impact (7) -
It is the policy of the Group to enter into foreign exchange contracts to cover specific foreign currency exposure. The Group also enters into forward and option foreign exchange contracts to manage the risk associated with anticipated sales and purchase transactions out 12 months which is based on 50-75% (50% covered at 30th June 2017) coverage of highly probable sales and 25-50% (25% covered at 30th June 2017) of coverage on foreign currency sales out 13-24 months. Foreign currency expenses are estimated and the net exposure is hedged. Basis adjustments are made to the carrying amounts of non-financial hedged items when the anticipated sale or purchase transaction takes place.
The Group has entered into contracts to supply wine to customers in the UK, Europe and Canada. The Group has entered into forward foreign exchange contracts to hedge the exchange rate risk arising from these anticipated future transactions, which are designated as cash flow hedges.
The following table details the forward foreign currency contracts and foreign exchange option contracts as at 30 June 2017:
CURRENCY EXCHANGE RATE FOREIGN CURRENCY FC CONTRACT VALUE AUD FAIR VALUE AUD ‘000 $’000 $’000
Forward Contracts:
Sell Euros 0.6898 275 399 (11)
Sell Euros 0.67107 250 373 (1)
Sell Euros 0.6656 500 751 (1)
Sell Euros 0.6538 950 1,453 17
Sell Euros 0.6623 750 1,132 (13)
Sell Euros 0.6415 960 1,496 17
Sell Euros 0.6524 500 766 (1)
Sell Euros 0.6941 250 360 (19)
Option Contracts:
Sell Euros 0.6700-0.5940 700 1,044 19
Forward Contracts:
Sell GBP 0.5957 1,000 1,679 20
Buy GBP 0.58106 (1,500) (2,581) 32
Sell GBP 0.58085 1,000 1,722 29
Sell GBP 0.58148 1,000 1,720 27

82 :: NOTES TO THE FINANCIAL STATEMENTS
Note 42: Financial instruments (continued)
(e) Foreign currency risk management (continued)
CURRENCY EXCHANGE RATE FOREIGN CURRENCY FC CONTRACT VALUE AUD FAIR VALUE AUD ‘000 $’000 $’000
Option Contracts:
Sell GB Pounds 0.5100-0.4722 177 346 48
Sell GB Pounds 0.5100-0.4690 177 346 48
Sell GB Pounds 0.5200-0.4865 2,000 3,846 454
Forward Contracts:
Sell Canadian Dollars 0.95554 500 523 24
Sell Canadian Dollars 0.99143 350 353 1
Sell Canadian Dollars 0.99969 300 300 (2)
Sell Canadian Dollars 1.0013 700 699 (7)
Sell Canadian Dollars 1.0014 250 250 (3)
Sell Canadian Dollars 0.99305 350 352 (2)
Sell Canadian Dollars 0.992 350 353 (2)
Sell Canadian Dollars 0.965 500 518 6
Forward Contracts:
Sell Hong Kong Dollars 5.9764 18 3 -
The following table details the forward foreign currency contracts and foreign exchange option contracts as at 30 June 2016:
Forward Contracts:
Sell Euros 0.6734 250 371 (3)
Sell Euros 0.6608 500 756 5
Option Contracts:
Sell Euros 0.7000-0.6535 1000 1,530 (25)
Sell Euros 0.6600-0.587 250 426 9
Sell Euros 0.6700-0.594 700 1,178 7
Option Contracts:
Sell GB Pounds 0.5100-0.4722 2,295 4,859 348
Sell GB Pounds 0.5100-0.4690 2,295 4,892 350
Sell GB Pounds 0.5100-0.4930 1,000 2,028 152
Sell GB Pounds 0.5600-0.5075 1,000 1,970 30
Sell GB Pounds 0.5600-0.4975 1,000 2,010 33
Sell GB Pounds 0.5200-0.4865 2,000 4,111 219
Forward Contracts:
Sell Canadian Dollars 0.95554 500 523 (2)
Option Contracts:
Sell Canadian Dollars 1.0300-0.9806 2,200 2,243 (70)
Forward Contracts:
Sell Hong Kong Dollars 5.735 18 3 -
Forward Contracts:
Sell Swedish Krona 6.300 171 27 -

NOTES TO THE FINANCIAL STATEMENTS :: 83
Note 42: Financial instruments (continued)
(e) Foreign currency risk management (continued)
As at reporting date the aggregate amount of unrealised profits/(losses) under foreign exchange contracts deferred in the hedging reserve relating to the exposure on anticipated future transactions is $288 thousand profit before tax (2016: a loss of $1,053 thousand before tax). It is anticipated that the sales will take place in the periods prescribed in the table below at which stage the amount deferred in equity will be released into the profit or loss.
OUTSTANDING YEAR END FOREIGN CURRENCY NOTIONAL VALUE FAIR VALUE CONTRACTS EXCHANGE RATE FC ‘000 $’000 $’000
30/06/17 30/06/16 30/06/17 30/06/16 30/06/17 30/06/16 30/06/17 30/06/16
Forward contracts:Cash flow hedgesSell EuroLess than 3 months 0.6728 0.6711 275 750 399 1,128 (11) 33 to 6 months 250 - 373 - (1) -6 to 9 months 1,100 - 1,669 - 11 -9 to 12 months 600 - 896 - (13) ->12 months 2,210 - 3,395 4 -
Sell GB PoundsLess than 3 months 0.5903 0.5586 3,000 - 5,162 - 87 -
Buy GBPLess than 3 months 0.5903 0.5586 1,500 - 2,513 - 20 -
Sell CADMore than 3 months 0.9974 0.9653 - 500 - 523 - (2) Option Contracts:Cash flow hedgesSell GB PoundsLess than 3 months 0.5903 0.5586 1,353 1,059 2,615 2,250 327 1613 to 6 months 1,000 3,059 1,923 6,249 223 3436 to 9 months - 1,059 - 2,250 - 1629 to 12 months - 2,059 - 4,260 - 193More than 12 months - 2,353 - 4,861 - 272
Sell EUROLess than 3 months 0.6728 0.6711 - - - - - -3 to 6 months 700 500 1,045 765 18 (10)6 to 9 months - 500 - 765 - (14)9 to 12 months - 250 - 726 - 9More than 12 months - 700 - 1,178 - 7
Sell CADLess than 3 months 0.9974 0.9653 500 600 523 612 21 (14)3 to 6 months 650 600 653 612 (2) (19)6 to 9 months 600 600 609 612 3 (22)9 to 12 months 250 600 250 612 (3) (16)More than 12 month 1,300 - 1,314 - (4) -
(f) Interest rate risk management
The Group is exposed to interest rate risk as entities in the Group borrow funds at floating interest rates. The risk is managed by the Group by the use of interest rate swap contracts. Hedging activities are evaluated regularly to align with interest rate views and defined risk appetite; ensuring optimal hedging strategies are applied, by either positioning the balance sheet or protecting interest expense through different interest rate cycles.
It is the policy of the group to designate the Interest Rate Swap as a hedge against the variability in the cash flow arising from future changes in the interest rate.
The Group policy requires fixed interest cover on up to 70% of all outstanding average net debt usage.

84 :: NOTES TO THE FINANCIAL STATEMENTS
Note 42: Financial instruments (continued)
(f) Interest rate risk management (continued)
Interest rate sensitivity analysis
The sensitivity analysis below has been determined based on the exposure to interest rates for both derivative and non-derivative instruments at the reporting date and the stipulated change taking place at the beginning of the financial year and held constant throughout the reporting period. A 50 basis point increase or decrease represents management’s assessment of the possible change in interest rates.
At reporting date, if interest rates had been 50 basis points higher or lower and all other variables were held constant, the Group’s:
• net profit after tax would increase and decrease by $108,000 (2016: increase/decrease by $159,000). This is mainly attributable to the Group’s exposure to interest rates on its variable rate borrowing which are not covered by the interest rate swap agreements.
Interest rate swap contracts
Under interest rate swap contracts, the Group agrees to exchange the difference between fixed and floating rate interest amounts calculated on agreed notional principal amounts. Such contracts enable the Group to mitigate the risk of changing interest rates on the cash flow exposures on the issued variable rate debt held. The fair value of interest rate swaps at the reporting date is determined by discounting the future cash flows at reporting date. The average interest rate is based on the outstanding balances at the end of the financial year.
At balance date, the Group has three (2016: three) interest rate swap agreements with a notional amount of $70 million (2016: $70 million), as follows:
PAY RECEIVE ROLLOVER EXPIRY DATE CURRENCY AMOUNT RATE FREQUENCY RATE
4-Sep-17 AUD $25,000,000 2.25% Monthly AUD-BBR-BBSY
17-Jul-18 AUD $20,000,000 1.89% Monthly AUD-BBR-BBSY
26-Jul-18 AUD $25,000,000 2.29% Monthly AUD-BBR-BBSY
$70,000,000
The swaps in place cover 85% (2016: 69%) of the total net debt as at 30 June 2017. It is anticipated that the coverage will be below 70% when the swap expires in September 2017.
The following table details the notional principal amounts and remaining terms of interest rate swap contracts outstanding as at reporting date:
Cash flow hedges AVERAGE CONTRACTED NOTIONAL FAIR VALUE FIXED INTEREST RATE PRINCIPAL AMOUNT
Outstanding floating 2017 2016 2017 2016 2017 2016 for fixed contracts % % $’000 $’000 $’000 $’000
Less than 1 year 2.25 2.13 25,000 20,000 (36) (44) 1 – 2 years 2.11 2.25 45,000 25,000 (186) (177) 2 – 5 years - 2.29 - 25,000 - (336)
The interest rate swaps settle on a monthly or quarterly basis. The Group will settle the difference between the fixed and floating interest rate on a net basis.
All interest rate swap contracts exchanging floating rate interest amounts for fixed rate interest amounts are designated as cash flow hedges in order to reduce the Group’s cash flow exposure resulting from variable interest rates on borrowings. The interest rate swaps and the interest payments on the loan occur and the amount deferred in equity is recognised in profit or loss over the period that the floating interest payments on debt impact profit or loss.
(g) Credit risk management
Credit risk refers to the risk that a counterparty will default on its contractual obligations resulting in financial loss to the Group.
The Group has adopted a policy of only dealing with creditworthy counterparties as a means of mitigating the risk of financial loss from defaults.
The Group undertake credit worthiness reviews on all customers and where appropriate obtains debtor insurance for all significant customers. Credit exposure is controlled by counterparty limits that are reviewed and approved.
Trade receivables consist of a large number of customers, spread across several geographical areas. Ongoing credit evaluation is performed on the financial condition of accounts receivable and, where appropriate, credit guarantee insurance cover is purchased.
Details of the Groups exposure to significant counterparties at the end of the reporting period are disclosed in note 10.
The credit risk on liquid funds and derivative financial instruments is limited because the counterparties are banks with high credit-ratings assigned by international credit-rating agencies.
The carrying amount of financial assets recorded in the financial statements, net of any allowances for losses, represents the Group’s maximum exposure to credit risk without taking account of the value of any collateral obtained.
The Group does not hold any collateral or other credit enhancements to cover this credit risk.

NOTES TO THE FINANCIAL STATEMENTS :: 85
Note 42: Financial instruments (continued)(h) Liquidity risk management
Ultimate responsibility for liquidity risk management rests with the board of directors who have built an appropriate liquidity risk management framework for the management of the Group’s short, medium and long-term funding and liquidity management requirements.
The Group manages liquidity risk by maintaining adequate reserves, banking facilities and reserve borrowing facilities by continuously monitoring forecast and actual cash flows and matching the maturity profiles of financial assets and liabilities. Included in note 42 (b) is a listing of additional undrawn facilities that the Group has at its disposal to further reduce liquidity risk.
The following table details the Group’s remaining contractual maturity for its non-derivative financial assets and liabilities. The contractual maturity is based on the earliest date on which the Group may be required to pay. The amounts below are based on undiscounted cash flows and include principal and interest:
CONSOLIDATED WEIGHTED LESS THAN 3 MONTHS AVERAGE 1 MONTH 1-3 MONTHS TO 1 YEAR 1-5 YEARS 5+ YEARS INTEREST RATE $’000 $’000 $’000 $’000 $’000
2017 Non-interest bearing assets - 9,786 20,130 10,286 - -Non-interest bearing liabilities - 19,367 27,150 145 28 -Finance Lease liability 5.65 74 149 618 3,524 2,507Floating interest rate liabilities 3.85 40 80 241 10,120 -Fixed interest rate liabilities 4.26 248 406 1,421 70,217 -Fixed interest rate assets - - - - - -Financial Guarantees - - 865 - - -
2016 Non-interest bearing assets - 10,452 21,408 10,952 - -Non-interest bearing liabilities - 17,514 26,361 186 309 -Finance Lease liability 8.84 24 47 210 136 -Floating interest rate liabilities 4.01 155 309 927 37,464 -Fixed interest rate liabilities 4.33 253 505 1,886 71,462 -Fixed interest rate assets - - - - - -Financial Guarantees - - 412 - - -
The amounts included above for financial guarantee contract are the maximum amounts the Group could be forced to settle under the arrangement for the full guaranteed amount if that amount is claimed by the counterparty to the guarantee. Based on expectations at the end of the reporting period, the Group considers that it is more likely than not that such an amount will not be payable under the arrangement. However, the estimate is subject to change depending on the probability if the counterparty claiming under the guarantee which is a function of the likelihood that the financial receivables held by the counterparty which are guaranteed suffer credit losses.
The variable interest rate instruments for both non-derivative financial assets and liabilities is subject to change if changes in variable interest rates differ to those estimates of interest rates determined at the end of the reporting period.
The Group has access to financing facilities of which $37.6 million were unused at the end of the reporting period (2016: $17.0 million). The Group expects to meet its other obligations from operating cash flows and proceeds of maturing financial assets.
The following table details the Group’s liquidity analysis for its derivative financial instruments. The table has been drawn up based on the undiscounted net cash inflows /(outflows) on the derivative instrument that settle on a net basis and the undiscounted gross inflows/(outflows) on those derivatives that require gross settlement. When the amount payable or receivable is not fixed, the amount disclosed has been determined by reference to the projected interest rates as illustrated by the yield curves existing at the reporting date.
LESS THAN 3 MONTHS 1 MONTH 1-3 MONTHS TO 1 YEAR 1-5 YEARS 5+ YEARS $’000 $’000 $’000 $’000 $’000
2017 Net settled: Interest rate swaps - (36) (158) (28) - Net settled: Forward exchange contracts 76 45 (10) - - Foreign currency options 96 454 19 - - 172 463 (149) (28) -2016 Net settled: Interest rate swaps - - (248) (309) -Net settled: Forward exchange contracts - - 1 - - Foreign currency options 52 257 517 226 - 52 257 270 (83) -
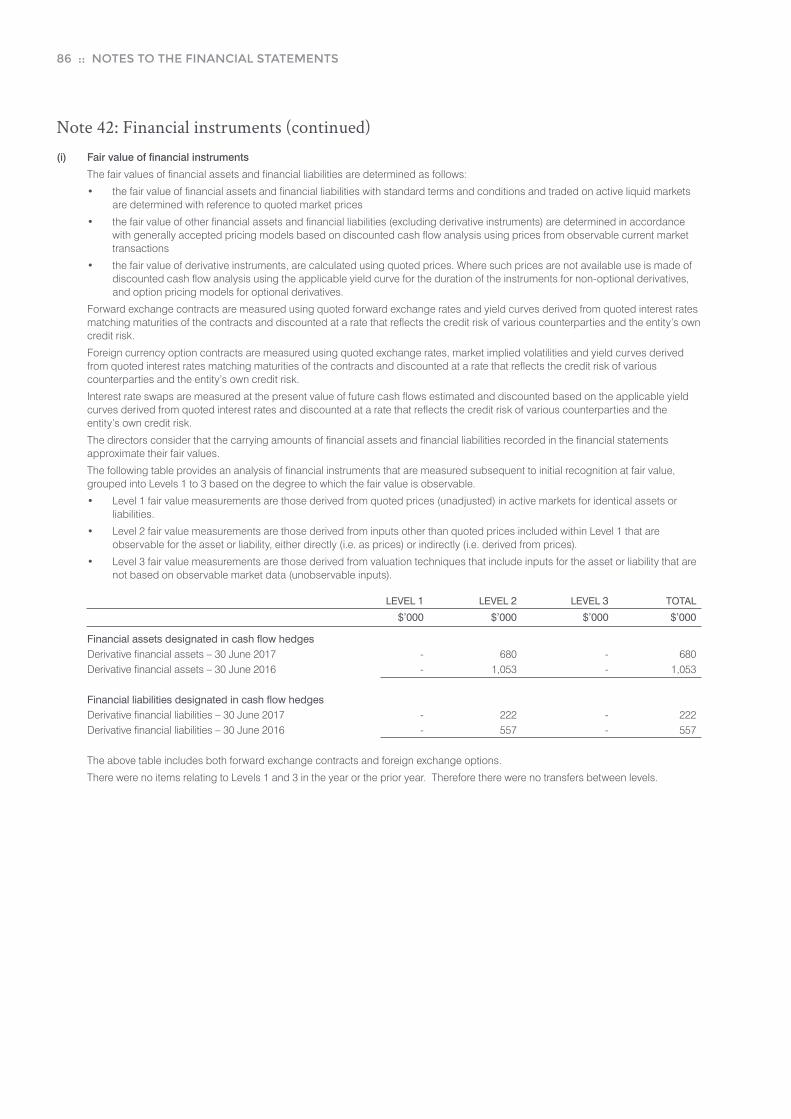
86 :: NOTES TO THE FINANCIAL STATEMENTS
Note 42: Financial instruments (continued)(i) Fair value of financial instruments
The fair values of financial assets and financial liabilities are determined as follows:
• the fair value of financial assets and financial liabilities with standard terms and conditions and traded on active liquid markets are determined with reference to quoted market prices
• the fair value of other financial assets and financial liabilities (excluding derivative instruments) are determined in accordance with generally accepted pricing models based on discounted cash flow analysis using prices from observable current market transactions
• the fair value of derivative instruments, are calculated using quoted prices. Where such prices are not available use is made of discounted cash flow analysis using the applicable yield curve for the duration of the instruments for non-optional derivatives, and option pricing models for optional derivatives.
Forward exchange contracts are measured using quoted forward exchange rates and yield curves derived from quoted interest rates matching maturities of the contracts and discounted at a rate that reflects the credit risk of various counterparties and the entity’s own credit risk.
Foreign currency option contracts are measured using quoted exchange rates, market implied volatilities and yield curves derived from quoted interest rates matching maturities of the contracts and discounted at a rate that reflects the credit risk of various counterparties and the entity’s own credit risk.
Interest rate swaps are measured at the present value of future cash flows estimated and discounted based on the applicable yield curves derived from quoted interest rates and discounted at a rate that reflects the credit risk of various counterparties and the entity’s own credit risk.
The directors consider that the carrying amounts of financial assets and financial liabilities recorded in the financial statements approximate their fair values.
The following table provides an analysis of financial instruments that are measured subsequent to initial recognition at fair value, grouped into Levels 1 to 3 based on the degree to which the fair value is observable.
• Level 1 fair value measurements are those derived from quoted prices (unadjusted) in active markets for identical assets or liabilities.
• Level 2 fair value measurements are those derived from inputs other than quoted prices included within Level 1 that are observable for the asset or liability, either directly (i.e. as prices) or indirectly (i.e. derived from prices).
• Level 3 fair value measurements are those derived from valuation techniques that include inputs for the asset or liability that are not based on observable market data (unobservable inputs).
LEVEL 1 LEVEL 2 LEVEL 3 TOTAL
$’000 $’000 $’000 $’000
Financial assets designated in cash flow hedges Derivative financial assets – 30 June 2017 - 680 - 680 Derivative financial assets – 30 June 2016 - 1,053 - 1,053
Financial liabilities designated in cash flow hedges Derivative financial liabilities – 30 June 2017 - 222 - 222 Derivative financial liabilities – 30 June 2016 - 557 - 557
The above table includes both forward exchange contracts and foreign exchange options.
There were no items relating to Levels 1 and 3 in the year or the prior year. Therefore there were no transfers between levels.

NOTES TO THE FINANCIAL STATEMENTS :: 87
Note 42: Financial instruments (continued)(i) Fair value of financial instruments (continued)
Fair value of the Group’s financial assets and financial liabilities that are measured at fair value on a recurring basis
Some of the Group’s financial assets and financial liabilities are measured at fair value at the end of each reporting period. The following table gives information about how the fair values of these financial assets and financial liabilities are determined (in particular, the valuation technique(s) and inputs used).
FINANCIAL ASSETS/ FINANCIAL LIABILITIES
FAIR VALUE
AS AT 30/6/17 $ 000
FAIR VALUE
AS AT 30/6/16 $ 000
FAIR
VALUE HIERARCHY
VALUATION
TECHNIQUE(S) AND KEY INPUT(S)
SIGNIFICANT
UNOBSERVABLE INPUT(S)
RELATIONSHIP OF UNOBSERVABLE
INPUTS TO FAIR VALUE
A) Forward exchange contracts
Assets $111 Assets $1 Level 2 (1) N/A N/A
B) Foreign currency options
Assets $569 Assets $1,052 Level 2 (1) N/A N/A
C) Interest rate Swaps
Liabilities $222 Liabilities $557 Level 2 (2) N/A N/A
(1) Discounted cash flow. Future cash flows are estimated based on forward exchange rates (from observable forward exchange rates at the end of the reporting period) and contract forward rates, discounted at a rate that reflects the credit risk of various counterparties.
(2) Discounted cash flow. Future cash flows are estimated based on forward interest rates (from observable yield curves at the end of the reporting period) and contract interest rates, discounted at a rate that reflects the credit risk of various counterparties.
There were no items relating to Levels 1 and 3 in the period or the prior period.
Fair value of financial assets and financial liabilities that are not measured at fair value on a recurring basis (but fair value disclosures are required)
The directors consider that the carrying amounts of financial assets and financial liabilities recognised in the consolidated financial statements approximate their fair values.
Note 43: Events after the reporting periodIn respect of the financial year ended 30 June 2017, a fully franked dividend of 1.0 cents per share was declared on the 30th August 2017 and will be paid on the 10th November 2017.
There have been no other matters or circumstances, other than that referred to in the financial statements or notes thereto, that have arisen since the end of the financial year, that have significantly affected, or may significantly affect, the operations of the Group, the results of those operations, or the state of affairs of the Group in future financial years.

88 :: NOTES TO THE FINANCIAL STATEMENTS
Note 44: Parent Entity Disclosures
44.1 Financial Position 2017 2016 $’000 $’000
Assets
Current assets 185,611 189,636
Non-current assets 257,457 260,001
Total assets 443,068 449,637
Liabilities
Current liabilities 47,653 43,075
Non-current liabilities 154,813 180,369
Total liabilities 202,466 223,444
Net Assets 240,602 226,193
Equity
Issued Capital 463,009 443,266
Accumulated Losses (224,074) (218,890)
Reserves
Equity settled employee benefits 1,698 1,546
Hedging 46 348
Foreign currency translation (77) (77)
Total reserves 1,667 1,817
Total equity 240,602 226,193
44.2 Financial Performance Year ended Year ended 30 June 2017 30 June 2016 $’000 $’000
Profit / (Loss) for the year (2,324) (1,387)
Other comprehensive income/(Loss) (302) 1,376
Total comprehensive income (2,626) (11)
44.3 Guarantees entered into by parent entity 2017 2016 $’000 $’000
Guarantee provided under the deed of cross guarantee (i) 5,022 5,754
(i) The parent entity has entered into a deed of cross guarantee with subsidiaries as indicated in note 38.
44.4 Contingent Liabilities of the parent entity Bank Guarantees 865 412
44.5 Capital Commitments of the parent entity
Plant and Equipment
Not longer than 1 year 4,398 26

Head Office
275 Sir Donald Bradman Drive
Cowandilla SA 5033
T +61 8 8172 8333
F +61 8 8172 8399
Sydney Office
2 Queens Place
Balmain NSW 2041
T +61 2 8345 6377
F +61 2 8345 6366
Registered Office
275 Sir Donald Bradman Drive
Cowandilla SA 5033
T +61 8 8172 8333
F +61 8 8172 8399
Company Secretary
Michael Noack
Chief Financial Officer
Michael Noack
Auditor
Deloitte Touche Tohmatsu
11 Waymouth Street
Adelaide SA 5000
Bankers
National Australia Bank
500 Bourke Street
Melbourne Vic 3000
Share Register
Computershare Investor Services
115 Grenfell Street
Adelaide SA 5000
T +61 8 8236 2300
F +61 8 8236 2305
www.australianvintage.com.au
ACN 052 179 932
McGuigan Hunter Valley Cellar Door & Administration
Cnr Broke & McDonalds Roads
Pokolbin NSW 2320
T +61 2 4998 4199
F +61 2 4998 4188
Tempus Two Cellar Door
Cnr Broke & McDonalds Roads
Pokolbin NSW 2320
T +61 2 4993 3999
F +61 2 4993 3988
Nepenthe Cellar Door
93 Jones Road
Balhannah SA 5242
T +61 8 8398 8899
F +61 8 8398 8895
Buronga Hill Winery
557A Silver City Highway
Buronga NSW 2739
T +61 3 5022 5100
F +61 3 5022 5135
Merbein Packaging
2 Wentworth Road
Merbein Vic 3505
T +61 3 5021 9303
F +61 3 5021 6490
As a company so reliant on our environment and natural resources, we at Australian Vintage Limited are proud to produce our 2017 Annual Report on Carbon Neutral and 100% recycled paper.
EcoStar is an environmentally responsible paper made carbon neutral (CN) and the fibre source has been independently certified by the Forest Stewardship Council (FSC). ecoStar is manufactured from 100%
post consumer recycled paper in a process chlorine free environment under the ISO 14001 environmental management system which guarantees continuous improvement. Carbon Neutral: the carbon emissions of the
manufacturing process for ecoStar include: Incoming deliveries – raw materials and wrapping; Premises – energy consumption on site, waste treatment and disposal; Energy of materials – raw materials; Outgoing deliveries –
transportation of the finished product to Raleigh Paper warehouses have been measured and offset.
International Winemaker of the Year for a world record 4th time

ACN 052 179 932
2017 ANNUAL REPORT