2017 - chicago chicago energy benchmarking report ... 123 sample street ... using energy star...
TRANSCRIPT
CH ICAGO ENERGY
B E N C H M A R K I N G
2 0 1 7
R E P O R T

2017 Chicago Energy Benchmarking Report
The nex t energy reports are due by June 1, 2018.To learn more, go to: www.CityofChicago.org/EnergyBenchmarking
CHICAGO ENERGY RATINGCITY OF CHICAGO
BUILDING ADDRESS: 123 Sample StreetBUILDING NAME: The Sample Street Office Tower
THIS BUILDING RECEIVED 2 OUT OF 4 STARS FOR ENERGY PERFORMANCE
AND RECEIVED AN ENERGY STAR SCORE OF 55 OUT OF 100.
DATE ISSUED:Based on information from calendar year 20XX.
Building on this success, Chicago will launch the new Chicago EnergyRating System in 2019.
CHICAGO ENERGY RATING
When energy scores go up, carbon goesdown. The carbon emissions from these buildings
are down by 19% in just two years.
IMPACT CO2
LOW
19%
8%
HIGHEN
ERGY
SCO
RE
2017
85%
Under Chicago Energy Benchmarking,85% of large properties reported
energy use in 2017, up from 80% in 2016.
REACH
On average, reporting properties have improved theirenergy performance by 8% in just one yearsaving over $16 million dollars per year in energy costs.
PERFORMANCE AND OPPORTUNITY
58 59 64
ENERGYSTARSCORE
ENERGYuse from large buildings
represents 20% of citywidecarbon emissions.

2 0 1 7 C H I CAG O E N ER GY B E N C H MA R K I N G R E P O RT WWW . C ITYO F C H I CAG O . O R G / E N ER GY B E N C H MA R K I N G
2 0 1 7 C H I CAG O E N ER GY B E N C H MA R K I N G R E P O RT WWW . C ITYO F C H I CAG O . O R G / E N ER GY B E N C H MA R K I N G
Benchmarking is the cornerstone of Chicago’s strategy for reducing carbon emissions from the building sector.
Year after year since energy reporting requirements began in 2014, we continue to see significant energy and cost savings associated with energy benchmarking. In 2017 alone, ENERGY STAR scores have increased by 8% over scores reported in 2016 - an astounding achievement.
In June of 2017, the City of Chicago committed to adopt the guidelines of the Paris Agreement after President Trump withdrew the United States. In August 2017, we released a report showing that we are 40 percent of the way to meeting the Paris Agreement goal, with the City seeing an 11 percent reduction in carbon emissions from 2005 to 2015.
A key part of those reductions came from the changes you and your colleagues are making to improve energy efficiency in buildings across the City. In Chicago, over 70 percent of our carbon emissions come from buildings. More importantly, the properties that are subject to the energy benchmarking reporting requirements represent approximately 20 percent of all citywide carbon emissions – more than every car, bus, and truck on the road in Chicago.
Building on the success of energy benchmarking, we will implement a new Chicago Energy Rating System starting in 2019. This rating system, unique to Chicago, will make it easier for every resident, tenant, property manager, and visitor to understand how buildings are using energy, and where we can continue to drive more energy and cost savings while creating local, clean jobs.
Thank you for your support and dedication to improving energy performance. We look forward to ongoing partnerships in order to make energy efficiency a reality for every resident and business across the City. n
Sincerely,
Rahm EmanuelMayor, City of Chicago
B
DEAR FELLOW CHICAGOANS,
3


2 0 1 7 C H I CAG O E N ER GY B E N C H MA R K I N G R E P O RT WWW . C ITYO F C H I CAG O . O R G / E N ER GY B E N C H MA R K I N G
2 0 1 7 C H I CAG O E N ER GY B E N C H MA R K I N G R E P O RT WWW . C ITYO F C H I CAG O . O R G / E N ER GY B E N C H MA R K I N G
TABLE OF CONTENTS
I. EXECUTIVE SUMMARY 6
II. COMING IN 2019 – THE CHICAGO ENERGY RATING SYSTEM 8
III. USING ENERGY STAR PORTFOLIO MANAGER TO TRACK WATER USE 11
IV. CHICAGO ENERGY BENCHMARKING BACKGROUND AND COMPLIANCE 14
V. 2017 BENCHMARKING RESULTS 19
VI. CONTINUING PROGRESS THROUGH PARTNERSHIPS 26
VII. ACKNOWLEDGEMENTS 30
VIII. APPENDIX 31
• Trinity United Church of Christ (House of Worship) 13 • Mid-America Asset Management (Retail) 18• AMLI Residential (Multifamily Apartments) 25
FEATURED BUILDINGS
5
2017 CHICAGO ENERGY BENCHMARKING REPORT WWW.CITYOFCHICAGO.ORG/ENERGYBENCHMARKING
WWW . C ITYO F C H I CAG O . O R G / E N ER GY B E N C H MA R K I N G 2 0 1 7 C H I CAG O E N ER GY B E N C H MA R K I N G R E P O RT
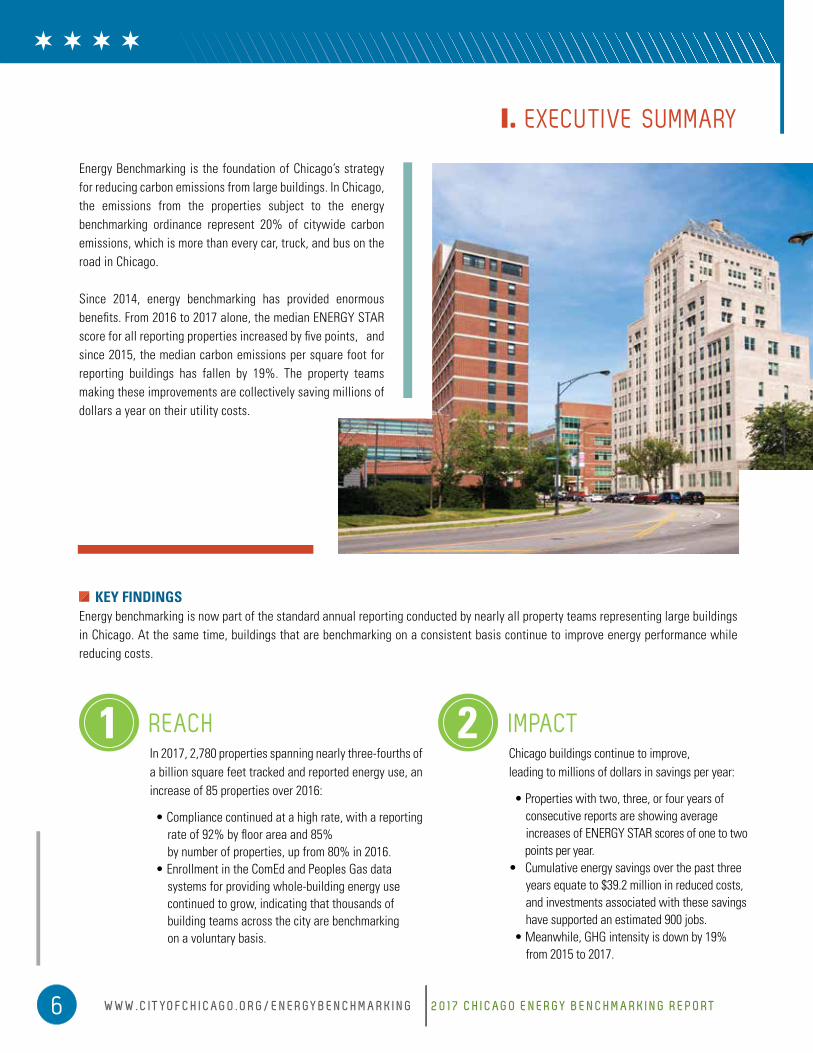
Energy Benchmarking is the foundation of Chicago’s strategy for reducing carbon emissions from large buildings. In Chicago, the emissions from the properties subject to the energy benchmarking ordinance represent 20% of citywide carbon emissions, which is more than every car, truck, and bus on the road in Chicago.
Since 2014, energy benchmarking has provided enormous benefits. From 2016 to 2017 alone, the median ENERGY STAR score for all reporting properties increased by five points, and since 2015, the median carbon emissions per square foot for reporting buildings has fallen by 19%. The property teams making these improvements are collectively saving millions of dollars a year on their utility costs.
I. EXECUTIVE SUMMARY
KEY FINDINGS Energy benchmarking is now part of the standard annual reporting conducted by nearly all property teams representing large buildings in Chicago. At the same time, buildings that are benchmarking on a consistent basis continue to improve energy performance while reducing costs.
1 REACHIn 2017, 2,780 properties spanning nearly three-fourths of a billion square feet tracked and reported energy use, an increase of 85 properties over 2016:
• Compliance continued at a high rate, with a reporting rate of 92% by floor area and 85% by number of properties, up from 80% in 2016. • Enrollment in the ComEd and Peoples Gas data systems for providing whole-building energy use continued to grow, indicating that thousands of building teams across the city are benchmarking on a voluntary basis.
2 IMPACTChicago buildings continue to improve,leading to millions of dollars in savings per year:
• Properties with two, three, or four years of consecutive reports are showing average increases of ENERGY STAR scores of one to two points per year. • Cumulative energy savings over the past three years equate to $39.2 million in reduced costs, and investments associated with these savings have supported an estimated 900 jobs. • Meanwhile, GHG intensity is down by 19% from 2015 to 2017.
6

2 0 1 7 C H I CAG O E N ER GY B E N C H MA R K I N G R E P O RT WWW . C ITYO F C H I CAG O . O R G / E N ER GY B E N C H MA R K I N G
2 0 1 7 C H I CAG O E N ER GY B E N C H MA R K I N G R E P O RT WWW . C ITYO F C H I CAG O . O R G / E N ER GY B E N C H MA R K I N G
I. EXECUTIVE SUMMARY
3 PERFORMANCEAND OPPORTUNITYIn Chicago, properties continue to perform far better than national averages:
• With a median ENERGY STAR score of 64, Chicago’s reporting buildings have improved their median score by 8% in just one year. • Some sectors have seen slight increases in median energy use, indicating additional opportunities for improvements.
4 PARTNERSHIP AND SUPPORTThe City continues to partner with numerousorganizations and private sector firms to advanceenergy efficiency in every neighborhood across the City:
• The Chicago Energy Benchmarking Help Center has now facilitated more than 13,000 phone calls, emails, or online requests since 2014, providing a valuable resource to property owners and managers. • Numerous organizations are using benchmarking information to jump-start efficiency efforts.
LOOKING FORWARDBuilding on the success of the energy benchmarking ordinance, the Chicago City Council adopted the new Chicago Energy Rating System in late 2017. The Chicago Energy Rating will assign each building required to benchmark a zero-to-four star rating, which is designed to make energy performance data easier to understand and more accessible to residents, tenants, and others. Chicago is the first US city to assign buildings an energy performance rating and require properties to post their rating. The new system goes into effect in 2019.
7

2017 CHICAGO ENERGY BENCHMARKING REPORT WWW.CITYOFCHICAGO.ORG/ENERGYBENCHMARKING
WWW . C ITYO F C H I CAG O . O R G / E N ER GY B E N C H MA R K I N G 2 0 1 7 C H I CAG O E N ER GY B E N C H MA R K I N G R E P O RT
In November 2017, the Chicago City Council voted to update the existing benchmarking ordinance and create a new Chicago Energy Rating System that makes energy use information for large buildings easily accessible to residents while encouraging energy savings. The new system is a zero to four star scale rating and is based on existing and publicly available energy data, alongside recent energy improvements to buildings. Each building over 50,000 square feet that is subject to the Chicago Energy Benchmarking ordinance will receive a rating, starting in 2019. These properties will be required to post their rating in a prominent location on the property, and share this information at the time of sale or lease listing.
WHY THE CITY OF CHICAGO ADOPTED THE CHICAGO ENERGY RATING SYSTEM
The original Chicago Energy Benchmarking ordinance allows the City to publicly share the ENERGY STAR scores and other metrics for each property subject to the energy benchmarking requirements. However, the information may not always be simple to understand to those outside of the real estate industry and is not highly visible at each building site. Many tenants, visitors, building engineers, and even property managers may not know their score, or may not know what it means. The goal of the new Chicago Energy Rating System is to improve the transparency of the information and make it easier to understand.
Consider this example. If you took a test and received a score of 50 out of 100, you might be disappointed in your performance. However, a 50 on the 1-100 ENERGY STAR score scale represents an average building for energy performance. Similarly, if you took a test and received a score of 75 out of 100, you might be still disappointed in your performance. Yet, a 75 on the 1-100 ENERGY STAR score scale represents a fairly high performer.
The new four star system is designed to help translate the 1-100 score into a form that is easier to understand by all building stakeholders.
HOW THE CHICAGO ENERGY RATING SYSTEM WORKS
The new four star rating system will be based on the 1-100 ENERGY STAR score for each building. The 1-100 ENERGY STAR score is a nationally recognized standard that is acknowledged by numerous real estate and energy groups as a clear indication of energy performance.
In addition, any building with one to three stars that has improved their ENERGY STAR score by ten points or more in the past two years can earn an extra star, which provides an incentive to building teams to improve performance.
Buildings that are not eligible to receive a 1-100 ENERGY STAR score (approximately 15% of all reporting properties in Chicago) will receive a rating based on their energy use per square foot, as compared to national medians for similar buildings.
The City of Chicago will issue the energy rating in 2019, and building owners will then be required to post their rating, and also share it when listing the property for sale or lease, with the exception of residential properties that are subject to Chicago Heat Disclosure requirements.1
II. COMING IN 2019 • THE CHICAGO ENERGY RATING SYSTEM
CHICAGO ENERGY RATINGCITY OF CHICAGO
BUILDING ADDRESS: 123 Sample StreetBUILDING NAME: The Sample Street Office Tower
THIS BUILDING RECEIVED 2 OUT OF 4 STARS FOR ENERGY PERFORMANCE
AND RECEIVED AN ENERGY STAR SCORE OF 55 OUT OF 100.
DATE ISSUED:Based on information from calendar year 20XX.
Draft Placard for theChicago Energy Rating System
8
1 For more information on the Chicago Heat Disclosure requirements, click here:
https://www.cityofchicago.org/city/en/depts/bacp/supp_info/energy_disclosureapplication.html

2 0 1 7 C H I CAG O E N ER GY B E N C H MA R K I N G R E P O RT WWW . C ITYO F C H I CAG O . O R G / E N ER GY B E N C H MA R K I N G
2 0 1 7 C H I CAG O E N ER GY B E N C H MA R K I N G R E P O RT WWW . C ITYO F C H I CAG O . O R G / E N ER GY B E N C H MA R K I N G
II. COMING IN 2019 • THE CHICAGO ENERGY RATING SYSTEM
INITIALLY, THE RATINGS WILL BE BASED ON THE FOLLOWING SCALE:
• 4 stars: 81-100 points or 61-80 points and a 10-point improvement in the last two years;
• 3 stars: 61-80 points or 41-60 points and a 10-point improvement in the last two years;
• 2 stars: 41-60 points or 11-40 points and a 10-point improvement in the last two years;
• 1 star: 40 points or below; and
• 0 stars: did not submit required benchmarking information.
NEW WATER DATA PROVISIONThe City is also now authorized to collect each building’s water usage information from the Department of Water Management and/or the Department of Finance, and then to publish that information, along with each building’s reported energy use information. It is important to note that building owners are not required to gather and report water usage information using the ENERGY STAR Portfolio Manager energy benchmarking tool, although they can voluntarily choose to do so.
Data on water costs will not be shared, and only the total water usage data will be collected and published for each property. In addition, building owners will be able to opt out of having their water data shared publicly.
9

2017 CHICAGO ENERGY BENCHMARKING REPORT WWW.CITYOFCHICAGO.ORG/ENERGYBENCHMARKING
WWW . C ITYO F C H I CAG O . O R G / E N ER GY B E N C H MA R K I N G 2 0 1 7 C H I CAG O E N ER GY B E N C H MA R K I N G R E P O RT
WHAT YOU NEED TO DOThere is no new reporting requirement under the Chicago Energy Rating System. In 2018, there is no additional action required. In 2019, the City will issue the first Energy Rating to each property subject to the energy benchmarking ordinance, and the property owner will be required to post their rating in a prominent location, as well as share the rating at the time the property is listed for sale or lease.
II. COMING IN 2019 • THE CHICAGO ENERGY RATING SYSTEM
10

2 0 1 7 C H I CAG O E N ER GY B E N C H MA R K I N G R E P O RT WWW . C ITYO F C H I CAG O . O R G / E N ER GY B E N C H MA R K I N G
2 0 1 7 C H I CAG O E N ER GY B E N C H MA R K I N G R E P O RT WWW . C ITYO F C H I CAG O . O R G / E N ER GY B E N C H MA R K I N G
III. USING ENERGY STAR PORTFOLIO MANAGER TO TRACK WATER USE
The City of Chicago does not require building owners to track and report water usage, although the City will begin to collect and share this information publicly in 2019. (The City will gather the data from its Department of Water Management and post the information online, with no new reporting requirements for building owners.)
However, building teams may choose to voluntarily use ENERGY STAR Portfolio Manager to track water consumption. A total of 565 properties (over 20% all properties reporting in 2017) are already doing so!
Initial results from voluntary water reporting are provided below. This information is not required by the City of Chicago, nor are
the data required to be verified, so the accuracy may differ from the energy data included in this report. However, the information below provides a good starting point for reviewing your property’s water usage.
These preliminary and early results show that some Chicago property types appear to be consuming water at levels below national medians. (In some cases, national medians are not available for comparison.) Also, Chicago’s overall median of 19 gallons per square foot is similar to the overall national median of 20 gallons per square foot. In future years, more accurate data will be available as Chicago begins to report water use data for all properties over 50,000 square feet in 2019.
0 5 10 15 20 25 30 35 40 45 50
Multifamily Housing (n=207)
Lodging (n=58)
Healthcare (n=13)
Retail (n=57)
Office (n=163)
University (n=27)
Other (n=31)
K-12 school (n=9)
Water Use Intensity (gallons per square foot)
Chicago median by property type
National median by property type (if available)
Chicago median
National median
Chicago Median = 19
National Median = 20
n=565
FOR MULTIFAMILY PROPERTIESDid you know that multifamily properties are now eligible to receive a 1-100 Water Score? Consistent with the approach to the 1 – 100 ENERGY STAR score, you can now generate an EPA 1 – 100 water score to see how your multifamily property’s water consumption measures up against similar properties nationwide. Available to existing multifamily properties with 20 or more units, the Water Score provides a statistical evaluation of whole property water use—including both indoor and outdoor use—normalized for weather and operation.
To learn more click here: https://www.energystar.gov/buildings/owners_and_managers/existing_buildings/use_portfolio_manager/understand_metrics/epa_1_100_water_score
NEW!
11
Figure 1: Median Water Use
Intensityby Property Type
Note: See the Appendix (page 32) for the data sourcesused for national median values.

2017 CHICAGO ENERGY BENCHMARKING REPORT WWW.CITYOFCHICAGO.ORG/ENERGYBENCHMARKING
WWW . C ITYO F C H I CAG O . O R G / E N ER GY B E N C H MA R K I N G 2 0 1 7 C H I CAG O E N ER GY B E N C H MA R K I N G R E P O RT
NEW BENCHMARKING EXEMPTION FOR RECENTLY SOLD PROPERTIESAs part of the updates to the energy benchmarking ordinance that created the new Chicago Energy Rating System, the City of Chicago created a new temporary energy benchmarking exemption.
If your property was sold in the year for which energy benchmarking information is required, then you can receive a temporary, one-year exemption in the following compliance year. For example, if your property was sold in 2017, then you can request an exemption in 2018, the compliance year in which calendar year 2017 data is reported.
The purpose of this exemption is to allow new building teams enough time to become familiar with energy benchmarking requirements, and to also ensure that the property is able to receive a complete set of whole-building energy use information from the utilities. Due to privacy concerns, the utilities are not able to always share information with new owners about energy usage under prior owners.
PROPERTY BEING SOLD?Remember – when you purchase or sell a property, it is important to discuss energy benchmarking! Specifically, if you purchase a property, ask to have the existing energy benchmarking profile in ENERGY STAR Portfolio Manager transferred to the new owner or property manager. That way, you will not need to set up and populate a new profile for the building.
NEW!
12

2 0 1 7 C H I CAG O E N ER GY B E N C H MA R K I N G R E P O RT WWW . C ITYO F C H I CAG O . O R G / E N ER GY B E N C H MA R K I N G
2 0 1 7 C H I CAG O E N ER GY B E N C H MA R K I N G R E P O RT WWW . C ITYO F C H I CAG O . O R G / E N ER GY B E N C H MA R K I N G
FEATURED BUILDING
ADDRESS:400 West 95th Street
NEIGHBORHOOD:Washington Heights
CONSTRUCTED:1994
BUILDING OWNER/MANAGER:Trinity United Church of Christ
ARCHITECT:Brook Architecture, Inc.
BUILDING SIZE:78,501 square feet
FEAUTURED
BUILDING
TRINITY UNITED CHURCH OF CHRISTHOUSE OF WORSHIP
“Trinity United Church of Christ is committed to environmental stewardship. Working with numerous partners, such as Faith in Place, the Church has actively improved its energy efficiency by implementing a number of retrofits, from LED lighting upgrades (both indoors and in our parking lot), to updating our reflective roof with a vegetated roof, to adding occupancy sensors. We are also using tankless water heaters, replacing HVAC equipment and boilers with more efficient versions, and replacing all our water fixtures with low-flow models. Finally, we are adding controls to make sure that all equipment in the building is automated. We have started to see the reductions in our utility bills and are using the savings to fund various community-based ministries. For example, the LED retrofit saved $25,000/year on lighting alone.
As a leader on energy, we continue to benchmark the property and to have the data officially verified every year as a best practice. The benchmarking data also reflects the many improvements we have made to the building. For example, our ENERGY STAR score has improved by over 20 points in just two years.
We will continue to serve as a steward and look forward to sharing best practices with other houses of worship or nonprofits that wish to start making similar improvements for their facilities.”
Wilfred Bentley - Trinity United Church of Christ
13

2017 CHICAGO ENERGY BENCHMARKING REPORT WWW.CITYOFCHICAGO.ORG/ENERGYBENCHMARKING
WWW . C ITYO F C H I CAG O . O R G / E N ER GY B E N C H MA R K I N G 2 0 1 7 C H I CAG O E N ER GY B E N C H MA R K I N G R E P O RT
HISTORYThe Chicago Energy Benchmarking Ordinance, adopted in 2013, raises awareness of energy performance through information and transparency, with the goal of unlocking energy and cost savings opportunities for businesses and residents.
The benchmarking reporting requirements were initially rolled out from 2014 to 2016. During those three years, different groups of buildings were phased into compliance by building size and sector. As of 2017, all buildings covered by the ordinance have been required to report for at least two years, with the exception of a handful of newly-constructed buildings completed in recent years. Some larger properties have now been reporting for three or four years.
The benchmarking ordinance is widely regarding as being highly successful in improving transparency of energy use, and also driving energy and emission reductions. The reporting rate by square footage has consistently been 90% or greater since the ordinance was adopted, and the properties benchmarking on a regular basis are seeing energy savings of one to two percent per year, on average.
OVERVIEW OF THE CHICAGO ENERGY BENCHMARKING ORDINANCEThe Chicago Energy Benchmarking Ordinance affects approximately 3,500 buildings, including at least one property in every neighborhood across the City. While these properties account for well less than one percent of all buildings in the city, they represent approximately 20% of citywide carbon emissions — more than every car, bus, and truck on the road in Chicago.
Building owners or managers of properties 50,000 square feet or greater are required to measure and report whole-building energy use once a year, and have the data verified once every three years. All work can be done in-house and there is not a requirement to hire a third party.
COMPLIANCE SUMMARYAs of December 27, 2017, 2,717 properties submitted reports to the City of Chicago, and 63 additional properties submitted on a voluntary basis, for a total of 2,780 reports. This is 85 more reports than were received in 2016.
In 2017, 240 properties received temporary exemptions, leading to 2,957 covered properties that reported or received exemptions out of 3,475 covered properties. The 2017 reporting rate was 85%, which is 5% higher than the 2016 reporting rate of 80%.
IV. CHICAGO ENERGY BENCHMARKING BACKGROUND AND COMPLIANCE
The goal of the Chicago Energy Benchmarking Ordinance is to unlock energy and cost savings opportunities through information and transparency. b
14
2 0 1 7 C H I CAG O E N ER GY B E N C H MA R K I N G R E P O RT WWW . C ITYO F C H I CAG O . O R G / E N ER GY B E N C H MA R K I N G
2 0 1 7 C H I CAG O E N ER GY B E N C H MA R K I N G R E P O RT WWW . C ITYO F C H I CAG O . O R G / E N ER GY B E N C H MA R K I N G
IV. CHICAGO ENERGY BENCHMARKING BACKGROUND AND COMPLIANCE
• 2,780 total reporting properties, 85 more than in 2016 • 20% of citywide carbon emissions represented by reporting properties • 85% reporting rate, 5% higher than in 2016
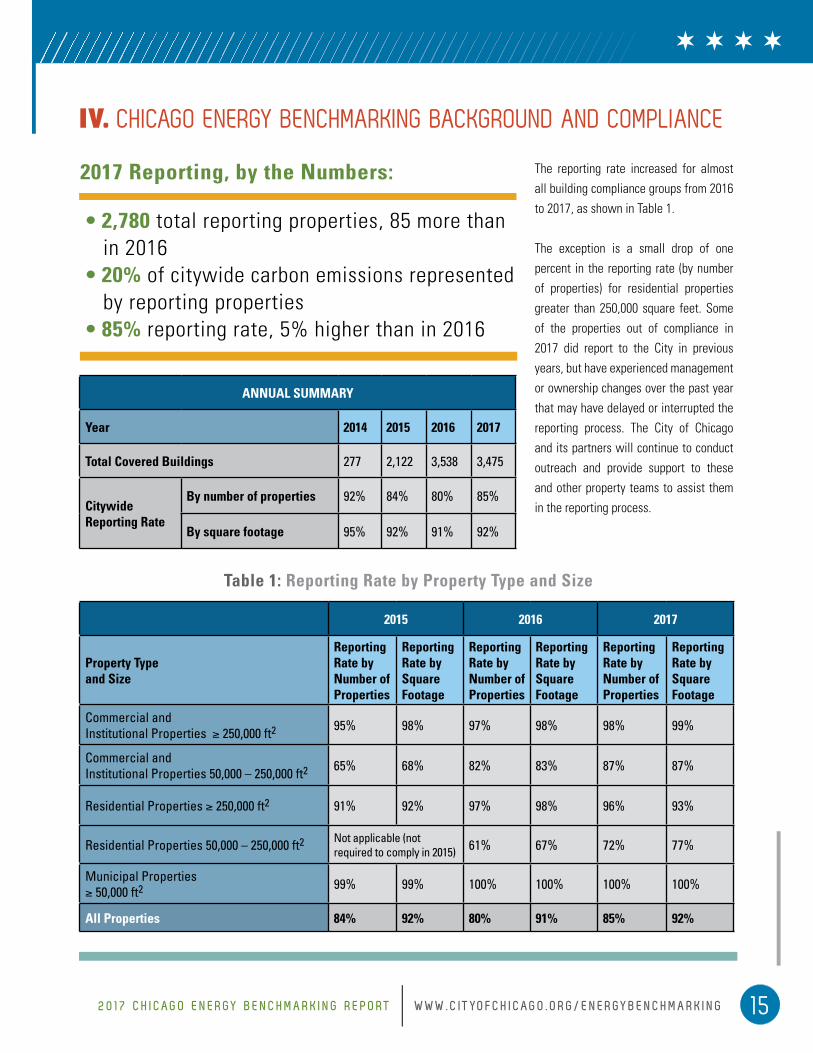
The reporting rate increased for almost all building compliance groups from 2016 to 2017, as shown in Table 1.
The exception is a small drop of one percent in the reporting rate (by number of properties) for residential properties greater than 250,000 square feet. Some of the properties out of compliance in 2017 did report to the City in previous years, but have experienced management or ownership changes over the past year that may have delayed or interrupted the reporting process. The City of Chicago and its partners will continue to conduct outreach and provide support to these and other property teams to assist them in the reporting process.
Table 1: Reporting Rate by Property Type and Size
15
ANNUAL SUMMARY
Year 2014 2015 2016 2017
Total Covered Buildings 277 2,122 3,538 3,475
CitywideReporting Rate
By number of properties 92% 84% 80% 85%
By square footage 95% 92% 91% 92%
2015 2016 2017
Property Typeand Size
Reporting Rate by Number of Properties
Reporting Rate by SquareFootage
Reporting Rate by Number of Properties
Reporting Rate by SquareFootage
Reporting Rate by Number of Properties
Reporting Rate by SquareFootage
Commercial andInstitutional Properties ≥ 250,000 ft2 95% 98% 97% 98% 98% 99%
Commercial andInstitutional Properties 50,000 – 250,000 ft2 65% 68% 82% 83% 87% 87%
Residential Properties ≥ 250,000 ft2 91% 92% 97% 98% 96% 93%
Residential Properties 50,000 – 250,000 ft2 Not applicable (notrequired to comply in 2015) 61% 67% 72% 77%
Municipal Properties≥ 50,000 ft2 99% 99% 100% 100% 100% 100%
All Properties 84% 92% 80% 91% 85% 92%
2017 Reporting, by the Numbers:

2017 CHICAGO ENERGY BENCHMARKING REPORT WWW.CITYOFCHICAGO.ORG/ENERGYBENCHMARKING
WWW . C ITYO F C H I CAG O . O R G / E N ER GY B E N C H MA R K I N G 2 0 1 7 C H I CAG O E N ER GY B E N C H MA R K I N G R E P O RT
REACHING ACROSS ALL NEIGHBORHOODSCitywide, every neighborhood has at least 1 reporting building, and 87% of neighborhoods have 5 or more reporting buildings.
IV. CHICAGO ENERGY BENCHMARKING BACKGROUND AND COMPLIANCE
Figure 2: 2017 Reporting Properties by Neighborhood
16

2 0 1 7 C H I CAG O E N ER GY B E N C H MA R K I N G R E P O RT WWW . C ITYO F C H I CAG O . O R G / E N ER GY B E N C H MA R K I N G
2 0 1 7 C H I CAG O E N ER GY B E N C H MA R K I N G R E P O RT WWW . C ITYO F C H I CAG O . O R G / E N ER GY B E N C H MA R K I N G
IV. CHICAGO ENERGY BENCHMARKING BACKGROUND AND COMPLIANCE
DATA PORTAL: The City of Chicago publishes energy information about every building required to benchmark and report on its Data Portal once per year. Users can view the data, download the information, and compare similar properties. There is a one-year grace period; the first year a building reports its information, the data is not shared.
In 2017, the City is authorized to share information about every building that has reported – approximately 2,700 properties (with a very small number of exceptions for newly-constructed buildings.) The energy benchmarking information on Data Portal can be found at: https://data.cityofchicago.org/Environment-Sustainable-Development/Chicago-Energy-Benchmarking/xq83-jr8c
The City and its partners have also published an interactive map of the building data. To use the map and view building results, including the buildings in your neighborhood, please visit: http://cityenergyproject.github.io/chicago/
Chicago Energy Benchmarking Data Map
17

2017 CHICAGO ENERGY BENCHMARKING REPORT WWW.CITYOFCHICAGO.ORG/ENERGYBENCHMARKING
WWW . C ITYO F C H I CAG O . O R G / E N ER GY B E N C H MA R K I N G 2 0 1 7 C H I CAG O E N ER GY B E N C H MA R K I N G R E P O RT
ADDRESS:Various
NEIGHBORHOOD:Mid-America Asset Management has properties in
neighborhoods throughout the City of Chicago
CONSTRUCTED:1920s - present
BUILDING OWNER/MANAGER:Various / Mid-America Asset Management
ARCHITECT:Various
BUILDING SIZE:Over 1,900,000 square feet across the portfolio
FEAUTURED
BUILDING
MID-AMERICA ASSET MANAGEMENTRETAIL PROPERTIES
“A sustainable shopping center enhances the neighborhood, improves the quality of the environment and strengthens the ties of community. It’s a place where retailers not only coexist among the community but are the centerpiece of it. One that spends less on energy use with each passing year, sensibly maintains and upgrades its operations and ensures its tenants have the opportunity to prosper.
In 2013, the Mayor of Chicago unveiled a progressive agenda called Sustainable Chicago 2015; more recently, the Mayor committed the City to reach the original U.S. carbon reduction goals of the Paris Climate Agreement. Improving citywide energy efficiency touches upon the full spectrum of life for Chicagoans, whether at home, at work, on the streets and even at its shopping centers. Mid-America Asset Management has not only embraced the challenge for more livable, competitive and sustainable buildings but embraced it for ALL properties under management. We now have the capability to perform energy assessments, benchmark, and EnergyStar certify all of our properties under management. We work with our preferred vendors, utility companies and local government agencies to come up with a plan to make shopping centers more sustainable while maximizing the return on investment.”
- Mid-America Asset Management
FEATURED BUILDING
18

2 0 1 7 C H I CAG O E N ER GY B E N C H MA R K I N G R E P O RT WWW . C ITYO F C H I CAG O . O R G / E N ER GY B E N C H MA R K I N G
2 0 1 7 C H I CAG O E N ER GY B E N C H MA R K I N G R E P O RT WWW . C ITYO F C H I CAG O . O R G / E N ER GY B E N C H MA R K I N G
V. 2017 BENCHMARKING RESULTS
PROPERTIES ANALYZED IN 2017Energy benchmarking reports from 2,437 properties are included in this analysis, and these buildings are referred to as “analyzed properties.” (For more details on the analysis methodology, please see the Appendix.) Each property is assigned to one of eight property groups.
Multifamily residential buildings continue to be the largest reporting group – by far - in terms of the number of properties (see Figure 3), representing nearly half of all analyzed properties. The next largest groups are Offices and K-12 School buildings. There is also a cluster of property types with similar rates of energy use per square foot that includes Retail, Lodging, Higher Education, and “Other” properties.
Figure 3: Median Site EUI and Total Site Energy Use by Number of Properties
OVERALL ENERGY PERFORMANCEThe 1-100 ENERGY STAR Score represents the property’s overall energy performance relative to similar buildings. A score of 50 indicates energy performance at the national median, while a score of 100 represents extremely high energy performance. Scores below 50 indicate significant opportunities for improvement.
In 2017, the median ENERGY STAR score for all analyzed properties was 64 out of 100, a whopping five points higher than the median score of 59 reported in 2016. This jump represents a 8% improvement from 2016 to 2017. Also, 85% of all analyzed properties received a score in 2017. Figure 4 shows the median reported ENERGY STAR score from Chicago Energy Benchmarking reports over the past three years.
The 1-100 Energy Star Score
19
Healthcare
Office
Mutifamily HousingK-12 School
Higher Education
0
50
100
150
200
250
-20 180 380 580 780 980 1180
Med
ian
Site
Ene
rgy
Use
Inte
nsity
(kB
TU/s
quar
e fo
ot)
Number of Propertiesnnnn n=2,437nnnnnnnnnnnnnnnnnnnn
Size of bubble = Total Site Energy Use (kBTU)
Other Lodging
Retail
Image Courtesy of the U.S. EPA

2017 CHICAGO ENERGY BENCHMARKING REPORT WWW.CITYOFCHICAGO.ORG/ENERGYBENCHMARKING
WWW . C ITYO F C H I CAG O . O R G / E N ER GY B E N C H MA R K I N G 2 0 1 7 C H I CAG O E N ER GY B E N C H MA R K I N G R E P O RT
V. 2017 BENCHMARKING RESULTS
Figure 4: Median ENERGY STAR Scores Over the Past Three Years
Figure 5: ENERGY STAR Scores by Building Sector Reported from 2015-2017
In addition, the median ENERGY STAR score increased for almost all of the 8 property sectors from 2015 to 2017. (See Figure 5). Multifamily Housing, Lodging, and Healthcare properties had the greatest improvement in energy performance, with each sector seeing a 6-point increase in median ENERGY STAR scores.
The Retail and K-12 School sectors each saw a 4-point improvement in median scores. Office properties did not see a change, but continue to lead the City with the highest median score of 79. The Other building sector saw a slight decline in scores, although only 20 of the Other buildings were eligible to receive a score in 2017. (Very few of the “Other” buildings are typically eligible to receive a score.)
20
58
59
64
55
56
57
58
59
60
61
62
63
64
65
2015 (n=1,123) 2016 (n=1,867) 2017 (n=2,075)
Med
ian
1-10
0 EN
ERG
Y ST
AR
Scor
e
Reporting Year
79
57
63
63
61
47
42
79
67
59
59
55
41
36
74
66
64
54
43
35
37
0 10 20 30 40 50 60 70 80
Office
Other
Retail
K-12 school
Multifamily Housing
Healthcare
Lodging
2014 Median ENERGY STAR Score (Reported in 2015)
2015 Median ENERGY STAR Score (Reported in 2016)
2016 Median ENERGY STAR Score (Reported in 2017)
79
57
63
63
61
47
42
79
67
59
59
55
41
36
74
66
64
54
43
35
37
0 10 20 30 40 50 60 70 80
Office
Other
Retail
K-12 school
Multifamily Housing
Healthcare
Lodging
2014 Median ENERGY STAR Score (Reported in 2015)
2015 Median ENERGY STAR Score (Reported in 2016)
2016 Median ENERGY STAR Score (Reported in 2017)

2 0 1 7 C H I CAG O E N ER GY B E N C H MA R K I N G R E P O RT WWW . C ITYO F C H I CAG O . O R G / E N ER GY B E N C H MA R K I N G
2 0 1 7 C H I CAG O E N ER GY B E N C H MA R K I N G R E P O RT WWW . C ITYO F C H I CAG O . O R G / E N ER GY B E N C H MA R K I N G
V. 2017 BENCHMARKING RESULTS
TREND ANALYSISEnergy benchmarking reports continue to confirm that the process of regularly tracking and reporting energy use is associated with energy savings. On average, properties that have been benchmarking two, three, or four years consecutively are reporting an average increase in ENERGY STAR scores of one to two points per year (Figure 6 and Table 2).
Figure 6:ENERGY STAR Scores For
Properties Reporting Two or More Years Consecutively
Table 2: Year-Over-Year, Same Building Trend Analysis
In most cases, building owner and manager teams also saw decreases in weather normalized site energy use for properties reporting two, three, or four years consecutively (Table 2). Similar to results in previous years, these energy reductions are resulting in millions of dollars of savings per year.
Over the past three years, properties have reported average energy reductions of one to two percent per year, which equates to cost savings totaling over $39.2 million. While Chicago does not require property teams to report how they are saving energy, common reasons include improving automated energy systems and controls, upgrading lighting to more efficient fixtures, and replacing outdated heating and cooling equipment. The carbon emissions from these energy savings total over 1 million metric tons of CO2. equivalent to the carbon from consuming nearly 2.5 million barrels of oil. We estimate that approximately 900 jobs were supported through the investments associated with these energy savings. Examples of some of the jobs created could include the electrical workers who replaced older light bulbs with LEDs, or mechanical engineers hired to analyze energy trends and provide recommendations for improvements.
21
58
51
70
60 57
76
-
10
20
30
40
50
60
70
80
Buildings Benchmarking in 2016 and 2017(n=637)
Buildings Benchmarking in 2015, 2016,and 2017 (n=911)
Buildings Benchmarking in 2014, 2015,2016, and 2017 (n=184)
Aver
age
1-10
0 EN
ERG
Y ST
AR
Scor
e
Beginning Average ENERGY STAR Score
Ending Average ENERGY STAR Score
GroupWeather Normal-ized Site Energy Use Change (%)
Cost Savings ($/year)
Starting Average 1-100 ENERGY STAR Score
Ending Average 1-100 ENERGY STAR Score
Properties reporting for 2 consecutive years (2016 and 2017) (n=637)
0.37% increase None 58 60
Properties reporting for 3 consecutive years (2015, 2016, and 2017) (n=911)
1.3% decrease $3.7 million/year 51 57
Properties reporting for 4 consecutive years (2014, 2015, 2016, and 2017) (n=184)
4.4% decrease $12.7 million/year 70 76
Total $16.4 million/year

2017 CHICAGO ENERGY BENCHMARKING REPORT WWW.CITYOFCHICAGO.ORG/ENERGYBENCHMARKING
WWW . C ITYO F C H I CAG O . O R G / E N ER GY B E N C H MA R K I N G 2 0 1 7 C H I CAG O E N ER GY B E N C H MA R K I N G R E P O RT
V. 2017 BENCHMARKING RESULTS
When ENERGY STAR scores go up, carbon emissions go down. Overall, the carbon emissions per square foot of space (also known as the GHG intensity) went down by 19% from 2015 to 2017. Every single building sector saw decreases in the GHG intensity, as shown in Figure 7. Also, for buildings benchmarking for two, three, or four consecutive years, the total carbon reduction is 662,920 metric tons CO2e/year, equivalent to the energy needed to power over 71,000 homes for one year.
Figure 7: Median GHG Intensity from 2015 – 2017
Figure 8:
Median SourceEUI from
2015 - 2017
Finally, comparison of the past three years of benchmarking information shows that the median source energy per square foot for all reporting buildings has dropped by seven percent from the 2015 to 2017 reporting years. The greatest reductions occurred in the Lodging sector (14% decrease), followed by the Office and Multifamily Housing sectors (each of which saw a 6% decrease) (Figure 8). Some sectors, such as K-12 Schools and Retail, did see a slight increase over the past three years of reports.
22
5.0
10.0
15.0
20.0
25.0
2015 (n=1,451) 2016 (n=2,259) 2017 (n=2,437)
GH
G E
mis
sion
s In
tens
ity (k
g CO
2e/s
quar
e fo
ot)
Healthcare
K-12 school
Lodging
Office
Other
Retail
University
Total for All ReportingBuildings
Multifamily Housing
100
150
200
250
300
350
400
450
2015 (n=1,451) 2016 (n=2,259) 2017 (n=2,437)
Med
ian
Wea
ther
Nor
mal
ized
Sou
rce
EUI (
kBTU
/squ
are
foot
)
Healthcare
K-12 school
Lodging
Multifamily Housing
Office
Other
Retail
University
Total Median for AllReporting Buildings

2 0 1 7 C H I CAG O E N ER GY B E N C H MA R K I N G R E P O RT WWW . C ITYO F C H I CAG O . O R G / E N ER GY B E N C H MA R K I N G
2 0 1 7 C H I CAG O E N ER GY B E N C H MA R K I N G R E P O RT WWW . C ITYO F C H I CAG O . O R G / E N ER GY B E N C H MA R K I N G
ENERGY STAR CERTIFICATION AND ENERGY STAR UPDATES IN AUGUST 2018Properties that receive a score of 75 or higher and meet other criteria may be able to earn the ENERGY STAR label. In Chicago, increasing the number of properties required to benchmark has been associated with increases in the number of ENERGY STAR certifications (Figure 9). As of the 2017 Reporting Year, a total of 168 properties subject to the energy benchmarking ordinance have been certified, up from 106 certified properties in 2014.
This increase matters because ENERGY STAR certification provides a nationally-recognized standard for energy performance. According to the U.S. EPA, ENERGY STAR certified buildings and plants meet strict energy performance standards set by EPA. They use less energy, are less expensive to operate, and cause fewer greenhouse gas emissions than their peers. If your property has a score of 75 or higher, consider getting it certified and receiving the ENERGY STAR label. For more details, please visit: https://www.energystar.gov/buildings/about-us/how-can-we-help-you/recognition/earn-recognition-your-building-or-plant
V. 2017 BENCHMARKING RESULTS
Figure 9: ENERGY STAR Certified Properties from 2014-2017
23
90
117127 131
16
25
27
37
0
20
40
60
80
100
120
140
160
180
2014(262 analyzed
properties)
2015(1,451 analyzed
properties)
2016(2,259 analyzed
properties)
2017(2,437 analyzed
properties)
Num
ber o
f Pro
pert
ies
Buildings Certified 3 or MoreYears Prior to the Reporting Year
Buildings Certified Within 2 Yearsof the Reporting Year

2017 CHICAGO ENERGY BENCHMARKING REPORT WWW.CITYOFCHICAGO.ORG/ENERGYBENCHMARKING
WWW . C ITYO F C H I CAG O . O R G / E N ER GY B E N C H MA R K I N G 2 0 1 7 C H I CAG O E N ER GY B E N C H MA R K I N G R E P O RT
V. 2017 BENCHMARKING RESULTS
ENERGY STAR UPDATESThe U.S. EPA regularly updates models used to develop ENERGY STAR Scores, based on the most recent energy performance information available. In August 2018, scores will be updated for the following Portfolio Manager property types:
• Office, Financial Office, Bank, Courthouse • Retail • Supermarket • K-12 School • Hotel • Worship Facility
In addition, the following changes will occur for all property types:
• Scores and metrics will be updated with revised site-to- source factors. These factors are updated to reflect the current energy market.
• National Median values will be updated based on the most recent national dataset. • Data Center benchmarking options will be updated to offer the use of Estimated IT Energy to get a score and certification.
Note that these changes will not affect the energy benchmarking reports submitted in 2018 by the annual deadline of June 1.
IF YOUR SCORE IS 75 OR HIGHER – GET CERTIFIED BY AUGUST 2018! The U.S. EPA recommends pursuing 2018 ENERGY STAR certification prior to the score changes in Portfolio Manager, in case your property’s score changes, rather than waiting for the 2018 update to go into place.
For more information on these changes, click here:https://www.energystar.gov/scoreupdates
24

2 0 1 7 C H I CAG O E N ER GY B E N C H MA R K I N G R E P O RT WWW . C ITYO F C H I CAG O . O R G / E N ER GY B E N C H MA R K I N G
2 0 1 7 C H I CAG O E N ER GY B E N C H MA R K I N G R E P O RT WWW . C ITYO F C H I CAG O . O R G / E N ER GY B E N C H MA R K I N G
FEATURED BUILDINGS: AMLI RESIDENTIAL
APARTMENT COMMUNITIESAMLI 900440 units in South LoopAddress: 900 South Clark StreetLEED CertifiedBuilt 2008Building Size: 480,050 square feet
AMLI RIVER NORTH409 units in River NorthAddress: 71 West Hubbard StreetLEED GoldENERGY STAR certifiedBuilt 2013Building Size: 456,710 square feet
AMLI LOFTS398 units in South LoopAddress: 850 South Clark Street /111 West Polk StreetLEED SilverBuilt 2015Building Size: 403,195 square feet
BUILDING DEVELOPER /OWNER / MANAGER:AMLI Residential
FEAUTURED
BUILDING
MULTIFAMILY RESIDENTIALAPARTMENT BUILDINGS
“AMLI Residential has been investing in sustainability since we built our first LEED® certified apartment building in 2008 in Chicago’s South Loop. By going through the energy benchmarking process, we have been able to prove out the value of LEED certification during the development process and identify energy retrofits opportunities in our existing apartment portfolio. Energy benchmarking data has been integral to our process in evaluating retro commissioning opportunities, lighting retrofits, and rooftop photovoltaic. In Chicago, we have used this information to implement an LED retrofit, saving an estimated 290,000 kilowatt-hours per year.
Energy benchmarking has also enabled us to earn additional recognition for our apartment communities, earning our first ENERGY STAR® certification at AMLI River North in 2015. With that success, we undertook an initiative to benchmark all communities in our national portfolio and have since received a total of 16 ENERGY STAR certifications, making us an ENERGY STAR leader in the multifamily industry, a distinction valued by our residents, investors and the cities in which we operate.”
- AMLI Residential
25

2017 CHICAGO ENERGY BENCHMARKING REPORT WWW.CITYOFCHICAGO.ORG/ENERGYBENCHMARKING
WWW . C ITYO F C H I CAG O . O R G / E N ER GY B E N C H MA R K I N G 2 0 1 7 C H I CAG O E N ER GY B E N C H MA R K I N G R E P O RT
VI. ONGOING PROGRESS THROUGH PARTNERSHIPS
The City of Chicago has built numerous partnerships to enable building owners and managers to harness their energy benchmarking information in order to find new cost savings. Beginning with the benchmarking reporting through to identification of energy saving measures, the City works with multiple groups to get the word out about both the energy benchmarking requirements and ways to save energy.
OUTREACH The City of Chicago sends out multiple compliance notices to building stakeholders each year; two prior to the June 1st deadline, and two after the deadline (for any building that missed the deadline). In 2017 alone, the City (or its Help Center) sent out over 18,000 letters and 11,000 emails to remind building owners and managers of the need to comply.
The City and its partners also continue to work with local industry groups to share information about the benchmarking requirements, and how to start using the energy data that is reported.
For example, the City worked with partners and its Help Center to develop a Chicago Energy Profile, which is emailed to every reporting building once per year. The Profile shows the building’s performance in comparison with similar buildings reporting in Chicago, and also provides specific, concrete suggestions for
improving energy performance. If you benchmarked a building in 2017, look for the Chicago Energy Profile for your property in your inbox by spring 2018.
BUILDING SUPPORTUtility Data AccessComEd provides whole-building data upon request to building owners or their representative through the Energy Usage Data System (EUDS)2, a secure, online service. Currently, EUDS serves over 1,285 property owners/managers and more than 5,944 properties in the City of Chicago, an increase of over 80% since 2016. Only about 3,500 properties in the City are subject to the energy benchmarking ordinance, so this level of enrollment in ComEd’s tool – approaching double the number of buildings required to benchmark – indicates that thousands of properties are beginning to benchmark, even though they are not required to do so.
Peoples Gas provides whole-building natural gas consumption information through the Large Building Energy Use Natural Gas Data Aggregation offering.3 In 2014, approximately 70 properties enrolled in this program, and the number grew to more than 500 properties in 2015 and over 1,300 in 2016. As of December 2017, more than 1,420 properties have utilized this service from Peoples Gas.
Help CenterThe Chicago Energy Benchmarking Help Center, operated by Elevate Energy 4, continues to provide a one-stop-shop for property teams with questions about energy benchmarking. With absolutely no complaints over the past several years, the Help Center provides exceptional service to hundreds of stakeholders annually.
2 EUDS: https://www.comed.com/WaysToSave/ForYourBusiness/Pages/EnergyUsageData.aspx
A portion of the Chicago Energy Profile sent annually to every reporting building
26
3 Peoples Gas Large Buildings Energy Use Data Aggregation Program: http://www.peoplesgasdelivery.com/business/aggregation.aspx
4 Elevate Energy helps people do more with less energy. They design and implement efficiency programs that lower costs, protect the environment, and
ensure the benefits of energy efficiency reach those who need them most. For more information, visit: www.ElevateEnergy.org

2 0 1 7 C H I CAG O E N ER GY B E N C H MA R K I N G R E P O RT WWW . C ITYO F C H I CAG O . O R G / E N ER GY B E N C H MA R K I N G
2 0 1 7 C H I CAG O E N ER GY B E N C H MA R K I N G R E P O RT WWW . C ITYO F C H I CAG O . O R G / E N ER GY B E N C H MA R K I N G
VI. ONGOING PROGRESS THROUGH PARTNERSHIPS
Figure 10: 2017 Chicago Energy BenchmarkingHelp Center Interactions
Figure 11:Annual Help Center Interactions
Per Covered Building
• 13,385 interactions from 2014 - 2017 (phone calls, emails, and webforms)
• Average 2017 call time: 6 minutes, 30 seconds
• Average 2017 caller wait time: 17 seconds
• Total 2017 phone support: 117 hours, 7 minutes
27
53%
35%
12%
Phone Calls
Emails
Webforms
n=2,234
3.3
2.5
1.4
0.6
0.0
0.5
1.0
1.5
2.0
2.5
3.0
3.5
2014 2015 2016 2017
Hel
p Ce
nter
Inte
ract
ions
Per
Cov
ered
Bui
ldin
g
Although most buildings covered by the ordinance have now benchmarked their property at least once, staff turnover or changes in ownership lead some property teams to have questions about the process. Other stakeholders may need additional assistance to apply for exemptions, or to update contact information associated with a property.
The Help Center continues to operate year-round to respond to these inquiries, with assistance available by phone (9am-5pm, Monday – Friday), by email, and by webform (for certain common requests). In 2017, the Help Center conducted over 2,200 interactions. The breakdown is shown in Figure 10.
Also, the average number of interactions per building required to comply continues to decline (Figure 11), indicating that energy benchmarking now is becoming a standard operating procedure for building owners and property managers.

2017 CHICAGO ENERGY BENCHMARKING REPORT WWW.CITYOFCHICAGO.ORG/ENERGYBENCHMARKING
WWW . C ITYO F C H I CAG O . O R G / E N ER GY B E N C H MA R K I N G 2 0 1 7 C H I CAG O E N ER GY B E N C H MA R K I N G R E P O RT
VI. ONGOING PROGRESS THROUGH PARTNERSHIPS
While our staff of five may seem small, we have expertly responded to over 13,000 interactions since 2014. These interactions include phone calls, emails, and webforms. Our interactions range anywhere from explaining ordinance basics to providing resources and step by step guidance to ensure buildings are well on their way to compliance.
TRAINING AND OFFICE HOURSThe Illinois Green Alliance (formerly known as the U.S. Green Building Council – Illinois Chapter) 5 continues to partner with the City of Chicago to provide high-quality, easily accessible education around energy benchmarking and the use of the ENERGY STAR Portfolio Manager software tool. A key offering provided by the Illinois Green Alliance is the basic energy benchmarking training, created and delivered in collaboration with the American Institute of Architects – Chicago chapter (AIA-Chicago), the ASHRAE – Illinois chapter (ASHRAE-IL), and the Midwest Energy Efficiency Alliance (MEEA). Relying solely on volunteer instructors, the trainings are always provided free-of-charge.
Illinois Green Alliance volunteers provided additional free trainings in 2017, bring the total number of trainings to over 50 sessions over the past four years. Over 750 stakeholders have received an in-person training or one-on-one support during this time.
Chicago Energy Benchmarking Volunteers Providing Free One-on-One Support for Benchmarking at the Illinois Green Alliance
Trainings are also posted online as free videos, which can be watched at anytime. The online videos were viewed over 500 times in 2017 alone.
PRO-BONO DATA VERIFICATIONIn 2017, the Illinois Green Alliance continued to facilitate the pro-bono data verification program, in which a volunteer is matched with a property team to ensure that energy benchmarking and required data verification are completed at no charge. A total of 45 volunteers have now participated in the program, working with over 100 properties to complete energy benchmarking and data verification.
5 The Illinois Green Alliance is a non-profit, membership-driven organization that advances buildings and communities that are sustainable, prosperous
and healthy: https://illinoisgreenalliance.org/
MEET THE CHICAGO ENERGY BENCHMARKING HELP CENTER!
28

2 0 1 7 C H I CAG O E N ER GY B E N C H MA R K I N G R E P O RT WWW . C ITYO F C H I CAG O . O R G / E N ER GY B E N C H MA R K I N G
2 0 1 7 C H I CAG O E N ER GY B E N C H MA R K I N G R E P O RT WWW . C ITYO F C H I CAG O . O R G / E N ER GY B E N C H MA R K I N G
VI. ONGOING PROGRESS THROUGH PARTNERSHIPS
USING ENERGY DATA TO JUMP-START EFFICIENCY EFFORTS Working with the City of Chicago, the utilities, and other partners, the Illinois Green Alliance has begun an effort to use energy benchmarking information to target and provide additional assistance to property teams with lower-than-average ENERGY STAR scores.
The overall project goal is to leverage the Chicago Energy Benchmarking dataset and initial engagement of property teams
in completing energy benchmarking and data verification, along with existing utility programs (offered by ComEd and Peoples Gas) to encourage commercial, institutional, public, or nonprofit building owners/managers to enroll in utility programs to achieve energy savings.
The project seeks to target 100 property teams over the course of two years, with an overall goal of achieving 20% energy savings across the targeted properties.
29

2017 CHICAGO ENERGY BENCHMARKING REPORT WWW.CITYOFCHICAGO.ORG/ENERGYBENCHMARKING
WWW . C ITYO F C H I CAG O . O R G / E N ER GY B E N C H MA R K I N G 2 0 1 7 C H I CAG O E N ER GY B E N C H MA R K I N G R E P O RT
VII. ACKNOWLEDGEMENTS
The Chicago Energy Benchmarking Ordinance continues to be successful due to the time, effort, and resources provided by numerous partnering organizations.
The Chicago Energy Benchmarking Working Group, initially convened to design the original Ordinance in 2013, continues to work with the City to support its implementation. Additional partners have joined the collaboration, and contribute to ordinance implementation, or assist with development of the new Chicago Energy Rating System.
From outreach to training to Help Center operations, to many of the other tasks related to energy benchmarking, the City is grateful to our many partners for their tireless efforts.
CHICAGO ENERGY BENCHMARKING / CHICAGO ENERGY RATING SYSTEM PARTNERS
• ABOMA• ASHRAE – Illinois• American Institute of Architects – Chicago Chapter• BOMA - Chicago• C40 Cities Climate Leadership Group• Chicagoland Apartment Association• Chicago Association of REALTORS• City Energy Project• Elevate Energy • Enterprise Community Partners• Illinois Environmental Council• Institute for Market Transformation• Midwest Energy Efficiency Alliance• Natural Resources Defense Council• Seventhwave• Sierra Club• Illinois Green Alliance (formerly known as the U.S. Green Building Council – Illinois Chapter)• U.S. Environmental Protection Agency
The 2017 Chicago Energy Benchmarking Report and the initiatives/programs described herein were created with input, analysis, and other support from the following organizations and individuals:
OFFICE OF THE MAYOR, CITY OF CHICAGOChris WheatChief Sustainability Officer & Senior Policy Advisor
Margaret HansbroughEnergy Engagement Manager
CITY ENERGY PROJECTAmy Jewel
COMEDKevin Bricknell Richard Tonielli
ELEVATE ENERGY AND THE HELP CENTER TEAMJohn Blaser Antonia OrnelasJoanna Racho Lisa RothRachel Scheu
PEOPLES GASDavid Baron Catherine Magee
ILLINOIS ENVIRONMENTAL COUNCILJen Walling
ILLINOIS GREEN ALLIANCEKatie Kaluzny
SIERRA CLUBRebecca Judd
DOCUMENT DESIGN BY:Marco TanziCity of Chicago
IN MEMORIAM: George MalekThe City of Chicago recognizes and celebrates the many contributions of George Malek, who passed away in 2017. Mr. Malek, who oversaw many of the energy rebate and incentive programs at ComEd for several years, provided a leading voice on energy efficiency and was a key contributor to advancing new programs and approaches at ComEd and beyond.
30
2 0 1 7 C H I CAG O E N ER GY B E N C H MA R K I N G R E P O RT WWW . C ITYO F C H I CAG O . O R G / E N ER GY B E N C H MA R K I N G
2 0 1 7 C H I CAG O E N ER GY B E N C H MA R K I N G R E P O RT WWW . C ITYO F C H I CAG O . O R G / E N ER GY B E N C H MA R K I N G
APPENDIX
USEFUL BENCHMARKING METRICS AND HOW TO USE THEM• ENERGY STAR Score: A 1-100 ENERGY STAR score shows the property’s overall energy performance relative to similar buildings. A score of 50 indicates energy performance at the national median, while a score of 100 represents extremely high energy performance. Scores below 50 indicate significant opportunities for improvement.6
- The 1-100 ENERGY STAR rating allows comparisons across property types, and across different geographies because it normalizes for differences in energy use (such as climate or annual weather patterns, building space uses, operating characteristics, and other variables).
- A score of 75 or above represents a top performer, and properties with scores of 75 or above may be eligible for the national ENERGY STAR recognition. Learn more at: www.EnergyStar.gov/Buildings
• EUI: Energy Use Intensity (EUI) is the energy use per square foot of gross floor area in the property. There are two types of EUI metrics:
- Site EUI refers to the total energy per square foot that is actually consumed in the building, including all electricity, natural gas, and other fuels in all building spaces (including common areas and tenant spaces).
- Source EUI includes the energy per square foot that is actually consumed in the building (i.e. site EUI), plus additional energy that is generated and consumed ‘upstream’ of the building at power plants, or energy lost through transmission and distribution.
The ENERGY STAR Portfolio Manager tool can also be used to track energy costs, as well as water consumption and water costs, solid waste generation, and many other metrics.
MULTI-YEAR BUILDING COMPARISONS If you have two or more years of benchmarking results, determine the property’s performance over time by using the ENERGY STAR score and/or weather normalized metrics. Weather-normalized metrics account for changes in weather from year to year (such as an extremely hot summer or a very cold winter) and allow comparisons of the same building to itself across different years.7
31
6 For more details about how to interpret your property’s ENERGY STAR score, please visit:
https://www.energystar.gov/buildings/facility-owners-and-managers/existing-buildings/use-portfolio-manager/interpret-your-results/what
7 Two key weather normalized metrics include weather normalized site energy use and weather normalized source energy use, both expressed in kBTU.
These include the site and/or source energy (kBTU) that a property would have consumed under 30-year average weather conditions, based on actual
energy use for a given time period. For more information on weather normalization, see the ENERGY STAR Portfolio Manager Technical Reference
on Climate and Weather: https://portfoliomanager.energystar.gov/pdf/reference/Climate%20and%20Weather.pdf

2017 CHICAGO ENERGY BENCHMARKING REPORT WWW.CITYOFCHICAGO.ORG/ENERGYBENCHMARKING
WWW . C ITYO F C H I CAG O . O R G / E N ER GY B E N C H MA R K I N G 2 0 1 7 C H I CAG O E N ER GY B E N C H MA R K I N G R E P O RT
APPENDIX
32
ADDITIONAL TERMS• ENERGY STAR Portfolio Manager: Free, online software developed by the U.S. EPA to help buildings benchmark, verify, and report energy use and property information (www.EnergyStar.gov/PortfolioManager).
• Greenhouse Gas (GHG) Emissions: Carbon dioxide (CO2) and other gases released as a result of energy generation, transmission, and consumption. GHG emissions contribute to climate change and are expressed in metric tons of carbon dioxide equivalent (CO2e). GHG emissions are also released due to other activities in buildings, such as refrigeration and cooling, but those emissions are not calculated from energy benchmarking.
• Gross Floor Area (Building Size): Total interior floor space between the outside surfaces of a building’s enclosing walls, expressed in square feet (ft2). This includes tenant space, common areas, stairwells, basements, storage, and interior parking.
• Site Energy Use: Energy consumed on-site at a building, as measured by utility bills, and expressed in thousands of British Thermal Units (kBTU).
• Source Energy Use: Energy required to operate a property, including on-site consumption, as well as energy used for energy generation, transmission, and distribution; expressed in kBTU.
ADDITIONAL DATA SOURCESFigure 1 of this report includes multiple values for national medians of water use intensity by property type. These national median values were taken from the following sources:
• K-12 School, Multifamily Housing, and Office properties: U.S. EPA Portfolio Manager Water Use Tracking DataTrends report: https://www.energystar.gov/sites/default/files/buildings/tools/DataTrends_Water_20121002.pdf
• Healthcare, Lodging, Retail: Commercial Buildings Energy Consumption Survey (CBECS), Water Consumption in Large Buildings Summary, Table W1: https://www.eia.gov/consumption/commercial/reports/2012/water/
DATA VERIFICATIONUnder the Chicago Energy Benchmarking Ordinance, all covered properties are required to complete data verification once every three years, starting with the first year that the property is required to comply with the ordinance. Data verification is required to ensure that reported information is being tracked and reported correctly.
Data verification may be completed by in-house staff, and the use of a third party is not required. However, data verification must be completed by an individual holding a City-recognized license or training credential.8 City of Chicago-recognized credential programs must include training that covers benchmarking and the use of ENERGY STAR Portfolio Manager, as well as energy-efficient operations, measures, and technology.
Data verification takes the form of a signed Data Verification Checklist, a standard report generated automatically by the ENERGY STAR Portfolio Manager tool. It is important to note that verifiers are not required to complete the Indoor Environmental Standards section of the Data Verification Checklist, but are required to complete all other sections. Covered properties are not required to submit the signed Checklist, but they are required to include data verifier contact and credential details in the Property Notes field of their reported ENERGY STAR Portfolio Manager data. The ordinance requires covered properties to maintain benchmarking and data verification records for three years and to produce a copy of the signed Data Verification Checklist upon request by the City.
In 2017, any building team that had verified data in 2014, as well as any building team that had not ever verified data in the past, was required to conduct official verification. For the teams that submitted reports this year, nearly 75% of the building teams
8 See www.CityofChicago.org/EnergyBenchmarking for additional information

2 0 1 7 C H I CAG O E N ER GY B E N C H MA R K I N G R E P O RT WWW . C ITYO F C H I CAG O . O R G / E N ER GY B E N C H MA R K I N G
2 0 1 7 C H I CAG O E N ER GY B E N C H MA R K I N G R E P O RT WWW . C ITYO F C H I CAG O . O R G / E N ER GY B E N C H MA R K I N G
APPENDIX
that had never verified in the past did so this year. However, of those teams that had verified in 2014, only about half completed the required verification (and submitted the associated documentation) in 2017. The City has followed up with all teams that were required to complete verification and did not do so. Also, in future years, the City of Chicago may need to conduct additional outreach to remind all building teams that verification must be repeated once every 3 years.
One initial step is that the Covered Buildings List that is posted to the City’s Data Portal 9 every year will contain information about the next required year for data verification for all properties on the List. Future communications to each building team will also emphasize the need for verification to be conducted every three years.
DATA QUALITYEnergy benchmarking continues to rely on a self-reporting process (although data verification is required once every three years). While data quality can be difficult to determine, certain indicators continue to point to a high level of data quality for the information reported in Chicago. As in previous years, the City
and its partners complete automated reviews of all benchmarking submissions to identify missing information, errors, or possible data issues. If any issues are found, the Chicago Energy Benchmarking Help Center then sends a customized email to property representatives containing a list of issues, and links to documentation on how to address each issue. Property teams typically review their data, update any information that was entered in error, and then resubmit their report to the City. Once a submission is found to be complete and free of any potential data quality issues, the property representatives receive a final confirmation email.
Some of the indicators used to track data quality include the number of properties that use default, estimated, and temporary values. While using these values is allowed under the energy benchmarking ordinance, these values indicate a slightly lower level of data quality and accuracy. The use of each of these indicators has continued to fall, indicating ongoing improvements in data quality (See Table 3).
33
9 Found online at: https://data.cityofchicago.org/Environment-Sustainable-Development/Chicago-Energy-Benchmarking-Covered-Buildings/g5i5-yz37
Type of Values 2015 2016 2017
Estimated Values – Energy 9% 9% 5%
Default Values 40% 31% 24%
Temporary Values 5% 4% 3%
Table 3: Percentage of Analyzed Properties Using Estimated, Default, or Temporary Values
ANALYSIS METHODOLOGIESData Analysis MethodologyMost data analysis methodologies were unchanged from what was used in the 2015 and 2016 data analyses.
Data Cleansing and Summary of Analyzed PropertiesData cleansing was completed using the same process as
previous years. First, properties with duplicate submissions were removed, which can occur when multiple facility managers or owners submit reports for the same property. Once duplicates were removed, the dataset included 2,711 reporting properties (as of the analysis cutoff date, which was August 10, 2017).
2017 CHICAGO ENERGY BENCHMARKING REPORT WWW.CITYOFCHICAGO.ORG/ENERGYBENCHMARKING
WWW . C ITYO F C H I CAG O . O R G / E N ER GY B E N C H MA R K I N G 2 0 1 7 C H I CAG O E N ER GY B E N C H MA R K I N G R E P O RT
APPENDIX
34
Of these 2,711 reporting properties, 58 properties reported voluntarily (i.e. were not required to comply) and were removed from the dataset that was used for analysis, leaving 2,653 reports for ‘covered’ properties (i.e. those that were required to comply in 2017). From these 2,653 properties, 216 reports (eight percent) were removed from the data analysis due to being outliers or due to missing information.
The 216 records removed from the analysis either reported extreme values for key energy metrics or had other data issues as follows:
• 37 properties: Site EUI less than three kBTU/square foot or a Site EUI more the three standard deviations above or below the median site EUI for the property’s building sector (see Table 4 for a breakdown of the eight building sectors included in this analysis).
• 1 property: Site EUI greater than 2000 kBTU/square foot, which would be very unusual for any property required to report in Chicago.
• 126 properties: ENERGY STAR score of 1, 2, 99, or 100. Properties with scores of 99 or 100 were removed if they had not been ENERGY STAR certified in 2015 or 2016. All properties with scores of 1 or 2 were removed.
• 27 properties: Missing electricity use.
• 25 properties: Missing Site EUI metrics.
This data cleansing process resulted in 2,437 covered building data submissions that provide the basis for the analysis presented in this report, an increase of eight percent over the analyzed properties in 2016, which included 2,259 analyzed properties.
BUILDING SECTORSTable 4 shows the eight building sectors included in this report’s analysis and the ENERGY STAR Portfolio Manager property types included in each sector. The number of properties analyzed, total floor area, median ENERGY STAR scores, and median site and source EUI values are also provided for each Portfolio Manager property type or property type grouping.
Properties with multiple uses are typically assigned to the space use that comprises 50% or more of the total floor area. If no single space use makes up 50% or more of the property’s floor area, then the property is considered to be Mixed Use, which is included in the “Other” property type category.

2 0 1 7 C H I CAG O E N ER GY B E N C H MA R K I N G R E P O RT WWW . C ITYO F C H I CAG O . O R G / E N ER GY B E N C H MA R K I N G
2 0 1 7 C H I CAG O E N ER GY B E N C H MA R K I N G R E P O RT WWW . C ITYO F C H I CAG O . O R G / E N ER GY B E N C H MA R K I N G
APPENDIX
35
Building Sector
Primary ENERGY STAR Portfolio Manager Property Type(s)
Number ofProperties Included in Analysis
Total Floor Area (Gross ft2) – Buildings and Parking
Median SiteEUI (kBTU/square foot)
MedianSource EUI (kBTU/square foot)
Median ENERGYSTAR Score (1-100 rating)
Office
Bank Branch and Financial Office 7 5,160,069 105 258 55
Office, 50,000 ft2 – 99,999 ft2 68 4,981,467 78 192 69
Office, 100,000 ft2 - 249,999 ft2 89 14,633,215 81 194 71
Office, ≥ 250,000 ft2 156 146,316,613 71 182 83
All Offices 320 171,091,363 77 185 79
Multifamily Housing
Multifamily Housing, 50,000 ft2 – 99,999 ft2 394 27,955,351 77 123 70
Multifamily Housing,100,000 ft2 - 249,999 ft2 407 65,185,719 77 132 63
Multifamily Housing, ≥ 250,000 ft2 366 189,496,314 80 140 50
All Multifamily Housing 1,167 282,637,383 78 132 61
K-12Schools
K-12 School, 50,000 ft2 – 99,999 ft2 204 15,206,494 74 137 62
K-12 School, 100,000 ft2 - 249,999 ft2 146 20,947,155 69 129 63
K-12 School, ≥ 250,000 ft2 24 8,611,667 78 141 69
All K-12 Schools 374 44,765,316 72 132 63
Healthcare
Ambulatory Surgical Center; Outpatient Rehabilitation/Physical Therapy; and Urgent Care/Clinic/Other Outpatient
4 816,209 172 384 NA
Hospital (General Medical & Surgical) 25 26,714,561 234 447 47
Medical Office 14 3,342,915 107 262 44
Other - Specialty Hospital 4 538,546 198 385 NA
All Healthcare 47 31,412,231 208 414 47
Higher Education
College/University, 50,000 ft2 – 99,999 ft2 25 1,799,507 87 199 NA
College/University, 100,000 ft2 - 249,999 ft2 37 5,731,478 93 197 NA
College/University, ≥ 250,000 ft2 14 10,090,449 100 204 NA
All College/University 76 17,621,434 92 198 NA
Lodging
Hotel 72 29,459,005 109 233 39
Other - Lodging/Residential andResidence Hall/Dormitory 29 5,197,561 86 169 66
Residential Care Facility 11 1,325,466 152 250 NA
Senior Care Community 47 3,867,056 97 170 38
All Lodging 159 39,849,088 103 196 42
Table 4: Detailed Building Sector Description andEnergy Performance Metrics by Sector for Analyzed Properties
(Continued on following page.)

2017 CHICAGO ENERGY BENCHMARKING REPORT WWW.CITYOFCHICAGO.ORG/ENERGYBENCHMARKING
WWW . C ITYO F C H I CAG O . O R G / E N ER GY B E N C H MA R K I N G 2 0 1 7 C H I CAG O E N ER GY B E N C H MA R K I N G R E P O RT
APPENDIX
36
Building Sector
Primary ENERGY STAR Portfolio Manager Property Type(s)
Number ofProperties Included in Analysis
Total Floor Area (Gross ft2) – Buildings and Parking
Median SiteEUI (kBTU/square foot)
MedianSource EUI (kBTU/square foot)
Median ENERGYSTAR Score (1-100 rating)
Retail
Automobile Dealership 4 1,067,608 82 170 NA
Enclosed Mall and Other - Mall 13 4,222,286 104 300 NA
Lifestyle Center and Strip Mall 24 4,797,378 97 245 NA
Retail Store 51 11,948,740 80 203 72
Supermarket/Grocery Store 43 3,669,469 250 587 63
Wholesale Club/Supercenter; Other – Services; and Repair Services (Vehicle, Shoe, Locksmith, etc.)
11 1,548,566 141 314 36
All Retail 146 27,254,047 106 276 63
Other
Adult Education; Other – Education;and Preschool/Daycare 7 1,231,429 57 110 NA
Convention Center and Other-Entertainment/Public Assembly 7 11,194,190 88 181 NA
Courthouse; Other - Public Services; and Prison/Incarceration 6 7,882,641 96 201 76
Fitness Center/Health Club/Gym 9 1,313,893 178 323 NA
Indoor Arena and Other - Recreation 16 3,724,633 125 288 NA
Laboratory 25 4,023,858 323 663 NA
Library 8 2,066,559 102 263 NA
Mixed Use 28 20,771,881 86 202 72
Movie Theater; Performing Arts; and Social/Meeting Hall 12 1,558,610 149 293 NA
Museum 4 2,673,246 118 273 NA
Other 14 3,929,819 78 168 NA
Worship Facility 11 1,132,576 69 135 34
All Other Properties 148 61,663,335 101 227 57
Grand Total 2,437 676,171,434 80 150 64
(Continued from previous page.)

2 0 1 7 C H I CAG O E N ER GY B E N C H MA R K I N G R E P O RT WWW . C ITYO F C H I CAG O . O R G / E N ER GY B E N C H MA R K I N G
2 0 1 7 C H I CAG O E N ER GY B E N C H MA R K I N G R E P O RT WWW . C ITYO F C H I CAG O . O R G / E N ER GY B E N C H MA R K I N G
APPENDIX
TREND ANALYSIS METHODOLOGY The trend analysis presented in this report applies to individual properties that reported consecutively over the past two, three, or four years. Thus, properties included in the trend analysis for the past three years reported in 2015, 2016, and 2017. Those properties included in the trend analysis for the past two years reported in 2016 and 2017. Weather-normalized site energy use was used for the trend analysis to control for weather variations between the calendar years of the comparison.10
Trend Analysis for Properties Reportingin the Past Four Consecutive Years
In 2015, 212 properties were included in the multi-year analysis for properties that had reported in both 2014 and 2015. Of these 212 properties, 12 were removed for the analysis in 2016, and an additional 16 were removed this year in 2017, for a total cohort of 184 properties that have reported for four consecutive years since 2014.
A total of six properties were not analyzed in 2017 because they did not submit reports by the data analysis cutoff. An additional five were identified as an outlier or had missing information, and five other reports showed a 50% or greater increase or decrease in weather normalized site EUI.
Trend Analysis for PropertiesReporting in the Past Three Consecutive Years
For the trend analysis covering three consecutive years, a total of 1,083 properties reported for the first time in 2015 and reported again in 2016. Of these 1,083 properties, 76 were removed from the trend analysis in 2016, and an additional 108 were removed in 2017.
In 2017, there were 20 properties that did not report (which had previously reported in 2015 and 2016). Another 21 properties received a permanent or temporary exemption, and 25 were identified as an outlier or had missing information. A total of 41 properties showed a 50% or greater increase or decrease in weather normalized site EUI, and one additional property began reporting as part of a larger campus.
Removing these 108 properties left 899 properties in the trend analysis for buildings reporting for three consecutive years.
Trend Analysis for Properties Reportingin the Past Two Consecutive Years
In 2017, a total of 960 properties reported that had also submitted reports in 2016 for the first time. Of these 960, a total of 323 reports were excluded from the trend analysis. The majority of reports excluded, 207 reports, were not analyzed in 2016 due to being identified as outliers or containing missing information. An additional 33 reports were not analyzed in 2017 due to the same reasons. Another 49 reports were missing weather normalized metrics, and 34 reports showed a 50% or greater increase or decrease in weather normalized site EUI. Once these 323 reports were removed, a total of 637 properties were included in the trend analysis for buildings reporting for two consecutive years.
Calculation Methodologies
The total weather normalized site energy use (in kBtu) for the sample properties was summed for the years included in each analysis. The total for 2017 was then subtracted from the total in the earliest year available. These calculations indicate a decrease in total weather-normalized site energy use for two of the three groups of properties analyzed.
Table 5 shows the total weather-normalized site energy use (in KBtu) for each calendar year included in the analysis for these three groups of buildings, and the total percentage reductions achieved for weather normalized site energy use.
The metrics for cost savings are based on the percentage reduction of weather normalized site energy use. This percentage reduction in weather normalized site energy use was applied to electricity and natural gas use to calculate the annual reduction of these two fuels across each cohort of buildings.
These potential electricity and natural gas reductions were multiplied by estimated Chicago energy costs for each fuel and building type. Estimated energy rates are based on the
37
10 For more information, see the ENERGY STAR Portfolio Manager Technical Reference on Weather and Climate:
https://portfoliomanager.energystar.gov/pdf/reference/Climate%20and%20Weather.pdf

2017 CHICAGO ENERGY BENCHMARKING REPORT WWW.CITYOFCHICAGO.ORG/ENERGYBENCHMARKING
WWW . C ITYO F C H I CAG O . O R G / E N ER GY B E N C H MA R K I N G 2 0 1 7 C H I CAG O E N ER GY B E N C H MA R K I N G R E P O RT
APPENDIX
38
average January – December 2016 commercial electricity and natural gas costs in the State of Illinois, as published by the U.S. Department of Energy’s Energy Information Administration.11 To reflect local Chicago energy market conditions (including some properties’ ability to negotiate lower energy rates), the 2016 average state commercial energy prices were reduced by 15%.
GHG emission reductions were calculated directly from ENERGY STAR Portfolio Manager results.
For the properties reporting for four consecutive years, the analysis used the total change in weather normalized site energy
use intensity (EUI) instead of total weather normalized site energy use, to calculate cost savings. The EUI metric was used because this group of properties saw a one percent increase in total reported square footage, and the EUI metric normalizes for square footage, while total weather normalized site energy use does not normalize for square footage. The other groups of properties did not see any significant changes in reported square footage, and so the weather normalized site energy metric was used to calculate cost savings for those groups. n
11 U.S. Department of Energy Information Administration average 2015 electricity and natural gas rates for the State of Illinois:
http://www.eia.gov/electricity/monthly/epm_table_grapher.cfm?t=epmt_5_6_a,
http://www.eia.gov/dnav/ng/ng_sum_lsum_dcu_sIL_m.htm
Metric Used: Weather-normalized site energy use (kBTU)
Group2014Reported Data (from CY 2013)
2015Reported Data (from CY 2014)
2016Reported Data (from CY 2015)
2017Reported Data (from CY 2016)
Change between First Year and 2016 Reported Data
Percentage Change
Properties reporting for 2 consecutive years (2016 and 2017) (n=637)
Not available Not available 7,031,179,391 kBTU
7,072,623,269 kBTU
41,443,878kBTU 0.6% increase
Properties reporting for 3 consecutive years (2015, 2016, and 2017) (n=899)
Not available 21,336,910,924 kBTU
20,850,810,218 kBTU
21,061,896,210 kBTU
(275,014,714) kBTU -1.3%
Properties reporting for 4 consecutive years (2014, 2015, 2016, and 2017) (n=184)
18,114,674,229 kBTU
17,920,894,846 kBTU
17,406,882,909 kBTU
17,596,610,707 kBTU
(518,063,522) kBTU -2.9%
Table 5: Year-Over-Year, Same Building Trend Analysis


CH ICAGO ENERGY
B E N C H M A R K I N G
2 0 1 7
R E P O R T
C IT Y O F C H I C A G O • M AY O R R A H M E M A N U E L