2017 customer satisfaction survey report
TRANSCRIPT
2017 Customer Satisfaction
Survey
Report

Port Stephens Council 2017 Customer Satisfaction Survey Report 2
© Port Stephens Council 2017
Port Stephens Council 2017 Customer Satisfaction Survey Report 3
Customer Satisfaction Survey 2017
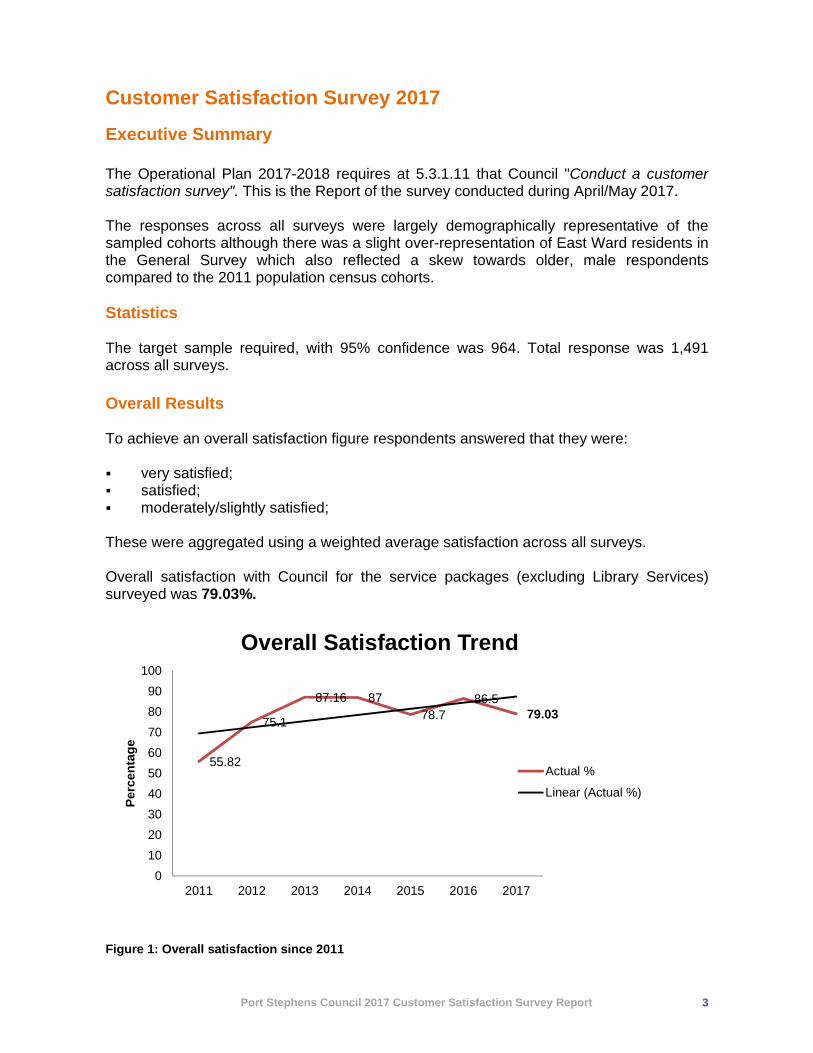
Executive Summary The Operational Plan 2017-2018 requires at 5.3.1.11 that Council "Conduct a customer satisfaction survey". This is the Report of the survey conducted during April/May 2017. The responses across all surveys were largely demographically representative of the sampled cohorts although there was a slight over-representation of East Ward residents in the General Survey which also reflected a skew towards older, male respondents compared to the 2011 population census cohorts. Statistics The target sample required, with 95% confidence was 964. Total response was 1,491 across all surveys. Overall Results To achieve an overall satisfaction figure respondents answered that they were: very satisfied; satisfied; moderately/slightly satisfied; These were aggregated using a weighted average satisfaction across all surveys. Overall satisfaction with Council for the service packages (excluding Library Services) surveyed was 79.03%.
Figure 1: Overall satisfaction since 2011
55.82
75.1
87.16 8778.7
86.579.03
0
10
20
30
40
50
60
70
80
90
100
2011 2012 2013 2014 2015 2016 2017
Pe
rcen
tag
e
Overall Satisfaction Trend
Actual %
Linear (Actual %)

Port Stephens Council 2017 Customer Satisfaction Survey Report 4
In terms of overall satisfaction with Council, slightly more males (80.7%) were satisfied compared to 77.6% of females, with younger females and older males being more satisfied that others in their genders (based on the General Survey outcomes only). Other surveys did not identify age or gender so the General Survey may be taken as a guide.
Individual Results The table below shows individual services/facilities by level of overall satisfaction. Table 1: Satisfaction scores
The Report that follows provides detailed information on the areas surveyed.
Facilities/Services Satisfaction
Score %
Libraries 98.0%
Children's Services 87.5 – 100% Garbage collection services 93.9%
Sport & Recreational facilities 89.2%
Swimming pools 87.0%
Holiday Parks 81 – 94% Community public halls 92.5%
Playground equipment 83.5% Maintaining parks and gardens 67.4%
Development and Building Services 90.0%
Managing traffic flow (eg lights, roundabouts, street signs) 77.2%
Roadside maintenance (eg trees, litter, slashing) 80.3% Public toilet amenities (Council-owned park/community amenities - not those in shopping centres)
73.6%
Managing nature reserves, wetlands, beaches & foreshores 88.0% Access to waste depots and recycling 76.5%
Managing street trees 83.4% Maintaining footpaths 70.0%
Maintaining cycleways/walking tracks 82.4% Maintaining local roads 67.4%
Managing storm water drainage systems 78.4% Controlling weeds 81.9%
Ranger services (eg animal management) 70.6% Managing illegal dumping 53.9%
Ranger services (parking) 74.3%

Port Stephens Council 2017 Customer Satisfaction Survey Report 5
Customer Satisfaction Survey 2017 General Survey This survey was conducted from 1 to 31 May 2017. The targeted response for this General Survey was 640 and actual response was 877. (The total target for all surveys was 964 responses). Not all respondents answered all questions. Percentage satisfaction results as shown in Table 1 and below relate to those respondents who answered the question; they exclude "don't know" and "don't use" responses. Demographics Of those that answered the age/gender question (n= 803) 52.2% were females and 47.8% were males. (Census 2011: Males 49.2%, Females 50.8%). The graph below shows the age profile of respondents compared to the population (Census 2011) and with 2016 respondents' profile.
Figure 2: Demographic Profile of Respondents There was a skew towards older residents and this age skew reflects that younger demographics may not have participated as the social media campaign was not implemented until later in the survey period. Locality Respondents answered the questions related to where in Port Stephens they lived (n=801). The overall sample of 801 respondents who answered geo-demographic questions was numerically statistically representative however there was a skew towards those residing in the east of the Local Government Area (LGA). This geographical skew continues a long- established trend for more responses from more densely settled areas of the LGA, as Raymond Terrace and Medowie responses are relatively statistically representative.1
1 ABS Census 2011
0
5
10
15
20
25
30
35
40
0-18 19-34 35-50 51-65 >65
Respondents by Age - comparison with Census and 2016
Population
2016
2017
Port Stephens Council 2017 Customer Satisfaction Survey Report 6
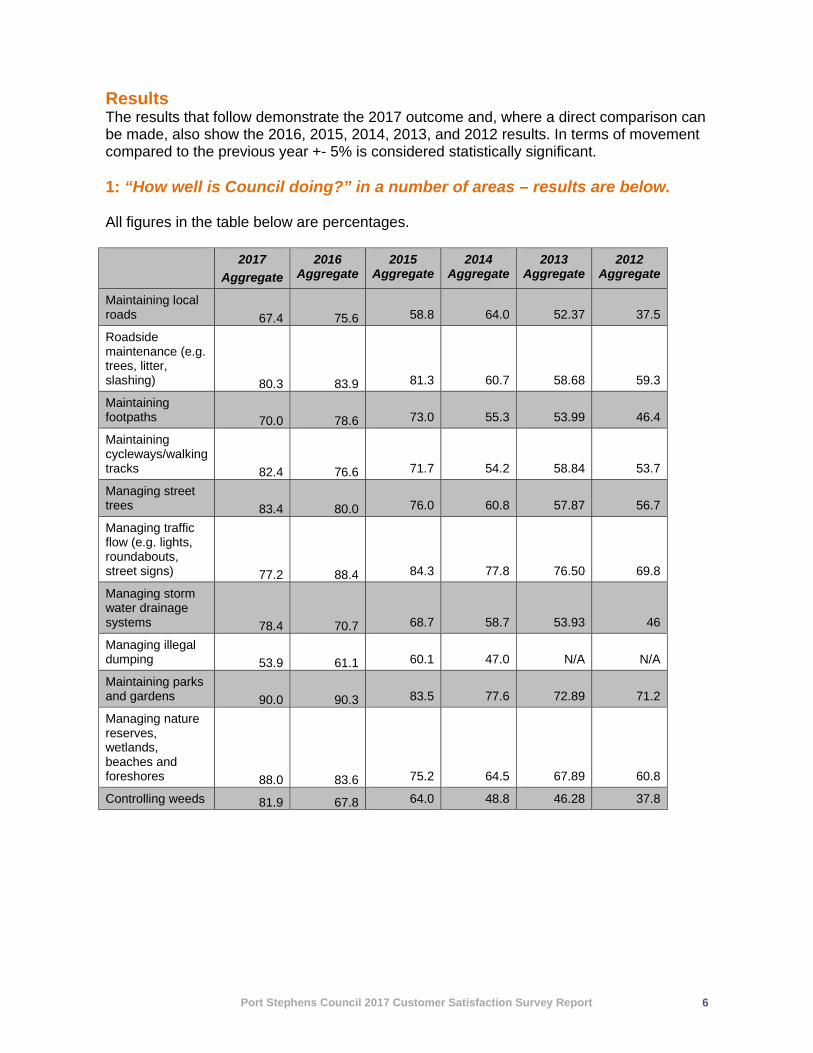
Results The results that follow demonstrate the 2017 outcome and, where a direct comparison can be made, also show the 2016, 2015, 2014, 2013, and 2012 results. In terms of movement compared to the previous year +- 5% is considered statistically significant. 1: “How well is Council doing?” in a number of areas – results are below. All figures in the table below are percentages. 2017
Aggregate
2016 Aggregate
2015 Aggregate
2014 Aggregate
2013 Aggregate
2012 Aggregate
Maintaining local roads 67.4 75.6 58.8 64.0 52.37 37.5
Roadside maintenance (e.g. trees, litter, slashing) 80.3 83.9 81.3 60.7 58.68 59.3
Maintaining footpaths 70.0 78.6 73.0 55.3 53.99 46.4
Maintaining cycleways/walking tracks 82.4 76.6 71.7 54.2 58.84 53.7
Managing street trees 83.4 80.0 76.0 60.8 57.87 56.7
Managing traffic flow (e.g. lights, roundabouts, street signs) 77.2 88.4 84.3 77.8 76.50 69.8
Managing storm water drainage systems 78.4 70.7 68.7 58.7 53.93 46
Managing illegal dumping 53.9 61.1 60.1 47.0 N/A N/A
Maintaining parks and gardens 90.0 90.3 83.5 77.6 72.89 71.2
Managing nature reserves, wetlands, beaches and foreshores 88.0 83.6 75.2 64.5 67.89 60.8
Controlling weeds 81.9 67.8 64.0 48.8 46.28 37.8
Port Stephens Council 2017 Customer Satisfaction Survey Report 7
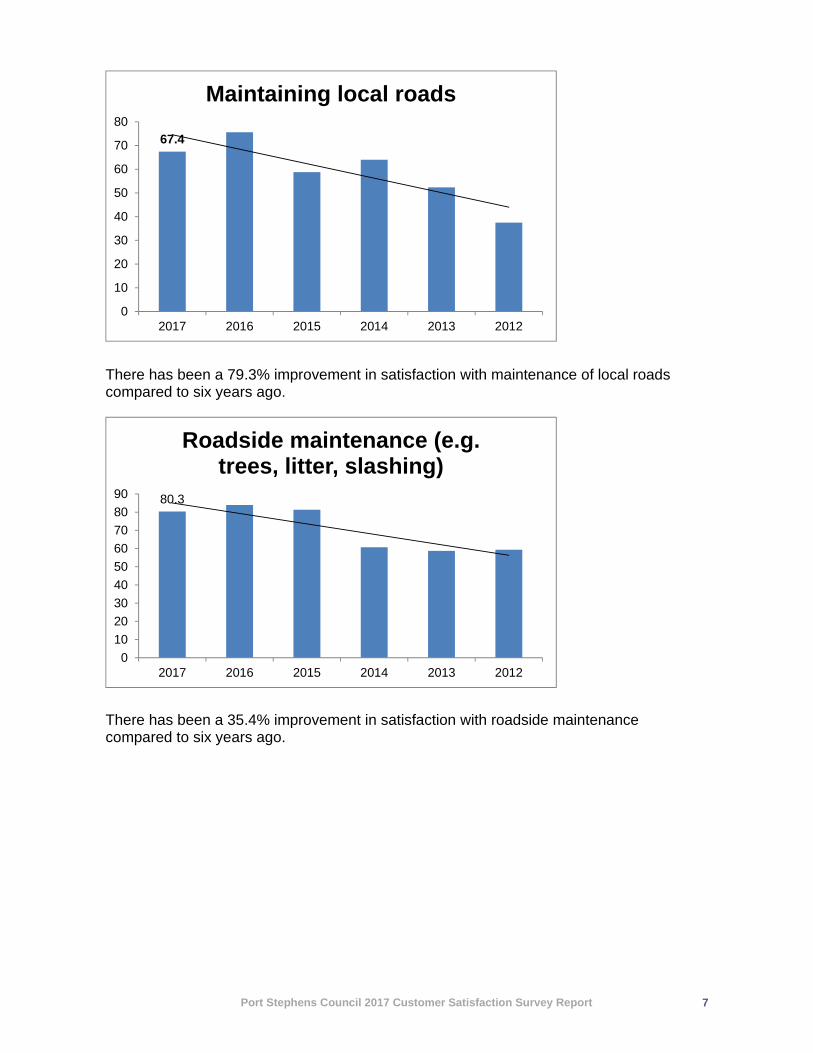
There has been a 79.3% improvement in satisfaction with maintenance of local roads compared to six years ago.
There has been a 35.4% improvement in satisfaction with roadside maintenance compared to six years ago.
67.4
0
10
20
30
40
50
60
70
80
2017 2016 2015 2014 2013 2012
Maintaining local roads
80.3
0
10
20
30
40
50
60
70
80
90
2017 2016 2015 2014 2013 2012
Roadside maintenance (e.g. trees, litter, slashing)
Port Stephens Council 2017 Customer Satisfaction Survey Report 8
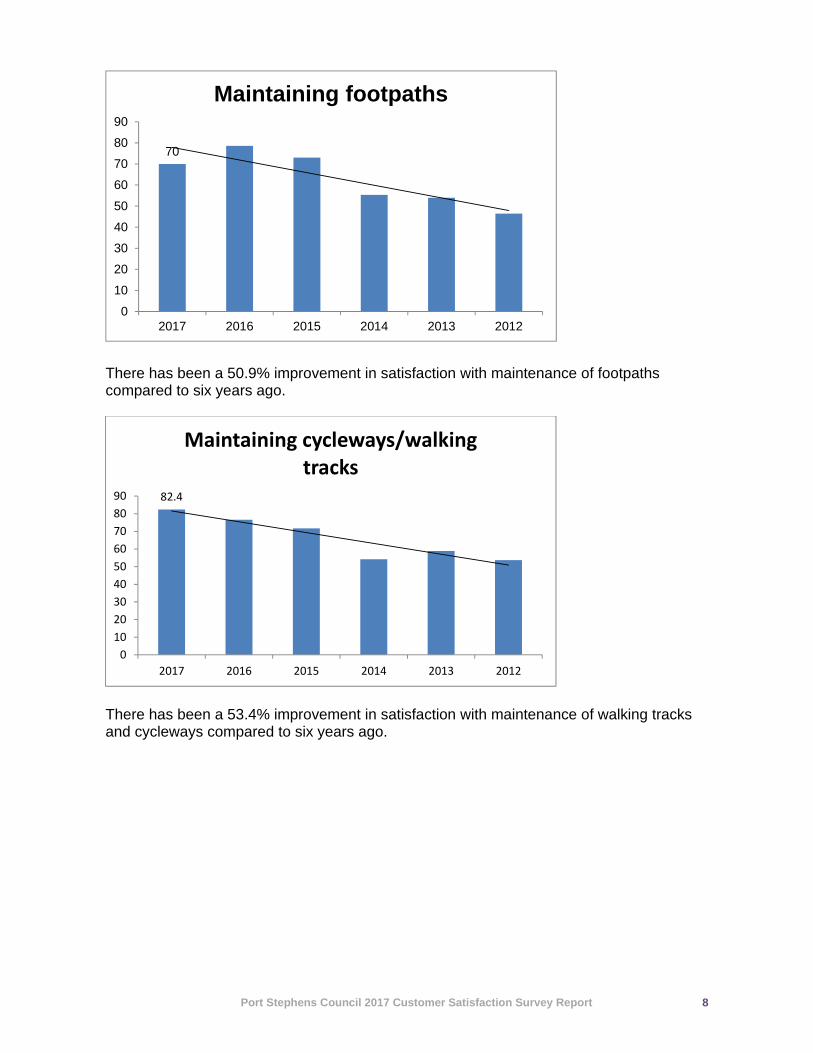
There has been a 50.9% improvement in satisfaction with maintenance of footpaths compared to six years ago.
There has been a 53.4% improvement in satisfaction with maintenance of walking tracks and cycleways compared to six years ago.
82.4
0
10
20
30
40
50
60
70
80
90
2017 2016 2015 2014 2013 2012
Maintaining cycleways/walking tracks
70
0
10
20
30
40
50
60
70
80
90
2017 2016 2015 2014 2013 2012
Maintaining footpaths
Port Stephens Council 2017 Customer Satisfaction Survey Report 9
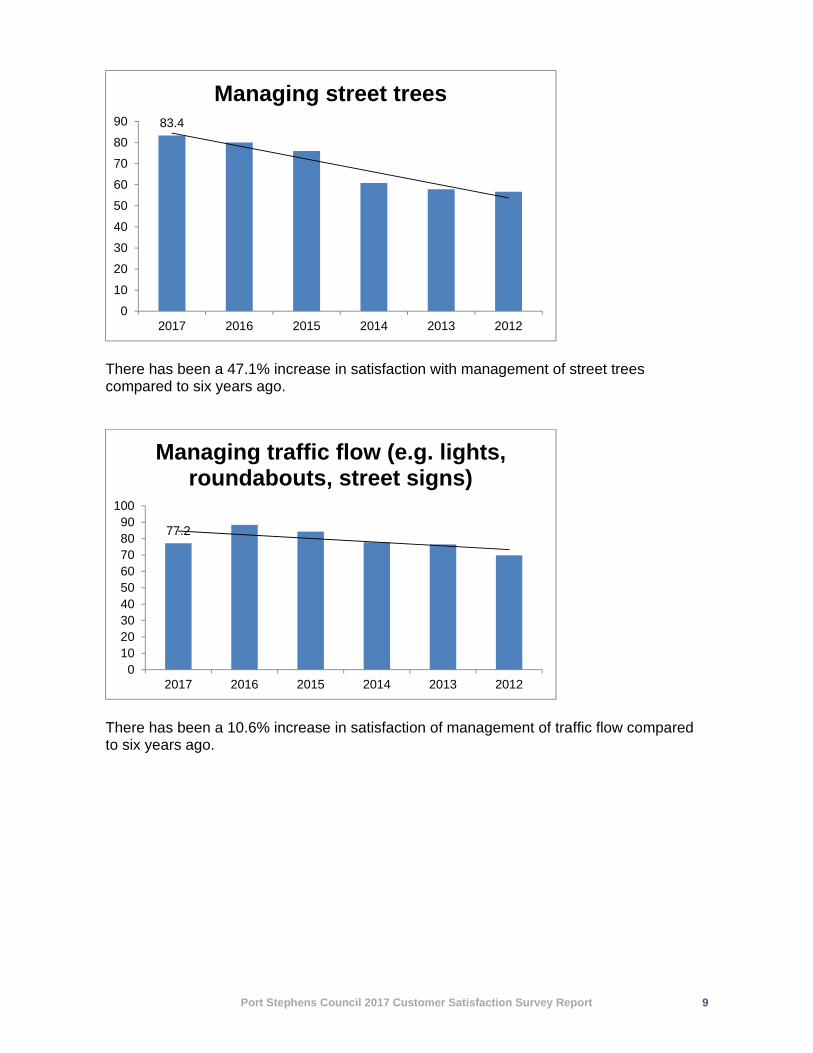
There has been a 47.1% increase in satisfaction with management of street trees compared to six years ago.
There has been a 10.6% increase in satisfaction of management of traffic flow compared to six years ago.
83.4
0
10
20
30
40
50
60
70
80
90
2017 2016 2015 2014 2013 2012
Managing street trees
77.2
0102030405060708090
100
2017 2016 2015 2014 2013 2012
Managing traffic flow (e.g. lights, roundabouts, street signs)
Port Stephens Council 2017 Customer Satisfaction Survey Report 10
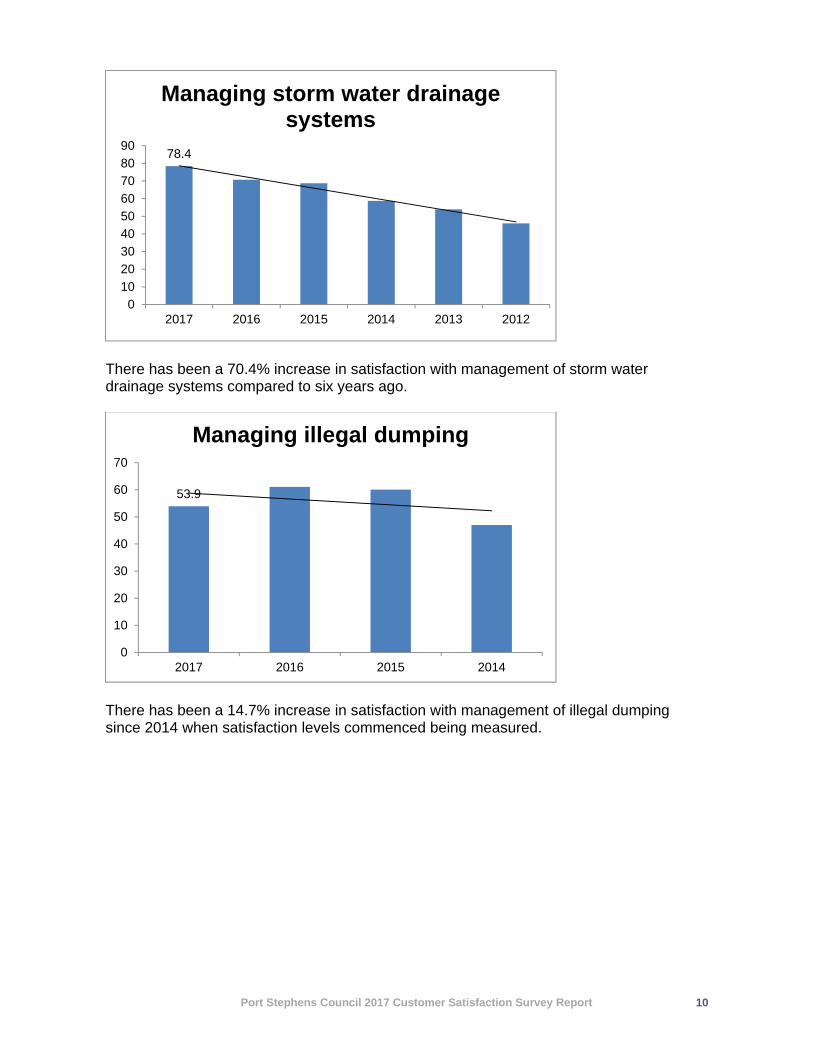
There has been a 70.4% increase in satisfaction with management of storm water drainage systems compared to six years ago.
There has been a 14.7% increase in satisfaction with management of illegal dumping since 2014 when satisfaction levels commenced being measured.
78.4
0
10
20
30
40
50
60
70
80
90
2017 2016 2015 2014 2013 2012
Managing storm water drainage systems
53.9
0
10
20
30
40
50
60
70
2017 2016 2015 2014
Managing illegal dumping

Port Stephens Council 2017 Customer Satisfaction Survey Report 11
There has been a 26.4% increase in satisfaction with maintenance of parks and gardens compared to six years ago.
There has been a 44.7% increase in satisfaction with management of reserves etc compared to six years ago.
90
0
10
20
30
40
50
60
70
80
90
100
2017 2016 2015 2014 2013 2012
Maintaining parks and gardens
88
0
20
40
60
80
100
2017 2016 2015 2014 2013 2012
Managing nature reserves, wetlands, beaches and
foreshores

Port Stephens Council 2017 Customer Satisfaction Survey Report 12
There has been a 116.7% increase in satisfaction with controlling weeds compared to six years ago. 2: Required respondents to indicate how satisfied they were with the following services. Summary:
81.9
0
10
20
30
40
50
60
70
80
90
2017 2016 2015 2014 2013 2012
Controlling weeds
2017
Aggregate
2016 Aggregate
2015 Aggregate
2014 Aggregate
2013 Aggregate
2012 Aggregate
Public toilet amenities
(Council-owned park/community amenities - not
those in shopping centres) 73.6 83.7 73.9 82.5 81.52 75.2
Playground equipment 83.5 90.7 81.8 87.6 88.15 84.4
Community Public Halls 92.5 90.7 87.0 91.6 91.14 88.8
Sport and Recreational
Facilities 89.2 93.1 83.2 92.1 93.77 91.2
Swimming Pools 87.0 92.8 87.2 93.8 91.38 89.9

Port Stephens Council 2017 Customer Satisfaction Survey Report 13
There has been a 2.1% decrease in satisfaction with Council-owned public amenities compared to six years ago.
There has been a 1.0% decrease in satisfaction with playground equipment compared to six years ago.
73.6
0
20
40
60
80
100
2017 2016 2015 2014 2013 2012
Public toilet amenities (Council-owned park/community amenities - not those in
shopping centres)
83.5
0
10
20
30
40
50
60
70
80
90
100
2017 2016 2015 2014 2013 2012
Playground equipment

Port Stephens Council 2017 Customer Satisfaction Survey Report 14
There has been a 4.2% increase in satisfaction with community public halls compared to six years ago.
There has been a decrease of 2.2% in satisfaction with sport and recreation facilities compared to six years ago.
92.5
0
10
20
30
40
50
60
70
80
90
100
2017 2016 2015 2014 2013 2012
Community Public Halls
89.2
0
10
20
30
40
50
60
70
80
90
100
2017 2016 2015 2014 2013 2012
Sport and Recreational Facilities

Port Stephens Council 2017 Customer Satisfaction Survey Report 15
There has been a 3.2% decrease in satisfaction with swimming pools compared to six years ago. 3: Respondents were asked how well Council delivered some services.
In 2014 the Tilligerry Community Library was included for the first time, and therefore no comparisons with previous years are valid.
*Services not directly comparable; or not collected in this format.
87
0
10
20
30
40
50
60
70
80
90
100
2017 2016 2015 2014 2013 2012
Swimming Pools
Figures are percentages
2017
Aggregate
2016 Aggregate
2015 Aggregate
2014 Aggregate
2013 Aggregate
2012 Aggregate
Library Services 98.0 98.6 99.3 72.4
Children's Services (all services) 87.5 - 100 98.3 98.0 99.6 99.8 *
Ranger Services (e.g. Animal
Management) 70.6 62.6 62.6 63.6 60.4 65.5
Rangers Services (Parking) 74.3 59.5 61.5 60.1 61.6 56.3
Garbage Collection Services 93.9 93.5 86.1 93.3 92.7 92.3
Access to waste depots and waste transfer stations 76.5 81.7 72.2 82.1 76.5 74.3

Port Stephens Council 2017 Customer Satisfaction Survey Report 16
4: How safe do you feel in the following situations?
5: How satisfied are you with the built environment of Port Stephens LGA? (N = 821)
There was a slight decrease in the very satisfied and satisfied categories compared to 2016. 6: How satisfied are you with the management of the Environment of the Port Stephens LGA? (n = 828). Note: This question was given a context – Council was not solely responsible for management of the environment.
There was a slight decrease in very satisfied and satisfied compared to 2016.
6.0%
36.5%
31.5%
15.3%
10.6%
Very Satisfied
Satisfied
Somewhat Satisfied
Somewhat Unsatisfied
Unsatisfied
4.8%
36.6%
32.5%
10.5%
6.2%
6.4%
3.0%
Very Satisfied
Satisfied
Somewhat Satisfied
Somewhat Unsatisfied
Unsatisfied
Very Unsatisfied
Don't know
N = 843 Very safe Safe Moderately
safe Not very
safe Unsafe
At home during the day 420 327 79 14 2 At home at night 324 338 138 32 9 In your neighbourhood during the day 392 321 114 14 1 In your neighbourhood during the night 243 320 197 68 14

Port Stephens Council 2017 Customer Satisfaction Survey Report 17
7: How would you rate the appearance of your neighbourhood?
N = 813
Very satisfactory/Very well maintained 12.5% Satisfactory/well maintained 59.5% Unsatisfactory/poorly maintained 23.5%
Very unsatisfactory/very poorly maintained 4.4%
8: Do you feel you have opportunities to have genuine input to Council's decision-making on policies and matters that affect you? (2017 N = 815)
4.28.7
24.3
33.3
17.7
11.9
05
10152025303540
Percentage of Respondents
2017
2016

Port Stephens Council 2017 Customer Satisfaction Survey Report 18
9: How quickly do Council staff respond to your needs/queries/problems?
9: Where do you most usually get information about Council activities (select all that apply)?
6.4%
25.1%
24.1%
22.0%
22.3%
Response Percentage N = 812
Extremely quickly
Quickly
Slightly quickly
Slowly or not at all
Not applicable - don'tcontact Council
N = 810 Responses No.
Council's website 304 Council's Facebook 152 Council's Twitter 8 Council's email newsletter (Informe, BizLink etc) 71 At Council locations (Administration Centre, Libraries etc) 59 Council Notices in Port Stephens Examiner 442 News/editorial in Port Stephens Examiner 421 News/editorial in the Newcastle Herald 81 Local radio news 226 Local television news 170 Other (please specify) 111

Port Stephens Council 2017 Customer Satisfaction Survey Report 19
10: Is Council's web site easy to use to access information or interact with Council? N = 564 (response by those who accessed the website; total response 806).
11: How well do you think Council is communicating with the community?
N = 812 Very well Well
Moderately well
Not very well Poorly
Don't Know
In the Port Stephens Examiner - Council Page 80 236 286 79 50 77
On Council's web site 60 209 193 56 28 241 Through social media sites such as Facebook & Twitter 31 91 130 59 39 438
Through Council's Customer Service Staff 62 148 149 58 58 313
80.384.4
19.715.6
0.0
10.0
20.0
30.0
40.0
50.0
60.0
70.0
80.0
90.0
2017 2016
Yes
No

Port Stephens Council 2017 Customer Satisfaction Survey Report 20
12: What is your preferred means of communicating with Council? (Respondents could choose more than one option).
N = 818 Response Percent
In Person at Council's Administration Building 20.3% By Telephone 49.9% In writing (letter) 7.1% In writing (email) 43.9% Via Council's Facebook page 11.7% On Twitter 1.1% Don't contact Council 10.1% 13: Overall, how confident are you that Council is managing its resources (workforce, assets, and finances) well?
4.6
21.2
29.5
18.8
9.1
16.8
0.0
5.0
10.0
15.0
20.0
25.0
30.0
35.0
Veryconfident
Confident Somewhatconfident
Not veryconfident
Noconfidence
at all
Don't know
Workforce
4.7
18.9
30.6
17.9
9.8
18.1
0.0
5.0
10.0
15.0
20.0
25.0
30.0
35.0
Veryconfident
Confident Somewhatconfident
Not veryconfident
Noconfidence
at all
Don't know
Assets
Port Stephens Council 2017 Customer Satisfaction Survey Report 21
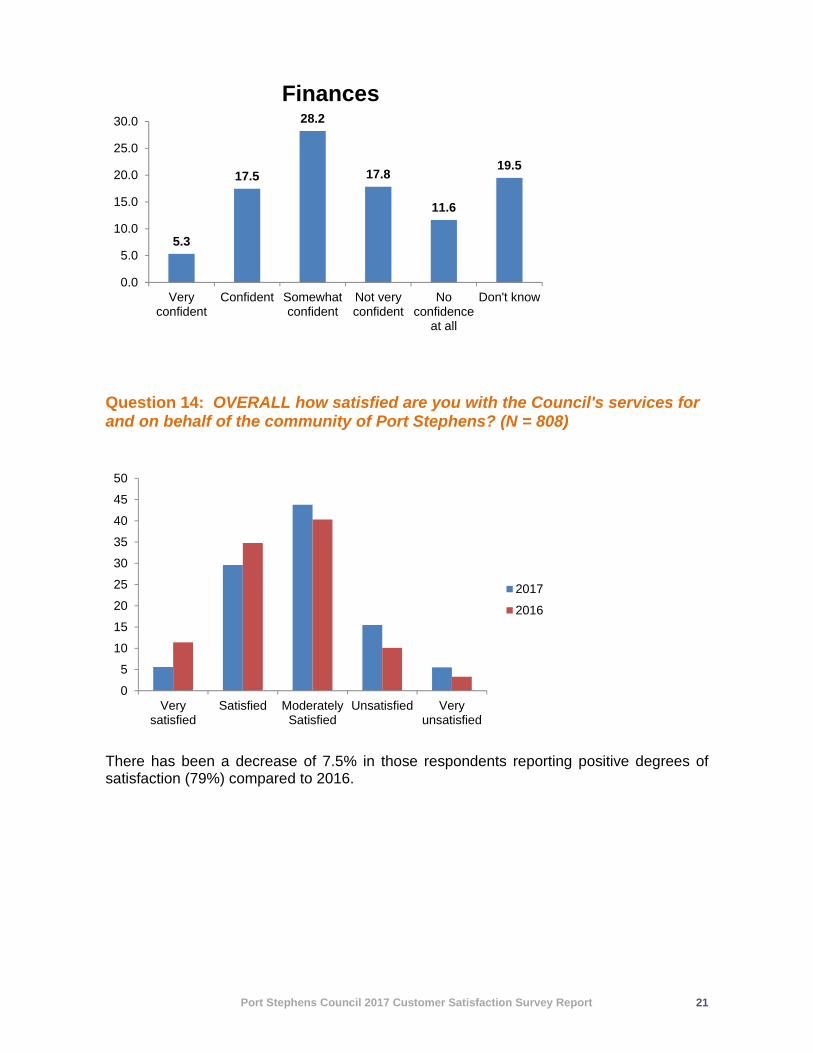
Question 14: OVERALL how satisfied are you with the Council's services for and on behalf of the community of Port Stephens? (N = 808)
There has been a decrease of 7.5% in those respondents reporting positive degrees of satisfaction (79%) compared to 2016.
5.3
17.5
28.2
17.8
11.6
19.5
0.0
5.0
10.0
15.0
20.0
25.0
30.0
Veryconfident
Confident Somewhatconfident
Not veryconfident
Noconfidence
at all
Don't know
Finances
0
5
10
15
20
25
30
35
40
45
50
Verysatisfied
Satisfied ModeratelySatisfied
Unsatisfied Veryunsatisfied
2017
2016