2017 ethiopia - reliefweb · agriculture 17 ... plw pregnant and lactating women ... while ethiopia...
TRANSCRIPT

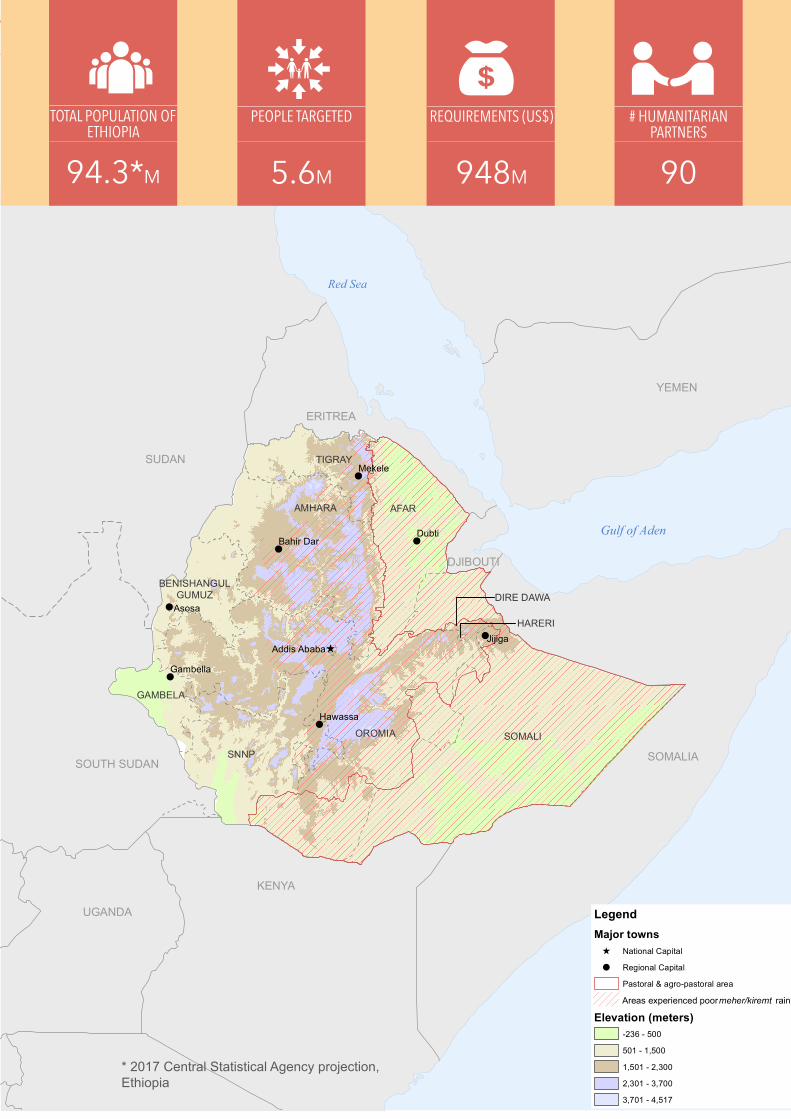
ETHIOPIA Humanitarian Requirements Document2017
Joint Government and Humanitarian Partners’ DocumentP
hoto
cre
dit:
Jake
Lye
ll, C
hild
Fund
02
PART I:
5
!
!
!
!
^
!
!
!
UGANDA
KENYA
SUDAN
SOUTH SUDAN SOMALIA
DJIBOUTI
ERITREA
Red Sea
YEMEN
Gulf of Aden
AFARAMHARA
BENISHANGULGUMUZ DIRE DAWA
GAMBELA
HARERI
OROMIA
SNNP
SOMALI
TIGRAYMekele
Bahir Dar
Asosa
JijigaAddis Ababa
Gambella
Hawassa
Dubti
LegendMajor towns^ National Capital
! Regional Capital
Pastoral & agro-pastoral area
Elevation (meters)-236 - 500
501 - 1,500
1,501 - 2,300
2,301 - 3,700
3,701 - 4,517
Areas experienced poor rains meher/kiremt
PEOPLE TARGETED
5.6M
REQUIREMENTS (US$)
948M
# HUMANITARIAN PARTNERS
90
TOTAL POPULATION OF ETHIOPIA
94.3*M
* 2017 Central Statistical Agency projection, Ethiopia

03
PART I: CONTENTS
!
!
!
!
^
!
!
!
UGANDA
KENYA
SUDAN
SOUTH SUDAN SOMALIA
DJIBOUTI
ERITREA
Red Sea
YEMEN
Gulf of Aden
AFARAMHARA
BENISHANGULGUMUZ DIRE DAWA
GAMBELA
HARERI
OROMIA
SNNP
SOMALI
TIGRAYMekele
Bahir Dar
Asosa
JijigaAddis Ababa
Gambella
Hawassa
Dubti
LegendMajor towns^ National Capital
! Regional Capital
Pastoral & agro-pastoral area
Elevation (meters)-236 - 500
501 - 1,500
1,501 - 2,300
2,301 - 3,700
3,701 - 4,517
Areas experienced poor rains meher/kiremt
PART I: COUNTRY STRATEGY Acronyms
1. Foreword by the Government of Ethiopia 6
2. Foreword by the Humanitarian Coordinator for Ethiopia 7
3. The humanitarian requirement document at a glance 8
4. Overview of the crisis 9 9
5. Humanitarian needs 10
6. Response strategy 11 12
7. Operational capacity 14 15
8. Response monitoring 15 16
PART II: OPERATIONAL RESPONSE PLANSAgriculture 17
Education 20
Emergency shelter and non-food items 23
Food 26
Health 28
Nutrition 30
Protection 33
Water, sanitation and hygiene 37
PART III: ANNEXESRegional needs snapshots: meher assessment results 41
2016 Government of Ethiopia and donor contributions 51
Coordination structure in Ethiopia 52
CONTENTS

04
PART I: ACRONYMS
5
ACF Action Contre La Faim
AfDB Africa Development Bank
Belg Short rainy season from March to May (in highland and mid-land areas)
Birr Ethiopian currency
CMAM Community Based Management of Acute Malnutrition
CPC Climate Prediction Center
CRS Catholic Relief Services
CSB Corn-Soya Blend
CWA Consolidated WASH Account
Deyr Short rainy season from October to December (in Somali Region)
DfID UK – Department for International Development
DRM ATF Disaster Risk Management Agriculture Taskforce
DRM-SPIF Disaster Risk Management Strategic Programme Investment Framework
DRMTWG Disaster Risk Management Technical Working Group
ECHO European Commission – Humanitarian Aid and Civil Protection
EHCT Ethiopia Humanitarian Country Team
ERCS Ethiopian Red Cross Society
ES/NFI Emergency Shelter and Non-Food Items
FAO Food and Agriculture Organization of the United Nations
FMoH Federal Ministry of Health
GAM Global Acute Malnutrition
GBV Gender Based Violence
GDP Gross Domestic Product
GFD General Food Distribution
Gu Main rainy season from March to June (in Somali region)
HCT Humanitarian Country Team
HW Health Workers
HEW Health Extension Workers
HRD Humanitarian Requirements Document
ICP Incident Command Post
ICRC International Committee of the Red Cross and Red Crescent
IDA International Development Association
IFRC International Federation of Red Cross
INGOs International Non-Governmental Organizations
IOD Indian Ocean Dipole
IRC International Rescue Committee
IYCF Infant and Young Child Feeding
JEOP Joint Emergency Operation Program
JICA Japan International Cooperation Agency
ACRONYMS

05
PART I: ACRONYMS
ACF Action Contre La Faim
AfDB Africa Development Bank
Belg Short rainy season from March to May (in highland and mid-land areas)
Birr Ethiopian currency
CMAM Community Based Management of Acute Malnutrition
CPC Climate Prediction Center
CRS Catholic Relief Services
CSB Corn-Soya Blend
CWA Consolidated WASH Account
Deyr Short rainy season from October to December (in Somali Region)
DfID UK – Department for International Development
DRM ATF Disaster Risk Management Agriculture Taskforce
DRM-SPIF Disaster Risk Management Strategic Programme Investment Framework
DRMTWG Disaster Risk Management Technical Working Group
ECHO European Commission – Humanitarian Aid and Civil Protection
EHCT Ethiopia Humanitarian Country Team
ERCS Ethiopian Red Cross Society
ES/NFI Emergency Shelter and Non-Food Items
FAO Food and Agriculture Organization of the United Nations
FMoH Federal Ministry of Health
GAM Global Acute Malnutrition
GBV Gender Based Violence
GDP Gross Domestic Product
GFD General Food Distribution
Gu Main rainy season from March to June (in Somali region)
HCT Humanitarian Country Team
HW Health Workers
HEW Health Extension Workers
HRD Humanitarian Requirements Document
ICP Incident Command Post
ICRC International Committee of the Red Cross and Red Crescent
IDA International Development Association
IFRC International Federation of Red Cross
INGOs International Non-Governmental Organizations
IOD Indian Ocean Dipole
IRC International Rescue Committee
IYCF Infant and Young Child Feeding
JEOP Joint Emergency Operation Program
JICA Japan International Cooperation Agency
ACRONYMSKebele Lowest Administrative Level
Kiremt/Meher Long and heavy rainy season/post-kiremt harvest
MAC Multi Agency Coordination
MAM Moderately Acute Malnourished
MHNT Mobile Health and Nutrition Teams
MoANR Ministry of Agriculture and Natural Resources
MSF Médecins Sans Frontières
MoJ Ministry of Justice
MoLF MinistryofLivestockandfisheries
MT Metric Tones
NGOs Non-Governmental Organizations
NDRMC National Disaster Risk Management Commission
NMA National Meteorology Agency
OCHA OfficefortheCoordinationofHumanitarianAffairs(UN)
OFDA OfficeofU.S.ForeignDisasterAssistance
OTP Outpatient Therapeutic Program
PE-DTM Protection-Enhanced Displacement Tracking Matrix
PLW Pregnant and Lactating Women
PSNP Productive Safety Net Program
Region Highest Sub-National Administrative Level
RMF Response Monitoring Framework
RUTF Ready-to-Use Therapeutic Food
SAM Severe Acute Malnutrition
SGBV Sexual and Gender Based Violence
SNNP Southern Nations, Nationalities and Peoples region
SO Strategic Objective
SWAP Sector Wide Approach
TFP Therapeutic Feeding Program
TSF Targeted Supplementary Feeding
UN United Nations
UNDP United Nations Development Program
UNICEF United Nations Children’s Fund
USAID US Agency for International Development
WASH Water, Sanitation and Hygiene
WDA Women Development Army
WFP World Food Program
WFS Women Friendly Spaces
WHO World Health Organization
WSWG Water Sector Working Group

06
PART I: FOREwORd bY ThE GOvERNMENT OF EThIOPIA
5
FOREWORD BY
THE GOVERNMENT OF ETHIOPIA
H.E. Mr. Mitiku Kassa, National Disaster Risk Management Commission, Commissioner
2016 was a challenging year. Ethiopians felt the impact of the worst El Niño in 50 years. Last year, more than 10 million Ethiopians required relief food assistance. To meet these and non-food needs, $1.4 billion were required.
Taking the lead, we, the Government of Ethiopia, allocated more than $735 million to initiate the HRD response and to facilitate a speedy response to additional needs as the situation evolved. Our lead was followed by the generous support of international donors. The contribution of Ethiopian citizens was also remarkable. To save the lives and livelihoods of fellow Ethiopians, the civil society, business people and communities stood in solidarity.
Asweturnto2017, thenumberofpeoplethatrequirehumanitarianassistancehassignificantlydecreasedfromthat of 2016. This is due to the positive impact of the kiremt/gu/ganna rains and the subsequent above-average meher harvest in northern and western parts of the country. Nevertheless, food security of pastoralist households in southern and south-eastern lowland areas is threatened following the failure of the autumn deyr/hagaya rains and in pocket areas throughout the country. The most vulnerable Ethiopians will continue to need some form of humanitarian assistance in 2017.
Aswedoeveryyear, theGovernmentwillallocateresourcestofinancehumanitarian interventions in2017.TheGovernment will lead, and looks to friends of Ethiopia, humanitarian donors, partners, communities and the private sector to continue their generous contributions in support of the joint efforts to save lives and to protect and restore Ethiopian livelihoods.
In 2017, as humanitarian needs shift to the southern and south-eastern dry areas, response actors are called upon torefocustheirresponsetoidentifiedandemergingneedsintheseareas.

07
PART I: FOREwORd bY ThE huMANITARIAN COORdINATOR FOR EThIOPIA
FOREWORD BY
THE HUMANITARIAN COORDINATOR FOR ETHIOPIA
Ms. Ahunna Eziakonwa-Onochie UN Resident and Humanitarian Coordinator
In 2016, through joint efforts over US$1 billion, against the annual HRD requirement, was raised to support Ethiopians impacted by the El Niño-induced drought. For the El Niño response which started in September 2015, the Government allocated more than $730 million to address critical humanitarian needs including some ad-hoc requests that were not captured in the HRD. In addition, international donors contributed $985 million to address humanitarian needs and to safeguard decades of development gains. This phenomenal response enabled the humanitarian partners to successfully meet the needs of the most vulnerable people throughout a challenging year for ordinary Ethiopian women, men and children affected by the drought.
In 2016, the Government of Ethiopia and humanitarian partners provided food to some 10.2 million people, and rolled out the largest national emergency seed response to some1.5 million households. Together, we facilitated access to clean water for 10 million people and more than 2 million cases of moderate acute malnutrition and at least 220,000 cases of severe acute malnutrition were treated.
The people of Ethiopia bore the brunt of the historic drought, while not forgetting to support their fellow countrymen andwomeninmeetingtheirneeds.TheEthiopianswerethefirsttorespondtotheirneighbours’needs,andhandin hand with the Government, extended their generous hospitality to refugees that sought asylum in their country. Countless Ethiopians contributed their salaries to help their fellow Ethiopians. Businessmen supplied transportation assets to ensure that people in remote areas could access humanitarian aid. Thousands of volunteers mobilized in the spirit of the Ethiopian culture of sharing.
While Ethiopia continues to reel from the impacts of the El Niño-induced drought, the country is facing a new drought affectinglowlandareasinsouthernandeasternpartsofthecountry.Thisreflectsashiftintheareaswhereacutehumanitarian needs are experienced, a change that requires the humanitarian community to review and adjust the presence in order to save lives and livelihoods.
In 2017, in the tradition of collaboration with the Government and the people of Ethiopia, the humanitarian partners will continue to address the needs of the affected people and we aim to exceed the accomplishments of 2016 and successfully meet new challenges.
If well resourced, the 2017 Humanitarian Requirements Document will also facilitate preparedness and ensure a well-coordinated, timely and prioritized humanitarian response.
But for this we need your support. We now look to donors to continue their generous support to deliver the resources needed for the 2017 response.

08
PART I: ThE huMANITARIAN RESPONSE PlAN AT A GlANCE
5
THE HUMANITARIAN RESPONSE PLAN
AT A GLANCEPEOPLE WHO NEED HUMANITARIAN FOOD ASSISTANCE
5.6MAFARAMHARA
BENESHANGULGUMUZ
GAMBELA
HARERI
DIRE DAWA
SNNP OROMIA
SOMALI
TIGRAY
Addis Ababa
2M
0.6M
0.02M
0.03M
0.4M
0.3M
0.4M
0.03M0.01M
1.6M
## Number of relief food beneficiaries per region
The post-summer rains/meher harvest assessment and projections for 2017 indicate the following priority needs:
• 1.9M households in need of livestock support
• 0.3M severely acute malnourished
• 2.7M moderately acute malnourished
• 2M without safe drinking water
• 0.3M displaced due to shocks
Key humanitarian issues
• Lives remain at risk due to shortage of food and water and the risk of disease outbreaks.
• Livelihoods are at risk due to lack of pasture, livestock death or poor health, and elsewhere remain precarious following the impact of the 2016 drought.
• Critical needs for food, shelter and non-food items lead to displacement.
• Negative coping mechanisms such as child labour and early marriage lead to absenteeism and increased risk of violence against women and girls.
5.6MTotal 948M 715M233M
5.6M
5.6M
2.7M
0.3M
4.3M
9.2M
1.9M
2M
0.5M
0.6M
598M
598M
598M
42M
86M
41.9M
45M
11M
17M
17M
183M
183M
183M
46M
0.5M
1.6M
1.8M
50.9M
415M
415M
415M
42M86M
41.4M45M
9.4M15M
300M
SECTOR
contribution** $10m Government contribution to education*** Not included in HRD requirements and contributions
59M105.6M
General Ration:Gross Requirements: 919,898 MT
FOOD SUB TOTAL
FOOD
Nutrition Supplies(MAM)
Nutrition(SAM)
Health
WASH
Agriculture
Education
Protection
Emergency Shelter/NFI
NON-FOOD SUB TOTAL
# PEOPLE TARGETED
TOTAL REQUIREMENTS US$ AVAILABLE RESOURCE US$ NET REQUIREMENTS US$
150 200
REQUIREMENTS (US$)
$948M
PEOPLE TARGETED (HRD)
5.6M
STRATEGIC OBJECTIVE 1
Save lives and reduce morbidity due to drought and acute food insecurity
STRATEGIC OBJECTIVE 2
Protect and restore livelihoods
STRATEGIC OBJECTIVE 3
Prepare for and respond to other humanitarian shocks, including natural disasters,
conflictand displacement

09
PART I: OvERvIEw OF ThE CRISIS
Following successful kiremt rains between June and September 2016, above-average harvest is expected in northern and western parts of Ethiopia. This is expected to improve the food security situation in these areas. At the same time, reports of livestock deaths and water shortages are emerging from the primarily pastoral areas in southern and south-eastern parts of the country. In addition, disease outbreaks and food and nutritional insecurity persist in pocket areas throughout Ethiopia.
The needs presented in the HRD for 2017 have been established through a robust, Government-led multi-agency meher needs assessment, which took place over three weeks in November and December 2016. Nearly 230 representatives from the Government, UN, NGOs and donors visited affected communities across Ethiopia’s nine regions. The assessment concluded that some 5.6 million people will be in need of assistance in the course of 2017.*
The meher assessment also concluded that the 2016 summer kiremt rains resulted in a return to
normal meher season planting (planting takes place between June and July). Most smallholder cropping households are expected to produce a normal harvest in northern and western cropping areas. However, erratic distribution and below normal kiremt rains in lowland areas and failed autumn deyr/hagaya (short rainy season from November to December) in pastoral areas tipped southern and eastern pastoralist areas into
severe food insecurity. Similarly, hailstorms, landslides and frost in some highland areas significantlyreduced crop yields in pocket areas.
The 2015/2016 El Niño has left a negative legacy on many households, including those that lost livestock and other productive assets. This 2017 HRD does not include responses to recovery needs, which are expected to be captured in a separate document.
OVERVIEW OF
THE CRISISWhile Ethiopia battles residual needs from the El Niño-induced drought, below average rains in the southern and eastern parts of the country caused by the negative Indian Ocean Dipole have led to a new drought.
AFARAMHARA
BENESHANGULGUMUZ
GAMBELA
HARERIDIRE DAWA
Belg rains
OROMIA
SNNPRSOMALI
TIGRAY
Kiremt rains
HARERIDIRE DAWA
Segen Peoples’
South Omo
HARERIDIRE DAWA
HARERIDIRE DAWA
AFARAMHARA
BENESHANGULGUMUZ
GAMBELAOROMIASNNPR SOMALI
TIGRAY
AFARAMHARA
BENESHANGULGUMUZ
GAMBELAOROMIA
SNNPRSOMALI
TIGRAY
AFARAMHARA
BENESHANGULGUMUZ
GAMBELAOROMIA
SNNPRSOMALI
TIGRAY
Jan DecNovOctSepAugJulJunMayAprMarFeb
Kiremt rains
Belg rains
Gu rains in Somali region Ganna rains in Oromia region
Deyr rains in Somali region Hageya rains in Oromia region
Hageya/Hagayita rains in Segen Peoples’ zone
Kiremt rains in South Omo zone
Sugum rains in Afar region Belg rains in northern Somali
Karma rains in Afar region Karran rains in Somali region
Sapie rains
Sapie rains
0
4.5M ppl
8.2M ppl10.2M ppl 10.2M ppl 9.7M ppl
5.6M ppl
NovOctSepAugJulJun'16MayAprMarFebJanDecNovOctSepAugJulJun'15
10.2M ppl 10.2M ppl 9.7M ppl5.6M ppl
kiremt rain Erratic due to El Niño
Delayed belg/gu rainFlooding in some regions
La Niña conditions develop
4 Jun 2015The Government
declared failed belgrains
Jun - Mid Sep 2015Kiremt rain erratic
due to El Niño
Oct 2016Joint NDRMC-OCHA
HRM call around confirms symptoms
of drought
Nov 2016Projected needs
for 2017Jul 2016
Peak of negativeIndian Ocean Dipole
(IOD)
18 Aug 2015Belg verification
assessmentidentifies 4.5M relief
food beneficiaries
13 Oct 2015Rapid pre-meher
assessmentidentifies 8.2M relief
food beneficiaries
Apr 2016Prioritization statement
Jun 2016Belg partially successful
Nov 2016Meher assessment
Oct 2016Joint NDRMC-OCHA
HRM call around confirms symptoms
of drought
Nov 20165.6M ppl Projected needs
for 2017
Jul 2016Peak of negative
Indian Ocean Dipole (IOD)
Apr 2016Prioritization statementidentifies 10.2M relief
food beneficiaries
Jun 2016Belg partially
successful
Nov 2016Meher assessment
Mid Mar - Mid Jul 2016Delayed belg/gu rain
Flooding in some regions
Jun - Mid Aug 2016La Niña conditions
develop
x
Oct 2016Joint NDRMC-OCHA
HRM call around confirms symptoms of drought
Dec 2016Needs
in 2017
Jul 2016Peak of negative
Indian Ocean Dipole
Jan 2016Needs in
2016
Jun 2016Belg partially
successful
Nov 2016Meher assessment
Mid Mar - Mid Jul 2016Delayed belg/gu rain
Flooding in some regions
Jun - Mid Aug 2016La Niña conditions
develop
Apr 2016Prioritization
Statement
DecNovOctJulJunMayAprMarFebJan'16
* The June 2017 belg assessment will inform the Mid-Year Review of the 2017 HRD.
CRISIS TIMELINE

10
PART I: huMANITARIAN NEEdS
5
5.6Mpeople will need emergency
food assistance
2.7Munder 5 and PLW
projected MAM cases
4.37Mpeople will requirehealth assistance
0.3Mprojected SAM cases
2Mschool-aged children
will be targeted for schoolfeeding
9.1Mpeople will require
WASH support
1.9Mhouseholds will need
livestock support
0.59Mpeople will be targetedfor protection assistance
0.5Mhouseholds will need
seeds support
0.6Mhouseholds need shelter
and Household NFIs
2016
0
10,000
20,000
30,000
40,000
50,000
DecAugAprJanTypical year average of 2012-2014For comparison of 2011 Horn of Africa drought
2015 monthly admission in August were higher than peak of 2011 crisis
AddisAbaba
Afar
Amhara
BenishangulGumuz
DireDawa
Gambela
Hareri
Oromia
SNNP
Somali
Tigray
Priority
P1-192
P2-174
P3-88
woredas
Number of people displaced in 2016
Number of people projected to be displaced in 2017
718,000 376,000
HARERIADDIS ABABA
AFARAMHARA
BENISHANGULGUMUZ
DIRE DAWA
GAMBELA
OROMIASNNP
SOMALI
TIGRAY
Legend
Water trucking as of 21 Jan 20172017 WaSH hotspot woredas
123
SOUTH SUDAN
SUDAN
KENYASOMALIA
DJIBOUTI
ERITREA
UGANDA
SUDAN
HUMANITARIAN
NEEDS
HOTSPOT WOREDAS (AS OF DECEMBER 2016)
In 2017, some 5.6 million people will require emergency food assistance; some 2.7 million children and pregnant and lactating mothers will require supplementary feeding; some 9.1 million people will not have regular access to safe drinking water; and some 1.9 million households will need livestock support. Partners also estimate that 303,000 children will become severely acutely malnourished in the year.
SEVERE ACUTE MALNUTRITION ADMISSIONS
WASH HOTSPOT WOREDAS VS WATER TRUCKING AS OF JAN 21, 2017
Of the 718,000 people who were displaced in 2016, more than half have returned to places of origin. An additional 376,000 people are estimated to be displaced in 2017 duetofloods,droughtand/orconflict.

11
PART I: RESPONSE STRATEGY
RESPONSE
STRATEGYSTRATEGIC OBJECTIVES
Theprojectionsinthe2017HRDarebasedonthefindingsoftheseasonalmeher needs assessment as well as early warning data and modeling done by partners. To reinforce inter-sector coordination, the response will be built aroundthreeStrategicObjectives(SO)whichformthebasisforthesector-specificoperationalplans,presentedinthe Sector Chapters.
1Save lives and reduce morbidity due to drought and acute food insecurity 3Prepare for and
respond to oth-er humanitarian shocks – natural disasters, conflict
and displacement2Protect and
restore livelihoods
In the first half of 2017, pastoralistcommunities in the areas affected by the new drought will need additional support to cope with the loss of livestock in late 2016. The response will include a full range of livestock relief interventions (fodder distribution, animal health and slaughter destocking) as outlined in the Ministry of Agriculture’s National Guidelines for Livestock Relief Interventions in Pastoralist Areas of Ethiopia (2008). These activities will also support pastoralists in northern parts of the country, who require targeted livelihood recovery support following the El Niño-induced drought. Activities to support smallholder cropping households will be introduced during the second quarter of 2017, informed by weather forecasts, to enable the households to take advantage of the 2017 rains.
Duringthefirsthalfof2017,humanitarianpartners will prioritize areas affected by the new drought in south and south-eastern parts of Ethiopia. The mobile approach will address the unique needs of mobile pastoralist communities and provide complete nutritional care and health services, including reproductive health. Support will also be made to enable children to continue their education. During the dry season, when animal milk production decreases, the response will be complemented by supplementary food based on regular screenings to ensure the most vulnerable are reached. Ensuring access to safe drinking water in parallel to hygiene promotion will reduce the spread of disease outbreaks. The potential for further expansion of disease outbreaks is of particular concern reinforcing the need to further expand case management in remote areas and linkages to surveillance systems.
This objective relates to drought and flood-affected areas and supportsresponse efforts to address the needs of people who may become displaced over the course of 2017. Facilitating meaningful and safe access to services including health and nutrition for displaced communities require a flexible mobile service, particularlywhere host community services are unable to meet the needs of additional people. The MHNTs, that provide health and nutritional services to remote and mobile populations, will work to include areas known to host displaced communities in their operational areas. Scaled-up multi-disease surveillance and improved link to response triggers will also reduce the impact of disease outbreaks that continue to be of concern, particularly among people affected by shocks. Agreements reached on a harmonized, common muti-sector approach to rapid needs assessment and response SOPs following new shocks will be rolled out across affected regions.

12
PART I: RESPONSE STRATEGY
5
Cross-cutting: Government service provision strengthened at point of delivery
This cross-cutting theme cuts through the entire HRD and forms a key component of the response. Almost all humanitarian assistance in Ethiopia is coordinated through the Government, where technical and material support for Government systems is provided by partners at multiple levels. Although there are concerns that the crisis may impact some of Ethiopia’s development gains, there is also hope that if well-funded, the implementation of the HRD will lead to longer-term development outcomes, in particular through the support that will be provided to front-end service providers.
Planning assumptionsThroughout the El Niño response, extensive efforts were made to continuously improve the quality of cross-sectoral needs analysis that underpins the 2017 HRD. Where possible, operational bottlenecks were addressed and needs projections developed by the clusters using multi-layered cross-sector indicators, in collaboration with the Government sector chairs. For example, the Logistics Cluster, which was activated in March 2016, conductedagapanalysisandidentifiedbottlenecksforefficientdeliveryoflife-savingassistance.Asaresult,mitigation measures were introduced in close collaboration with the National Disaster Risk Management Commission (NDRMC). These included augmenting the logistics coordination and information management capacity, as well as enhancing the overall logistics capacity of the Government and that of other humanitarian actorswithincreasedstoragefacilitiesandstaffing,logisticstrainings,andsupporttotheNDRMChubsandtransport.
A number of unpredictable variables remain beyond the control of Government and humanitarian responders that will affect needs and the ability of partners to address them over the coming year, most notably the weather.
The following planning assumptions have been agreed as a basis for humanitarian operations outlined in the HRD:
i) Government capacity in the newly impacted areas (south and south-eastern parts) requires strengthening. Consequently, all responding partners will need to ensure a strong initial investment in the response capacity to ensure a robust and timely intervention.
ii) The areas experiencing new drought are large and sparsely populated geographic areas with limited infrastructure. Limited road networks, warehouse capacity and availability of water schemes in the affected areas will challenge the response efforts and potentially delay the initial delivery of life-saving assistance. These effects can be somewhat mitigated through augmenting the warehouse capacity in the affected areas and by pre-positioning humanitarian relief items.
iii) The spring 2017 belg/gu/ganna rains could be below-normal in south and south-eastern parts of Ethiopia. Although it is too early to make reliable long-term forecasts, there are some indications that the spring belg/gu/ganna rains could be below-average in drought affected lowland areas. Should this happen, the recovery of pastoralists and farmers could be delayed until later in 2017.
iv) Continued three month lead times for the procurement and delivery of food and other humanitarian assistance. New funding contributions will take up to three months to translate into concrete assistance delivered to beneficiaries.
v) The Productive Safety Net Programme (PSNP). The PSNP will provide monthly food and cash transfers to 7.9millionbeneficiariesasplannedforthefirstsixmonthsoftheyear.
vi) Success in local purchase of cereals as part of response mechanisms will reduce lead time and port congestion.
vii) Continuing ‘unseasonal’ migration and displacement. Heads of households in low-land areas of southern and

13
PART I: RESPONSE STRATEGY
eastern Ethiopia may migrate in search of pasture for livestock. There is a high potential for displacement of whole communities due to lack of available drinking water. Congregation around scarce water points can potentially increase inter-communal tensions.
Viii) Services may not fully take into account the needs of vulnerable groups: The lives of vulnerable groups such as women, children, disabled persons and displaced people may be at risk if services are not safe or meaningful and address the special needs of vulnerable groups.
Prioritization
The prioritization of activities has been undertaken by humanitarian partners during the development of the sectorspecificstrategiesoutlinedinthisplan.Theprioritiesarefurtherrefinedthroughouttheyearinad hoc prioritization meetings in line with changes in the operating environment.
In 2016, three prioritization meetings were convened. In the meetings, partners agreed on immediate priorities acrossthedifferentsectorsandidentifiedgapsintheresponsetoinformdecision-makingprocesses.Theoutcomes of the prioritization meetings are further discussed by Cluster Coordinators and their Government counterparts and endorsed by the EHCT in close consultation with NDRMC.
For the purposes of this plan, prioritization of activities was determined according to the following criteria:
Most life-saving: Responses with immediate, large impact on the lives and livelihoods of the affected people conducted in a cost-effective manner whilst addressing the needs of the most-vulnerable groups.
Time-critical: Ensuring timely procurement and distribution of seeds to areas benefiting from the rainyseasons.
Critically enabling: Activities supporting the response efforts or complementing the multi-sector response, e.g. transportation of food or nutritional supplies.
Each sector/cluster’s operational plan includes a short list of agreed, prioritized activities, categorized as either ‘high’ or ‘critical’ priority. The associated costing has also been prioritized accordingly.
Geographical prioritization in most sectors is driven primarily by the Government’s hotspot woreda classification,whichisupdatedthroughouttheyear.Furtherad hoc operational prioritization of multi-sector response is undertaken via the DRMTWG and the Inter-Cluster/Sector Coordination Groups.

14
PART I: OPERATIONAl CAPACITY
5
OPERATIONAL
CAPACITYCurrently there are over 90 humanitarian organizations operating in Ethiopia and supporting the Government-led response.The Government structures at the national and sub-national levels are the backbone of humanitarian response in Ethiopia. Humanitarian partners operating in support of the Government include 11 UN agencies, 66 INGOs, ICRC, IFRC, and the ERCS. At least 11 national NGOs are conducting and supporting humanitarian operations. These include faith-and community-based organizations, who have the multiplier effect of ensuring that assistance reaches those in the most remote areas. In south and south-eastern areas affected by the new drought, limited numbers of operational humanitarian partners requires a shift in operational presence for some partners, and a shift in programmatic focus (to include humanitarian activities in ongoing development programming) for others.
COORDINATION
The overall coordination of the humanitarian response is led by the Government’s NDRMC. The NDRMC leads federal and regional DRMTWGs across Ethiopia and hosts a series of specialized task forces that work in tandem with the clusters/sectors. The Government strengthened the DRMTWG presence in the country and rolled out structures in most regions. The NDRMC, with support from humanitarian partners, also conducted gap assessments and capacity building workshops to increase the effectiveness of regional coordination forums. Based on operational presence, UN agencies, NGOs and the Ethiopia Red Cross Society are active participants in federal, regional and sub-regional coordination forums.
The NDRMC also convenes an ambassador/ministerial level Strategic Multi-Agency Coordination (S-MAC) meeting, to ensure a strategic approach to response efforts including resource mobilization and strengthening linkages between government bodies and the wider humanitarian community.
In addition to this, an inter-cluster coordination meeting
convened by OCHA is held fortnightly in Addis Ababa to agree on operational priorities, to ensure coherence and complementarity of response efforts. The inter-cluster coordination group identifies and recommends strategicaction for the EHCT for decision making and/or advocacy considerations. The EHCT, chaired by the Humanitarian Coordinator, consists of UN agencies, international NGOs, national NGOs and donor representatives as well as observers from IFRC, ICRC, ERCS and MSF.*
The Government and humanitarian partners recognize that men, women, boys and girls are impacted by crises in different ways and therefore have different needs. Similarly, the National Policy and Strategy on Disaster Risk Management (2013) recognizes women, children, the elderly, people with disabilities as well as those living with HIV/AIDS as the most vulnerable to the impact of various hazards and notes that special attention should be given to these vulnerable groups. The Government and the humanitarian community in Ethiopia are committed to ensuring that all affected people are able to access and benefit fromprotection and assistance.Partners are alsoencouraged to advance gender equality and women’s rights through their programmes where opportunities exist to do so. The Government and partners in Ethiopia recognise the value and the need to strengthen participatory approaches to programme design, implementation, monitoring and evaluation, and pay particular attention to the inclusion of women and girls.
CASH AS A RESPONSE MODALITY
Market supply for some areas could be variable depending on the nature of infrastructure and traders' capacity. Cash as a response modality will be considered by WFP in areas where markets are functioning as well as considering availability of cash in the pipeline.
* The humanitarian coordination structure in Ethiopia is included in the Annex.

15
PART I: RESPONSE MONITORING
RESPONSE
MONITORINGResponse monitoring is a continuous process that tracks the delivery of humanitarian assistance to affected people against targets set out in the HRD.
Dashboard of Sector Response and Contextual Indicators
InordertomonitorprogressagainsttheHRD,clustershaveidentifiedasetofresponseandcontextualindicatorsforwhich they have committed to provide monthly data. The info graphics produced on the basis of this data are used to understand how the response is progressing and identify bottlenecks so that proactive measures can be taken.
Periodic Monitoring Report (PMR)
Since March 2016, the Periodic Monitoring Report (PMR) has been produced on a quarterly basis. The PMR highlights progress made on Strategic and Cluster Objectives, changes in context and funding trends.
Humanitarian Response Monitoring
In March and October 2016, NDRMC and OCHA conducted a "call around"survey of ongoing humanitarian response reaching out to DPPB and other woreda (districts)officialsinpriority1and2woredas. The resulting report allowed for analysis of progress of the ongoing response and revealed new challenges. In 2017, similar surveys will be carried out.
HUMANITARIAN PROGRAMME CYCLE TIMELINE
DashboardPeriodic Monitoring ReportBelg assessmentMid-year review of 2017 HRDHumanitarian Response Monitoring Meher assessment2018 HRD
DECNOVOCTSEPAUGJULJUNMAYAPRMARFEBJAN
Jan 2017 Dec 2017

16
PART I: RESPONSE PART II: OPERATIONAl
5
Agriculture
Education
Emergency Shelter
Food
Health
Nutrition
Protection
WASH
PART II: OPERATIONALRESPONSE PLANS
Pho
to c
redi
t: Ja
ke L
yell,
Chi
ldFu
nd

17
PART I: RESPONSE RESPONSE PlANS
RESPONSE PLANS
AGRICULTURE
REQUIREMENTS (US$)
41.9M
PEOPLE TARGETED
1.9M(HH)
Context
In Ethiopia, 8 in 10 people depend on agriculture and livestock for their livelihoods. More than 80 per cent of the production is rain-fed, which is typically seasonal across the country. Following the failure of two consecutive rainy seasons in 2015, the spring belg and summer kiremt rainfall seasons in 2016 were normal to above-normal in most northern areas, leading to improved crop and livestock production and normalization of prices. However, poor spring gu/ganna rains and failed autumn deyr/hagaya rains in Ethiopia’s southern rainfall belt – generally unaffected by the 2015-2016 El Niño drought have led to the need for additional emergency agriculture and livestock interventions.
During the first half of 2017, affectedpastoral areas of Oromia, SNNP and Somali regions are expected to go though an emergency phase of the drought cycle. At the end of 2016, abnormal early migrations, excess livestock mortality rates and extreme emaciation have already been observed. Urgent interventions are required to help pastoral households maintain their herds and avoid losing their livelihoods.
National crop production is estimated to be 20 per cent higher in 2017 as compared to previous year boosting food availability and access in crop-producing, meher-dependent areas. The preliminary results of a seed system security assessment by the Agriculture Cluster in late 2016 indicate that in 2017, most crop-dependent householdswill haveaccess to sufficientquantities of quality and preferred types of seed and planting materials. However, the livelihoods of farmers are yet to fully recover in many areas, and there are pocket areas along the Rift Valley, especially in northern and eastern highlands, where production remained low in 2016. Families in these areas will face significant challenges inaccessing productive inputs, and will need scaled up agricultural support to prevent another year of poor production and heightened food insecurity.
Targeting
In 2017, the Agriculture Cluster will target farming, agro-pastoral and pastoral households with interventions to support crop- and livestock-based livelihoods.
1. Pastoralists in southern and southeastern Ethiopia will be targeted with emergency animal health, livestock feed and destocking (commercial and slaughter) interventions.
2. From January 2017, the most vulnerable smallholder farming and herding households in the northern rainfall belt dependent on the belg/meher seasons will be targeted with livestock interventions aimed at facilitating humanitarian recovery for the most affected and destitute, ensuring that women-headed households are prioritized.
Main Partners
MoANR, MoLF, EGTE, FAO, ACF, Action Aid, ATA, Brooke Ethiopia, CARE, CA, Concern, COOPI, Cordaid, CHF, CISP, CRS, CST, DCA, FHE, FEWS NET, GAA, GIZ, GOAL, Intermon Oxfam, IRC, Mercy Corps, MoT, NCA, NMA, NRC, Oxfam America, PIE, PIN, REST, SCI, SDC, SHA, SoS Sahel, Tufts University, VSF Germany, VSF Suisse, WVE and ZoA.
Implementation and Coordination arrangements
Until the end of 2016, emergency response in the agriculture sector was coordinated through the DRM–ATF, which reports to the DRMTWG and the NDRMC. In 2017, the transition of this responsibility to the MoANR and the MoLF will necessitate adjustments in coordination arrangements.
In the interim, the DRM–ATF will continue to coordinate the overall response in the agriculture sector, the MoANR – supported by the Emergency Seed Working Group
# OF PARTNERS
xx 88IN SUPPORT OF STRATEGIC OBJECTIVES 1 AND 2 CLUSTER OBJECTIVE 1
1To provide chronically poor households that have experienced drought and related
shocks with ‘seeds of choice’ to plant their full land holdings and improve household food and nutrition security
CLUSTER OBJECTIVE 2
2To protect livestock herds where drought conditions are already at the alarm stage of the drought
cycle model
Pho
to c
redi
t: Ja
ke L
yell,
Chi
ldFu
nd

18
PART I: RESPONSE PART II: OPERATIONAl
5
– will take the lead in the coordination of agricultural interventions, and the MoLF – supported by the Emergency Livestock Working Group – will lead the coordination of livestock interventions. Given the scale of the longer than normal dry spells in southern and southeastern Ethiopia, the DRM–ATF is in the process of re-activating subregional DRM–ATF coordination structures in Gode (Somali), South Omo (SNNP) and Yabello (Oromia).
Since its inception in April 2016, the DRM–ATF Strategic Advisory Group has been instrumental in supporting the DRM–ATF in bringing together agriculture sector stakeholders, including donors, UN agencies, and NGOs to jointly solicit resources and plan, coordinate and respond to the El Niño-induced crisis. This important role is expected to continue for at leastthefirsthalfof2017.
The two technical working groups under the umbrella of DRM–ATF, and their regional branches, will monitor and evaluate humanitarian response in the agriculture and livestock sectors.
Strategy
Although the gu/genna season typically relieves the impacts of drought in lowland areas, pastoral households continue to require urgent interventions to safeguard their herds, improve milk production and ensure access to feed and water, especially in southern and southeastern pastoral areas. In 2017, the implementation of humanitarian activities to support the livelihoods of 1.4 million pastoral households will require $37.1 million. The majority of support is required in southern and southeastern pastoral areas of the
country, while requirements for livestock support in highland areas is estimated at $ 4.7 million.
Supplementary livestock feed will be combined with tailored animal health interventions for core breeding stock. For interventions in pastoral areas – where feed resources are typically stretched to feed more animals than planned–, communities will be encouraged to establish feed centres that can only be accessed by marked livestock to ensure that the most productive animals survive the drought. As rangeland productivity deteriorates, livestock produce less milk which is a key component of the diet in pastoral areas. To improve nutrition levels among affected households, destocking interventions will be implemented to make protein-rich meat available for the most vulnerable and support livestock prices in local markets.
To ensure the availability of seeds of choice in the 2017 planting windows, the sector needs resources to provide cereal, legume and vegetable seed and root crop planting materials to more that 500,000 households in Amhara, Oromia, SNNP and Tigray regions. The 2016 seed system security assessment and the meher season assessment results informed the planning for the 2017 seed response in belg- and meher-dependent areas. In contrast to the 2016 emergency seed response, priority in2017willbegiven toPSNPbeneficiaryhouseholds. The seed support will be covered by the Government. FAO and the SAG in collaboration with partners will continue to provide technical support to a Government-led seed response.

19
PART I: RESPONSE PART II: OPERATIONAl
:
PRIORITY ACTIVITY BENEFICIARIES(HH) REQUIREMENTS US$
Pastoral zones – Afar, Somali, Oromia and SNNP regionsCategory 1 Emergency provision of livestock
feed for core breeding animals0.34 M 21,000,000
Animal health support (including veterinary equipment)
0.82 M 8,600,000
Destocking for saving lives and livelihoods and nutritional support to children and safe carcass disposal
0.34 M 5,600,000
Category 2 Emergency vaccination of livestock after the next rains
1.4 M 2,000,000
Sub-total 1.4 M 37,200,000 Belg and belg/kiremt smallholder farming zones – Amhara, Oromia, SNNP and Tigray regionsCategory 1 Provision of emergency livestock
feed for core dairy cattle and plough oxen
0.036 M 2,100,000
Animal health support (including veterinary equipment)
0.47 M 1,000,000
Category 2 Animal vaccination 0.43 M 1,600,000 Sub-total 0.5 M 4,700,000TOTAL REQUIREMENTS 1.9 M 41.9M*An assessment to be made after one season of good rains to determine the viability and appropriateness of the intervention.

20
PART I: RESPONSE PART II: OPERATIONAl
5
Context
Over the past 25 years, Ethiopia has performed relatively well in expanding formal and non-formal education opportunities, although ensuring the provision of quality education remains a challenge. Enrollment at all levels has improved substantially and youth and adult literacy rate increased from 28 per cent in 1994 to nearly 59 per cent in 2015. Primary school (grades 1-8) gross enrollment increased from 22 per cent in 1994 to over hundred per cent in 2015 in most of the regions. Before 1994, secondary school education was limited to large towns. At the end of 2016, there is at least one secondary school in each woreda.
The education system in Ethiopian is vulnerable to natural disasters and man-made emergencies. Additionally, out of the 738,000 refugees in Ethiopia, 57 per cent are children, putting additional pressure on the Ethiopian education system.
The education sector was severely hit by
the El-Niño induced drought as well as the new drought affecting lowland areas in eastern and southeastern parts of the country.
The findings of the 2016 meher needs assessment found that 138 schools in Oromia and 13 in SNNP regions have been closed due to the ongoing emergency. Lack of water and school feeding were identifiedasmajorcontributorstostudentabsenteeism hampering overall education activities in emergency situation.
The data further shows that some 76 per cent of schools in affected areas are without water which impacts on children's learning abilities and the overall hygiene conditions at schools.
Similarly, about 73 per cent of schools in Tigray and Oromia, 49 per cent in Afar, and 44 per cent in Amhara regions are without latrines. Generally, 47 per cent of schools in the meher assessed woredas are without latrines.
The loss of assets and livelihoods has also compromised the capacity and purchasing power of parents and care givers to send
EDUCATION
REQUIREMENTS (US$)
45.5M
PEOPLE TARGETED
2M
CLUSTER OBJECTIVE 1
1Support two million emergency-affected school-age girls and boys
continue their education
CLUSTER OBJECTIVE 2
2Support 73,683 (50 percent) IDP school-age girls and boys to continue
their education*
AFARAMHARA
BENESHANGULGUMUZ
GAMBELA
HARERI
DIRE DAWA
OROMIA
ADDIS ABABA
SNNP SOMALI
TIGRAY
Schools targeted
318
3,005
54
1,977
3,939
1,669
665
2542
# OF PRIMARY SCHOOLS
11,274
# OF PARTNERS
xx 22IN SUPPORT OF STRATEGIC OBJECTIVES 1 AND 3
2M Children targeted 0.9M Girls
1.1M Boys

21
PART I: RESPONSE PART II: OPERATIONAl
their children to school in 2016.
The above factors have contributed to high levels of school absenteeism with the highest numbers recorded between October and November 2016 in Oromia (34,531), followed by Somali (19,978), Gambella (7,902) and SNNP (7,716) regions. The lowest number of school absentee is recorded in Harari region (691).
Parents are unable to cover the costs of school learning supplies (e.g. pens, pencils, exercise books).
Recent information reveals that 147,366 school children are internally displaced in six regions: Afar, Gambella, Harari, Oromia, Somali and Tigray. Of this, about half is estimated to be accommodated within host communities and the rest are targeted by Temporary Learning Centers with WaSH facilities, school feeding and learning supplies.
The residual effect of the 2015/16 drought and floods combined with the newdrought in the eastern and southeastern
parts of Ethiopia is estimated to disrupt education of some 2.9 million school-age children. Of these, some 2 million school-age children in priority one woredas (mainly in eastern and southern parts of the country and in some pocket areas in other regions) require immediate support.
Targeting
With a focus on children aged 4-18 years, the Government and humanitarian partners aim to target two million school age boys and girls in priority one woredas for emergency school feeding, learning supplies and school WaSH. Most of these children are in eastern and south-eastern Ethiopia.
Main Partners
FMoE, Regional and woreda Education Bureaus, UNICEF, Save the Children, WFP , Child Fund, PIN, DANFE, Islamic Relief, Kelem, LWF, PACT, PTP, Plan
Total children % boys & girls
PEOPLE TARGETED
Region
AFAR
AMHARA
DIRE DAWA
GAMBELLA
OROMIA
SNNP
SOMALI
TIGRAY
TOTAL
88,047
362,837
7,836
30,799
928,693
318,586
187,546
95,911
2M 55% 45%
BREAKDOWN OF PEOPLE IN NEED, AGGREGATED BY REGION/AREA, SEX AND AGE (MEHER ASSESSMENT)

22
PART I: RESPONSE PART II: OPERATIONAl
5
Ethiopia, Right to Play, World vision, Italian Center for Child Aid, NRCl, Camara Education, Relief Aid, Imagine 1 Day, and implementing partners.
Implementation and coordination arrangements
The Ministry of Education jointly with co-lead agencies (UNICEF and SCI)will continue to lead and coordinate the preparedness and response activities at federal and sub-national levels. Monthly coordination meetings at the federal level are informed by sub-national coordination forums that meet on a monthly basis at regional capitals. The Education Cluster which was reactivated in January 2016 is nationally coordinated by two staff members/ technical experts with support from UNICEF and SCI. There is a need to strengthen regional/sub-clusters in terms ofstaffingandcapacitybuildinginitiatives.
Strategy
The Cluster with support from lead agencies will continue to mobilize
resources for Education in Emergency. A list of targeted schools will be shared with the Food, Nutrition and WaSH clusters to ensure that necessary cross cluster interventions are prioritized and schools are used as platforms for broader humanitarian interventions. Learning spaces include gender-sensitive sanitation facilities and school feeding programmes which incentivize families in need to send their children to schools, while improving the overall nutritional situation. Education of IDP children will be conducted in close coordination with IOM.
The cluster/sector partners will devote dedicated attention to youth issues, such as school absenteeism, who are likely to be more vulnerable to abuse, neglect, susceptible to embarking on the often perilous migration journeys risking trafficking and abuse. Jointlywith Protection Cluster, the education sector will ensure children continue their education in safe and protective school environments. Go-to-school campaigns are organized jointly with parents and children to bring back dropouts.
PRIORITY ACTIVITY BENEFICIARIES REQUIREMENTS US$
Critical Provide school feeding 2,034,652 school-age children
30,061,821
Critical Provide school WaSH 2,142 schools 8,056,195Critical Provide learning supplies 2,034,652 school
children5,758,065
Critical Establish temporary learning centers
73,683 IDP school children
1,628,319
TOTAL REQUIREMENTS 2M 45.5M

23
PART I: RESPONSE PART II: OPERATIONAl
EMERGENCY SHELTER AND NON-FOOD ITEMS
REQUIREMENTS (US$)
17.2M
PEOPLE TARGETED
0.6M
# OF PARTNERS
14
CLUSTER OBJECTIVE 1:
1To improve flood-resilience of existing shelters to minimize loss of household assets.
CLUSTER OBJECTIVE 2
2To provide immediate humanitarian assistance to newly displaced and people
in prolonged displacement not yet reached with assistance.
Context
In 2016, severe drought forced pastoralist families to abandon their shelters and household belongings as the result of loss of livestock. Scarce resources and lack of access had also led to inter-community tension and clashes that caused more displacements. Seasonal flooding also traditionally displacespeople living in flood-prone areas forup to three months. In average, 90 per cent of the displaced will return to their places of origin.
Based on the 2016 meher assessment, 376,000 persons are at risk of being displaced across five regions (Afar,Amhara, Gambela, Oromia, and Somali). The majority of these (217,000 persons) are expected to be in Somali region with Afar, Gambela and Oromia projecting close to 50,000 each.
In support of the seasonal assessment first round of Displacement TrackingMatrix (DTM), carried out between SeptemberandOctober2016,identified167,688 persons (30,676 households), 66 per cent of which are under 18 years old, who have been displaced in 2016. Of these 33 per cent were as the result of inter-community clashes, 23 per cent from drought and 44 per cent due to flooding. The majority ofdisplaced populations were in Somali, Gambella and Afar regions. The DTM data indicates that majority (55 per cent) of the displaced population are living with host communities, sharing limited resources. This was further confirmedby the meher assessment where some woredas in Somali region are hosting more than double their population size. There is a need to explore multiple response modalities to better address the need of those in different contexts.
New waves of drought-related displacements towards woreda centres in search of assistance is already being reported in Somali. Host communities, left with low coping and absorption capacity following the 2015/16 El-Niño will likely
be faced with increased vulnerability. Inter-community clashes are expected to cause further displacements, in some cases resulting in secondary and multiple displacements that are likely to further reduce the families’ abilities to cope.
The seasonal and cyclical nature of flood displacement and subsequentresponses highlights the need for technical assessment to gain better understanding of flood-induceddisplacements within the context of shelter. Evidence-based decisions can then be made to address needs that require longer-term and more sustainable solutions.
Targeting
The Cluster will target people who have lost access to shelters and their belongings due to shocks that have caused damage to their habitats. This includes 90 per cent of the newly displaced people as projected in the meher assessment as well as households identifiedbytheDTMtohaveremainedinprolonged displacement situations without adequate assistance. In collaboration with Cluster partners, geographical prioritization for preposition of stocks will also be done using regional response plans and the DTM, severity levels, vulnerability criteria, and at -risk factors.
Based on seasonal assessment findingsandflood-contingencyplanstheClusterwilltarget communities in flood-prone areasthat are at risk of cyclical displacements for disaster risk reduction assistance at the place of origin.
Main Partners
NDRMC, DPPB/DPFSAs, ERCS, ICRC, IOM, IRC, NRC, UNICEF, ACF, Concern Ethiopia, Help Age, People In Need, Save the Children, ZOA, IMC, Islamic Relief.
IN SUPPORT OF STRATEGIC OBJECTIVES 2 AND 3

24
PART I: RESPONSE PART II: OPERATIONAl
5
Implementation and Coordination arrangements
Led by NDRMC and with support of IOM, the Cluster meets at the Federal level on a bi-weekly basis, to ensure coordinated and effective response and mitigate displacements. In Somali region, the Cluster meets on a monthly basis under the leadership of the regional DPPB. Ad hoc coordination forums also take place for response in Afar, Tigray, Gambella and Oromia regions. Strengthening of coordination structure and information management system support at the regional and zonal levels in priority areas, will be vital in 2017. More emphasis will also be placed on monitoring and evaluation as well as accountability to affected populations through feedback and complaint mechanisms.
Strategy
The Cluster aims to expand its activities into disaster risk reduction and rehabilitation assistance in flood-proneareas while also maintaining focus on responding to emergency shelter and household NFI needs of affected and displaced populations.
The immediate humanitarian response will be based on joint assessments carried out following reports of new displacements, as well as verification conducted byGovernment and humanitarian partners. Traditionally the Cluster response modality is based on in-kind provision of emergency shelter and household NFI kits at the family-unit level. While this will remain the majority of the Cluster’s response, studies and pilots will be carried out to explore the feasibility of using cash or voucher system in both emergency response for NFIs, and recovery assistance for shelter in order to increase the flexibility and efficiency ofresponse.
For in-kind responses, emphasis will continue to be placed on minimizing environmental impact and supporting local economies through local sourcing of materials where possible without compromising the quality of assistance. The Cluster will continue to improve NFI kit quality, and advocate for distribution of dignity kits alongside shelter and NFI responses to mitigate the impacts of gender-based violence during displacement. The Cluster, through its technical working group, will also work todefinerecoveryshelterkitstosupportthose who have suffered complete damage to their homes but remain at their place of origin, to contribute to self-recovery effort.
In flood-prone areas, geographicalprioritisation based on priority woredas with history of repeated flood-relateddisplacements and other contributing vulnerabilities will be used to target communities for recovery shelter assistance at place of origin with strong disaster risk reduction and management component. In-depth technical and social economical studies around traditional construction practices will be carried out to provide evidence and framework for response planning. Shelter recovery assistance will include awareness raising campaigns and trainings on safer-construction practices; material and/or conditional cash grants to support shelterimprovementtowardsbetterfloodresilience; and construction of model shelters where appropriate.

25
PART I: RESPONSE PART II: OPERATIONAl
PRIORITY ACTIVITY BENEFICIARIES REQUIREMENTS US$
Activities under SO2
High Flood-prone area rehabilitation and DRR activities (estimated 30%offlooddisplacedpopulationin 2016)
19,200 5,760,000
Activities under SO3
Critical Emergency shelter & NFI kits or Recovery Shelter Kits: 90 per cent of the estimated new displacement in 2017
64,000 8,690,000
Critical Emergency shelter & NFI kits: Remaining gap from 2016 (est. at 30% of existing IDPs - funded)
13,437 0
High Preposition Stock (7,000 funded) 15,000 980,000
Critical Displacement Tracking Matrix 1,400,000
Critical Cluster Coordination 450,000
TOTAL REQUIREMENTS 614,004 ppl
(111,637 HH)
17.2M
The Cluster will coordinate its activities with other sectors as well as working groups including Gender: Cluster partners are advocating to conduct an assessment and distribute dignity kits simultaneously with household NFIs distribution; guidelines for kit content and distribution as per the Dignity Kit Taskforce within the CP/GBV sub-cluster. In terms of protection: Promote good programming that takes intoaccount specificneeds of the most vulnerable groups (eg. the elderly, the disabled, children, child-headed
households, female-headed households and polygamous households), awareness and recognition of protection related incidences and use of appropriate referral mechanisms. Complaint and feedback mechanism will be set-up to ensure accountability to affected populations. The IDPs and Durable Solutions Working Groups also coordinate with the working groups to identify and target those in prolonged displacement for possible support both at the federal and regional levels.

PART II: FOOd
26 5
FOOD
REQUIREMENTS (US$)
598M
PEOPLE TARGETED
5.6M
Context
The 2015 El Niño episode was one of the strongest in modern history. In Ethiopia the El Niño was manifested by severe drought in the northern rangelands of Afar and northern Somali regions and late onset, erratic and poor summer kiremt (long rainy season between June and September) rains in the eastern highlands. In the most drought-affected highland areas, it is estimated that El Niño reduced the 2015-2016 meher harvest by between 50 and 90 per cent. While the cumulative 2016 kiremt rains were normal to above normal to most areas, dry spells in parts of eastern Amhara, eastern and central Oromia, parts of SNNP and eastern, central and southern Tigray resulted in harvest reductions and subsequent food shortages for the most vulnerable households. Of particular concern are the lowland areas in highland woredas.
Over the course of 2016, food consumption improved significantly asa result of humanitarian assistance as well as improved food access from the belg rains. However, negative coping mechanisms continued to be practiced, highlighting the need to support households with recovery and livelihood protection measures.*
In 2016, households’ access to food from their own production remained very low despite some improvements resulting from the belg.
In northern pastoralist areas that experienced unusually high livestock deaths in 2015/16, it is expected that milk and cash income from livestock sale will be lower in 2017, especially in the first six months of the year. Separately,southern pastoralist areas, (7 southern zones of Somali region, southern Oromia pastoralists and South Omo pastoralists
in SNNP) experienced below average October to December rains in 2016. This is likely to lead to low milk productivity as livestock body condition deteriorates and reduced cash income from livestock sale, which in turn could lead to reduced access to food.
Cropping households in meher receiving areas received normal to above-normal 2016 rains. However, pocket areas that experienced dry spells and late onset of rains are expected to result in harvest reductions while poor households in these areas will likely face food shortages. Vulnerable cropping households in belg crop dominant areas that had poor production in 2016 are also likely to experience poor household food security as the main harvest is only expected in July.
Among people targeted for food assistance in 2016, the positive impact of increased levels of emergency food assistance was evident as the rate of inadequate consumption fell by nearly 50 per cent throughout the year.
Targeting
The food response in 2017 will focus on immediate and transitory needs that have
CLUSTER OBJECTIVE 1
1To improve food consumption of targeted households.
CLUSTER OBJECTIVE 2
2Humanitarian shock related food needs prepared and responded to.
IN SUPPORT OF STRATEGIC OBJECTIVES 1 AND 3
Somali
Oromia
Afar
Amhara
SNNPR
Tigray
Gambela
Beneshangul Gumuz
Dire DawaHareri
Addis Ababa
LegendJEOP
NDRMC
WFP
NDRMC, JEOP AND WFP
# OF PARTNERS
xx 3
* WFP household food security survey

PART II: FOOd
27
emerged as a result of shocks such as drought,floodingorconflict.ThePSNPandrelief food are complementary and do not overlapintermsofbeneficiaryhouseholdsand offer a continuum of support to the most vulnerable households. This said, vulnerable segments of the population will be prioritized including people displaced by drought as well as women- and child-headed households.
In the event that resources are not sufficient, prioritization of the most-affected woredas and households will be carried out by the Food Cluster/Sector, led by the NDRMC and assisted by woreda authorities. The category of the woreda in the hotspot ranking, the prevalence of global acute malnutrition and the level of household food insecurity will inform this prioritization. Data supporting this exercise will originate from health and nutrition screening carried out by woreda authorities, the results of the 2016 meher assessment and the WFP Community and Household Surveys.
Main Partners
NDRMC, WFP, JEOP (CRS, CARE, Save the Children International, WVE, FHE, REST, ECC-SDCOH-Harar, ECC-SDCOM-Meki, ORDA).
Implementation and Coordination arrangements
The food response in 2017 will be led by NDRMC, who, together with WFP,
will assist a projected 4.7 million people in close to 327 woredas. The JEOP will provide support to 0.9 million people in 70 priority woredas.
CRS, representing the JEOP consortium, and WFP participate in a monthly NDRMC-led Prioritization Committee Meeting, which is the forum for reviewing the national pipeline and recommending allocations to address the emergency food needs of the country. In addition, CRS and WFP co-lead the Food Cluster/Sector structure. CRS, NDRMC and WFP also participate in monthly Food Aid Management Task Force meetings which meet to discuss operational challenges such as transport and port operations.
Strategy
The 2016 meher assessment concluded that 57 million people will require food assistance in 2017. For the relief response covering 5.6 million people during 2017, NDRMC and WFP will mobilize to cover 4,700,000 people, while the CRS-led JEOP will cover the needs of 939,869 people.
It is essential to consider food assistance, supplementary and therapeutic feeding and WaSH as package of interventions. Evidence shows that failure to distribute food and operate supplementary feeding both undermines the effectiveness of nutrition interventions and causes significant increases in severe acutemalnutrition.
PRIORITY ACTIVITY BENEFICIARIES REQUIREMENTS US$Critical Emergency
Food Assistance (NDRMC /WFP)
4.7M
Critical Emergency Food Assistance (JEOP)
0.9M
TOTAL REQUIREMENTS 5.6M 598M

PART II: hEAlTh
28 5
HEALTH
REQUIREMENTS (US$)
42.8M
PEOPLE TARGETED
4.37M
Context
In 2016, Ethiopia experienced and responded to several El Niño driven adverse events with public health repercussions. These events included outbreaks of diseases such as AWD and scabies, flooding which destroyedhealth facilities in Afar and Somali and displaced more than 200,000 people; drought drove over 450,000 children and 1.8 million pregnant and lactating women to malnutrition.
The drought condition which led to severe shortage of water for hygiene and sanitation predisposed people for AWD and throughout the affected 10 of the 11 regions and city administrations, most zones, sub-cities and woredas. Other sporadic disease outbreaks attributed to the drought that occurred in 2016 included measles, chikungunya (> 900 cases) and dengue fever (>100 cases).
The Government, with support from partners mobilized a robust public health response. The response to the various events over-stretched the health system and required diversion of resources from regular health care services. The response to the anticipated events in 2017 will exert a similar burden on the health system, especially in pastoralist and semi-pastoralist regions. In 2017, the Ministry of Health anticipates that severe acute malnutrition will continue to be a major health problem among children, and lactating and pregnant mothers in areas that are currently affected by the ongoing drought in Somali, Afar, low lands of Oromia, SNNP and pockets areas in other regions. Outbreaks of AWD, meningitis, measles, dengue fever and malaria will remain an anticipated health problems that will affect the population. The ongoing outbreak of AWD in Somali region is aggravated by the dry spells and will continue to pose the risk of the wider expansion of disease to many woredas and even to other parts of the
country. Population displacement due to drought and flooding is also expected.To continue supporting the Government of Ethiopia in its response to various public health emergencies in 2017, a focus on improving access to health care, strengthening outbreak response capacity particularly to communicable disease outbreaks, preparedness and support for life-saving essential health care services in affected areas, is requested.
The goal of the Health Cluster support is to strengthen the capacity of the health system to deliver lifesaving interventions aimed at reducing morbidity and mortality resulting from public health events.
Strategy
The strategies for the response are;
1. Strengthen leadership and coordination of the health response to public health emergencies at all levels (FMoH, RHB, zonal and woredahealthoffices)
2. Strengthen the capacity for emergency preparedness, early detection, response and control of communicable diseases at all levels (FMoH, RHB, zonal and woreda healthoffices)
3. Strengthen the capacity to provide essential health services to populations affected by the humanitarian crisis (pastoralist communities, IDPs, refugees and others).
4. Strengthen capacity to investigate and respond to risks of outbreak.
Targeting
The health sector aims to target some 4.37 million people through coordinated response to the anticipated health conditions and disease outbreaks. This number includes 370,000 IDPs and
CLUSTER OBJECTIVE 1
1To strengthen the capacity of the health system to deliver
lifesaving interventions aimed at reducing morbidity and mortality resulting from public health events.
CLUSTER OBJECTIVE 2
2To detected and responded to epidemic disease outbreaks in high
risk areas.
# OF PARTNERS
xx 24IN SUPPORT OF STRATEGIC OBJECTIVES 1 AND 3

PART II: hEAlTh
29
PRIORITY ACTIVITY BENEFICIARIES REQUIREMENTS US$
Critical Support provision of essential health services and supplies, referral support and outreach services including preventive and curative, routine immunization, support to access and provision of essential health services including emergency reproductive health care services to IDPs and others
Indirect – 4,370,000
individuals
6,300,000
Critical Public health surveillance, prevention and control of the occurrence of communicable disease outbreaks
Indirect – 4,370,000 individuals
3,840,000
Critical Identificationofmalnutrition emergencies, screening and response
Indirect – 3,300,000 individuals
22,870,000
Critical Monitoring and evaluation and technical support to Federal and Regional Health Bureaus, Emergency Operation Centers to strengthen coordination of all-hazards emergency response
MoH and Health Bureaus
9,790,000
TOTAL REQUIREMENTS 4.37M 42.8M
300,000 women and adolescent girls who willbenefit fromemergency reproductivehealth services.
To address the anticipated health hazards and the ongoing disease outbreak response, as well as to strengthen surveillance and to provide essential emergency health care services, it is estimated that $42.8 million is required until the end of 2017.
Main Partners
FMoH, EPHI, Regional Health Bureaus, WHO, UNICEF, UNFPA, UNHCR, ACF, Care, Concern, CDC, CRS, ERCS, GOAL, IMC, IRC, Islamic relief, MSF-France, MSF-Spain, MSF-Holland, Mothers and Children Multi sectoral Development Organization (MCMDO), OXFAM, Save the Children, World Vision, WAHA.

PART II: NuTRITION
30 5
Context
The El Niño induced drought has had the most devastating impact on livelihoods and food security in more than 50 years. At its peak, the number of priority 1, 2 and 3 woredas reached 443, (approximately 60 per cent of Ethiopia). Some 458,000 of severe acute malnutrition and 2.5 million cases of moderate acute malnutrition (1.75 million children and 700,000 pregnant and lactating women) were treated.
Following the onset of the belg and replenishment of water sources, the number of priority woredas was revised down to 420. The number of priority 1 woredas reduced from 219 to 206, with an estimated SAM caseload of 420,000 and 2.36 million MAM cases in 2016.
From January to October 2016, a total of 272,165 children aged 6 and 59 months suffering from SAM were reached with monthly admissions - the highest ever recorded in Ethiopia (compared to 351,969 SAM cases in 2015). Furthermore, since mid-2015 the number of MAM and PLW admissions have continually increased and reached a record high in 2016 with 2.15 million reported cases.
Targeting
The meher assessment is used to re-define the hotspot classification, andcontribute to estimating the number
of MAM, SAM and PLW cases. The number of cases are established based on feeding programme admission trends as of October 2016, survey data and previous analog years such as 2011, while considering risk factors like diseases such as the recent AWD, livestock/livelihood loss, food insecurity associated with the emerging drought and water scarcity in some drought affected areas that directly reduce the quality of water consumed and childcare indirectly. The estimated numbers were further validated by the results of the 2016 meher assessment and theDecember2016hotspotclassification.Thehotspotclassificationcategorized192woredas as priority 1, 174 woredas as priority 2 and 88 woredas as priority 3.
In 2017, an estimated 303,000 SAM cases and 2.7 million MAM cases* (1,371,235 MAM children and 1,372,758 PLWs) are expected to be reached in Ethiopia. These estimated cases consider the highly vulnerable woredas countrywide, though the prioritization for response will focus on areas identified as most vulnerable inpriority 1 and 2 at the very least. Populations with special needs will be considered as necessary including nutrition response for the elderly, women of child bearing age and teenage mothers in particular.
In addition, appropriate infant and young child feeding in emergencies (IYCF-E) support will be given to 1 million children through their caretakers and to 550,000 pregnant and
NUTRITION
REQUIREMENTS (US$)
105.6M
PEOPLE TARGETED
3M
TRENDS IN SEVERE ACUTE MALNUTRITION ADMISSIONS
# OF PARTNERS
xx 32
2016
0
10,000
20,000
30,000
40,000
50,000
DecAugAprJanTypical year average of 2012-2014For comparision of 2011 Horn of Africa drought
2015 monthly admission in August were higher than peak of 2011 crisis
CLUSTER OBJECTIVE 1
1303,000 SAM cases and 2.7 million MAM cases identifiedandtreatedfor
severe and moderate acute malnutrition, ensuring the beneficiarieshaveaccesstoacontinuum of care and IYCF-E support.
CLUSTER OBJECTIVE 2
2Integrated response (at least with WASH, Health, WASH and food)
promoted to mitigate against nutrition vulnerability
CLUSTER OBJECTIVE 3
35,0002 acutely malnourished children from internally displaced
populationtimelyidentifiedand treated with MAM and SAM management services to prevent further impact of the experienced shocks.
IN SUPPORT OF STRATEGIC OBJECTIVES 1,2 AND 3
* WFP targets 1.3 million MAM cases (668,201MAM children and 657,416 PLW)

PART II: NuTRITION
31
lactating women. Special attention will be given to young mothers who need guidance on child care as well as support for their own nutrition wellbeing, who will be targeted with micro-nutrient supplementation.
Main Partners
FMoH, EPHI, NDRMC, UNFPA, UNHCR, UNICEF, WFP, WHO, ACF, Concern WW, FEWSNET, FH-E, GOAL, IMC, Islamic Relief, IRC, Mercy Corps, Save the Children, MCMDO, MSF, Plan International, Red Cross, World Vision, CARE, CRS, CCF-Canada, IOCC, Help Age International, PIN, ZOA.
Implementation and coordination arrangements
The nutrition coordination is led by the Emergency Nutrition Coordinating Unit (ENCU), which sits under NDRMC. As part of the El Niño response, the Federal Ministry of Health has established a Health and Nutrition Incident Command Post, which monitors the overall health situation, the ongoing response, challenges, and mobilizes required support from the Government as well as partners. Continued engagement with this coordination platform will be required as long as it remains operational.
Strategy
The Government and partners have agreed to focus on key nutrition strategies and activities in the at-risk woredas. These include:
1.Improved community-level screening for acute malnutrition in children under 5 years and PLW. This includes periodic screening exercises for acute malnutrition, mobile teams moving to various sites as well as heath extension workers conducting screenings in their areas of coverage.
2.Ensure timely, safe and quality access to CMAM services countrywide (SAM treatment) and in priority woredas (MAM and PLW treatment) including capacity
strengthening of health and nutrition extension workers.
3.Strengthened MAM-SAM continuum of care through the CMAM approach. This includes facilitating a referral system between the two programme components to ensure optimal recovery, capacity strengthening of health workers and their response skills.
4. Enhanced delivery of IYCF-E promotion in woredas through capacity strengthening of health workers, provision of appropriate information, education and communication materials, engagement of community and religious leaders and peer support groups. The optimal coverage of vitamin A supplementation and de-worming for children under-5 will also be sustained.
5.Strengthened coordination and early warning with particular focus on harmonizing strategies and information in sub-regional administrations, timely and quality information flow between theregions and federal levels. Strengthen appropriate linkages and collaboration between Nutrition and WaSH, Health and Food sectors/clusters among others, will be fostered.
The emergency nutrition response is primarily delivered by the Government’s Health Extension Workers (HEWs) with support from humanitarian partners. The HEWs work at the kebele level providing basic preventive and curative health services including the prevention and treatment of acute malnutrition. Nutrition partners play a crucial role in supporting the nutrition response in the priority woredas and overall response quality enhancement. The NGO partners provide technical and logistical support to the Regional Health Bureaus, including delivery of CMAM supplies.
Many at-risk woredas, as per the earlier 2016classification,inSomaliandsouthernSNNP regions were less affected by El Niñothereforedidnotbenefitfromthe2016humanitarian response. Strengthened efforts and support will be made to reach these woredas in 2017 and beyond.

PART II: NuTRITION
32 5
PRIORITY ACTIVITY BENEFICIARIES REQUIREMENTS US$
Critical Management of SAM, including technical and logistical support
303,000 40,200,000
Critical Management of MAM and PLW, including technical and logistical support
• 1,371,235 MAM children 6 to 59 months
• 1,372,758 acutely malnourished PLW
60,500,000
High Infant and Young Child Feeding – Emergency (IYCF-E)
Caregiver of 1 million children 0-23 months and 550,000 pregnant and lactating women
500,000
Critical Malnutrition screening including Vitamin A supplementation and deworming
10.3 million children 6-59 months
2,800,000
High Early warning and coordination
42 nutrition surveys
ENCU coordination platforms in Addis Ababa and six regions
1,600,000
TOTAL REQUIREMENTS 3M 105.6M

PART II: PROTECTION
33
PROTECTION
REQUIREMENTS (US$)
11.1M
PEOPLE TARGETED
0.59M
Context
The Government’s National Policy and Strategy on Disaster Risk Management (2013) recognizes women, children, the elderly, people with disabilities and people living with HIV/AIDS as the most vulnerable to hazards and related disasters. Nearly half of the population in Ethiopia are under 18 years, and women and children constitute the majority of internally displaced populations.
The 2016 meher assessment reported that in two regions more than 1,000 cases of children and 300 cases of elderly who were left behind when parents/caregivers migrated and more than 2,300 children across four regions were reported to have migrated without parents/caregivers.
The depletion of household income and assets caused by the El Niño-induced drought was reported to have exacerbated certain protection risks for children, women and other vulnerable groups during 2016. The Gender Analysis, conducted by cluster partners in 2016, indicated that the drought reduced the productivity, income generating and remunerative activities of both women and men. As men and boys were temporarily migrating with their livestock, the number of female-headed households increased.
The meher assessment also found that the most commonly reported child protection risks (reported in more than 50 per cent of assessed woredas, across most regions) which had significantlyincreased in the last 3 months were: children migrating without parents, child marriage, psychosocial distress, and sexual violence against women and girls (including rape) while moving outside home. Between April and October 2016, across 50 drought-affected kebeles, the Bureaus of Women and Children’s Affairs and Labour and Social Affairs had identified 6,597 unaccompaniedand separated children (59 per cent boys, 41 per cent girls), often associated with the migration of children or their parents in search of livelihood and other
opportunities, and more than 8,800 cases of children (56 per cent boys and 44 per cent girls) in need of child protection services and referrals. The meher assessment noted the linkages between drought (from 2015 and new symptoms in 2016), student absenteeism, child migration and child labour.
During emergency and displacement, women and girls of reproductive age have increased needs of safety, security, as well as hygienic needs, and the exacerbation of pre-existing gender inequalities can put women and girls at higher risk of GBV. The Gender Analysis highlighted the psychosocial impacts of drought on male breadwinners, which may negatively impact the household situation or care of children. The meher assessment reported almost 5,000 cases of domestic violence against women and girls, although data was limited to a few regions, and in three regions the issue of women and girls trading favours or sex for food and survival was raised. The assessment also indicated that 277 cases of sexual violence against women and girls reported in the assessed woredas of Oromia, Afar, Amhara and SNNP regions.
The 2016 meher assessment showed that there is limited access to basic services for the most vulnerable groups mainly people living with disability, the elderly, and IDPs. Furthermore, the meher assessment highlighted the importance of conducting protection mainstreaming activities as well as having protection analysis in most drought affected areas.
In addition, the Inter-Agency Protection field missions conducted in 2016indicated that, displacement situations may place additional strain on the available limited resources, which may also lead to competition over resources between host communities and displaced persons. These reports also highlighted that access to services is not designed to incorporate the needs of vulnerable groups including IDPs amongst affected populations and the need for durable solutions.
CLUSTER OBJECTIVE 1
1Vulnerable groups, including women, girls and boys, are protected
from life threatening protection risks including GBV, neglect, abuse, exploitation and other forms of violence.
CLUSTER OBJECTIVE 2
2Coordination, analysis and monitoring of protection as core
intervention for humanitarian actors is ensured in close collaboration with authorities
# OF PARTNERS
xx 32
IN SUPPORT OF STRATEGIC OBJECTIVES 1 AND 3

PART II: PROTECTION
34 5
Targeting
To prevent, mitigate and respond to the protection risks of vulnerable groups, including through service provision and system strengthening, the Cluster will support 590,000 people. This will include 210,000 emergency-affected population and service providers through general protection monitoring and mainstreaming activities, with the aim to ensure that 10 per cent of the people are with disabilities and the elderly. The identification ofand response to child protection cases (including referrals, as appropriate), and multi-layered psychosocial support, is expected to benefit 70,000 children (50per cent boys, 50 per cent girls) directly. Child Protection actors will also work with more than 100,000 caregivers, family members, community members, social workers, teachers, health workers, police, humanitarian workers and other service providers to facilitate protective care and support for children. In addition, 158,000 women, girls and service providers will benefitfrompriorityGBVpreventionandresponse activities. The Protection and CP/GBV sub-cluster are working closely with partners to facilitate psychosocial support services, case management, increase GBV prevention and establish/strengthen referral systems and roll out of the GBV information management systems (IMS), and provide dignity kits for vulnerable women and girls.
Main Partners
MoWCA, MoH, MoJ, MoLSA, NDRMC, sub-national bureaus, UNICEF, UNFPA, IOM, UNHCR, UN Women, WFP, WHO, Save the Children, IMC, APDA, PAPDA, Plan International, Oxfam, IRC, HelpAge International, Pastoral Concern, Child Fund, NRC, WVI, DRC, SoS, RaDO.
Implementation and coordination arrangements
The Ministry of Women and Children Affairs (MoWCA) and the Bureau of
Women and Children’s Affairs and Bureau of Labour and Social Affairs will continue to lead and coordinate the response of the child protection/gender based violence (CP/GBV) sub-cluster at the national and regional levels. Monthly meetings at the federal and sub-national levels, working in close collaboration with the CP/GBV sub-cluster coordinators and cluster partners. At the federal level, the Protection Cluster is working closely with NDRMC to identify a sector chair, to be supported by the Cluster Coordination team. An IDP sub-working Group established in 2016, under the Protection Cluster, to address IDP protection concerns and advise on durable solutions as appropriate at the federal level, and link with relevant regional level working groups.
Strategy
The effect of emergency in exacerbating pre-existing issues of migration, GBV, child marriage and child labour highlight the importance of strengthening linkages between humanitarian and development actors in 2017 and further building capacities of formal and community based systems to prepare for, prevent and respond to future emergencies. The ultimate goal of all interventions is to provide life-saving protection and support for children, women and vulnerable groups.
The Protection Cluster strategy is two pronged:
1. Ensuring timely, safe and quality access to services for emergency-affected girls, boys, women, people with disabilities, elderly, IDPs and other vulnerable groups, including specialized services (such as for GBV survivors and child protection cases) where needed.
2.Strengthening systems to prevent, mitigate and respond to protection risks, including normative frameworks, institutional capacities, community structures, and application of understanding of protection mainstreaming; alongside service

PART II: PROTECTION
35
provision for the most vulnerable groups. This includes technical expertise, analysis, and advocacy to support the exploration and development of durable solutions for displaced people
All activities will be implemented in line with the global CP Minimum Standards for Child Protection in Humanitarian Action (2012), the Interagency Standard Operating Procedures for Child Protection Case Management Services
for Emergency Response in Ethiopia (2016) and the Inter Agency Standing Committee Guidelines for Integrating GBV into Humanitarian Interventions (2015). Targeted Cluster mainstreaming activities will prioritize the Food, WaSH, Health/Nutrition and Education Clusters to support service design and delivery that issensitivetosexandagespecificneedsand vulnerable groups, and to strengthen inter-cluster referral pathways.
PRIORITY ACTIVITY BENEFICIARIES REQUIREMENTS US$
Activities under SO1
Critical Child protection cases (within or moving from emergency affected areas)areidentified,referredandresponded to
22,500 direct (50% girls, 50% boys)
2,100,000
Critical GBVcasesareidentified,referredandresponded to
10,000 direct Beneficiaries
1,000,000 (GBV)
Critical Equip health facilities with medicines and treatment kits for survivors of sexual violence
Target: 136 health facilities
186,450
Critical Children, parents and caretakers provided with skills and support (including psychosocial) to prevent, mitigate or respond to risks for children
50,000 direct (20,000 girls, 20,000 boys, 5000 women, 5000 men),
1,800,000
Critical Vulnerable women and girls provided with psychosocial support services through WFS
20,000 direct beneficiaries
900,000 (GBV)
High Community members, social workers, teachers, health workers, humanitarian workers, police and other service providers are provided with knowledge and skills to identify, prevent and respond to child protection cases and GBV risks
195,000 indirect beneficiaries(100,000 GBV, 95,000 CP) (50% women targeted)
600,000 (CP)
1,000,000 (GBV)

PART II: PROTECTION
36 5
High Reproductive age women and girls provided with dignity kits
67,000 1,540,000
Activities under SO3
Critical Governmentalofficial,humanitarianworkers and other service providers are provided with knowledge and skills to identify, prevent and respond to protection risks as well strengthening coordination on durable solutions for IDPs and other affected population
150,000 280,000
Critical CP and GBV cases within IDP or conflict-affectedcommunitiesareidentified,referredandrespondedto
2,500 (CP)
3,000 (GBV)
230,000 (CP)
250,000 (GBV)
High Establish and strengthen GBV information management system
Target: 37 woredas
560,000
Critical IDP children, women and carers provided with skills and psychosocial support
5,000 (CP)
5,000 (GBV)
270,000 (CP)
300,000 (GBV)
High Monitoring and evaluation activities to assess and analyze protection risks and the effectiveness of response in reducing risks
60,000 (indirect)
120,000
TOTAL 590,000 11.1M

PART II: wATER, SANITATION ANd hYGIENE
37
WATER, SANITATION AND HYGIENE
REQUIREMENTS (US$)
86.4M
PEOPLE TARGETED
9.2M
Context
Some 57 per cent of Ethiopia’s population has access to safe water sources, with coverage higher in urban areas (92 per cent) as compared to rural areas (45 per cent). According to the 2015 Joint Monitoring Programme (JMP), 29 per cent people in Ethiopia practice open defecation and some 43 per cent have access to shared latrine or unimproved latrine.
The 2015/16 El Niño WaSH response focused on facilitating access to water and supporting response to public health risks. As of October 2016, the WaSH Cluster partners have reached to 4.6 million people with emergency water supply, 1.4 million people with the household water treatment chemicals provision and 3.5 million people with sanitation and hygiene promotions.
The 2016 meher assessment indicates that some 6.4 million people living in 200 woredas are still living in acute water scares areas. This is due to increased non-functionality of water points in the
identifiedworedas, poor rain and lowering of ground water levels. Lack of WaSH facilities and water supply systems were alsoidentifiedinmanyschoolsandhealthcentres.
Additionally, according to the joint UNICEF and Hydrogeological Department of Addis Ababa University analysis on the impact of drought on ground water availability, below-average rainfall reduced the ground water table and its recharge. The analysis shows that in woredas prioritised by WaSH Cluster, accessing ground water is becoming increasingly complex. Ground water is the primary water source for 80 per cent of the population in Ethiopia.
As required, urgent water supply needs will be assessed in rapid WaSH assessment that will inform response plans to address emergency water supply needs.
The Government and WaSH partners began response to AWD in Moyale woreda, Liben zone in Somali region when the outbreak began in November 2015. Since then, AWD outbreaks have been
CLUSTER OBJECTIVE 1:
1Save lives by responding to emergencies through improved coordination at all levels, to
deliver water, sanitation and hygiene promotion assistance to affected populations.
CLUSTER OBJECTIVE 2
2Prepare for humanitarian shocks – flooding, conflict and displacement and be well-
positioned to provide WaSH services during the response phase of an emergency.
# OF PARTNERS
xx 48IN SUPPORT OF STRATEGIC OBJECTIVES 1 AND 3
HARERIADDIS ABABA
AFARAMHARA
BENISHANGULGUMUZ
DIRE DAWA
GAMBELA
OROMIASNNP
SOMALI
TIGRAY
Legend
Water trucking as of 21 Jan 20172017 WaSH hotspot woredas
123
SOUTH SUDAN
SUDAN
KENYASOMALIA
DJIBOUTI
ERITREA
UGANDA
SUDAN
WASH hotspot Woredas Vs Water trucking as at Jan- 21-2017WASH HOTSPOT WOREDAS VS WATER TRUCKING AS OF JAN 21, 2017

PART II: wATER, SANITATION ANd hYGIENE
38 5
reported in all regions in approximately 351 woredas (including 120 woredas in Addis Ababa). To effectively respond to the AWD outbreak, the WaSH Cluster in coordination with health stakeholders continues working to ensure household water safety and security, and hygiene promotions.
Targeting
In 2017, the WaSH Cluster will target IDPs, vulnerable rural and urban communities, and health and education facilities. The 2017 plan, largely an expansion of 2016 activities will target 9,173,078 people with a focus on activities that support 1) Increasing access to safe water in Indian Ocean Dipole (IOD) affected communities and, 2) WaSH response to water/vector borne disease outbreaks.
Humanitarian response will target in hotspot priority 1 woredas where - the amount of water supply is less than 5 liters per person per day, water trucking distance is more than 20 kilometers, the level of malnutrition is severe, increased cases of water/vector borne diseases (including AWD, Scabies, etc.) exist, and reduced livestock productivity or increased animal death is present.
To improve the response quality in 2017, the WaSH Cluster will address specificWaSH needs of vulnerable groups including pastoralist communities, IDPs, the elderly, people living with disabilities, women, boys and girls while prioritizing safety and dignity, facilitating meaningful access to WaSH services, accountability, participation and empowerment of people targeted for WaSH cluster support.
Main Partners
FMoWIE and regional water bureaus, FMoH and regional health bureaus, NDRMC, ONEWASH/CWA development partners (UNICEF, OCHA, DFID, IDA, AFDB, JICA, USAID, GoF, WB); 34 NGOs OXFAM, IRC, Save the children, CARE, Islamic Relief, Plan International, NRC, DRC, GOAL, ACF, IMC, PIN, Action Aid, AMREF, CCF Canada, Child
Fund, CISP, CRS, ERCS, ICRC, FHE, IAS, NCA, WV, REST, VSF; private sector WaSH service providers.
Implementation and coordination arrangements
The Ministry of Water, Irrigation and Electricity and the Ministry of Health will continue to lead and coordinate the response at federal and sub-national levels working in close collaboration with the Emergency WaSH Task Force (ETF) and the Water Sector Working Group (WSWG). Regular meetings at the federal and regional levels will enable information sharing through the 4Ws matrix. Coordination of WaSH actors at the woreda level will be strengthened, for equitably distributed WaSH services.
Monthly meetings at federal level are complemented by alternate meeting of AWD response partners’ meeting chaired by WHO and co-chaired by the WaSH Cluster.
Inter-cluster/sector information exchange with the health and nutrition emergency task forces will be reinforced at the Government-led command post and federal/regional coordination bodies.
Cluster/sector partners will ensure that interventions undertaken are in line with the Government’s National Emergency Response Plan. To ensure the longer term impact, cluster/sector partners including UNICEF, are dedicating resources to communication and advocacy campaigns that aim to show families how to improve daily sanitation and hygiene practices.
Strategy:
The Cluster/Sector response strategy is two-pronged - focus on rehabilitating existing boreholes/water points rather than digging new ones, where infrastructures exist. In hard to reach areas such as parts of Oromia lowlands, Somali and Afar, drilling and construction of emergency boreholes would be the most cost-effective response. Water trucking, according to the National Water

PART II: wATER, SANITATION ANd hYGIENE
39
Trucking Guidelines developed by the Cluster/Sector, is a last resort. Water trucking will be triggered as a “bridging measure” while drilling and rehabilitating is being undertaken. Water provision – quantity and quality – will be according to National Water Quality standards. The minimum is 15 litres per person per day. Forwater trucking the threshold is five
litres per person per day. Provision of water treatment chemicals (along with essential WaSH NFIs and community mobilisation) will be prioritized in areas where ponds and surface water (unsafe) are available with perceived high water/vector borne risks.
PRIORITY ACTIVITY BENEFICIARIES REQUIREMENTS US$
Water: Access to safe water through provision of :Critical Water: Access to safe water
through provision of
• Rehabilitation and upgrade of water points
• Operation and maintenance of water points
• Emergency water supply at crucial points – water trucking and EMWAT kits
• Repair and maintenance of water supply / sanitation at institutional level in high priority locations (Schools, Health centres etc.)
2,682,830 37,559,620
High • New water points / sources / system construction in crucial areas
• New construction of WaSH facilities at institutional level in high priority locations (Schools, Health centres etc.)
445,912 22,295,600
WASH response to minimize public health risks
Critical (water / vector borne diseases)• Household water safety and
security (Provision of water treatment chemicals, WASH NFIs and awareness raising in urban and rural communities)
• Promotion of Safe sanitation and hygiene (e.g. soap for personal hygiene and cleaning, C4D activities and materials, etc)
4,835,469 9,670,938

PART II: wATER, SANITATION ANd hYGIENE
40 5
High • Operation and maintenance of water points
• Rehabilitation and upgrade of water points
• Emergency water supply at crucial points – water trucking and EMWAT kits
• Repair and maintenance of water supply / sanitation at institutional level in high priority locations (Schools, Health centres etc.)
1,208,867 16,924,138
TOTAL REQUIREMENTS 9.2M 86.4M

41
PART I: RESPONSE PART III: ANNExES
Regional Needs Snapshots: Meher Assessment Results2016 Government of Ethiopia and Donor contributionCoordination Structure in Ethiopia
PART III: ANNEXES

42 5
PART III: ANNExES
Red
Sea
Food
inse
cure
pop
ulat
ion
tren
d (in
thou
sand
s)B
ASE
LIN
E D
ATA
SEA
SON
AL
PER
FOR
MA
NC
E• T
he 2
016
Kar
ma
rain
in A
far r
egio
n is
cha
ract
eriz
ed b
y no
rmal
ons
et,
erra
tic d
istri
butio
n an
d ea
rly c
essa
tion.
• T
he im
pact
of t
he ra
infa
ll on
the
brow
se a
nd p
astu
re c
ondi
tion
has
been
goo
d in
all
the
visi
ted
wor
edas
exc
ept i
n Zo
ne 4
and
Arg
oba
Spe
cial
Wor
eda
in Z
one
3.
CO
PIN
G M
ECH
AN
ISM
S• T
he m
ajor
cop
ing
stra
tegi
es p
ract
iced
in th
e re
gion
are
sal
es o
f liv
esto
ck (d
esto
ckin
g an
d ad
ditio
nal i
ncom
e), m
igra
tion
with
in a
nd o
ut o
f th
e re
gion
(in
som
e ca
ses
even
to n
ear-
by c
ount
ry) a
nd d
epen
denc
e on
re
lief f
ood.
CU
RR
ENT
RES
PON
SE•
3,61
2 H
ouse
hold
s di
spla
ced
by d
roug
ht a
nd f
lood
rec
eive
d E
S/
NFI
su
ppor
t.
• 54
9,08
6 ch
ildre
n (6
-59
Mon
ths)
hav
e be
en s
cree
ned
betw
een
May
to
Oct
ober
201
6.
• Th
e w
ater
tru
ckin
g se
rvic
es a
re s
till r
unni
ng in
Elid
aar
(3-tr
ucks
) an
d G
ewan
e (2
-truc
ks) b
y G
over
nmen
t and
Priv
ate
sect
ors.
IMPA
CT
• In
Kar
ma
seas
on c
rop
prod
uctio
n w
as s
erio
usly
cha
lleng
ed b
y flo
od in
Zo
ne 1
, 2 a
nd 3
and
sho
rtage
of r
ainf
all i
n A
rgob
a S
peci
al w
ored
a.
• In
Arg
oba
Spe
cial
wor
eda
mos
t of t
he c
ultiv
ated
land
faile
d at
flow
erin
g st
age
due
to s
horta
ge o
f rai
nfal
l, fa
rmer
s w
ere
oblig
ed to
feed
the
stov
er
to li
vest
ock.
• In
the
20 a
sses
sed
wor
edas
a to
tal o
f 12,
439
child
ren
have
bee
n tre
ated
fo
r SA
M d
urin
g la
st 6
mon
ths.
The
curr
ent n
umbe
r is
high
er th
an la
st y
ear.
• Th
e av
erag
e pr
oxy
GA
M a
nd p
roxy
SA
M a
re 2
0.8%
and
1.4
%
resp
ectiv
ely.
• E
xcep
t K
oneb
a, A
fder
a, G
ulin
a, T
eru,
Tel
alak
and
Dal
ifage
wor
edas
du
ring
the
last
six
mon
th A
WD
out
brea
k w
as r
epor
ted
from
maj
ority
of
asse
ssed
wor
edas
.
• AW
D,
diar
rhea
, m
alar
ia,
mes
ales
and
pne
umon
iaar
e M
ajor
mor
bidi
ty
caus
es o
f und
er-fi
ve c
hild
ren
in th
e re
gion
.
• To
tal o
f 64
kebe
ls a
re id
entif
ied
as c
ritic
al w
ater
sho
rtage
are
as w
hich
in
clud
es 3
03,2
34 in
divi
dual
s.
• 14
% w
ater
sch
emes
are
not
fun
ctio
nal
in t
he r
egio
n. 1
6 m
otor
ized
sc
hem
es w
ill n
eed
urge
nt m
aint
enan
ce a
nd re
habi
litat
ion.
• 5,6
08 d
ispl
aced
hou
seho
lds
are
in d
ire n
eed
of N
FIs.
• 75%
of t
he a
sses
sed
scho
ols
do n
ot h
ave
safe
wat
er.
KEY
REC
OM
MEN
DAT
ION
S• S
calin
g up
of S
AM
-MA
M c
ontin
uum
of c
are.
• Est
ablis
h an
d fu
nctio
naliz
e th
e M
ulti-
sect
oral
PH
EM
coo
rdin
atio
n fo
rum
at
all
leve
ls a
nd fo
llow
-up
as p
er th
e TO
Rs.
• Exp
and
emer
genc
y sh
ool-f
eedi
ng p
rogr
ame
to o
ther
sch
ools
.
• Wat
er tr
ucki
ng in
all
wat
er s
horta
ge a
reas
.
1.7
mill
ion
(CS
A 2
016)
Live
lihoo
d:
Rai
nfal
l C
alen
dar:
Pop
ulat
ion:
past
oral
ism
(90%
) and
agr
o pa
stor
alis
m (1
0%)
sugu
m (M
arch
- A
pril)
, kar
ma
(Jul
y - S
epte
mbe
r)
0
100
200
300
400
2017
2016
2015
2014
2013
2012
2011
6-ye
ar a
vera
ge
HO
TSPO
T W
OR
EDA
S A
S O
F D
ECEM
BER
201
6
Rel
ief f
ood
bene
ficia
ries
per m
onth
(201
6 Ja
n. -
2016
Dec
.) (in
mill
ions
)
In 2
016,
ad
hoc
assi
stan
ce w
as p
rovi
ded
to 3
2,46
6 flo
od v
ictim
sin
May
(not
incl
uded
in th
e H
RD
).
25%
of t
he re
gion
’s p
opul
atio
n re
quire
s fo
od a
ssis
tanc
e
415,
987
re
quire
food
ass
ista
nce
Lege
nd Prio
rity
1
Prio
rity
2
Prio
rity
3
Afa
r Reg
ion:
Meh
er A
sses
smen
t Sum
mar
y (a
s of
Dec
embe
r 201
6)
0
0.1
0.2
0.3
0.4
0.5
Dec
Jun
# of
ben
efic
iarie
sJa
n

43
PART III: ANNExES
Red
Sea
Food
inse
cure
pop
ulat
ion
tren
d (in
mill
ions
)B
ASE
LIN
E D
ATA
SEA
SON
AL
PER
FOR
MA
NC
E•T
he 2
016
meh
er s
easo
n ra
infa
ll co
uld
be r
ated
as
norm
al a
nd a
bove
no
rmal
in th
e re
gion
whi
ch h
as c
ontri
bute
d to
a g
ood
prod
uctio
n of
cro
ps
in m
id &
hig
hlan
d ar
eas
in a
dditi
on to
impr
ovin
g an
imal
feed
and
wat
er in
lo
wla
nd a
reas
.
•How
ever
, th
e se
ason
was
cha
ract
eriz
ed b
y di
ffere
nt n
atur
al h
azar
ds:
moi
stur
e st
ress
, exc
ess
rain
s, h
ails
torm
, fro
st, p
est &
cro
p di
seas
e, th
at
affe
cted
a s
igni
fican
t num
ber o
f hou
seho
ld li
velih
oods
in p
ocke
t are
as o
f th
e re
gion
.
•Bel
ow n
orm
al y
ield
was
repo
rted
from
poc
ket l
owla
nd a
reas
bec
ause
of
moi
stur
e st
ress
and
ear
ly c
essa
tion
of t
he r
ainf
all,
due
to e
xces
sive
ra
infa
ll, h
ail s
torm
and
fros
t haz
ards
in h
igh
and
mid
land
s.
CO
PIN
G M
ECH
AN
ISM
S•D
ecre
ase
in q
uant
ity &
num
ber o
f mea
ls, b
orro
win
g fo
od a
nd c
ash,
and
la
bor
mig
ratio
n to
oth
er z
one
and
near
-by
regi
on
are
the
mai
n co
ping
m
echa
nism
s ad
opte
d by
the
vuln
erab
le h
ouse
hold
s.
• 37
wor
edas
in 8
zon
es h
ave
criti
cal w
ater
sho
rtage
.
• Lim
ited
acce
ss to
dis
tribu
tion
of re
lief f
ood
have
bee
n re
porte
d.
Abs
ence
of w
ater
sou
rces
with
in p
roxi
mat
e di
stan
ce h
as a
ffect
ed th
e liv
es o
f the
com
mun
ity m
ainl
y w
omen
and
chi
ldre
n.
CU
RR
ENT
RES
PON
SE•V
acci
ne c
over
age
for m
easl
es w
as 9
0% a
nd a
bove
. SIA
was
giv
en o
nly
for h
otsp
ot w
ored
as.
•The
wor
eda
DP
PC
s fa
cilit
ate
infra
stru
ctur
es fo
r tra
nspo
rtatio
n of
wat
er to
S
choo
ls, H
ealth
Inst
itutio
ns a
nd p
ublic
ser
vice
em
ploy
ed w
ho a
re w
orki
ng
the
kebe
les
that
can
not b
e re
ache
d by
oth
er m
eans
tran
spor
tatio
n.
•Nut
ritio
nal s
uppl
ies
are
ava
ilabl
e in
all
thre
e vi
site
d di
stric
t hea
lth o
ffice
s fo
r thr
ee m
onth
s.
KEY
REC
OM
MEN
DAT
ION
S• S
uppl
ies
and
logi
stic
s sh
ould
be
cont
inuo
usly
ava
ilabl
e at
hea
lth
faci
litie
s
• Stre
ngth
en s
urve
illan
ce a
t all
leve
ls a
nd a
lloca
te a
dequ
ate
emer
genc
y fu
nd a
t all
leve
ls.
• Wat
er tr
ucki
ng s
houl
d be
a p
riorit
y ac
tion
in c
ritic
al w
ater
sho
rtage
ke
bele
s in
the
com
ing
dry
perio
d an
d di
strib
utio
n of
hou
seho
ld w
ater
tre
atm
ent c
hem
ical
s.
• The
com
mun
ity m
embe
rs a
nd D
PP
Cs
stro
ngly
reco
mm
ende
d pr
ovis
ion
of c
anva
s ba
gs a
t hou
seho
ld le
vel t
o su
ppor
t col
lect
ion
of w
ater
by
load
ing
on p
ack
anim
als
to th
e hi
lly a
reas
.
• Wat
er tr
ucki
ng in
crit
ical
are
as a
nd re
habi
litat
ion
of n
on-fu
nctio
nal
wat
er s
chem
es.
IMPA
CT
• A to
tal a
rea
of 3
,510
,809
hec
tare
s (9
9%) o
f the
pla
nned
3,5
32,4
69
hect
are
arab
le la
nd h
as b
een
plan
ted
with
diff
eren
t cro
ps.
• Agr
icul
ture
pro
duct
s of
the
regi
on h
ave
incr
ease
d by
4%
and
be
nefic
iarie
s al
mos
t dec
reas
ed b
y 43
% to
85%
com
pare
d to
last
yea
r.
• Pric
es o
f tef
f and
mai
ze ro
se b
y 15
% a
nd 3
.5%
whi
le w
heat
and
bar
ley
decl
ined
by
12%
& 1
1% re
spec
tivel
y.
• Ave
rage
incr
emen
t in
the
pric
e of
ox,
cow
and
sho
ats
are
18%
,18%
an
d 25
% re
spec
tivel
y.
• A to
tal o
f 1,1
33,4
59 u
nder
five
chi
ldre
n sc
reen
ed in
Oct
ober
201
6,
5,06
4 an
d 86
,906
wer
e S
AM
and
MA
M re
spec
tivel
y.
• Pro
xy G
AM
for p
regn
ant a
nd le
ctat
ing
wom
nen(
PLW
) has
pea
ked
in
July
and
dro
pped
the
follo
win
g m
onth
by
72%
, w
hich
mig
ht re
quire
fu
rther
inve
stig
atio
n.
• Am
ong
six
visi
ted
heal
th p
osts
(HP
s), w
ater
is a
vaila
ble
only
in o
ne H
P an
d fo
ur re
porte
d sh
orta
ge o
f the
rape
utic
sup
plie
s fo
r the
com
ing
thre
e m
onth
s
• Hig
h tu
rnov
er o
f tra
ined
PH
EM
and
nut
ritio
n of
ficer
s an
d he
alth
w
orke
rs h
as b
een
repo
rted.
20.7
mill
ion
(CS
A 2
016)
Live
lihoo
d:
Rai
nfal
l C
alen
dar:
Pop
ulat
ion:
100%
agr
aria
n (m
ixed
cro
ppin
g an
d liv
esto
ck)
belg
(Mar
ch-M
ay) a
nd k
irem
t (Ju
ne-S
epte
mbe
r)
HO
TSPO
T W
OR
EDA
S A
S O
F D
ECEM
BER
201
6
Rel
ief f
ood
bene
ficia
ries
per m
onth
(201
5 Ja
n. -
2016
Dec
.) (in
mill
ions
)
In 2
016,
ad
hoc
assi
stan
ce w
as p
rovi
ded
to 3
3,63
5 flo
od v
ictim
sin
Jan
uary
and
Apr
il (n
ot in
clud
ed in
the
HR
D).
00.
5
1.0
1.5
2.0
2.5
2017
2016
2015
2014
2013
2012
2011
6-ye
ar a
vera
ge
00.
5
1.0
1.5
2.0
2.5
30.
2015
2016
Dec
Jun
Jan
3% o
f reg
ion’
s po
pula
tion
requ
ires
food
ass
ista
nce
649,
751
requ
ire fo
od a
ssis
tanc
eLe
gend Prio
rity
1P
riorit
y 2
Prio
rity
3
Am
hara
Reg
ion:
Meh
er A
sses
smen
t Sum
mar
y (a
s of
Dec
embe
r 201
6)

44 5
PART III: ANNExES
Red
Sea
BA
SELI
NE
DAT
A
SEA
SON
AL
PER
FOR
MA
NC
E•T
he o
nset
of r
ain
was
tim
ely
in a
ll zo
nes
of th
e re
gion
. G
ener
ally,
the
dist
ribut
ion
and
amou
nt w
ere
sim
ilar t
o no
rmal
ye
ars
in m
ost o
f the
wor
edas
of t
he re
gion
.
In A
ssos
a zo
ne, t
he o
nset
was
nor
mal
exc
ept i
n O
da B
idig
ilu a
nd
She
rkol
e w
ored
a, w
here
it w
as d
elay
ed to
the
begi
nnin
g of
Jun
e.
The
amou
nt a
nd d
istri
butio
n of
rai
ns w
as g
ood
for
crop
gro
wth
an
d liv
esto
ck p
erfo
rman
ce. H
owev
er, a
dver
se w
eath
er c
ondi
tions
(h
ails
torm
and
stro
ng w
ind)
hav
e af
fect
ed c
rops
(so
rghu
m, t
eff,
pepp
er a
nd m
aize
) in
poc
ket
kebe
les
of A
ssos
a B
amba
si a
nd
Hom
osha
wor
edas
.
CO
PIN
G M
ECH
AN
ISM
STh
e m
ajor
co
ping
st
rate
gies
ar
e:
rely
ing
on
less
pr
efer
red
food
/che
aper
or
low
qua
lity
food
, lim
it f
requ
ency
and
siz
e of
m
eal,
agric
ultu
ral l
abou
r, hu
ntin
g an
d ga
ther
ing
of w
ild fo
od/ro
ots
.
KEY
REC
OM
MEN
DAT
ION
S• C
apac
ity b
uild
ing
for h
ealth
wor
kers
& h
ealth
ext
ensi
on w
orke
rs
on p
rope
r SA
M a
nd M
AM
cas
es m
anag
emen
t, pr
oper
reco
rdin
g of
per
form
ance
and
repo
rting
.
• Stre
ngth
en s
ecto
ral c
oord
inat
ion
and
info
rmat
ion
flow
to c
ontro
l AW
D.
• Stre
ngth
en th
e m
ulti-
sect
oral
PH
EM
task
forc
es a
t all
leve
ls w
ith
regu
lar m
eetin
g w
ith d
ocum
ente
d m
inut
es.
• Reh
abili
tatio
n of
non
-func
tiona
l wat
er s
chem
es.
IMPA
CT
•The
tota
l pla
nted
are
a ha
s be
en in
crea
sed
by 5
.76%
com
pare
d to
last
yea
r.
• Meh
er p
rodu
ctio
n is
est
imat
ed to
incr
ease
by
26.7
% c
ompa
red
to la
st y
ear.
• E
noug
h qu
antit
iy o
f pas
ture
and
wat
er is
ava
ilabl
e fo
r liv
esto
ck
cons
umpt
ion,
live
stoc
k bo
dy c
ondi
tion
is a
lso
good
.
• In
met
kel z
one
the
pric
e of
maj
or c
erea
ls (m
aize
, sor
ghum
and
ca
sh c
rop)
are
ver
y lo
w, w
hich
is f
avou
ring
the
farm
ers.
Far
mer
s ar
e sw
itchi
ng to
oth
er c
rops
• AW
D is
stil
l ong
oing
thou
gh th
e nu
mbe
r of
cas
es h
as d
eclin
ed
now
, no
case
has
bee
n re
porte
d fo
r the
last
2 w
eeks
.
• Inc
reas
e of
SA
M c
ases
has
bee
n re
porte
d in
Met
ekel
zon
e.
• 51
1 (1
7%)
wat
er
sche
mes
ar
e no
n-fu
nctio
nal
in
the
regi
on.W
ater
sup
ply
cove
rage
in a
ll vi
site
d w
ored
as is
less
than
70
%.
•Incr
ease
d m
igra
tions
of a
dole
scen
t and
you
th fr
om P
awi w
ored
a to
oth
er a
reas
hav
e be
en o
bser
ved.
•Wat
er p
oint
s ar
e no
t lo
cate
d in
pro
xim
ate
dist
ance
whi
ch h
as
impa
ct o
n m
eani
ngfu
l acc
ess
of w
ater
sou
rces
.
1.0
mill
ion
(CS
A 20
16)
Live
lihoo
d:
Rai
nfal
l C
alen
dar:
Pop
ulat
ion:
agric
ultu
re (1
00%
)
meh
er (J
une-
Sep
tem
ber)
,
Ben
isha
ngul
Gum
uz R
egio
n: B
elg
Ass
essm
ent S
umm
ary
(as
of D
ecem
ber 2
016)
2% o
f reg
ion’
s po
pula
tion
requ
ire fo
od a
ssist
ance
20,9
99re
quire
food
ass
ista
nce
Food
inse
cure
pop
ulat
ion
tren
d (in
mill
ions
)
0
285684
Dec
Jun
Jan
Rel
ief f
ood
bene
ficia
ries
per m
onth
(201
5 Ja
n. -
2016
Dec
.) (in
thou
sand
s)
0.00
0.01
0.02
0.03
0.04
0.05
0.06
0.07
0.08
2017
2016
2015
2014
2013
2012
2011
6-ye
ar a
vera
ge
2015
2016

45
PART III: ANNExES
Red
Sea
BA
SELI
NE
DAT
A
SEA
SON
AL
PER
FOR
MA
NC
E• T
he m
eher
rain
sta
rted
in ti
me,
but
with
inad
equa
te a
mou
nt a
nd e
rrat
ic
dist
ribut
ion.
The
rain
in th
e lo
wla
nd 9
keb
eles
was
muc
h be
low
nor
mal
. O
vera
ll,
ther
e w
as
insu
ffici
ent
rain
fall
with
an
er
ratic
an
d un
even
di
strib
utio
n, b
oth
spat
ially
and
tem
pora
lly. T
here
was
a d
ry s
pell
in J
une,
Ju
ly a
nd S
epte
mbe
r. In
mid
land
are
as, t
he c
ondi
tions
wer
e be
tter
than
la
st y
ear.
• E
rrat
ic d
istri
butio
n an
d dr
y sp
ells
hig
hly
affe
ctin
g th
e cr
op g
row
th
espe
cial
ly i
n lo
wla
nd a
nd s
emi
low
land
are
as.
This
cre
ated
fav
orab
le
cond
ition
s fo
r inf
esta
tion
of s
talk
bor
ers
on s
orgh
um a
nd fo
r the
spr
ead
of
strig
a w
eed,
whi
ch is
resp
onsi
ble
for t
he s
tunt
ed g
row
th o
f cro
ps re
sulti
ng
in a
yie
ld r
educ
tion
of 1
2.5%
of s
orgh
um a
nd th
e to
tal l
oss
of m
aize
in
low
land
are
as.
CO
PIN
G M
ECH
AN
ISM
S• N
orm
ally,
maj
or c
opin
g m
echa
nism
s in
the
regi
ons
are
reta
il m
arke
ting
of v
eget
able
s, in
crea
sed
firew
ood
and
char
coal
sal
es, u
rban
labo
r in
Har
are
tow
n, c
hat h
arve
stin
g, li
vest
ock
sale
s an
d fo
od a
ssis
tanc
e.
KEY
REC
OM
MEN
DAT
ION
S• P
rovi
de s
choo
l fee
ding
whe
re th
e dr
ough
t em
erge
ncy
is s
ever
e an
d ha
s a
grea
t pos
sibi
lity
to c
ause
sch
ool d
rop
outs
.• M
aint
enan
ce o
f dam
aged
wat
er s
chem
es.
• Cap
acity
bui
ldin
g fo
r vac
cine
man
agem
ent s
yste
m o
f mea
sles
i.e.
col
d ch
ain,
tran
spor
tatio
n, tr
aini
ng o
f hea
lth w
orke
rs m
ust b
e cr
oss
chec
ked
agai
nst r
epor
ted
mea
sles
cas
es a
nd d
eath
s.• M
ulti-
sect
oral
col
labo
ratio
n m
ust b
e es
tabl
ishe
d an
d re
spon
se ti
mel
y to
an
y ki
nd o
f dis
ease
out
brea
ks a
t reg
iona
l lev
el.
IMPA
CT
• Pla
ntat
ion
was
late
by
two
wee
ks in
the
mid
land
are
as, i
t was
on
time
in
low
land
are
as.
• M
oist
ure
stre
ss a
t la
te v
eget
ativ
e to
flo
wer
ing
stag
es in
the
low
land
s co
ntrib
uted
to s
igni
fican
t yie
ld re
duct
ion.
•
Pla
ntat
ion
area
s in
crea
sed
by 9
% c
ompa
red
to t
he a
vera
ge o
f la
st 5
ye
ars
(201
0-20
15) p
lant
atio
n.•
Due
to b
elg
failu
re a
nd b
elow
nor
mal
rai
ns o
f meh
er, w
ater
ava
ilabi
lity
for l
ives
tock
has
dec
reas
ed.
• Pric
e fo
r sta
ple
cere
als
cont
inue
d to
incr
ease
thro
ugh
Oct
ober
201
6 bu
t a
chan
ge is
ant
icip
ated
upo
n co
mpl
etio
n of
meh
er h
arve
st.
• R
ecen
t pric
es in
dica
te a
ris
ing
trend
bot
h fo
r st
aple
food
and
live
stoc
k m
arke
ts.
• AW
D h
as b
een
repo
rted
as m
ajor
hea
lth p
robl
em in
the
reg
ion,
352
ca
ses
have
bee
n re
porte
d fro
m J
uly
to O
ctob
er 2
016.
• Th
e to
p fiv
e ca
uses
of m
orbi
dity
in u
nder
five
: Dia
rrhe
a (N
on b
lood
y),
Acu
te U
pper
Res
pira
tory
Tra
ct I
nfec
tion
(AU
RTI
), P
neum
onia
, A
cute
Fe
brile
illn
ess
(AFI
) and
Hel
min
thia
sis.
• Th
e de
clin
e ha
s be
en s
een
in th
e m
alnu
tritio
n ad
mis
sion
whi
le G
AM
, M
AM
and
SA
M ra
tes
are
1.9%
, 2.5
% a
nd 4
.34%
resp
ectiv
ely.
• 31%
wat
er s
chem
es a
re n
ot f
unct
iona
l in
the
regi
on w
hile
18
rura
l pip
e sy
stem
s ar
e no
t wor
king
at a
ll.• S
choo
l dro
p-ou
t has
dec
reas
ed fr
om 7
.6%
to 4
.7%
sin
ce to
last
yea
r.
0.23
mill
ion
(CS
A 2
016)
Pop
ulat
ion:
Rel
ief f
ood
bene
ficia
ries
per m
onth
(2
016
Jan.
- 20
16 J
un.)
(in th
ousa
nds)
14,5
00
requ
ire fo
od a
ssis
tanc
e
Har
ari
Dire
Daw
a
SEA
SON
AL
PER
FOR
MA
NC
E• T
he k
irem
t/meh
er ra
in w
as b
elow
nor
mal
in J
uly,
abo
ve n
orm
al ra
in w
as
repo
rted
durin
g th
e en
d of
Jul
y. T
he r
ain
ceas
ed d
urin
g fir
st h
alf
of
Sep
tem
ber w
hich
is e
arlie
r tha
n th
e no
rmal
tim
e.
•Out
of
the
plan
ned
13,1
49 h
a la
nd o
nly
11,9
77 h
a w
as c
ultiv
ated
and
pl
ante
d w
ith s
orgh
um a
nd m
aize
.
•Sup
ply
of s
tapl
e ce
real
s ex
perie
nced
sea
sona
l dec
line
durin
g th
e pe
ak
lean
per
iod
(Jun
e to
Sep
tem
ber)
.
•The
num
ber
of S
AM
cas
es i
ncre
ased
as
com
pare
d w
ith
resp
ectiv
e m
onth
s of
201
5 (M
ay-O
ctob
er 2
015)
exc
ept f
or th
e m
onth
s of
Sep
tem
ber
and
Oct
ober
whi
ch s
how
ed a
slig
ht d
ecre
ased
due
to b
ette
r pr
oduc
tion
durin
g th
ese
mon
ths.
•In
the
last
re
porti
ng
quar
ter
38
case
s of
ph
ysic
al
viol
ence
w
ere
pres
ente
d to
pol
ice
in th
e re
gion
. Thi
s is
an
incr
ease
from
the
4th
quar
ter
of F
Y08
cas
es w
here
18
case
s w
ere
pres
ente
d an
d ad
dres
sed.
•Ove
rall
wat
er c
over
age
is 7
1% in
the
regi
on.
• 82%
of t
he fu
nctio
nal p
rimar
y sc
hool
s ha
ve a
cces
s to
saf
e w
ater
and
se
para
te la
trine
for b
oys
and
girls
.
IMPA
CT
•Cro
ps p
lant
atio
n w
as la
te b
y 2
wee
ks.
•Moi
stur
e st
ress
at
flow
erin
g an
d se
ed f
illin
g st
ages
cre
ated
sig
nific
ant
yiel
d re
duct
ion.
CO
PIN
G M
ECH
AN
ISM
S• F
or th
e po
or to
ver
y po
or h
ouse
hold
s w
ith li
mite
d la
nd h
oldi
ng a
nd c
rop
prod
uctio
n co
ping
stra
tegi
es a
re re
duct
ion
in n
umbe
r of m
eals
, wag
e la
bor,
sale
of f
irew
ood
and
char
coal
. Mos
tly a
lso
depe
nds
on th
e as
sist
ance
. In
addi
tion
shift
ing
of n
on-fo
od e
xpen
ditu
re to
food
pur
chas
e ha
s be
en re
porte
d al
so.
KEY
REC
OM
MEN
DAT
ION
S• E
mer
genc
y pr
epar
edne
ss fo
r sup
plie
s of
prio
rity
dise
ase
mus
t be
obta
ined
.
• Mai
nten
ance
of n
on-fi
ctio
nal w
ater
sch
emes
rath
er th
an w
ater
ra
tioni
ng.
• Stre
ngth
enin
g of
mal
nutri
tion
data
man
agem
ent s
yste
m.
• Stre
ngth
en O
WC
A in
dat
a m
anag
emen
t, do
cum
enta
tion
and
evid
ence
ba
sed
inte
rven
tion/
prog
ram
ing.
6% o
f re
gion
’s p
opul
atio
n re
quire
food
ass
ista
nce
5060
DD
Dec
Jun
Jan
Rel
ief f
ood
bene
ficia
ries
per m
onth
(2
016
Jan.
- 20
16 J
un.)
(in th
ousa
nds)
35,2
24
requ
ire fo
od a
ssis
tanc
e
8% o
f re
gion
’s p
opul
atio
n re
quire
food
ass
ista
nce
91215
DD
Dec
Jun
Jan
Rai
nfal
l C
alen
dar:
BA
SELI
NE
DAT
A0.
23 m
illio
n (C
SA
201
6)
Pop
ulat
ion:
kire
mt (
June
to S
epte
mbe
r)
kire
mt (
June
to S
epte
mbe
r)
Rai
nfal
l C
alen
dar:
Har
ari a
nd D
ire D
awa
Reg
ions
: Meh
er A
sses
smen
t Sum
mar
y (a
s of
Dec
embe
r 201
6)

46 5
PART III: ANNExES
01326395265
2017
2016
2015
2014
2013
2012
2011
Food
inse
cure
pop
ulat
ion
tren
d (in
thou
sand
s)2
Red
Sea
Rel
ief f
ood
bene
ficia
ries
per m
onth
(201
5 Ja
n. -
2016
Dec
.) (in
thou
sand
s)
9% o
f reg
ion’
s po
pula
tion
requ
ire fo
od a
ssita
nce
Gam
bella
Reg
iona
l Meh
er A
sses
smen
t Sum
mar
y (a
s of
Dec
embe
r 201
6)
0.4
mill
ion
(CS
A 2
016)
Live
lihoo
d:
Rai
nfal
l Cal
enda
r:
Pop
ulat
ion:
mix
ed a
gric
ultu
re (1
00%
)
belg
(Mar
ch-M
ay) a
nd m
eher
(Jun
e - S
ept.)
Impa
ct
Base
line
data
• The
floo
d da
mag
ed m
aize
cro
p an
d ve
geta
ble
high
ly a
t fru
it se
tting
and
flow
erin
g st
ages
.
• 57%
are
a ha
s be
en p
lant
ed a
gain
st to
tal p
lann
ed o
f pla
ntat
ion.
• The
phy
sica
l con
ditio
n an
d pr
oduc
tivity
of l
ives
tock
is g
ood
for
now
.• L
ives
tock
her
d si
ze h
as b
een
decr
ease
d in
Jor
, Lar
e an
d Ji
kaw
w
ored
as d
ue to
mur
le c
attle
raid
ing
activ
ities
and
atta
cks
and
in
Dim
a w
ored
a du
e to
sur
ma
atta
cks.
• Cur
rent
ly th
e su
pply
and
dem
and
of s
tapl
e fo
od c
omm
oditi
es
(mai
ze a
nd s
orgh
um) a
re b
alan
ced
whi
le in
crem
ents
in p
rices
ha
ve b
een
obse
rved
.• I
n m
ajan
g zo
ne tr
ends
of b
oth
OTP
and
SC
cas
es in
crea
sed
dram
atic
ally.
• The
num
ber o
f cas
es s
een
at O
TP a
nd S
C in
May
201
6 ha
s be
en re
porte
d in
crea
sed
com
pare
d to
sam
e m
onth
in 2
015.
• The
top
five
caus
es o
f mor
bidi
ty in
the
unde
r fiv
e ar
e m
alar
ia,
pneu
mon
ia, d
iarr
hea
(non
blo
ody)
, acu
te re
spira
tory
trac
t inf
ectio
n an
d D
iarr
hea
with
no
dehy
drat
ion
in o
rder
of o
ccur
renc
e.
•The
san
itatio
n an
d hy
gien
e co
vera
ge o
f the
Reg
ion
is
whi
ch
is b
elow
the
natio
nal a
vera
ge a
nd th
e lo
wes
t as
com
pare
d to
ot
her R
egio
ns.
• 197
wat
er s
chem
es o
ut 1
,068
are
non
-func
tiona
l, th
ere
is
shor
tage
of p
otab
le w
ater
in m
ost a
sses
sed
wor
edas
due
to
sche
me
dam
age
and
none
xist
ence
of w
ater
sch
emes
.
Seas
onal
per
form
ance
• Th
e 20
16 m
eher
sea
son
rain
fall
onse
t was
ear
ly in
mos
t of t
he
area
s. T
he a
mou
nt o
f rai
nfal
l was
ver
y hi
gh in
the
begi
nnin
g w
hich
re
sulte
d bo
th fl
ash
and
river
floo
ding
.
Copi
ng m
echa
nism
• The
cop
ping
stra
tegi
es p
ract
iced
in a
ll w
ored
as o
f the
regi
on a
re
inte
nsifi
catio
n of
live
stoc
k sa
le, p
urch
ase
and
cons
umpt
ion
of
chea
per f
ood,
suc
h as
sw
eet p
otat
oes,
cas
sava
and
als
o th
e in
tens
ifica
tion
of fi
shin
g. T
he e
xpan
sion
of w
ild fr
uits
root
s an
d le
aves
col
lect
ion,
and
the
inte
nsifi
catio
n of
cha
rcoa
l and
gra
ss s
ale
is a
lso
an a
dded
val
ue. V
ery
poor
hou
seho
lds
also
dep
end
on g
ifts
from
rela
tives
and
sea
sona
l mig
ratio
n to
nei
ghbo
urin
g W
ored
as a
nd
kebe
les.
Key
reco
mm
enda
tion
• S
eeds
pro
visi
on fo
r the
nex
t yea
r’s c
rop
prod
uctio
n to
cro
p-fa
ilure
fa
rmer
s.
• Cro
p pr
oduc
tion
and
lives
tock
rela
ted
train
ing
shou
ld b
e co
nduc
ted
for f
arm
ers.
• Tra
inin
g on
Com
mun
ity m
anag
emen
t of a
cute
mal
nutri
tion
(CM
AM
) and
infa
nt y
oung
chi
ld fe
edin
g du
ring
emer
genc
ies
for
zona
l and
wor
eda
offic
e ex
perts
sho
uld
be p
rovi
ded
as s
oon
as
poss
ible
.
Curre
nt re
spon
se• I
n th
e re
gion
a to
tal o
f 42,
800
bene
ficia
ries
from
13
wor
edas
re
ceiv
ed e
mer
genc
y re
lief f
ood
assi
stan
ce fo
r a p
erio
d of
6 m
onth
s (r
ound
s) in
201
6. In
add
ition
al e
mer
genc
y fo
od a
ssis
tanc
e w
as
dist
ribut
ed fo
r cro
ss-b
orde
r atta
cks
and
flood
vic
tims.
Dur
ing
the
relie
f ope
ratio
n th
ere
was
a d
elay
in a
lloca
tion,
del
iver
y an
d di
strib
utio
n w
as n
ot fu
ll ba
sket
. Cer
eals
and
pul
ses
wer
e th
e on
ly
food
that
was
pro
vide
d. T
here
wer
e pr
oble
ms
and
chal
leng
es in
ta
rget
ing,
reco
rdin
g an
d re
porti
ng o
f the
relie
f ope
ratio
ns.
Hots
pot w
ored
as a
s of
Dec
embe
r 201
6
36,0
42re
quire
food
ass
ista
nce
6-ye
ar a
vera
ge
20304050
2015
2016
Dec
Jun
JanLe
gend P
riorit
y 1
Prio
rity
2
Prio
rity
3

47
PART III: ANNExES
Red
Sea
Food
inse
cure
pop
ulat
ion
tren
d (in
mill
ions
)B
ASE
LIN
E D
ATA
SEA
SON
AL
PER
FOR
MA
NC
E•T
he o
nset
of h
agay
a ra
in w
as la
te in
all
Pas
tora
l and
Agr
o-P
asto
ral p
arts
of
Oro
mia
by
2-6
wee
ks. I
n B
oren
a Zo
ne it
was
repo
rted
that
, it h
as b
een
di
fficu
lt to
def
ine
the
exac
t ons
et ti
me
of th
e ra
ins
as s
mal
l sho
wer
s w
ere
occu
rrin
g in
som
e pl
aces
for
one
day
and
fol
low
ed b
y lo
ng d
ry s
pell
cond
ition
s un
til th
e ne
xt s
how
er.
•In g
ener
al, t
he p
erfo
rman
ce o
f hag
aya
rain
s in
pas
tora
list a
reas
was
a
failu
re d
urin
g th
e se
ason
in
term
s of
im
prov
ing
wat
er a
nd p
astu
re
avai
labi
lity.
Uns
easo
nal
rain
s th
at h
appe
ned
durin
g m
id o
f N
ovem
ber
over
all
past
oral
are
as w
as a
sses
sed
to h
ave
a po
sitiv
e im
pact
in
impr
ovin
g w
ater
ava
ilabi
lity
to s
ome
exte
nt, b
ut n
ot e
xpec
ted
to e
nhan
ce
past
ure
and
crop
con
ditio
ns a
s th
eir d
urat
ion
was
sho
rt.
•Nea
rly 1
0,47
4 ho
useh
olds
and
tot
al o
f 50
,474
peo
ple
are
disp
lace
d m
ainl
y du
e to
floo
d, d
roug
ht a
nd c
onfli
ct fr
om 1
1 w
ored
as (
abou
t 1,5
63
from
Som
ali r
egio
n), m
ore
than
hal
f of t
he ID
Ps
are
wom
en a
nd c
hild
ren
requ
iring
pro
tect
ion.
The
IDP
s re
quire
sho
rt an
d lo
ng te
rm a
ssis
tanc
e.
CO
PIN
G M
ECH
AN
ISM
S•C
opin
g m
echa
nism
s ar
e m
ainl
y in
crea
sed
labo
ur m
igra
tion
to u
rban
ar
eas
for i
nsta
nce
in lo
w la
nds
of E
ast a
nd W
est H
arar
ghe
and
Ars
i zo
nes
as w
ell a
s us
e of
neg
ativ
e co
ping
mec
hani
sms
such
as
exce
ssiv
e sa
le o
f liv
esto
ck, c
harc
oal a
nd fi
rew
ood
acro
ss th
e lo
w la
nd a
nd p
asto
ral
area
s.
•With
draw
of c
hild
ren
from
sch
ool a
nd re
duct
ion
in n
umbe
r of m
eals
ha
ve b
een
repo
rted
also
as
copi
ng m
echn
ism
s.
CU
RR
ENT
RES
PON
SE•
Dur
ing
belg
an
d m
eher
se
ason
s a
tota
l of
24
3,13
7 qu
inta
ls
of
emer
genc
y se
ed o
f diff
eren
t var
ietie
s w
ere
prov
ided
to te
n zo
nes,
out
of
whi
ch 7
8,59
8 qu
inta
ls (3
2.3%
) con
tribu
ted
by N
GO
s w
hile
the
rem
aini
ng
cove
red
by g
over
nmen
t.
• Wat
er tr
ucki
ng is
on-
goin
g in
wat
er s
horta
ge a
reas
.
• The
Bur
eaus
of w
omen
and
chi
ldre
n A
ffairs
had
alre
ady
iden
tifie
d 1,
123
unac
com
pani
ed a
nd s
epar
ated
chi
ldre
n (5
5% b
oys
and
45%
Girl
s)
KEY
REC
OM
MEN
DAT
ION
S•S
treng
then
coo
rdin
atio
n at
all
leve
ls fo
r effe
ctiv
e an
d tim
ely
hum
anita
rian
resp
onse
•Stre
ngth
en a
nd c
oord
inat
e th
e on
goin
g re
spon
se to
con
tain
AW
D
outb
reak
•Tim
ely
deliv
ery
of w
ater
truc
king
as
wel
l as
mai
nten
ance
and
re
habi
litat
ion
of w
ater
sch
emes
.
•Sup
port
for s
choo
ls w
ith s
choo
l fee
ding
pro
gram
me
and
wat
er
•Tim
ely
supp
ort o
f liv
esto
ck fe
ed fo
r crit
ical
ly a
ffect
ed a
reas
, in
parti
cula
r th
e pa
stor
al a
reas
IMPA
CT
•In h
igh
and
mid
lan
d ar
eas
the
perfo
rman
ce o
f cr
ops
was
goo
d.
How
ever
, in
low
land
are
as t
he c
rop
perfo
rman
ce w
as a
ffect
ed b
y la
te
onse
t, er
ratic
dis
tribu
tion
and
belo
w n
orm
al m
eher
rain
s as
wel
l as
faile
d ha
gaya
rain
in p
asto
ral a
reas
.
•Liv
esto
ck b
ody
cond
ition
s ar
e ve
ry p
oor
in lo
w la
nd a
nd p
asto
ral a
reas
w
ith s
igni
fican
t liv
esto
ck d
eath
rep
orte
d fro
m B
oren
a an
d W
est
Guj
i zo
nes.
•Sta
ple
food
pr
ices
ar
e in
crea
sing
w
hile
th
e liv
esto
ck
pric
es
are
decr
easi
ng in
the
low
land
and
pas
tora
l are
as b
ut p
rices
are
sta
ble
in th
e hi
gh a
nd m
id la
nd a
reas
.
•Ear
ly m
igra
tion
repo
rts fr
om B
ale,
Bor
ena,
Guj
i and
Wes
t Guj
i zon
es in
se
arch
of
past
ure
and
wat
er,
with
inc
reas
ed s
choo
l ab
sent
eeis
m a
s ch
ildre
n m
igra
te a
long
with
thei
r fam
ilies
•AW
D c
ontin
ues
with
the
curr
ent c
ases
at 5
, 200
cas
es w
ith a
ctiv
e ca
ses
in E
ast H
arar
ghe,
Wes
t Har
argh
e, W
est A
rsi a
nd E
ast s
how
a zo
nes.
In
addi
tion,
ther
e is
a m
alar
ia o
utbr
eak
in H
awi G
udin
a of
Wes
t Har
argh
e zo
ne w
ith 1
,680
cas
es
•Alth
ough
, the
re is
dec
reas
e in
S
AM
adm
issi
on w
hen
com
pare
d to
last
ye
ar s
ame
time,
the
case
s re
mai
n hi
gh in
low
land
and
pas
tora
l are
as,
for
inst
ance
in G
olol
cha,
Mer
ti an
d R
ayitu
wor
edas
.
•Crit
ical
wat
er s
horta
ges
have
bee
n re
porte
d in
Bal
e, B
oren
a, G
ujji
and
Eas
t Har
ergh
e zo
nes.
34.5
mill
ion
(CS
A 2
016)
Live
lihoo
d:
Rai
nfal
l C
alen
dar:
Pop
ulat
ion:
agra
rian
(85%
) and
pas
tora
list (
15%
)
gann
a/ b
elg
(Apr
il -m
id-J
une)
, kire
mt (
July
- O
ctob
er),
haga
ya (O
ctob
er-N
obem
ber)
HO
TSPO
T W
OR
EDA
S A
S O
F JU
LY 2
016
Rel
ief f
ood
bene
ficia
ries
per m
onth
(201
5 Ja
n. -
2016
Dec
) (in
mill
ions
)
In 2
016,
ad
hoc
assi
stan
ce w
as p
rovi
ded
to 1
4,19
7 flo
od v
ictim
sin
Apr
il an
d M
ay (n
ot in
clud
ed in
the
HR
D).
6% o
f reg
ion’
s po
pula
tion
requ
ire fo
od a
ssis
tanc
e
2,04
9,87
1
re
quire
food
ass
ista
nce
01234
Dec
Jun
Jan
2015
2016
00.
51.
01.
52.
02.
53.
03.
54.
0
2017
2016
2015
2014
2013
2012
2011
6-ye
ar a
vera
ge
Lege
nd Prio
rity
1
Prio
rity
2
Prio
rity
3
Oro
mia
Reg
ion:
Meh
er A
sses
smen
t Sum
mar
y (a
s of
Dec
embe
r 201
6)

48
PART I: RESPONSE PART III: ANNExES
5
Red
Sea
Food
inse
cure
pop
ulat
ion
tren
d (in
thou
sand
s)B
ASE
LIN
E D
ATA
SEA
SON
AL
PER
FOR
MA
NC
E• T
he o
vera
ll pe
rform
ance
of k
irem
t rai
n w
as fa
vour
able
for c
rop
prod
uctio
n, p
astu
re d
evel
opm
ent a
nd im
prov
emen
t of l
ives
tock
pr
oduc
tivity
. Sho
rt dr
y sp
ells
bet
wee
n Ju
ly- A
ugus
t and
Sep
tem
ber -
O
ctob
er le
d to
som
e re
plan
ting
to o
verc
ome
patc
hine
ss in
ger
min
atio
n of
pla
nted
cro
ps.
• The
kire
mt r
ain
was
muc
h be
low
nor
mal
in m
ost w
ored
as o
f Gam
o G
ofa
and
Sou
th O
mo
zone
s. B
elow
nor
mal
and
err
atic
rain
fall
rece
ived
in
low
land
s.
• Hea
vy ra
ins,
hai
lsto
rm a
nd fl
oodi
ng a
lso
had
adve
rse
effe
cts
on c
rop
prod
uctio
n in
hig
hlan
d lo
caliz
ed p
ocke
t are
as.
CO
PIN
G M
ECH
AN
ISM
S• T
he c
urre
nt c
oppi
ng m
echa
nism
in th
e re
gion
are
: sal
e of
live
stoc
k an
d m
igra
tion
with
live
stoc
k. S
easo
nal m
igra
tion
with
the
lives
tock
is
com
mon
in s
earc
h of
pas
ture
and
drin
king
wat
er to
the
near
by h
ighl
ands
an
d ot
her w
ater
abu
ndan
t are
as.
• Mor
e th
an 5
60 c
ases
of c
hild
ren
left
behi
nd a
fter p
aren
ts /
care
take
rs
mig
rate
d; 2
07 C
hild
ren
have
bee
n id
entif
ied
as m
igra
ted
with
out
pare
nts/
Car
etak
ers
to 1
7 w
ored
as.
CU
RR
ENT
RES
PON
SE• C
MA
M p
rogr
am h
as b
een
impl
emen
ted
in 1
2 zo
nes
and
one
spec
ial
wor
eda
in S
NN
P.
• Acc
ordi
ng to
the
regi
onal
Hea
lth B
urea
u, th
e sc
reen
ing
cove
rage
for
unde
r fiv
e ch
ildre
n is
abo
ve 7
5% in
mos
t of t
he m
onth
s ex
cept
for J
uly
2016
whe
n th
e sc
reen
ing
cove
rage
was
72.
4%.
KEY
REC
OM
MEN
DAT
ION
S• I
n ge
nera
l, th
e as
sess
men
t tea
m p
ropo
sed
Em
erge
ncy
scho
ol fe
edin
g pr
ogra
mm
e fo
r a to
tal o
f 416
,782
stu
dent
s of
390
sch
ools
in th
e re
gion
.
• Fac
ilita
te ti
mel
y de
liver
y an
d di
strib
utio
n of
relie
f foo
d as
sist
ance
• A
dvoc
ate
for
mor
e TS
F fo
od a
nd e
nsur
e tim
elin
ess
of e
xist
ing
TSF
dist
ribut
ion.
• Reh
abili
tatio
n of
non
-func
tiona
l wat
er s
chem
es.
IMPA
CT
• Tot
al a
rea
plan
ted
and
expe
cted
cro
p pr
oduc
tion
incr
ease
d co
mpa
red
to la
st y
ear e
xcep
t in
Gam
o G
ofa
and
Sou
th O
mo
zone
s.
• Hig
her m
eher
cro
p pr
oduc
tion
is e
xpec
ted
this
yea
r due
to re
lativ
ely
bette
r kire
mt r
ains
.
• Muc
h be
low
ave
rage
per
form
ance
of s
hort
rain
s (S
epte
mbe
r- O
ctob
er)
has
caus
ed c
rop
failu
re in
agr
o-pa
stor
al a
reas
of t
he re
gion
.
• Wel
l-fun
ctio
ning
food
mar
kets
pla
y a
good
role
, mai
nly
in th
e pa
stor
al
and
food
inse
cure
are
as o
f the
regi
on.
• Foo
d pr
ices
hav
e sh
own
an in
crea
sing
tren
d in
are
as re
porti
ng
sign
ifica
nt y
ield
redu
ctio
n w
ith d
eclin
ed s
uppl
y of
gra
ins
in th
e lo
cal
mar
ket.
• Top
five
cau
ses
of m
orbi
dity
for u
nder
five
is li
sted
to b
e: P
neum
onia
, D
iarr
hea,
all
resp
irato
ry d
isea
ses,
acu
te fe
brile
illn
ess
and
mal
aria
in th
e re
gion
. Ord
er re
pres
ents
the
high
er to
low
er ri
sk.
• Com
pare
d to
last
yea
r sam
e pe
riod,
SA
M a
dmis
sion
s ha
ve d
eclin
ed in
al
mos
t all
zone
s as
sess
ed.
•Non
func
tiona
lity
(13%
) of w
ater
poi
nts
is s
till a
cha
lleng
e an
d pe
ople
ar
e fo
rced
to u
se u
nsaf
e dr
inki
ng w
ater
.
18.7
mill
ion
(CS
A 2
016)
Live
lihoo
d:
Rai
nfal
l C
alen
dar:
Pop
ulat
ion:
crop
ping
(88%
), ag
ro-p
asto
ralis
m (4
%) a
nd
past
oral
ism
(8%
)
belg
(Mar
ch-M
ay) a
nd k
irem
t (Ju
ne-S
epte
mbe
r)
HO
TSPO
T W
OR
EDA
S A
S O
F D
ECEM
BER
201
6
Rel
ief f
ood
bene
ficia
ries
per m
onth
(201
5 Ja
n. -
2016
Dec
.) (in
mill
ions
)
In 2
016,
ad
hoc
assi
stan
ce w
as p
rovi
ded
to 6
2,13
5 flo
od v
ictim
sin
Apr
il an
d M
ay (n
ot in
clud
ed in
the
HR
D).
11%
of t
he re
gion
’s p
opul
atio
n re
quire
s fo
od a
ssis
tanc
e
458,
157
requ
ire fo
od a
ssis
tanc
e
0
0.2
0.4
0.6
0.8
1.0
Dec
Jun
Jan
2016
2015
0
2.0
4.0
6.0
8.0
2017
2016
2015
2014
2013
2012
2011
6-ye
ar a
vera
ge
Lege
nd Prio
rity
1
Prio
rity
2
Prio
rity
3
SNN
P R
egio
n: M
eher
Ass
essm
ent S
umm
ary
(as
of D
ecem
ber 2
016)

49
PART III: ANNExES
Red
Sea
Food
inse
cure
pop
ulat
ion
tren
d (in
mill
ions
)B
ASE
LIN
E D
ATA
SEA
SON
AL
PER
FOR
MA
NC
E•
Gen
eral
ly, 2
016
kara
n ra
in s
tarte
d on
tim
e in
all
wor
edas
of S
itti z
one
with
go
od
dist
ribut
ion
and
inte
nsity
ex
cept
po
cket
ar
eas
whe
re
perfo
rman
ce o
f the
rain
was
bel
ow n
orm
al, w
here
as F
afan
zon
e sh
owed
va
riatio
ns b
etw
een
diffe
rent
par
ts n
orm
ally
ben
efitt
ing
from
thes
e ra
ins.
O
nset
of r
ainf
all w
as g
ener
ally
del
ayed
but
sho
wed
goo
d pe
rform
ance
in
the
sede
ntar
y ar
eas.
• Th
e de
yr r
ecei
ving
, mos
tly p
asto
ralis
t dom
inat
ed a
reas
of F
afan
zon
e su
ffere
d fro
m n
ear
com
plet
e fa
ilure
of r
ainf
all a
s a
resu
lt of
acu
te w
ater
an
d pa
stur
e sh
orta
ge h
ave
led
to m
ass
mig
ratio
n of
live
stoc
k he
rds
to
othe
r par
ts o
f the
Faf
an, J
arar
and
Nog
ob z
ones
.
CO
PIN
G M
ECH
AN
ISM
S• G
ener
ally,
mos
t com
mon
cop
ing
stra
tegi
es a
pplie
d by
the
com
mun
ities
in
tim
e of
cris
is a
re li
vest
ock
mig
ratio
n, s
ale
of li
vest
ock,
labo
r mig
ratio
n,
fire
woo
d co
llect
ion,
redu
ctio
n of
mea
ls fr
eque
ncy
and
quan
tity,
and
re
lief d
istri
butio
n or
food
aid
pro
gram
s.
• Crit
ical
wat
er s
horta
ges
in m
any
parts
of t
he d
eyr r
ecei
ved
area
s pa
rticu
larly
in D
obaw
eyn,
Shi
labo
, Mer
sin,
Sha
ykos
h an
d pa
rts o
f K
abrid
ahar
dis
trict
s of
Kor
ahay
zon
e, a
ll di
stric
ts o
f Doo
lo z
one,
G
asha
mo,
Gun
agad
o, D
aror
and
par
t of A
war
e di
stric
ts o
f Jar
ar z
one,
H
arsh
in a
nd K
oran
dis
trict
s of
Faf
an z
one,
Dol
obay
, Bar
ey, K
ohle
, and
G
odgo
d di
stric
ts o
f Afd
er z
one,
Ada
dley
, God
e, D
anan
, poc
ket a
rea
of
Kal
afo,
and
Muz
atah
il di
stric
ts’ o
f She
belle
zon
e, D
oloa
do, B
okol
may
o,
Gur
ebaq
aqsa
,par
t of M
oyal
e, p
ocke
t are
a of
Hud
ad d
istri
cts
of L
iban
an
d D
awa
zone
s, G
arbo
, Sag
ag, D
uhun
and
Elw
eyn
dist
ricts
of N
ogob
zo
ne.
CU
RR
ENT
RES
PON
SE• O
n-go
ing
wat
er tr
ucki
ng in
vul
nera
ble
wor
edas
.
KEY
REC
OM
MEN
DAT
ION
S• P
rovi
sion
of i
mpr
oved
cro
p se
eds
for a
gro-
past
oral
ists
and
rive
rine
com
mun
ities
in th
e re
gion
to h
elp
crop
pro
duct
ion
activ
ities
in
subs
eque
nt c
ropp
ing
seas
on (G
u 20
17) a
nd m
itiga
te th
e im
pact
of t
he
curr
ent d
roug
ht in
the
affe
cted
zon
es a
s w
ell.
• Pas
ture
had
bee
n st
eadi
ly d
eter
iora
ting
over
the
last
sev
eral
mon
ths
prec
edin
g th
e de
yr ra
in a
nd n
ow h
as b
een
depl
eted
com
plet
ely
in m
any
area
s in
the
deyr
rece
ivin
g zo
nes.
• Em
erge
ncy
lives
tock
feed
ing
to s
ave
core
bre
edin
g an
imal
s in
the
wor
st a
ffect
ed a
reas
of t
he re
gion
incl
udin
g D
olo,
Kor
ahey
, Jar
ar,
She
belle
, par
ts o
f the
rem
aini
ng d
eyr r
ecei
ving
zon
es.
• In
orde
r to
treat
the
MA
M c
ases
and
pre
vent
them
from
dev
elop
ing
into
S
AM
, rol
lout
of T
arge
ted
Sup
plem
enta
ry F
eedi
ng (T
SF)
is a
nec
essi
ty.
• Urg
ent w
ater
truc
king
to a
ll af
fect
ed 4
60 k
ebel
es to
hel
p al
levi
ate
the
acut
e w
ater
sho
rtage
s af
fect
ing
the
com
mun
ity.
IMPA
CT
• The
kar
en 2
016
rain
fall
was
cha
ract
eriz
ed b
y er
ratic
ons
et a
nd u
neve
n di
strib
utio
n le
adin
g to
var
iatio
ns i
n th
e pe
rform
ance
of
crop
s ac
ross
di
ffere
nt w
ored
as o
f Faf
an z
one
• With
the
exce
ptio
n of
som
e ke
ren
rain
rece
ivin
g ar
eas
in th
e no
rth o
f the
re
gion
, all
the
othe
r zon
es a
re in
the
mid
st o
f a s
ever
e dr
ough
t.
• Th
e bo
dy c
ondi
tion
of a
nim
als
has
dete
riora
ted
sign
ifica
ntly
and
liv
esto
ck h
ave
begu
n to
die
in c
erta
in a
reas
, a tr
end
whi
ch is
exp
ecte
d to
co
ntin
ue o
ver
the
com
ing
mon
ths,
as
the
long
dry
sea
son
of J
iilaa
l pr
ogre
sses
.
• In
Nov
embe
r 20
16,
the
pric
e of
the
sta
ple
food
(im
porte
d) r
emai
ned
high
er,
whi
le li
vest
ock
pric
e de
clin
ed in
the
sam
e m
onth
to
the
low
est
leve
l sin
ce 2
011.
• A
tota
l of
5,
259
AWD
ca
ses
repo
rted
acro
ss
the
regi
on
from
Ju
ly-M
id-D
ec 2
016
and
still
spr
eadi
ng t
o ne
w w
ored
as.
Cur
rent
ly, 9
w
ored
as a
re a
ctiv
ely
inte
rmitt
ently
repo
rting
.
• 84
,610
acu
tely
mal
nour
ishe
d ch
ildre
n yo
unge
r th
an 5
yea
rs a
nd P
LW
have
bee
n id
entif
ied
durin
g th
e O
ctob
er 2
016
bian
nual
nut
ritio
n sc
reen
ing
in 3
6 P
-1 w
ored
as: 7
,403
of t
hese
wer
e S
AM
cas
es a
nd re
ferr
ed to
TFP
si
tes.
5.5
mill
ion
(CS
A 2
016)
Live
lihoo
d:
Rai
nfal
l C
alen
dar:
Pop
ulat
ion:
agro
-pas
tora
list (
30%
), pa
stor
alis
m (6
0%),
sede
ntar
y (1
0%)
gu (A
pril
- Jun
e) a
nd d
eyr (
Nov
embe
r - D
ecem
ber)
HO
TSPO
T W
OR
EDA
S A
S O
F D
ECEM
BER
201
6
Rel
ief f
ood
bene
ficia
ries
per m
onth
(201
5 Ja
n. -
2016
Dec
.) (in
mill
ions
)
In 2
016,
ad
hoc
assi
stan
ce w
as p
rovi
ded
to 8
5,29
6 flo
od v
ictim
sin
Apr
il an
d M
ay (n
ot in
clud
ed in
the
HR
D).
31%
of r
egio
n’s
popu
latio
n re
quire
food
ass
ista
nce
0
0.3
0.6
0.9
1.2
1.5
2016
2015
Dec
Jun
Jan
0
0.5
1.0
1.5
2.0
2017
2016
2015
2014
2013
2012
2011
6-ye
ar a
vera
ge
1.7M
requ
ire fo
od
assi
stan
ce
Som
ali R
egio
n: M
eher
Ass
essm
ent S
umm
ary
(as
of D
ecem
ber 2
016)
Lege
nd Prio
rity
1
Prio
rity
2
Prio
rity
3

50 5
PART III: ANNExES
Red
Sea
Food
inse
cure
pop
ulat
ion
tren
d (in
mill
ions
)B
ASE
LIN
E D
ATA
SEA
SON
AL
PER
FOR
MA
NC
E• T
he s
tart
of th
e ra
in w
as a
bout
nor
mal
in a
lmos
t all
wor
edas
of t
he
regi
on, a
nd th
e am
ount
and
dis
tribu
tion
of ra
in w
as a
lso
norm
al fo
r bot
h pr
oduc
tion
seas
ons
azm
era
and
tsed
iya.
The
ces
satio
n of
rain
fall
was
ea
rlier
by
one
to fo
ur w
eeks
than
nor
mal
acr
oss
the
regi
on.
• Apa
rt fro
m e
rrat
ic d
istri
butio
n, th
e pe
rform
ance
of t
his
year
’s ts
ediy
a ra
infa
ll, m
ainl
y du
ring
July
and
Aug
ust,
was
rela
tivel
y go
od a
s co
mpa
red
to la
st y
ear.
Rai
nfal
l adv
ersi
ties
such
as
hails
torm
, Wat
erlo
ggin
g, w
ind,
m
oist
ure
and
flood
ing
have
bee
n re
porte
d.
CO
PIN
G M
ECH
AN
ISM
SC
opin
g m
echa
nism
s: c
ash/
food
ass
ista
nce,
sal
e of
live
stoc
k an
d liv
esto
ck p
rodu
cts,
sal
e of
exp
ensi
ve c
rops
suc
h as
teff
and
puls
e to
pu
rcha
se c
heap
er c
rops
. Exp
and
labo
r inc
ome,
min
imiz
e ex
pend
iture
on
none
food
item
s, c
hang
e fo
od c
onsu
mpt
ion
patte
rn a
nd s
uppo
rt th
roug
h C
CC
(Com
mun
ity C
are
Coa
litio
n).
CU
RR
ENT
RES
PON
SE• B
oth
emer
genc
y re
lief a
nd P
SN
P pr
ogra
ms
have
con
tribu
ted
a lo
t to
save
live
s an
d liv
elih
ood
of th
e dr
ough
t affe
cted
peo
ple
and
prot
ect f
rom
st
ress
mig
ratio
n an
d as
set d
eple
tion.
Mor
eove
r, si
gnifi
cant
pub
lic w
orks
m
ainl
y re
habi
litat
ion
and
soci
al in
frast
ruct
ures
, wer
e co
nstru
cted
by
able
bo
died
ben
efic
iarie
s.
• The
scr
eeni
ng c
over
age
of 6
-59
mon
ths
old
child
ren
of th
e as
sess
ed
wor
edas
fro
m th
e O
ctob
er 2
016
mas
s sc
reen
ing
was
85%
.
KEY
REC
OM
MEN
DAT
ION
S• C
apac
ity b
uild
ing
shou
ld b
e gi
ven
for h
ouse
hold
eco
nom
y, li
velih
ood
anal
ysis
, ear
y w
arni
ng a
ctiv
ities
, pro
duct
ion
estim
atio
n, m
arke
t as
sess
men
t and
fore
cast
at w
ored
a le
vel.
• Em
erge
ncy
seed
dis
tribu
tion
is h
ighl
y ne
eded
for a
ffect
ed p
ocke
t ar
eas/
wor
edas
bef
ore
the
next
sow
ing
perio
d.• S
treng
then
dis
ease
sur
veill
ance
sys
tem
.• P
repo
sitio
n so
me
key
emer
genc
y dr
ugs
and
med
ical
sup
plie
s at
w
ored
a le
vel
• C
ontin
ue T
SFP
in th
e af
fect
ed w
ored
as.
• W
ater
truc
king
in a
reas
with
crit
ical
wat
er p
robl
em.
• S
choo
l fee
ding
pro
gram
to th
e af
fect
ed s
choo
ls.
IMPA
CT
•83%
incr
ease
d cr
op p
rodu
ctio
n co
mpa
red
to la
st y
ear.
•Bec
ause
of t
he g
ood
rain
s bo
th in
azm
era
and
tsid
ia a
reas
fodd
ers
so
urce
s ar
e a
dequ
ate
to c
over
ove
rall
requ
irem
ents
of t
he re
gion
ex
cept
in s
ome
pock
et a
reas
.•S
uppl
y of
cas
h cr
ops,
sta
ple
food
, and
live
stoc
k to
the
mar
ket i
s no
rmal
in
all
mar
ket p
lace
s of
the
regi
on.
•Sta
ple
food
pric
es h
ave
decr
ease
d w
hile
live
stoc
k pr
ices
hav
e in
crea
sed
com
pare
d to
last
yea
r.
•Acu
te re
spira
tory
trac
t inf
ectio
n ( 4
0%),
skin
infe
ctio
n (2
4%),
pneu
mon
ia ( 2
0%),
non-
bloo
dy d
iarr
hea
(12%
) and
mal
aria
(11%
) are
th
e fiv
e to
p ca
uses
of m
orbi
dity
in th
e re
gion
.
• 4.8
% c
hild
ren
have
a p
roxy
of G
loba
l Acu
te M
alnu
tritio
n (G
AM
) and
0.
2 %
with
pro
xy o
f Sev
er A
cute
Mal
nutri
tion
(SA
M) r
ate
by O
ctob
er
2016
.
• 22%
wat
er s
chem
es a
re n
on-fu
nctio
nal i
n th
e w
hole
regi
on.
•Crit
ical
wat
er s
horta
ge in
126
keb
eles
of 1
6 w
ored
as. A
tota
l of
389,
657
peop
le a
re c
urre
ntly
in n
eed
of w
ater
sup
ply
for d
rinki
ng
wat
er.
21%
wat
er s
chem
es a
re n
ot fu
nctio
nal i
n th
e re
gion
.
•Onl
y 33
% s
choo
ls h
ave
safe
pot
able
wat
er.
•Due
to h
eavy
rain
fall
and
high
win
d, 2
3 sc
hool
s ar
e af
fect
ed a
s re
sult
10,6
84 s
tude
nts
are
affe
cted
and
• 169
,446
stu
dent
s ar
e af
fect
ed d
ue to
em
erge
ncy
and
heal
th re
late
d pr
oble
ms.
5.1
mill
ion
(CS
A 20
16)
Live
lihoo
d:
Rai
nfal
l C
alen
dar:
Pop
ulat
ion:
agric
ultu
re (1
00%
)
belg
(Jan
uary
-May
), az
mer
a (A
pril
to e
nd o
f May
),an
d ts
edia
(Jun
e-S
epte
mbe
r)
HO
TSPO
T W
OR
EDA
S A
S O
F D
ECEM
BER
201
6
Rel
ief f
ood
bene
ficia
ries
per m
onth
(201
5 Ja
n. -
2016
Jun
.) (in
mill
ions
)
00.
2
0.4
0.6
0.8
1.0
1.2
Dec
Jun
Jan
2015
2016
0
0.3
0.6
0.9
1.2
2017
2016
2015
2014
2013
2012
2011
6-ye
ar a
vera
ge
6% o
f reg
ion’
s po
pula
tion
requ
ires
food
ass
ista
nce
310,
917
requ
ire fo
od a
ssis
tanc
e
• Lim
ited
acce
ss to
ser
vice
s fo
r dis
able
per
sons
, chi
ldre
n an
d H
IV
patie
nts.
Lege
nd Prio
rity
1
Prio
rity
2
Prio
rity
3
Tigr
ay R
egio
n: B
elg
Ass
essm
ent S
umm
ary
(as
of D
ecem
ber 2
016)

51
PART III: ANNExES
2016
GO
VER
NM
ENT
OF
ETH
IOPI
A A
ND
DO
NO
R C
ON
TRIB
UTI
ON
1513
1110
98
87
75
54
43
∫∫
∫∫
∫∫
∫∫
∫∫
∫∫
∫∫
Ethiop
ia: H
uman
itaria
n fund
ing up
date (a
s of 3
0 Decem
ber 2
016)
US$
1.62
billion
requ
ired
$537
mgap
*$1.06
ballocated
to se
ctors
$20m
allo
cated
to m
ulti‐sector
0.20.4
0.50.5
0.50.60.9
2.7
3.4
3.4
7.4
Kuwait
Canada
Denm
ark
UNICEF Global…
Finlan
dSw
itzerland
Austria
Save th
e Ch
ildren…
Swed
enEC
HO + EU delegation
EHF Do
nors
*Include
s US$60.5m carry‐over , US$97.6m Governm
ent con
tribution to fo
od and
US$11m to
edu
catio
n,**
MAM
(Mod
erate Ac
ute Malnu
trition
), *** do
es not includ
e do
nor con
tributions to
NGO Nutrition requ
iremen
ts ~$53m
Ad
ditio
nal $15.5 (UK ‐$13.6m a
nd Ireland
‐$1.9m
) is se
cured for 2
017 im
plem
entatio
n, th
roug
h EH
F.
1,062
20
537
allocated to se
ctors
allocated to m
ulti‐sector
gap
$0.6m pledg
ed
0.6
Switzerland
2016
don
or co
ntrib
utions/com
mitm
ents to
the HRD
‐$m
illion
Revised requ
iremen
ts and
fund
ing pe
r sector ‐
$million
HRD
fund
ing ‐sector a
llocatio
n an
d gap ‐$
million
Don
or pledg
es to
the HRD
‐$m
illion
Don
or m
ulti‐sector co
mmitm
ents ‐$m
illion
15
24
24
5260
45
83
91
115
1.1b
illion
12
7
1316
32
48
7871
106
677.4
Logistics
Protectio
n
ES/N
FI
Education
Health
Nutrition
Nutrition Supp
lies**
Agriculture
WAS
H
Food
Revised requ
iremen
ts
Contrib
utions**
*
Gov
ernm
ent con
tributions ‐$
million
a
ab
d
b
c
c
389
164 14
2
5032
2720
2016
don
or co
ntrib
utions/com
mitm
ents to
the HRD
‐$m
illion
d
272
109
2015
2016
Year
Others: Austria, IKEA, UNICEF Thematic, Russia
, TCP/FA
O interna
l , W
HO internal, Egypt, Private do
nors
(UNICEF, W
FP), LD
S, STA
RT, Finland
, Belgium
, Korea, U
NA Sw
eden,Spa
in,N
MFA
, Kuw
ait, Czech Re
public and
Mon
aco
1
1

52 5
PART III: ANNExES
Stra
teg
icO
pe
ratio
nal
Government Joint Humanitarian
Re
gio
nal
Polit
ical
ENCU: Emergency Nutrition Coordination UnitFAO: Food and Agriculture OrganizationHC: Humanitarian CoordinatorIOM: International Organization for Migration MoE: Ministry of EducationMoH: Ministry of HealthMoWCA: Ministry of Women and Children’s AffairMoWIE: Ministry of Water, Irrigation and ElectricityNDRMC: National Disaster Risk Management CommissionUNICEF: United Nations Children’s FundWFP: World Food Program
National Disaster Prevention and Preparedness Committee (NDPPC)
Chair: DPM Members: Ministers, NDRMC
Frequency: Weekly
National Technical Committee Chair: NDRMC
Members: Line Ministries (Technical level) Frequency: Triweekly
Regional Technical Committee Chair: Deputy Regional President
Members: Line Bureaus (Technical level) Frequency: Weekly
Steering Committee Chair: Regional President
Members: Line Bureau Heads (Strategy level) Frequency: Weekly
Regional Disaster Risk Management Technical Working Group (RDRMTWG)/Incident Command Post (ICP)
Chair: DPPC Heads Members: Sector Bureaus, Humanitarian PartnersSecretariat: OCHA
Frequency: Either fortnightly or monthly
Regional Sector Task ForcesChair: Regional Bureau Heads
Members: Regional Bureaus, Humanitarian Partners
Agriculture & Livestock
Chair: NDRMCCo-chair: FAOFreq.: Weekly
Health & NutritionChair: MoH
Co-chair: WHOFreq.: Fortnightly
Shelter & Non-Food
Chair: NDRMC / IOMFreq.: Fortnightly
WASHChair: MoWIE
Co-chair: UNICEFFreq.: Monthly
EducationChair: MoE
Co-chair: UNICEF/Save the Children
Freq.: Weekly
Child ProtectionChair: MoWCA
Co-chair: UNICEFFreq.: Monthly
Prioritization Committee
(Food)Chair: NDRMCCo-chair: WFP
Freq.: Fortnightly
NutritionChair: NDRMC/
ENCUCo-chair: UNICEFFreq.: Fortnightly
Sectors Task Forces and Cluster Coordinators
Strategic Multi-Agency Coordination (S-MAC)
Chair: Commissioner Co-chair: HCMembers: Heads of Cooperation, UN
& NGOs & Line MinistriesFrequency: Monthly
Disaster Risk Management Technical Working Group (DRMTWG)
Chair: NDRMC Co-chair: OCHAMembers: Sector Task Force Chairs, Cluster Coordinators,
UN, NGO & donors at the technical level Frequency: Monthly
Inter-Cluster Coordination Group (ICCG)
Chair: OCHA Members: Cluster Coordinators
Freq.: Fortnightly
Humanitarian Country Team (HCT)Chair: HC/RC
Members: UN Cluster Coordinators, Agency Reps., NGOs Reps., Donor Reps. and
Red Cross MovementFreq.: Fortnightly
Inter-Cluster Information Management Working
Group (ICIMWG) Chair: OCHA
Members: IM Focal Persons Freq.: Fortnightly
Emergency Communication
Group(ECG)Chair: OCHA Members: Communication Officers
Freq.: Fortnightly
Humanitarian Resilience Donor Group (HRDG)
Chair: Donors Members: Donors and Key Humanitarian
PartnersFreq.: Monthly
COORDINATION STRUCTURE IN ETHIOPIA

This is a joint Government of Ethiopia and Humanitarian Partners’ document.
This document provides a shared understanding of the crisis, including the most pressing humanitarian needs, and reflectsthejointhumanitarianresponseplanning.