2017 fourth quarter earnings conference call merchandise intermodal coal 2017 ... unique market...
TRANSCRIPT
1
2017 Fourth Quarter
Earnings Conference Call
January 24, 2018

2
Certain statements in this presentation are forward-looking statements within the meaning of the safe harbor provision of
the Private Securities Litigation Reform Act of 1995, as amended. In some cases, forward-looking statements may be
identified by the use of words like “believe,” “expect,” “anticipate,” “estimate,” “plan,” “consider,” “project,” and similar
references to the future. Forward-looking statements are made as of the date they were first issued and reflect the
good-faith evaluation of Norfolk Southern Corporation’s (NYSE: NSC) (“Norfolk Southern” or the “Company”) management
of information currently available. These forward-looking statements are subject to a number of risks and uncertainties,
many of which are beyond the Company’s control. These and other important factors, including those discussed under “Risk
Factors” in the Company’s Form 10-K for the year ended December 31, 2016, as well as the Company’s other public filings
with the SEC, may cause our actual results, performance or achievement to differ materially from those expressed or
implied by these forward-looking statements. Forward-looking statements are not, and should not be relied upon as, a
guarantee of future performance or results, nor will they necessarily prove to be accurate indications of the times at or by
which any such performance or results will be achieved. As a result, actual outcomes and results may differ materially from
those expressed in forward-looking statements. We undertake no obligation to update or revise forward-looking statements,
whether as a result of new information, the occurrence of certain events or otherwise, unless otherwise required by
applicable securities law.
Forward-Looking Statements

3
2017 Highlights
Fourth Quarter and Full Year
January 24, 2018
James A. Squires
Chairman, President, and
Chief Executive Officer

4
4Q17 and Full Year Results Versus Prior Year
4Q17* vs 4Q16 2017* vs 2016
Operating Ratio 67.7% 69.4% 67.4% 68.9%
Income From Operations $863M 13% $3,435M 12%
Net Income $486M 17% $1,922M 15%
Earnings Per Share $1.69 19% $6.61 18%
RECORD RESULTS
RECORD RESULTS
Record full year operating ratio and earnings per share
*Excludes impacts associated with Tax reform(1)
(1) Please see reconciliation to GAAP posted on our website.
RECORD RESULTS

5
Balanced Deployment of Capital
$1.7 billion in CapEx; $1.7 billion returned to shareholders
Maintaining our Rail Infrastructure:
$1.7 billion in CapEx for 2017
Planned $1.8 billion in CapEx for 2018
Returns to Shareholders in 2017:
$703 million in dividends
$1.0 billion in share repurchases

6
5%
-3%
Labor Productivity
Volume Avg. Employees
Delivering Growth While Driving Efficiency
4%
-1%
Fuel Efficiency
GTMs Gallons
(% change vs. 2016)(% change vs. 2016)
80
76
Composite Service Metric
2016 2017
Achieved $150 million in productivity savings in 2017

7
Alan H. Shaw
Executive Vice President
and Chief Marketing Officer
2017 Marketing Overview
Fourth Quarter
January 24, 2018

8
$2,490
$2,669
$72
$84 $23
4Q 2016 Merchandise Intermodal Coal 4Q 2017
Merchandise
$1,599
+3%
Coal
$449
+13%
Intermodal
$621
+8%
RECORD VOLUME
Revenue Change in $ Millions
* Please see reconciliation to GAAP posted on our website.
Fourth consecutive quarter of year-over-year revenue growth
Railway Operating RevenueFourth Quarter 2017 vs 2016
Merchandise Intermodal Coal Total
Revenue $1,576M 5% $667M 14% $426M 6% $2,669M 7%
Volume 611,000 1% 1,060,400 6% 253,700 6% 1,925,100 5%
RPU $2,580 4% $629 8% $1,677 (1%) $1,387 2%
RPU (less fuel)* $2,551 3% $549 4% $1,649 (1%) $1,329 1%
RECORD VOLUME
RECORD REVENUE

9
$9,888
$10,551
$175
$234
$254
2016 Merchandise Intermodal Coal 2017
* Please see reconciliation to GAAP posted on our website.
Revenue Volume RPU RPU Less Fuel *
$10.6 Billion 7,611,500 units $1,386 $1,339
up 7% up 5% up 2% up 1%
Tight truck capacity, coal rebound, and drilling
activity drove revenue growth in 2017:
Tightened truck capacity and E-commerce
growth
High benchmark pricing increasing demand
for US coals
Increased steel production and drilling activity
Revenue Change in $ Millions
Full Year Performance
Unique market approach continues to yield higher returns

10
Improved industrial
production
Continued drilling
activity
NGL declines with
pipeline activity
Truck capacity
constraints
Strong consumer
spending
Full implementation
of ELDs
Declines in
export coal
markets
Lower natural
gas prices
Opportunities in the Intermodal and Merchandise networks will drive growth
Strong Economic Environment

11
Michael J. Wheeler
Executive Vice President
and Chief Operating Officer
2017 Operations Overview
Fourth Quarter
January 24, 2018

12
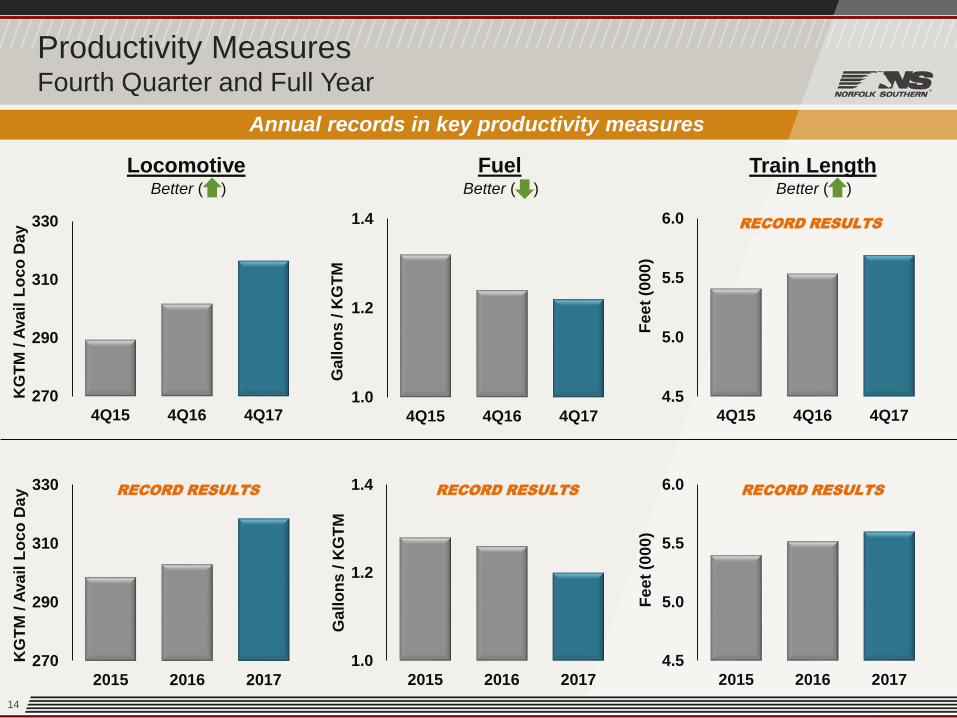
Lowest annual train accident ratio
Record annual train length
Record annual locomotive productivity
Record annual fuel efficiency
Record annual Operating Ratio
Record Results

13
► Safety:‒ Injury ratios stable
‒ Lowest annual train
accident ratio
► Service:‒ Challenging 4th quarter
Composite Service Metric
Safety and Service
Better ( )
0%
25%
50%
75%
100%
1Q17 2Q17 3Q17 4Q17
14
Train Length
1.0
1.2
1.4
4Q15 4Q16 4Q17
Ga
llo
ns / K
GT
M
4.5
5.0
5.5
6.0
4Q15 4Q16 4Q17
Fe
et
(00
0)
Fuel
4.5
5.0
5.5
6.0
2015 2016 2017
Fe
et
(00
0)
1.0
1.2
1.4
2015 2016 2017
Ga
llo
ns / K
GT
M
270
290
310
330
2015 2016 2017
KG
TM
/ A
va
il L
oco
Day
270
290
310
330
4Q15 4Q16 4Q17
KG
TM
/ A
va
il L
oco
Day
Locomotive
Annual records in key productivity measures
Better ( ) Better ( )Better ( )
RECORD RESULTS RECORD RESULTS RECORD RESULTS
RECORD RESULTS
Productivity MeasuresFourth Quarter and Full Year

15
Cynthia C. Earhart
Executive Vice President Finance
and Chief Financial Officer
2017 Financial Overview
Fourth Quarter
January 24, 2018
16
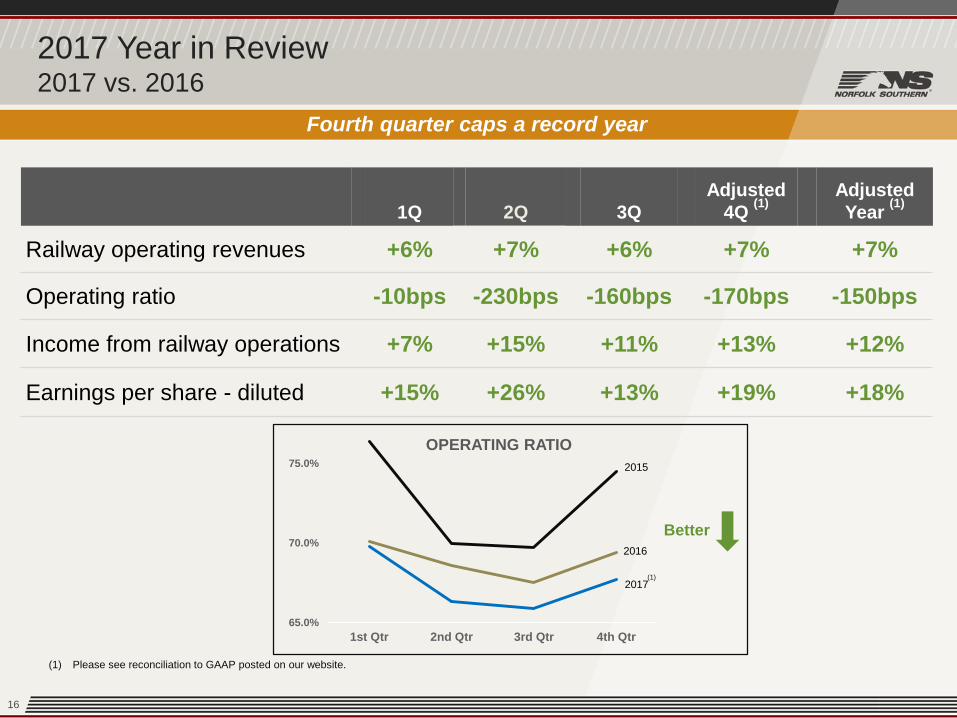
2017 Year in Review2017 vs. 2016
1Q 2Q 3Q
Adjusted
4Q (1)
Adjusted
Year (1)
Railway operating revenues +6% +7% +6% +7% +7%
Operating ratio -10bps -230bps -160bps -170bps -150bps
Income from railway operations +7% +15% +11% +13% +12%
Earnings per share - diluted +15% +26% +13% +19% +18%
Fourth quarter caps a record year
(1) Please see reconciliation to GAAP posted on our website.
65.0%
70.0%
75.0%
1st Qtr 2nd Qtr 3rd Qtr 4th Qtr
2015
2016
2017(1)
OPERATING RATIO
Better

17
Operating Results Fourth Quarter 2017 vs. 2016 ($ millions)
Growth and 13% improvement in adjusted operating income
2017
Adjusted
2017(1)
2016 $ %
Railway operating revenues $ 2,669 $ 2,669 $ 2,490 $ 179 7%
Railway operating expenses 1,655 1,806 1,729 (77) (4%)
Income from railway operations $ 1,014 $ 863 $ 761 $ 102 13%
Operating ratio (%) 62.0 67.7 69.4 1.7 2%
Favorable
(Unfavorable)
(1) Please see reconciliation to GAAP posted on our website.

18
Operating Expense Components (excluding tax reform)
Fourth Quarter 2017 vs. 2016 ($ millions)
Compensation and Benefits $52 / 8%
Incentive compensation $55
Health and welfare rates $16
Overtime $9
Reduced employee levels $24
Fuel $45 / 23%
22% higher price per gallon $41
1% higher consumption $2
Purchased Svcs and Rents(1) $20 / 5%
Higher volume-related costs $12
Materials and Other $48 / 22%
Gains on sale of operating properties $25
Lower casualty and claims expense $18
Equipment and roadway material usage $7
27,601 27,453 27,088
26,761 26,520
Q4 '16 Q1 '17 Q2 '17 Q3 '17 Q4 '17
Average Rail Employees
(1) Please see reconciliation to GAAP posted on our website.
$1,729
$52
$45$20 $8
$48
$1,806
Materials
& Other
Deprec.Fuel2016 Purchased
Svcs & Rents
Adjusted
2017Comp
& Ben
Cost control tempers inflation and volume-related increases
(1)
(1)

19
Financial ResultsFourth Quarter 2017 vs. 2016 ($ millions except per share)
2017
Adjusted
2017(1)
2016 $ %
Income from railway operations $ 1,014 $ 863 $ 761 $ 102 13%
Non-operating expenses – net 121 121 120 (1) (1%)
Income before income taxes 893 742 641 101 16%
Income taxes (3,075) 256 225 (31) (14%)
Net income $ 3,968 $ 486 $ 416 $ 70 17%
Earnings per share - diluted $ 13.79 $ 1.69 $ 1.42 $ 0.27 19%
Favorable
(Unfavorable)
Adjusted net income up 17% and adjusted EPS up 19%
(1) Please see reconciliation to GAAP posted on our website.

20
Full Year Highlights 2017 vs. 2016 ($ millions except per share)
2017
Adjusted
2017(1)
2016 $ %
Railway operating revenues $ 10,551 $ 10,551 $ 9,888 $ 663 7%
Railway operating expenses 6,965 7,116 6,814 (302) (4%)
Income from railway operations 3,586 3,435 3,074 361 12%
Non-operating expenses – net 458 458 492 34 7%
Income before income taxes 3,128 2,977 2,582 395 15%
Income taxes (2,276) 1,055 914 (141) (15%)
Net income $ 5,404 $ 1,922 $ 1,668 $ 254 15%
Earnings per share – diluted $ 18.61 $ 6.61 $ 5.62 $ 0.99 18%
Operating ratio (%) 66.0 67.4 68.9 1.5 2%
Favorable
(Unfavorable)
Record earnings per share and operating ratio
(1) Please see reconciliation to GAAP posted on our website.

21
Cash Flows2017 vs. 2016 ($ millions)
2017 2016
Cash from operating activities $ 3,253 $ 3,034
Property additions (1,723) (1,887)
Free cash flow (1) $ 1,530 $ 1,147
Returns to shareholders:
Dividends $ 703 $ 695
Share repurchases $ 1,012 $ 803
(1) Please see reconciliation to GAAP posted on our website.
Committed to significant shareholder returns
Quarterly dividend increased to $0.72 per share

22
2018 Capital Improvement Budget($ millions)
$930
$60 $170
$345
$50
$150
$140
Roadway
Infrastructure
Facilities & Terminals
Locomotives
Freight Cars
Technology & Other
PTC
Total Spending = $1,845 million
Strategic investment to core assets supports growth

23
Strategic Plan Update
January 24, 2018
James A. Squires
Chairman, President, and
Chief Executive Officer

24
Driving Increased Shareholder Value
Increase asset utilization
Optimize revenue – both pricing
and volume
Improve productivity to deliver
efficient and superior service
Reward shareholders with
significant return of capital
Focus capital investment to
support long-term value creation
Key Focus Areas 2020 Strategic Plan Targets(as conveyed December 4, 2015)
Double-digit compound annual EPS growth
Operating Ratio < 65
CapEx ~19% of revenue through 2018
CapEx ~17% of revenue thereafter
Dividend payout target of ~33% over the longer term and
continuation of dividend growth and significant share
repurchases
Disciplined pricing increases above rail inflation
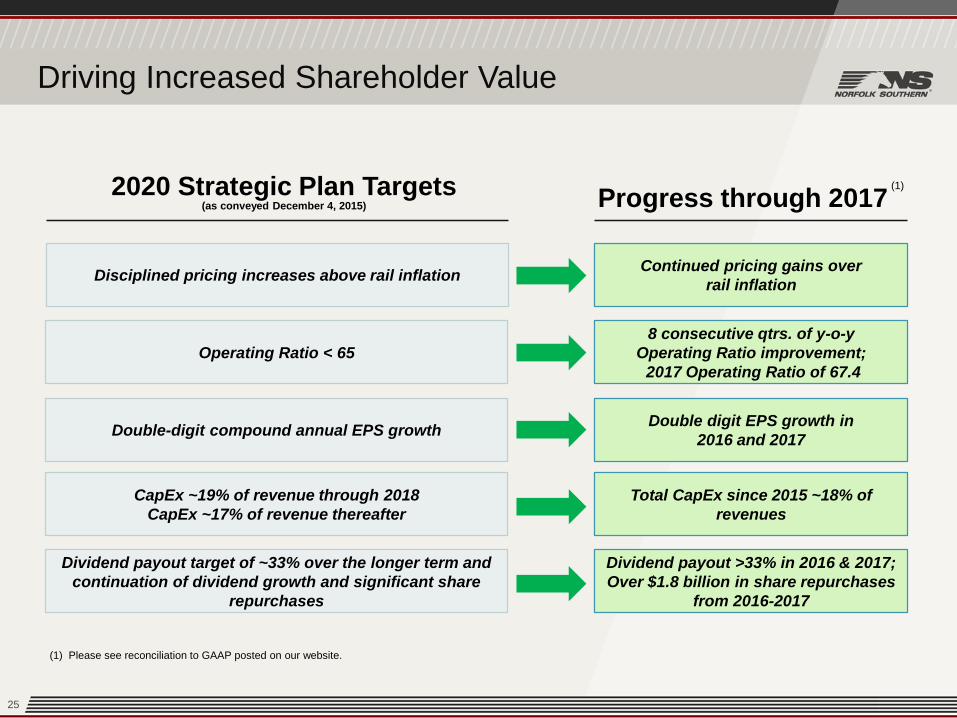
25
Driving Increased Shareholder Value
Double digit EPS growth in
2016 and 2017
Continued pricing gains over
rail inflation
8 consecutive qtrs. of y-o-y
Operating Ratio improvement;
2017 Operating Ratio of 67.4
Dividend payout >33% in 2016 & 2017;
Over $1.8 billion in share repurchases
from 2016-2017
Total CapEx since 2015 ~18% of
revenues
Progress through 2017
Double-digit compound annual EPS growth
Operating Ratio < 65
CapEx ~19% of revenue through 2018
CapEx ~17% of revenue thereafter
Dividend payout target of ~33% over the longer term and
continuation of dividend growth and significant share
repurchases
Disciplined pricing increases above rail inflation
2020 Strategic Plan Targets(as conveyed December 4, 2015)
(1) Please see reconciliation to GAAP posted on our website.
(1)
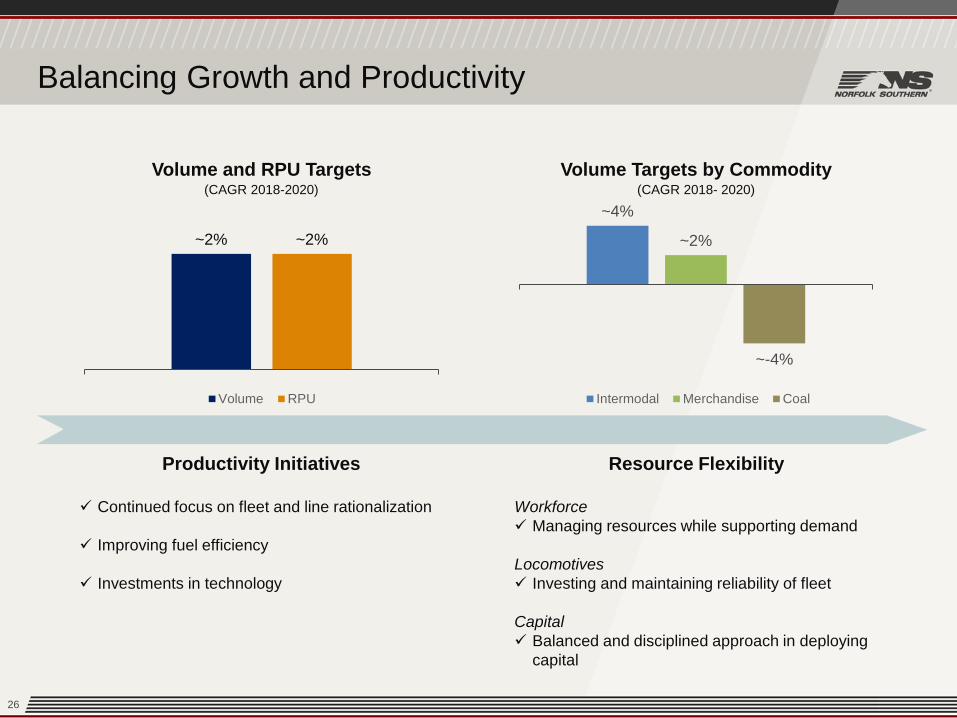
26
~2% ~2%
Volume and RPU Targets
Volume RPU
~4%
~2%
~-4%
Volume Targets by Commodity
Intermodal Merchandise Coal
(CAGR 2018- 2020)
Balancing Growth and Productivity
(CAGR 2018-2020)
Resource Flexibility
Workforce
Managing resources while supporting demand
Locomotives
Investing and maintaining reliability of fleet
Capital
Balanced and disciplined approach in deploying
capital
Productivity Initiatives
Continued focus on fleet and line rationalization
Improving fuel efficiency
Investments in technology

27
Norfolk Southern’s Strategic Plan
Revenue plan drives profitable growth
Service product that customers value
Efficiencies while pursuing growth
Committed to delivering shareholder value

28
www.norfolksouthern.com
Thank You